rolf weberg donald fosnacht director associate director ...€¦ · director associate director,...
TRANSCRIPT

Growing Strong Industries ~ Developing New Ideas ~ Nurturing Natura l Resources
Rolf Weberg Donald FosnachtDirector Associate Director,
Technology Development
January 13, 2016

Reduction of mining cost enhanced iron yield from harvest of both hematite and magnetite
Diversify product mix transition to value-added metalized products
• participate across the US steel industry (BF + EAF) produce DR-grade pellets as initial step develop heat-efficient DRI process
• take advantage of low price natural gas capitalize on product quality
• provide flexibility to EAF customers provide secondary product support – immediate impact
• high quality aggregate for use in highway surfaces
Define new opportunities Lean ore stockpile reclamation Ilmenite ore demonstration Other non-ferrous
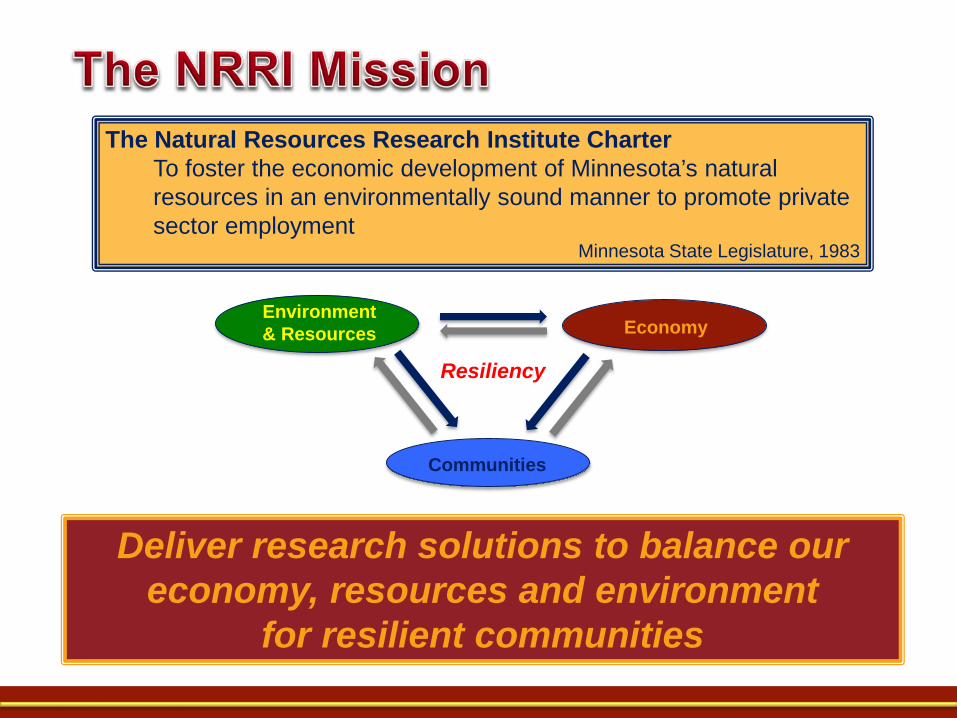
The Natural Resources Research Institute CharterTo foster the economic development of Minnesota’s natural resources in an environmentally sound manner to promote private sector employment
Minnesota State Legislature, 1983
Deliver research solutions to balance our economy, resources and environment
for resilient communities
Environment& Resources Economy
Communities
Resiliency

Build upon long-standing relationships & location leverage broad expertise and 30+ years experience in NE MN understand integration between resource-based industries
• relationship between iron provider and steel manufacturer• relationships between energy, mining, timber
Coleraine Lab presence on Iron Range
Broad collaboration Industry, agencies, stakeholders
Anticipate & Innovate improved iron ore processing ilmenite ore demonstration DRI process opportunities

MN Iron Ore
Higher-value Iron
Improved Taconite BF, BOF
DR-Grade EAF
Focus 1: Product diversification – higher value, customer focus
Focus 2: Industry diversification – high value, niche products
MN SteelHigh VolumeCommodity x
High SpecHigh Value
Outcome/Regional Vision:Preserve Midwest/Great Lakes
Steel Industry(MN, MI, WI, IL, IN, OH, PA)
Healthy MNIndustry
MN Iron Mining Industry – Balanced Portfolio
DRI

Diversify the offering: Produce higher value metallic products (DRG, DRI) Highlight differentiating high product quality (low P, S, alkalinity, fines,
impurities); identify process & recycle flexibilities to customers Define competitive delivery & price
Steps in Minnesota “Iron Innovation”
Ore20-25% Fe
Taconite62-65% Fe
DRI94-96% Fe
E.W. DavisU of MN
Modificationto low-cost DRI
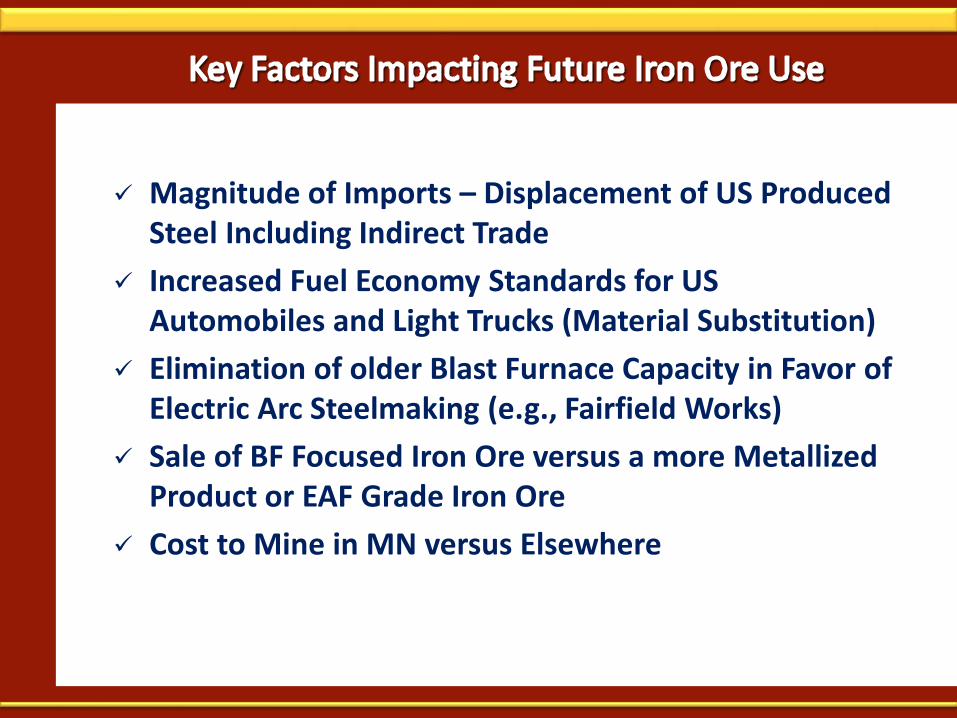
Magnitude of Imports – Displacement of US Produced Steel Including Indirect Trade
Increased Fuel Economy Standards for US Automobiles and Light Trucks (Material Substitution)
Elimination of older Blast Furnace Capacity in Favor of Electric Arc Steelmaking (e.g., Fairfield Works)
Sale of BF Focused Iron Ore versus a more Metallized Product or EAF Grade Iron Ore
Cost to Mine in MN versus Elsewhere

2014 USA Steel Statistics (metric tonnes) and Projected 2015Source: Worldsteel.org
Type Amount % 0f Total 2014 2015 Projection**
Overall Crude Steel Production 88,174,000
Hot Rolled Products Before Conversion 89,130,000 100 79,787,000Hot Rolled Flat Products 63,866,000 71.7% 57,171,284
Plate 6,550,000 10.3% 5,951,294Hot Rolled Coil, Sheet & Strip < 3mm 20,688,000 32.4% 18,791,470
Tin Mill Production 1,754,000 2.7% 1,593,206Other Coated 1,255,000 2.0% 1,139,950
Galvanized 16,510,000 25.9% 14,996,479Estimated Cold Rolled 14,810,000 23.2% 13,452,323
Welded Tubes 2,299,000 3.6% 1,250,000
Hot Rolled Long Products 24,150,000 27.1% 21,618,490Rail 1,178,000 4.9% 1,080,903
Heavy Sections 5,571,000 23.1% 5,111,810Light Sections 1,870,000 7.7% 1,715,865
Reinforcing Bars 6,997,000 29.0% 6,420,272Other Bars 4,483,000 18.6% 4,113,489
Wire Rod 2,153,000 8.9% 1,975,539Seamless Tubes 2,419,000 10.0% 1,200,000
-10,000,000

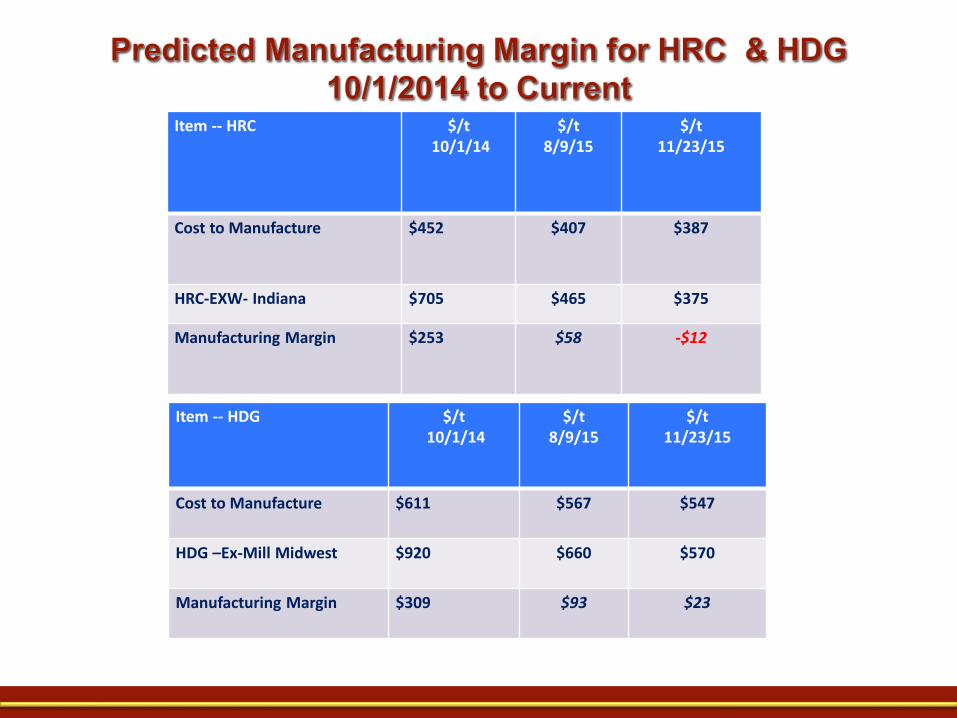
Item -- HRC $/t10/1/14
$/t 8/9/15
$/t11/23/15
Cost to Manufacture $452 $407 $387
HRC-EXW- Indiana $705 $465 $375
Manufacturing Margin $253 $58 -$12
Item -- HDG $/t10/1/14
$/t 8/9/15
$/t11/23/15
Cost to Manufacture $611 $567 $547
HDG –Ex-Mill Midwest $920 $660 $570
Manufacturing Margin $309 $93 $23
0 2,000,000 4,000,000 6,000,000 8,000,000 10,000,000 12,000,000
Semi-Finished Steel
Structurals and Plates
Bars & Wire Rods
Pipe and Tubing
Sheets and Strip
Rail Products
Tool Steel
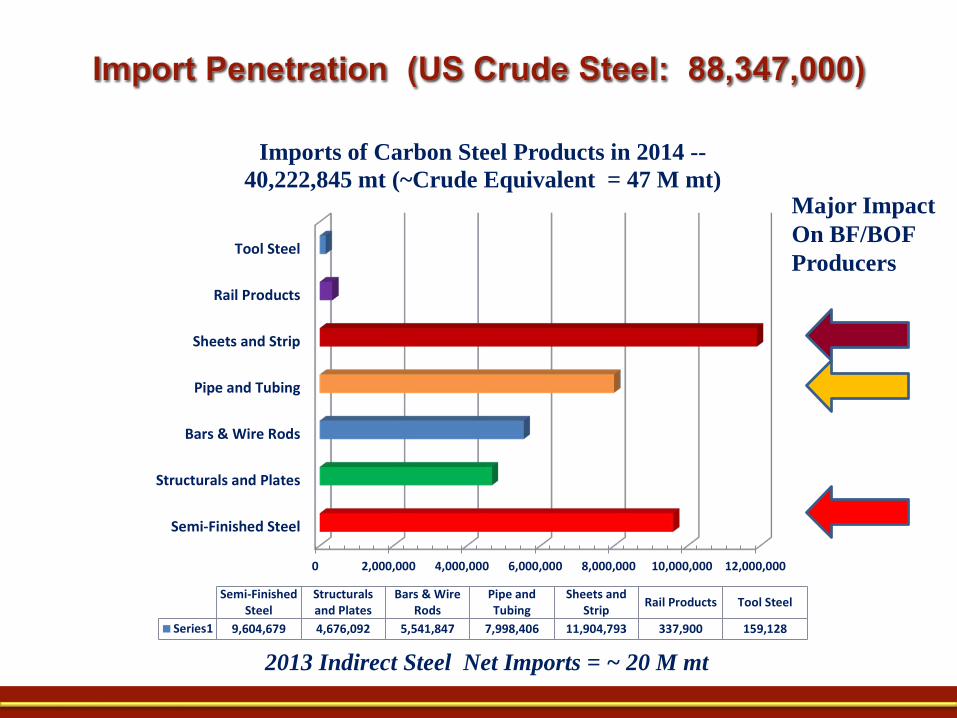
Semi-FinishedSteel
Structuralsand Plates
Bars & WireRods
Pipe andTubing
Sheets andStrip Rail Products Tool Steel
Series1 9,604,679 4,676,092 5,541,847 7,998,406 11,904,793 337,900 159,128
Imports of Carbon Steel Products in 2014 --40,222,845 mt (~Crude Equivalent = 47 M mt)
Major ImpactOn BF/BOF Producers
2013 Indirect Steel Net Imports = ~ 20 M mt

Ford F 150 Switch to Aluminum for Body Outer

Aluminum Substitution is Roughly Equivalent to displacement of 405,000 tonnes of steel/y or 503,000 tonnes of Iron Ore/y for the F150 model alone
http://www.ford.com/ngbs-services/resources/ford/f-150/2015/gallery/photos/f1515_pg_005_ext_lg.jpg

If other manufacturers follow the Ford lead for Model Year 2018;An additional, 1,676,000 mt is placed in jeopardy

Growth of Electric Arc Steelmaking in USA at Expense of BF Based Steel
Making
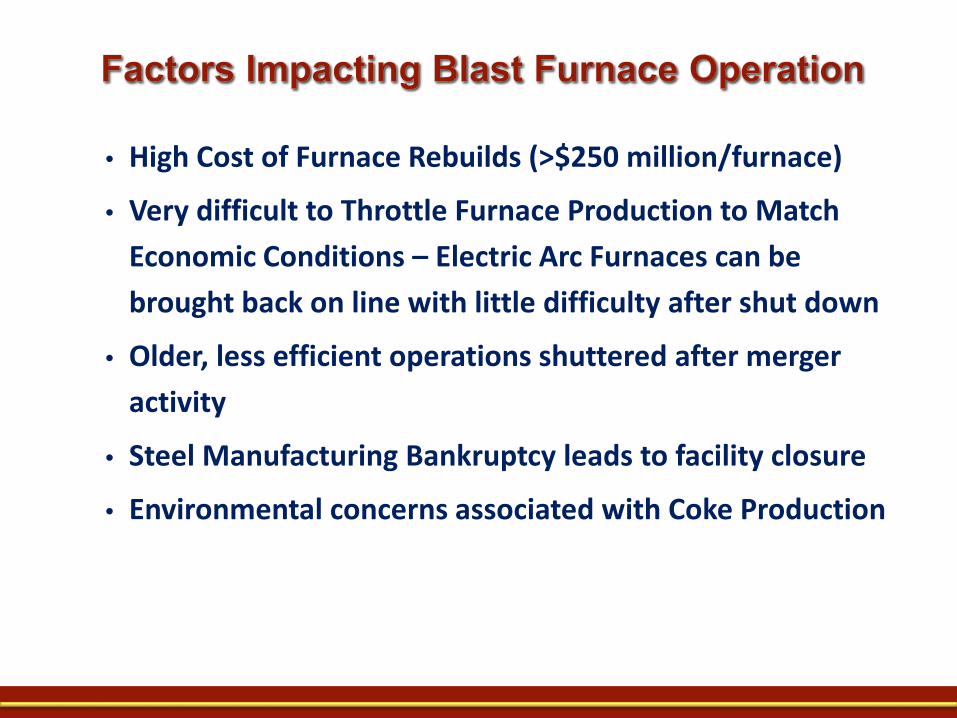
• High Cost of Furnace Rebuilds (>$250 million/furnace)
• Very difficult to Throttle Furnace Production to Match Economic Conditions – Electric Arc Furnaces can be brought back on line with little difficulty after shut down
• Older, less efficient operations shuttered after merger activity
• Steel Manufacturing Bankruptcy leads to facility closure
• Environmental concerns associated with Coke Production

Company DivisionFurnace
Identifier2014
Production Status
Arcelor Mittal Dofasco 2 692,752 Active
3 722,181 Active4 1,233,953 Active
Burns HarborC 1,994,094 Active
D 2,099,156 ActiveCleveland 5 1,363,887 Active
6 1,283,385 ActiveIndiana Harbor
IH-3 1,569,919 Active
IH-4 1,586,533 Active
IH-5 0 Inactive
IH-6 0 Inactive
IH-7 2,614,394 ActiveLazaro Cardenas
1 1,269,706 Active
Source: AIST, Iron and Steel Technology, March 2015, pp. 294-297
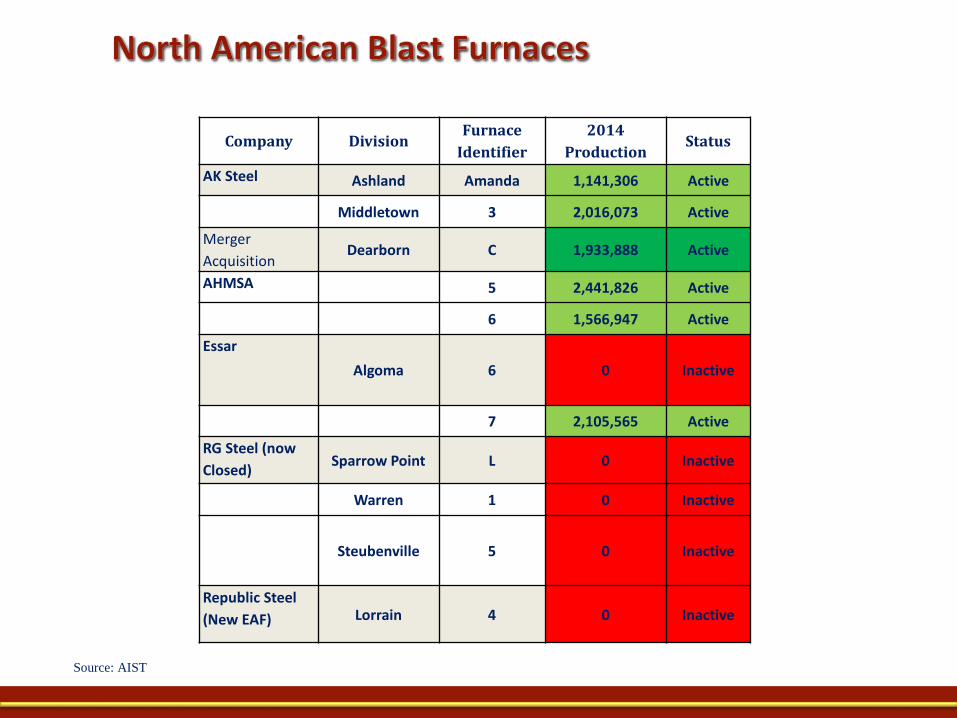
Company DivisionFurnace
Identifier2014
Production Status
AK Steel Ashland Amanda 1,141,306 Active
Middletown 3 2,016,073 Active
Merger Acquisition
Dearborn C 1,933,888 Active
AHMSA 5 2,441,826 Active
6 1,566,947 Active
EssarAlgoma 6 0 Inactive
7 2,105,565 Active
RG Steel (now Closed) Sparrow Point L 0 Inactive
Warren 1 0 Inactive
Steubenville 5 0 Inactive
Republic Steel(New EAF) Lorrain 4 0 Inactive
Source: AIST

Company DivisionFurnace
Identifier2014
Production Status
US Steel Fairfield 8 1,726,870 Active
Gary 4 990,848 Active
Gary 6 961,941 Active
Gary 8 873,044 Active
Gary 14 2,227,704 Active
Granite City A 855,863 Active
Granite City B 1,042,020 Active
Great Lakes B 1,112,340 Active
Great Lakes D 861,328 Active
Mon Valley 1 987,488 Active
Mon Valley 3 1,073,454 Active
Source: AIST
New EAF Being Installed
WARN Notices

Total Blast Furnace Capacity Idled or to be idled (10): 14,140,000 mt/y
Iron Ore no longer Needed: 20,503,000 mt/y
Granite City Shut Down: A and B furnaces Location: Granite City, Illinois 2014 Production: 1,898,000 mt Potential Iron Ore Loss if they remain down: 2,750,000 mt/y
Announced Future Shut Down: Fairfield No. 8 Location: Birmingham, Alabama (USS) 2014 Production: 1,726,870 mt Potential Iron Ore Loss after Closure: 2,500,000 mt/y Total included in iron ore no longer needed

Year EAF BF-BOF Total % EAF Yr to Yr GR2001 42,745,000 47,359,000 90,104,000 47.4% Base
2002 46,124,000 45,463,000 91,587,000 50.4% 1.6%
2003 47,804,000 45,873,000 93,677,000 51.0% 2.3%
2004 51,968,000 47,713,000 99,681,000 52.1% 6.4%
2005 52,193,000 42,704,000 94,897,000 55.0% -4.8%
2006 56,098,000 42,458,000 98,556,000 56.9% 3.9%
2007 57,003,000 41,098,000 98,101,000 58.1% -0.5%
2008 53,062,000 38,288,000 91,350,000 58.1% -6.9%
2009 35,933,000 22,263,000 58,196,000 61.7% -36.3%
2010 49,338,000 31,157,000 80,495,000 61.3% 38.3%
2011 52,107,000 34,290,000 86,398,000 60.3% 7.1%
2012 52,414,000 36,281,000 88,695,000 59.1% 2.7%
2013 52,641,000 34,237,000 86,878,000 61% -2%
2014 55,197,000 33,859,000 88,174,000 62.6% 1.5%
Source: worldsteel.org
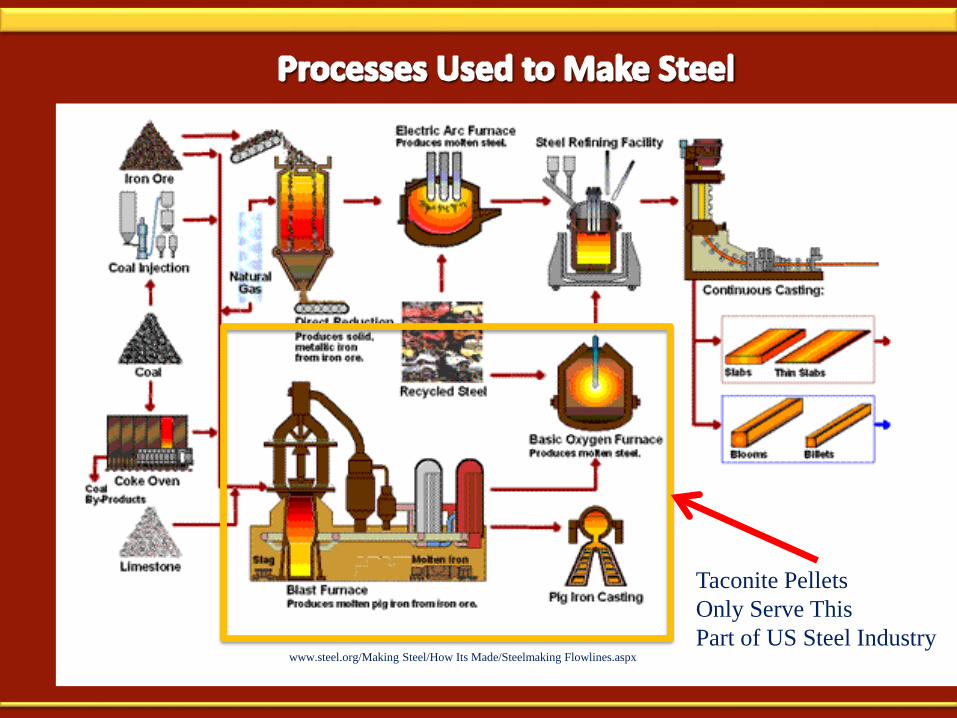
www.steel.org/Making Steel/How Its Made/Steelmaking Flowlines.aspx
Taconite Pellets Only Serve This Part of US Steel Industry
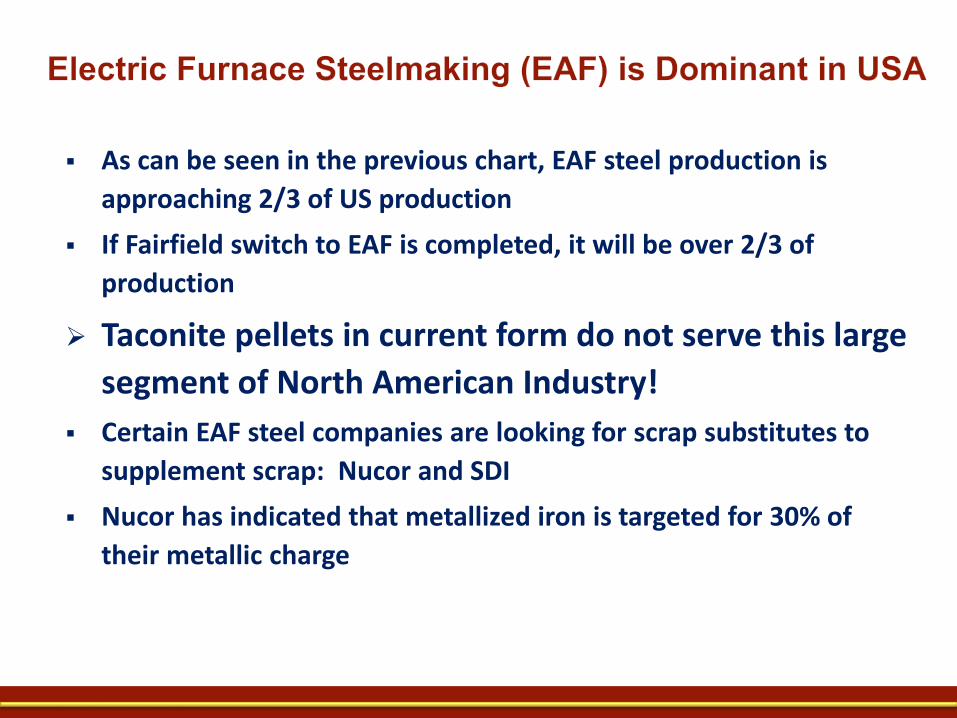
As can be seen in the previous chart, EAF steel production is approaching 2/3 of US production
If Fairfield switch to EAF is completed, it will be over 2/3 of production
Taconite pellets in current form do not serve this large segment of North American Industry!
Certain EAF steel companies are looking for scrap substitutes to supplement scrap: Nucor and SDI
Nucor has indicated that metallized iron is targeted for 30% of their metallic charge

What will be the bottom?
Recent reports indicate that some producer costs are under$20/mt

Other Reported Operating Costs FOB Mine site
Company
2005 Cost per
Tonne*Projected Cost
December, 2014
Minnesota Taconite $28.94 $53.83 Tilden (MI) $29.19 $54.30 Iron Ore of Canada $30.39 $56.53 United Taconite (MN) $30.85 $57.38 Keewatin Taconite (MN) $31.10 $57.85 Minorca Mine (MN) $31.83 $59.21 Northshore Mining (MN) $32.04 $59.60 Hibbing Taconite (MN) $33.08 $61.53 Empire Mines (MI) $33.24 $61.83 Quebec Cartier (Canada) $33.81 $62.89
Wabush Mines (Canada) $33.95 $63.15
*Source: Iron Ore Booming: More Growth Ahead, Peter J. Kakela, Dec.
2005
PPI1 March, 2005 = 115.1; December, 2014= 214.1
1: http://www.bls.gov/news.release/archives/ppi_04192005.pdfhttp://download.bls.gov/pub/time.series/pc/pc.data.2.Mining

Producer Estimated Cost per mtMinnesota/MichiganOperations
$53 to $61 as pellets
Projected LabradorTrough
$30-$35 as pellets
Australian $15 to $25 as sinter feedBrazilian $15 to $25 as sinter
feed

Develop more efficient processing for our mines Capture value from all rock that is mined Add value to the iron ore that is shipped Convert some portion of our ore to materials
that are needed by EAF industry Take advantage of energy situation by producing
direct reduced iron or other advanced metallics
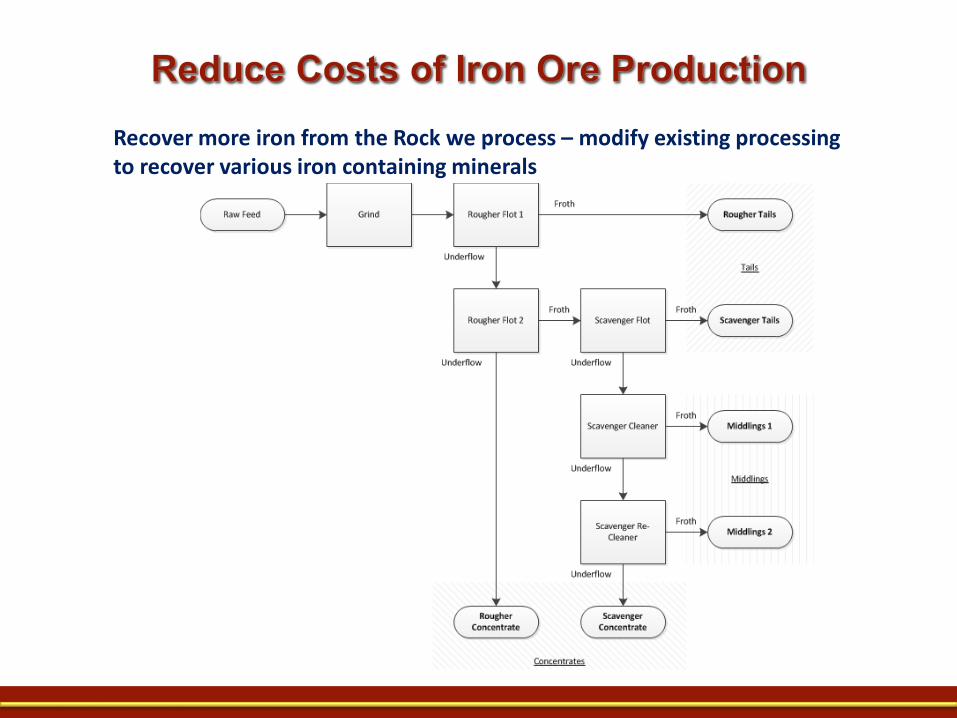
Recover more iron from the Rock we process – modify existing processing to recover various iron containing minerals
Capture iron Values from Existing Lean ore Piles Implement processing techniques to reclaim iron values
Elimination of piled rock will ease sulfate related water issues
Take advantage of already mined materials to reduce mining costs -- concentrator plants modified to accommodate different iron oxide minerals
Magnetation already capturing iron values from tailings

Encourage MNDOT to use taconite aggregate in state-wide road construction – NRRI data characterizes as a superior material for highway use Wear course – high durability, less need to reconstruct roads Excellent friction properties for safer winter driving
Market specialty products using by-product rocks High temperature insulation Substitution of silica and iron oxides needed for portland
cement manufacture Pot hole repair compounds using taconite based rocks

Produce EAF grade iron ore for conversion into DRI Produce EAF grade iron ore and install DRI capacity at our
mines (Take Advantage of Natural Gas Situation) and sell product to EAF customers
Make DRI and sell as scrap substitute to current customers Install DRI capacity & smelt the DRI to make marketable pig
iron product Install DRI capacity at our mines and subsequently nuggetize
the DRI using technologies to produce gangue free EAF charge materials
Make products that can serve the EAF industry!

Estimated Production Cost for 1 Metric Ton of DRI Using EAF Grade
Item UnitConsumption
/t DRI $Cost/Unit Item CostIron Ore Pellets t 1.5 58 $87Natural Gas Gcal 2.4 15.9 $38Oxygen Nm3 54 0.05 $2.70Nitrogen Nm3 22 0.03 $0.66Electricity Core including Materials Handling kWh 77 0.07 $5.39
Electricity Auxiliary Facilities kWh 13 0.07 $0.91Water m3 1.2 1 $1.20Labor m-h 0.15 25 $3.75Total Estimated Cost $140
Unit inputs based on Tenova HYL Brochure

The 95% Use Level is most efficient if steel conversion is at the DRI production facility. If at the mine, Logistical costs would alsobe reduced. At the 95% level, and foamy slag practices very ductile steelcan be routinely produced.
Using Market Iron for DRI Production
Using Keetacpellets for DRI Production
All Scrap $315/t $315/t
30% DRI Use $307/t $294/t
95% DRI use $290/t $249/t

New processing for capturing iron lost (Can be Done) Produce new grades of iron concentrate (Can Be Done) Develop new value added processing strategy for region (Under
study with key partners) Get revenue from waste rock from aggregate uses (shipments
now well over 1 Million tons per year and growing) Use legacy resources to drive down mining costs (actively
developing) Recover other key mineral values in Arrowhead region to
diversify mining while protecting the environment (ilmenite and non-ferrous)
Make final products in our region (new steel plant concepts under investigation)

Reduction of mining cost enhanced iron yield from harvest of both hematite and magnetite
Diversify product mix transition to value-added metalized products
• participate across the US steel industry (BF + EAF) produce DR-grade pellets as initial step develop heat-efficient DRI process
• take advantage of low price natural gas capitalize on product quality
• provide flexibility to EAF customers provide secondary product support – immediate impact
• high quality aggregate for use in highway surfaces
Define new opportunities Lean ore stockpile reclamation Ilmenite ore demonstration Other non-ferrous
