roles of continental shelves and marginal seas in the - terrapub
TRANSCRIPT
17
Journal of Oceanography, Vol. 60, pp. 17 to 44, 2004
Keywords:⋅⋅⋅⋅⋅ Bering Sea,⋅⋅⋅⋅⋅ Japan/East Sea,⋅⋅⋅⋅⋅ Okhotsk Sea,⋅⋅⋅⋅⋅ East China Sea,⋅⋅⋅⋅⋅ South China Sea,⋅⋅⋅⋅⋅ Kuroshio,⋅⋅⋅⋅⋅ Sulu Sea,⋅⋅⋅⋅⋅ Gulf of California,⋅⋅⋅⋅⋅ nutrients,⋅⋅⋅⋅⋅ denitrification,⋅⋅⋅⋅⋅ carbon,⋅⋅⋅⋅⋅ anthropogenicCO2,
⋅⋅⋅⋅⋅ budgets,⋅⋅⋅⋅⋅ North PacificIntermediateWater.
* Corresponding author. E-mail: [email protected]
Copyright © The Oceanographic Society of Japan.
Roles of Continental Shelves and Marginal Seas in theBiogeochemical Cycles of the North Pacific Ocean
CHEN-TUNG ARTHUR CHEN1*, ANDREY ANDREEV2, KYUNG-RYUL KIM3 and MICHIYO YAMAMOTO4
1Institute of Marine Geology and Chemistry, National Sun Yat-Sen University, Kaohsiung 804, Taiwan, R.O.C.2Pacific Oceanological Institute Far Eastern Branch, Russian Academy of Sciences, Vladivostok, Russia3OCEAN Laboratory/RIO, SEES, Seoul National University, Shilim-Dong, Gwanak-Gu, Seoul 151-747, Korea4Frontier Observational Research System for Global Change, International Arctic Research Center, University of Alaska Fairbanks, Fairbanks, AK 99775-7335, U.S.A.
(Received 25 August 2003; in revised form 29 October 2003; accepted 1 November 2003)
Most marginal seas in the North Pacific are fed by nutrients supported mainly byupwelling and many are undersaturated with respect to atmospheric CO2 in the sur-face water mainly as a result of the biological pump and winter cooling. These seasabsorb CO2 at an average rate of 1.1 ± 0.3 mol C m–2yr–1 but release N2/N2O at anaverage rate of 0.07 ± 0.03 mol N m–2yr–1. Most of primary production, however, isregenerated on the shelves, and only less than 15% is transported to the open oceansas dissolved and particulate organic carbon (POC) with a small amount of POC de-posited in the sediments. It is estimated that seawater in the marginal seas in theNorth Pacific alone may have taken up 1.6 ± 0.3 Gt (1015 g) of excess carbon, includ-ing 0.21 ± 0.05 Gt for the Bering Sea, 0.18 ± 0.08 Gt for the Okhotsk Sea; 0.31 ± 0.05Gt for the Japan/East Sea; 0.07 ± 0.02 Gt for the East China and Yellow Seas; 0.80 ±0.15 Gt for the South China Sea; and 0.015 ± 0.005 Gt for the Gulf of California.More importantly, high latitude marginal seas such as the Bering and Okhotsk Seasmay act as conveyer belts in exporting 0.1 ± 0.08 Gt C anthropogenic, excess CO2 intothe North Pacific Intermediate Water per year. The upward migration of calcite andaragonite saturation horizons due to the penetration of excess CO2 may also makethe shelf deposits on the Bering and Okhotsk Seas more susceptible to dissolution,which would then neutralize excess CO2 in the near future. Further, because mostnutrients come from upwelling, increased water consumption on land and dammingof major rivers may reduce freshwater output and the buoyancy effect on the shelves.As a result, upwelling, nutrient input and biological productivity may all be reducedin the future. As a final note, the Japan/East Sea has started to show responses toglobal warming. Warmer surface layer has reduced upwelling of nutrient-rich sub-surface water, resulting in a decline of spring phytoplankton biomass. Less bottomwater formation because of less winter cooling may lead to the disappearance of thebottom water as early as 2040. Or else, an anoxic condition may form as early as 2200AD.
gins and in the coastal ocean although continental mar-gins influence global biogeochemical cycles much morethan their areal extent might imply (Wollast, 1998; Liu etal., 2000a, b). Coastal regions are also especially suscep-tible to anthropogenic influence at a time when humansare strongly interfering in the global biogeochemical cy-cle of carbon (C), nitrogen (N) and phosphorus (P). Thisinterference has led to substantially increased loadings
1. IntroductionMany global assessments of the oceanic carbon cy-
cle (e.g. Chen and Drake, 1986) have not fully accountedfor the carbon fluxes and dynamics on continental mar-

18 C.-T. A. Chen et al.
of the land and atmosphere with chemicals such as nutri-ents from these activities, especially in the North Pacific.These discharges might have significantly stimulated car-bon fixation (up to 0.5–1 Gt C yr–1) (Smith andHollibaugh, 1993; Meybeck, 1993; Chen et al., 1994;LOICZ, 1997; Mackenzie et al., 1998, 2001, 2002a,2002b; Mackenzie and Ver, 2001). At present, however,it is not known how much of this excess organic carbon(OC) is simply re-oxidized, and how much is permanentlysequestered by export to the interior ocean, or in sedimentson the shelves and shallow seas. Jahnke et al. (1990) es-timated that about half of the OC input into the seabed ofthe North Pacific occurs within 500 km of the margin.Walsh et al. (1981, 1991) and Walsh (1991) state that largeamounts of OC are recycled on the Bering Sea shelves.Of the small fraction that is not remineralized, the major-ity is not buried on the shelves, but transported over theshelf edge and deposited on the continental slopes. Hedgesand Keil (1995) state that continental shelf deposits aloneare responsible for the storage of about 45% of the pre-served OC in the world. The number is doubled if deltasare included. Bauer and Druffel (1998) also pointed outthat the ocean margins can contribute an order of magni-tude greater amount of dissolved and particulate organicmatter (DOM and POM, respectively) to the interior ofthe Pacific than those derived from the surface open ocean.These aspects of the oceanic cycles of carbon and associ-ated elements, and their horizontal and vertical fluxes inthe marginal seas of the North Pacific, are the subject ofthe JGOFS North Pacific Synthesis Group (NPSG), andthe results are hereby reported.
The North Pacific has some of the largest marginalseas in the world, including the Bering Sea (2.27 × 10⁶
km2), the Okhotsk Sea (1.53 × 10⁶ km2), the Japan/EastSea* (JES 1.0 × 10⁶ km2), the East China Sea (ECS,0.77 × 106 km2 plus the Bohai Gulf at 0.077 × 10⁶ km2
and the Yellow Sea at 0.38 × 10⁶ km2), and the SouthChina Sea (SCS, 3.5 × 10⁶ km2) (Fig. 1). These seas formthe linkage between the largest continent and the largestocean, ventilate the deep oceans, receive much land run-off (Milliman et al., 1995; Dai and Trenberth, 2002) andexchange much material with the open oceans. Generaldescriptions of the area studied are summarized in Table1. The role of these marginal seas in the context of car-bon and nutrient cycles are briefly discussed with moreemphasis on the CO2 sink. Several national and interna-tional projects have also been identified (Appendix I).
2. Carbon and Nutrient CyclesRock weathering and the decay of organic material,
together with fertilizers and waste discharges, are the
major sources of most forms of nutrients to the sea, towhich they are usually carried by terrestrial drainage in-cluding rivers, freshwater runoff, groundwater dischargeand point source discharges (Mackenzie et al., 1998). Forcoastal oceans the human inputs, including aeolian, arebeginning to become signicificant compared to weather-ing (Hong et al., 1995; Hu et al., 1998; Vörösmarty etal., 1998; Rabouille et al., 2001).
The marine organisms act as a “biological pump”,thus removing CO2 and nutrients from the surface oceanand transferring these elements into the deeper ocean andocean bottom. The ratios among carbon, nitrogen andphosphorus in phytoplankton vary but the Redfield Ratiois still a good representation (Chen et al., 1996b; Hedgeset al., 2002). Assuming C:N:P ratios of 106:16:1,remineralization of these material can be represented bythe equation (Redfield et al., 1963):
(CH2O)106(NH3)16H3PO4 + 138O2↔ 106CO2 + 122H2O + 16HNO3 + H3PO4. (1)
Nitrate values in coastal waters usually decreasegoing seaward in surface waters and increase along thesame axis in deep waters. Upwelling regions have majorinputs of new nitrogen from the subsurface open oceanand the surface nitrate concentrations are higher, and of-ten have strong oxygen depletion and periodically showa high degree of denitrification, resulting in high subsur-face ammonium, N2O and nitrite values. One of the ma-jor reactions is as follows:
(CH2O)106(NH3)16H3PO4 + 94.4HNO3↔ 106CO2 + 177.2H2O + H3PO4 + 55.2N2. (2)
The concentrations of phosphate and silicate incoastal waters are also often higher than in the water fur-ther offshore due to land runoff, sewage outflow, and
*The Editor-in-Chief does not recommend the usage ofthe term “East Sea” in place of “Japan Sea”.
Fig. 1. Marginal Seas in the North Pacific. The hatched areaindicates where the dominant water mass transfer is fromthe interior ocean to the surface mixed layer (redrawn fromBlanke et al., 2002).

Roles of Continental Shelves and Marginal Seas in the Biogeochemical Cycles of the North Pacific Ocean 19
Tab
le 1
. N
orth
Pac
ific
Con
tine
ntal
Mar
gins
: S
ite
Des
crip
tion
s.
1. C
hen
et a
l. (
2003
a);
2. J
GO
FS
(19
97);
3. L
oder
et
al. (
1998
); 4
. Hi l
l et
al.
(19
98);
5. M
atsu
mur
a et
al.
(20
02);
6. C
hurc
h et
al.
(19
98).
*Nar
row
, <10
0 km
; m
edi u
m 1
00–3
00 k
m;
wi d
e, >
300
km.
20 C.-T. A. Chen et al.
coastal upwelling. When denitrification occurs N2O orN2 may escape from the water column making DIN/DIPratio lower (Eq. (2); Gordon et al., 1996; Seitzinger,2000). Since Si exists in the extracellular structures ofdiatoms, silicoflagellates and radiolarians, whereas N andP exist in the soft tissue, Si frequently does not covarywith N or P.
There is clear evidence of changes in the concentra-tions of fixed N in some coastal systems due to humanactivities (Kemp, 1995). These nutrients are carried tothe oceans mainly via rivers and groundwater. A recentreport (IGBP, 1994) estimated the total anthropogenicinorganic N and P inputs to the coastal zone as 1.5 × 10¹²
mol N and 0.52 × 10¹¹ mol P per year. Galloway et al.(1995), however, estimated that 4.2 × 10¹² mol N yr–1 ofthe nitrogen fixed by human activities are injected intooceans, of which 2.9 × 10¹² mol N yr–1 are from riverflow and the rest are from the atmospheric deposition.Smith et al. (2003) reported that the total loads for the1990s are about three times Meybeck’s (1993) estimatesmainly for the 1970s. No doubt, part of the increase musthave been due to human influences.
3. Case Studies on North Pacific Marginal Seas
3.1 East China SeaSince the ECS has been studied the most thoroughly,
we will discuss it first. The ECS, including the Gulf ofBohai and the Yellow Sea has a total area of 1.24 × 10⁶
km2 of which about 0.9 × 10⁶ km2 is the continental shelf,one of the largest in the world. It is also one of the mostproductive areas of the world oceans. Two of the largestrivers in the world, the Yangtze River (Changjiang) andthe Yellow River (Huanghe), empty into the shelf withlarge, and ever increasing nutrient and carbon inputs. Forinstance, the NO3 concentration near the Yangtze River(Changjiang) estuary increased four-fold between 1963and 1983, because of the 2.25-fold increase in the use ofN-containing fertilizers in China. The DIN/DIP ratio inthe estuarine water has also doubled in 20 years, but netprimary productivity (PP) has not shown much variation(Gu, 1991; Zhang, 1991; Zhang and Gu, 1994; Note thatnet primary productivity is frequently reported but it isnot always clear in the original references).
The Kuroshio Surface Water (KSW), Kuroshio Tropi-cal Water (KTW), Kuroshio Intermediate Water (KIW)and the Shelf Surface Water (SSW) make up the majorwater masses near the ECS continental shelf break (Chenet al., 1995b). Although the major currents are parallel tothe isobath, the SSW has a net transport offshore becauseof the buoyancy induced by the net precipitation (QP–QE,where Q denotes the flux in mass unit, subscripts P and Eare precipitation and evaporation, respectively) and thefresh water discharge from rivers (QRi), while KSW, KTW
and KIW have net onshore transports. In addition, thereis an input through the Taiwan Strait (TSW).
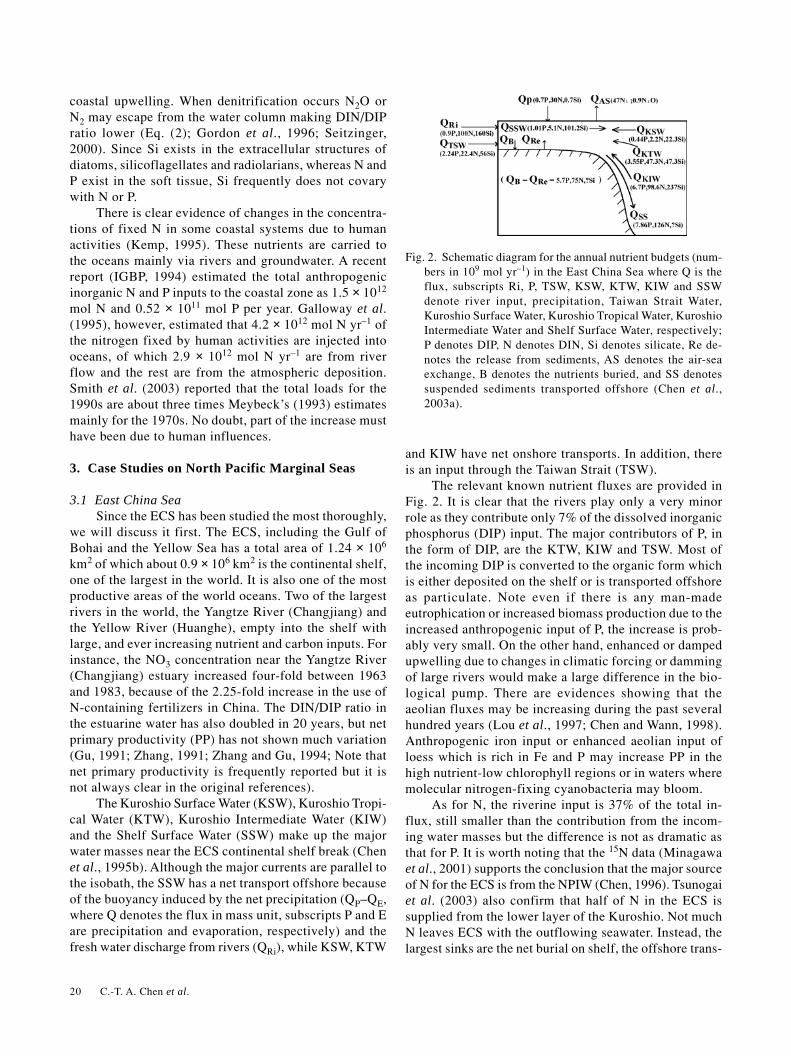
The relevant known nutrient fluxes are provided inFig. 2. It is clear that the rivers play only a very minorrole as they contribute only 7% of the dissolved inorganicphosphorus (DIP) input. The major contributors of P, inthe form of DIP, are the KTW, KIW and TSW. Most ofthe incoming DIP is converted to the organic form whichis either deposited on the shelf or is transported offshoreas particulate. Note even if there is any man-madeeutrophication or increased biomass production due to theincreased anthropogenic input of P, the increase is prob-ably very small. On the other hand, enhanced or dampedupwelling due to changes in climatic forcing or dammingof large rivers would make a large difference in the bio-logical pump. There are evidences showing that theaeolian fluxes may be increasing during the past severalhundred years (Lou et al., 1997; Chen and Wann, 1998).Anthropogenic iron input or enhanced aeolian input ofloess which is rich in Fe and P may increase PP in thehigh nutrient-low chlorophyll regions or in waters wheremolecular nitrogen-fixing cyanobacteria may bloom.
As for N, the riverine input is 37% of the total in-flux, still smaller than the contribution from the incom-ing water masses but the difference is not as dramatic asthat for P. It is worth noting that the 15N data (Minagawaet al., 2001) supports the conclusion that the major sourceof N for the ECS is from the NPIW (Chen, 1996). Tsunogaiet al. (2003) also confirm that half of N in the ECS issupplied from the lower layer of the Kuroshio. Not muchN leaves ECS with the outflowing seawater. Instead, thelargest sinks are the net burial on shelf, the offshore trans-
Fig. 2. Schematic diagram for the annual nutrient budgets (num-bers in 109 mol yr–1) in the East China Sea where Q is theflux, subscripts Ri, P, TSW, KSW, KTW, KIW and SSWdenote river input, precipitation, Taiwan Strait Water,Kuroshio Surface Water, Kuroshio Tropical Water, KuroshioIntermediate Water and Shelf Surface Water, respectively;P denotes DIP, N denotes DIN, Si denotes silicate, Re de-notes the release from sediments, AS denotes the air-seaexchange, B denotes the nutrients buried, and SS denotessuspended sediments transported offshore (Chen et al.,2003a).

Roles of Continental Shelves and Marginal Seas in the Biogeochemical Cycles of the North Pacific Ocean 21
port in the form of sediments, and losses in the form ofdegassing as N2 and N2O (Watanabe et al., 1997; Oguriet al., 2003) with an net denitrification rate of 0.103 ±0.050 mol N m–2yr–1 (note the ± sign usually denotesstandard deviation although it is not always clear fromthe original sources). This figure is small compared tothose estimated in the coastal areas worldwide (Seitzingeret al., 2000). This may be because the ECS value is aver-aged over the entire shelf area rather than only in thenearshore coastal region. Further, because of the abun-dant Trichodesmium in the ECS (Chen et al., 1996b), ni-trogen fixation may be a significant source of N. Includ-ing this in the budget would increase the denitrificationrate accordingly.
After the completion of the Shelf Edge ExchangesProcesses (SEEP) project in the Atlantic Bight the sourcesof N for the shelf to support the measured PP was consid-ered as an unresolved question. The question was the dif-ficulty to reconcile the flux of nitrate onto the shelf with-out imposing an net export of water (Biscaye et al., 1994).Upwelling of nutrient-rich subsurface water however,would balance the export of nutrient-depleted surfacewater. Chen and Wang (1999) noted that the riverine DIN/DIP ratio is 111 which is much higher than the RedfieldN/P ratio of 16 for phytoplankton. This makes P morelimiting to net organic production than N in the estuaries.The total seawater flux of N and P to the ECS, however,has a ratio of 13 which is much closer to the Redfieldratio. As a result, the P shortage in the ECS as a whole isnot as dramatic thanks to the large influx due to the sub-surface Kuroshio waters. Changes in nutrient structureof small riverine input are also not expected to affect thestoichiometric nutrient balance of phytoplankton ecosys-tem in the ECS. The amount of Si transported by the riv-ers is 31% of the total influx. Note in Fig. 2 only the dis-solved or the easily dissolvable Si is included. Since it isnot known how much of these convert into sediments,the offshore transport of SS can not be calculated.
The carbon fluxes are more complicated. On theKuroshio side the surface water CO2 is more or less atequilibrium with the atmosphere because of the low nu-trient contents and PP. On the shelf the pCO2 is all under-saturated yearround because of the high PP. The influx ofCO2 is about 2 ± 0.8 mol m–2yr–1 (Chen and Wang, 1999;Tsunogai et al., 1999; Oh et al., 2000). By way of com-parison, the global shelf average is about 1.2mol m–2yr–1 (Chen, 2003b).
The major rivers bring in carbon in the form of dis-solved inorganic carbon (DIC), dissolved organic carbon(DOC), particulate inorganic carbon (PIC) and particulateorganic carbon (POC). A mass-balance calculation givesthe downslope contemporary particulate carbon transportrate as 2.8 ± 1.4 mol C m–2yr–1 (Fig. 3). Chen and Wang(1999) estimated the contemporary offshore POC trans-
port rate as 0.76 ± 0.38 mol C m–2yr–1. This value isequivalent to 5.7% of the average PP of 13.3 mol org Cm–2yr–1 (Zhang, 1991). By way of comparison, the off-shore transport of POC of the global continental marginsamounts to 6% PP on the shelf. Dividing the POC trans-port rate by 106 gives the particulate organic P (POP)transport rate as 6.6 ± 3.3 × 10⁹ mol yr–1, in good agree-ment with the estimate of 7.9 ± 4 × 10⁹ mol yr–1 obtainedearlier.
Much of the land-derived DOC and POC is highlyinert and mixes with seawater conservatively. Should thiscarbon partially or totally respire on the shelf it wouldform an natural source of atmospheric CO2 (Kempe,1995). The DOC outflow, however, is higher than the to-tal input. Thus 1.14 ± 0.38 mol C m–2yr–1 new DOC isproduced on the shelf and is transported to the open oceanseach year. On the other hand, the ECS shelf waters pro-duce 0.79 ± 0.28 mol C m–2yr–1 POC for export out of thewater column. Overall the ECS gets 6.24 ± 2.1 mol Cm–2yr–1 OC from outside sources and exports 6.75 ± 2.25mol C m–2yr–1 OC excluding the 0.67 ± 0.28 mol Cm–2yr–1 buried. So the ECS currently is a net exporter ofOC and is a net sink of atmospheric CO2. It should benoted that Jickells et al. (1991) reported that the majorportion of POC in continental margin sediments is de-rived from algal cells that have been produced in the over-lying water. They reported that little of the POC in thesediment is of terrestrial origin.
The study of Chen and Wang (1999), however, indi-cates that about 20% of the ECS shelf deposit is relic.The results of Honda et al. (2000), Bauer et al. (2001)and Lin et al. (2002a) also indicate that a large portion ofthe off-shelf transport of POC may be old terrestrial orrelic matter. Further, Ogawa et al. (2003) estimated a ter-restrial DOC input of 400 × 109 mol C yr–1 in the areaclose to the Changjiang River mouth, which is substan-tially larger than the total input of 170 × 109 mol C yr–1
that Chen and Wang (1999) chose to use (Fig. 3). A higher
Fig. 3. Schematic diagram for the annual carbon budget in theEast China Sea (numbers in 109 mol C yr–1) (taken fromChen and Wang, 1999). Subscripts as in Fig. 2.

22 C.-T. A. Chen et al.
riverine DOC input also implies that more shelf producedOC is recycled on the shelf. The net conversion of IC toOC is by the new production of 1.95 ± 0.98 mol org Cm–2yr–1 which is 15% of the average PP with the rest re-generated on the shelf, mostly aerobically. Note the newproduction rate obtained from the P budget is 0.16 ± 0.05mol C m–2yr–1. Results from the SEEP–II program on theeastern US continental shelf indicate that only less than5% of the PP is exported to the adjacent slope (Andersonet al., 1994; Biscaye et al., 1994). In the North Sea only0.14% of the PP is accumulated on the shelf as POC, and2–3% of the PP is exported over the margin (de Haas etal., 1997).
The continental shelf waters are generally high intitration alkalinity (TA) because of river discharge and insitu generation due to oxidation of organic material, whichreduces TA by 17 moles for the aerobic regeneration of106 moles of OC (Chen et al., 1982). When the dissolvedoxygen is exhausted in the sediments, the system turns tothe next most abundant source for the oxidation of or-ganic material, NO3
–, followed by the manganese, iron,sulfate and methane reductions (Noriki et al., 1997; Chen,2002a). Chen and Wang (1999) estimated that on the or-der of 1 × 10¹² mol yr–1 of alkalinity is generated on theECS shelf, mainly because of iron and sulfate reductions(Lin et al., 2002b). Fermentation, however, is probablyresponsible for the high CH4 found in the ECS, about 35%supersaturated (Tsurushima et al., 1996). The sea-to-airflux of CH4 is about 3 × 10⁹ mol yr–1. The DMS concen-tration in he surface water is about 80 and 17 ng S l–1,respectively, in summer and winter, with the correspond-ing fluxes of 2.2 and 0.6 mmol µg S m–2yr–1 (Uzuka etal., 1997).
The anthropogenic, excess CO2 penetrates to ap-proximately 600 m in the ECS. The entire ECS contains0.07 (±0.02) Gt C excess carbon in 1992. Since the wa-ters on the ECS shelf are highly supersaturated with re-spect to calcite and aragonite, sediments on the ECS shelfare not expected to neutralize excess CO2 in the comingcentury.
3.2 Bering SeaThe Bering Sea is the third largest marginal sea in
the world and the second largest in the North Pacific. Itis divided about equally into a wide shelf and a deep ba-sin with a maximum depth of 5121 m. The average waterdepth of the 500 km wide shelf is less than 50 m with ashelf break located at 100–200 m water depth. The shelfarea is covered by ice from November to May. The BeringStrait is about 85 km wide and less than 50 m deep. Thisis the only northern gateway where water of the Pacificorigin flows into the Atlantic through the Arctic Sea, andhas one of the highest biological productivities in theworld (Walsh et al., 1990). Despite of its shallow depth,
however, the Bering Sea transports 0.8 Sv (106 m3 sec–1)of seawater to the Arctic Ocean to account for 19% of theDOC found there (Wheeler et al., 1997). Takahashi (1999)went even further and claimed that “... Much of the bio-logical production of organic matter and associated nu-trients flowing into the Arctic Ocean today is due to thisnortherly current direction”.
The Bering Sea is relatively nutrient rich comparedto the open oceans and the PP, even in the deep basin, isalmost twice of that found in the Gulf of Alaska immedi-ately south of the Aleutian Islands. The diatom fluxes areapproximately one order of magnitude higher in theBering Sea than in the Gulf of Alaska although the rela-tively minor CaCO3 fluxes are similar on either side ofthe Aleutian Islands (Tsunogai et al., 1979; Takahashi,1995; Takahashi et al., 2002). The shelf water has a pCO2of about 100 µatm below saturation in winter, mainlybecause of the cooling effect. Nevertheless the rate of air-sea exchange is probably low because of the sea ice cov-erage. On the other hand, near the shelf break the pCO2is supersaturated because of vertical mixing (Chen,1993a). In summer, however, the shelf area is highlyundersturated with pCO2 as low as 125 µatm because ofhigh productivity, especially those from siliceous shell-bearing plankton (Codispoti et al., 1986; Takahashi,1999). The PP on the shelf is on the order of 14 mol Cm–2yr–1, supported by nutrients from influxes of subsur-face waters from offshore (Fig. 1). The f ratio is 49% onthe outer shelf and 17% at mid-shelf (Walsh et al., 1985;Walsh and McRoy, 1986; Walsh and Dieterle, 1994;Wollast, 1998). DMS and N2O have a concentration ofabout 1.6 nmol S and 313 µatm, respectively, in the sur-face water (Nojiri et al., 1997; Uzuka et al., 1997).Aranami et al. (2002) reported a sea-to-air DMS flux of4.1 mmol m–2yr–1.
Walsh and Dieterle (1994) calculated a mean inva-sion rate of 4.3 mol C m–2yr–1 on shelves of the Bering
Fig. 4. Penetration depth of excess CO2 in the Bering Sea (modi-fied from Chen, 1993a).
Roles of Continental Shelves and Marginal Seas in the Biogeochemical Cycles of the North Pacific Ocean 23
Sea. These are converted to DIC, DOC and POC, and aretransported to the deep basin. They suggested that, as aconsequence of the rising levels of atmospheric CO2 sincethe Industrial Revolution, the biophysical CO2 status ofthe southeastern shelf may have switched over the last250 years, from a prior source to the present sink. Chen(1993a) reported that the excess CO2 in the Bering Seapenetrates to approximately 1000 m. This is the depthwhere the excess CO2 is at about its detection limit of 5µmol kg–1. Some excess CO2 may be present below thisdepth. The penetration is deeper in the eastern and south-ern regions, with slightly shallower penetration off theKamchatka Peninsula (Fig. 4). Tritium and freons showsimilar penetration, but the 14C concentration does notlevel off until a slightly deeper depth (Chen, 1993a;Warner and Roden, 1995). The Bering Sea contains about0.21 (±0.05) Gt excess carbon around 1980. Although thisvalue is small, export of the dichothermal water (Miuraet al., 2002) through the Kamchatka Strait could feed theNPIW with excess CO2. Further, the carbonate depositson the vast Bering and Okhotsk shelves could provide alarge sink for excess CO2 in the near future. The shelfwaters are currently about 210 and 150% saturated withrespect to calcite and aragonite, respectively. Because ofthe shallow depth of the shelves (less than 200 m) rela-tive to the saturation horizons of calcite (400 m) andaragonite (350 m), the upward migration of these satura-tion horizons due to the excess CO2 input (Feely and Chen,1982; Sharma et al., 1999) probably has not changed the
dissolution rates of carbonates.An increase of approximately 200 µatm in pCO2,
however, would make the shelf water undersaturated withrespect to aragonite and high-magnesium calcite, whichwould then dissolve and neutralize the excess CO2. Adoubling of the current CO2 level in the atmosphere bythe later part of the next century would cause the calciteson the shelves to dissolve, providing another large sinkfor CO2 (Chen, 1993a).
3.3 The Okhotsk SeaThe Okhotsk Sea is the sixth largest marginal sea in
the world and the third largest in the North Pacific andhas a maximum depth of 3475 m. It is enclosed on threesides by land and the shelves occupy 40% of the surfacearea. Although this sea is geographically located at a tem-perate latitude, it has many characteristics of a polarocean, namely, large seasonal variations in water tempera-tures and a subarctic water column structure. It also has aseasonal ice cover from December through April with athickness of about 1 m and an areal coverage comparableto that of the Bering Sea. It is connected to the open NorthPacific through the Kuril Island chain. The two most im-portant passages are Bussol’ (2300 m sill depth) andKruzenstern (1900 m sill depth) Straits. The net exchangebetween the open North Pacific and the Okhotsk Sea ison the order of 3–5 Sv (Talley, 1996). The Okhotsk Sea isconnected to the JES by two narrow, shallow straits: theSoya (La Perouse) Strait between Sakhalin and Hokkaido
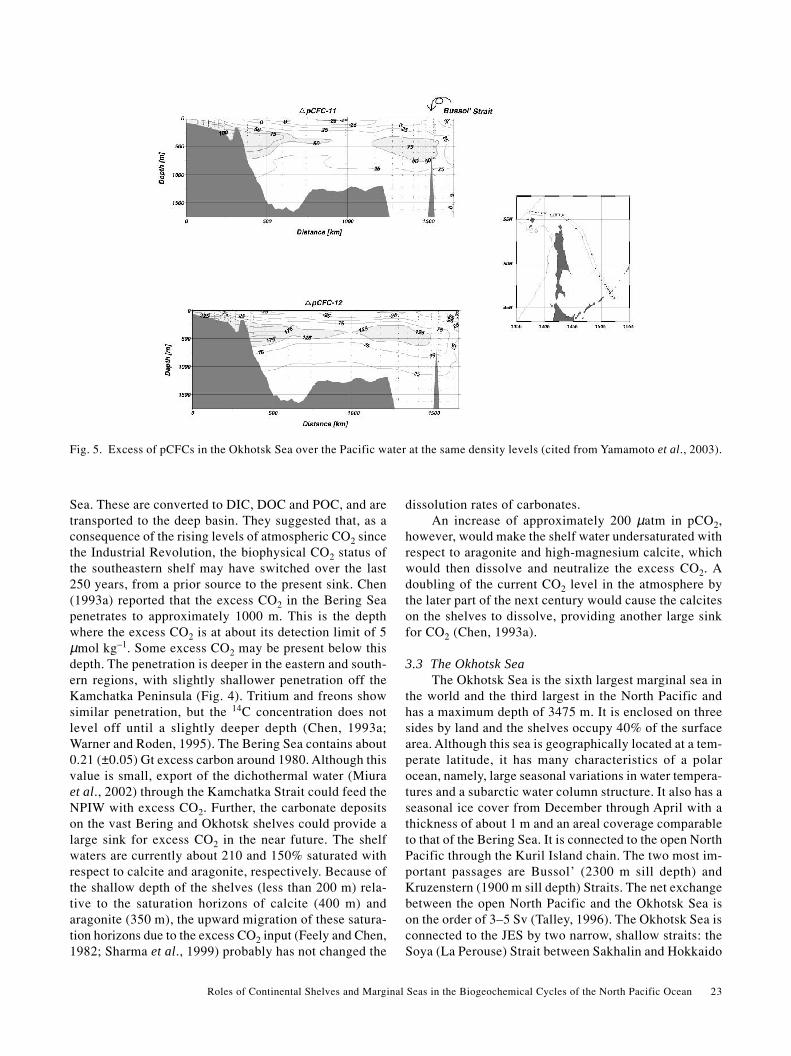
Fig. 5. Excess of pCFCs in the Okhotsk Sea over the Pacific water at the same density levels (cited from Yamamoto et al., 2003).

24 C.-T. A. Chen et al.
with a sill depth of 40 m, and Tatar Strait between Sakhalinand the Eurasian continent with a sill depth of 10 m. Atnorthwestern shelf region, the Amur River, one of the larg-est rivers in the world, supplies freshwater, heat (Ogi etal., 2001), nutrients, and organic matters (Nakatsuka etal., 2003) into the Okhotsk Sea.
Within the Okhotsk Sea, the flow is basically cy-clonic. Local circulation features include the northernshelf region where coastal polynyas are often found;upwelling on the Kashevarov Bank; the Soya Currentwhich transports saline JES water into the Okhotsk Sea,and; an anticyclonic eddy field in the Kuril Basin. Thecold, fresh but dense Okhotsk Sea Intermediate Water(OSIW) is believed to be an important source of the NorthPacific Intermediate Water (NPIW) (Wakatsuchi andMartin, 1991; Talley and Nagata, 1995; Watanabe andWakatsuchi, 1998). Because of the influence of the north-west Pacific water there is a maximum in potential tem-perature (θ) at about 900 m in the deep basin, which isdeeper and colder than the θmax found in the northwestPacific. There is a weak θmin immediately beneath thesurface layer, representing the remnant winter water.There is an apparent oxygen utilization (AOU) and nor-malized total CO2 (NTCO2 = TCO2 × 35/S) maximumbut pH minimum in both the Okhotsk Sea and the north-west Pacific. The AOU and NTCO2 values are lower be-tween about 200 m and the θmax layer, but higher above200 m or near bottom in the Okhotsk Sea. This is a clearindication that the Okhotsk Sea has younger waters be-tween 200 m and the θmax layer but older water near bot-tom as compared to the open ocean outside. Above 200m AOU and NTCO2 values are higher but pH is lower inthe Okhotsk Sea. These features remain unchanged at leastsince the 1950’s when data became available althoughinter-decadal variability has been reported (Andreev andKusakabe, 2001).
The normalized TA (NTA = TA × 35/S) data seem toshow a systematic offset between the typical Okhotsk Seaand the northwest Pacific stations. Both, however, showa large increase below about 300 m, which is alreadydeeper than the saturation depth for aragonite and cal-cite. The surface water is generally below saturation forpCO2 except near the Kashevarou Bank and the Kurilstraits where tidal mixing is strong (Rogachev et al.,1997). In summer, the undersaturation of surface waterswith pCO2 between –20 and –90 µatm is commonly ob-served, while the recorded values range between –170µatm understurated to 50 µatm supersaturated. The low-est undersaturation of CO2 is measured along the easterncoast of Sakhalin and northern shelf area. Theseundersaturations are attributed to enhanced phytoplanktonproductivity. From May to September a mean invasionrate is 1–2 mol C m–2yr–1 (Biebow and Hutten, 1999;Biebow et al., 2000). In winter, the rate of air-sea ex-
change is low because of the sea ice coverage. The sur-face waters of the ice-free zone of the Kuril Basin have apCO2 of about 10–40 µatm below saturation mainly be-cause of the strong salinity stratification and the coolingeffect. On the other hand, near the Bussol’ Strait the sur-face water are supersaturated with pCO2 (20–80 µatm)because of vertical mixing in the strait and winter con-vection (unpublished data, R/V Dmitry Peskov March2003 cruise).
The excess CO2 penetrates to at least 1000 m (σθ =27.35–27.5; Chen and Tsunogai, 1998; Andreev et al.,1999). Wong et al. (1998) recently reported that CFCsare found in the OSIW (ranging from σθ = 26.8 to 27.4)which feeds the NPIW where high values of dissolvedoxygen (DO), tritium, CFCs (Fig. 5) and excess CO2 aredetected in the σθ = 26.6 to 27.2 range (Tsunogai et al.,1995). The OSIW outflow is about 6 Sv (Takahashi, 1999;Yamamoto et al., 2003). Wong et al. (1998) gave 2.7–23.3 Sv with most of the transport occurring above σθ =27.0. Multiplying these fluxes by the excess CO2 con-centration gives the excess CO2 export of 0.011–0.18 GtC yr–1 to the North Pacific. Recently Chen and Tsunogai(1998) reported an inventory of 0.18 ± 0.08 Gt excesscarbon in the Okhotsk Sea. This inventory is by itself notlarge but the export is significant. The CFC12 data (Fig.6) indicates that the upper water is indeed mixed into thedeeper layer diapycnally. Since the CFCs of the NorthPacific water are very low below 300 m (Fig. 6), theoutflowing CFC-rich OSIW transports CFCs and excessCO2 to the interior of the North Pacific.
The nutrient and DIC budgets for the Okhotsk Seaare determined by the water exchange with the PacificOcean, Amur river run off and the supply of low-nutrient
30
40
50
60
70
25
25
25
30
30
30
3030
35
35
35
35
35
35
40
40
40
4045
45
45
45
50
Oce
an D
ata
Vie
w
135E 140E 145E 150E 155E
45N
50N
55N
60N
Oce
an D
ata
Vie
w
Fig. 6. Distribution of pCFC-12 on the potential density sur-face of 27.4σθ in the southern Okhotsk Sea (cited fromYamamoto et al., 2003).
Roles of Continental Shelves and Marginal Seas in the Biogeochemical Cycles of the North Pacific Ocean 25
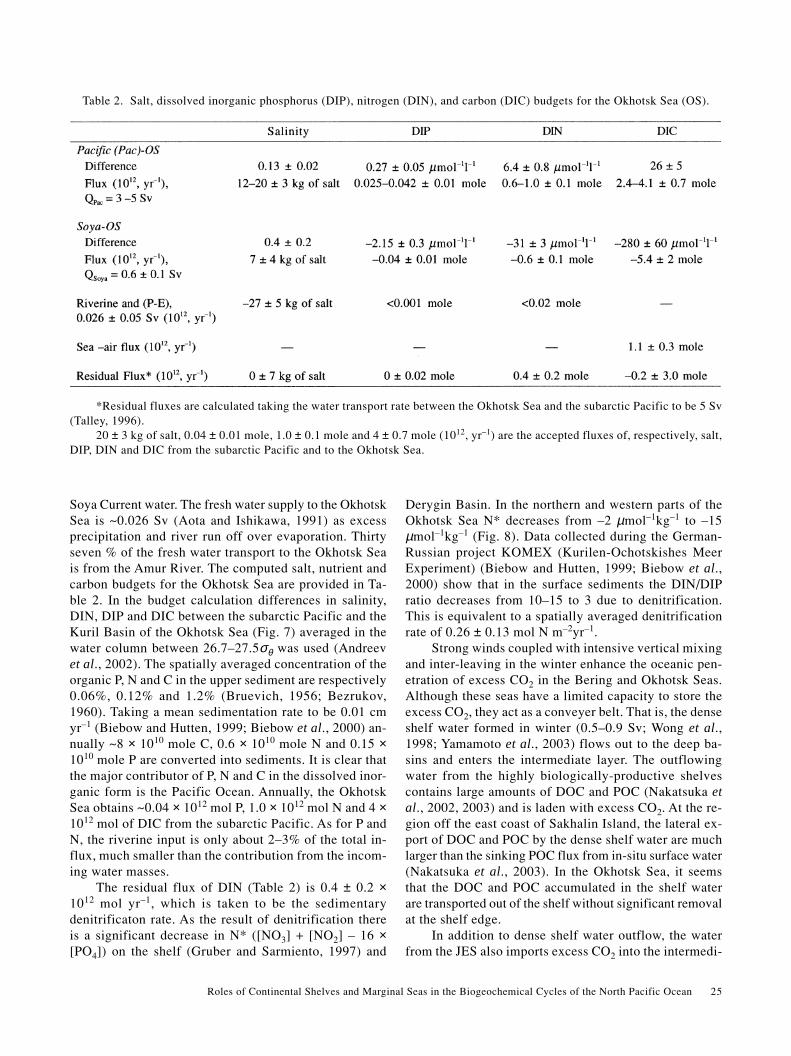
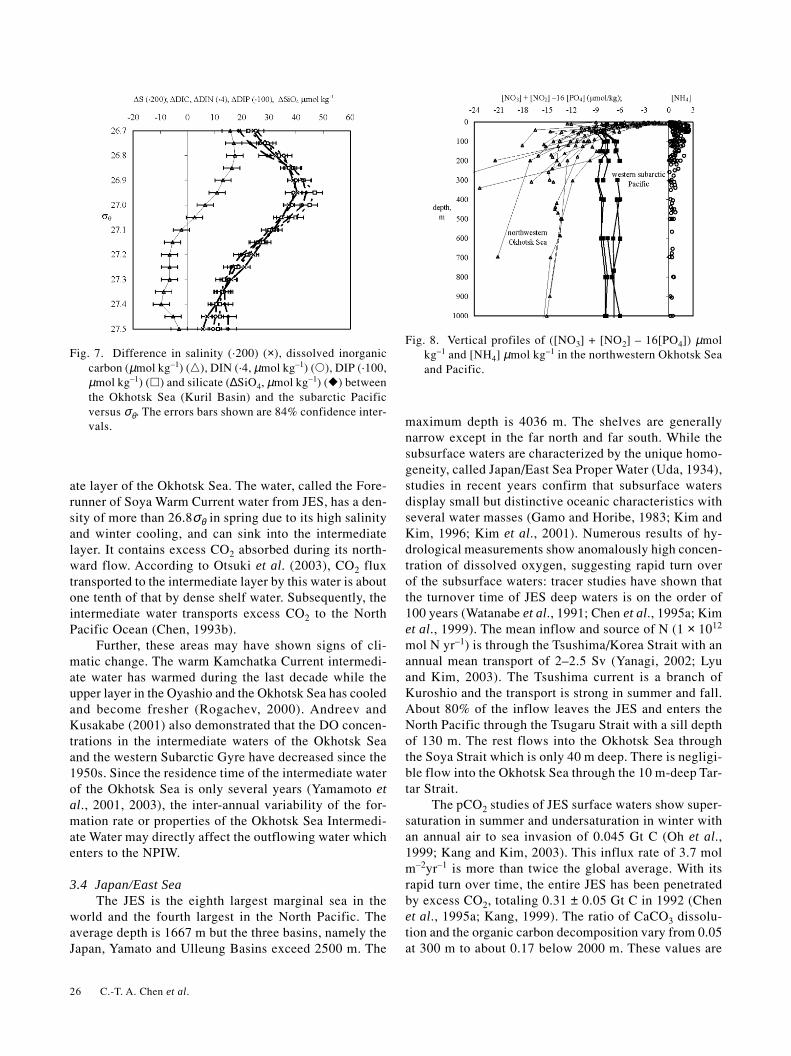
Soya Current water. The fresh water supply to the OkhotskSea is ~0.026 Sv (Aota and Ishikawa, 1991) as excessprecipitation and river run off over evaporation. Thirtyseven % of the fresh water transport to the Okhotsk Seais from the Amur River. The computed salt, nutrient andcarbon budgets for the Okhotsk Sea are provided in Ta-ble 2. In the budget calculation differences in salinity,DIN, DIP and DIC between the subarctic Pacific and theKuril Basin of the Okhotsk Sea (Fig. 7) averaged in thewater column between 26.7–27.5σθ was used (Andreevet al., 2002). The spatially averaged concentration of theorganic P, N and C in the upper sediment are respectively0.06%, 0.12% and 1.2% (Bruevich, 1956; Bezrukov,1960). Taking a mean sedimentation rate to be 0.01 cmyr–1 (Biebow and Hutten, 1999; Biebow et al., 2000) an-nually ~8 × 10¹⁰ mole C, 0.6 × 10¹⁰ mole N and 0.15 ×10¹⁰ mole P are converted into sediments. It is clear thatthe major contributor of P, N and C in the dissolved inor-ganic form is the Pacific Ocean. Annually, the OkhotskSea obtains ~0.04 × 10¹² mol P, 1.0 × 10¹² mol N and 4 ×10¹² mol of DIC from the subarctic Pacific. As for P andN, the riverine input is only about 2–3% of the total in-flux, much smaller than the contribution from the incom-ing water masses.
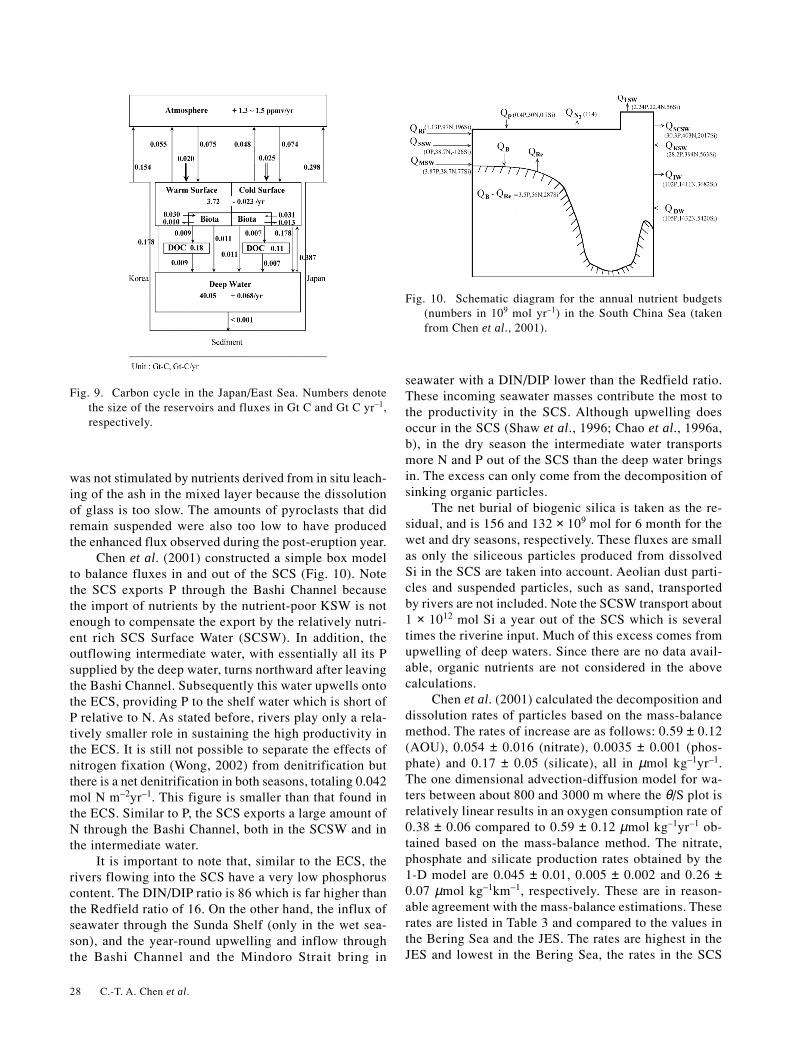
The residual flux of DIN (Table 2) is 0.4 ± 0.2 ×10¹² mol yr–1, which is taken to be the sedimentarydenitrificaton rate. As the result of denitrification thereis a significant decrease in N* ([NO3] + [NO2] – 16 ×[PO4]) on the shelf (Gruber and Sarmiento, 1997) and
Derygin Basin. In the northern and western parts of theOkhotsk Sea N* decreases from –2 µmol–1kg–1 to –15µmol–1kg–1 (Fig. 8). Data collected during the German-Russian project KOMEX (Kurilen-Ochotskishes MeerExperiment) (Biebow and Hutten, 1999; Biebow et al.,2000) show that in the surface sediments the DIN/DIPratio decreases from 10–15 to 3 due to denitrification.This is equivalent to a spatially averaged denitrificationrate of 0.26 ± 0.13 mol N m–2yr–1.
Strong winds coupled with intensive vertical mixingand inter-leaving in the winter enhance the oceanic pen-etration of excess CO2 in the Bering and Okhotsk Seas.Although these seas have a limited capacity to store theexcess CO2, they act as a conveyer belt. That is, the denseshelf water formed in winter (0.5–0.9 Sv; Wong et al.,1998; Yamamoto et al., 2003) flows out to the deep ba-sins and enters the intermediate layer. The outflowingwater from the highly biologically-productive shelvescontains large amounts of DOC and POC (Nakatsuka etal., 2002, 2003) and is laden with excess CO2. At the re-gion off the east coast of Sakhalin Island, the lateral ex-port of DOC and POC by the dense shelf water are muchlarger than the sinking POC flux from in-situ surface water(Nakatsuka et al., 2003). In the Okhotsk Sea, it seemsthat the DOC and POC accumulated in the shelf waterare transported out of the shelf without significant removalat the shelf edge.
In addition to dense shelf water outflow, the waterfrom the JES also imports excess CO2 into the intermedi-
Table 2. Salt, dissolved inorganic phosphorus (DIP), nitrogen (DIN), and carbon (DIC) budgets for the Okhotsk Sea (OS).
*Residual fluxes are calculated taking the water transport rate between the Okhotsk Sea and the subarctic Pacific to be 5 Sv(Talley, 1996).
20 ± 3 kg of salt, 0.04 ± 0.01 mole, 1.0 ± 0.1 mole and 4 ± 0.7 mole (1012, yr–1) are the accepted fluxes of, respectively, salt,DIP, DIN and DIC from the subarctic Pacific and to the Okhotsk Sea.
26 C.-T. A. Chen et al.
ate layer of the Okhotsk Sea. The water, called the Fore-runner of Soya Warm Current water from JES, has a den-sity of more than 26.8σθ in spring due to its high salinityand winter cooling, and can sink into the intermediatelayer. It contains excess CO2 absorbed during its north-ward flow. According to Otsuki et al. (2003), CO2 fluxtransported to the intermediate layer by this water is aboutone tenth of that by dense shelf water. Subsequently, theintermediate water transports excess CO2 to the NorthPacific Ocean (Chen, 1993b).
Further, these areas may have shown signs of cli-matic change. The warm Kamchatka Current intermedi-ate water has warmed during the last decade while theupper layer in the Oyashio and the Okhotsk Sea has cooledand become fresher (Rogachev, 2000). Andreev andKusakabe (2001) also demonstrated that the DO concen-trations in the intermediate waters of the Okhotsk Seaand the western Subarctic Gyre have decreased since the1950s. Since the residence time of the intermediate waterof the Okhotsk Sea is only several years (Yamamoto etal., 2001, 2003), the inter-annual variability of the for-mation rate or properties of the Okhotsk Sea Intermedi-ate Water may directly affect the outflowing water whichenters to the NPIW.
3.4 Japan/East SeaThe JES is the eighth largest marginal sea in the
world and the fourth largest in the North Pacific. Theaverage depth is 1667 m but the three basins, namely theJapan, Yamato and Ulleung Basins exceed 2500 m. The
maximum depth is 4036 m. The shelves are generallynarrow except in the far north and far south. While thesubsurface waters are characterized by the unique homo-geneity, called Japan/East Sea Proper Water (Uda, 1934),studies in recent years confirm that subsurface watersdisplay small but distinctive oceanic characteristics withseveral water masses (Gamo and Horibe, 1983; Kim andKim, 1996; Kim et al., 2001). Numerous results of hy-drological measurements show anomalously high concen-tration of dissolved oxygen, suggesting rapid turn overof the subsurface waters: tracer studies have shown thatthe turnover time of JES deep waters is on the order of100 years (Watanabe et al., 1991; Chen et al., 1995a; Kimet al., 1999). The mean inflow and source of N (1 × 10¹²
mol N yr–1) is through the Tsushima/Korea Strait with anannual mean transport of 2–2.5 Sv (Yanagi, 2002; Lyuand Kim, 2003). The Tsushima current is a branch ofKuroshio and the transport is strong in summer and fall.About 80% of the inflow leaves the JES and enters theNorth Pacific through the Tsugaru Strait with a sill depthof 130 m. The rest flows into the Okhotsk Sea throughthe Soya Strait which is only 40 m deep. There is negligi-ble flow into the Okhotsk Sea through the 10 m-deep Tar-tar Strait.
The pCO2 studies of JES surface waters show super-saturation in summer and undersaturation in winter withan annual air to sea invasion of 0.045 Gt C (Oh et al.,1999; Kang and Kim, 2003). This influx rate of 3.7 molm–2yr–1 is more than twice the global average. With itsrapid turn over time, the entire JES has been penetratedby excess CO2, totaling 0.31 ± 0.05 Gt C in 1992 (Chenet al., 1995a; Kang, 1999). The ratio of CaCO3 dissolu-tion and the organic carbon decomposition vary from 0.05at 300 m to about 0.17 below 2000 m. These values are
Fig. 7. Difference in salinity (·200) (×), dissolved inorganiccarbon (µmol kg–1) (�), DIN (·4, µmol kg–1) (�), DIP (·100,µmol kg–1) (�) and silicate (∆SiO4, µmol kg–1) (�) betweenthe Okhotsk Sea (Kuril Basin) and the subarctic Pacificversus σθ. The errors bars shown are 84% confidence inter-vals.
Fig. 8. Vertical profiles of ([NO3] + [NO2] – 16[PO4]) µmolkg–1 and [NH4] µmol kg–1 in the northwestern Okhotsk Seaand Pacific.

Roles of Continental Shelves and Marginal Seas in the Biogeochemical Cycles of the North Pacific Ocean 27
lower than the ratios of 0.14 and 0.36 found in the Southand North Pacific, respectively (Chen et al., 1982; Chen,1990), or 0.54 in the Bering Sea (Chen, 1993a). Diatomand silicoflagellates dominate the phytoplankton (Hongand Chen, 2002). As a result, the vertical gradient of SiO2is several times that of calcium or alkalinity (Chen et al.,1995a).
Because the straits connecting the JES to the outsideare all narrow and shallow, the deep waters have no di-rect exchange with the Pacific, the ECS and Okhotsk Sea.Since the deep waters of the JES are all formed inside theclosed basin, they provide an unique opportunity to con-firm the Redfield Ratios based on the mass-balancemethod (Chen et al., 1996a). The consumption and pro-duction rates of CaCO3, OC, DO and nutrients are givenin Table 3. The JES provides, furthermore, another uniqueenvironment to study the carbon cycle within the closedbasin (Fig. 9; Kang et al., 2001; Kang and Kim, 2003).The estimated primary productions in the warm regionand the cold region are 4.95 mol C m–2yr–1 and 5.07 molC m–2yr–1, respectively (Kang and Kim, 2003). The ex-port production was estimated by the f-ratio of 0.36 inthe warm region, obtained by the helium isotope method(Hahm and Kim, 2001).
3.5 South China SeaThe SCS is the largest marginal sea in the world and
has an average depth of about 1350 m. The southern andsouthwestern regions are the shallow Sunda Shelf and theGulf of Thailand, with an average depth of 50 m. TheSunda Shelf connects to the Indian Ocean through theStrait of Malacca, but the major connection is with theJava Sea through the Karimata and Gelasa Straits whichare shallower than 50 m. The northern and northwesternregions are also wide shelves with connection to the ECSthrough the Taiwan Strait, which is also shallow, averag-ing 50 m-deep. The central and northeastern parts of theSCS are rather deep, over 5500 m at places. The only
deep connections with the outside are the 400 m-deepMindoro Strait which leads to the Sulu Sea, and the 2200m-deep Bashi Channel which opens to the Philippine Sea.The seasonally reversing monsoon winds play an impor-tant role in determining the upper ocean circulation. Thecombination of such variable atmospheric forcing andcomplex geometry contributes to the complicated dynam-ics of the flow in the SCS. There is no deep or intermedi-ate water formation in the SCS. In addition, there is strongupwelling. As a result, the excess CO2 does not penetratemore than 1500 m and the entire SCS probably contains0.43 (±0.1) Gt C anthropogenic carbon in 1994.
Particle fluxes in the SCS appear to be basically con-trolled by monsoon-related processes (Liu et al., 2002).Upwelling phenomena and wind-induced nutrient entrain-ment into the euphotic zone may account for the overallenhanced production of biogenic components in the cen-tral part of the basin. In the northern SCS, however, pro-ductivity is at comparatively low levels probably becauseof an Ekman-induced downward deflection of thethermocline in winter and reduced wind strengths in sum-mer. Here the seasonal flux signal seems to be related tothe latitudinal extension of the monsoonal dust veils,yielding significantly higher lithogenic contributions. Inresponse to the grater availability of mineral ballast, thefluxes of organic matter in the northern SCS are as highas at the central region. Increased carbonate fluxes dur-ing the NE monsoon may be due to a fallout of calcitefrom the dust plumes (Wiesner et al., 1996a, b).
Wiesner et al. (1996a, b) reported a fallout of vol-canic ash (9012 g m–2) from the 1991 paroxysmal explo-sion of Mount Pinatubo (Philippines) in mid- and deepwater in the central SCS. The bulk of the ash arrived inthe deep sea within less than 3 days after the release ofthe major eruption plume which means a subaqueous set-tling velocity of higher than 1670 m d–1. The recovery ofthe surface water ecosystem from this massive injectionwas very rapid as compared to the deep sea but probably
Table 3. Consumption or production rates of CaCO3, organic carbon, oxygen and nutrients in the deep North Pacific MarginalSea Basins (µmol kg–1yr–1).
*Taken from Chen et al., 1996a; **Taken from Chen et al., 2001.
28 C.-T. A. Chen et al.
was not stimulated by nutrients derived from in situ leach-ing of the ash in the mixed layer because the dissolutionof glass is too slow. The amounts of pyroclasts that didremain suspended were also too low to have producedthe enhanced flux observed during the post-eruption year.
Chen et al. (2001) constructed a simple box modelto balance fluxes in and out of the SCS (Fig. 10). Notethe SCS exports P through the Bashi Channel becausethe import of nutrients by the nutrient-poor KSW is notenough to compensate the export by the relatively nutri-ent rich SCS Surface Water (SCSW). In addition, theoutflowing intermediate water, with essentially all its Psupplied by the deep water, turns northward after leavingthe Bashi Channel. Subsequently this water upwells ontothe ECS, providing P to the shelf water which is short ofP relative to N. As stated before, rivers play only a rela-tively smaller role in sustaining the high productivity inthe ECS. It is still not possible to separate the effects ofnitrogen fixation (Wong, 2002) from denitrification butthere is a net denitrification in both seasons, totaling 0.042mol N m–2yr–1. This figure is smaller than that found inthe ECS. Similar to P, the SCS exports a large amount ofN through the Bashi Channel, both in the SCSW and inthe intermediate water.
It is important to note that, similar to the ECS, therivers flowing into the SCS have a very low phosphoruscontent. The DIN/DIP ratio is 86 which is far higher thanthe Redfield ratio of 16. On the other hand, the influx ofseawater through the Sunda Shelf (only in the wet sea-son), and the year-round upwelling and inflow throughthe Bashi Channel and the Mindoro Strait bring in
seawater with a DIN/DIP lower than the Redfield ratio.These incoming seawater masses contribute the most tothe productivity in the SCS. Although upwelling doesoccur in the SCS (Shaw et al., 1996; Chao et al., 1996a,b), in the dry season the intermediate water transportsmore N and P out of the SCS than the deep water bringsin. The excess can only come from the decomposition ofsinking organic particles.
The net burial of biogenic silica is taken as the re-sidual, and is 156 and 132 × 109 mol for 6 month for thewet and dry seasons, respectively. These fluxes are smallas only the siliceous particles produced from dissolvedSi in the SCS are taken into account. Aeolian dust parti-cles and suspended particles, such as sand, transportedby rivers are not included. Note the SCSW transport about1 × 1012 mol Si a year out of the SCS which is severaltimes the riverine input. Much of this excess comes fromupwelling of deep waters. Since there are no data avail-able, organic nutrients are not considered in the abovecalculations.
Chen et al. (2001) calculated the decomposition anddissolution rates of particles based on the mass-balancemethod. The rates of increase are as follows: 0.59 ± 0.12(AOU), 0.054 ± 0.016 (nitrate), 0.0035 ± 0.001 (phos-phate) and 0.17 ± 0.05 (silicate), all in µmol kg–1yr–1.The one dimensional advection-diffusion model for wa-ters between about 800 and 3000 m where the θ/S plot isrelatively linear results in an oxygen consumption rate of0.38 ± 0.06 compared to 0.59 ± 0.12 µmol kg–1yr–1 ob-tained based on the mass-balance method. The nitrate,phosphate and silicate production rates obtained by the1-D model are 0.045 ± 0.01, 0.005 ± 0.002 and 0.26 ±0.07 µmol kg–1km–1, respectively. These are in reason-able agreement with the mass-balance estimations. Theserates are listed in Table 3 and compared to the values inthe Bering Sea and the JES. The rates are highest in theJES and lowest in the Bering Sea, the rates in the SCS
Fig. 9. Carbon cycle in the Japan/East Sea. Numbers denotethe size of the reservoirs and fluxes in Gt C and Gt C yr–1,respectively.
Fig. 10. Schematic diagram for the annual nutrient budgets(numbers in 109 mol yr–1) in the South China Sea (takenfrom Chen et al., 2001).

Roles of Continental Shelves and Marginal Seas in the Biogeochemical Cycles of the North Pacific Ocean 29
being intermediate between these two. These differencesare caused by the age of the water relative to their sources(Chen et al., 2001).
The saturation horizon of calcite is deeper than 2000m in the SCS; thus little enhanced dissolution is expecteddue to the excess CO2 penetration (Chen and Huang,1995). The saturation horizon of aragonite is 600 m, shal-lower than the excess CO2 penetration depth but deeperthan the saturation horizon found in the Bering Sea. Theupward migration of the saturation horizon would notaffect the calcareous deposits on the SCS shelf to the de-gree that it affects the Bering Sea deposits.
3.6 Sulu SeaLike most other deep basins in southeast Asia, the
deep Sulu Basin is isolated from the neighboring seas bysurrounding topography. Therefore, its hydrographic anddynamic characteristics are representative of an isolateddeep basin. While the near-surface circulation is mainlygoverned by the seasonally reversing monsoon winds, thedeep circulation is forced by an inflow of intermediatewater from the SCS through the Mindoro Strait (sill depth420 m), which supplies the intermediate and bottom wa-ters of the Sulu Sea (Wyrtki, 1961; Nozaki et al., 1999).Below 1000 m T, S, AOU, PO4, SiO2 and pH in the SuluSea are remarkably homogeneous (Fig. 11). Tracer data(Broecker et al., 1986) suggest renewal times of 50–100yr.
Below the warm and fresh surface layer, the core ofthe Subtropical Lower Water from the Pacific Ocean can
be seen around 200 m depth as a very distinct salinitymaximum. It lies well above the sill depth in the MindoroStrait and its spreading is thus not hampered by topogra-phy. NPIW is the primary source for the intermediate anddeep waters of the Sulu Sea. A low-salinity core originat-ing from this minimum can be traced across the Sulu Seain the 600-to-1400 m depth layer. It is associated with arelative maximum in oxygen content and a vertically ho-mogeneous silicate concentration. Temperatures here arehigher than in the corresponding layer in the SCS, pre-sumably due to tidally induced vertical mixing in theMindoro Strait.
In the deep-water regime below about 2500 m depth,the vertical and horizontal gradients of the hydrographicproperties are small. There is a tendency for the deep waterin the northern Sulu Sea to be slightly fresher and warmerand to have higher oxygen content compared to the deepwater in the south. The high temperature, low salinity,and high oxygen contents are indicative of an intrusionof NPIW in the deep northern Sulu Sea. Deep plume con-vection down the continental slope is likely the genera-tion mechanism. The maximum depth of the renewal de-pends strongly on the density of the water inflowingthrough the Mindoro Strait. The shallower the thermoclinein the SCS, the denser the overflow water and the deeperthe convection in the Sulu Sea. A possible mechanism forthermocline uplifting is the passage of tropical cycloneswhich may be responsible for the intermediate depth in-trusion in the Sulu Sea (Frische and Quadfasel, 1990).
The depth-integrated PP rates in the oceanic region
Fig. 11. Vertical distribution of θ, S, AOU, PO4, SiO2 and pH in the Sulu, South China and West Philippine Seas (Sulu Sea datataken from Gamo et al., 1997).

30 C.-T. A. Chen et al.
of the Sulu Sea (16 mol C m–2yr–1) is higher than the shoalarea (14 mol C m–2yr–1), which is higher still than thatacross the Mindoro Strait (12 mol C m–2yr–1) (SanDiego-McGlone et al., 1999). The biological productiv-ity is probably the major factor leading to the low sur-face water pCO2 value of around 250 µatm in summer(calculated based on the pH and TA data of Gamo et al.,1997).
3.7 Californian shelf and Gulf of CaliforniaThe California shelves are quite narrow and have a
maximum width of about 20 km. The shelf break is lo-cated at 100–200 m water depth and is intersected by can-yons. Local rivers supply 80% of the total sediment input(Eittreim et al., 2002) but there is little recent sedimenta-tion, and sediments on the shelf are largely relic deposits(de Hass, 1997). The Gulf of California shelves are alsonarrow, usually within 50 km wide on the eastern sideand narrower on the western side. In the northern end theshelf reaches 150 km wide.
Like the Red Sea (Chen and Wu, 1991) the Gulf ofCalifornia is a large evaporation basin because of the higharidity (Alvarez-Borrego, 1983). It is about 1000 km longand 150 km wide on the average, and has an area of0.16 × 106 km2 with an average depth of 813 m. The Colo-rado River used to be a major source of fresh water to theGulf but there has been essentially no river water inputexcept during the winter raining season due to the con-struction of dams. Because of the arid climate the salin-ity of the Gulf increases from below 35 in the south, to35 in the northern gulf, and to about 37 in the ColoradoRiver estuary. Strong tidal mixing (9 m tidal range in thenorthern gulf) generated upwelling which brings cool, lesssaline, low pH and very low oxygen but high TCO2 andnutrient-rich North Pacific Intermediate Water (>500 m)to the euphotic zone in the region of the Midrift Islands.The percent saturation of CaCO3 with respect to calciteand aragonite decreases with depth rapidly toundersaturation at about 300 and 70 m, respectively, inthe central and southern regions of the Gulf (Alvarez-Borrego, 1983). Despite of the relatively high primaryproductivity, on the order of 30 mol C m–2yr–1, the sur-face pCO2 becomes 30 to 40 µatm supersaturated at thesouthern end of the Gulf and at times may become al-most 200 µatm supersaturated near the Midrift islands(Alvarez-Borrego and Lara-Lara, 1991; Hidalgo-Gonzalezet al., 1997; Zirino et al., 1997). Because of strongupwelling, excess CO2 penetrates to no more than 500 mand the Gulf of California contains only 0.015 ± 0.005Gt of excess carbon.
Primary productivity on the California shelves showlarge seasonal and interannual variations. Sediments andorganic matter are deposited on the slopes and fans of thecontinental borderland basins, notably the Santa Barbara
Basin where multiple blooms occur. Most of the organicmatter is mineralized in the water column and the upperlayer of the sediments. Organic matter consists of 25%terrigenous input and the concentrations in the sedimentsvary between 4 and 6% (Kemp, 1995; de Haas, 1997; deHass et al., 2002). Only less than 2% of the PP reachesthe seabed below 500 m and less than 1% is accumulatedon the slope (Reimers et al., 1992; Pilskaln et al., 1996).On an annual to decadal scale, the dominant cause ofvariability in productivity is the El Niño-Southern Oscil-lation event (ENSO). The net effect of ENSO is to movewarmer water onshore and reduce the strength ofupwelling, hence nutrient supply. This has been docu-mented for the 1982–83 ENSO when cold water diatomflux in the Santa Barbara Basin decreased relative to non-ENSO years and warm water diatoms, radiolarians andforaminifera were recorded in the laminated sediments.Decadal to millennial cycles of bioturbation and preser-vation of laminated sediments driven by variation in oxy-gen minimum zone intensity has been ascribed to solarcycles affecting the longer-term alternation of El Niñoand La Niña. However, no regular cyclicity in productiv-ity was identified in the laminated, diatomaceoussediments (Kemp, 1995). This is because surface nutri-ent concentrations and productivity remain high duringan ENSO event due to strong upwelling and mixing asso-ciated with the tides (Alvarez-Borrego and Lara-Lara,1991). Only about 4% of the silica deposited is suppliedby rivers, with the rest coming from upwelling (Alvarez-Borrego, 1983). Smoak et al. (1999) detected more effi-cient scavenging during an ENSO winter.
3.8 Northwestern American shelfThe Northwestern American shelf is 25–60 km wide
with the shelf break located at 150–200 m water depth.Several canyons intersect the shelf. North wind from Mayto September results in coastal upwelling in a narrow bandwhereas from October to April south wind results indownwelling. Local rivers discharge about 2.5 × 10¹¹ m3
of water per year, peaking in June. The Columbia Riverdischarges about 17 × 106 tons of sediments and 0.6 ×10⁶ tons of terrigenous carbon per year. Of the latter about80% is DOC and the remainder is POC (de Hass, 1997;Hill and Wheeler, 2002). When downwelling occurs thePP is smaller than 15 mol C m–2yr–1. In summer whenupwelling occurs the PP is larger than 92 mol m–2yr–1.Total PP is about 54 mol C m–2yr–1. Most of the producedOC on the shelf is consumed before it reaches the seafloor (de Haas, 1997). The DMS concentration is about4.1 nmol S (Uzuka et al., 1997).
Most of the particulate load of the Columbia Riveris deposited on the Washington shelf. Only a very smallamount is deposited on the Oregon shelf. The accumula-tion rates on the Washington shelf range from 2.5–7.5 kg

Roles of Continental Shelves and Marginal Seas in the Biogeochemical Cycles of the North Pacific Ocean 31
m–2yr–1. Organic carbon concentrations on the shelf rangefrom below 0.5% to above 1%, and the accumulation ratesaverage 0.3 mol C m–2yr–1. On the slope and in the can-yons the average OC accumulation rates are, respectively,1.2 and 5.3 mol m–2yr–1. About 25% of the preserved OCis of terrigenous origin. It has been reported above thatcanyons are major conduits of offshore transport ofsediments in the ECS. It is also true here that most of theorganic matter introducted onto the shelf is not storedlocally, but is burried on the slope, in the canyons and onthe abyssal plain (de Haas, 1997). The narrow shelvesoff the eastern coast of Japan also see the lithogenic par-ticles transported to the open ocean rapidly (Noriki et al.,1997).
3.9 Western Canadian shelfThe large (0.1 × 10⁶ km2) western Canadian shelf is
relatively narrow (10–120 km wide) intersected by deepglacial channels. During autumn and winter general flowis down wind with strong storm mixing. During summerthe flow over the shelf is dominated by eddies. Almostall the material supplied by rivers is deposited in thefjords, bays and straits before it can reach the shelf. As aresult, the surface sediments on the shelf is mostly relic.The PP is moderate, at 12.5–16.7 mol C m–2yr–1. Organiccarbon thus produced is the major source of OC on theshelf. Most of the OC, however, is mineralized in the watercolumn or is exported offshore (de Haas, 1997).
4. Teleconnection between the East and South ChinaSeasThe Taiwan Strait connects the East and South China
Seas. The SCS is rather deep but because of its shallowdepth, averaging only 50 m with no deep channels, theStrait does not permit exchange of waters between thesetwo seas except for low-nutrient near-surface waters. Insummer, the water flows northward through the Strait but,in winter, there is a southward flowing current along thecoast of Fujien Province on the western side of the Strait.
On the other hand, the Kuroshio feeds the SCS year-round. The nutrient-depleted near-surface Kuroshio wa-ter exchanges freely with the SCS all year. However, thenutrient-rich intermediate water, arbitrarily taken as thelayer between 350 and 1350 m encompassing the core ofthe salinity minimum (Smin), seems only to flow out ofSCS and forms the western portion of the Kuroshio (Chenand Huang, 1996). The core of the outflowing SCS Sminlayer is at about 600 m, roughly 200 m shallower thanthe Smin core of the eastern part of the Kuroshio origi-nated from the west Philippine Sea. As a result, the nownorthward flowing SCS intermediate water is able to crossthe ridge northeast of Taiwan to enter the OkinawaTrough, which is adjacent to the ECS continental shelf.
The KIW contributes up to 30% in the upwelling and
cross-shelf mixing at the East China Sea shelf break. Theupwelled KIW actually originates from the SCS and ishigh in nutrients, thus contributing a great deal of nutri-ents to the shelf as compared with the much smallerriverine fluxes. Furthermore, P flux from the ChangjingRiver could be identified only in the estuary. The N fluxextends further but could still be identified only in theYangtze River Plume. This suggests that the new produc-tivity in much of the ECS is influenced by the upwelledsubsurface Kuroshio water. Any potential change in theupwelling rate would thus have a much larger effect thanthe change in the nutrient input from rivers (Chen andWang, 1998).
5. Initial SynthesisAlmost without exception, the observational data and
budget calculations for the North Pacific continentalshelves suggest that although a small fraction of carbonis exported across the shelf-slope break, the principal fateof carbon produced on shelf is, in fact, oxidation on theshelf. Similar results have been reported for the NorthSea and the Atlantic Bight. Upwelling seems to supportmost of the nutrient needed to support the new produc-tion and denitrification. Even for bays with relatively largeriverine input the riverine loading seems to support onlya small percentage of new production (e.g. Yoshimura andKudo, 2003). As a result, when upwelling is reduced newproduction is reduced as well (e.g. Kudela and Chavez,2002).
Table 4 summarizes the systems studied to exemplifysimilarities and differences in terms of the general typol-ogy characteristics explored. These include allocatingsystems on the basis of positive or negative estimates fora number of processes and fluxes, where the sign is takenas gains (+) or losses (–) with respect to the shelf, wherep is production, r is respiration, Net denit. is denitrificationminus nitrogen fixation. Smith and Mackenzie (1987)noted that the oceans are a net heterotropic system, thatis, (p–r) is negative. (p–r), however, is rarely measuredsystematically on a cruise and is usually calculated basedon the phosphorus budget (Smith and Hollibaugh, 1993;LOICZ, 1997). Most results indicate that (p–r) is posi-tive, that is, most continental margins in the North Pa-cific are exporting organic carbon because production ishigher than respiration. Noteworthy is that even the To-kyo Bay, which receives much terrestrial input, is still anet exporter of organic matter because of the high PP(Matsumura et al., 2002).
As for the air-sea exchange of CO2, Table 4 indi-cates that most regions are absorbing CO2 from the at-mosphere or are nearly at equilibrium. As expected, mostregions export particulate C, N and P to the sediments.Dissolved and particulate organic matter, as well asparticulate inorganic matter are also transported offshore

32 C.-T. A. Chen et al.
Tab
le 4
. N
on-c
onse
rvat
ive
flux
es i
n co
ntin
enta
l m
argi
ns.
Da t
a fr
om 1
. th
is s
tudy
; 2.
ta b
le 8
of
Che
n e t
al.
(20
03a )
and
13
refe
renc
e s t
here
in;
3. W
a lsh
(19
88,
1989
, 19
95,
1996
); 4
. N
e da s
hkov
sky
a nd
Sap
ozhn
ikov
(20
01);
5. M
oisa
n e t
al.
(19
96);
6. O
h e t
al.
(20
00);
7. K
a ng
e t a
l. (
2001
); 8
. Wa l
sh a
nd D
iete
rle
(199
4); 9
. De v
ol (
1991
) a n
d D
evol
and
Chr
iste
nse n
(19
93);
10.
Ma c
kas
a nd
Ye l
land
(199
9);
11.
Che
n e t
al.
(20
01);
12.
Ta k
a ha s
hi e
t al
. (2
002)
; 13
. M
a e t
al.
(19
99);
14.
Ya n
a gi
(200
2);
15.
Koi
ke (
1993
); 1
6. K
a ng
e t a
l. (
2003
); 1
7. d
e H
a as
e t a
l. (
2002
);18
. Ha r
tne t
t a n
d D
evol
(20
03);
19.
Won
g e t
al.
(20
02);
20.
Yos
him
ura
a nd
Kud
o (2
003)
; 21
. Ma t
sum
ura
e t a
l. (
2002
); 2
2. F
rie d
e ric
h e t
al.
(20
02).
*p–r
re p
rese
nts
the
diff
e re n
c e b
e tw
e en
prim
a ry
prod
ucti
on a
nd r
e spi
rati
on. T
his
diff
e re n
c e r
e pre
sent
s th
e ne
t e c
osys
tem
me t
a bol
ism
of
the
syst
em a
nd h
a s b
e en
take
nto
de s
c rib
e th
e ro
le o
f or
gani
c m
e ta b
olis
m i
n th
a t s
yste
m a
s a
sour
c e o
r si
nk o
f C
O2.
**+
ind
ica t
e s e
nte r
ing
the
she l
f sy
stem
; –
me a
ns l
e avi
ng t
he s
yste
m.

Roles of Continental Shelves and Marginal Seas in the Biogeochemical Cycles of the North Pacific Ocean 33
while dissolved inorganic matter enters the continentalmargins from offshore. Dust and rain, of course, supplyN and P to the margins but most margins seem to lose N2/N2O by way of net denitrification.
Recently Nixon et al. (1996) and Galloway et al.(1996) studied the fate of N and P at the land-sea margin(5.7 × 10⁶ km2) of the North Atlantic Ocean. They con-cluded that net denitrification (Av. 246 mmol N m–2yr–1)in most estuaries and continental shelves exceeds theamount of N supplied to the shelves by rivers, and re-quires a supply of nitrate from the open ocean. This is inagreement with our results or those of global shelves(Walsh, 1991; Middelburg et al., 1996; Wollast, 1998)but their P budget indicates that there is a net export of Pto the open ocean in the water column. Whereas in theECS the opposite is true (Fig. 2). The net offshore exportis mostly supported by upwelling. In fact, so much nutri-ents are supplied by upwelling which drives the biologi-cal pump on the shelves. Clearly large uncertainties existhere but data in the ECS, SCS, JES, and Okhotsk andBering Seas all show an air-to-sea flux of CO2 at an aver-age rate of 1.1 ± 0.3 mol C m–2yr–1. Similar to what hasbeen reported for the European shelves (e.g. Frankignoulleand Borges, 2001) marginal seas of the North Pacific aremostly undersaturated with respect to atmospheric CO2in the surface water mainly as a result of the biologicalpump and winter cooling. The North Pacific marginal seas,however, release N2 at an average rate of about 0.07 ±0.03 mol N m–2yr–1.
Most of the primary production, however, is regen-erated on the shelves, and only 15% is transported to theopen oceans as dissolved and particulate organic carbon(POC) with a small amount of POC deposited in thesediments (Chen, 2003a). Recently, Hernes and Benner(2002) reported that lignin concentrations in both dis-solved and particulate organic matters in the NPIW are afactor of two higher than at all other depths in the NorthPacific. This is taken to reflect the riverine input via theOkhotsk Sea. Further, it is estimated that seawater in themarginal seas in the North Pacific alone may have takenup 1.6 ± 0.3 Gt (1015 g) of excess carbon, including0.21 ± 0.05 Gt for the Bering Sea, 0.18 ± 0.08 Gt for theOkhotsk Sea; 0.31 ± 0.05 Gt for the JES; 0.07 ± 0.02 Gtfor the East China and Yellow Seas; 0.80 ± 0.15 Gt forthe South China Sea; and 0.015 ± 0.005 Gt for the Gulfof California. More importantly, high latitude marginalseas such as the Bering and Okhotsk Seas may act as con-veyer belts in exporting 0.1 ± 0.08 Gt C excess CO2 intothe NPIW per year (Fig. 12). The upward migration ofcalcite and aragonite saturation horizons due to the pen-etration of excess CO2 may also make the shelf depositson the Bering and Okhotsk Seas more susceptible to dis-solution, which would then neutralize excess CO2 in thenear future. Further, because most nutrients originate from
upwelling, increased water consumption on land and dam-ming of major rivers may reduce freshwater output andthe buoyancy effect on the shelves and, thus, reduceupwelling, nutrient input and biological productivity inthe future (Chen, 2002b; Chen et al., 2003b).
The above discussion, however, is all under the as-sumption of a steady state. Interannual variations, suchas ENSO, affect the riverine runoff to a great deal. As aresult, the upwelling rate and all associated fluxes forriver-dominated shelves would change. Even for areaswith narrow shelves but strong wind-induced upwelling,the impact of higher runoff (increased new productionhence lower pCO2) can be seen nearshore (e.g. Kudelaand Chavez, 2002). Further, slumping and turbidity cur-rents may wash away the shelf deposit, thus reducing thereservoir. These effects have not been considered.
6. Effects of Climatic Changes and Future ResearchNumerous examples reveal that the oceanic environ-
ment is changing due to either natural or man-made vari-ations in climate and river run-off. For instance, Murrayet al. (1991) suggested that there may have been an up-ward displacement of the isopycnal surfaces in the BlackSea due to an increase in salinity at a given potential tem-perature. The ecosystem and biogeochemical structures
Fig. 12. Schematic diagrams of flow patterns in the Bohai Sea,Bering and Okhotsk Seas, Japan/East, Yellow and EastChina Seas, Gulf of California, and the Sulu and South ChinaSeas.

34 C.-T. A. Chen et al.
in the Black Sea have been drastically modified withinthe last three decades by a combination of natural andanthropogenic variations (Konovalov and Murray, 2001).Bethoux et al. (1998a, b) reported temperature and salin-ity increases in the Mediterranean deep waters since the1940s. Freeland (1990) and Freeland et al. (1997) dem-onstrated a warming trend but a decrease in the surfacesalinity, hence increase in stratification along the BritishColumbian coast of Canada overthe past 50 years.Whitney and Welch (2002) further revealed a trend to-wards greater stratification of Gulf of Alaska coastal wa-ters in the past several decades, hence a reduction of sup-ply of nutrient to the mixed layer. The PP and fish pro-duction have suffered. While these incidences could benatural variations, they may well reflect environmentalchanges such as global warming and higher frequency ofEl Niño events.
Changes in stratification and the concentration ofnutrients have also been reported in the Oyashio Currentregion of the western subarctic Pacific (Ono et al., 2002).The decrease in the salinity in the surface layer duringthe last 40 years has been observed in the Bering Sea,attributed to the decrease in the meridional salt transport,and thereby reduction in the overturning of intermediatelayer (Andreev and Watanabe, 2002). Similar decreasesin salinity or river runoff in the northeastern North Pa-cific can be related to increases in precipitation in theabsence of processes such as advection (Freeland et al.,1997; Peterson et al., 2002).
Andreev and Kusakabe (2001) and Andreev andWatanabe (2002) have observed the tendency towards adecrease in oxygen in the intermediate waters of theOkhotsk Sea, Western Subarctic Gyre and Alaska Gyrebetween 1950 and 2000. The decrease in oxygen coin-cides with an increase in temperature in the intermediatelayer. It is hypothesized that the changes are correlatedwith the North Pacific Index (NPI), which fosters me-ridional transport of salt to the Bering Sea when NPI ishigh. The gradual decrease in NPI thus has caused a fresh-ening and a subsequent decrease in ventilation, resultingin a decrease in oxygen of the intermediate waters of thesubarctic North Pacific. The observed trends in salinityof the surface water, and oxygen in the intermediate layerof the subarctic North Pacific are in good agreement withthe prediction of coupled ocean/atmospheric models us-ing a changing climate scenario (Manabe and Stouffer,1993; Sarmiento et al., 1998; Matear and Hirst, 1999).On the other hand, the observed trends may still be a natu-ral event that probably took place previously in the NorthPacific between 1750 and 1905 (Biondi et al., 2001).
Restricted seas can not escape such temporal vari-ability. For instance, Matsumura et al. (2001) reported arapid increase of nutrient loading in the Tokyo Bay in the1960s. Nutrient concentrations, however, showed a de-
clining trend in the 1990s. Enhanced removal of anthro-pogenic CO2 by excess PP, and subsequent burial of OCin the sediments are probably not significant because theenhanced nutrient supply is still very limited. Note thatupwelling provides most nutrients to the shelves and,upwelling may intensify as a result of global warming(Bakun, 1990). On the other hand, the widespread dam-ming has reduced freshwater output. Upwelling might beaffected as a result of reduced buoyancy effect (Chen,2000, 2002b; Chen et al., 2003b).
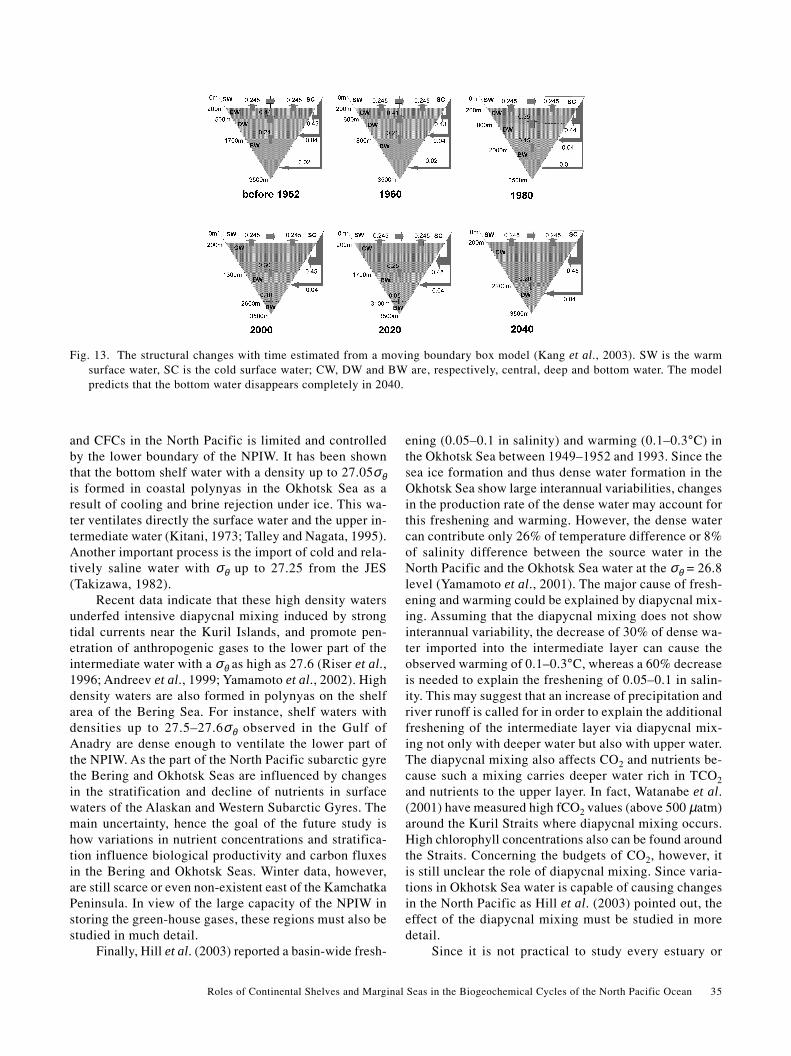
The JES has seen a decline of the springphytoplankton biomass during the 1980s because of in-tensified stratification of the upper water column (Chibaand Saino, 2002). It has also experienced fluctuations inbottom-water oxygen concentration over many time pe-riods (Gamo et al., 1986; Kim and Kim, 1996; Chen etal., 1999; Kim et al., 1999). These temporal variationswere transient, probably caused by warming and a reduc-tion or cessation of new bottom water formation (Kimand Kim, 1996; Chen et al., 1999; Kim et al., 1999; Gamo,1999; Kim et al., 2001). It has also been reported that thetemperature below 2000 m has been increasing while thethickness of the relatively homogeneous bottom layer hasdecreased since 1950 (Kim and Kim, 1996; Kim et al.,2001). Recent secular variations in temperature and dis-solved oxygen for stations in the central basin have indi-cated that the depth of the oxygen minimum layer hasbeen increasing since the 1950s but the oxygen concen-tration in the bottom layer has been decreasing. The thick-ness of the bottom layer has also decreased. It can onlybe concluded that the JES began to show signs of stagna-tion at least around 1950. It is worthwhile noting thatGladyshev (1997) reported that the gentle Okhotsk Seawinters led to a dramatic decrease in dense water produc-tion in the coastal Okhotsk Sea polynyas during the 1990s.This may be related to the reported (Watanabe et al., 2001)reduction in the formation rate of the surface water in theNorth Pacific. Despite the fact that intermittent bottomwater is still formed (Kim et al., 2002a), if the tempera-ture keeps on rising and stagnation continues, the JESbottom water could become anoxic between 180 and 530years from now (Chen et al., 1999). It has also beenshown, however, that the observed structural changes inthe JES are associated with changes in its internal con-veyor belt system, i.e., a reduction of bottom water for-mation but an increase in intermediate water formation(Kim and Kim, 1996; Kim et al., 2001). If this changecontinues at the current rate, the bottom water would dis-appear completely by 2040 (Fig. 13; Kim et al., 2002b;Kang et al., 2003).
An issue that deserves further study is the role of thewestern Bering Sea and the Sea of Okhotsk in the forma-tion of the NPIW. Accumulation and redistribution ofanthropogenic and green-house gases such as CO2, CH4
Roles of Continental Shelves and Marginal Seas in the Biogeochemical Cycles of the North Pacific Ocean 35
and CFCs in the North Pacific is limited and controlledby the lower boundary of the NPIW. It has been shownthat the bottom shelf water with a density up to 27.05σθis formed in coastal polynyas in the Okhotsk Sea as aresult of cooling and brine rejection under ice. This wa-ter ventilates directly the surface water and the upper in-termediate water (Kitani, 1973; Talley and Nagata, 1995).Another important process is the import of cold and rela-tively saline water with σθ up to 27.25 from the JES(Takizawa, 1982).
Recent data indicate that these high density watersunderfed intensive diapycnal mixing induced by strongtidal currents near the Kuril Islands, and promote pen-etration of anthropogenic gases to the lower part of theintermediate water with a σθ as high as 27.6 (Riser et al.,1996; Andreev et al., 1999; Yamamoto et al., 2002). Highdensity waters are also formed in polynyas on the shelfarea of the Bering Sea. For instance, shelf waters withdensities up to 27.5–27.6σθ observed in the Gulf ofAnadry are dense enough to ventilate the lower part ofthe NPIW. As the part of the North Pacific subarctic gyrethe Bering and Okhotsk Seas are influenced by changesin the stratification and decline of nutrients in surfacewaters of the Alaskan and Western Subarctic Gyres. Themain uncertainty, hence the goal of the future study ishow variations in nutrient concentrations and stratifica-tion influence biological productivity and carbon fluxesin the Bering and Okhotsk Seas. Winter data, however,are still scarce or even non-existent east of the KamchatkaPeninsula. In view of the large capacity of the NPIW instoring the green-house gases, these regions must also bestudied in much detail.
Finally, Hill et al. (2003) reported a basin-wide fresh-
Fig. 13. The structural changes with time estimated from a moving boundary box model (Kang et al., 2003). SW is the warmsurface water, SC is the cold surface water; CW, DW and BW are, respectively, central, deep and bottom water. The modelpredicts that the bottom water disappears completely in 2040.
ening (0.05–0.1 in salinity) and warming (0.1–0.3°C) inthe Okhotsk Sea between 1949–1952 and 1993. Since thesea ice formation and thus dense water formation in theOkhotsk Sea show large interannual variabilities, changesin the production rate of the dense water may account forthis freshening and warming. However, the dense watercan contribute only 26% of temperature difference or 8%of salinity difference between the source water in theNorth Pacific and the Okhotsk Sea water at the σθ = 26.8level (Yamamoto et al., 2001). The major cause of fresh-ening and warming could be explained by diapycnal mix-ing. Assuming that the diapycnal mixing does not showinterannual variability, the decrease of 30% of dense wa-ter imported into the intermediate layer can cause theobserved warming of 0.1–0.3°C, whereas a 60% decreaseis needed to explain the freshening of 0.05–0.1 in salin-ity. This may suggest that an increase of precipitation andriver runoff is called for in order to explain the additionalfreshening of the intermediate layer via diapycnal mix-ing not only with deeper water but also with upper water.The diapycnal mixing also affects CO2 and nutrients be-cause such a mixing carries deeper water rich in TCO2and nutrients to the upper layer. In fact, Watanabe et al.(2001) have measured high fCO2 values (above 500 µatm)around the Kuril Straits where diapycnal mixing occurs.High chlorophyll concentrations also can be found aroundthe Straits. Concerning the budgets of CO2, however, itis still unclear the role of diapycnal mixing. Since varia-tions in Okhotsk Sea water is capable of causing changesin the North Pacific as Hill et al. (2003) pointed out, theeffect of the diapycnal mixing must be studied in moredetail.
Since it is not practical to study every estuary or

36 C.-T. A. Chen et al.
marginal sea in the world generalization is needed. Ourbudgeting approach should be complimentary to the ap-proach advocated by LOICZ (local budgets upscaled tothe whole coastal zone). Comparison of the two ap-proaches would be interesting when LOICZ publishes theresults. It is not yet possible for this study but the recom-mendations made by the JGOFS/LOICZ ContinentalMargins Task Team are still valid (JGOFS, 1997): Thereis a need to check, validate and carry out sensitivity analy-ses on the available budgets. But all budgets are notequal—some budgets have more precise input data andso have more precise output. This must be identified intheir descriptions; There is a need to compare budget re-sults with process studies in as many situations as possi-ble. One possibly useful comparison is with direct meas-urements of the p–r and denitrification; Efforts should bemade to explore the finer categorisation of different shelfsystems based on globally available parameters such asshelf width and human impacts and; Work on regionalscales shows the greatest potential for the use of budgetanalysis in understanding the discrepancies of inputs andexports of inorganic nutrients.
7. SummarySimilar to the results reported elsewhere based ei-
ther on observations (Gattuso et al., 1998; Frankignoulleand Borges, 2001) or models (Rabouille et al., 2001) mostmarginal seas in the North Pacific are found to be fed bynutrients supported mainly by upwelling. Many areundersaturated with respect to atmospheric CO2 in thesurface water mainly as a result of the biological pumpand winter cooling. These seas absorb CO2 at an averagerate of 1.1 ± 0.3 mol C m–2yr–1 but release N2/N2O at anaverage rate of 0.07 ± 0.03 mol N m–2yr–1. The results ofthe budget calculations for the ECS shelf support the con-clusion of the SEEP-II study that the hypothesis of ex-port of a large proportion of the shelf PP is untenable.Only a small fraction of carbon, on the order of 15% pro-duced, is exported across the shelf break. The ECS ab-sorbs a large amount of CO2 because of its high produc-tivity, hence low pCO2. The high productivity is supportedmainly by nutrients in the upwelled subsurface Kuroshiowater, thus converting DIC into DOC and POC which aresubsequently transported offshore. Yet the East and SouthChina Seas are not important reservoirs for excess CO2because of their small size and the upwelling. Thesediments are unlikely to neutralize excess CO2 in thenext century, but carbonate is regenerated from organicmatter at the bottom. This regenerated carbonate, and al-kalinity, may be exported to, and stored in, the pelagicocean.
The Bering and Okhotsk Seas do not have very deepwater formation but may contribute to the formation ofNPIW, thus pumping excess CO2 to the North Pacific.
The JES, which has shown signs of warming and stagna-tion, has deep and bottom water formation, but does notexport excess CO2 because of the shallow sills. It is esti-mated that seawater in the marginal seas in the NorthPacific alone may have taken up 1.6 ± 0.3 Gt (1015 g) ofexcess carbon, including 0.21 ± 0.05 Gt for the BeringSea, 0.18 ± 0.08 Gt for the Okhotsk Sea; 0.31 ± 0.05 Gtfor the Japan/East Sea; 0.07 ± 0.02 Gt for the East Chinaand Yellow Seas; 0.80 ± 0.15 Gt for the South China Sea;and 0.015 ± 0.005 Gt for the Gulf of California. Sedimentsin the shelves of these three seas may neutralize excessCO2 in the later part of the next century when the shelfwaters become undersaturated with respect to calcite andaragonite. How much will be dissolved how quickly, how-ever, deserves further study.
Another emerging issue will be the large scale de-velopment of hydroelectric power in the Yangtze andMekong River Basins. Reduced freshwater outflow leadsto reduced buoyancy effect and upwelling. Consequentlythe nutrient supply and the productivity on the shelvesmay be reduced. Because of the growing human pertur-bation on the environment, however, the future coastalzone will become a stronger sink for atmospheric CO2.
AcknowledgementsThe ROC National Science Council supported the
preparation of this manuscript (NSC 92-2611-Z-110-005and 92-2611-M-110-014). H. Thomas and an anonymousreviewer provided very detailed and constructive com-ments. Revision of the manuscript was completed whileC-T A. Chen was a visiting research fellow (visiting pro-fessor) at the Hydrospheric Atmospheric Research Center,Nagoya University, Nagoya, Japan.
Appendix I: Relevant Research Programs in the NorthPacific Oceans
The CREAMS (Circulation Research of the EastAsian Marginal Seas) in the JES is being carried out byJapan, South Korea, Russia and USA from physical andchemical viewpoints. South Korea has a Material Fluxesin the East Sea program for the JES. China (Beijing), Ja-pan, South and North Korea, Russia and USA carried outpart of the UNEP-NOWPAP project (United Nations En-vironment Program-Northwest Pacific Action Plan) forprotection from pollution in the JES and the Yellow Sea.The Yellow Sea Environmental Conservation Programwas carried out between China (Beijing) and South Ko-rea. South Korea also has a COPEX (Coastal Ocean Proc-esses Experiment of the East China Sea) program. TheMASFLEX (Marginal Sea Flux Experiment) was carriedout by China (Beijing) and Japan, and the MFLECS (Mar-gin Flux in the East China Sea), MAFLECS (MarginalSea Flux Experiment in the West Pacific), and POFLECS(Key Processes of Ocean Fluxes in the East China Sea)
Roles of Continental Shelves and Marginal Seas in the Biogeochemical Cycles of the North Pacific Ocean 37
were undertaken by China (Beijing) in order to reveal thebio-element cycling in the ECS.
China (Taipei) has carried out the KEEP (KuroshioEdge Exchange Processes) project in order to reveal thephysical mechanisms that drive the water exchange be-tween the Kuroshio and the ECS shelf, and to estimatethe consequent fluxes of biogenic, geological and anthro-pogenic materials. China (Taipei) and Russia carried outthe KEEP-MASS (KEEP-Marginal Sea Studies) in theECS and the JES along the same lines. The SEATS (SouthEast Asian Time Series Study) program is China—(Taipei)’s contribution to the JGOFS time-series studiesand the SWEET program (Strait Watch on the Environ-ment and Ecosystem with Telemetry) studies the exchangebetween the East and South China Seas. The ASEAN-Australia Marine Science Project and the ASEAN-CanadaCooperative Program on Marine Science carried out re-search on marine pollution monitoring, regional oceandynamics and other environmental criteria in the SCS.The Thailand-Norway and the Thailand-Sweden coopera-tive studies monitored oceanographic conditions and nu-trient transport in the Gulf of Thailand.
Relevant data can be found at http://www.jodc.go.jp/JGPFS_DMO/as a contribution of NPSG.
Appendix II. AcronymsAOU: Apparent Oxygen UtilizationAS: Air-SeaCFC: Chloro-Fluoro-CarbonDIC: Dissolved Inorganic CarbonDIN: Dissolved Inorganic NitrogenDIP: Dissolved Inorganic PhosphorusDMS: Dimethyl sulfideDO: Dissolved OxygenDOC: Dissolved Organic CarbonDOP: Dissolved Organic PhosphorusECS: East China SeaENSO: El Niño-Southern OscillationIC: Inorganic CarbonIN: Inorganic NitrogenIP: Inorganic PhosphorusJES: Japan/East SeaJGOFS: Joint Global Ocean Flux StudyKIW: Kuroshio Intermediate WaterKSW: Kuroshio Surface WaterKTW: Kuroshio Tropical WaterLOICZ: Land-Ocean Interaction in the Coastal ZoneMSW: Mindoro Strait WaterNPI: North Pacific IndexNPIW: North Pacific Intermediate WaterNPSG: North Pacific Synthesis Group of JGOFSNTA: Normalized Titration AlkalinityNTCO2: Normalized Total CO2OC: Organic Carbon
OS: Okhotsk SeaOSIW: Okhotsk Sea Intermediate WaterPIC: Particulate Inorganic CarbonPIN: Particulate Inorganic NitrogenPIP: Particulate Inorganic PhosphorusPOC: Particulate Organic CarbonPON: Particulate Organic NitrogenPOP: Particulate Organic PhosphorusPP: Primary ProductivitySCS: South China SeaSCSW: South China Sea Surface WaterSEEP: Shelf Edge Exchanges ProcessesSS: Suspended SedimentsSSW: Shelf Surface WaterTA: Titration AlkalinityTCO2: Total CO2TSW: Taiwan Strait Water
ReferencesAlvarez-Borrego, S. (1983): Gulf of California. p. 427–448. In
Estuaries and Enclosed Seas, ed. by B. H. Ketchum,Elsevier, Amsterdam.
Alvarez-Borrego, S. and J. R. Lara-Lara (1991): The physicalenvironment and primary productivity of the Gulf of Cali-fornia. In The Gulf and Pennisular Provinces of theCalifornias, AAPG Memoir 47, 555–567.
Anderson, R. F., G. T. Rowe, P. F. Kemp, S. Trumbore and P. E.Biscaye (1994): Carbon budget for the mid-slope depocenterof the Middle Atlantic Bight. Deep-Sea Res., 41, 669–703.
Andreev, A. G. and M. Kusakabe (2001): Interdecadal variabil-ity in dissolved oxygen in the intermediate water layer ofthe Western Subarctic Gyre and Kuril Basin (Okhotsk Sea).Geophys. Res. Lett., 28, 2453–2456.
Andreev, A. G. and S. Watanabe (2002): Temporal changes indissolved oxygen of the intermediate water in the subarcticNorth Pacific. Geophys. Res. Lett., 29, 25.1–25.4.
Andreev, A. G., A. S. Bychkov and I. A. Zhabin (1999): ExcessCO2 penetration in the Okhotsk Sea. Extended abstract, 2ndInternational Symposium on CO2 in the Oceans, Tsukuba,Jan. 18–22, 1999, p. 21-05.
Andreev, A. G., M. Kusakabe, M. Honda, Y. Kumamoto and A.Murata (2002): The Okhotsk Sea impact on chemical pa-rameters in the Northwestern Pacific. Extended abstracts,Mirai Symposium, Tokyo, p. 73–74.
Aota, M. and M. Ishikawa (1991): Fresh water supply to theSea of Okhotsk and volume transport of Soya Warm Cur-rent. Bull. Hokkaido Natl. Fish. Res. Inst., 55, 95–99.
Aranami, K., S. Watanabe, S. Tsunogai, A. Ohki, K. Miura andH. Kojima (2002): Chemical assessment of oceanic and ter-restrial sulfur in the marine boundary layer over the North-ern North Pacific during summer. J. Atm. Chem., 41, 49–66.
Bakun, A. (1990): Global climate change and intensification ofcoastal ocean upwelling. Science, 247, 198–201.
Bauer, J. E. and E. R. M. Druffel (1998): Oceanmargins as asignificant source of organic matter of the deep ocean. Na-ture, 392, 482–485.

38 C.-T. A. Chen et al.
Bauer, J. E., E. R. M. Druffel, D. M. Wolgast and S. Griffin(2001): Sources and cycling of dissolved and particulateorganic radiocarbon in the northwest Atlantic continentalmargin. Global Biogeochem. Cycles, 15, 615–636.
Bethoux, J. P., B. Gentili and D. Tailliez (1998): Warming andfreshwater budget change in the Mediterranean since the1940s, their possible relation to the greenhouse effect.Geophys. Res. Lett., 25, 1023–1026.
Bezrukov, P. L. (1960): Donnye otlozeniya Ohotskogo morya.Trudy Instituta Okeanologii, 32, 15–95.
Biebow, N. and E. Hutten (1999): Cruise report KOMEX I andII: RV Professor Gagarinsky Cruise 22, Akademik M.A.Lavrentyev cruise 28, GEOMAR Rep., 82, 188 pp.
Biebow, N., T. Ludmann, B. Karp and R. Kulinich (2000):Cruise report KOMEX V and VI: RV Professor GagarinskyCruise 26, Marshal Gelovany cruise 1, GEOMAR Rep., 88,296 pp.
Biondi, F., A. Gershunov and D. R. Cayan (2001): North Pa-cific Decadal Climate Variability since 1961. J. Climate,14, 5–10.
Biscaye, P. E., C. N. Flagg and P. G. Falkowski (1994): TheShelf Edge Exchange Processes experiment, SEEP-II: Anintroduction to hypotheses, results and conclusions. Deep-Sea Res., 41, 231–252.
Blanke, B., S. Speich, G. Madec and R. Maugé (2002): A glo-bal diagnostic of interior ocean ventilation. Geophys. Res.Lett., 29, 10.1029/2001GL013727.
Broecker, W. S., W. C. Patzert, J. R. Toggweiler and M. Stuiver(1986): Hydrography, chemistry and radioisotopes in thesouth-east Asian basins. J. Geophys. Res., 91, 14345–14354.
Bruevich, S. V. (1956): Khimii osadkov Ohotskogo morya.Trudy Instituta Okeanologii, 18, 41–132.
Chao, S. Y., P. T. Shaw and S. Y. Wu (1996a): Deep water ven-tilation in the South China Sea. Deep-Sea Res. I, 43, 445–466.
Chao, S. Y., P. T. Shaw and S. Y. Wu (1996b): El Niño modula-tion of the South China Sea circulation. Prog. Oceanogr.,38, 51–93.
Chen, C. T. A. (1990): Rates of calcium carbonate dissolutionand organic carbon decomposition in the North PacificOcean. J. Oceanogr. Soc. Japan, 46, 201–210.
Chen, C. T. A. (1993a): Carbonate chemistry of the wintertimeBering Sea marginal ice zone. Cont. Shelf Res., 13, 67–87.
Chen, C. T. A. (1993b): The oceanic anthropogenic CO2 sink.Chemosphere, 27, 1041–1064.
Chen, C. T. A. (1996): The Kuroshio Intermediate Water is themajor source of nutrients on the East China Sea continentalshelf. Oceanologica Acta, 1, 523–527.
Chen, C. T. A. (2000): The Three Gorges Dam: reducing theupwelling and thus productivity of the East China Sea.Geophys. Res. Lett., 27, 381–383.
Chen, C. T. A. (2002a): Shelf vs. dissolution generated alkalin-ity above the chemical lysocline in the North Pacific. Deep-Sea Res. II, 49, 5365–5375.
Chen, C. T. A. (2002b): The impact of dams on fisheries: Caseof the Three Gorges Dam, Chapter 16. p. 97–99. In Chal-lenges of a Changing Earth, ed. by W. Steffen, J. Jager, D.J. Carson and C. Bradshaw, Springer, Berlin.
Chen, C. T. A. (2003a): New vs. export production on the con-
tinental shelf. Deep-Sea Res. II, 50, 1327–1333.Chen, C. T. A. (2003b): Exchanges of carbon in the coastal seas.
In The Global Carbn Cycle: Integrating Humans, Climate,and the Natural World, ed. by C. B. Field and M. R.Raupach, Island Press (in press).
Chen, C. T. and E. T. Drake (1986): Carbon dioxide increase inthe atmosphere and oceans and possible effects on climate.Ann. Rev. Earth Planet. Sci., 14, 201–235.
Chen, C. T. A. and M. H. Huang (1995): Carbonate chemistryand the anthropogenic CO2 in the South China Sea. ActaOceanolog. Sin., 14, 47–57.
Chen, C. T. A. and M. H. Huang (1996): A mid-depth frontseparating the South China Sea water and the west Philip-pine Sea water. J. Oceanogr., 52, 17–25.
Chen, C. T. A. and S. Tsunogai (1998): Carbon and nutrients inthe ocean. p. 271–307. In Asia Change in the Context ofGlobal Climate Change, ed. by J. N. Galloway and J. M.Melillo, Cambridge Univ. Press.
Chen, C. T. A. and S. L. Wang (1998): The intermediate waterin the western Okinawa Trough is influenced by the out-flow from the South China Sea. J. Geophys. Res., 103,12683–12688.
Chen, C. T. A. and S. L. Wang (1999): Carbon, alkalinity andnutrient budget on the East China Sea Continental Shelf. J.Geophys. Res., 104, 20675–20686.
Chen, C. T. A. and J. K. Wann (1998): Flux of metals in GreatGhost Lake in Taiwan in the past 2600 years. J. Lake Sci.,10, Suppl., 315–329.
Chen, C. T. A. and C. J. Wu (1991): The anthropogenic CO2signals in the Red Sea and northwest Indian Ocean.Oceanogr. and Limnol., 22, 434–442 (in Chinese with Eng-lish abstract).
Chen, C. T., R. M. Pytkowicz and E. J. Olson (1982): Evalua-tion of the calcium problem in the South Pacific. Geochem.J., 16, 1–10.
Chen, C. T. A., P. Holligan, H. S. Hong, K. Iseki, S.Krishnaswami, R. Wollast and J. Yoder (1994): Land-oceaninteractions in the coastal zone, JGOFS Report No. 15,SCOR, 20 pp.
Chen, C. T. A., S. L. Wang and A. S. Bychkov (1995a): Car-bonate chemistry of the Sea of Japan. J. Geophys. Res., 100,13737–13745.
Chen, C. T. A., R. Ruo, S. C. Pai, C. T. Liu and G. T. F. Wong(1995b): Exchange of water masses between the East ChinaSea and the Kuroshio off northeastern Taiwan. Cont. ShelfRes., 15, 19–39.
Chen, C. T. A., G. C. Gong, S. L. Wang and A. S. Bychkov(1996a): Redfield ratios and regeneration rates of particulatematter in the Sea of Japan as a model of closed system.Geophys. Res. Lett., 23, 1785–1788.
Chen, C. T. A., C. M. Lin, B. T. Huang and L. F. Chang (1996b):The stoichiometry of carbon, hydrogen, nitrogen, sulfur andoxygen in particular matter of the Western North Pacificmarginal seas. Mar. Chem., 54, 179–190.
Chen, C. T. A., A. S. Bychkov, S. L. Wang and G. Y. Pavlova(1999): An anoxia Sea of Japan by the year 2200? Mar.Chem., 67, 249–265.
Chen, C. T. A., S. L. Wang, B. J. Wang and S. C. Pai (2001):Nutrient budgets for the South China Sea basin. Mar. Chem.,

Roles of Continental Shelves and Marginal Seas in the Biogeochemical Cycles of the North Pacific Ocean 39
75, 281–300.Chen, C. T. A., K. K. Liu and R. MacDonald (2003a): Conti-
nental margin exchanges. p. 53–97. In Ocean Biogeochem-istry: A JGOFS Synthesis, ed. by M. J. R. Fasham, Springer.
Chen, C. T. A., C. T. Liu, W. S. Chuang, Y. C. Yang, F. K. Shiah,T. Y. Tang and S. W. Chung (2003b): Enhanced buoyancyand hence upwelling of subsurface Kuroshio waters after atyphoon in the southern East China Sea. J. Mar. Sys., 42,65–79.
Chiba, S. and T. Saino (2002): Interdecadal change in the up-per water column environment and spring diatom commu-nity structure in the Japan Sea: an early summer hypoth-esis. Mar. Eco. Prog. Series, 231, 23–35.
Church, T. M., J. R. Scudlark and K. M. Conko (1998): Trans-mission of atmospherically deposited trace elements throughan undeveloped, forested Maryland watershed. Report sub-mitted to the Chesapeake Bay Research and MonitoringDivision of the Maryland Department of Natural Resources,87 pp.
Codispoti, L. A., G. E. Friederich and D. W. Hood (1986): Vari-ability in the inorganic carbon system over the southeast-ern Bering Sea shelf during spring 1980 and spring-sum-mer 1981. Deep-Sea Res., 5, 133–160.
Dai, A. and K. E. Trenberth (2002): Estimates of freshwaterdischarge from continents: Latitudinal and seasonal varia-tions. J. Hydrometeorol., 3, 660–687.
de Haas, H. (1997): Transport, preservation and accumulationof organic carbon in the North Sea. Dissertation, Univ.Utrecht, 149 pp.
de Haas, H., W. D. Boer and T. C. E. van Weering (1997): Re-cent sedimentation and organic carbon burial in a shelf sea:the North Sea. Mar. Geol., 144, 131–146.
de Haas, H., T. C. E. van Weering and H. de Stigter (2002):Organic carbon in shelf seas: sinks or sources, processesand products. Cont. Shelf Res., 22, 691–717.
Devol, A. H. (1991): Direct measurement of nitrogen gas fluxesfrom continental shelf sediments. Nature, 349, 319–321.
Devol, A. H. and J. P. Christensen (1993): Benthic fluxes andnitrogen cycling in sediments of the continental margin ofthe eastern North Pacific. J. Mar. Res., 51, 345–372.
Eittreim, S. L., J. P. Xu, M. Noble and B. D. Edwards (2002):Towards a sediment budget for the Santa Cruz shelf. Mar.Geol., 181, 235–248.
Feely, R. A. and C. T. Chen (1982): The effect of excess CO2on the calculated calcite and aragonite saturation horizonsin the northeast Pacific. Geophys. Res. Lett., 9, 1294–1297.
Frankignoulle, M. and A. V. Borges (2001): European conti-nental shelf as a significant sink for atmospheric carbondioxide. Global Biogeochem. Cycles, 15, 569–576.
Freeland, H. J. (1990): Sea surface temperatures along the coastof British Columbia: regional evidence for a warming trend.Can. J. Fish. Aquat. Sci., 47, 346–350.
Freeland, H., K. Denman, C. S. Wong, F. Whitney and R.Jacques (1997): Evidence of change in the winter mixedlayer in the Northeast Pacific Ocean. Deep-Sea Res., 44,2117–2129.
Friederich, G. E., P. M. Walz, M. G. Burczynski and F. P. Chavez(2002): Inorganic carbon in the central California upwellingsystem during the 1997–1999 El Niño-La Niña event. Prog.
Oceanogr., 54, 185–203.Frische, A. and D. Quadfasel (1990): Hydrography of the Sulu
Sea. p. 101–104. In Proceedings of the Ocean Drilling Pro-gram, Initial Reports, Vol. 124, ed. by C. Rangin, E. Silver,M. T. Von Breymann et al.
Galloway, J. N., W. H. Schlesinger, H. Levy, II, A. Michaelsand J. L. Schnoor (1995): Nitrogen fixation: Anthropogenicenhancement-environmental response. Global Biogeochem.Cycles, 9, 235–252.
Galloway, J. N., R. W. Howarth, A. F. Michaels, S. W. Nixon,J. M. Prospero and F. J. Dentener (1996): Nitrogen and phos-phorus budgets of the North Atlantic Ocean and its water-shed. Biogeochem., 35, 3–25.
Gamo, T. (1999): Global warming may have slowed down thedeep conveyor belt of a marginal sea of the northwesternPacific: Japan Sea. Geophys. Res. Lett., 26, 3137–3140.
Gamo, T. and Y. Horibe (1983): Abyssal circulation in the Ja-pan Sea. J. Oceanogr. Soc. Japan, 39, 220–230.
Gamo, T., Y. Nozaki, H. Sakai, T. Nakai and H. Tsubota (1986):Spatial and temporal variations of water characteristics inthe Japan Sea bottom layer. J. Mar. Res., 44, 781–793.
Gamo, T., Y. Kato and H. Hasumoto (1997): Comparative studyon chemical characteristics of deep waters of tropical mar-ginal seas: Sulu Sea, Andman Sea and South China Sea.Preliminary Report of the Hakuho Maru Cruise KH-96-5(Piscis Austrinus Expedition), Ocean Research Institute,University of Tokyo, 149 pp.
Gattuso, J.-P., M. Frankignoulle and R. Wollast (1998): Car-bon and carbonate metabolism in coastal aquatic ecosys-tems. Annu. Rev. Ecol. Syst., 29, 405–434.
Gladyshev, S. V. (1997): Salt, ice and dense water productionin the north Okhotsk Sea coastal polynyas in winter 1995–1996. North Pacific Marine Science Organization (PICES)Sixth Annual Meeting, Pusan, Korea, 14–26 October, 1997,Abstracts p. 14.
Gordon, D. C., Jr., P. R. Boudreau, K. H. Mann, J. E. Ong, W.L. Silvert, S. V. Smith, G. Wattayakorn, F. Wulff and T.Yanagi (1996): LOICZ Biogeochemical Modelling Guide-lines. LOICZ Report and Studies, No. 5, 96 pp.
Gruber, N. and J. L. Sarmiento (1997): Global patterns of ma-rine nitrogen fixation and denitrification. Global Biochem.Cycle, 11, 235–266.
Gu, H. K. (ed.) (1991): Marine Chemistry of the Bohai Sea,The Yellow Sea and the East China Sea, Science Press,Beijing, 500 pp.
Hahm, D. and K.-R. Kim (2001): An estimation of the new pro-duction in the southern East Sea using helium isotopes. J.Kor. Soc. Oceanogr., 36, 19–26.
Hartnett, H. E. and A. H. Devol (2003): Role of a strong oxy-gen-deficient zone in the preservation and degradation oforganic matter: A carbon budget for the continental mar-gins of northwest Mexico and Washington State. Geochim.Cosmochim. Acta, 67, 247–264.
Hedges, J. I. and R. G. Keil (1995): Sedimentary organic pres-ervation: an assessment and speculative synthesis. Mar.Chem., 49, 81–115.
Hedges, J. I., J. A. Baldock, Y. Gelinas, C. Lee, M. L. Petersonand S. G. Wakeham (2002): The biochemical and elemen-tal compositions of marine plankton: A NMR perspective.
40 C.-T. A. Chen et al.
Mar. Chem., 78, 47–63.Hernes, P. J. and R. Benner (2002): Transport and diagenesis
of dissolved and particulate terrigenous organic matter inthe North Pacific Ocean. Deep-Sea Res. I, 49, 2119–2132.
Hildalgo-Gonzalez, R. M., S. Alvarez-Borrego and A. Zirino(1997): Mixing in the region of the Midrift Islands of theGulf of California: effect on surface pCO2. Ciencias Mari-nas, 23, 317–327.
Hill, A. E., B. M. Hickey, F. A. Shillington, P. T. Strub, Strub,K. H. Bringk, E. D. Barton and A. C. Thomas (1998): East-ern Ocean Boundaries. p. 29–67. In The Sea, VII, ed. by A.R. Robinson and K. H. Brink, Wiley.
Hill, J. K. and P. A. Wheeler (2002): Organic carbon and nitro-gen in he northern California current system: comparisonof offshore, river plume, and coastally upwelled waters.Prog. Oceanogr., 53, 369–387.
Hill, K. L., A. L. Weaver, H. J. Freeland and A. Bychkov (2003):Evidence of change in the Sea of Okhotsk: Implications forthe North Pacific. Atmosphere-Ocean, 41, 49–63.
Honda, M. C., M. Kusakabe, S. Nakabayashi and M. Katagiri(2000): Radiocarbon of sediment trap samples from theOkinawa trough: lateral transport of 14C-poor sediment fromthe continental slope. Mar. Chem., 68, 213–247.
Hong, G. H. and C. T. A. Chen (2002): Aragonitic pteropodflux to the interior of the East Sea (Japan Sea). Terr. Atmos.and Oceanic Sci., 13, 205–210.
Hong, G. H., S. H. Kim, C. S. Chung and S. J. Pae (1995): Therole of the anthropogenic nutrient input in the carbon fixa-tion of the coastal ocean Yellow Sea: A preliminary study.p. 13–22. In Direct Disposal of Carbon Dioxide, ed. by N.Handa and T. Ohsumi, Terra Publishing Company, Tokyo.
Hu, D., Y. Saito and S. Kempe (1998): Sediment and nutrienttransport to the coastal zone. p. 245–270. In Asian Changein the Context of Global Climate Change: Impact of Natu-ral and Anthropogenic Changes in Asia on GlobalBiogeochemical Cycles, ed. by J. N. Galloway and J. M.Melillo, IGBP Book Series, Cambridge University Press,Cambridge.
IGBP (1994): Land-ocean interactions in the coastal zone, im-plementation plan. Global Change Report, 33, 215 pp.
Jahnke, R. A., C. E. Reimers and D B. Craven (1990): Intensi-fication of recycling of organic matter at the sea floor nearocean margins. Nature, 348, 50–54.
JGOFS (1997): Report of the JGOFS/LOICZ Workshop on non-conservative fluxes in the continental margins. JGOFS Re-port No. 25, 25 pp.
Jickells, T. D., T. H. Blackburn, C. S. Martens, J. O. Blanton,A. Moll, D. Eisma, R. Scharek, S. W. Fowler, Y. Suzuki, R.F. C. Mantoura and D. Vaulot (1991): Group report: whatdetermines the fate of materials within ocean margins?p. 211–234. In Ocean Margin Processes in Global Change,ed. by R. F. C. Mantoura, J. M. Martin and R. Wollast, JohnWiley & Sons.
Kang, D.-J. (1999): A study on the carbon cycle in the EastSea. Ph.D. Thesis, Seoul National Univ., 159 pp.
Kang, D.-J. and K.-R. Kim (2003): Preliminary results on thecarbon cycle in the East Sea. J. Korean Soc. Oceanogr. (sub-mitted).
Kang, D. J., M. K. Park and K. R. Kim (2001): Application of
AMS Radiocarbon in earth system science studies. J. Ko-rean Phys. Soc., 39, 755–761.
Kang, D.-J., S. Park, Y.-G. Kim, K. Kim and K.-R. Kim (2003):A moving-boundary box model (MBBM) for oceans inchange: An application to the East/Japan Sea. Geophys. Res.Lett., 30, No. 6, 1299, doi:10.1029/2002GL016486.
Kemp, A. E. S. (1995): Laminated sediments from coastal andopen ocean upwelling zones: what variability do theyrecord? p. 239–257. In Upwelling in the Ocean: ModernProcesses and Ancient Records, ed. by C. P. Summerhayes,K. C. Emeis, M. V. Angel, R. L. Smith and B. Zeitzschel,Wiley.
Kempe, S. (1995): Coastal seas: a net source or sink of atmos-pheric carbon dioxide? LOICZ Report and Studies, No. 1,27 pp.
Kim, K., K.-R. Kim, D. H. Min, Y. Volkov, J.-H. Yoon and M.Takematsu (2001): Warming and structural changes in theEast (Japan) Sea: A clue to future changes in global oceans?Geophys. Res. Lett., 28, 3293–3296.
Kim, K.-R. and K. Kim (1996): What is Happening in the EastSea (Japan Sea)?: Recent Chemical Observations duringCREAMS 93–96. J. Korean Soc. Oceanogr., 31, 164–172.
Kim, K.-R., K. Kim, D.-J. Kang, S.-Y. Park, M.-K. Park, Y.-G.Kim, H.-S. Min and D. Min (1999): The East Sea (JapanSea) in change: A story of dissolved oxygen. MTS Journal,33, 15–22.
Kim, K.-R., G. Kim, K. Kim, V. Lobanov, V. Ponomarev andA. Salyuk (2002a): A sudden bottom-water formation dur-ing the severe winter 2000–2001: The case of the East/Ja-pan Sea. Geophys. Res. Lett., 29, 10.1029/2001GL014498.
Kim, K.-R., K. Kim, D.-J. Kang, Y. N. Volkov, J.-H. Toon andM. Takematsu (2002b): The changes in the East/Japan Seafound by CREAMS. Oceanogr. in Japan, 11, 419–429 (inJapanese with an English abstract).
Kitani, K. (1973): An oceanographic study of the Okhotsk Sea:Particularly in regard to cold waters. Bull. Far Sea Fish.Res. Lab., 9, 45–77.
Koike, I. (1993): Microorganisms. p. 102–117. In Tokyo Bay:Its Environmental Change for Recent 100 Years, ed. by N.Ogura, Kouseisha Kouseikaku Press, Tokyo (in Japanese).
Konovalov, S. K. and J. W. Murray (2001): Variations in thechemistry of the Black Sea on a time scale of decades (1960–1995). J. Mar. Sys., 31, 217–243.
Kudela, R. M. and F. P. Chavez (2002): Multi-Platform remotesensing of new production in central California during the1997–1998 El Niño. Prog. Oceanogr., 54, 233–249.
Lin, S. L., I.-J. Hsieh, K. M. Huang and C. H. Wang (2002a):Influence of the Yangtze River and grain size on the spatialvariations of heavy metals and organic carbon in the EastChina Sea continental shelf sediments. Chem. Geol., 182,377–394.
Lin, S. L., K. M. Huang and S. K. Chen (2002b): Sulfate reduc-tion and iron sulfide mineral formation in the southern EastChina Sea continental slope sediment. Deep-Sea Res. I, 49,1837–1852.
Liu, K. K., K. Iseki and S.-Y. Chao (2000a): Continental mar-gin carbon fluxes. p. 187–239. In The Changing OceanCarbon Cycle: A Midterm Synthesis of the Joint GlobalOcean Flux Study, ed. by R. B. Hanson, H. W. Ducklow
Roles of Continental Shelves and Marginal Seas in the Biogeochemical Cycles of the North Pacific Ocean 41
and J. G. Field, International Geosphere-Biosphere Pro-gramme Book Series, Cambridge University Press, Cam-bridge.
Liu, K. K., L. Atkinsion, C. T. A. Chen, S. Gao, J. Hall, R. W.MacDonald, L. Talaue McManus and R. Quinones (2000b):Exploring continental margin carbon fluxes on a globalscale. EOS, 81, 641–642 plus 644.
Liu, K. K., S. Y. Chao, P. T. Shaw, G. C. Gong, C. C. Chen andT. Y. Tang (2002): Monsoon-forced chlorophyll distribu-tion and primary production in the South China Sea: obser-vations and a numerical study. Deep-Sea Res. I, 49, 1387–1412.
Loder, J. W., W. C. Boicourt and J. H. Simpson (1998): West-ern ocean boundary shelves, in the Sea, VII. p. 3–27. InThe Global Coastal Ocean, ed. by A. R. Robinson and K.H. Brink, Wiley & Sons.
LOICZ (1997): Report of the JGOFS/LOICZ workshop on non-conservative fluxes in the continental margins. LOICZ Meet-ing Report, 25, 25 pp.
Lou, J . Y., C. T. A. Chen and J. K. Wann (1997):Paleoclimatological records of the Great Ghost Lake in Tai-wan. Sci. in China, 40, 284–292.
Lyu, S. J. and K. Kim (2003): Absolute transport from the sealevel difference across the Korea Strait. Geophys. Res. Lett.,30, 18-1~4.
Ma, L. M., R. Qiao, B. Zhang, Z. Q. Huang and Y. H. Zhang(1999): Carbon dioxide in the East China Sea. p. 113–123.In Margin Flux in the East China Sea, ed. by D. X. Hu andS. Tsunogai, China Ocean Press, Beijing.
Mackas, D. L. and D. R. Yelland (1999): Horizontal flux ofnutrients and plankton across and along the British Colum-bia continental margin. Deep-Sea Res. II, 46, 2941–2967.
Mackenzie, F. T. and L. M. Ver (2001): Land-sea global trans-fers. p. 1443–1453. In Encyclopedia of Ocean Sciences, ed.by J. H. Steel, K. K. Turekian and S. A. Thrope, AcademicPress, New York.
Mackenzie, F. T., A. Lerman and L. M. B. Ver (1998): Role ofcontinental margin in the global carbon balance during thepast three centuries. Geol., 26, 423–426.
Mackenzie, F. T., A. Lerman and L. M. Ver (2001): Recent pastand future of the global carbon cycle. p. 51–82. In Geologi-cal Aspects of the Global Climate, ed. by L. Gerhard andW. Harrison, Am. Assoc. Pet. Geologists Special Publica-tion.
Mackenzie, F. T., L. M. Ver and A. Lerman (2002a): Century-scale nitrogen and phosphorus controls of the carbon cycle.Chem. Geol., 190, 13–32.
Mackenzie, F. T., L. M. Ver and A. Lerman (2002b): Coastal-zone biogeochemical dynamics under global warming. p.27–40. In Frontiers in Geochemistry: Organic, Solution,and Deposit Geochemistry, ed. by W. G. Ernst, KonradKrauskopf Volume 2, Bellwether Publishing Ltd.
Manabe, S. and R. J. Stouffer (1993): Century-scale effects ofincreased atmospheric CO2 on the ocean-atmospheric sys-tem. Nature, 364, 215–218.
Matear, R. J. and A. C. Hirst (1999): Climate change feedbackon the future oceanic CO2 uptake. Tellus, 51B, 722–733.
Matsumura, T., N. Horimoto, Y. Xu and T. Ishimaru (2001):Recent trends of nutrients in Tokyo Bay (1989–1998). La
mer, 39, 19–32.Matsumura, T., T. Ishimaru and T. Yanagi (2002): Nitrogen and
Phosphorus budgets in Tokyo Bay. Oceanogr. in Japan, 11,613–630.
Meybeck, M. (1993): Natural sources of C, N, P, and S. p. 163–93. In Interactions of C, N, P, and S Biogeochemical Cyclesand Global Change, ed. by R. Wollast, Springer-Verlag,Berlin.
Middelburg, J. J., K. Soetaert, D. M. J. Herman and C. H. R.Heip (1996): Denitrification in marine sediments: a modelstudy. Global Biogeochem. Cycles, 10, 661–673.
Milliman, J. D., C. Rutkowski and M. Meybeck (1995): Riverdischarge to the Sea: A Global River Index (GLORI). LOICZReports and Studies, No. 2.
Minagawa, M., M. Ohashi, T. Kuramoto and N. Noda (2001):N of PON and nitrate as a clue to the origin and transfor-mation of nitrogen in the subartic north Pacific and its mar-ginal sea. J. Oceanogr., 57, 285–300.
Miura, T., T. Suga and K. Hanawa (2002): Winter mixed layerand formation of dichothermal water in the Bering Sea. J.Oceanogr., 58, 815–823.
Moisan, J. R., E. E. Hofmann and D. B. Haidvogel (1996):Modelling nutrient and plankton processes in the Califor-nia coastal transition zone. J. Geophys. Res., 101, 22677–22691.
Murray, J. W., Z. Top and E. Ozsoy (1991): Hydrographic prop-erties and ventilation of the Black Sea. Deep-Sea Res., 38,S663–689.
Nakatsuka, T., C. Yoshikawa, M. Toda, K. Kawamura and M.Wakatsuchi (2002): An extremely turbid intermediate wa-ter in the Sea of Okhotsk: Implication for the transport ofparticulate organic matter in a seasonally ice-bound Sea.Geophys. Res. Lett . , 29 , No. 16, 10–13, 10.1029/2001GL014029.
Nakatsuka, T., M. Toda, K. Kawamura and M. Wakatsuchi(2003): Dissolved and particulate organic carbon in the Seaof Okhotsk: their transport from continental shelf to oceaninterior. J. Geophys. Res. (submitted).
Nedashkovsky, A. P. and V. V. Sapozhnikov (2001): Estimateof CO2 fluxes through the ocean-atmosphere boundary onthe basis of hydrochemical parameters measured in thewestern part of the Bering Sea. Oceanol., 41, 370–378 (inRussian with English abstract).
Nixon, S. W., J. W. Ammerman, L. P. Atkinson, V. M.Berounsky, G. Billen, W. C. Boicourt, W. R. Boynton, T.M. Church, D. M. Ditoro, R. Elmgren, J. H. Garber, A. E.Giblin, R. A. Jahnke, N. J. P. Owens, M. E. Q. Pilson and S.P. Seitzinger (1996): The fate of nitrogen and phosphorusat the land-sea margin of the North Atlantic Ocean.Biogeochem., 35, 141–180.
Nojiri, Y., T. Nojiri, T. Machida, G. Inoue and M. Fujinuma(1997): Meridional distribution and secular trend of atmos-pheric nitrous oxide concentration over the Western Pacific.p. 115–118. In Biogeochemical Processes in the North Pa-cific, ed. by S. Tsunogai, Japan Marine Science Founda-tion, Tokyo.
Noriki, S., M. Shimizu, K. Hamahara, H. Narita, T. Saino andT. Yanagi (1997): Transportation of particulate materialthrough the mouth of Tokyo Bay to the open ocean. J.

42 C.-T. A. Chen et al.
Oceanogr., 53, 571–577.Nozaki, Y., D. S. Alibo, H. Amakawa, T. Gamo and H. Hasumoto
(1999): Dissolved rare earth elements and hydrography inthe Sulu Sea. Geochim. Cosmochim. Acta, 63, 2171–2181.
Ogawa, H., T. Usui and I. Koike (2003): Distribution of dis-solved organic carbon in the East China Sea. Deep-Sea Res.II, 50, 353–366.
Ogi, M., Y. Tachibana, F. Nishio and M. Danchenkov (2001):Does the fresh water supply from the Amur River flowinginto the Okhotsk affect sea ice formation? J. Meteo. Soc.Japan, 79, 123–129.
Oguri, K., E. Matsumoto, M. Yamada, Y. Saito and K. Iseki(2003): Sediment accumulation rates and budgets of depos-iting particles of the East China Sea. Deep-Sea Res. II, 50,513–528.
Oh, D.-C., M.-K. Park, S.-H. Choi, D.-J. Kang, S. Y. Park, J. S.Hwang, A. Andreev, G. H. Hong and K.-R. Kim (1999):The air-sea exchange of CO2 in the East Sea (Japan Sea). J.Oceanogr., 55, 157–169.
Oh, D.-C., M. K. Park and K. R. Kim (2000): CO2 exchange atair-sea interface in the Huanghai sea. Acta Oceanolog. Sin.,19, 79–89.
Ono, T., K. Tadoroko, T. Midorikawa, J. Nishioka and T. Saino(2002): Multi-decadal decrease of net community produc-tion in western subarctic North Pacific. Geophys. Res. Lett.,10.1029/2001GLO14332.
Otsuki, A., S. Watanabe and S. Tsunogai (2003): Absorption ofatmospheric CO2 and its transport to the intermediate layerin the Okhotsk Sea. J. Oceanogr., 59, 709–717.
Peterson, B. J., R. M. Holmes, J. W. McClelland, C. J.Vorosmarty, R. B. Lammers, A. I. Shiklomanov, I. A.Shilomanov and S. Rahmstorf (2002): Increasing river dis-charge to the Arctic Ocean. Science, 298, 2171–2173.
Pilskaln, C. H., J. B. Paduan, F. P. Chavez, R. Y. Anderson andW. M. Berelson (1996): Carbon export and regeneration inthe coastal upwelling system of Monterey Bay, CentralCalifornia. J. Mar. Res., 54, 1149–1178.
Rabouille, C., F. T. Mackenzie and L. M. Ver (2001): Influenceof the human perturbation on carbon, nitrogen, and oxygenbiogeochemical cycles in the global coastal ocean. Geochim.Cosmochim. Acta, 65, 3615–3641.
Redfield, A. C., B. H. Ketchum and F. A. Richards (1963): Theinfluence of organisms on the composition of seawater. p.26–77. In The Sea, Vol. 2, ed. by M. N. Hill, Wiley, NewYork.
Reimers, C. E., R. A. Jahnke and D. C. McCorkle (1992): Car-bon fluxes and burial rates over the continental slope andrise off Central California with implications for the globalcarbon cycle. Global Biogeochem. Cycles, 6, 199–224.
Riser, S. C., G. I . Yurasov and M. J. Warner (1996):Hydrographic and tracer measurements of the water massstructure and transport in the Okhotsk Sea in early spring.PICES Sci. Rep., 6, 138–143.
Rogachev, K. A. (2000): Recent variability in the Pacific west-ern subartic boundary currents and Sea of Okhotsk. Prog.Oceanogr., 47, 299–336.
Rogachev, K. A., A. S. Bychkov, E. C. Carmack, P. YaTishchenko, A. P. Nedashkovsky and C. S. Wong (1997):Regional carbon dioxide distribution near Kashevarov Bank
(Sea of Okhotsk): Effect of tidal mixing. p. 52–69. In Con-tinental Shelf Research, ed. by S. Tsunogai, Japan MarineScience Foundation, Tokyo.
San Diego-McGlone, M. L., G. S. Jacinto, V. C. Dupra, I. S.Narcise, O. Padayao and I. B. Velasquez (1999): A com-parison of nutrient characteristics and primary productivityin the Sulu Sea and South China Sea. Acta Oceanogr. Tai-wan, 37, No. 3, 219–229.
Sarmiento, J. L., T. M. C. Hughes, R. S. Stouffer and S. Manabe(1998): Simulated response of the ocean carbon cycle toanthropogenic climate warming. Nature, 393, 245–249.
Seitzinger, S. P. (2000): Scaling up: Site-specific measurementsto global-scale estimates of denitrification. p. 211–240. InEstuarine Science, ed. by J. E. Hobbie, Island Press, Wash-ington, D.C.
Seitzinger, S. P., C. Kroeze and R. V. Styles (2000): Globaldistribution of N2O emissions from aquatic systems: natu-ral emissions and anthropogenic effects. Chemosph. Glo.Change Sci., 2, 267–279.
Sharma, S., L. A. Barrie, D. Plummer, J. C. McConnell, P. C.Brickell, M. Levasseur, M. Gosseliln and T. S. Bates (1999):Flux estimation of oceanic dimethyl sulfide around NorthAmerica. J. Geophys. Res., 104(D17), 21327–21342.
Shaw, P. T., S. Y. Chao, K. K. Liu, S. C. Pai and C. T. Liu (1996):Winter upwelling off Luzon in the north-eastern South ChinaSea. J. Geophys. Res., 101, 16435–16448.
Smith, S. V. and J. T. Hollibaugh (1993): Coastal metabolismand the oceanic carbon balance. Rev. Geophys., 31, 75–89.
Smith, S. V. and F. T. Mackenzie (1987): The ocean as a netheterotrophic system: Implications from the carbonbiogeochemical cycle. Global Biogeochem. Cycles, 1, 187–198.
Smith, S. V., D. P. Swaney, L. Talaue-McManus, J. D. Bartley,P. T. Sandhei, C. J. McLaughlin, V. C. Dupra, C. J.Crossland, R. W. Buddemeier, B. A. Maxwell and F. Wulff(2003): Humans, hydrology, and the distribution of inor-ganic nutrient loading to the ocean. BioScience, 53, 235–245.
Smoak, J. M., W. S. Moore, R. C. Thunell and T. J. Shaw (1999):Comparison of 234Th, 228Th, and 210Pb fluxes with fluxes ofmajor sediment components in the Guaymas Basin, Gulf ofCalifornia. Mar. Chem., 65, 177–194.
Takahashi, K. (1995): Opal particle flux in the subarctic Pa-cific and Bering Sea and sidocoenosis preservation hypoth-esis. Proceedings, 1994 Sapporo IGBP Symposium, 14–17Nov., 1994, Sapporo, p. 458–466.
Takahashi, K. (1999): The Okhotsk and Bering Sea: Criticalmarginal seas for the land-ocean linkage. In Land-Sea Linkin Asia, Proceedings of an International Workshop on Sedi-ment Transport and Storage in Coastal Sea-Open System,Tsukuba, Japan, March 15–19, 1999, p. 341–353.
Takahashi, K., N. Fujitani and M. Yanada (2002): Long termmonitoring of particle fluxes in the Bering Sea and the cen-tral subarctic Pacific Ocean, 1990–2000. Prog. Oceanogr.,55, 95–112.
Takizawa, T. (1982): Characteristics of the Soya Warm Currentin the Okhotsk Sea. J. Oceanogr. Soc. Japan, 38, 281–292.
Talley, L. D. (1996): North Pacific Intermediate Water Forma-tion and the Role of the Okhotsk Sea. PICES Sci. Rep., 6,

Roles of Continental Shelves and Marginal Seas in the Biogeochemical Cycles of the North Pacific Ocean 43
150–157.Talley, L. D. and Y. Nagata (eds.) (1995): The Okhotsk Sea and
Oyashio region. PICES Sci. Rep., 2, 227 pp.Tsunogai, S., M. Kusakabe, H. Iizumi, I. Koide and A. Hattori
(1979): Hydrographic features of the deep water of theBering Sea—the sea of silica. Deep-Sea Res., 26/6A, 641–659.
Tsunogai, S., S. Watanabe, M. Honda and T. Aramaki (1995):North Pacific Intermediate Water studied chiefly with ra-diocarbon. J. Oceanogr., 51, 519–536.
Tsunogai, S., S. Watanabe and T. Sato (1999): Is there a conti-nental shelf pump for the absorption of atmospheric CO2.Tellus, 51B, 701–712.
Tsunogai, S., K. Iseki, M. Kusakabe and Y. Saito (2003):Biogeochemical cycles in the East China Sea: MASFLEXprogram. Deep-Sea Res. II, 50, 321–326.
Tsurushima, N., S. Watanabe and S. Tsunogai (1996): Methanein the East China Seawater. J. Oceanogr., 52, 221–233.
Uda, M. (1934): The Results of simultaneous oceanographicinvestigations in the Japan Sea and its adjacent waters inMay and June, 1932. J. Imperial Fishery Experimental Sta-tions, 5, 57–190 (in Japanese).
Uzuka, N., S. Watanabe and S. Tsunogai (1997): DMS in theNorth Pacific and its adjacent seas. p. 127–135. InBiogeochemical Processes in the North Pacific, ed. by S.Tsunogai, Japan Mar. Sci. Found, Tokyo.
Vörösmarty, C. J., C. Li, J. Sun and Z. Dai (1998): Emergingimpacts of anthropogenic change on global river systems:The Chinese example. p. 210–244. In Asian Change in theContext of Global Change: Impacts of Natural and Anthro-pogenic Changes in Asia on Global Biogeochemical Cy-cles, ed. by J. Galloway and J. Melillo, Cambridge Univer-sity Press, Cambridge.
Wakatsuchi, M. and S. Martin (1991): Water circulation in theKuril Basin of the Okhotsk Sea and its relation to eddy for-mation. J. Oceanogr. Soc. Japan, 47, 152–168.
Walsh, J. J. (1988): On the Nature of Continental Shelves, SanDiego. Academic Press, London, 520 pp.
Walsh, J. J. (1989): Arctic carbon sinks: present and future.Global Biogeochem. Cycles, 3, 393–411.
Walsh, J. J. (1991): Importance of continental margins in themarine biogeochemical cycling of carbon and nitrogen.Nature, 350, 53–55.
Walsh, J. J. (1995): DOC storage in Arctic Seas: the role ofcontinental shelves. Coast. Estua. Stu., 49, 203–230.
Walsh, J. J. (1996): Nitrogen fixation within a tropical upwellingecosystem: Evidence for a Redfield budget of carbon/ni-trogen cycling by the total phytoplankton community. J.Geophys. Res., 101, 20607–20616.
Walsh, J. J. and D. A. Dieterle (1994): CO2 cycling in the coastalocean. I—A numerical analysis of the southeastern BeringSea with applications to the Chukchi Sea and the north Gulfof Mexico. Prog. Oceanogr., 34, 335–392.
Walsh, J. J. and C. P. McRoy (1986): Ecosystem analysis in thesoutheastern Bering Sea. Cont. Shelf Res., 5, 259–288.
Walsh, J. J., G. T. Rowe, R. C. Iverson and C. P. M. McRoy(1981): Biological export of shelf carbon is a sink of theglobal CO2 cycle. Nature, 291, 196–201.
Walsh, J. J., E. T. Premuzic, J. S. Gaffney, G. T. Rowe, G.
Harbottle, R. W. Stoenner, W. L. Balsam, P. R. Betzer andS. A. Macko (1985): Organic storage of CO2 on the conti-nental slope off the mid-Atlantic bight, the southeasternBering Sea and the Peru coast. Deep-Sea Res., 32, 853–883.
Walsh, J. J., C. P. McRoy, L. K. Coachman, L. K. Goering, J. J.Nihoul, J. J. Whitledge, T. E. Blackburn, T. H. Parker, P. L.Wirick, C. D. Shuert, P. G. Gremeir, J. M. Springer, A. M.Tripp, R. D. Hansell, D. A. Dienidi, S. Delersnijder, E.Henriksen, K. Lund, B. A. Andersen, P. F. E. Muller-Kargerand K. Dean (1990): Carbon and nitrogen cycling withinthe Bering/Chukchi Seas: Source regions for organic mat-ter effecting AOU demands of the Arctic Ocean. Prog.Oceanogr., 22, 277–359.
Walsh, J. J., D. A. Dieterle and J. R. Pribble (1991): Organicdebris on the continental margins: a simulation analysis ofsource and fate. Deep-Sea Res. I, 38, 805–828.
Warner, M. J. and G. I. Roden (1995): Chlorofluorocarbon evi-dence for recent ventilation of the deep Bering Sea. Na-ture, 373, 409–412.
Watanabe, S., N. Takei and S. Tsunogai (1997): Nitrous oxidein he coastal seas. p. 119–126. In Biogeochemical Proc-esses in the North Pacific, ed. by S. Tsunogai, Japan Ma-rine Science Foundation, Tokyo.
Watanabe, S., M. Wakita, K. Igarashi, S. Tsunogai and M.Wakatsuchi (2001): Spatial distribution of carbon dioxidefugacity in the Sea of Okhotsk. p. 102–103. In Proceedingsof the International Symposium on Atmosphere-Ocean-Cryosphere Interaction in the Sea of Okhotsk and the Sur-rounding Environment, ed. by M. Wakatsuchi and T. Hara,Inst. of Low Temp. Sci., Hokkaido Univ., Sapporo.
Watanabe, T. and M. Wakatsuchi (1998): Formation of 26.8–26.9 sigma-θ water in the Kuril Basin of the Sea of Okhotskas a possible origin of North Pacific Intermediate Water. J.Geophys. Res., 103, 2849–2865.
Watanabe, Y. W., S. Watanabe and S. Tsunogai (1991): Tritiumin the Japan Sea and the renewal time of the Japan Sea deepwater. Mar. Chem., 34, 97–108.
Watanabe, Y. W., T. Ono, A. Shimamoto, T. Sugimoto, M. Wakitaand S. Watanabe (2001): Probability of a reduction in theformation rate of the subsurface water in the North Pacificduring the 1980s and 1990s. Geophys. Res. Lett., 28, 3289–3292.
Wheeler, P. A., J. M. Watkins and R. L. Hansing (1997): Nutri-ents, organic carbon and organic nitrogen in the upper wa-ter column of the Arctic Ocean: implications for the sourcesof dissolved organic carbon. Deep-Sea Res. II, 44, 1571–1592.
Whitney, F. A. and D. W. Welch (2002): Impact of the 1997–1998 El Niño on nutrient supply in the Gulf of Alaska. Prog.Oceanogr., 54, 405–421.
Wiesner, M. G., L. Zheng and H. K. Wong (1996a): Fluxes ofpariculate matter in the South China Sea. p. 293–312. InParticle Flux in the Ocean, Scope 57, ed. by V. Ittekot,Chichester.
Wiesner, M. G., Y. Wang and L. Zheng (1996b): Fallout of vol-canic ash to the deep South China Sea induced by the 1991eruption of Mount Pinatubo (Philippines). Oceanogr. Lit.Rev., 43, p. 258.
44 C.-T. A. Chen et al.
Wollast, R. (1998): Evaluation and comparison of the globalcarbon cycle in the coastal zone and in the open ocean. p.213–252. In The Sea, Vol. 10, ed. by K. H. Brink and A. R.Robinson, Wiley & Sons.
Wong, C. S., R. J. Matear, H. J. Freeland, F. A. Whitney and A.S. Bychkov (1998): WOCE line P1W in the Sea of Okhotsk,2, CFC’s and the formation rate of intermediate water. J.Geophys. Res., 103, 15625–15642.
Wong, C. S., Z. Yu, N. A. D. Waser, F. A. Whitney and W. K.Johnson (2002): Seasonal changes in the distribution of dis-solved organic nitrogen in coastal and open-ocean watersin the North East Pacific: sources and sinks. Deep-Sea Res.II, 49, 5759–5773.
Wong, G. T. F. (2002): Nitrate anomaly in the upper nutriclinein the northern South China Sea—Evidence of nitrogen fixa-tion. Geophys. Res. Lett . , 29 , 2097, doi:10.1029/2002GL015796.
Wyrtki, K. (1961): Physical oceanography of the southeast Asianwaters. Scientific results of marine investigations of theSouth China Sea and the Gulf of Thailand, Scripps Institu-tion of Oceanography, La Jolla, California, NAGA Report,Vol. 2, 195 pp.
Yamamoto, M., N. Tanaka and S. Tsunogai (2001): OkhotskSea intermediate water formation deduced from oxygen iso-tope systematics. J. Geophys. Res., 106, 31075–31084.
Yamamoto, M., S. Watanabe, S. Tsunogai and M. Wakatsuchi(2002): Effects of sea ice formation and diapycnal mixingon the Okhotsk Sea intermediate water clarified with oxy-gen isotopes. Deep-Sea Res. I, 49, 1165–1174.
Yamamoto, M., S. Watanabe, S. Tsunogai and M. Wakatsuchi(2003): Chlorofluorocarbons in the Okhotsk Sea: ventila-tion of the intermediate water. J. Geophys. Res. (submit-ted).
Yanagi, T. (2002): Water, salt, phosphorus and nitrogen budg-ets of the Japan Sea. J. Oceanogr., 58, 797–804.
Yoshimura, T. and I. Kudo (2003): Riverine nutrient loadingsand their impact on primary production in Funka Bay, Ja-pan. Oceanogr. in Japan, 12, 185–193 (in Japanese withEnglish abstract).
Zhang, J. B. (1991): Marine Atlas of Bohai Sea, Yellow Sea,East China Sea. Marine Biology. China Ocean Press,Beijing, 250 pp. (in Chinese).
Zhang, S. L. and H. K. Gu (1994): Marine chemistry in north-ern seas of China. p. 157–170. In Oceanography of ChinaSeas, Vol. 1, ed. by D. Zhou, Y. B. Liang and C. K. Zeng,Kluwer Academic Publishers.
Zirino, A., J. M. Hernandez-Ayon, R. A. Fuhrmann, S. Alvarez-Borrego, G. Gaxiola-Castro, J. R. Lara-Lara and R. L.Bernstein (1997): Estimate of surface pCO2 in the Gulf ofCalifornia from underway pH measurements and satelliteimagery. Cien. Mar., 23, 1–22.