role osmotic potential gradients during water stress … · pronounced gradients in leaf osmotic...
TRANSCRIPT

Plant Physiol. (1983) 72, 931-9370032-0889/83/72/093 1/07/$00.50/0
Role of Osmotic Potential Gradients during Water Stress andLeaf Senescence in Fragaria virginiana'
Received for publication November 15, 1982 and in revised form April 8, 1983
SHARMAN D. O'NEILLSection of Plant Biology, Cornell University, Ithaca, New York 14853
ABSTRACT
The physiological basis underlying differences in sensitivity of differentaged leaves to water stress was investigated in Fragaria virginiana Du-chesne. Differential susceptibility of only older leaves to water stress inthe field during summer months appeared related to gradients in leafosmotic potential within the plant and by an age dependency in the abilityof leaves to adjust osmotically when challenged by periodic water deficits.Under greenhouse conditions, older leaves senesced invariably during animposed water stress while control leaves of comparable age and stressedyounger leaves remained green. Osmotic potentials of intermediate agedand younger leaves became approximately 1 to 2 bars lower after a singlecycle of imposed stress and up to 10 bars lower after two cycles of stress.Pronounced gradients in leaf osmotic potential within individual wholeplants were observed following two cycles of water stress that weresignificantly different from control values. Osmotic adjustment was de-pendent on leaf age with the greatest capacity for adjustment in theintermediate aged leaves. Loss of osmotic adjustment was rapid uponrewatering with a half-life of 4 days. An irreversible component of adjust-ment was observed, amounting to about 10% (or 2 bars) of the maximallyadjusted state. This irreversible component could be accounted for in partby significant changes in cell size and other anatomical alterations in theleaf that affect cellular osmotic volume, and, hence, cellular water relations.
Osmotic adjustment in response to water stress is considered animportant physiological mechanism enabling plants to toleratewater deficits (l). A leaf can increase its resistance to dehydrationthrough a reduction in cellular osmotic potential by a net accu-mulation ofcellular solutes (9). The key role ofosmotic adjustmentis in turgor maintenance during water deficits, which in turn isessential for maintenance ofturgor-related processes (3), especiallystomatal regulation. For any given leaf water potential, a leaf witha lower osmotic potential will have more turgor pressure to expendand can therefore withstand greater dehydration before a criticalloss of turgor occurs. Lower cellular osmotic potentials also con-serve cellular volume and maintain gradients of water potentialfavorable for water influx.
It is generally recognized that osmotic adjustment is importantfor leaf survival under stress conditions; however, its interactionwith leaf age and senescence has not been thoroughly investigated.Mechanisms which modify the internal water relations of a plantmay depend on plant age or developmental stage. The accelerationof leaf senescence by water stress has been reported for a numberof agronomic species including wheat (7), cotton (11), flax (14),and green panic (12). In most of these reports, only the physiolog-
'This research was supported in part by National Science FoundationGrant DEB 77-08432.
ically older leaves were affected permanently by the stress andbecame senescent. The specific mechanism by which water deficitscan bring about premature senescence of only the physiologicallyolder leaves is still unknown. An age dependency in the stressresponse is suggested.The goal of the current investigation has been to examine the
interaction between osmotic adjustment, leaf age, and senescence.This study of Fragaria virginiana Duchesne is the first whichspecifically examines the internal water relations on a leaf by leafbasis for the whole plant during an imposed water stress. Suchdetailed investigation permits the separation of stress-related fromdevelopmentally related differences between leaves on the sameplant. This has been accomplished by (a) examining the physio-logical basis underlying the differential sensitivity of old andyoung leaves to water stress, and by (b) determining the role ofosmotic adjustment in leaf survival.
MATERIALS AND METHODS
Plant Material. Field studies were performed on a wild popu-lation of Fragaria virginiana Duchesne. This plant was consideredto be an excellent model system for studying age-dependentprocesses because leaves are produced sequentially and are there-fore of different ages. Growth analysis throughout the growingseason allowed the ready determination of leaf order so thatsamples could be grouped according to leaf number representingleaves which were all of approximately the same age. Greenhouseexperiments were performed on potted plants which had beentransplanted from the field into 25.4-cm clay pots containing aclay-loam soil mix. Plants were allowed to grow in the greenhousefor 30 d prior to the beginning of experimental treatment. Duringthis time period, several leaves were produced. Leaves 1 and 2that had expanded in the field before transplanting were removedprior to experimental treatment.
Greenhouse Experimental Treatment. In the greenhouse, con-trol plants were watered twice daily and fertilized weekly withsoluble fertilizer (Peter's fertilizer, 15:10:15) at recommended ratesthroughout the course of the water stress experiments. Stressedplants received the same fertilizer treatment following rewateringand recovery of turgor. Water stress treatment was imposed bywithholding water for a period of 7 to 10 d. The development ofstress was monitored with midday measurements of stomataldiffusive resistance using a diffusion porometer (LiCor model LI-700). Stress was relieved by rewatering when severe leaf rollingand petiole wilting were observed in the leaves. These visualsymptoms of stress corresponded to high diffusive resistances andleaf 12 values as low as -25 bars in some leaves. For experimentsin which several cycles of water stress were imposed sequentially,
2 Abbreviations: I, water potential; 4,,, osmotic potential; 4'p, turgorpotential; WSD, water saturation deficit; FW, fresh weight; DW, dryweight; SLW, specific leaf weight.
931 www.plantphysiol.orgon June 6, 2018 - Published by Downloaded from Copyright © 1983 American Society of Plant Biologists. All rights reserved.
Plant Physiol. Vol. 72, 1983
plants were rewatered only once between cycles of imposed stress.Following rewatering after one, two, or three cycles, osmoticpotentials of the previously stressed leaves were determined. De-terminations of 4,, were made on all fully expanded and unfoldingleaves present on each of six separate plants for the control andwater-stressed groups. Several folded just emergent leafbuds werealso used for 41, determinations on selected plants. All 4,, deter-minations were made on fully hydrated leaves at predawn waterstatus (I close to -I bar). Leaf persistence and production weremonitored intermittently during the series of stress cycles.Water Potential Measurements. Predawn water potentials were
determined in the field on individual leaves from whole plantsusing a pressure chamber (Soilmoisture Equipment Corp., SantaBarbara, CA). Midday leaf I and diurnal leaf 'I measurementswere made on greenhouse plants using the same method. Tissuewater potential (I) and its component potentials (4,, and 4p) weredetermined by a pressure-volume method using the pressurechamber on fully hydrated leaves at predawn water status. Thismethodology for analysis of internal water relations was adoptedfrom Cutler et al. (5). Pressure-volume relations for individualstrawberry leaves permitted the determination of initial tissueosmotic potential (4',) and the relationship between the componentpotentials (4', and 4'p) and the WSD. The initial 4,, was determinedby extrapolation of the linear portion of the pressure-volume curveto the point of full hydration. Only regression lines with regressioncoefficients of0.990 or better were accepted. All osmotic potentialswere taken at similar predawn water potentials (usually less than-1 bar) of fully hydrated tissue. Acceptable regression values wereobtained routinely because the petiolar anatomy was such thataccurate balance pressures could be determined readily. Theturgor potential (4p) was calculated as the difference between themeasured I and the calculated 4,, values at each point on thepressure-volume curve. The volume of water expressed was deter-mined gravimetrically with an analytical balance.Other Measurements. LeafFW and DW were used to calculate
WSD for each point on the pressure-volume curve. WSD wascalculated as:
WSD = 1- V0- Vi )/v0
where Vo = FW(.turated) - DW and Vi = weight (volume) of sapexpressed for each individual sample for each paired measurementof tissue brought initially to full hydration (see Ref. 5). Leaf freshweight and dry weight were determined with an analytical balancebefore and after oven drying at 80°C for 8 h and at 60°C for 48h. Per cent leaf senescence was calculated as the cumulativepercentage of leaves yellowing and/or browning out of the totalleaf population, exclusive of new leaf production, at variousintervals.
Determinations of cell length and cell density were made onfresh epidermal strips of strawberry leaves (side leaflets from leaf7). Three replicate leaves of each leaf type or treatment wereexamined. Five fields were examined per leaf for cell density. Celllength was measured randomly for 50 cells/leaf. All measurementswere made with a calibrated optical micrometer at x 800 magni-fication. Leaf area was determined with a LiCor electronic leafarea meter. Differences in measurements between leaf types ortreatments were analyzed for significance with a t test (17).
RESULTS AND DISCUSSION
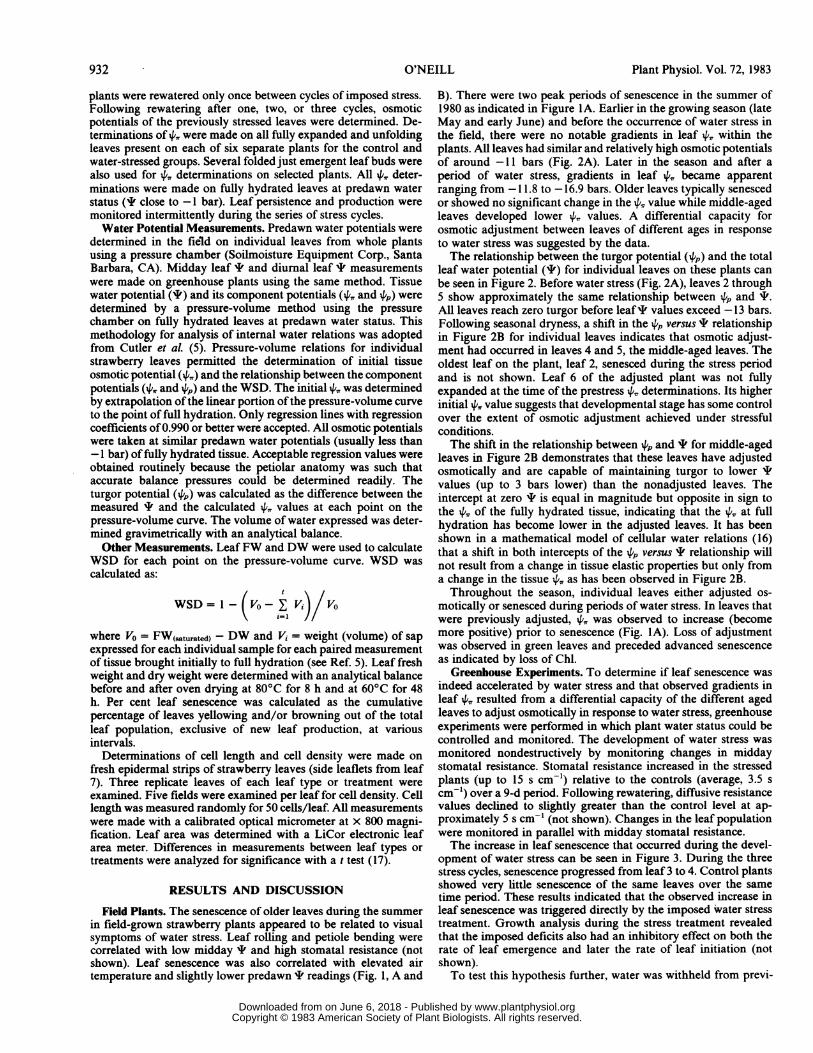
Field Plants. The senescence of older leaves during the summerin field-grown strawberry plants appeared to be related to visualsymptoms of water stress. Leaf rolling and petiole bending werecorrelated with low midday 'I and high stomatal resistance (notshown). Leaf senescence was also correlated with elevated airtemperature and slightly lower predawn I readings (Fig. 1, A and
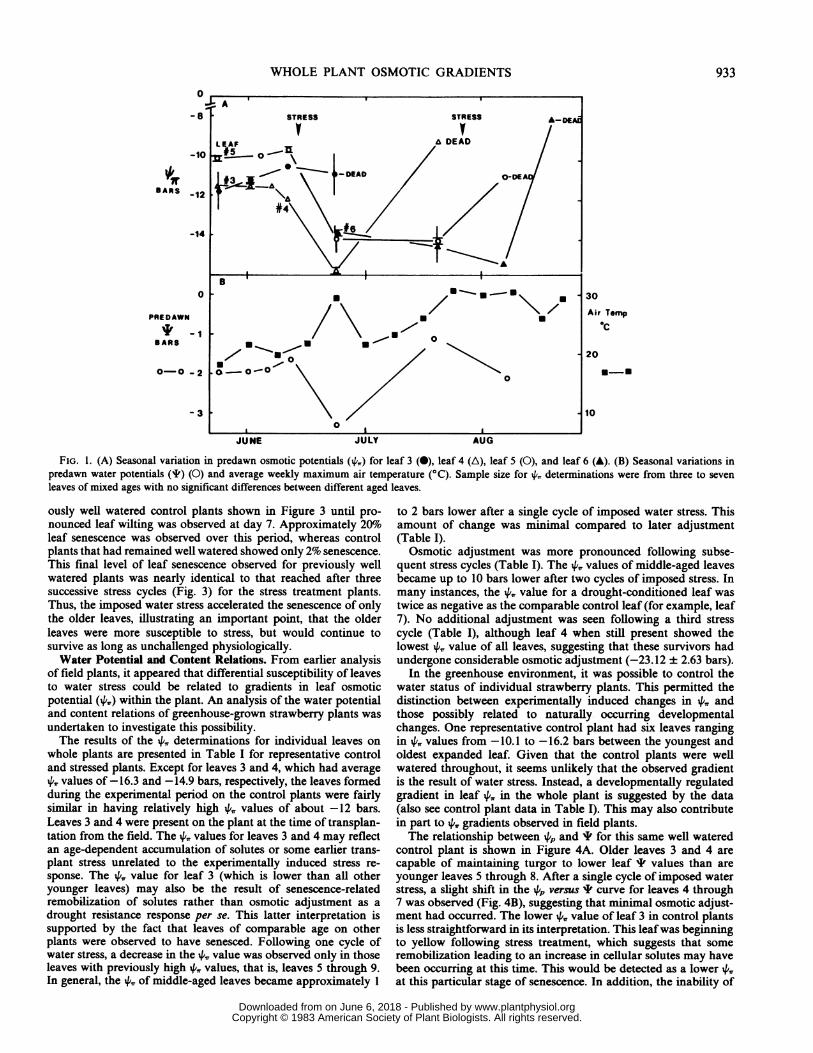
B). There were two peak periods of senescence in the summer of1980 as indicated in Figure IA. Earlier in the growing season (lateMay and early June) and before the occurrence of water stress inthe field, there were no notable gradients in leaf 4,, within theplants. All leaves had similar and relatively high osmotic potentialsof around -11 bars (Fig. 2A). Later in the season and after aperiod of water stress, gradients in leaf 4, became apparentranging from -1 1.8 to -16.9 bars. Older leaves typically senescedor showed no significant change in the 4, value while middle-agedleaves developed lower 4,, values. A differential capacity forosmotic adjustment between leaves of different ages in responseto water stress was suggested by the data.The relationship between the turgor potential (4p) and the total
leaf water potential (I) for individual leaves on these plants canbe seen in Figure 2. Before water stress (Fig. 2A), leaves 2 through5 show approximately the same relationship between 4p and I.All leaves reach zero turgor before leaf I values exceed -13 bars.Following seasonal dryness, a shift in the 4p versus I relationshipin Figure 2B for individual leaves indicates that osmotic adjust-ment had occurred in leaves 4 and 5, the middle-aged leaves. Theoldest leaf on the plant, leaf 2, senesced during the stress periodand is not shown. Leaf 6 of the adjusted plant was not fullyexpanded at the time of the prestress 4, determinations. Its higherinitial 4,, value suggests that developmental stage has some controlover the extent of osmotic adjustment achieved under stressfulconditions.The shift in the relationship between 4p and I for middle-aged
leaves in Figure 2B demonstrates that these leaves have adjustedosmotically and are capable of maintaining turgor to lower Ivalues (up to 3 bars lower) than the nonadjusted leaves. Theintercept at zero I is equal in magnitude but opposite in sign tothe 4, of the fully hydrated tissue, indicating that the 4,, at fullhydration has become lower in the adjusted leaves. It has beenshown in a mathematical model of cellular water relations (16)that a shift in both intercepts of the 4p versus I relationship willnot result from a change in tissue elastic properties but only froma change in the tissue ',, as has been observed in Figure 2B.Throughout the season, individual leaves either adjusted os-
motically or senesced during periods of water stress. In leaves thatwere previously adjusted, 4,, was observed to increase (becomemore positive) prior to senescence (Fig. IA). Loss of adjustmentwas observed in green leaves and preceded advanced senescenceas indicated by loss of Chl.
Greenhouse Experiments. To determine if leaf senescence wasindeed accelerated by water stress and that observed gradients inleaf 4,, resulted from a differential capacity of the different agedleaves to adjust osmotically in response to water stress, greenhouseexperiments were performed in which plant water status could becontrolled and monitored. The development of water stress wasmonitored nondestructively by monitoring changes in middaystomatal resistance. Stomatal resistance increased in the stressedplants (up to 15 s cm-1) relative to the controls (average, 3.5 scm-1) over a 9-d period. Following rewatering, diffusive resistancevalues declined to slightly greater than the control level at ap-proximately 5 s cm-' (not shown). Changes in the leaf populationwere monitored in parallel with midday stomatal resistance.The increase in leaf senescence that occurred during the devel-
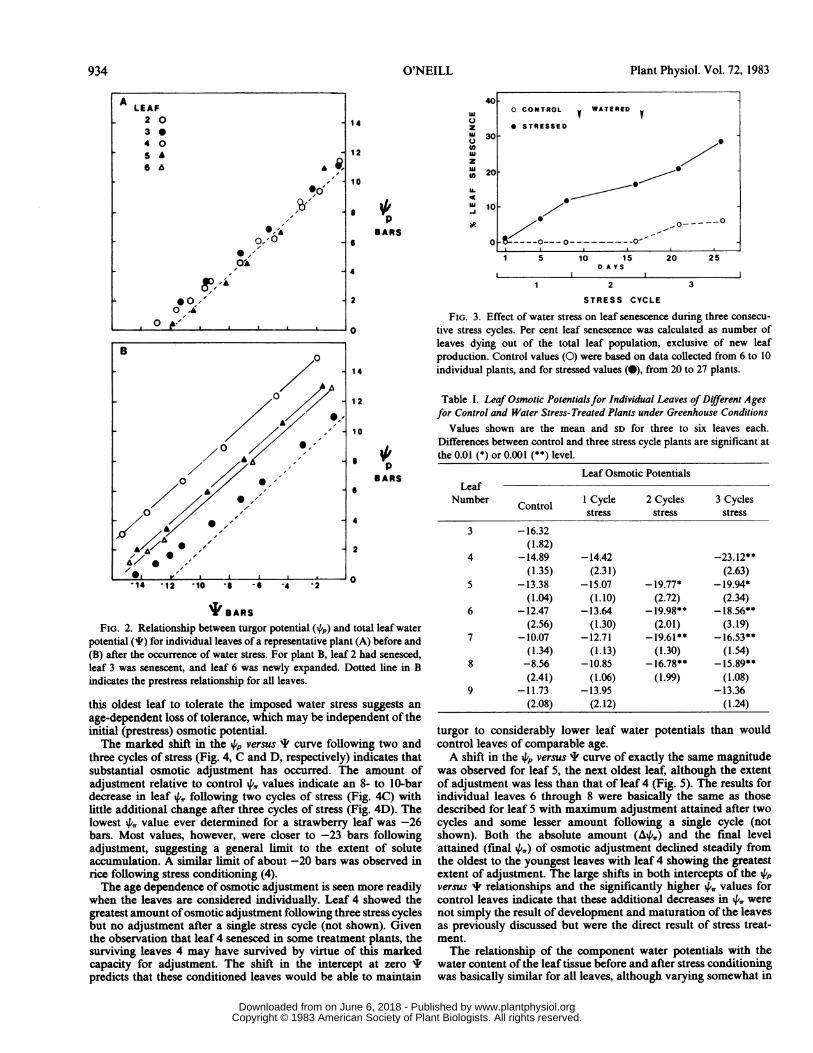
opment of water stress can be seen in Figure 3. During the threestress cycles, senescence progressed from leaf 3 to 4. Control plantsshowed very little senescence of the same leaves over the sametime period. These results indicated that the observed increase inleaf senescence was triggered directly by the imposed water stresstreatment. Growth analysis during the stress treatment revealedthat the imposed deficits also had an inhibitory effect on both therate of leaf emergence and later the rate of leaf initiation (notshown).To test this hypothesis further, water was withheld from previ-
932 O'NEILL
www.plantphysiol.orgon June 6, 2018 - Published by Downloaded from Copyright © 1983 American Society of Plant Biologists. All rights reserved.
WHOLE PLANT OSMOTIC GRADIENTS
0
-8
wtBARS _
PRE DAWN
BARS
0-0 -
30
Air Temp°C
20
*--
-3 \ / 10
JUNE JULY AUG
FIG. 1. (A) Seasonal variation in predawn osmotic potentials (',,) for leaf 3 (0), leaf 4 (A), leaf 5 (0), and leaf 6 (A). (B) Seasonal variations inpredawn water potentials (1) (0) and average weekly maximum air temperature (°C). Sample size for X, determinations were from three to sevenleaves of mixed ages with no significant differences between different aged leaves.
ously well watered control plants shown in Figure 3 until pro-nounced leaf wilting was observed at day 7. Approximately 20%oleaf senescence was observed over this period, whereas controlplants that had remained well watered showed only 2% senescence.This final level of leaf senescence observed for previously wellwatered plants was nearly identical to that reached after threesuccessive stress cycles (Fig. 3) for the stress treatment plants.Thus, the imposed water stress accelerated the senescence of onlythe older leaves, illustrating an important point, that the olderleaves were more susceptible to stress, but would continue tosurvive as long as unchallenged physiologically.Water Potential and Content Relations. From earlier analysis
of field plants, it appeared that differential susceptibility of leavesto water stress could be related to gradients in leaf osmoticpotential (4,,,) within the plant. An analysis of the water potentialand content relations of greenhouse-grown strawberry plants wasundertaken to investigate this possibility.The results of the 4,, determinations for individual leaves on
whole plants are presented in Table I for representative controland stressed plants. Except for leaves 3 and 4, which had average4,, values of -16.3 and -14.9 bars, respectively, the leaves formedduring the experimental period on the control plants were fairlysimilar in having relatively high 4,, values of about -12 bars.Leaves 3 and 4 were present on the plant at the time of transplan-tation from the field. The 4,,, values for leaves 3 and 4 may reflectan age-dependent accumulation of solutes or some earlier trans-plant stress unrelated to the experimentally induced stress re-sponse. The 4,,, value for leaf 3 (which is lower than all otheryounger leaves) may also be the result of senescence-relatedremobilization of solutes rather than osmotic adjustment as adrought resistance response per se. This latter interpretation issupported by the fact that leaves of comparable age on otherplants were observed to have senesced. Following one cycle ofwater stress, a decrease in the 4,, value was observed only in thoseleaves with previously high 4,,, values, that is, leaves 5 through 9.In general, the 4,, of middle-aged leaves became approximately 1
to 2 bars lower after a single cycle of imposed water stress. Thisamount of change was minimal compared to later adjustment(Table I).
Osmotic adjustment was more pronounced following subse-quent stress cycles (Table I). The 4,, values of middle-aged leavesbecame up to 10 bars lower after two cycles of imposed stress. Inmany instances, the 4,, value for a drought-conditioned leaf wastwice as negative as the comparable control leaf (for example, leaf7). No additional adjustment was seen following a third stresscycle (Table I), although leaf 4 when still present showed thelowest 4,, value of all leaves, suggesting that these survivors hadundergone considerable osmotic adjustment (-23.12 ± 2.63 bars).
In the greenhouse environment, it was possible to control thewater status of individual strawberry plants. This permitted thedistinction between experimentally induced changes in 4,, andthose possibly related to naturally occurring developmentalchanges. One representative control plant had six leaves rangingin 4,, values from -10.1 to -16.2 bars between the youngest andoldest expanded leaf. Given that the control plants were wellwatered throughout, it seems unlikely that the observed gradientis the result of water stress. Instead, a developmentally regulatedgradient in leaf 4,, in the whole plant is suggested by the data(also see control plant data in Table I). This may also contributein part to 4,,, gradients observed in field plants.The relationship between 4pp and I for this same well watered
control plant is shown in Figure 4A. Older leaves 3 and 4 arecapable of maintaining turgor to lower leaf I values than areyounger leaves 5 through 8. After a single cycle of imposed waterstress, a slight shift in the 4,p versus I curve for leaves 4 through7 was observed (Fig. 4B), suggesting that minimal osmotic adjust-ment had occurred. The lower 4,, value of leaf 3 in control plantsis less straightforward in its interpretation. This leafwas beginningto yellow following stress treatment, which suggests that someremobilization leading to an increase in cellular solutes may havebeen occurring at this time. This would be detected as a lower 4,,at this particular stage of senescence. In addition, the inability of
933
www.plantphysiol.orgon June 6, 2018 - Published by Downloaded from Copyright © 1983 American Society of Plant Biologists. All rights reserved.
Plant Physiol. Vol. 72, 1983
2
aI IO
14
12
10
pBARS
6
4
2
.
-14 -12 -10 -6 -6 '4 -2 -
* BARS
FIG. 2. Relationship between turgor potential (4p) and total leaf waterpotential (4I) for individual leaves of a representative plant (A) before and(B) after the occurrence of water stress. For plant B, leaf 2 had senesced,leaf 3 was senescent, and leaf 6 was newly expanded. Dotted line in Bindicates the prestress relationship for all leaves.
this oldest leaf to tolerate the imposed water stress suggests anage-dependent loss of tolerance, which may be independent of theinitial (prestress) osmotic potential.The marked shift in the ,p versus ' curve following two and
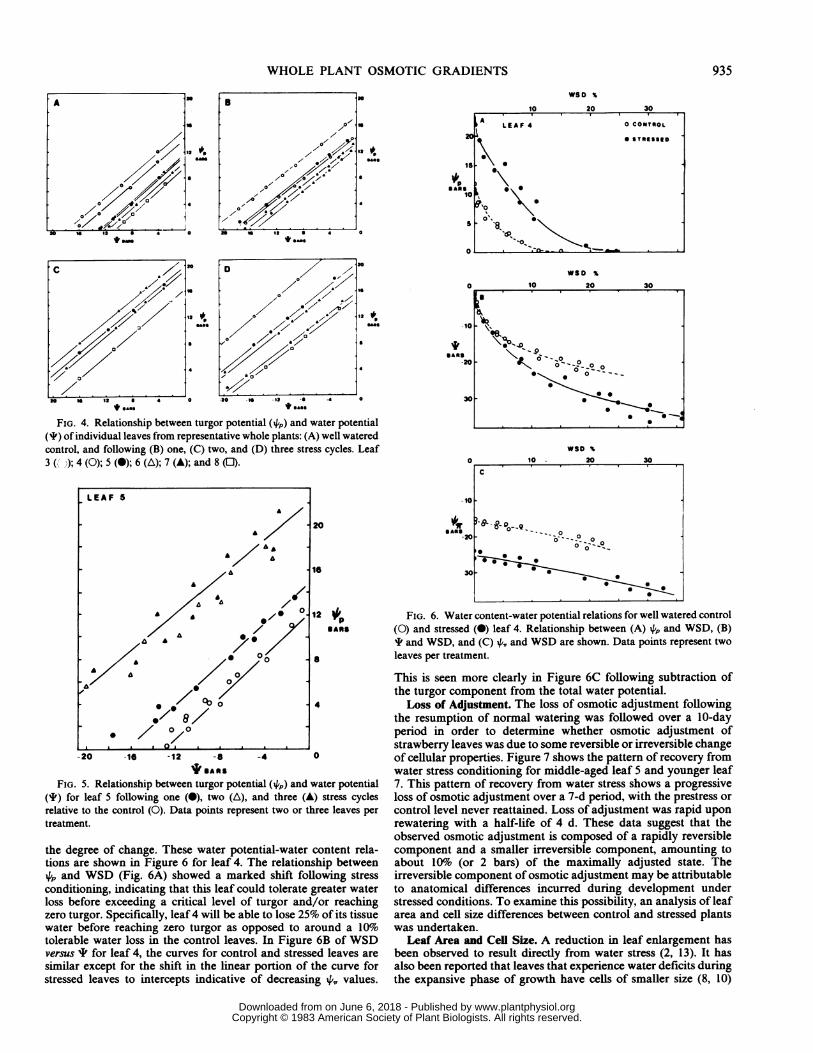
three cycles of stress (Fig. 4, C and D, respectively) indicates thatsubstantial osmotic adjustment has occurred. The amount ofadjustment relative to control P,, values indicate an 8- to 10-bardecrease in leaf 4,, following two cycles of stress (Fig. 4C) withlittle additional change after three cycles of stress (Fig. 4D). Thelowest 4',, value ever determined for a strawberry leaf was -26bars. Most values, however, were closer to -23 bars followingadjustment, suggesting a general limit to the extent of soluteaccumulation. A similar limit of about -20 bars was observed inrice following stress conditioning (4).The age dependence of osmotic adjustment is seen more readily
when the leaves are considered individually. Leaf 4 showed thegreatest amount ofosmotic adjustment following three stress cyclesbut no adjustment after a single stress cycle (not shown). Giventhe observation that leaf 4 senesced in some treatment plants, thesurviving leaves 4 may have survived by virtue of this markedcapacity for adjustment. The shift in the intercept at zero 'predicts that these conditioned leaves would be able to maintain
40
14
12
10
BARS6
J)zwC)0
zw
M.
-I
30~
20~
o
1 5 10 15 20 25D A YS
4
2 3
STRESS CYCLE
FIG. 3. Effect of water stress on leaf senescence during three consecu-tive stress cycles. Per cent leaf senescence was calculated as number ofleaves dying out of the total leaf population, exclusive of new leafproduction. Control values (0) were based on data collected from 6 to 10individual plants, and for stressed values (0), from 20 to 27 plants.
Table I. Leaf Osmotic Potentialsfor Individual Leaves of Different Agesfor Control and Water Stress-Treated Plants under Greenhouse Conditions
Values shown are the mean and SD for three to six leaves each.Differences between control and three stress cycle plants are significant atthe 0.01 (*) or 0.001 (**) level.
Leaf Osmotic PotentialsLeaf
Number Control I Cycle 2 Cycles 3 Cyclesstress stress stress
3 -16.32(1.82)
4 -14.89 -14.42 -23.12**(1.35) (2.31) (2.63)
5 -13.38 -15.07 - 19.77* - 19.94*(1.04) (1.10) (2.72) (2.34)
6 -12.47 -13.64 - 19.98** - 18.56**(2.56) (1.30) (2.01) (3.19)
7 -10.07 -12.71 - 19.61 ** - 16.53**(1.34) (1.13) (1.30) (1.54)
8 -8.56 -10.85 - 16.78** - 15.89**(2.41) (1.06) (1.99) (1.08)
9 -11.73 -13.95 -13.36(2.08) (2.12) (1.24)
turgor to considerably lower leaf water potentials than wouldcontrol leaves of comparable age.A shift in the 4p versus ' curve of exactly the same magnitude
was observed for leaf 5, the next oldest leaf, although the extentof adjustment was less than that of leaf 4 (Fig. 5). The results forindividual leaves 6 through 8 were basically the same as thosedescribed for leaf 5 with maximum adjustment attained after twocycles and some lesser amount following a single cycle (notshown). Both the absolute amount (A+,,) and the final levelattained (final 4,,) of osmotic adjustment declined steadily fromthe oldest to the youngest leaves with leaf 4 showing the greatestextent of adjustment. The large shifts in both intercepts of the i4pversus I relationships and the significantly higher 4'. values forcontrol leaves indicate that these additional decreases in 4,, werenot simply the result of development and maturation of the leavesas previously discussed but were the direct result of stress treat-ment.The relationship of the component water potentials with the
water content of the leaf tissue before and after stress conditioningwas basically similar for all leaves, although varying somewhat in
A LEAF2 03 04 0
5 A
*0'
*'I'A
0,'01
@0-'O 4
, 0 La"', , I
O CONTROL v WATERED v
* STRESSED
0
0
0~~~~
--S-----O
,-
B
0 -
0I0,/
A /*, ,
,,A 0 7',
, _.,
LA
IL
934 O'NEILL
10
I
www.plantphysiol.orgon June 6, 2018 - Published by Downloaded from Copyright © 1983 American Society of Plant Biologists. All rights reserved.
WHOLE PLANT OSMOTIC GRADIENTS
Xo//~~~ ,,/</,,1oo o oa-I @ -
+*^" +*^"-*
to is it a 4 0 320 E II2 69 4 0
*asag * sass
FIG. 4. Relationship between turgor potential (4p) and water potential(I) of individual leaves from representative whole plants: (A) well wateredcontrol, and following (B) one, (C) two, and (D) three stress cycles. Leaf3( ');4(0);5(@);6((A);7(A);and8(FJ).
LEAF 5
A
i
& £ , 12 opSAMS
& 0
A ~~~~~0 0
./ ex'
-20 -16 -12 -a -4 0
* SAKS
FIG. 5. Relationship between turgor potential (4) and water potential(I) for leaf 5 following one (0), two (A), and three (A) stress cyclesrelative to the control (0). Data points represent two or three leaves pertreatment.
the degree of change. These water potential-water content rela-tions are shown in Figure 6 for leaf 4. The relationship between4 and WSD (Fig. 6A) showed a marked shift following stressconditioning, indicating that this leaf could tolerate greater waterloss before exceeding a critical level of turgor and/or reachingzero turgor. Specifically, leaf4 will be able to lose 25% of its tissuewater before reaching zero turgor as opposed to around a l1o0tolerable water loss in the control leaves. In Figure 6B of WSDversus I for leaf 4, the curves for control and stressed leaves aresimilar except for the shift in the linear portion of the curve forstressed leaves to intercepts indicative of decreasing 4A, values.
0
-10
-20
30
20
, *,15
p10
S
0
WSD %
10 20 30A
LEAF 4 0 CONTROL
0 STREiSSED
0
'0\0 0
% 0~~~~~~~~~~.
~O \
935
WSD %
WSD %
10 - 20 30
i-,g~*.--,
C
0 0
0o - - °
o -0-_ _O _
I 0
0 00 0
0
FIG. 6. Water content-water potential relations for well watered control(0) and stressed (0) leaf 4. Relationship between (A) 4, and WSD, (B)I and WSD, and (C) 4,. and WSD are shown. Data points represent twoleaves per treatment.
This is seen more clearly in Figure 6C following subtraction ofthe turgor component from the total water potential.
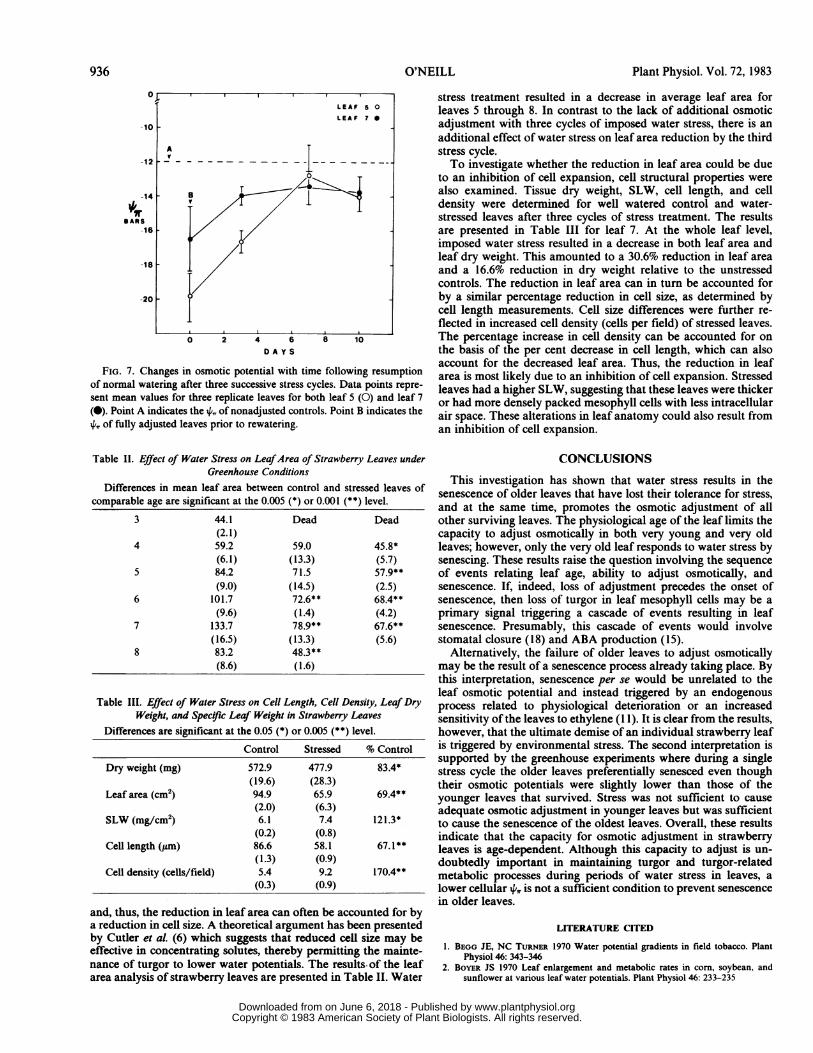
Loss of Adjustment. The loss of osmotic adjustment followingthe resumption of normal watering was followed over a 10-dayperiod in order to determine whether osmotic adjustment ofstrawberry leaves was due to some reversible or irreversible changeof cellular properties. Figure 7 shows the pattern of recovery fromwater stress conditioning for middle-aged leaf 5 and younger leaf7. This pattern of recovery from water stress shows a progressiveloss of osmotic adjustment over a 7-d period, with the prestress orcontrol level never reattained. Loss of adjustment was rapid uponrewatering with a half-life of 4 d. These data suggest that theobserved osmotic adjustment is composed of a rapidly reversiblecomponent and a smaller irreversible component, amounting toabout 10%o (or 2 bars) of the maximally adjusted state. Theirreversible component of osmotic adjustment may be attributableto anatomical differences incurred during development understressed conditions. To examine this possibility, an analysis of leafarea and cell size differences between control and stressed plantswas undertaken.
Leaf Area and Cell Size. A reduction in leaf enlargement hasbeen observed to result directly from water stress (2, 13). It hasalso been reported that leaves that experience water deficits duringthe expansive phase of growth have cells of smaller size (8, 10)
. 1
www.plantphysiol.orgon June 6, 2018 - Published by Downloaded from Copyright © 1983 American Society of Plant Biologists. All rights reserved.
Plant Physiol. Vol. 72, 1983
BARS
_16
D A Y S
FIG. 7. Changes in osmotic potential with time following resumptionof normal watering after three successive stress cycles. Data points repre-sent mean values for three replicate leaves for both leaf 5 (0) and leaf 7(0). Point A indicates the 44 of nonadjusted controls. Point B indicates theX, of fully adjusted leaves prior to rewatering.
Table II. Effect of Water Stress on LeafArea of Strawberry Leaves underGreenhouse Conditions
Differences in mean leaf area between control and stressed leaves ofcomparable age are significant at the 0.005 (*) or 0.001 (**) level.
3 44.1 Dead Dead(2.1)
4 59.2 59.0 45.8*(6.1) (13.3) (5.7)
5 84.2 71.5 57.9**(9.0) (14.5) (2.5)
6 101.7 72.6** 68.4**(9.6) (1.4) (4.2)
7 133.7 78.9** 67.6**(16.5) (13.3) (5.6)
8 83.2 48.3**(8.6) (1.6)
Table III. Effect of Water Stress on Cell Length, Cell Density, Leaf DryWeight, and Spec!ric Leaf Weight in Strawberry Leaves
Differences are significant at the 0.05 (*) or 0.005 (**) level.
Control Stressed % Control
Dry weight (mg) 572.9 477.9 83.4*(19.6) (28.3)
Leaf area (cm2) 94.9 65.9 69.4**(2.0) (6.3)
SLW (mg/cm2) 6.1 7.4 121.3*(0.2) (0.8)
Cell length (,tm) 86.6 58.1 67.1**(1.3) (0.9)
Cell density (cells/field) 5.4 9.2 170.4**(0.3) (0.9)
and, thus, the reduction in leaf area can often be accounted for bya reduction in cell size. A theoretical argument has been presentedby Cutler et aL (6) which suggests that reduced cell size may beeffective in concentrating solutes, thereby permitting the mainte-nance of turgor to lower water potentials. The results of the leafarea analysis of strawberry leaves are presented in Table II. Water
stress treatment resulted in a decrease in average leaf area forleaves 5 through 8. In contrast to the lack of additional osmoticadjustment with three cycles of imposed water stress, there is anadditional effect of water stress on leaf area reduction by the thirdstress cycle.To investigate whether the reduction in leaf area could be due
to an inhibition of cell expansion, cell structural properties werealso examined. Tissue dry weight, SLW, cell length, and celldensity were determined for well watered control and water-stressed leaves after three cycles of stress treatment. The resultsare presented in Table III for leaf 7. At the whole leaf level,imposed water stress resulted in a decrease in both leaf area andleaf dry weight. This amounted to a 30.6% reduction in leaf areaand a 16.6% reduction in dry weight relative to the unstressedcontrols. The reduction in leaf area can in turn be accounted forby a similar percentage reduction in cell size, as determined bycell length measurements. Cell size differences were further re-flected in increased cell density (cells per field) of stressed leaves.The percentage increase in cell density can be accounted for onthe basis of the per cent decrease in cell length, which can alsoaccount for the decreased leaf area. Thus, the reduction in leafarea is most likely due to an inhibition of cell expansion. Stressedleaves had a higher SLW, suggesting that these leaves were thickeror had more densely packed mesophyll cells with less intracellularair space. These alterations in leaf anatomy could also result froman inhibition of cell expansion.
CONCLUSIONS
This investigation has shown that water stress results in thesenescence of older leaves that have lost their tolerance for stress,and at the same time, promotes the osmotic adjustment of allother surviving leaves. The physiological age of the leaf limits thecapacity to adjust osmotically in both very young and very oldleaves; however, only the very old leaf responds to water stress bysenescing. These results raise the question involving the sequenceof events relating leaf age, ability to adjust osmotically, andsenescence. If, indeed, loss of adjustment precedes the onset ofsenescence, then loss of turgor in leaf mesophyll cells may be aprimary signal triggering a cascade of events resulting in leafsenescence. Presumably, this cascade of events would involvestomatal closure (18) and ABA production (15).
Alternatively, the failure of older leaves to adjust osmoticallymay be the result of a senescence process already taking place. Bythis interpretation, senescence per se would be unrelated to theleaf osmotic potential and instead triggered by an endogenousprocess related to physiological deterioration or an increasedsensitivity of the leaves to ethylene (1 1). It is clear from the results,however, that the ultimate demise of an individual strawberry leafis triggered by environmental stress. The second interpretation issupported by the greenhouse experiments where during a singlestress cycle the older leaves preferentially senesced even thoughtheir osmotic potentials were slightly lower than those of theyounger leaves that survived. Stress was not sufficient to causeadequate osmotic adjustment in younger leaves but was sufficientto cause the senescence of the oldest leaves. Overall, these resultsindicate that the capacity for osmotic adjustment in strawberryleaves is age-dependent. Although this capacity to adjust is un-doubtedly important in maintaining turgor and turgor-relatedmetabolic processes during periods of water stress in leaves, alower cellular 4i, is not a sufficient condition to prevent senescencein older leaves.
LITERATURE CITED
1. BEGG JE, NC TURNER 1970 Water potential gradients in field tobacco. PlantPhysiol 46: 343-346
2. BOYER JS 1970 Leaf enlargement and metabolic rates in corn, soybean, andsunflower at various leaf water potentials. Plant Physiol 46: 233-235
936 O'NEILL
www.plantphysiol.orgon June 6, 2018 - Published by Downloaded from Copyright © 1983 American Society of Plant Biologists. All rights reserved.

WHOLE PLANT OSMOTIC GRADIENTS
3. CRAM WJ 1976 Negative feedback regulation of transport in cells: the mainte-nance of turgor volume and nutrient supply. In U Luttge, MG Pitman, eds,Encyclopedia of Plant Physiology, Vol 2. Springer-Verlag, New York, pp 284-316
4. CUTLER JM, KW SHAHAN, PL STEPONKUS 1980 Alteration of the internal waterrelations of rice in response to drought hardening. Crop Sci 20: 307-310
5. CUTLER JM, KW SHAHAN, PL STEPONKUS 1979 Characterization of internalwater relations of rice by a pressure-volume method. Crop Sci 19: 681-685
6. CUTLER JM, DW RAINS, RS LooMIs 1977 The importance of cell size in thewater relations of plants. Physiol Plant 40: 255-260
7. FISCHER RA, GD KoHN 1966 The relationship ofgrain yield to vegetative growthand post-flowering leaf area in the wheat crop under conditions of limitedmoisture. Aust J Agric Res 17: 281-295
8. HENCKEL RA 1964 Physiology of plants under drought. Annu Rev Plant Physiol15: 386-408
9. HSIAo TC, E ACEVEDO, B FERERES, DW HENDERSON 1976 Stress metabolism.Water stress, growth, and osmotic adjustment. Phil Trans R Soc Lond Ser B273: 479-500
10. ILJIN WS 1957 Drought resistance in plants and physiological processes. AnnuRev Plant Physiol 8: 257-274
11. JORDAN WR, PW MORGAN, TL DAVENPORT 1972 Water stress enhances eth-ylene-mediated leaf abscission in cotton. Plant Physiol 50: 756-758
12. LUDLOW MM, TT NG 1974 Water stress suspends leaf ageing. Plant Sci Lett 3:235-240
13. MCCREE KJ, SD DAVIS 1974 Effect of water stress and temperature on leaf sizeand on size and number of epidermal cells in grain sorghum. Crop Sci 14: 751-755
14. MILTHORPE FL 1945 Fibre development in flax in relation to water supply andlight intensity. Ann Bot 9: 31-53
15. PIERCE M, K RASCHKE 1980 Correlation between loss ofturgor and accumulationof abscisic acid in detached leaves. Plant 148: 174-182
16. SHAHAN KW 1980 Facultative drought-induced alterations of internal waterrelations in rice (Oryza sativa). Master's thesis, Cornell University, Ithaca, NY
17. SNEDECOR GW, WG COCHRAN 1967 Statistical Methods, Ed 6. Iowa StateUniversity Press, Ames, IA
18. THIMANN KV, SO SATLER 1979 Relation between leaf senescence and stomatalclosure: senescence in light. Proc Natl Acad Sci USA 76: 2295-2298
937
www.plantphysiol.orgon June 6, 2018 - Published by Downloaded from Copyright © 1983 American Society of Plant Biologists. All rights reserved.