role of leached potato on renal function among …
TRANSCRIPT

ROLE OF LEACHED POTATO ON RENAL FUNCTION
AMONG PATIENTS WITH CHRONIC RENAL
FAILURE AT NALLASWAMY KIDNEY
CENTRE, ERODE, TAMILNADU.
A DISSERTATION SUBMITTED TO THE TAMILNADU Dr.M.G.R
MEDICAL UNIVERSITY, CHENNAI, IN PARTIAL FULFILLMENT OF
THE REQUIREMENT FOR THE DEGREE OF AWARD OF
MASTER OF SCIENCE IN NURSING
MEDICAL SURGICAL NURSING (Critical Care Nursing)
BY
30109005
DHANVANTRI COLLEGE OF NURSING
Ganapathypuram, No: 1 Ranganoor Road
Pallakkapalayam (po), Namakkal (Dt).
APRIL – 2012

ROLE OF LEACHED POTATO ON RENAL FUNCTION
AMONG PATIENTS WITH CHRONIC RENAL
FAILURE AT NALLASWAMY KIDNEY
CENTRE, ERODE, TAMILNADU.
BY
30109005
Research advisor: _______________________________________
Professor. A. Arvin Babu, M.Sc (N), Ph.D (N)
Principal,
Dhanvantri College of Nursing,
Pallakkapalayam, Namakkal (Dt)
Clinical specialty advisor: _______________________________
Mrs. Jiji Thomas, M.Sc Nursing, Reader, HOD, Medical-Surgical Nursing, Dhanvantri College of Nursing, Pallakkapalayam.
A dissertation submitted in partial fulfillment of the requirement for the
Degree of Master of Science in Nursing from The Tamilnadu Dr.M.G.R
Medical University, Chennai.
APRIL – 2012

CERTIFIED THAT THIS IS THE BONAFIDE WORK OF
30109005
AT DHANVANTRI COLLEGE OF NURSING
A DISSERTATION SUBMITTED IN PARTIAL FULFILLMENT OF THE
REQUIREMENT FOR THE DEGREE OF MASTER OF SCIENCE IN
NURSING TO THE TAMILNADU Dr.M.G.R MEDICAL UNIVERSITY,
CHENNAI.
EXAMINERS,
1. ……………………………..
2. ……………………………..

ACKNOWLEDGEMENT
“When thou passest through the waters, I will be with thee; and through
the rivers, they shall not overflow thee: when thou walkest through the
fire, thou shalt not be burned; neither shall the flame kindle upon thee”.
Isaiah 43:2
“For wisdom is better than rubies; and all things that may be desired are
not compared to it”.
Proverbs 8:11
“I can do all things through Christ which strengthenenth me”.
Philippians 4:13
I thank the ALPHA and OMEGA for his marvelous grace, abundance
mercy and determined presence in this journey of my hardship.
“Honour thy father and thy mother: that thy days may be long upon the
land which the lord thy God giveth thee”.
Exodus 20:11
“If you raise your children to feel that they can accomplish any goal or
task they decide upon, you will have succeeded as a parent and you will
have given your children the greatest of all blessings.”

I deeply convey my heartfelt gratitude to my loving parents
(Mr. S. Ambrose and Mrs. Victoria) for their love, care, hard work, support,
motivation, inspiration and bearing me through prayers to succeed in
accomplishing designed task of my life.
I owe my sincere thanks to Prof. Dr. N. Ganapathy, MBBS., MD., DA.,
FCCP., DCCM (Cardio)., MCAM., Chairman, Dhanvantri College of Nursing,
who was a token of encouragement for the success of this study.
It’s my great debt to thank to Mr. Yogeswaran, MBBS, DNB,
(GENERAL SURGEON) for granting permission to conduct my study in his
hospital besides the risks.
I deeply thank Mr. Arulmozhli, TAMILNADU AGRICULTURE
UNIVERSITY, Coimbatore for his timely and kind act when I was in need and
also enriched my knowledge regarding potassium analysis in potatoes.
I consider my great pleasure to thank my honored Prof. Mr. A. Arvin
Babu, M.Sc (N), Ph.D (N), Principal, Dhanvantri College of Nursing for his
untiring effort and guidance towards the horizon.
It’s my great privilege to thank my respected and lovable Assoc. Prof.
Mrs. Padmavathy, M.Sc (N), Ph.D (N), vice principal, dhanvantri College of
Nursing for her dedicated support and sincere commitment for the success of this
study.

I owe my thanks to Mrs. Jiji Thomas, H.O.D, Medical surgical Nursing,
Dhanvantri College of Nursing for her valuable advice throughout this study.
I express my thanks to my encourager and guide Mrs. Gracy, Lecturer,
H.O.D, Medical surgical Nursing, Dhanvantri College of Nursing for her
valuable advice and support through prayers.
Petals join hands together to blossom a flower which spreads the fragrance
on hands of people who touches it. I express my gratitude to my respected
teachers Mrs. Amudha, M.Sc (N), Mrs. Jayadeepa, M.Sc (N),
Mrs. Indira, M.Sc(N), Mrs. Annam, M.Sc (N), Mrs. Uma Maheswari, M.Sc (N),
Mrs. Deepa, M.Sc (N), Ms. Sampoornam, M.Sc(N), and Ms. Poonkuzhalil who
also spent their precious time in fulfilling my study.
I wish to express my gratitude to Prof. Dhanapal, Statician, Dhanvantri
College of Nursing, who helped me in analysis.
I express my hearty thanks to all the Experts for validating the tools and
for giving suggestion and necessary corrections.
I render my thanks to librarians, Mrs. Radha, Ms. Vimla who helped in
issuing books, journals, Xeroxing and printing very patiently.
I express my gratitude to Mr. Christopher M.Sc (N),
Mrs. Manmaya, M.Sc (N), Ms. Sunita Rao, M.Sc (N), Mrs. Eliean M.Sc (N),
Dr. Vatsa Patel, Nephrologists, Mr. Thomas victor, Radiologist Mr. Peter, lab

technician, NKC, and Mr. Kalyan, Dialysis technician, NKC who also gave their
valuable and unforgettable support to complete the study.
I express my sincere thanks from my bottom of my heart to my loving
family members, Mr.Arumainayagam, Mrs. Clarence, and Mr.Raju James, who
consistently inspired, encouraged and provided untiring and countless help to
succeed in my career and my sweet sisters(Ms. Christy Magdaline, Ms. Asha
chrisline) and brother(Mr. Sam Alwin Victor) who fervently supported in
prayers.
I render my thanks to all my seniors who gave suggestions and supported
me in the study.
I express my lovable thanks to circle of friends (2010-2012) who joined my
hands in the pathway of research.
I owe my gratitude to my lovable friends Ms. Kanakambram, Ms. Pandi
Selvi, Mrs. Daphne, Mrs. Hepzi Anjala, Mrs. Maxin, Mrs. Himani, Ms.Vinobha,
Ms. Veena, Ms. Vinci, and Ms. Catherine Juliet for their kind, love, care and
encouragement in completing this study.
BY
30109005

CONTENTS

LIST OF CONTENTS
Chapter No Contents Page No
I INTRODUCTION 1-29
• Need for the study 10-23
• Statement of the problem 23
• Objectives 23
• Operational definitions 23-25
• Hypothesis 25-26
• Delimitations 26
• Conceptual framework 26-29
II REVIEW OF LITERATURE 30-56
• Studies related to leached potato 31-33
• Studies related to renal function. 34-46
• Studies related to dietary management other than
leached potato among patients with chronic renal
failure.
46-55

Chapter No Contents Page No
• Studies related to leached potato on renal function
among patients with chronic renal failure.
55-56
III
METHODOLOGY 57- 72
• Research Approach 57
• Research Design 58-59
• Setting 60
• Variables 60-61
• Population 61
• Sample 61
• Sample size 62
• Sampling technique 64
• Selection of sample criteria 64-65
• Development of the tool 65-67
• Validity and reliability of the tool 68-69

Chapter No Contents Page No
• Data collection procedure 69-71
• Plan for data analysis 71
• Summary 72
IV DATA ANALYSIS AND INTERPRETATION 73-109
• Description of sample characteristics 76-87
• Assess the renal function among control and
experimental group patients with chronic renal
failure before and after leached potato
88-91
• Determine the changes in renal function among
patients with chronic renal failure in control and
experimental group after leached potato.
92-105
• Find out the association between the posttest
scores of renal function among patients with
control and experimental group with their
demographic variables.
106-109
Chapter No Contents Page No
V DISCUSSION 110-121
VI SUMMARY,CONCLUSION,IMPLICATIONS
AND RECOMMENDATIONS
122-134
REFERENCES 135-140
APPENDICES i-xiv
ABSTRACT xvi

LIST OF TABLES
No. Title Page No
3.1 Scoring procedure for level of renal function among patients
with chronic renal failure.
66
4.1 Frequency and percentage distribution of control and
experimental group of patients with chronic renal failure
according to their demographic variables
76-77
4.2 Frequency and percentage distribution of control group pretest
and posttest scores of renal function among patients with
chronic renal failure.
88-89
4.3 Frequency and percentage distribution of experimental group
pretest and posttest scores of renal function among patients with
chronic renal failure.
90
4.4 Frequency and percentage distribution of control and
experimental group of posttest score of renal function among
patients with chronic renal failure.
91
4.5 Paired ‘t’ test value of pre and posttest scores of renal function
in control group
92-93
4.6 Paired ‘t’ test value for pre and posttest scores of renal function
in experimental group
94
4.7 Area wise mean, standard deviation and mean percentage of pre
and posttest scores of renal function in control group
95
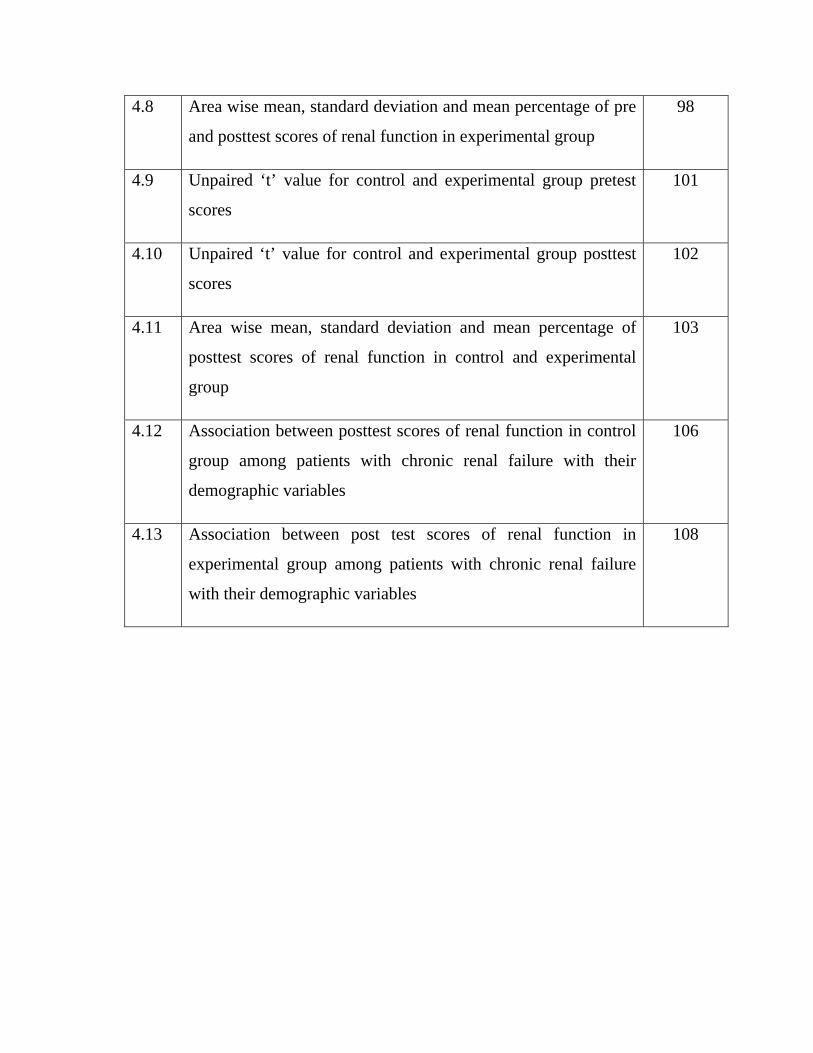
4.8 Area wise mean, standard deviation and mean percentage of pre
and posttest scores of renal function in experimental group
98
4.9 Unpaired ‘t’ value for control and experimental group pretest
scores
101
4.10 Unpaired ‘t’ value for control and experimental group posttest
scores
102
4.11 Area wise mean, standard deviation and mean percentage of
posttest scores of renal function in control and experimental
group
103
4.12 Association between posttest scores of renal function in control
group among patients with chronic renal failure with their
demographic variables
106
4.13 Association between post test scores of renal function in
experimental group among patients with chronic renal failure
with their demographic variables
108

LIST OF FIGURES
Figure
No. Title Page No
1.1 Conceptual framework 66
3.1 Schematic representation of research design 79
4.1 Bar diagram showing the percentage distribution of patients
with chronic renal failure according to their age in years.
80
4.2 Bar diagram showing the percentage distribution of patients
with chronic renal failure according to their gender.
81
4.3 Bar diagram showing the percentage distribution of patients
with chronic renal failure according to their educational status.
82
4.4 Bar diagram showing the percentage distribution of patients
with chronic renal failure according to their marital status.
83
4.5 Bar diagram showing the percentage distribution of patients
with chronic renal failure according to their food habits
84
4.6 Cone diagram showing the percentage distribution of patients
with chronic renal failure according to their duration of illness.
85
4.7 Cone diagram showing the percentage distribution of patients
with chronic renal failure according to their period of dialysis
86

4.8 Pyramid diagram showing the percentage distribution of
patients with chronic renal failure according to their causes of
illness
87
4.9 Cone diagram showing the percentage distribution of control
group pre and posttest scores of renal function among patients
with chronic renal failure.
97
4.10 Pyramid diagram showing the percentage distribution of
experimental group pre and posttest scores of renal function
among patients with chronic renal failure.
102
4.11 Pyramid diagram showing the percentage distribution of
control and experimental group posttest scores of renal
function among patients with chronic renal failure.
104

LIST OF ANNEXURES
APPENDIX Title Page No
1 Letter seeking permission to conduct study. i
2 Letter granting permission to conduct study. ii
3 Letter seeking expert opinion for content validity. iii
4 Potassium analysis certificate. iv
5 Certificate for validation. v
6 Data collection tool.
Demographic variables Renal function parameter assessment scale.
vi-viii
7 Blue print description on process of leaching potato. xiii-xiv
8 List of experts. xv
9 Photographs. xvi-xvii

1
CHAPTER-I INTRODUCTION
“As a searcher for Truth I deem it necessary to find the perfect food for a
man to keep body, mind and soul in a sound condition.”
-Gandhiji
Depression and perception of negative thoughts are common among clients
with chronic renal failure. Their minds are clouded with various thoughts in
respective of self, family, finance and prognosis of illness. The chronic renal
failure patients lead a high abnormal life. All chronic renal failure patients find
themselves adjectively dependent on a procedure, medical facility, a group of
medical personnel and are exposed to various stressors like dietary and time
constraints, functional limitations, loss of employment, changes in self-perception,
alterations in sexual function, general and perceived effects of illness, medications
used to treat the illness, and fear of death, (Kimmel PL, 2001)
The Kidney Disease Outcomes Quality Initiative (K/DOQI) of the
National Kidney Foundation (NKF) (2002) defines chronic kidney disease as
either kidney damage or a decreased kidney glomerular filtration rate (GFR) of
less than 60 mL/min/1.73 m2 for 3 or more months.

2
In the United States at the end of 2005, over 345,000 individuals with
ESRD were being treated for CKD. Of these more than 245,000 were dialysis
patients, and more than 100,000 had a functioning kidney transplant. Over the past
five years, the number of new patients with kidney failure has average about
80,000 annually. This number of patients with ESRD is expected to reach 660,000
by 2012. Each year about 70,000 people die from causes related to renal failure,
(Lewis, 2006).
Incidence of End-stage renal disease is likely to be higher in India than the
developed country with glomerulonephritis being the most common cause,
accounting for more than one-third of patients the crude and age adjusted
incidence rates of end stage renal disease (ESRD) were 151 and 232 per million
population, respectively,(Sukhuja V, 2003)
Renal units in India are offering treatment to 80-100 new patients with end-
stage renal failure per million each year. End-stage renal failure population has
exceeded 7, 00,000 by the turn of the century, (Gulati P.D, 2007).
In a community based study from Delhi in Northern India, the prevalence
of chronic kidney disease was reported to be 7852 per million populations; this
report provides the most current nationally representative estimates of CKD. The
findings indicate that CKD affected an estimated 16.8% of adults aged >20 years.
A estimate of 14.5%. Persons with CKD have high rates of morbidity, mortality,

3
and health-care utilization (6,7). The findings in this report suggest that CKD is a
growing health problem in India, (Agarwal, 2005).
End-stage renal failure has many causes, including primary renal disease,
systemic disease involving kidney, and inherited disease. These various etiologies
can be classified in to six groups and they are diabetes mellitus, hypertension,
glomerulonephritis, cystic disease, and urologic disease, (Ralph .J, 2003).
Normally in the body, the kidney regulates the sodium and water balance
and intravascular volume and plays the key role in potassium and acid base
homeostasis. Renal failure results when the kidneys are unable to remove the
body’s metabolic wastes or perform their regulatory functions. The substances
normally eliminated in the urine accumulate in the body fluids as a result of
impaired renal excretion and lead to a disruption in endocrine and metabolic
functions as well as fluid, electrolyte and acid base disturbances, (Suzanne, 2005)
As renal function progressively detoriates, every body system is involved.
Clinical signs are a result of retained substance including urea, creatinine, phenols,
hormones and abnormal electrolyte and acid- base disturbances. Potential
complications of chronic renal disease that concerns nurse and that necessitates
collaborative care include Hyperkalemia, pericarditis, bone disease and
hypertension. (Brunner, 2004).
4
As the renal function detoriates, it is associated with bio-psychosocial
process that promotes or inhibits adaptive functioning. Patients with chronic life-
threatening illness are often angry, depressed or anxious. The emotional response
that may accompany chronic illness helps to improve the quality of life and
adherence to prescribed regimen of treatment, (Stuart, 2005).
The American National Kidney Foundation’s Kidney Disease Outcomes
Quality Initiative work group developed a classification system that separated the
period from very early kidney disease to end stage kidney failure into five stages
and their prevalence rate. Stage I- 3.1%, stage II- 4.1%, Stage III- 7.6%, stage IV-
0.5% and stage V- 0.5%, (National Kidney Foundation, 2002).
End-stage renal disease can be treated by renal replacement therapies, such
as hemodialysis, transplantation, and peritoneal dialysis. Hemodialysis is the
therapy used most often. Among patients with end-stage renal disease, 66% in the
United States and 46% to 98% in Europe receive hemodialysis. Although
hemodialysis effectively contributes to long-term survival, morbidity and
mortality of dialysis patients remains high, especially morbidity and mortality due
to cardiovascular diseases.3-7 Only 32% to 33% of patients on hemodialysis
survive to the fifth year of treatment, whereas 70% of patients who have kidney
transplants are alive after 5 years, (Marshall J, 2007).
India currently has 820+ nephrologists, 710+ hemodialysis units with
2,500+ dialysis stations and 4,800+ patients on CAPD. There are 172+ transplant

5
centers, two-thirds of which are in South India and mostly privately run. Nearly
3,500 transplants are done annually, the total number of cadaver donors being
approximately 700 till now. Thus, taken together, nearly 18,000–20,000 patients
(10% of new ESRD cases) in India get renal replacement therapy. The
government has initiated a process by which it is planning to establish stand-alone
hemodialysis units in the country to increase the facilities at an affordable cost,
and on the transplant side it had launched a National Organ Transplant Program
to facilitate transplantation on a national scale, (Karger S and Basel AG, 2009)
If Serum Creatinine (Scr) level is too high, the toxins in human body
cannot be excreted timely, which will easily cause various complications, thus
threatening people’s life. At that time, Renal Failure patients are badly in need of
effective therapy to excrete the toxins in order to lighten the complications and
maintain the normal sign of the body. While dialysis contains hemodialysis and
peritoneal dialysis is an effective and timely method. Generally speaking, if
glomerular filtration rate of patients is declining seriously and the rest renal
function is only less than 10%, it indicates Renal Failure has developed into
Creatinine Renal Failure---Uremia, the patient must carry on dialysis,
(Shijiazhuang, 2010)
Dialysis is a process used to remove fluid and uremic waste products from
the body when the kidneys are unable to do so. It may also be used in treating
patients with intractable edema, Hyperkalemia, hypertension and uremia. Chronic

6
or maintenance dialysis is indicated in chronic renal failure known as the end-
stage renal failure in instances like occurrence of uremic symptoms affecting all
body systems, Hyperkalemia, fluid overload not responsive to fluid restriction
and diuretics, and general lack of well-being, (Linda Traxler, 2000)
Patients with chronic renal failure, hemodialysis prevents death, although
it does not cure renal disease and does not compensate for loss of kidney’s
endocrine or metabolic activities. Patients receiving hemodialysis must undergo
treatment for their rest of their lives (usually three times a week for at least 3-4
hours per treatment), (Ann Peach, 2003)
Food provides energy and repairs the body itself. The food taken is broken
down in the stomach the nutrients are picked up by the blood and supply nutrition
to the cells. The cells take up the nutrients and put the waste product back in to the
blood stream. When kidneys are normal, the wastes are removed from the blood.
Now that kidneys stopped functioning, hemodialysis removes waste from the
body. But between dialysis the waste can build up and can make sick and this can
be reduced or avoided by maintaining good dietary pattern. A good meal pattern
can improve dialysis and good health, (Herselmen, MG, 2009).
Diet plays vital role in dialysis patients’ rehabilitative care. A well-
balanced diet is necessary for them to stay fit as their kidneys are no longer

7
functioning at its full capacity i.e. to get rid of the waste products and fluid from
their blood, (Michael J, 2005).
There are complex and individualized dietary rules which help to reduce the
progression of kidney disease and decrease the likelihood of complication. The
general dietary guidelines are protein restriction, sodium restriction, fluid
restriction, potassium restriction, phosphorous restriction and carefully following
the prescribed regimen, (Pranay Kathuria, 2005).
Excessive potassium level in the blood can cause muscle weakness, abnormal
heart rates and in extreme cases, heart failure. Since dialysis can only remove a
fixed amount of potassium, it is crucial to control the amount accumulated through
patients’ dietary intake. It is important to avoid foods that are high in potassium
and to take in moderation food that has low to moderate content. Healthy kidney
can keep the right amount of potassium level in the blood to keep your heart
beating in a steady pace. Potassium levels can rise between dialysis sessions and
affect heartbeat. Eating too much potassium can be very dangerous to your heart.
It may even cause death, (Sandra Ketcham, 2007).
The mineral potassium is found in many foods, especially fruits and
vegetables. Potassium affects how steadily your heart beats, so eating foods with
too much of it can be very dangerous to your heart. To control potassium levels in

8
your blood, avoid foods like oranges, bananas, tomatoes, potatoes, and dried fruits,
(Kim Bayer, 2004)
Potassium is a mineral that controls nerve and muscle function. One very
important muscle — the heart — beats at a normal rhythm because of potassium.
In addition, potassium is necessary for maintaining fluid and electrolyte balance
and pH level. Healthy kidneys help keep potassium at a normal level. Potassium
comes from the foods we eat, and healthy kidneys remove excess potassium in the
urine to help maintain normal levels in the blood. However, because people
with chronic kidney disease (CKD) or people on kidney dialysis do not have
healthy kidneys, potassium may build up in their bodies. For this reason, people
with CKD and those on hemodialysis may have to limit foods high in potassium or
find ways to remove potassium from the foods they eat, (Sara Colman, RD,
2007).
People with chronic kidney disease can keep their potassium at safe level
by Leaching high potassium vegetables, if including them in your diet. Leaching
removes some of the potassium. Instruction for leaching vegetables are given
below by (Davita, 2004)
Peel the vegetable, cut into small pieces and place in a very large pot
of water.
Rinse the vegetables.

9
Fill the pot with water and let the vegetables soak for at least four
hours at room temperature
After soaking, rinse the vegetables with clean water.
Cook vegetables as desired.
Limit portion to one serving, usually 1/2 cup.
A medium-size 150 g (5.3 oz) potato with the skin provides 27 mg of vitamin
C (45% of the Daily Value (DV)), 620 mg of potassium (18% of DV), 0.2 mg
vitamin B6 (10% of DV) and trace amounts of thiamin, riboflavin, folate, niacin,
magnesium, phosphorus, iron, and zinc. The fiber content of a potato with skin
(2 g) is equivalent to that of many whole grain breads, pastas, and cereals. In terms
of nutrition, the potato is best known for its carbohydrate content (approximately
26 grams in a medium potato).
Potatoes are a valuable source of mineral nutrients that provide high levels of
potassium. Individuals with compromised kidney function, however, must
minimize their potassium intake. Consumption of potatoes may benefit healthy
persons by adding potassium and other minerals to their diet, but potato
consumption by persons with chronic renal failure may be harmful. The
recommended potassium intake in kidney dialysis patients is 2 to 4 g/d .For these
persons, leaching cut potatoes in water prior to cooking is advised as a way to
reduce potassium content, (Bethke, 2007).

10
NEED FOR THE STUDY
The experience of dialysis can be very destructive for both the individual
with the disease and that individual's family, resulting in a life that is greatly
narrowed in scope with increased dependency on one's partner. The patient on
dialysis is threatened with many potential losses and life-style changes including
decreased financial status, fluid and food restrictions, changes in family roles and
responsibilities, and decreased ability to fulfill long-range life goals, (Gurklis &
Menke, 2005).
Chronic kidney disease (CKD), also known as chronic renal disease,
involves progressive, irreversible destruction of nephrons in both the kidneys.
Chronic kidney disease is a progressive loss in renal function over a period of
months or years, (Lewis, 2003)
ESRD is a devastating medical, social and economic problem for patients
and their families. The availability and quality of dialysis programmes largely
depend on the prevailing economic conditions and social support, (Collier, 2003).
The prevalence of chronic renal disease is rising worldwide. The global
patient population with an end stage renal disease continues to grow at the rate of
7 per cent per annum due to demographic transition, increase in disease leading to
chronic renal disease and increased availability of diagnostic and therapeutic
facilities, (Shyam and Sreenivas , 2005).

11
The incidence of ESRD has increased by almost 8% per year for the past
five years. In the united states, more than 280,000 patients with chronic renal
failure (65%) are receiving hemodialysis; more than 120,000 (28%) have
functioning renal transplants, and more than 24,000 (7%) are receiving peritoneal
dialysis, (United States Renal Data System, 2004).
According to national kidney foundation, approximately 80,000 people die
from kidney disease in this country every year. In 2002 only 9% were free of co-
morbid conditions. More than 65,000 patients with ESRD die annually, and 23%
annual mortality rate reflects the degree to which ESRD affects mainly a severely
ill geriatric population, (White.L.et.al, 2005)
Incidence of CKD has doubled in the last 15 years. In the USA, 30
million people suffer from CKD. India's national CKD registry organized under
the auspices of Indian Society of Nephrology and housed in Kidney Institute at
Nadiad has given data from 45,885 subjects admitted to 166 kidney centers in
India up to January 2010."It is noted that CKD, secondary to diabetes, heads the
list at 31.2 per cent, (Acharya, 2001).
Whorra.P.C. (2001) conducted a research among 183 patients who were
on seven years of experience with hemodialysis treatment for ESRD in Dehradun
and found that the incidence and prevalence was more among male when

12
compared to females and majority of the patients (71%) were above the age of 40
years.
A community based study has been done to determine the prevalence of
chronic renal failure in India. Using multi-stage cluster sampling a total of 4972
persons were contacted for the study. The individuals contacted responded to a
detailed questionnaire, and had a physical examination, a dipstick urine test for
albumin and sugar and a blood test for serum creatinine. A serum creatinine
>1.8�mg% defined renal failure. A repeat test for serum creatinine was done after
8–12 weeks to confirm chronicity of renal failure. If it was >1.8�mg% after 3
months in the absence of reversible factors, CRF was diagnosed. The person found
to have CRF was asked to attend a hospital renal clinic for further investigations
and individualized management. Thus, the prevalence of CRF in that adult
population was 0.785% or 7852/million, (Suresh Chand Dash, 2005).
According to the World Health Report 2002 and Global Burden of
Disease (GBD) project, diseases of the kidney and urinary tract contribute to the
global burden of diseases, with approximately 850,000 deaths every year and
15,010,167 disability-adjusted life years.
In the rural population of Chennai from South India, the evidence of CKD
short of renal failure was0.7%, (Maniet al, 2009).

13
The kidney help trust of Chennai has surveyed a population of 25,000 to
identify the risk of renal failure by estimating glomerular filtration rate using
MDRD formula. The prevalence of impaired renal function is 8.6 per thousand
population, (Muthu Krishnan, 2005)
Nallaswamy Kidney Centre, a well known kidney centre in Erode, has a
separate dialysis unit where patients with chronic renal failure in and around erode
district are treated by means of dialysis. The statistical report reveals 15.2% cases
are diagnosed each year and only 9.4% of the patients are only treated due o
financial crisis. The mortality rate is 3.3% per year.
The world wide prevalence of etiology of chronic kidney disease was
Diabetes mellitus – 34 %, hypertension – 29 %, glomerulonephritis – 14%,
obstructive nephropathy – 9 %, pyelonephritis and interstitial kidney disease – 3%,
polycystic kidney disease – 3 %, drug induced nephropathy – 1%, unknown (not
detected) – 7%, (Anonymous et al. 2002).
Zarzeclin M.et.al., (2004) given the information on the main causes of
ESRD were chronic glomerulonephritis (29%), diabetic nephropathy (27%),
polycystic kidney disease (15%), interstitial (1%) and hypertensive nephropathy
(9%).
An epidemiological, cross-sectional and multicenter study, in patients older
than 65 years (n 625) and > 75 years (n 558) from 29 Spanish medical institutions
was to perform an epidemiological analysis It included demographic information,
as well as data regarding chronic renal failure, functional and psychological

14
abilities . The study analyzed data from 1,183 patients (678 female), mean age
75,4 ± 5,5 years; mean duration of dialysis 4,3 ± 5,1 years . The most frequent
etiologies were diabetic nephropathy (21,2%) and vascular renal disease (20,9%).
The main co-morbidities were high blood pressure (75,6%), Diabetes Mellitus
(32,9%) and vascular (29,0%) and osteoarticular (27,3%) diseases. Around 75%
of elderly patients on hemodialysis fulfill age-suitable daily living activities and
display adequate dialysis quality parameters, (Francisco. A.L.L.de, 2008).
Statistics of the South African Dialysis and Transplant Registry (SADTR),
conducted a six-year study of 3632 patients with ESRD, based on SADTR
statistics, hypertension was reported to be the cause of ESRD in 4.3% of whites,
34.6% of blacks, 20.9% mixed race group and 13.8% of Indians. In a ten-year
study of 368 patients with chronic renal failure in Nigeria, the etiology of renal
failure was undetermined in 62%. Of the remaining patients whose etiology was
ascertained, hypertension accounted for 61%, diabetes mellitus for 11% and
chronic glomerulonephritis for 5.9%. Patients with CRF constituted 10% of all
medical admissions in this center. Chronic glomerulonephritis and hypertension
are principal causes of CRF in tropical Africa and East Africa, together with
diabetes mellitus and obstructive uropathy, (Kidney International, 2003).
The kidneys have many functional roles, including fluid and electrolyte
balance, waste removal, acid-base balance, bone health, and stimulation of red
blood cell production. CKD can be associated with fluid overload, sodium and
potassium imbalances, bone and mineral disorders, anemia, and reduced quality of
15
life. Additionally, adults with CKD typically have other chronic diseases, such as
diabetes, hypertension, and other cardiovascular diseases, (Christa Nolte, RN,
2006).
Prior to early 1960’s patient who developed end-stage renal disease faced
an inevitable death within days to weeks with few expectations. The indication of
hemodialysis and peritoneal dialysis has enabled these patients to survive many
for years, resulting in a large population of patients with end-stage renal disease
replacement therapy, (John.T,2000).
Zuo wang (2006), reported the current status of HD in Beijing. Data
collections forms were distributed to all HD centers in Beijing, and data from 2003
and 2004 were collected for analysis of incidence, prevalence, causes and
mortality of end-stage renal disease treated by HD. The city has 122 HD centres.
At the end of 2003 (December 31), 3,435 resident patients were on HD, the point
prevalence then was 235.9 per million population (pmp). In 2004, 4,110 new cases
of ESRD were diagnosed, of which 2,587 cases were Beijing residents, resulting
in an annual incidence of HD treatment of 173.3 pmp. At the end of 2004, 4,014
resident patients were on HD, and the point prevalence increased to 268.9 pmp.
The result shows that the prevalence and incidence of HD are increasing. Thus, for
better prevention of ESRD, efforts should be made to clarify the reason for the
increase. Also, the quality of health care provided needs to be improved for better
quality of life for patients on HD.

16
Man-ching law (2004), performed a single-center prospective
observational study among continuous ambulatory peritoneal dialysis patient to
identify the impact of dialysis adequacy on patient outcome among Caucasian
patients in china. Multivariate analysis showed that the duration of dialysis,
diabetes, %LBM, index of dialysis adequacy (Kt/V or CCr), residual GFR, and
requirement of a helper for CAPD exchanges were independent factors of patient
survival; serum albumin, adequacy index (Kt/V or CCr), and requirement of a
helper were independent factors of technique survival. Duration of dialysis, body
weight, and requirement of helper, cardiovascular disease, HBsAg carrier, serum
albumin, and CCr had independent effects on hospitalization. Our results show that
dialysis adequacy has significant impact on outcome of Asian CAPD patients.
Urth M, et.al, (2004), conducted a study on health related quality of life
among hemodialysis patients in USA, in which revealed that despite technical
progress in therapy, hemodialysis patients continue to report health-related quality
of life substantially lower than that of the general population while African-
Americans with end-stage renal disease survive longer than the members of other
races. Concluded that ESRD is the only chronic illness for which African-
Americans report significantly better psychological well-being and a lower burden
of disease than non-African – Americans. After adjustments there were no racial
differences in score on the social support and dialysis staff encouragement or
patient satisfaction.

17
Sadler .J.H (2003), said that health promotion is the desired objective of
dialysis-treatment. Achieving the highest level of functioning not only improves
the life of the patient, but also rewards the staff through the positive feedback that
helps improvement in procedures. Fundamental to achieving health is adequate
dialysis, control of anemia, good nutrition and attention to co-morbid conditions.
To strive towards being healthy and happy dialysis patients, they would
need to, eat the right kind and amount of food on a daily basis. To achieve good
dialysis outcome, dialysis patients need to closely and careful monitor their diet so
as to help control the waste products and fluids accumulated between dialysis
treatments. It is essential for dialysis patients to have the right amount of protein,
calories, fluids, vitamins and minerals each day, (Burke. K, 2004)
A Healthy Diet for a dialysis patient is, adequate in protein, adequate in
calories, low to moderate in potassium, low in sodium low in phosphorus,
controlled in fluids, (Aguilera J, 2008).
Oka. M. and Chaboyer. W (2001), conducted a study on “dietary
behaviors and sources of support in hemodialysis patients” in Japan, in which he
found that individuals with CRF generally have strict dietary guidelines and
identified support from family members and nurses were significantly related to
dietary behaviors. Nurses working with dialysis patients should remember to use
their influence positively to support their patient and bear in mind that long-term

18
dialysis patients, especially those who are young and unmarried may benefit from
ongoing nursing support and encouragement.
Nand .N, et.al, (2003), conducted a study on “effect of dietary management
of CRF patients” in Haryana, India, the effect of low protein 10.6 gm/Kg/day, low
potassium (2-4mg/kg/day) diet with calcium (600mg/day) supplementation on
renal and parathyroid functions in patients with CRF. There were symptomatic
improvement in 88% patients, blood urea, creatinine decreased significantly, GFR
improved. So dietary management should be strictly enforced in CRF patient in
the early course of disease.
Lee .S.H. (2002), conducted a cross-sectional study, examined dietary and
fluid compliance behaviors in Chinese hemodialysis patients in Hong Kong and
information was obtained about their knowledge of fluid and dietary restrictions
related to dialysis, health beliefs, personal and medical characteristics, and self-
reported compliance. In addition serum levels of potassium and phosphate and
intra-dialytic weight gain were retrieved from the medical records, dietary and
fluid compliance was observed in only 35.5% and 40.3% of the patients
respectively. Patients with more hours on hemodialysis per week found to be more
fluid non-compliant. Working patients and those whose diet was prepared by
someone else in the family were also more likely to be non-compliant. Health
professional should be aware of the factors behind non-compliance in HD patients
and assist them in making life style changes.

19
Elevated potassium is of special concern for patients with chronic kidney
disease. Patients with kidney disease are advised to moderate their intake of
potassium through careful selection of foods and by preparing foods in ways that
minimize potassium consumption, (Krishnan, 2006).
Ren Fail (2010), conducted a study was to estimate the prevalence of
hyperkalemia among Egyptian hemodialysis patients. 400 ESRD patients on
maintenance hemodialysis were enrolled in the study. For all patients, history and
clinical examinations and serum potassium level was measured three times--pre-
and post-1st session and pre-next session--at two successive sessions of
hemodialysis. The results of this study showed that the prevalence of
hyperkalemia was 41.2%, 6.5%, and 66.9% of pre- and post-dialysis and before
the next session of dialysis, respectively. Hyperkalemia significantly correlates
with potassium-rich diets, non-compliant patients, two sessions of hemodialysis
per week, and constipation in ESRD patients during the study periods.
Hyperkalemia is a frequent problem in patients with end stage renal disease in
Egypt.
Stephen L. Seliger (2009), conducted a retrospective analysis of a national
cohort comprised 2 103 422 records from 245 808 patients with at least 1
hospitalization and at least 1 inpatient or outpatient serum potassium record .
Chronic kidney disease and treatment with angiotensin-converting enzyme
inhibitors and/or angiotensin II receptor blockers (blockers of the

20
reninangiotensin- aldosterone system [RAAS]) were the key predictors of
hyperkalemia. Of the 66 259 hyperkalemic events (3.2% of records), more
occurred as inpatient events (n=34 937 [52.7%]) than as outpatient events (n=31
322 [47.3%]). The adjusted rate of hyperkalemia was higher in patients with CKD
than in those without CKD among individuals treated with RAAS blockers (7.67
vs 2.30 per 100 patient-months; P_.001) and those without RAAS blocker
treatment (8.22 vs 1.77 per 100 patient months; P_.001). The risk of hyperkalemia
is increased with CKD, and its occurrence increases the odds of mortality within 1
day of the event. These findings underscore the importance of this metabolic
disturbance as a threat to patient safety in CKD.
Potatoes are a valuable source of mineral nutrients that provide high levels of
potassium. Individuals with compromised kidney function, however, must
minimize their potassium intake. A new study in the Journal of Food Science
provided certain potato preparation guidelines for kidney dialysis patients by
exploring the effects of leaching and boiling on levels of potassium and other
minerals in potatoes and found that boiling cubed or shredded samples reduced
potassium levels by 50 percent and 75 percent, respectively, (Jasline, 2008)
Agricultural Research Service Scientist Jansky (2008) analyzed 1/2-inch
cubed potato pieces (that’s very small) and grated potatoes soaked in the
refrigerator for 20 hours at 42° F and then boiled. The results showed that boiling
reduced the potassium just as effectively as soaking then boiling. The raw potato

21
cubes that were not leached contained 400 milligrams of potassium. However,
after boiling for 10 minutes in a large volume of water, the boiled cubes were
reduced to 200 milligrams of potassium, and the boiled grated potatoes were
reduced to 100 milligrams of potassium. The result of this could be a good
cooking strategy for potato fans hoping to reduce potassium intake, such as
dialysis patients.
Madison (2007), has undertaken a study to determine the effects of leaching
and boiling on levels of potassium and other minerals in potato tubers. Leaching
alone did not significantly reduce levels of potassium or other minerals in tubers.
Boiling tuber cubes and shredded tubers decreased potassium levels by 50% and
75%, respectively. In addition, mineral levels in tubers of 6 North American
potato cultivars are reported. Significant differences in mineral levels were
detected among cultivars, but they were too small to be nutritionally important.
Individuals with compromised kidney function wishing to maximize the mineral
nutrition benefits of consuming potatoes should boil them whole or bake, roast, or
microwave them. Those who must reduce potassium uptake should boil small
pieces before consuming them.
Shelley Paul (2008), of the United States Department of Agriculture –
University of Wisconsin-Madison Department of Horticulture, utilized samples of
potatoes that had been shredded as well as potatoes that had been diced into 1 cm
cubes. The samples were then leached or boiled, two treatments that are most

22
likely to have an impact on the mineral content of a consumed product. The
mineral content of the potatoes was drastically reduced by either cubing or
shredding them and then boiling. Boiling shredded potatoes reduced levels of
potassium, zinc, magnesium by 50 percent. Boiled potato cubes lost 35 percent of
their total magnesium and zinc. Leaching, which refers to soaking food in water
before cooking, had little effect on the mineral levels of the samples. This exist
little benefit for renal failure patients trying to reduce potassium consumption by
leaching potatoes. Those with compromised kidney function can decrease their
mineral intake while still taking advantage of the other nutritional qualities of
potatoes by boiling them, thinly sliced. “Our study offers information about the
nutritional quality of potatoes and the effects of cooking on the contents of mineral
nutrients,” the authors conclude. “It will likely result in changes in
recommendations by medical staff working with patients who have compromised
kidney function.”
Potato is restricted in dietary regimen for patients with chronic renal failure,
but through the process of leaching, potato can be included in their dietary pattern.
The researcher felt that it is the responsibility of nursing staff to educate the
leaching process to maintain the progression of renal function.

23
STATEMENT OF PROBLEM
"ROLE OF LEACHED POTATO ON RENAL FUNCTION AMONG
PATIENTS WITH CHRONIC RENAL FAILURE AT NALLASWAMY
KIDNEY CENTER, ERODE”.
OBJECTIVES
1) To assess the level of renal function among patients with chronic renal
failure in experimental and control group before and after leached potato
2) To determine the changes in renal function among patients with chronic
renal failure in experimental and control group after leached potato.
3) To find out the association between posttest scores of renal function among
patients with chronic renal failure in experimental and control group with
their demographic variables.
OPERATIONAL DEFINITIONS
Role
Role refers to changes in renal function among patients with chronic renal
failure as determined by significant difference between posttest scores of
experimental and control group.

24
Leached potato
Leaching is a process of removing potassium content from the potato through
series of steps and they are as follows:
Step 1: Wash 100gm of potato in the tap water
Step 2: Chop the potato into small pieces
Step 3: Soak the chopped potato in tap water for about one hour.
Step 4: Drain the water
Step 5: Boil the chopped potato in fresh water for 10 minutes.
Step 6: Drain the water
Step 7: Again re -boil the chopped potato in fresh water for 10 minutes.
Step 8: Drain the water.
Step 9: Repeat step 7 and step 8.
Step 10: Now the leached potato is used to prepare the dish.
This leached potato is advised to take for six days in a week.
This preparation is explained to the patient and care givers through video
demonstration.

25
100mg of potato contains 420mg of potassium. Soaking one hour prior to
cooking reduces 66mg of potassium. The amount of potassium lost after boiling is
51mg.
Renal function
This refers to assessment of urinary output in 24 hrs, systolic and diastolic
blood pressure, weight loss in kg, serum potassium, serum creatinine, and edema
which is measured by using renal function parameter assessment scale.
Chronic renal failure patients
It refers to patients who are diagnosed with chronic renal failure and are
undergoing hemodialysis for thrice a week.
HYPOTHESES
H1 : There is significant level of renal function among patients with chronic
renal failure in experimental and control group before and after Leached
Potato.
H2 : There is compromised level of renal function among patients with chronic
renal failure patients in experimental and control group before and after
Leached Potato.
26
H3 : There is significant association between posttest scores of renal function
among patients with chronic renal failure in experimental and control group
with their demographic variables.
DELIMITATIONS
The study was delimited to,
• Assess the role of leached potato.
• Identify changes in renal function
• Patients with chronic renal failure.
• Nallaswamy Kidney Centre, Erode.
CONCEPTUAL FRAME WORK
Orlando’s deliberate nursing process model
A conceptual frame work refers to a frame work of prepositions for
conducting research.
Conceptual frame work provides clear description of variables suggesting
ways or method to conduct the study and guiding the interpretation, evaluation and
integration of study findings, (Polit and Hungler, 2003)

27
Wood and Helper (1994), states that, “when conducting research a
theoretical frame work serves as a guide of map to systematically identify a
logical, precisely defined relationship between the variables”.
Orlando’s deliberate nursing process model was selected for this present
study. In this theory the nurse reacts to patient’s behavior by ascertaining both the
meaning of the distress and what would alleviate the distress.
Orlando’s deliberate nursing process model consists of three components
namely,
Patient behavior
Nurse reaction
Nurse’s action.
Patient behavior
According to theory, patient behavior means, patient feels helpless and
person’s behavior reflects his feelings. It can be verbal (expressed by language
such as complaints, requests, demands or refusals). Non-verbal (manifested
physiologically such as heart rate, edema or motor activity or vocally such as
crying).
In this theory patient’s verbal behavior is expressed through complaints of a
client and non-verbal behavior is expressed through pretest about the renal
function through renal function parameter assessment scale

28
Nurse reaction
Nurse’s reaction is comprised of three sequential parts:
Perception: the nurse perceives the behavior through any of her senses.
Thought: the perception leads to automatic thought.
Feeling: the thought produces an automatic feeling.
In this present study,
Nurse’s perception is coming to a conclusion about the pretest i.e., impaired
renal function.
Nurse’s thought is modify the dietary pattern
Nurse’s feeling is to include leached potato in the diet without causing any
adverse effect.
Nurse’s action
According to the theory nurse activity can be automatic (decided on for
reason other than the patient’s immediate need) or deliberative (resulting from
correctly identifying patient’s need through validation of an interpretation made
from the patient’s behavior).
In this present study nurse’s deliberative action is to educate and implement
leaching process of potato, with the help of video demonstration.

29
PATIENT’S BEHAVIOUR
Verbal response
• Weight
gain
• Metallic
taste
• Fatigue
• Vomiting
• Nausea
• Fluid restriction
• Not able to have desired food
Pretest
Non-verbal response
Renal function
parameter
assessment scale
• Urinary output
in 24 hours
• Systolic BP
• Diastolic BP
• Weight loss
• Potassium
• Creatinine
• Edema
Experimental group
Control group
NURSING REACTION
Perception:
Impaired renal function
Thought:
Modify dietary pattern
Feeling:
Concern to include leached potato without causing any adverse effect
Video demonstration on leaching potato
Compromised renal function
NURSING ACTION
Fig 1.1 conceptual framework on Orlando’s Deliberate Nursing Process Model

30
CHAPTER II
REVIEW OF LITERATURE
The review of literature is a broad, comprehensive, in depth, systematic and
critical review of scholarly publication, unpublished scholarly print materials
audiovisual material and personal communication.
A literature review is a written summary of the state of existing knowledge
on a research problem. The task of reviewing research literature involves the
identification, selection, critical analysis and written description of existing
information on a topic, (Polit and Hungler, 1999).
The review of literature in this study is organized under following
headings;
I. Studies related to renal function
II. Studies related to leached potato
III. Studies related to dietary management other than leached potato
among patients with chronic renal failure.
IV. Studies related to leached potato on renal function among patients
with chronic renal failure.

31
I. STUDIES RELATED TO LEACHED POTATO
Jansky (2008), carried out Two trials with potato tubers at the Univ. of
Wisconsin Lelah Starks Potato Research Station near Rhinelander,Wis., U.S.A. In
the 1st trial, The leaching treatment consisted of soaking each sample in 300 mL
distilled water at 5.6 ◦C for 20 h. The water was then decanted off and the sample
was lyophilized prior to mineral analysis. The leaching and boiling treatment
consisted of leaching, decanting the water off and replacing it with 300 mL fresh
distilled water, bringing the water to a boil, boiling for 10 min, decanting the water
off, and then lyophilizing the sample. The control consisted of lyophilized raw
tuber samples. One freeze-dried sample of each replication of each treatment was
ground into a powder using a mortar and pestle. For each sample, 500 mg of dried
tuber tissue and 5 mL of concentrated nitric acid were added to a 50-mL Folin
digestion tube. The mixture was heated to 120 to 130 ◦C for 14 to 16 h and then
treated with hydrogen peroxide. After digestion, the sample was diluted to 50 mL.
This solution was analyzed forminerals by inductively coupled plasma optical
emission spectrometry. The Shredded tubers (2 × 5 mm × tuber length) were
evaluated along with cubes. An additional processing treatment, boiling, was also
added. The boiling treatment consisted of placing a freshly prepared sample in 300
mL distilled water, bringing the water to a boil, and then boiling for 10 min. The
water was then decanted off and the sample was lyophilized. Statistical analyses
included analysis of variance (ANOVA) using the general linear model in SAS
and means separation using a protected least significant difference test at P = 0.05.

32
The amount of K remaining in the potato samples was strongly dependent on the
preparation method. Leaching of cubed samples had little effect on K content, and
the average amount of K remaining was 96% and 100% of control values in trials
1 and 2 respectively. Shredded samples retained less of their K after leaching, but
K amounts after overnight leaching were still 83% to 98% of control values.
Bethke (2008), analyzed 1/2-inch cubed potato pieces (that’s very small)
and grated potatoes soaked in the refrigerator for 20 hours at 42° F and then
boiled. The results showed that boiling reduced the potassium just as effectively as
soaking then boiling. The raw potato cubes that were not leached contained 400
milligrams of potassium. However, after boiling for 10 minutes in a large volume
of water, the boiled cubes were reduced to 200 milligrams of potassium, and the
boiled grated potatoes were reduced to 100 milligrams of potassium.
Burrowes (2008), compared potato varieties and potassium removal
without soaking. Instead 1/8" potato slices were boiled until tender. One batch was
boiled once as with normal cooking (NC). The second batch was brought to a boil,
drained, and then boiled until tender, called double cooking (DC). Results revealed
that potassium removal was effective although the amount varies with potato
variety. Idaho, red, purple, white and Russian fingerling potatoes had potassium
content ranging from 162-194 mg/100 g after double cooking. Yukon gold
potatoes were higher, 235 mg/100 g.

33
McVeigh (1990), analyzed cubed, grated and French-fry-cut potatoes
soaked in the refrigerator in cold water (40° F) for four hours. Ten times the
amount of water to potatoes was used. In this study, potassium in raw potatoes was
reduced from 340 milligrams to 290 milligrams after four hours of leaching. For
the grated potatoes soaked in the refrigerator, potassium was 150 milligrams after
four hours. The French-fry-cut potatoes were 340 milligrams after four hours of
soaking.
Louis (1970), analyzed dehydrated and raw potato slices and soaked in
water at room temperature for 30 minutes. The volume of water was 10 times
more than potatoes. Dehydrated potato slices were rinsed and boiled for 5-10
minutes. This method of soaking and boiling reduced potassium from 400
milligrams per every 100 grams of potatoes to 86 milligrams for dehydrated slices
of potato. The results confirmed that maximum surface exposure with a large
amount of water at room temperature or higher effectively removed potassium.
Tsaltas (1969), sliced potato into 1/8th-inch slices or diced into small dice-
size cubes and soaked in heated water (122 to 140° F) for two hours. The water
volume was 10 times more water than potatoes. Next, the potatoes were rinsed and
boiled in five times more water for five minutes. This method of soaking and then
boiling the potatoes reduced potassium from 400 milligrams per every 100 grams
(equal to 2/3 cup) of potatoes to 211 milligrams for cubes and 90 milligrams for
thinly sliced potato

34
II. STUDIES RELATED TO RENAL FUNCTION
Jerry Avorn MD (2005), done a study to quantify specific clinical
predictors of reduction in renal function in patients with CHF who are prescribed
angiotensin-converting enzyme inhibitor therapy. Randomized clinical trial used
to analyze data from the Studies of Left Ventricular Dysfunction (SOLVD), There
were 3379 patients randomly assigned to enalapril with a median follow-up of 974
days and 3379 patients randomly assigned to placebo with a mean follow-up of
967 days We used time-to-event analysis to identify potential predictors of
decrease in renal function including age, baseline ejection fraction, baseline
creatinine, low systolic blood pressure (<100 mm Hg), history of hypertension,
diabetes, and use of antiplatelet, diuretic, and β-blocker therapy. Patients
randomly assigned to enalapril had a 33% greater likelihood of decreased renal
function than controls (P = .003). By multivariate analysis, in both the placebo and
enalapril groups older age, diuretic therapy, and diabetes were associated with
decreased renal function, whereas β-blocker therapy and higher ejection fraction
were renoprotective. Older age was associated with a greater risk of developing
decreased renal function in both groups, but significantly more so in the enalapril
group (enalapril: risk ratio [RR] 1.42 per 10 years, 95% placebo: RR 1.18, 95%).
Diuretic therapy was likewise associated with a greater risk of decreased renal
function in the enalapril group (RR 1.89, 95% CI 1.70-2.08) than in the placebo
group (RR 1.35, 95% CI 1.09-1.66).. A lower risk of renal impairment was seen in

35
both groups with β-blocker therapy (RR 0.70, 95% CI 0.57-0.85) and higher
baseline ejection fraction (RR 0.93 per 5% increment, 95% CI 0.91-0.96).
Enalapril use caused a 33% increase in the risk of decreased renal function in
patients with CHF. Diuretic use and advanced age increased this risk. Diabetes
was associated with an increased risk of renal impairment in all patients with CHF,
but this risk was reduced in the enalapril group compared with the placebo group.
β-Blocker therapy and higher ejection fraction were renoprotective in all patients
regardless of therapy.
Andrew D, et.al, (2003), done a cohort study to measure GFR (e.g.,
iothalamate clearance), serum creatinine (SCr)-based GFR estimates, or creatinine
clearance as a determination for renal dysfunction among chronic renal disease.
234 patients with autosomal dominant polycystic kidney disease and baseline
creatinine clearance >70 ml/min were followed annually for four visits.
Iothalamate clearance, SCr, and creatinine clearance were obtained at each visit.
Estimated GFR (eGFR) was determined with the Modification of Diet in Renal
Disease (MDRD) and Cockcroft-Gault equations. Renal function slopes had a
mean residual SD of 10.7% by iothalamate clearance, 8.2% by MDRD equation,
7.7% by Cockcroft-Gault equation, and 14.8% by creatinine clearance. By each
method, a decline in renal function (lowest quintile slope) was compared among
baseline predictors. Hypertension was associated with a decline in iothalamate
clearance (odds ratio [OR] 5.8; 95% confidence interval [CI] 2.3 to 14), eGFR

36
(OR [MDRD] 2.0 [95% CI 1.0 to 4.2] or OR [Cockcroft-Gault] 1.9 [95% CI 0.9 to
3.9]), and creatinine clearance (OR 2.0; 95% CI 1.0 to 4.2). Each doubling of
kidney volume at baseline was associated with a decline in iothalamate clearance
(OR 2.4; 95% CI 1.5 to 3.7), eGFR (OR 1.7 [95% CI 1.1 to 2.6] or 2.1 [95% CI
1.4 to 3.3]), and creatinine clearance (OR 1.7; 95% CI 1.1 to 2.5). Predictor
associations were strongest with measured GFR. Misclassification from changes in
non-GFR factors (e.g., creatinine production, tubular secretion) conservatively
biased associations with eGFR. Misclassification from method imprecision
attenuated associations with creatinine clearance.
Hampton, MD (2003), studied whether renal function is a predictor for
mortality in advanced CHF, and we assessed its relative contribution compared
with other established risk factors. In addition, we studied the relation between
renal function and neurohormonal activation. The study population consisted of
1906 patients with CHF who were enrolled in a recent survival trial (Second
Prospective Randomized study of Ibopamine on Mortality and Efficacy). In a
subgroup of 372 patients, plasma neurohormones were determined. The baseline
glomerular filtration rate (GFRc) was calculated using the Cockroft Gault
equation. GFRc was the most powerful predictor of mortality; it was followed by
New York Heart Association functional class and the use of angiotensin-
converting enzyme inhibitors. Patients in the lowest quartile of GFRc values (<44
mL/min) had almost 3 times the risk of mortality (relative risk, 2.85; P<0.001) of
patients in the highest quartile (>76 mL/min). Impaired left ventricular ejection

37
fraction (LVEF) was only modestly predictive (P=0.053). GFRc was inversely
related with N-terminal atrial natriuretic peptide (ANP; r=-0.53) and, to a lesser
extent, with ANP itself (r=-0.35; bothP<0.001).Impaired renal function (GFRc) is
a stronger predictor of mortality than impaired cardiac function (LVEF and New
York Heart Association class) in advanced CHF, and it is associated with
increased levels of N-terminal ANP. Moreover, impaired renal function was not
related to LVEF, which suggests that factors other than reduced cardiac output are
causally involved.
Sara-Joan (2003), studied the relation between body weight and fat
distribution and microalbuminuria and elevated or diminished filtration in 7,676
subjects without diabetes. The total population was divided into six groups
according to body weight (overweight is defined as body mass index [BMI] > 25
and ≤ 30 kg/m2; obesity, as BMI > 30 kg/m2) and fat distribution.In logistic
regression analysis, obese subjects with central fat distribution had a greater risk
for microalbuminuria (relative risk, 1.7; 95% confidence interval, 1.19 to 2.35).
Obese subjects with either peripheral or central fat distribution had a greater risk
for elevated filtration (relative risk, 3.2; 95% confidence interval, 1.19 to 8.47;
relative risk, 2.6; 95% confidence interval, 1.59 to 4.28, respectively).
Furthermore, subjects with central fat distribution, either lean, overweight, or
obese, had a greater risk for diminished filtration (relative risk, 1.9; 95%
confidence interval, 1.19 to 3.12; relative risk, 2.0; 95% confidence interval, 1.19
to 3.19; and relative risk, 2.7; 95% confidence interval, 1.46 to 4.85, respectively).

38
Finally, by dividing waist-hip ratio (WHR) into quartiles, greater WHR was
associated with a greater risk for diminished filtration, even when corrected for
BMI. In conclusion not only overweight and obese subjects, but also lean subjects
with central fat distribution are at risk for diminished Renal Function,
Neurohormonal Activation, and Survival in Patients with Chronic Heart Failure.
Edward Franek (2002), performed a comprehensive study to compare
several aspects of renal function in four groups: (i) young healthy normotensive
subjects (N = 24; 13 males; mean age 26 3 years); (ii) elderly healthy
normotensive subjects (elderly NT; N = 29; 13 males; 68 7 years); (iii) elderly
treated and untreated hypertensive patients (elderly HT; N = 25; 13 males; 70 6
years); and (iv) elderly patients with compensated mild to moderate heart failure
(elderly HF; N = 14; 6 males; 69 6 years). Compared to young subjects mean
GFR (CIn) and ERPF (CPAH) were significantly lower in the elderly, despite similar
mean plasma creatinine levels (young, 121 11, 650 85 ml/min/1.73 m2; elderly
NT, 103 11, 486 102; elderly HT, 103 13, 427 55; elderly HF, 92 14,
377 103). Nevertheless, GFR was within the normal range in the majority of
elderly NT and HT, but not in elderly HF. In the elderly, mean PTH concentration
and urinary excretion of pyridoline cross-links were significantly higher and mean
25-(OH)D3, calcitriol and phosphate concentrations significantly lower; the
correlation between PTH and GFR was significant (r = -0.432, P < 0.001). The
results document that the decrease in renal hemodynamics with senescence is less

39
marked than suggested by some studies using less stringent methodology and
inclusion criteria. Comorbid conditions confound renal function in the elderly.
Age-associated changes in renal hemodynamics are accompanied by significant
alterations of renal hormones and of renal sodium handling.
Steven J. Hoorntje (2002), conducted a study to find relationship between
peritoneal transport characteristics as well as residual renal function outcome in
patients treated with continuous ambulatory peritoneal dialysis (CAPD). In the
present study, the relationship between fluid state [extracellular water (ECW)
(sodium bromide); total body water (TBW) (deuterium oxide)] with peritoneal
transport characteristics (2.27% glucose dialysate/plasma creatinine [D/P (creat)]
ratio), residual renal function (residual glomerular filtration rate [rGFR] by urine
collection) and C‐reactive protein (CRP) was assessed in 37 CAPD patients in a
cross‐sectional and longitudinal design, with 25 patients completing the study. In
the cross‐sectional part ECW, corrected for height (ECW:height), was inversely
related to rGFR ( r=−0.40, P=0.016), whereas during the longitudinal part,
D/P[creat] was related to the change in ECW (r=0.40, PNeither D/P[creat] nor
rGFR were related to CRP, whereas a significant relationship was observed
between ECW:height and CRP ( =0.05).r=0.58, P=0.0001). Patients were
dichotomized according to rGFR (<2 or >2�ml/min). Despite a higher daily
peritoneal glucose prescription (216.3±60.0 vs 156.5±53.0�g/24�h; P=0.004) and
peritoneal ultrafiltration volume (1856±644 vs 658±781�ml/24�h,

40
respectively;P=0.0001), the patients with a rGFR <2�ml/min showed a higher
ECW:height compared with the group with rGFR >2�ml/min
(12.5±3.8 vs 9.2±2.2�l/m, respectively; P=0.003). Fluid state was significantly
related to peritoneal transport characteristics and rGFR. The larger ECW:height in
CAPD patients with a negligible rGFR existed despite a higher peritoneal
ultrafiltration volume and higher peritoneal glucose prescription. These findings
raise doubts as to whether fluid state in CAPD patients with a diminished rGFR
can be adequately controlled on standard glucose solutions without an additional
sodium and fluid restriction. The preliminary finding of a relationship between
CRP and fluid state might suggest a relationship between overhydration and
inflammation.
Roberto Palla, et.al, (2002), studies have provided convincing evidence
that in apparently healthy subjects elevated serum levels of plasma C-reactive
protein (CRP) are associated with an increased risk of experiencing myocardial
infarction and sudden cardiac death. It has been claimed that, in dialytic patients,
the hepatic synthesis of this ‘acute phase response’ plasma protein is primarily
induced by the macrophage-derived interleukin 6 (IL-6). Little information is
available, however, regarding CRP and IL-6 plasma levels in pre-dialytic renal
failure. Plasma CRP by a modification of the laser nephelometry technique, IL-6
and serum albumin were determined in 103 chronic pre-dialytic patients (mean
age 50 ± 6.3 years; creatinine clearance (Cr.cl.) 36.3 ± 23.1 ml/min). CRP was >5
mg/l (normal upper range) in 42% of the global population. CRP and IL-6 were

41
significantly related (r = 0.35, p < 0.0004). CRP and IL-6 were related to renal
function (CRP vs. Cr.cl., r = –0.56, p < 0.0001; IL-6 vs. Cr.cl., r = –0.55, p <
0.0001, Spearman correlation coefficient). When patients were divided in tertiles
according to renal function, CRP median value resulted 7.9 mg/l (interquartile
interval: 5–12) in the first tertile (Cr.cl. <18.5 ml/min), 4.0 mg/l (3–6) in the
second tertile (Cr.cl. 18.5–45 ml/min) and 3.2 mg/l (2.7–4.0) in the last tertile
(Cr.cl. >45 ml/min) (p < 0.0001). A negative correlation between CRP and S-
albumin was also found.(r = –0.52, p < 0.0001, Spearman correlation
coefficient). IL-6 and CRP were increased and were inversely related to creatinine
clearance in our population of 103 chronic predialytic patients. The possibility of a
decreased renal clearance of CRP and/or cytokines as a cause of an activated
acute-phase response is discussed. A negative correlation between CRP and S-
albumin was found confirming the link between chronic inflammation and
malnutrition in chronic renal patients.
Mark J Sarnak (2002), did a cohort study to evaluate whether the level of
kidney function is an independent risk factor for CVD outcomes in the
Cardiovascular Health Study (CHS). Cox proportional-hazards regression was
used to evaluate the association of predicted glomerular filtration rate (GFR) with
CVD after adjustment for the major CVD risk factors.A total of 4893 subjects with
predicted GFR of 15 to 130 mL/min/1.73 m2 were included in the analysis. Fifty-
six percent were female and the mean age was 73.4 years. Of the subjects, 549

42
(11.2%) died and 1229 (25.1%) experienced CVD events in 5.05 years of follow-
up. Each 10 mL/min/1.73 m2 lower GFR was associated with an adjusted hazard
ratio for CVD, de novo CVD, recurrent CVD and all-cause mortality of 1.05 (1.02,
1.09), 1.07 (1.01, 1.12), 1.04 (0.99, 1.09), and 1.06 (1.00, 1.12), respectively.
There was no significant interaction between level of GFR and other traditional
CVD risk factors on CVD outcomes. A linear model best described the
relationship between GFR and CVD.The level of GFR is an independent risk
factor for CVD, de novo CVD, and all-cause mortality in the elderly.
Bergner A (2000), analyzed RRF in 45 patients with end-stage renal
disease (ESRD), commencing either CAPD or HD, to prospectively define the
time course of the decline in RRF, and to evaluate dialysis-technique-related
factors such as cardiovascular stability and bio incompatibility. Single-center
prospective investigation in parallel design with matched pairs. Fifteen patients
starting CAPD and 15 matched pairs of patients commencing HD were matched
according to cause of renal failure and RRF. Hemodialysis patients were assigned
to two dialyzer membranes differing markedly in their potential to activate
complement and cells (bioincompatibility). Fifteen patients were treated
exclusively with the cuprophane membrane (bioincompatible) and the other 15
patients received HD with the high-flux polysulfone membrane (biocompatible).
Residual renal function was determined at initiation of dialytic therapy and after 6,
12, and 24 months. Dry weight (by chest x ray and diameter of the vena cava) was

43
closely recorded throughout the study, and the number of hypotensive episodes
counted. Residual renal function declined in both CAPD and HD patients,
although this decline was faster in HD patients (2.8 mL/minute after 6 months and
3.7 mL/min after 12 months) than in CAPD patients (0.6 mL/min and 1.4 mL/min
after 6 and 12 months respectively). It declined faster in patients with
bioincompatible than with biocompatible HD membranes (3.6 mL/min vs 1.9
mL/min after 6 months). Eleven percent of the HD sessions were complicated by
clinically relevant blood pressure reductions, but there were no differences
between the two dialyzer membrane groups. None of the CAPD patients had
documented hypotensive episodes. The better preservation of RRF in stable CAPD
patients corresponded with greater cardiovascular stability compared to HD
patients, independently of the membrane used. Furthermore, there was a
significantly higher preservation of RRF in HD patients on polysulfone versus
cuprophane membranes, indicating an additional effect of biocompatibility, such
as less generation of nephrotoxic substances by the membrane. Thus, starting
ESRD patients on HD prior to elective CAPD should be avoided for better
preservation of RRF.
Joanne Marshall, RN (2000), studied to identify a population at high risk
of renal dysfunction with conventional treatment, we selected patients with a
creatinine level increased from baseline (within 6 months). We examined the
effects of nesiritide on GFR (measured by iothalamate clearance), renal plasma

44
flow (measured by para-amino hippurate clearance), urinary sodium excretion, and
urine output in a double-blind, placebo-controlled, crossover study. Patients
received nesiritide (2 μg/kg IV bolus followed by an infusion of 0.01 μg/kg per
minute) or placebo for 24 hours on consecutive days. Nesiritide and placebo data
were compared by repeated-measures analysis and Student t test. We studied 15
patients with a recent mean baseline creatinine of 1.5±0.4 mg/dL and serum
creatinine of 1.8±0.8 mg/dL on admission to the study. There were no differences
in GFR, effective renal plasma flow, urine output, or sodium excretion for any
time interval or for the entire 24-hour period between the nesiritide and placebo
study days. For 24 hours, urine output was 113±51 mL/h with placebo and 110±56
mL/h with nesiritide. GFR during placebo was 40.9±25.9 mL/min and with
nesiritide was 40.9±25.8. Nesiritide did not improve renal function in patients with
decompensated heart failure, mild chronic renal insufficiency, and renal function
that had worsened compared with baseline. The lack of effect may be related to
renal insufficiency, hemodynamic alterations, sodium balance, severity of heart
failure, or drug dose. Understanding the importance of these issues will permit
effective and appropriate use of nesiritide.
Anderson RG, (1999) retrospectively examined the effect of nephrectomy
on renal function in 55 living related donors. Renal function was measured with
131iodine-orthoiodohippurate scans. All patients were studied pre operatively, and
1 week and 1 year postoperatively. In 20 patients 10-year follow up was available.

45
Compensatory hypertrophy was complete 1 week postoperatively: effective renal
plasma flow of the remaining kidney was 32.5% higher than preoperatively. The
increase remained stable for at least a year. The degree of compensatory
hypertrophy was significantly greater in male patients (46.9% after 1 week) than
in female patients (26.7%). Compensatory hypertrophy occurred in all age groups
studied and it was most pronounced in patients less than 30 years old. In the
patients followed for 10 years effective renal plasma flow decreased from 387.7
ml. per minute 1 week after nephrectomy to 367.4 ml. per minute at 10 years. This
result is similar to the decrease seen in the normal population. According to our
results, renal donation by living related persons does not lead to long-term
decrease in renal function
Farrell PC (1991), conducted a retrospective investigation was undertaken
in which the rate of decline of residual renal function (RRF), estimated
from creatinine clearance, was compared in 55 continuous ambulatory peritoneal
dialysis (CAPD) and 57 hemodialysis (HD) patients for whom a minimum of four
(mean of 7.6) well-spaced historic measurements of residual clearance were
available. Residual function was found to decline exponentially after the onset of
therapy in both cohorts. The rate of decline in the HD group was twice that of the
CAPD group (5.8% +/- 0.4% per month for HD vs 2.9% +/- 0.3% per month for
CAPD; difference significant at p less than 0.0001). This difference remained
highly significant (p less than 0.01) when corrected for other potential risk factors
46
such as age, gender, hypertensive status, and use of angiotensin converting
enzyme inhibitors in patients with diabetic or other forms of
glomerular nephropathy. Differences between cohorts were not significant for
patients with other diagnoses (p greater than 0.1) although the size of some of
these subsets was very small. The physiologic mechanism for the more rapid fall-
off of RRF on HD remains speculative, but could be related to renal
ischemia secondary to intra treatment hypovolemia and/or to nephrotoxic effects
of the inflammatory mediators of extracorporeal circulation.
III. STUDIES RELATED DIETARY MANAGEMENT OTHER THAN
LEACHED POTATO AMONG PATIENTS WITH CHRONIC RENAL
FAILURE
Sharon Turban, MD (2011), conducted a randomized study to look at the
benefits and safety of two levels of potassium intake in patients with kidney
disease and expect that a higher level of potassium intake safely lowers blood
pressure compared to a lower level of potassium intake. there is great uncertainty
about the optimal K intake in CKD patients. K is often restricted in these patients
due to concerns about elevating serum K. However, renal K excretion does not
appear to be substantially impaired until the glomerular filtration rate (GFR) is
severely decreased (< 10-20 mL/min/1.73 m2). In this randomized feeding study
with a two-period crossover design, the benefits and safety of 4 weeks of 100
mmol versus 40 mmol K/day in 26 non-diabetic adults with stage 3 CKD

47
(estimated GFR 30-59 mL/min/1.73 m2) was evaluated. After a one-week run-in
period, all participants received either a diet containing either 40 mmol K/day or
100 mmol K/day. Students ‘t’ test reveals the significance of potassium in
lowering blood pressure among patients with chronic renal failure,(P< 0.05).
Amato D (2005), done a study to test the effect of zinc supplementation on
the nutritional status of patients on continuous ambulatory peritoneal dialysis
(CAPD). Double-blinded randomized controlled clinical trial. Twenty-five
patients with end stage renal disease (ESRD) on CAPD program, from 16 to 60
years old were studied. Two weeks before the beginning of the study all the drugs
with a known effect on zinc absorption were withdrawn. Patients were randomly
allocated into one of two groups. The control group consisted of 12 patients
receiving placebo, and the intervention group of 13 patients receiving 100 mg/day
of elemental zinc for 3 months. The diet was individually adjusted to 35
kcal/kg/day, and 1.5 g/day of proteins. Subjective global assessment (SGA),
anthropometric measurements, electric bioimpedanciometry, measurements of
albumin, prealbumin, and transferrin, and evaluation of energy, proteins,
carbohydrates, and lipids consumption were done to classify the nutritional status
at the beginning and at the end of the study. Therapeutic compliance was assessed
by measuring plasma zinc levels and by capsule counting. There were no
statistically significant differences between groups regarding age, gender, time on
CAPD, and ESRD causes. The proportion of patients classified as well nourished,

48
or with mild or moderate malnutrition by SGA did not show significant
differences between the group receiving Zn supplementation and the group
receiving placebo. Anthropometric measurements and body composition assessed
by bioelectric impedance were similar in the two groups. In the control group,
serum levels of albumin (3,621 +/- 838 vs. 3,068 +/- 842 mg/dL), prealbumin (49
+/- 14 vs. 44 +/- 12 mg/dL), and transferrin (238 +/- 94 vs. 195 +/- 79 mg/dL)
decreased significantly at the end of the follow-up period respect to the baseline
values (p < 0.05). In the intervention group albumin (3,320 +/- 910 vs. 2,696 +/-
964 mg/dL), prealbumin (43 +/- 9 vs. 38 +/- 8 mg/dL), and transferrin (236 +/- 99
vs. 193 +/- 66 mg/dL) also decreased significantly (p < 0.05). In the control group
baseline zinc level was low (60 +/- 5 micrograms/dL) and remained stable along
the follow-up period, while in the intervention group it increased from 52 +/- 5
(baseline) to 92 +/- 9 micrograms/dL (end of the follow-up, p < 0.05). Zinc
supplementation did not improve the nutritional status in patients on CAPD.
Salahudeen AK (2004), conducted a study to examine the effects of
dietary protein restriction in patients with chronic rejection. Fourteen patients with
biopsy proven chronic rejection, who had been on a self-selected home diet of 1.0
+/- 0.1 g protein/kg/day, were randomly assigned, using a crossover design to two
11-day periods, one on a low protein diet (0.55 g/kg/day) and the other on a high
protein diet (2 g/kg/day). The effect of these diets on renal hemodynamics,
proteinuria, plasma renin activity, and nutritional status was examined. The low
49
protein diet was associated with a significant improvement in glomerular
permselectivity in all patients as evidenced by a significant fall in the fractional
clearance of albumin and IgG and reduction in 24-hour urinary excretion of total
protein, albumin and IgG without any change in blood pressure, glomerular
filtration rate, or renal plasma flow. Compared to the proteinuria at the beginning
of each diet, a high protein diet did not increase but a low protein diet significantly
decreased the proteinuria. The low protein diet was also associated with a
significant reduction in plasma renin activity, suggesting that part of the beneficial
effect of protein restriction was related to the suppression of the renin-angiotensin
system.
Milovanova LIu (2004), studied to assess the rate and clinical significance
of impaired nutritional status and impact of low-protein diet on inhibition of renal
insufficiency in patients of stage III-IV chronic disease of the kidneys (CDK). A
total of 200 patients with CDK stage III-IV were randomized into three groups:
group 1 consisted of 123 patients with chronic glomerulonephritis (73 with stage
III and 50 with stage 1V), group 2--45 patients with systemic diseases (30 with
stage III and 15 with stage IV), group 3 (a comparison group)--32 patients with
CGN (17 with stage 111 and 15 with stage IV). Patients of groups 1 and 2
received low-protein diet (0.6 g protein kg/day) balanced by either high-calorie
mix containing protein SUPRO 760 or ketosteril for 24-48 months. The nutritional
status was studied by anthropometric data, absolute number of lymphocytes, levels

50
of blood albumin and transferring, intake of protein, food calorie value according
to 3-day diaries. Among 200 patients impaired nutritional status was detected in
22 (11.0%) patients. More than half of them had glomerulonephritis in systemic
diseases (SLE, systemic vasculitis). Only in patients with systemic diseases
nutritional disorders manifested at stage III. These disorders grew with
progression of renal insufficiency and were detected primarily in patients with
stage IV CDK. Patients with CGN on low-protein diet for a year and longer
demonstrated slowing of the fall of the glomerular filtration rate (GFR). Early
(predialysis) use of low-protein diet balanced by addition of amino- and keto-acids
and high-energy nutritional mixes has a positive influence on nutritional status of
patients with chronic renal insufficiency and can inhibit GFR lowering.
Jauregui Ontiveros B (2003), studied 12 patients treated during a year
with weekly intermittent dialysis whit a rigid catheter for 36 hours a week.
Patients were on a diet of 50 g. of proteins a day, normocaloric without sodium or
fluid restriction. They received supplementation whith iron, calcium, vitamins B,
C and folic acid, anabolic hormonal and, in some cases, furosemide hypotensives
and antibiotics. Patients received the procedure for a mean of 8 months. The
results show the following mean values: blood pressure: 143 +/- 12/99 +/- 3 mm.
Hg., plasma urea 208 +/- 62 ng./dl.; creatinine 21 +/- 2 mg./dl., hematocrit 25 mm.
and 8.0 g. hemoglobin. There was light increase of glucose, K, P, Mg, alkaline
phosphatase. Na, CO2, proteins cholesterol, albumin and Ca keep in normal
51
values. Nine patients passed to hemodialysis after a mean period of nine months
and three of them received a kidney transplant. Three are still in peritoneal
dialysis, one of them for 18 months. We compared our results with a similar group
of patients who were treated with non-regular peritoneal dialysis. Our group had
less cardiovascular complaints, or infections and keep more adequate body weight,
and also got more survival in better conditions with less days in hospital, they
received less blood transfusion. We concluded that weekly peritoneal dialysis is an
alternative method of treatment in uremic patients for longer period of time even
though frequently Paracentesis.
Lysenko LV (2003), studied to evaluate the effects of low-protein diet
(LPD) balanced by addition of highly energetic mix and essential keto/amino acids
on inhibition of renal failure in patients with systemic diseases with predialysis
stages of chronic disease of the kidney (CDK).Forty six patients with stage III--IV
of CDK in systemic diseases (33 SLE patients and 13 with systemic vasculitis)
were randomized into three groups. Group 1 consisted of 18 patients with CDK
(10 with stage III and 8 with stage IV). They received LPD (0.6 g/kg/day) with
addition of essential keto/amino acids for 24-48 months. Group 2 of 18 CDK
patients with the same stages received the same diet but greater amount of
vegetable protein (highly purified soya protein) to 0.3 g/kg/day in highly energetic
nutrient mixture. Group 3--10 CDK patients (7 with stage III and 3 with stage IV)
received free diet. Group 1 and 2 patients received LPD irrespective of the nutrient

52
status assessed basing on anthropometric and other data. Protein consumption and
caloric value were estimated by 3-day food diary.Before diet therapy, out of 46
examinees nutrient status was abnormal in 45.7% patients. Both variants of LPD
were well tolerated and nutrient status was corrected while the rate of nutritive
disorders in group 3 increased 1.5-fold (from 40 to 60%) with progression of renal
failure. Intake of LPD diet for at least a year reduced glomerular filtration rate
inhibition, especially in addition of highly energetic mixture.Early (predialysis)
restriction of diet protein (0.6 g/kg/day) with addition of highly energetic mixture
and essential keto/amino acids improves a nutritive status of CDK patients and
inhibits GFR decline.
Lee SH (2002), did a cross-sectional study to examine dietary and fluid
compliance behaviors in Chinese hemodialysis (HD) patients in Hong Kong and
identified variables related to compliance. Sixty-two chronic HD patients
participated and information was obtained about their knowledge of dietary and
fluid restrictions related to dialysis, health beliefs, personal and medical
characteristics, and self-reported compliance. In addition, serum levels of
potassium (K) and phosphate (PO(4)) and interdialytic daily weight gain were
retrieved from the medical records. Dietary and fluid compliance was observed in
only 35.5% and 40.3% of the patients, respectively. No direct relationship was
observed between dietary knowledge and any compliance measures.. Residual
urine output volume was positively correlated with the level of fluid compliance.
53
Patients with more hours on HD per week were found to be more fluid
noncompliant. Working patients and those whose diet was prepared by someone
else in the family were also more likely to be noncompliant. Health professionals
should be aware of the factors behind noncompliance in HD patients and assist
them in making life-style changes. Patient education with family involvement,
identification of at-risk patients for noncompliance and assisting patients to
identify and manage difficulties with life-style changes related to HD are
important elements in promoting compliance.
Bustamante J (2000), concluded Patients with kidney failure are a high
nutritional risk group. Patients with acute kidney failure need and energy intake of
30-40 kcal/kg and a protein intake of 0,8-1 g/kg of ideal weight, that it is increased
with glomerular filtration improvement. Potassium must be limited to 30-50
mEq/day and sodium to 20-40 mEq/day in oliguric phase, and must be replaced
the losses in diuretic phase. Specific recommendations have been designed to
some nutrients. A diet with 0.75-1 g/kg/day of proteins must be recommended in
patients with chronic kidney failure (CDF). Low protein diets (<0.6 g/kg/day) are
not justified, due to a possible malnutrition might be developed (A). In patients
with haemodialysis, energy requirements are 35 Kcal/kg/day. Protein
recommendations are 1.2-1.4 g/Kg/day. Water recommendations depend of
residual diuresis. 500-800 ml must be added to residual diuresis. Sodium must
limited to 60-100 meq/day, with a depth reduction of water and sodium in anuric

54
patients. Potassium must be under 1 meq/kg/day. Patients with peritoneal dialysis
had different dietary recommendations. Protein recommendations are higher than
previous (1.5 g/Kg/day). Energy recommendations from carbohydrates must be
included glucose of dialyser liquid (60% of total amount). Diet has low restrictions
due to the daily sessions of peritoneal dialysis, for example potassium intakes can
reach 2000-3000 mg/day. Hidrosoluble vitamin losses are lower than patients with
haemodialysis.
Priasca G (2000), conducted a study to analyze the possibility of applying
a once-a-week dialysis programme supplemented with hypoproteic diet as an
adequate technique for starting the uraemic patient on dialysis is examined.
Thirteen patients have been so treated, 7 of them currently under treatment for a
global period of observation of 46 months. At the moment dialysis began, mean
glomerular filtrate was 5.14 ml/min. Once-a-week dialytic treatment with
bicarbonate dialysis was associated with a hypoproteic diet of 0.5 g/kg/die of
proteins, supplemented with essential amino acids. This treatment showed
excellent dialytic tolerance, the values of dialysis start blood nitrogen were lower
than 200 mg/dl and dialytic efficiency was compatible with a Kt/v greater than
1.1. There was no observation of any subjective or objective symptomatology that
could be related to dialytic inadequacy. Taken as a whole these results make it
possible to state that this type of approach permits a gradual start to dialysis and
deserves further study.

55
Rosman JB (1984), conducted a prospective randomized trial has been in
progress since April, 1982. In 1984, we reported a general beneficial effect of o
diet after two years of follow-up. 248 patients with initial creatinine clearances
between 10 and 60 ml/min entered the trial. Patients were stratified for sex, age
and degree of renal insufficiency. 129 patients were randomly assigned to a DPR-
group (0.4 to 0.6 g/kg/day); 118 patients to a control group. Patients on DPR
visited the dietitian every three months during the first 24 months of the study;
thereafter, as with the controls, the dietitian visits were only for specific needs.
Urea excretion decreased significantly in DPR patients as a sign of good
compliance and stayed at that level, even without frequent visits to the dietitian.
Biochemical parameters showed no signs of malnutrition. Amino acid profiles
were related to the degree of renal failure. The diet appeared to have a selective
effect on the progression rate of renal failure: only patients with primary
glomerular disease responded to the diet.
IV. STUDIES RELATED TO LEACHED POTATO ON
RENAL FUNCTION AMONG PATIETNS WITH CHRONIC
RENAL FAILURE
Anderson J B (1997), In an effort to increase variety, flexibility and compliance
to the nutritional protocols for dialysis patients, this study investigated ways to
optimize leaching of potassium from fresh potatoes. Potatoes were processed in a

56
variety of methods including size of slices, duration of soaking, temperature of
soaking, agitation while soaking, volume of water, addition of leaching agents,
and cooking methods. Agitation, temperature of soaking water and addition of
leaching agents did not significantly increase the amount of potassium that was
leached out. Maximal loss of potassium was achieved when 4mm sliced potatoes
were pressure cooked for 7minutes in a volume of water ten times that of the
volume of the potatoes. The potassium content of raw, boiled, microwaved and
pressure cooked potatoes per 100 gram serving were: 380(±54) mg, 76(±7) mg,
46(±5) mg, 29(±6) mg respectively. Raw potatoes contained 380(±54) mg of
potassium per 100 gram serving. The pressure cooked potatoes contained 29(±6)
mg of potassium per 100 gram serving. Sensory analysis of the products was
conducted on 92 hemodialysis subjects at three dialysis centers. Overall
acceptability of reduced potassium potatoes was found to be excellent. It is
optimal household methods for reducing potassium content of potatoes for dialysis
patients.

57
CHAPTER - III
RESEARCH METHODOLOGY
Research methodology is a significant part of any study which enables the
researcher to project the research undertaken. Research methodology is the
systemic way to carry out an academic study. The methodology enables the
research to project a blue print of the details, data, approach; analysis and findings
of research undertaken, (Abdulah, 1979).
The present study was conducted to evaluate the role of leached potato on
renal function among patients with chronic renal failure.
This chapter includes research approach, research design, setting of the
study, variables, population, sample, sample size, sampling techniques, criteria for
the sample selection, developing and description of tool, data collection procedure,
plan for data analysis and interpretation of the data.
RESEARCH APPROACH
Research approach is the most essential part of any research. The entire
study is based on it. The research approach used in the study is an applied form of
research to find out how well the intervention is effective. In this study, the

58
effectiveness of leached potato on renal function was evaluated. Therefore an
evaluation approach was essential to test the effectiveness of the intervention.
RESEARCH DESIGN
Research design incorporates the most imported methodological decisions
that a researcher makes in conducting a research study. It depicts the overall plan
for organization of scientific investigations. It helps the researcher in the selection
of subjects, manipulation of independent variables and observation of a type of
statistical method to be used to interpret the data. The selection of the design
depends upon the purpose of the study, research approach and variables to be
studied. (Polit and Hungler, 2003).
The research design used for the present study was quasi experimental
design where one group pre and posttest with control group design was selected to
evaluate the effectiveness of leached potato on renal function among patients with
chronic renal failure.

59
Fig 3.1 Diagrammatic Representation of the Research Design
Purposively selected Patients
renal failure
Pretest Intervention Posttest
Experimental group O1 X O2
Control Group O3 - O4
The symbols used are,
O1-Pretest on renal function among patients with chronic renal failure in experimental
group.
X- Leached potato
O2- Posttest on renal function among patients with chronic renal failure in experimental
group.
O3-Pretest on renal function among patients with chronic renal failure in control group.
O4-Posttest on renal function among patients with chronic renal failure in control
group.

60
SETTING OF THE STUDY
Research settings are specific places in a research where data collection is
to be made. The selection of setting was done on the basis of the feasibility of
conducting the study, availability of subject and permission of authorities, (Polit
and Hungler, 2003).
Setting for the present study is Nallaswamy Kidney Centre, Erode, which
is 25kms away from Dhanvantri College of nursing.
This hospital is 100 bedded and has a separate dialysis unit where 35-40
dialyses are performed per day. The total patients who undergo dialysis are around
45-50 per month which includes both outpatients and inpatients. The total number
of inpatient dialysis is about 10-15 per month and the rest accounts for outpatients.
VARIABLES
Variables are characters that can have more than one value. The categories
of variables discussed in the present study are,
Independent Variable
According to Polit and Hungler (1999), the variable that is believed to
care or influence the behaviour and ideas.
In this present study, the independent variable refers to leached potato

61
Dependent Variable
According to Polit and Hungler (1999), the dependent variable is the
researcher is interested in understanding, explaining, and proceeding.
In this present study, the dependent variable refers to renal function.
POPULATION
Population refers to the entire aggregation of cases that meets the design
criteria, (Polit and Beck, 2002)
The population for the present study was patients with chronic renal
failures present during the period of data collection.
SAMPLE
A sample is the portion of the population that has been selected to represent
the population of interest , (Talbott, 1991).
The sample for the present study was patients with chronic renal failure,
who are outpatient in Nallaswamy Kidney Centre, Erode, willing to participate
and present during the period of data collection.

62
SAMPLE SIZE
Sample size is normally decided by nature of the study, nature of the
population, type of sampling technique, total variable, statistical test adopted for
data analysis and sensitivity measures and attrition, (Polit and Beck, 2001)
The total sample size was 30 patients with chronic renal failure, out of
which 15 were control group and 15 were experimental group.

63
FIG: 3.2 SCHEMATIC REPRESENTATION OF RESEARCH
METHODOLOGY
Target Population
Patients with chronic renal failure
Accessible Population
Patients with chronic renal failure at Nallaswamy Kidney Centre, Erode
Setting
Nallaswamy Kidney Centre, Erode
Sampling Technique
Purposive Sampling
Control Group Renal parameter assessment scale
Experimental Group
Leached potato demonstration
Analysis and Interpretation
Descriptive: Mean, SD, Mean Percentage
Inferential: Paired’t’test, unpaired ‘t’ test and Chi-square Test
Results
Dissertation
Pretest Pretest
Posttest Posttest

64
SAMPLING TECHNIQUE
Sampling is the process of selecting a portion of the population who
represent the entire population, (Polit and Beck, 2001).
In this present study, Purposive sampling technique was used to select all
patients with chronic renal failure in a Nallaswamy Kidney Centre, Erode and was
outpatients during the period of data collection.
Purposive sampling means selection of samples by choice, not by chance.
(Basvanthappa. B.T, 2007)
SAMPLING CRITERIA
⇒ Inclusion Criteria
Patients with Chronic Renal Failure
1. Who are under age group of 20-60 years.
2. Both gender
3. 3rd and 4th stage of chronic kidney disease
4. Who are willing to participate in the study
5. Who are present during the period of data collection

65
6. Who are only outpatients in Nallaswamy Kidney Centre,
Erode.
⇒ Exclusion Criteria
Patients with Chronic Renal Failure
1. Type 1 diabetes mellitus
2. Who are allergic to potato
3. Who dislikes potato
4. Who are not consistent with the intervention.
DEVELOPMENT OF THE TOOL
There are 2 sections of tools are used. They are;
SECTION A
It consists of demographic characteristics of patients with chronic renal
failure, i.e;
1. Age in years
2. Gender
3. Educational status
66
4. Marital status
5. Food habits
6. Duration of illness(months)
7. Period of dialysis procedure (months)
8. Causes of illness.
SECTION B
This consists of renal function parameter assessment scale. It consists of seven
parameters like urinary output in 24 hours, systolic BP, diastolic BP, weight loss,
potassium, creatinine, edema.

67
RENAL FUNCTION PARAMETER ASSESSMENT SCALE.
SCORES
RENAL FUNCTION PARAMETER
1 2 3 4
URINARY OUTPUT IN 24 HRS
BELOW 300 301-500 501-700 ABOVE 700
SYSTOLIC BLOOD PRESURE
>180 160-179 140-159 <140
DIASTOLIC BLOOD PRESSURE
>110 110-101 100-109 <90
WEIGHT LOSS IN Kg
<2 2-3.9 4-5.9 >6
SERUM POATSSIUM
>11 11-9 8.9-6.9 >5
SERUM CREATININE
>7 7-6.6 6.5-6.1 >6
EDEMA
+4 +3 +2 +1

68
SCORING PROCEDURE
Based on the percentage of scores the level of renal function was graded in
3 categories. They are “Highly impaired”, “Moderately impaired” and “Mildly
impaired”.
Table 3:1 Level of renal function based on percentage of scores
VALIDITY
The content validity of demographic variables and assessment tool for renal
function parameter assessment scale was validated in consultation with guides and
experts. The experts were nursing personnel’s, Nephrologists, Dietician and
statisticians. The tool was modified according to the suggestions and
recommendations of the experts, (Appendix III)
Level of renal function Actual Score Percentage (%)
Highly impaired 7 – 14 25 - 50%
Moderately impaired 15 – 21 51 - 75%
Mildly impaired 22 – 28 76 - 100 %

69
RELIABILITY
The reliability of the renal function parameter assessment scale was tested
by implementing the tool on patients with chronic renal failure who are outpatients
in dialysis unit in Government Head Quarters Hospital, Erode, which is other than
the sample area. Split Half method (Spearman Brown man formula) was used to
test the reliability of the tool and the tool was found to be reliable. (r1= 0.75)
DATA COLLECTION PROCEDURE
Data collection is the gathering of the information to address the research
problem. The word “data” means information i.e. systematically collected in the
course of study.
Talbott (1995) refers data collection as gathering of information from the
sampling unit. The researcher plan typically specifies procedures for actual
collection of data. The researcher must be sure that enough material is available to
complete the study that the participants are informed that the schedules do not
conflict.
Permission from the concerned authority
Prior to the collection of the data, permission was obtained from the
Administrative Officer of Nallaswamy Kidney Centre, Erode, (Appendix-II)

70
Period of data collection
The data was collected from 15.08.2011 to 15.09.2011. The investigator
collected the data from both experimental and control group. The first 15 patients
with chronic renal failure was experimental group whereas the next 15 patients
with chronic renal failure were control group. The reason for selecting samples
like this is to avoid the contamination of the samples in experimental group with
control group.
Pretest
Pretest was conducted on patients with chronic renal failure in the dialysis
unit by using renal function parameter assessment scale to assess the level of renal
function. In an average daily 8 patients were assessed.
Implementation of leached potato
Immediately after pretest, Leached potato cooking demonstration was done
on the first day of visit. The cooking demonstration was shown only once for 10
minutes. The patients are advised to take 100mg of leached potato for six days in a
week. The patient’s consistency with intervention is tracked and confirmed by
making phone calls and diary system.

71
Posttest / Evaluation of leached potato.
Posttest was conducted at the end of the sixth day of intervention using
renal function parameter assessment scale among patients with chronic renal
failure.
PLAN FOR DATA ANALYSIS
The level of renal function among patients with chronic renal failure in
experimental and control group of patients before and after leached potato was
analyzed by using frequency and percentage.
The changes in renal function among patients with chronic renal failure in
experimental and control group after leached potato was analyzed by using
mean, standard deviation, mean percentage, pair ‘t’ test and unpaired
‘t’test.
The association between posttest scores of renal function among experimental
group and control group of patients with chronic renal failure with their
demographic variables was analyzed by using chi-square test.

72
SUMMARY
A quasi-experimental design was carried on 30 patients with chronic renal
failure admitted in Nallaswamy Kidney Centre, Erode by using purposive
sampling technique. The renal function parameter assessment scale was used to
assess the level of renal function among patients with chronic renal failure.
The data were collected after obtaining permission from the administrative
officer of Nallaswamy Kidney Centre, Erode. Data were planned to analysis by
using descriptive and inferential statistics and to be presented in the form of
table, figures and graphs.
73
CHAPTER –IV
DATA ANALYSIS AND INTERPRETATION
Analysis is a “process of organizing and synthesizing data in such a way
that research questions can be answered and hypothesis tested”, (Polit and
Hungler, 2003).
Analysis enables the researcher to reduce, summarize, organize, evaluate,
interpret and communicate numerical information, (Polit and Hungler, 2003).
This chapter deals with the analysis and interpretation of data collected
from 30 (15 control group and 15 experimental group) patients with chronic renal
failure by using purposive sampling technique from Nallaswamy Kidney Centre,
“to evaluate the role of leached potato on renal function.
The data were coded and analyzed as per objectives of the study under the
following headings;
1. Section A: Description of samples characteristics.

74
2. Section B: Assess the level of renal function among control and
experimental group of patients with chronic renal failure before and after
leached potato.
Frequency and percentage distribution of the control group pre and
posttest scores of renal function among patients with chronic renal
failure.
Frequency and percentage distribution of the experimental group pre
and posttest scores of renal function among patients with chronic renal
failure.
Frequency and percentage distribution of posttest scores of renal
function among patients with chronic renal failure in control and
experimental group.
3. Section C: Determine the changes in renal function among patients with
chronic renal failure in experimental and control group after leached potato.
• Paired ‘t’ test value of pre and posttest scores of experimental
group.
• Area wise comparison of mean, SD, and mean percentage of
control group and experimental group pre and posttest scores
• Unpaired‘t’ test value of pre and posttest scores of control group.

75
• Unpaired ‘t’ test value of pre and posttest scores of experimental
group.
• Area wise comparison of mean, SD and mean percentage of
control and experimental group posttest scores.
4. Section D: Find out the association between posttest scores of renal
function among control and experimental group of patients with chronic renal
failure with their demographic variables.
• Chi-square value of association between control group posttest scores
with their demographic variables.
• Chi-square value of association between experimental group posttest
scores with their demographic variables.

76
SECTION-A
DESCRIPTION OF SAMPLES CHARACTERISTICS
Table-4.1 Frequency and percentage distribution of control and experimental
groups of patients with chronic renal failure according to their demographic
variables (N1 = 15, N2 = 15)
Demographic variables
Control group Experimental group
Frequency(N1)
Percentage(%)
Frequency (N2)
Percentage(%)
1.Age in years a) 20-40 years b) 40-60 years c) Above 60 years
7 7 1
47 47 6
4 8 3
27 53 20
2. Gender a) Male b) Female
11 4
73 27
9 6
60 40
3. Educational status a) No primary education b) Primary c) Higher secondary d) Degree
2 0 6 7
13 0 40 47
0 1 4
10
0 6 27 67

77
4. Marital status a) Unmarried b) Married c) Widow (or) widower
1
13 1
6 87 7
2
11 2
13 73 13
5. Food habits a) Vegetarian b) Non- vegetarian c) Mixed.
2 0
13
13 0 87
2 0
13
13 0 87
6. Duration of illness(in years)
a) 1-2
b) 2-3
c) 3-4
d) above 4
1
5
8
1
7
33
53
7
0
2
4
9
0
13
27
60
7. Period of dialysis(in years)
a) 1-3
b) 3-5
c) 5-7
d) Above 7
3
9
3
0
20
60
20
0
1
10
4
0
6
67
27
0
8. Cause of illness
a) Nephrotoxicity
b) Drug toxicity
c) Diabetes mellitus
d) Hypertension
e) Others
11
0
2
2
0
74
0
13
13
0
9
0
3
3
0
60
0
20
20
0
Table 4.1 Reveals the frequency and percentage distribution of patients with
chronic renal failure according to their demographic variables.

78
Distribution of control and experimental group samples according to their
age group depicts that the highest percentage (47% and 53%) of patients were in
the age group of 41-60 years in both the groups however 47% and27% of patients
with from each group were in the age group of 20-40years and only 6% and 20%
of patients from each group were in the age group of above60 years. (Fig:4.1).
Distribution of control and experimental group samples according to gender
reveals that most (73% and 60%) of patients were male in both the groups and
only 27% and 40% of patients were female in both the groups. It might be
associated that males are affected more than the females. (Fig:4.2).
Distribution of control and experimental group samples according to their
educational status reveals that highest percentages (47% and 67%) of the patients
were degree holder in both the groups, 40% and 27% of patients had higher
secondary education in both the groups, 6% of patients in experimental group had
primary education and 13% of patients with chronic renal failure in control group
had no formal education. It might be the place of study.(Fig:4.3).
Distribution of control and experimental group samples according to their
marital status reveals that most (87% and 73%) of the patients from both the
groups were married. However similar percentages (13%,13%, 7% and 7%) of the
patients in both the groups were unmarried and widowed respectively (Fig.4.4).

79
Distribution of control and experimental samples groups according to their
food habits reveals that highest similar percentages (87%) of patients from both
group had mixed food habits and similar percentage (13%) of patients from both
group were vegetarian. (Fig.4.5).
Distribution of control and experimental group according to the duration of
illness in years depicts that the highest percentage (53% and 27%) of patients from
both groups had 3-4 years of illness. However higher percentages (33% and 13%)
of patients from both group had 2-3 years of illness, whereas only 7% of patient
from control group and 60% of patient from experimental group had above 4
years of illness. It might be associated that most of them had 3-4 years duration of
illness. (Fig.4.6).
Distribution of control and experimental group according to their period of
illness reveals that the highest percentage (60% and 67%) of patients had dialysis
for 3-5 years in both the groups. However higher percentage( 20% and 27% )of
patients had dialysis for 5-7 years in both the group and only 20% and 6% of
patients had 1-3 years period of dialysis. (Fig.4.7).
Distribution of control and experimental group according to their causes of
illness depicts that the highest percentage (74% and 60%) of patients had illness
due to Nephrotoxicity. However similar percentage (20%,20%,13%, and 13%) of
patients in both the groups had illness due to diabetic mellitus and hypertension
respectively.(Fig.4.8)

80
Fig.4.1 Bar diagram shows the percentage distribution of patients according to their age group.
47 47
6
27
53
20
0
10
20
30
40
50
60
70
80
90
100
20-40 YEARS 40-60 YEARS ABOVE 60 YEARS
Perc
enta
ge O
f Pat
ient
s With
Chr
onic
Ren
al
Failu
re
Age In Years
CONTROL GROUP
EXPERIMENTAL GROUP

F
Fig.4.2 Bar di
0
10
20
30
40
50
60
70
80
90
100
Perc
enta
ge o
f pat
ient
s with
chr
onic
ren
al fa
ilure
agram shows
73
the percentag
60
MALE
ge distribution
gender
n of patients a
27
FE
according to th
40
EMALE
heir gender.
C
EX
ONTROL GROUP
XPERIMENTAL GRO
81
OUP
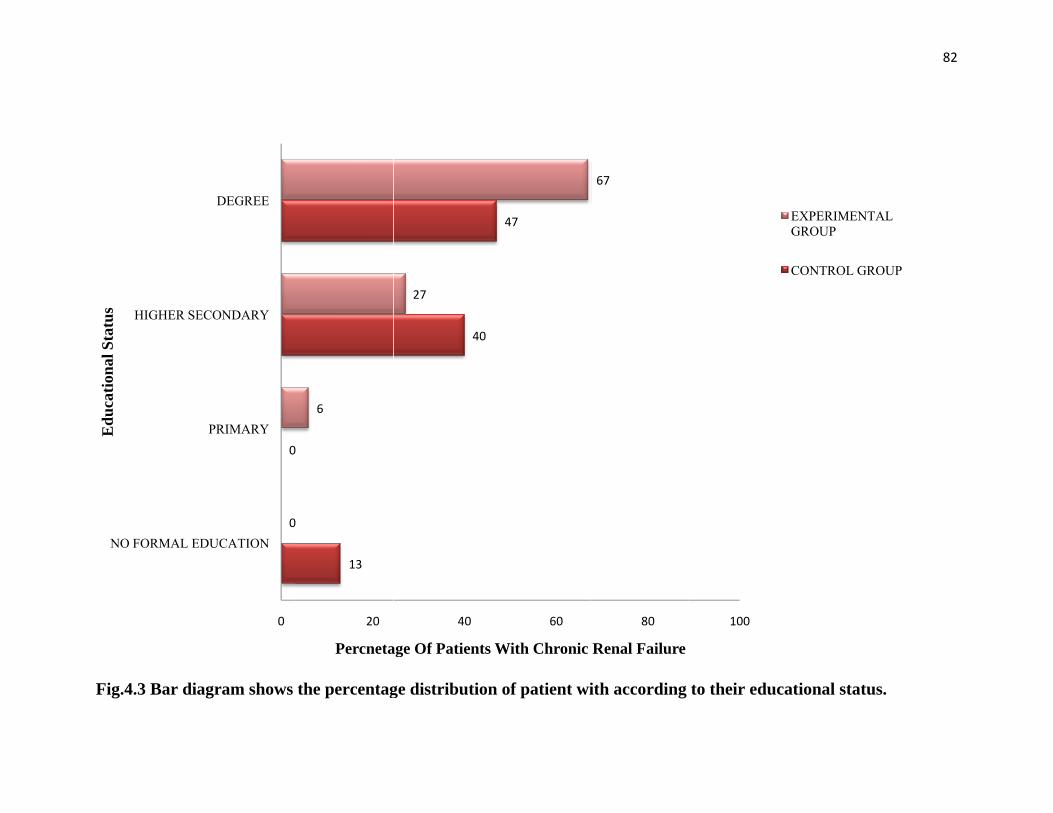
FFig.4.3 Bar di
NO FORMAL E
HIGHER SE
Edu
catio
nal S
tatu
s
agram shows
0
0
0
EDUCATION
PRIMARY
ECONDARY
DEGREE
the percentag
13
0
0
6
20
Percneta
ge distribution
40
27
40
age Of Patients
n of patient wi
47
60
With Chronic
ith according
67
80
Renal Failure
to their educa
100
ational status.
EXPERIMENTALGROUP
CONTROL GROU
82
.
L
UP

FFig.4.4 Bar di
0
10
20
30
40
50
60
70
80
90
100
Perc
enta
ge O
f Pat
ient
s With
Chr
onic
Ren
al F
ailu
re
agram shows
UNMARRIED
6
the percentag
D
13
M
ge distribution
MARRIED
87
73
Marital Status
n of patients a
WIDOW (OR
7
according to th
R) WIDOWER
13
heir marital sttatus.
CONTROL GRO
EXPERIMETNAGROUP
83
OUP
AL

FFig.4.5 Bar di
0
10
20
30
40
50
60
70
80
90
100
Perc
enta
ge O
f Pat
ient
s With
Chr
onic
Ren
al F
ailu
re
agram shows
VEGET
the percentag
TARIAN
13
13
Foo
ge distribution
od Habits
n of patients a
MIXED
87
87
according to thheir food habiits.
EXPERIMGROUP
CONTRO
84
MENTAL
OL GROUP

FFig.4.6 Cone d
0
10
20
30
40
50
60
70
80
90
100
PER
CE
NTA
GE
OF
PAT
IEN
TS
WIT
H C
HR
ON
IC R
EN
AL
FAIL
UR
E
diagram show
1-2 YEARS
7
0
ws the percenta
2-3 YEA
33
0
DURA
age distributio
ARS 3-4
13
ATION OF ILL
on of patients
4 YEARS A
53
27
LNESS
according to
ABOVE 4 YEARS
7
60
their durationn of illness.
CONTROL GR
EXPERIMENAGROUP
85
ROUP
AL

FFig.4.7 Cone d
0
10
20
30
40
50
60
70
80
90
100
Perc
enta
ge O
f Pat
ient
s With
Chr
onic
Ren
al F
ailu
re
diagram show
1-3 YEARS
20
6
ws the percenta
3-5 YEARS
60
67
Perio
age distributio
S 5-7 YE
od Of Dialysis
on of patients
EARS ABOV
20
27
according to
VE 7 YEARS
00
their period oof dialysis.
EXPERIMENTAGROUP
CONTROL GR
86
AL
ROUP

FFig.4.8 Pyram
0
10
20
30
40
50
60
70
80
90
100
Perc
enta
ge O
f Pat
ient
s With
Chr
onic
Ren
al F
ailu
re
mid diagram
NEPHROTOXIC
74
shows the p
CITY DIAB
60
Ca
percentage d
BETES MELLITU
13
20
auses Of Illness
distribution o
US HYPER
13
f patients ac
RTENSION
3
20
ccording to ttheir causes
CONTROL GR
EXPERIMENGROUP
87
of illness
ROUP
TAL

88
SECTION-B
ASSESS THE LEVEL OF RENAL FUNCTION AMONG CONTROL AND
EXPERIMENTAL GROUP AMONG PATIENT WITH CHRONIC RENAL
FAILURE BEFORE AND AFTER LEACHED POTATO.
Table 4.2 Frequency and percentage distribution of the control group pre and
posttest scores of renal function among patients with chronic renal failure.
(N2 = 15)
Level of renal
function
Control Group
Pretest scores Posttest scores
Frequency
(N)
Percentage
(%)
Frequency
(N)
Percentage
(%)
Highly impaired 15 100 14 93
Moderately
impaired
0 0 1 7
Mildly impaired 0 0 0 0

89
Frequency and percentage distribution of control group pretest and posttest scores
of renal function among patients with chronic renal failure depicts that, in pretest
all (100%) patients with chronic renal failure had highly impaired level of renal
function, whereas in posttest most (93%) of them had highly impaired level of
renal function and 7% of them had moderately impaired level of renal function. . It
seems that without intervention there is no obvious change in the renal function
among patients with chronic renal failure.

90
Table 4.3 Frequency and percentage distribution of the experimental group
pre and posttest scores of renal function among patients with chronic renal
failure
(N1=15,)
Level of renal
function
Experimental Group
Pretest scores Posttest scores
Frequency
(N)
Percentage
(%)
Frequency
(N)
Percentage
(%)
Highly impaired 11 73 9 60
Moderately impaired 4 27 6 40
Mildly impaired 0 0 0 0
Frequency and percentage distribution of experimental group pretest and
posttest scores of renal function among patients with chronic renal failure depicts
that, in pretest 73% of them had highly impaired level of renal function and 27%
of them had moderately impaired level of renal function, whereas in posttest
majority (60%) of them had highly impaired level of renal function and 40% of
them had moderately impaired level of renal function. It seems that with leached
potato, there is no major change in renal function

91
Table 4.4 Frequency and percentage distribution of posttest scores of renal
function in control group and experimental group
(N1= 15, N2 = 15)
Level of renal
function
Posttest scores
Control group Experimental group
Frequency
(N)
Percentage
(%)
Frequency
(N)
Percentage
(%)
Highly impaired 14 93 9 60
Moderately
impaired
1 7 6 40
Mildly impaired 0 0 0 0
Frequency and percentage distribution of control and experimental group
posttest scores of renal function among patients with chronic renal failure depicts
that, In control group, 93% of them had highly impaired level of renal function
and 7% of them had moderately impaired level of renal function, whereas in
experimental group 60% of them had highly impaired level of renal function and
40% of them had moderately impaired level of renal function. It seems that
leached potato on renal function among patients with chronic renal failure was
effective.
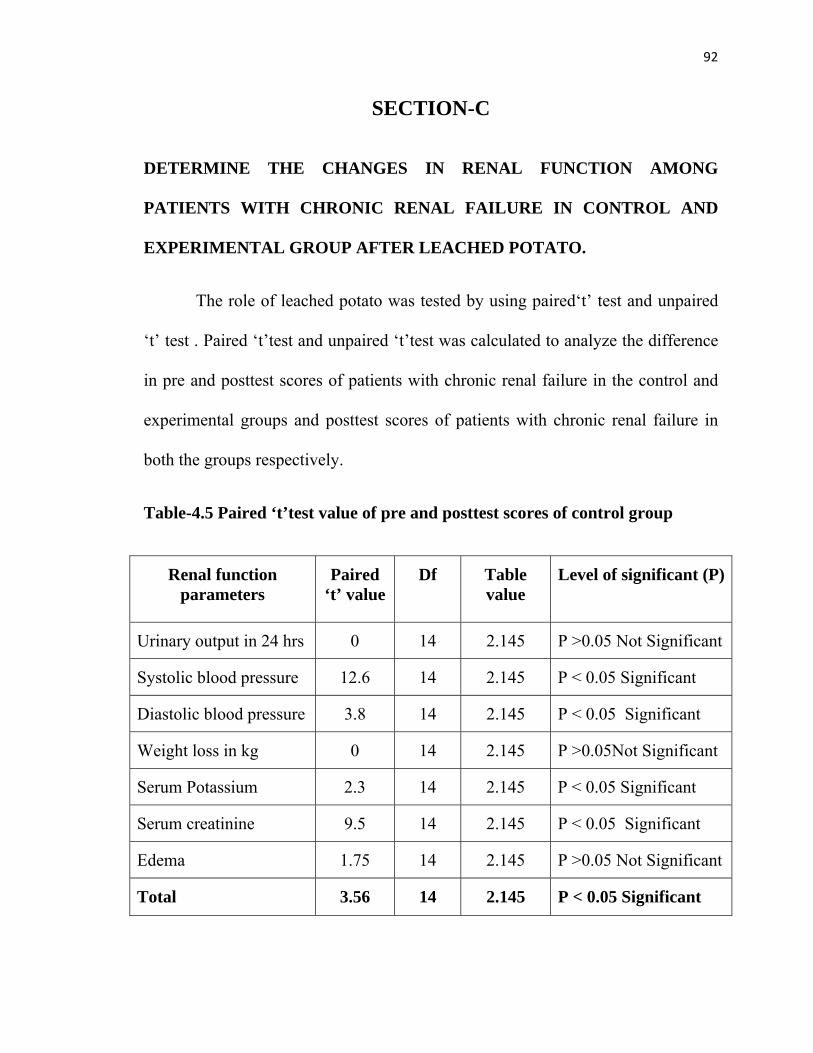
92
SECTION-C
DETERMINE THE CHANGES IN RENAL FUNCTION AMONG
PATIENTS WITH CHRONIC RENAL FAILURE IN CONTROL AND
EXPERIMENTAL GROUP AFTER LEACHED POTATO.
The role of leached potato was tested by using paired‘t’ test and unpaired
‘t’ test . Paired ‘t’test and unpaired ‘t’test was calculated to analyze the difference
in pre and posttest scores of patients with chronic renal failure in the control and
experimental groups and posttest scores of patients with chronic renal failure in
both the groups respectively.
Table-4.5 Paired ‘t’test value of pre and posttest scores of control group
Renal function parameters
Paired ‘t’ value
Df Table value
Level of significant (P)
Urinary output in 24 hrs 0 14 2.145 P >0.05 Not Significant
Systolic blood pressure 12.6 14 2.145 P < 0.05 Significant
Diastolic blood pressure 3.8 14 2.145 P < 0.05 Significant
Weight loss in kg 0 14 2.145 P >0.05Not Significant
Serum Potassium 2.3 14 2.145 P < 0.05 Significant
Serum creatinine 9.5 14 2.145 P < 0.05 Significant
Edema 1.75 14 2.145 P >0.05 Not Significant
Total 3.56 14 2.145 P < 0.05 Significant

93
Paired ‘t’test was calculated to analyze the effectiveness of leached potato
between pre and posttest scores of control group on renal function. The paired‘t’
test value was 3.56 when compared to table value 2.145, it is high. It seems that
there is significant relationship between leached potato and renal function among
patients with chronic renal failure.

94
Table-4.6 Paired ‘t’test value of pre and posttest scores of experimental group
Renal function
parameters
Paired
‘t’ value
Df Table
value
Level of significant (P)
Urinary output in 24 hrs 1.14 14 2.145 P >0.05 Not Significant
Systolic blood pressure 4.56 14 2.145 P < 0.05 Significant
Diastolic blood pressure 0.6 14 2.145 P>0.05 Not Significant
Weight loss in kg 1.14 14 2.145 P >0.05Not Significant
Serum Potassium 2.85 14 2.145 P > 0.05 Significant
Serum creatinine 0.9 14 2.145 P>0.05 Not Significant
Edema 2.9 14 2.145 P < 0.05 Significant
Total 4.96 14 2.145 P < 0.05 Significant
Paired ‘t’test was calculated to analyze the effectiveness of leached potato
between pre and posttest scores of experimental group on renal function. The
paired‘t’ test value was 4.96 when compared to table value 2.145, it is high. It
seems that there is significant relationship between leached potato and renal
function among patients with chronic renal failure.

95
Table-4.7 Area wise comparison of mean, SD, and mean percentage of pre
and posttest scores of renal function in control group
Renal function parameters
Maximum scores
Control group Difference
in mean
%
Pretest scores Posttest scores
Mean SD Mean%
Mean SD
Mean %
Urinary output in 24 hrs
4
1.2
0.46
30
1.4
0.65
35
5
Systolic blood pressure
4
1.8
0.75
45
2.3
0.98
58
13
Diastolic blood pressure
4
2.7
0.53
68
2.8
0.37
70
2
Weight loss in Kg
4 1.2 0.46 30 1.4 0.65 35 5
Serum Potassium
4
2.9 0.26 73 3.2 0.71 80 7
Serum creatinine
4
1
0.0
25
1.1
0.37
28
3
Edema 4
2.9
0.71
73
3
0.84
75
2
Total 28 12.6 1.97 45 13.3 1.64 48 3
Comparison of mean, SD, mean percentage of control group pre and
posttest scores reveals that, in pretest the highest mean score was (2.9±0.26),

96
which is 73% whereas mean score for posttest was (3.2±0.71), which is 80%
showing a difference of 7% on potassium.
In pretest the lowest mean score was (1.0±0.0), which is 25% whereas
mean score for posttest was (1.1±0.37), which is 28% showing the maximum
difference of 3% on serum creatinine.
Similarly the overall mean percentage of score for pretest was 45% whereas
in posttest it was 48% revealing a difference of 3%. It depicts that the leached
potato related to renal function was effective among patients with chronic renal
failure. The findings are graphically represented in Fig: 4.9

F
f
Fig: 4.9: Cone
function amon
Perc
enta
ge O
f Pat
ient
s With
chr
onic
R
enal
Failu
re
e diagram sho
ng patients wi
0102030405060708090
100
3
Ren
al F
ailu
re
owing the perc
ith chronic ren
3045
centage distrib
nal failure
68
Areas Of
bution of cont
35
f Renal Functio
trol group pre
73
25
on
e and posttest
73
scores of rena
97
al
POST TEST
PRE TEST

98
Table-4.8 Area wise comparison of mean, SD, and mean percentage of pre
and posttest scores of renal function in experimental group.
Renal function parameters
Maximum scores
Experimental group Difference
in mean
%
Pretest scores Posttest scores
Mean SD Mean%
Mean SD Mean%
Urinary output in 24 hrs
4
1.4
0.71
35%
1.6
0.7
40%
5
Systolic blood pressure
4
2.1
0.80
53
2.7
0.5
68
15
Diastolic blood pressure
4
2.3
0.80
58
2.7
0.8
68
10
Weight loss in Kg 4 1.4 0.71 35 1.6 0.7 40 5
Serum Potassium 4
2.9
2.6
73
3.2
0.5
80
7
Serum creatinine 4
1
0
25
1.1
0.2
28
3
Edema 4
2.6
0.65
65
2.7
0.7
68
3
Total 28 12.4 1.48 44 13.8 1.09 59 5

99
Comparison of mean, SD, mean percentage of experimental group pre and
posttest scores reveals that, in pretest the highest mean score was (2.9±2.6), which
is 73% whereas mean score for posttest was (3.2±0.5), which is 80% showing 7%
difference on potassium .
In pretest the lowest mean score was (1±0), which is 25% whereas mean
score for posttest was (1.1±0.2), which is 28% showing a difference of 3% on the
area of serum creatinine.
Similarly the overall mean percentage of score for pretest was 44% whereas
in posttest it was 49% revealing a difference of 5%. It depicts that with
intervention of leached potato on renal function was effective among patients with
chronic renal failure. The findings are graphically represented in Fig: 4.10

F
r
Fig: 4.10: Pyr
renal function
0
10
20
30
40
50
60
70
80
90
100
Perc
enta
ge O
f Pat
ient
s With
Chr
onic
Ren
al F
ailu
re
ramid diagram
n among patie
35
40
m showing the
nts with chron
53
68
percentage d
nic renal failu
58
68
Areas of R
distribution of
ure.
35
40
enal Function
f experimental
73
2
80
2
l group pre an
5
658
68
nd posttest sco
100
ores of
POST TEST
PRE TEST

101
Table-4.9 Unpaired ‘t’test value of control and experimental group pretest
scores
Renal function
parameters
Unpaired
‘t’ value
Df Table
value
Level of significance
(P)
Urinary output in 24 hrs 1.17 28 2.05 P > 0.05 Not Significant
Systolic blood pressure 0.3 28 2.05 P> 0.05 Not Significant
Diastolic blood pressure 1.9 28 2.05 P>0.05 Not Significant
Weight loss in kg 1.17 28 2.05 P > 0.05 Not Significant
Serum Potassium 0 28 2.05 P> 0.05 Not Significant
Serum creatinine 0 28 2.05 P> 0.05 Not Significant
Edema 1.8 28 2.05 P>0.05 Not Significant
Total 0.4 28 2.05 P >0.05 Not
Significant
Unpaired ‘t’test was calculated to analyze the effectiveness between
experimental and control groups pretest scores on renal function among patients
with chronic renal failure. The Unpaired‘t’ value was 0.4 when compared to table
value 2.05 is high. It seems that there is no significant change in renal function
among patients with chronic renal failure in control and experimental group before
leached potato.
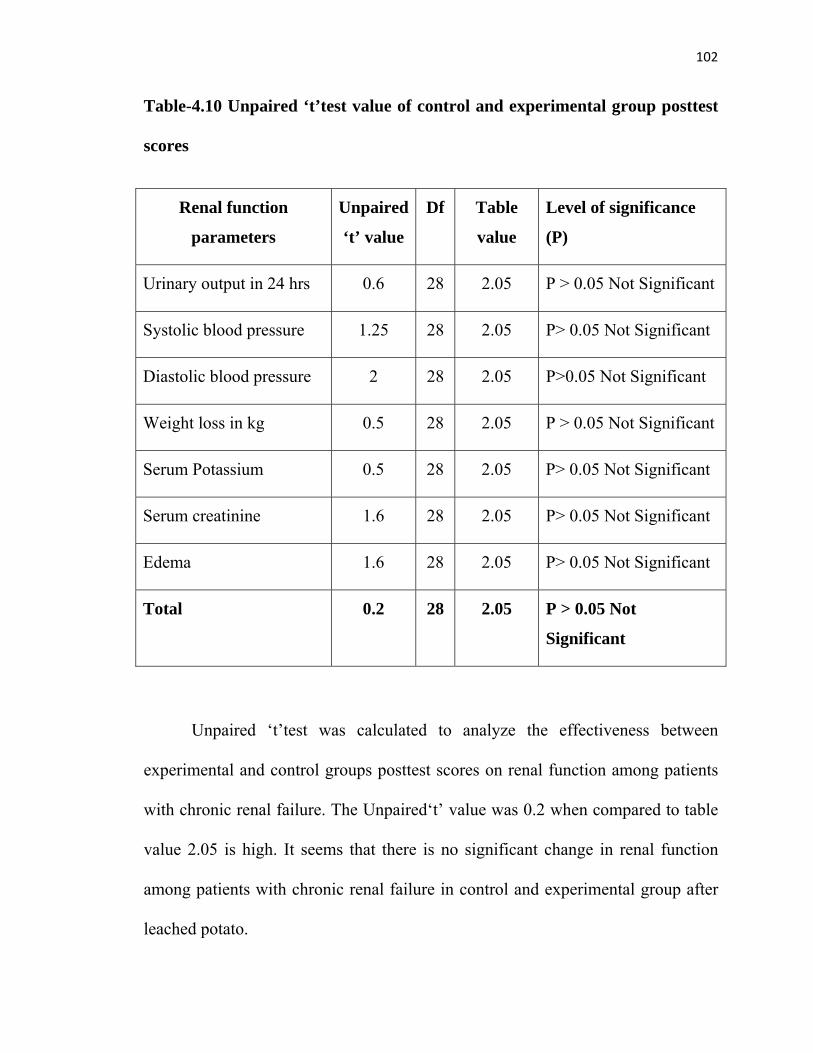
102
Table-4.10 Unpaired ‘t’test value of control and experimental group posttest
scores
Renal function
parameters
Unpaired
‘t’ value
Df Table
value
Level of significance
(P)
Urinary output in 24 hrs 0.6 28 2.05 P > 0.05 Not Significant
Systolic blood pressure 1.25 28 2.05 P> 0.05 Not Significant
Diastolic blood pressure 2 28 2.05 P>0.05 Not Significant
Weight loss in kg 0.5 28 2.05 P > 0.05 Not Significant
Serum Potassium 0.5 28 2.05 P> 0.05 Not Significant
Serum creatinine 1.6 28 2.05 P> 0.05 Not Significant
Edema 1.6 28 2.05 P> 0.05 Not Significant
Total 0.2 28 2.05 P > 0.05 Not
Significant
Unpaired ‘t’test was calculated to analyze the effectiveness between
experimental and control groups posttest scores on renal function among patients
with chronic renal failure. The Unpaired‘t’ value was 0.2 when compared to table
value 2.05 is high. It seems that there is no significant change in renal function
among patients with chronic renal failure in control and experimental group after
leached potato.

103
Table-4.11 Area wise comparison of mean, SD, mean percentage of posttest
scores of renal function in control and experimental group
Renal function parameters
Maximum scores
Posttest scores Difference in mean %
Control group Experimental group
Mean SD Mean%
Mean SD Mean%
Urinary output in 24 hrs
4 1.4 0.65 35 1.6 0.7 40 5
Systolic blood pressure
4 2.3 0.98 58 2.7 0.5 68 10
Diastolic blood pressure
4 2.8 0.37 70 2.7 0.8 68 2
Weight loss in Kg 4 1.4 0.65 35 1.6 0.7 40 5
Serum Potassium 4 3.2 0.71 80 3.2 0.5 80 0
Serum creatinine 4 1.1 0.37 28 1.1 0.2 28 0
Edema 4 3 0.84 75 2.7 0.7 68 7
Total 28 13.3 1.64 48 13.8 1.09 58 10
Comparison of mean, SD, mean percentage of posttest scores of both
control and experimental groups depicts that in control group the highest mean
score was (3.2±0.71), which is 80% whereas in experimental group the mean
score was (3.2±0.5), which is 80% on potassium level. It reveals 0.0% of mean
difference.

104
In control group the lowest mean score was (1.1±0.2), which is 28%
whereas in experimental group the lowest mean score was (1.1±0.37), which is
28% on the area of serum creatinine. It reveals the difference of 0.0%.
Similarly the overall mean percentage of score in control group was 48%,
whereas in experimental group the mean percentage was 59% revealing a
difference of 10%. It depicts that the leached potato on renal function was
effective among patients with chronic renal failure. The findings are graphically
represented in Fig: 4.11

F
r
Fig: 4.11: Pyr
renal function
0
10
20
30
40
50
60
70
80
90
100
Perc
enta
ge O
f Pat
ient
s With
Chr
onic
Ren
al F
ailu
re
ramid diagram
n among patie
35
40
m showing the
nts with chron
58
68
A
percentage d
nic renal failu
70
35
68
40
reas Of Renal F
distribution of
ure.
80
80
Function
f control and e
28
28
experimental g
75
68
group posttest
EXPEGROU
CONT
105
t scores of
ERIMENTAL UP
TROL GROUP

106
SECTION-D
FIND OUT THE ASSOCIATION BETWEEN POSTTEST SCORES OF
RENAL FUNCTION AMONG CONTROL AND EXPERIMENTAL
GROUP OF PATIENTS WITH CHRONIC RENAL FAILURE WITH
THEIR DEMOGRAPHIC VARIABLES.
Chi-square was calculated to analyze the association between posttest
scores on renal function among control and experimental group of patients with
chronic renal failure with their demographic variables.
Table-4.12 Chi-square value of association between control group posttest
scores with their demographic variables
Demographic
variables
Df Chi-
square
Table
Value
Level of significance
Age in years 2 0.4 5.99 P> 0.05 Not Significant
Gender 1 3.3 3.84 P> 0.05 Not Significant
Education 3 0.6 7.84 P> 0.05 Not Significant
Marital status 1 2.1 3.84 P> 0.05 Not Significant
Food habits 1 0.5 3.84 P> 0.05 Not Significant
Duration of illness 2 1.5 5.99 P> 0.05 Not Significant
Period of dialysis 2 0.7 5.99 P> 0.05 Not Significant
Cause of illness 2 1.6 5.99 P> 0.05 Not Significant
107
Chi-square was calculated to find out the association between control group
posttest scores of the patients with chronic renal failure with their demographic
variables regarding leached potato on renal function. It reveals that there was no
significant association between the posttest scores of control group when
compared to age in years, gender, education, marital status, food habits, duration
of illness, period of dialysis, and cause of illness, (P< 0.05). Hence the differences
observed in the mean scores values were only by chance and not true difference. It
seems that leached potato was effective to all patients with chronic renal failure
irrespective of their demographic variables.

108
Table-4.13 Chi-square value of association between experimental group
posttest scores with their demographic variables
Demographic
variables
Df Chi-
square
Table
Value
Level of significance
Age in years 2 0.6 5.99 P> 0.05 Not significant
Gender 1 1 3.84 P > 0.05 Not significant
Education 3 1.04 7.81 P > 0.05 Not significant
Marital status 1 0.6 3.84 P > 0.05 Not significant
Food habits 1 1.1 3.84 P > 0.05 Not significant
Duration of illness 2 0.3 5.99 P > 0.05 Not significant
Period of dialysis 2 0.3 5.99 P > 0.05 Not significant
Cause of illness 2 0.94 5.99 P > 0.05 Not significant
Chi-square was calculated to find out the association between experimental
group posttest scores of the patients with chronic renal failure with their
demographic variables regarding leached potato on renal function. It reveals that
there was no significant association between the posttest scores of experimental

109
group when compared to age in years, gender, education, marital status, food
habits, duration of illness, period of dialysis, and cause of illness, (P > 0.05).
Hence the differences observed in the mean scores values were only by chance
and not true difference. It seems that leached potato was effective to all patients
with chronic renal failure irrespective of their demographic variables.
SUMMARY
This chapter deals with analysis and interpretation of data collected to
evaluate the effectiveness of leached potato on renal function. Findings revealed
that mean posttest scores of patients with chronic renal failure in experimental
group (13.8±1.09), whereas in control group posttest score was (13.3±1.64). It
indicates that leached potato was effective among patients with chronic renal
failure. The paired ‘t’ test showed there is moderately significant relation between
leached potato and renal function among patients with chronic renal failure,
unpaired ‘t’test showed that there is no significant relation between leached potato
and renal function and chi-square test showed no association between their
demographic variables with experimental and control groups posttest scores.

110
CHAPTER – V
DISCUSSION
This chapter deals with the discussion which was based on the findings
obtained from the statistical analysis and its relation to the objectives of the study,
the conceptual frame work and the related literature.
This study was used to assess the role of leached potato on renal function
among patients with chronic renal failure in Nallaswamy Kidney Centre, Erode.
The following were the objectives of this study.
OBJECTIVES
1. To assess the level of renal function among patients with chronic renal
failure in experimental and control group before and after leached potato
2. To determine the changes in renal function among patients with chronic
renal failure in experimental and control group after leached potato.
3. To find out the association between posttest scores of renal function
among patients with chronic renal failure in experimental and control
group with their demographic variables.

111
OBJECTIVES
1) To assess the level of renal function among patient with chronic renal
failure patient in experimental and control group before and after
leached potato.
• Frequency and percentage distribution of control group pretest
and posttest scores of renal function among patients with chronic
renal failure depicts that,
o In pretest majority (100%) of patients with chronic renal failure
had highly impaired level of renal function
o In posttest all (93%) of them had highly impaired level of renal
function and 7% of them had moderately impaired level of renal
function.
o It seems that without intervention there is no obvious change in
the renal function among patients with chronic renal failure.
• Frequency and percentage distribution of experimental group
pretest and posttest scores of renal function among patients with
chronic renal failure depicts that,

112
o In pretest 73% of them had highly impaired level of renal
function and 27% of them had moderately impaired level of
renal function
o In posttest majority (60%) of them had highly impaired level of
renal function and 40% of them had moderately impaired level
of renal function.
o It seems that there is no major change in renal function.
• Frequency and percentage distribution of control and
experimental group posttest scores of renal function among
patients with chronic renal failure depicts that,
o In control group, 93% of them had highly impaired level of
renal function and in experimental group 60% of them had
highly impaired level of renal function.
o In experimental group 40% of them had moderately impaired
level of renal and in control group 7% of them had moderately
impaired level of renal function
o It seems that leached potato on renal function among patients
with chronic renal failure was effective.

113
HYPOTHESIS
H1 : There is significant level of renal function among patients with chronic
renal failure in experimental and control group before and after leached potato, so
the hypothesis is accepted.
Objective 2
To determine the changes in renal function among patients with
chronic renal failure in control and experimental group after leached potato.
Paired ‘t’ test, Unpaired ‘t’ test, area wise mean, SD, mean percentage
value of pre and posttest scores of control and experimental group on renal
function.
In urinary output
Paired ‘t’ test value for control group was 0, (P> 0.05) and
experimental group was 1.14, (P > 0.05)
Unpaired ‘t’ test value for pretest scores was,1.17, (P> 0.05) and
posttest scores was 0.6, (P> 0.05)
Pretest mean, SD score of control group was 1.2±0.46 which is 30%
and experimental group was 1.4±0.71 which is 35%

114
Posttest mean, SD score of control group was 1.4±0.65 which is
35% and experimental group was 1.6±0.7 which is 40%
The mean difference of control and experimental group was 5%.
Mean percentage of posttest in control group was 35% and
experimental group was 40%
Mean difference of posttest in control and experimental group was
5%
In systolic BP
Paired ‘t’ test value for control group was 12.6, (P< 0.05) and
experimental group was 4.56, (P< 0.05)
Unpaired ‘t’ test value for pretest scores was,0.3, (P> 0.05) and
posttest scores was 1.25, (P> 0.05)
Pretest mean, SD score of control group was 1.8±0.75 which is 45%
and experimental group was 2.1±0.80 which is 53%
Posttest mean, SD score of control group was 2.3±0.98 which is
58% and experimental group was 2.7±0.5 which is 68%
The mean difference in control group was 13% and in experimental
group was 15%

115
Mean percentage of posttest in control group was 58% and
experimental group was 60%
Mean difference of posttest in control and experimental group was
10%
In diastolic BP
Paired ‘t’ test value for control group was 3.8, (P< 0.05) and
experimental group was 0.6, (P> 0.05)
Unpaired ‘t’ test value for pretest scores was,1.9, (P> 0.05) and
posttest scores was 2, (P> 0.05)
Pretest mean, SD score of control group was 2.7±0.53 which is 68%
and experimental group was 2.3±0.80 which is 58%
Posttest mean, SD score of control group was 2.8±0.37 which is
70% and experimental group was (2.7±0.80) which is 68%
The mean difference in control group was 2% and experimental
group was 10%
Mean percentage of posttest in control group was 70% and
experimental group was 68%
Mean difference of posttest in control and experimental group was
2%

116
In weight loss
Paired ‘t’ test value for control group was 0, (P> 0.05) and
experimental group was 1.14, (P > 0.05)
Unpaired ‘t’ test value for pretest scores was,1.17, (P> 0.05) and
posttest scores was 0.6, (P> 0.05)
Pretest mean, SD score of control group was 1.2±0.46 which is 30%
and experimental group was 1.4±0.71 which is 35%
Posttest mean, SD score of control group was 1.4±0.65 which is
35% and experimental group was 1.6±0.7 which is 40%
The mean difference in control group was 5% and in experimental
group was 5%
Mean percentage of posttest in control group was 35% and
experimental group was 40%
Mean difference of posttest in control and experimental group was
5%
In serum potassium
Paired ‘t’ test value for control group was 2.3, (P< 0.05) and
experimental group was 2.85, (P < 0.05)

117
Unpaired ‘t’ test value for pretest scores was,0, (P> 0.05) and
posttest scores was 0.5, (P> 0.05)
Pretest mean, SD score of control group was 2.9±0.26 which is
73% and experimental group was 2.9±2.6 which is 73%
Posttest mean, SD score of control group was 3.2±0.71 which is
80% and experimental group was 3.2±0.5 which is 80%
The mean difference in control group was 7% and experimental
group was 7%
Mean percentage of posttest control group was 80% and
experimental group was 80%
Mean difference of posttest control and experimental group was
0%
In serum creatinine
Paired ‘t’ test value for control group was 9.5, (P< 0.05) and
experimental group was 0.9, (P< 0.05)
Unpaired ‘t’ test value for pretest scores was,0, (P> 0.05) and
posttest scores was 1.6, (P> 0.05)
Pretest mean, SD score of control group was 1±0.0 which is 25%
and experimental group was 1±0.0 which is 25%

118
Posttest mean, SD score of control group was 1.1±0.37 which is
28% and experimental group was 1.1±0.2 which is 28%
The mean difference in control group was 3% and in experimental
group was 3%
Mean percentage of posttest in control group was 28% and in
experimental group was 28%
Mean difference of posttest in control and experimental group was
0%
In edema
Paired ‘t’ test value for control group was 1.75, (P> 0.05) and
experimental group was 2.9, (P< 0.05)
Unpaired ‘t’ test value for pretest scores was,1.8, (P> 0.05) and
posttest scores was 1.6, (P> 0.05)
Pretest mean, SD score of control group was 2.9±0.71 which is
73% and experimental group was 2.6±0.65 which is 65%
Posttest mean, SD score of control group was 3±0.84 which is
75% and experimental group was 2.7±0.7 which is 68%
The mean difference in control group was 2% and in experimental
group was 3%

119
Mean percentage of posttest in control group was 75% and
experimental group was 68%
Mean difference of posttest in control and experimental group was
7%
In total
Paired ‘t’ test value for control group was 3.56, (P< 0.05) and
experimental group was 4.96, (P< 0.05)
Unpaired ‘t’ test value for pretest scores was,0.4, (P> 0.05) and
posttest scores was 0.2, (P> 0.05)
Pretest mean, SD score of control group was 12.6±1.96 which is
45% and group was 12.4±1.48 which is 44%
Posttest mean, SD score of control group was 13.3±1.64 which is
48% and experimental group was 13.8±1.09 which is 59%
The mean difference in control group was 3% and experimental
group was 5%
Mean percentage of posttest in control group was 48% and
experimental group was 59%
Mean difference of posttest in control and experimental group was
11%

120
It seems that there is no change in renal function among patients with chronic
renal failure in control and experimental group after leached potato at the same
time, it did not create any adverse effect.
Hypothesis 2 :
There is compromised level of renal function among patients with chronic renal
failure patients in experimental and control group before and after leached potato.
So the hypothesis is accepted.
Objective 3: III. To find out the association between posttest scores of renal
function among patients with chronic renal failure in experimental and
control group with their demographic variables.
1. Chi-square was calculated to find out the association between the posttest
scores of experimental group of patients with chronic renal failure with their
demographic variables (age in years, gender, education, marital status, food habits,
duration of illness, period of dialysis, and cause of illness).(P > 0.05). There is no
significant association between posttest scores of experimental group with their
demographic variables, the findings were only by chance not the true difference.
2. Chi-square was calculated to find out the association between posttest scores
of experimental group of patients with chronic renal failure with their
demographic variables (age in years, gender, education, marital status, food habits,
duration of illness, period of dialysis, and cause of illness).(P > 0.05). There is no

121
significant association between posttest scores of renal function among patients
with chronic renal failure with their demographic variables, the findings were only
by chance not the true difference.
Hypothesis 3 :
There is no significant association between posttest scores of renal function
among experimental and control group of patients with chronic renal failure
with their demographic variables, so the hypothesis is rejected.

122
CHAPTER - VI
SUMMARY, CONCLUSION, IMPLICATIONS AND
RECOMMENDATIONS
This chapter deals with the summary of the study, its findings, conclusion
and the implications for nursing administration, nursing practice, nursing
education and nursing research. This study has been started with a few limitations
and ends with suggestions and recommendations for research in future.
SUMMARY
The primary aim of the study was to assess the role of leached potato on renal
function among patients with chronic renal failure in Nallaswamy Kidney Centre,
Erode.
The objectives of the study were,
1. To assess the level of renal function among patients with chronic
renal failure in experimental and control group before and after
leached potato
2. To determine the changes in renal function among patients with
chronic renal failure in control and experimental group after leached
potato.

123
3. To find out the association between posttest scores of renal function
among patients with chronic renal failure in experimental and
control group with their demographic variables.
HYPOTHESES
Researcher formulated and tested the following research by hypothesis
H1 : There is significant level of renal function among patients with
chronic renal failure in experimental and control group before and
after leached potato.
H2 : There is compromised level of renal function among patients with
chronic renal failure patients in experimental and control group
before and after leached potato
H3 : There is significant association between posttest scores of renal
function among patients with chronic renal failure in experimental
and control group with their demographic variables.
The review of literature on related studies helped the investigator to design the
methodology, conceptual framework and find out the tool. The literature review
for the present study was presented under the following heading.

124
• Studies related to renal function
• Studies related to leached potato
• Studies related to dietary management other than leached potato
among patients in chronic renal failure.
• Studies related to leached potato on renal function among patients
with chronic renal failure.
The investigator developed Orlando’s Nursing Process Theory (1990).
The research design adopted for the study was quasi-experimental study. Setting
chosen to study was at Nallaswamy Kidney Centre, Erode. In this study the
samples were patients with chronic renal failure. The sample size was 30
(experimental group 15 and control group 15). In this purposive sampling
technique was used. Renal function parameter assessment scale was used to assess
the level of renal function among patients with chronic renal failure.
The reliability of the assessment tool was tested by implementing the tool
on patients with chronic renal failure who are outpatients in Government Head
Quarters, Erode, which is other than the sample area. Split Half method (Spearman
Brown man formula) was used to test the reliability of the tool and the tool was
found to be reliable. (r1= 0.75).
The main study was conducted in Nallaswamy Kidney Centre, Erode. The
samples were selected by using purposive sampling method among those who

125
fulfill the sampling criteria. Data were gathered through Renal Function Parameter
Assessment Scale on renal function. The data gathered are analyzed by descriptive
and inferential statistical method and interpretation is made on the basis of the
objectives of the study.
Major Findings of the study
The major findings of the study are presented under the following headings;
1. Findings related to description of patients with chronic renal failure
according to their demographic variables.
2. Findings related to level of renal function among patients with chronic
renal failure in control and experimental group before and after leached
potato
3. Findings related to level of renal function among patients with chronic
renal failure in control and experimental group after leached potato.
4. Findings related to effectiveness of leached potato on level of renal function
among patients with chronic renal failure.
5. Findings related to association of posttest scores of level of renal function
among patients with chronic renal failure with their selected demographic
variables.

126
I. Findings related to description of patients with chronic renal failure
according to their demographic variables.
In control group,
Most (47%) of the patients with chronic renal failure were in the age
group of both 20-40 years and 40-60 years.
Majority (73%) of the patients with chronic renal failure were males.
47% of the patients with chronic renal failure were degree holders..
Most (87%) of the patients with chronic renal failure were married.
Majority (87%) of the patients with chronic renal failure were both
vegetarian and non-vegetarian as their food habits.
Most (53%) of the patients with chronic renal failure has illness for
about 2-3 years.
Majority 60% of the patients with chronic renal failure were
undergoing dialysis for about 3-5 years.
Most (73%) of the patients with chronic renal failure had
Nephrotoxicity as their cause of illness.
In experimental group,
Most (53%) of the patients with chronic renal failure were in the age
group of 40-60 years.
Majority (60%) of the patients with chronic renal failure were males..
68% of the patients with chronic renal failure were degree holders.

127
Most (73%) of the patients with chronic renal failure were married.
87% of the patients with chronic renal failure had mixed food habits.
60% of the patients with chronic renal failure had illness for about
above 4 years.
67% of the patients with chronic renal failure were undergoing
dialysis for about 3-5 years.
60% of the patients had chronic renal failure due to Nephrotoxicity.
II. Findings related to level of renal function among patients with chronic
renal failure in control and experimental group before and after leached
potato.
In control group,
o In pretest majority (100%) of the patients with chronic renal
failure had highly impaired level of renal function
o In posttest all (93%) of the patients with chronic renal failure
had highly impaired level of renal function and 7% of the
patients with chronic renal failure had moderately impaired level
of renal function.
In experimental group,
o In pretest majority (73%) of the patients with chronic renal failure
had highly impaired level of renal function (27%)of the patients

128
with chronic renal failure had moderately impaired level of renal
function.
o In posttest (60%) of the patients with chronic renal failure had
highly impaired level of renal function and (40%) of the patients
with chronic renal failure had moderately impaired level of renal
function respectively.
III. Findings related to level of renal function among patients with chronic
renal failure in control and experimental group after leached potato.
o In Control group 93% of them had highly impaired level of renal
function and in experimental group 60% of them had highly
impaired level of renal function.
o In control group 7% of them had moderately impaired level of
renal function and in experimental group, 40% of them had
moderately impaired level of renal function.
VI. Findings related to changes in renal function among patients with chronic
renal failure in control and experimental group after leached potato.
Paired ‘t’ test value for control group was 3.56, (P< 0.05)
Paired ‘t’ test value for experimental group was, 4.96 (P< 0.05)
Unpaired ‘t’ test value for pretest scores was, 0.4 (P> 0.05)

129
Unpaired ‘t’ test value for posttest scores was, 0.2 (P > 0.05)
The overall mean score for pretest in control group was 12.6±1.97 , which
is 45%
The overall mean score for posttest in control group was 13.3±1.64, which
is 48%
The overall mean difference of control group was 3%
The overall mean score for pretest in experimental group was 12.4±1.48,
which is 44%
The overall mean score for posttest in experimental group was 13.8±1.09,
which is 59%
The overall mean difference of experimental group was 5%
The overall mean percentage of control group was 48%
The overall mean percentage of experimental group was 59%
The overall mean difference of posttest in control and experimental group
was 11%

130
V. Findings related to association of posttest scores of level of renal function
among patients with chronic renal failure with their selected demographic
variables.
In control group,
Chi-square value for age in years was 0.4, (P> 0.05)
Chi-square value for gender was 3.3, (P> 0.05)
Chi-square value for educational status was 0.6, (P> 0.05)
Chi-square value for marital status was 2.1, (P> 0.05)
Chi-square value for food habits was 0.5, (P> 0.05)
Chi-square value for duration of illness was 1.5, (P> 0.05)
Chi-square value for period of dialysis was 0.7, (P> 0.05)
Chi-square value for causes of illness was 1.6, (P> 0.05)
In experimental group,
Chi-square value for age in years was 0.6, (P> 0.05)
Chi-square value for gender was 1, (P> 0.05)
Chi-square value for educational status was 1.04, (P> 0.05)
Chi-square value for marital status was 0.6, (P> 0.05)

131
Chi-square value for food habits was 1.1, (P> 0.05)
Chi-square value for duration of illness was 0.3, (P> 0.05)
Chi-square value for period of dialysis was 0.3, (P> 0.05)
Chi-square value for causes of illness was 0.94, (P> 0.05)
CONCLUSION
From the findings of the study it can be concluded that,
The highest percentage of patient with chronic renal function was in the age
group of 20-40 years.
Most of them were males
Most of them were degree holders
Most of them were married
Most of them had mixed food habits
Most of them had above 4 years of illness
Most of them had dialysis for about 3-5 years
Most of them had illness due to Nephrotoxicity.
Obvious change in renal function is not observed.

132
Compromised renal function was found on control and experimental group
of patients with chronic renal failure before and after leached potato.
No significant association was observed between control and experimental
groups posttest scores of patients with chronic renal function with their
demographic variables.
NURSING IMPLICATIONS
Nursing Services
1. The nursing personnel working in hospital can reinforce the health
benefits of leached potato.
2. The nursing students can provide health education regarding leaching
potato.
3. Process of leaching potato can be included in the dietary regimen for
patients with chronic renal failure.
4. The nursing personnel
Nursing Education
1. Nursing educator should educate the nursing professionals about the
leaching process of potato.
2. Nurse educator must explain patients with chronic renal failure, the
importance of leaching in respect to their health status.
133
3. The researcher educates the patients with chronic renal failure to add
leached potato in their regular diet to maintain the renal function.
Nursing Research
This study may be issued for further references. Further large scale study
can be done as replication to standardize the leached potato on renal function.
Nursing administration
1. Nurse administer can conduct in-service program regarding leaching
process in various health sectors or agencies.
2. Nurse educator can issue brochures regarding leaching process in clinics
and hospitals.
3. Nurse administer can support the nurses for conducting research on
leaching fruits and vegetables.
RECOMMENDATIONS
Based on the findings of the study the following recommendations have
been made for the study.
• A large scale study can be carried out to generalize the findings.
• A similar study can be compared between each stages of chronic renal
failure.

134
• A similar study can be done with other vegetables like cabbage,
tomatoes, pumpkin, spinach, sweet corn, etc.,
• A similar study can be done with fruits like lime, orange, kiwi, banana,
apple etc.,
• A similar study can de compare with fruits and vegetables
• A similar study can be conducted for 6 months or 1 year period of time.
SUMMARY
This chapter as dealt with the summary of the study, major findings,
conclusions, implications of the study in nursing field and recommendations for
future

135
REFERENCES
BOOKS
Anderson KN, Glanze WD, (1994). Medical, nursing and allied health
dictionary. 4th edition. Mosby, Orlando.
Black M joycee and Hawks, (2005). Medical –Surgical Nursing. 7th edition W B
Saunders Company, Missouri.
Brenda G Bera, (1998). Medical–Surgical Nursing. 9th edition. Lippincott
Company, Philadephia.
Brunner and Siddarth’s, (2000). Text book of Medical –Surgical Nursing. 9th
edition. Lippincott Williams and Wikins publication, Newyork.
B. T. Basvanthappa, (2007). Nursing Theorie. Jaypee, New Delhi, India.
Densie,F. Polit, Hungler .(1999). Nursing Research Principles and Methods. 6th
edition. Lippincott William and Wilkins, Newyork.
John .T. Daugridas, (1994). Hand book of Dialysis. 2nd edition. little brown,
Newyork.
Jane Vincent, (2000). Laboratory tests and Diagnostic procedur. 5th edition.
Prentice-hall, Canada.

136
Kathleen mahan, (2004). Food, Nutrition and Diet therapy. 11th edition. W B
Saunders Company, USA.
Long Phipps, Casemeyer, (1993). Medical-Surgical Nursing. 3rd edition. Mosby,
USA.
Luckman, (1996). Core Principle of Medical Surgical Nursing. W B Saunders
Company, USA.
Lewis Colier, (2005). Medical-Surgical Nursing. 6th edition. Mosby, USA.
Maryan Foley, (1997). Mastering Medical –Surgical Nursing.1st edition. Spring
house, California.
Marshall joes J N, (2006). Cookbook for people on dialysis. national kidney
foundation, USA.
Nissenson Fine,(1993). Dialysis hand book. 2nd edition. Jaypee, Newdelhi, India.
Swaminathan M, (2004). Handbook of food and nutrition. 1st edition. Banglore,
India.
Ronald MJ, (2006). Creative cooking for renal dietics. Clevel and Clind
foundation, California.
Sundar Rao and Richard J (2000).An Introduction To Biostatistics.5th edition. W
B Saunders company, Philadelphia.

137
JOURNALS
Adibul, Hasan (2008). Importance of dialysis. kidney International,
vol:13.Pp:376-79
Anderson R G, (1991). short term and long term changes in renal function.
American Journal of Urology, vol:145. Pp:11-30.
Capdevila M, et.al, (2005). The efficiency of potassium removal. Hemodialysis
International, vol:9. Pp:296-302.
Dorothy, (1992). Effect of dietary protein in patients with chronic renal failure.
Kidney International, vol:41. Pp: 183-90.
Edward frank, et.al, (1997). Renal function in elderly-impact of hypertension and
cardiac function. Kidney International, vol:51. Pp: 1196-1204.
John L. Gifforth,et.al,(2003). Level of renal function as a risk factor for
cardiovascular outcome in elderly. Kidney International, vol:63.
Pp:1121-1129.
Johnson J P, (1983). Dietary management of hemodialysis patient. Journal of
medicine and science, vol:19. Pp:659-61.
Mcmarrow (2010). patient’s guide to living with reduced renal function.
American Dietic Association, vol:4. Pp:25-36

138
Patrick patricia, (2002). Nutrition and dialysis. National Kidney Foundation,
vol:2. Pp:15-30.
Rodwell (2006). healthy food guide for people with chronic kidney disease.
American Dietic Association, vol:6. Pp:35-48
Saraladevi (2003). End-stage renal disease in selected group. Kidney
International, vol:63. Pp:5119-5122.
Sharkay (2010). Prevalence of hyperkalemia among hemodialysis patient in
Egypt. Canadian Medical Journal, vol:182. Pp:1631-1635.
Shirley rao (1998). Hemodialysis for end-stage renal disease- a prospective from
a tertiary care centre. Nephrol Dial Transplant, vol:13. Pp:294-500.
Shelly (2008). Certain potato preparation guideline for kidney dialysis patients.
Journal of Food and Science Daily, vol:2. Pp:58-61.
Stevens M S (2000). Incidence of hyperkalemis in a hospitalized patients.
International Urology and Nephrology, vol:32. Pp:177-80.
Standely,et.al (2006). preservation of renal function. American Journal of
Nephrology, vol:23. Pp:125-34
Tracy M F (2000). Nutrition and dialysis patient. National Kidney Foundation,
vol:23. Pp:112-20

139
Williams (2000). Preserving renal function in adults with hypertension and
diabetes. American Journal of Kidney Disease, vol:36. Pp:646-61
Weisberg L S (2008). Management of severe hyperkalemia. Critical Care
Medicine, vol:36. Pp:3246-51.
Revathy (2010). stress and coping mechanism among hemodialysis patient.
Nightingale Times, vol:6. Pp:32-35.

140
NET REFERENCE
1. www.google.com
2. www.yahoo.com
3. www.bing.com
4. www.ncbi.nlm.nih.gov
5. www.eHow.com
6. www.medscape.com
7. www.biomedcentral.com
8. www.annals.com
9. www.livestrong.com
10. www.kid.org
11. www.cnn.com
12. www.wikipedia.org
13. www.msn.com
14. www.naturalnews.com
15. www.answer.com

[i]
APPENDIX-I
LETTERS SEEKING PERMISSION TO CONDUCT STUDY
From
Ms. Susan Olivial. A.
M.Sc. Nursing II Year, Dhanvantri college of Nursing.
Ganapathypuram, No.1, Ranganoor Road,
Muniyapan Kovil, Pallakkapalayam (po),
Sankagiri West, Namakkal (Dist).
To.
The principal,
Dhanvantri College of nursing,
Namakkal (Dist).
Respected madam
Sub: permission to conduct study in Nallaswamy Kidney Centre, Erode.
I Ms.Susan Olivial.A, II Year M.Sc.(Nursing) student of Dhanvantri College of Nursing, Pallakkapalayam as a partial fulfillment of Master of Science in Nursing. I have undertaken the following research study for my dissertation which has to be submitted to the DR.M.G.R Medical University, Chennai during december2011.
The Statement of the problem chosen for my study is “Role of leached potato on renal function among patient with chronic renal failure, at Nallaswamy kidney centre, Erode.”
I request you to permit me for conducting the study. Kindly do the needful.
Thanking you
Date: 22. 07. 2011 yours faithfully,
Place: Pallakkapalayam (SUSAN OLIVIAL.A)

[ii]
APPENDIX-II
LETTER GRANTING PERMISSION TO CONDUCT STUDY
From
Ms.Susan Olivial.A.
M.Sc. Nursing II Year, Dhanvantri college of Nursing.
Ganapathypuram, No.1, Ranganoor Road,
Muniyapan Kovil, Pallakkapalayam (po),
Sankagiri West, Namakkal (Dist).
To.
Through.
The principal,
Dhanvantri College of nursing,
Namakkal (Dist).
Respected madam
Sub: permission to conduct study in Nallaswamy Kidney Centre, Erode.
Ms.Susan Olivial.A, II Year M.Sc.(Nursing) student of Dhanvantri college of nursing, Pallakkapalayam as a partial fulfillment of master of science in nursing, have undertaken the following research study for my dissertation which has to be submitted to the DR.M.G.R Medical University, Chennai during december2011.
The Statement of the problem chosen for my study is “Role of leached potato on renal function among patient with chronic renal failure, at Nallaswamy kidney centre, Erode.”
She is in need of your help and co–operation to conduct this research study among patients with chronic renal failure in your esteemed hospital.
I request your kind office to permit me to collect the data from your hospital and allow me to utilize the needed facilities.
I assure you that my study will not in any way affect the routine work of the hospital nor would it harm study patients subjected for emotional freedom technique. Kindly do the needful
Thanking you
Date: 22. 07. 2011 Yours faithfully,
Place: Pallakkapalayam

[iii]
APPENDIX-III
LETTER SEEKING EXPERT OPINION ON CONTENT VALIDITY
From
Ms. Susan Olivial. A
II year M.Sc (Nursing),
Dhanvantri College of Nursing,
Ganapathypuram, No: 1, Ranganoor road,
Muniyappan Kovil, Pallakkapalayam, (PO), Namakkal (D.T).
To
Through
The Principal
Dhanvantri College of Nursing,
Ganapathypuram, No: 1, Ranganoor road,
Muniyappan Kovil, Pallakkapalayam, (PO), Namakkal (D.T).
Respected Sir/ Madam
Sub: Request for Validation of the Tool
I,Ms.Susan Olivial. A, II year M.Sc Nursing student of Dhanvantri College of Nursing, Pallakkapalayam as a partial fulfillment of Master of Science in Nursing, I have undertaken following research for my dissertation, which has to be submitted to the Tamilnadu Dr.M.G.R. Medical University, Chennai by December 2011.
The statement of problem chosen for my study is "Role of leached potato on among patients with chronic renal failure at Nallaswamy kidney centre, Erode”.
To achieve the objectives of the dissertation, I have prepared the following tools:
1. Demographic data
2. Renal parameter assessment scale
With regard to this, I kindly request you to go through the tool validate it render your valuable suggestions. Thanking You
Enclosures Yours faithfully
Chapter 1&3 with tool (SUSAN OLIVIAL.A)

[iv]
APPENDIX –III
POTASSIUM ANALYSIS CERTIFICATE
[v]
APPENDIX –IV
CONTENT VALIDITY CERTIFICATE
I hereby certify that I have validated the tool of Ms.Susan Olivial. A II year
M.Sc. Nursing student of Dhanvantri College of Nursing, Erode, who is
undertaking the dissertation work on “Role of leached potato on renal function
among patients with chronic renal failure at Nallaswamy Kidney Centre,
Erode”.
Place: Signature of the Expert:
Date: Name and Designation:
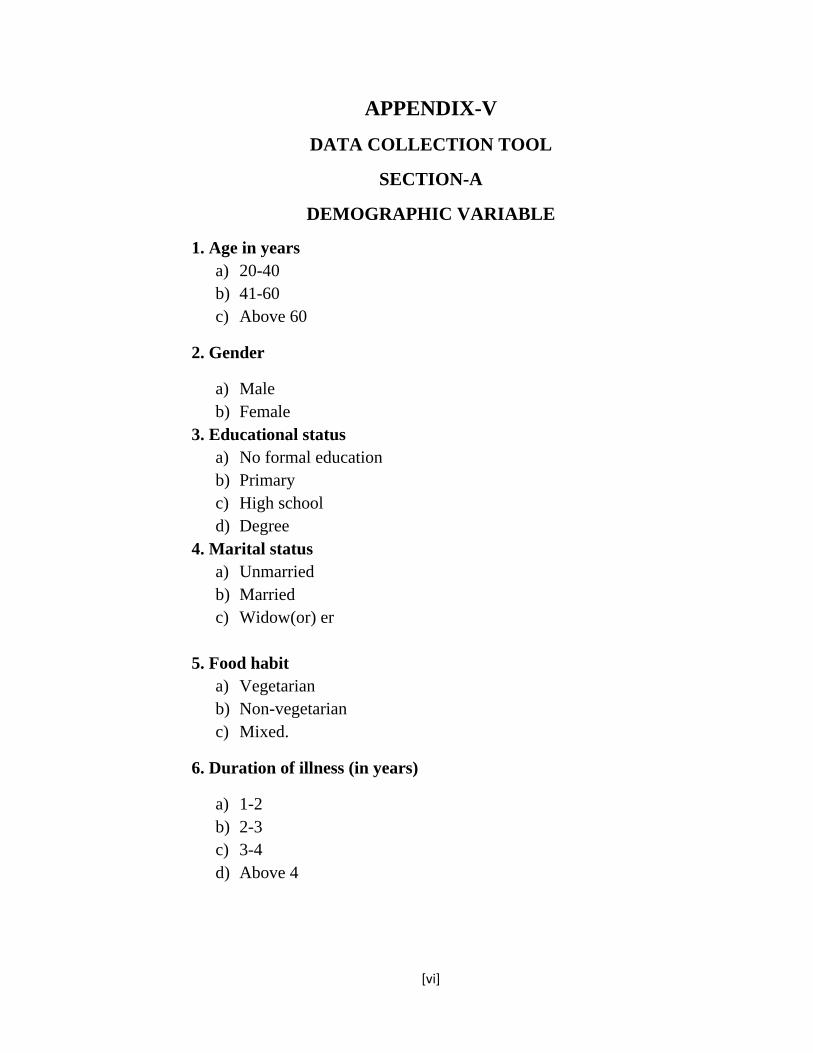
[vi]
APPENDIX-V
DATA COLLECTION TOOL
SECTION-A
DEMOGRAPHIC VARIABLE
1. Age in years a) 20-40 b) 41-60 c) Above 60
2. Gender
a) Male b) Female
3. Educational status a) No formal education b) Primary c) High school d) Degree
4. Marital status a) Unmarried b) Married c) Widow(or) er
5. Food habit
a) Vegetarian b) Non-vegetarian c) Mixed.
6. Duration of illness (in years)
a) 1-2 b) 2-3 c) 3-4 d) Above 4

[vii]
7. Period of dialysis (in years)
a) 1-3 b) 3-5 c) 5-7 d) Above 7
8. Causes of illness
a) Nephrotoxicity b) Drug toxicity c) Diabetes mellitus d) Hypertension e) others

[viii]
SECTION B:
This consists of renal function parameter assessment scale. It consists of seven
parameters like urinary output in 24 hours, systolic BP, diastolic BP, weight loss,
potassium, creatinine, Edema.
RENAL FUNCTION PARAMETER ASSESSMENT SCALE.
SCORES PARAMETER 1 2 3 4
URINARY OUTPUT IN
24 HRS
BELOW 300 301-500 501-700 ABOVE 700
SYSTOLIC BP
>180 160-179 140-159 <140
DIASTOLIC BP
>110 110-101 100-109 <90
WEIGHT LOSS
<2 2-3.9 4-5.9 >6
POATSSIUM
>11 11-9 8.9-6.9 >5
CREATININE
>7 7-6.6 6.5-6.1 >6
EDEMA
+4 +3 +2 +1
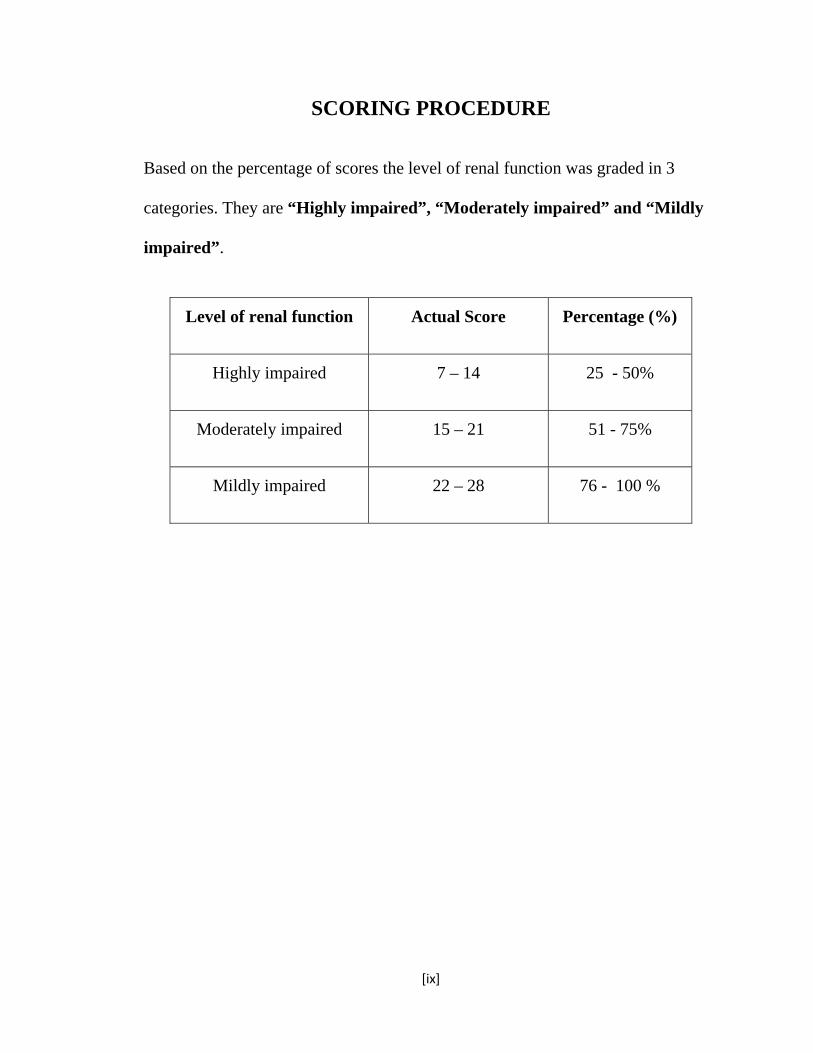
[ix]
SCORING PROCEDURE
Based on the percentage of scores the level of renal function was graded in 3
categories. They are “Highly impaired”, “Moderately impaired” and “Mildly
impaired”.
Level of renal function Actual Score Percentage (%)
Highly impaired 7 – 14 25 - 50%
Moderately impaired 15 – 21 51 - 75%
Mildly impaired 22 – 28 76 - 100 %

[x]
APPENDIX – VI
BLUE PRINT DESCRIPTION ON LEACHING POTATO.
DEFINITION
Leaching is a process of soaking and boiling vegetables whereby the potassium
content from the respective vegetable is lost, which can be used for patients with
reduced renal function.
STEPS IN LEACHING
Step 1: Wash 100gm of potato in the tap water
Step 2: Chop the potato into small pieces
Step 3: Soak the chopped potato in tap water for about one hour.
Step 4: Drain the water
Step 5: Boil the chopped potato in fresh water for 10 minutes.
Step 6: Drain the water
Step 7: Again re -boil the chopped potato in fresh water for 10 minutes.
Step 8: Drain the water.
Step 9: Repeat step 7 and step 8.
Step 10: Now the leached potato is used to prepare the dish.

[xi]
WHEN IS IT TO BE TAKEN
This leached potato is advised to take for six days in a week.
ADVANTAGES
It can be used for patients with hyperkalemia
It can be used for patients with chronic renal failure
This prevents muscle cramps.
This also prevents cardiac death due to hyperkalemia.

[xii]
APPENDIX-VII
LIST OF EXPERTS
1. Mrs. VIJAYARANI PRINCE, Ph.D
Principal,
Bishop’s college of nursing, C.S.I Compound,
Dharapuram-638656, Tripur district.
2. Mrs. LAKSHMI PRABHA, M.Sc (N)
Asso. Professor
Vinayaka Mission College of Nursing, Salem.
3. Mrs. SUMATHI. M, M.Sc (N),
Asso. Professor,
Vinayaka Mission College of Nursing, Salem.
4. Dr. SUDHAKAR, MBBS, M.Nephro,
Lotus hospital, Erode.
5. Mrs. POONKUZHALIL, (DIETICIAN),
6. Mr. DHANPAL,
Statistician,
Dhanvantri College of Nursing, Pallakapalayam,
Namakkal.

[xiii]
APPENDIX-VIII
PHOTOGRAPHS
Researcher showing the video demonstration on leaching potato the care givers.

[xiv]
Researcher showing the video demonstration on leaching potato to the patient.