role of different residues involved in atp interaction by the
TRANSCRIPT

1
ROLE OF DIFFERENT RESIDUES INVOLVED IN ATP INTERACTION BY THE CLAMP LOADER
By
ANKITA CHIRANIYA
A DISSERTATION PRESENTED TO THE GRADUATE SCHOOL OF THE UNIVERSITY OF FLORIDA IN PARTIAL FULFILLMENT
OF THE REQUIREMENTS FOR THE DEGREE OF DOCTOR OF PHILOSOPHY
UNIVERSITY OF FLORIDA
2012

2
© 2012 Ankita Chiraniya

3
To my Parents and family

4
TABLE OF CONTENTS page
LIST OF TABLES ............................................................................................................ 7
LIST OF FIGURES .......................................................................................................... 8
LIST OF ABBREVIATIONS ........................................................................................... 11
ABSTRACT ................................................................................................................... 13
CHAPTER
1 INTRODUCTION .................................................................................................... 15
AAA+ Proteins ........................................................................................................ 15 Structural Elements of the AAA+ Domain ......................................................... 15
ATP Driven Conformational Changes .............................................................. 18 Variation among AAA+ Proteins ....................................................................... 19
Clamp and Clamp Loaders ..................................................................................... 19
Structure of the Sliding Clamp .......................................................................... 20 Structure of the Clamp Loader ......................................................................... 21
Clamp Loading Reaction ......................................................................................... 23 Statement of Problem ............................................................................................. 24 Design of the Research Project .............................................................................. 26
Mutations used in this Study ............................................................................. 26 Assays used in this Study ................................................................................. 27
Significance of this Study in Medical Science ......................................................... 27
2 LITERATURE REVIEW .......................................................................................... 29
Clamp Loading Reaction ......................................................................................... 29 Events Coupled with ATP Binding .................................................................... 29 Events Coupled with ATP Hydrolysis ............................................................... 32
Previous work in Bloom laboratory ......................................................................... 33 Mutational Studies with AAA+ Proteins ................................................................... 36
3 MATERIALS AND METHODS ................................................................................ 37
Reagents and Oligonucleotides .............................................................................. 37
Reagents .......................................................................................................... 37 Oligonucleotide Substrates ............................................................................... 37
Proteins ................................................................................................................... 38 Replication Factor C (RFC) .............................................................................. 38
Expression vectors ..................................................................................... 38 Primers....................................................................................................... 40 Protein Overexpression and Purification .................................................... 43

5
Size-exclusion Chromatography ................................................................ 44
Other Proteins .................................................................................................. 46 Steady State Assays ............................................................................................... 46
ATP Binding Assay ........................................................................................... 47 PCNA Binding Assay ........................................................................................ 48
Binding Assay ................................................................................................ 50 PCNA Opening Assay ...................................................................................... 51
Opening Assay .............................................................................................. 53 DNA Binding Assay .......................................................................................... 54
DNA-DCC Based Assay ............................................................................ 54 DNA-RhX Based Assay ............................................................................. 55
ATP Hydrolysis Assay ...................................................................................... 57
Pre-Steady State PCNA Opening Assay ................................................................ 59
Assays Containing ATPS ...................................................................................... 59
4 NOVEL FUNCTIONS FOR THE CONSERVED ‘GLU’ RESIDUE IN THE WB MOTIF OF RFC ...................................................................................................... 60
Background Information .......................................................................................... 60 Results .................................................................................................................... 61
Equilibrium PCNA Binding ................................................................................ 61 PCNA Ring Opening ........................................................................................ 63
Equilibrium PCNA Opening in the Presence of 0.5 mM ATP ..................... 63 Equilibrium PCNA Opening in the Presence of Excess ATP...................... 65 Pre-steady State PCNA Opening ............................................................... 66
Equilibrium DNA Binding .................................................................................. 68
DNA-DCC Based Assay ............................................................................ 68 DNA-RhX Based Assay ............................................................................. 69
Equilibrium ATP Binding ................................................................................... 72
ATP Hydrolysis ................................................................................................. 74 Conclusions ............................................................................................................ 77
5 -COMPLEX ARG FINGER MUTANTS ARE DEFECTIVE IN CLAMP OPENING . 78
Background Information .......................................................................................... 78 Results .................................................................................................................... 80
Equilibrium Binding ........................................................................................ 80
Equilibrium Clamp Opening ........................................................................... 82 Conclusions ............................................................................................................ 84
6 THE CONSERVED ‘THR’ RESIDUE IN THE SENSOR 1 MOTIF OF -COMPLEX PROMOTES ATP-DEPENDENT CONFORMATIONAL CHANGES .... 86
Background Information .......................................................................................... 86
Results .................................................................................................................... 88 Equilibrium DNA Binding .................................................................................. 88 ATP Hydrolysis ................................................................................................. 90

6
Conclusions ............................................................................................................ 93
7 ATPS REDUCES CLAMP OPENING .................................................................... 95
Background Information .......................................................................................... 95 Results .................................................................................................................... 96
PCNA Binding .................................................................................................. 96
Equilibrium PCNA Opening .............................................................................. 97 Pre-Steady State PCNA Opening ..................................................................... 98
Binding ........................................................................................................ 100
Opening ....................................................................................................... 101 Conclusions .......................................................................................................... 102
8 DISCUSSION AND FUTURE DIRECTIONS ........................................................ 104
Walker B Motif ...................................................................................................... 104 Arg Finger Motif .................................................................................................... 105
Sensor 1 Motif ....................................................................................................... 105 Final Thoughts ...................................................................................................... 106
Implications ........................................................................................................... 108 Future Studies ...................................................................................................... 110
LIST OF REFERENCES ............................................................................................. 112
BIOGRAPHICAL SKETCH .......................................................................................... 120

7
LIST OF TABLES
Table page 3-1 Buffers used in RFC experiments. ...................................................................... 37
3-2 Buffers used in -complex experiments. ............................................................. 37
3-3 Expression vectors used for making RFC complex. ........................................... 38
3-4 Method used for making RFC expression vectors. ............................................. 39
3-5 Sequence of the primers used. ........................................................................... 40

8
LIST OF FIGURES
Figure page 1-1 The crystal structure of the AAA+ domain of NSF.. ............................................ 16
1-2 Essential residues involved in ATP hydrolysis. ................................................... 18
1-3 Ribbon diagrams of the sliding clamps ............................................................... 20
1-4 Ribbon diagrams of the clamp loaders.. ............................................................. 21
1-5 Ribbon diagrams of individual subunits. ............................................................. 22
1-6 Clamp loading reaction. ...................................................................................... 24
2-1 Clamp loading reaction divided into two phases based upon ATP requirement.. ...................................................................................................... 29
3-1 Representative maps of the final expression vectors used. ................................ 41
3-2 Representative map of the pCDFDuet-1-RFC2 expression vector.. ................... 42
3-3 Representative map of the pETDuet-1-RFC3(E118A)+RFC4(E115A) expression vector.. ............................................................................................. 42
3-4 Standard curve generated by separating protein standard molecular weight markers on Superose column. ............................................................................ 44
3-5 SDS-PAGE analysis of fractions collected of RFC elution from Superose column.. .............................................................................................................. 45
3-6 Representative emission spectra showing ATP binding assay. .......................... 47
3-7 Representative emission spectra showing PCNA binding assay. ....................... 49
3-8 Representative emission spectra showing binding assay.. .............................. 51
3-9 Representative emission spectra showing PCNA opening assay....................... 52
3-10 Representative emission spectra showing opening assay. ............................. 53
3-11 Representative emission spectra showing DNA-DCC based binding assay.. .... 54
3-12 Representative emission spectra showing DNA-RhX based binding assay.. ..... 56
3-13 Representative emission spectrum showing ATP hydrolysis assay.. ................. 57
3-14 A representative standard curve used in ATP hydrolysis assay. ........................ 58
9
4-1 Sequence of the WB motif in each of the RFC subunits.. ................................... 60
4-2 Effect of WB Glu mutations on PCNA binding. ................................................... 62
4-3 Effect of WB Glu mutations on PCNA opening with 0.5 mM ATP. ...................... 64
4-4 Effect of RFC WB Glu mutations on PCNA opening with excess ATP.. ............. 65
4-5 Effect of RFC WB Glu mutations on rate of PCNA ring opening. ........................ 67
4-6 DCC-based equilibrium DNA binding. ................................................................ 69
4-7 Effect of RFC WB Glu mutations on DNA binding in the absence of PCNA. ...... 70
4-8 Effect of RFC WB Glu mutations on DNA binding in the presence of PCNA.. .... 71
4-9 Effect of RFC WB-EQ Glu mutations on ATP binding.. ...................................... 73
4-10 Effect of RFC WB Glu mutations on rate of ATP hydrolysis.. ............................. 75
4-11 Effect of RFC WB Glu mutations on rate of ATP hydrolysis. .............................. 76
5-1 Schematic diagram of the arrangement of ATP-binding sites within the 3’-complex. ............................................................................................................. 79
5-2 Effect of -complex Arg finger mutations on clamp binding.. ........................... 81
5-3 Effect of -complex Arg finger mutations on opening. ...................................... 83
6-1 Effect of the -complex Sensor 1 Thr mutation on -complex•DNA binding in
the absence of .. ............................................................................................... 89
6-2 Effect of -complex Sensor 1 Thr mutation on -complex•DNA binding in the
presence of .. .................................................................................................... 90
6-3 Effect of -complex Sensor 1 Thr mutations on the rate of ATP hydrolysis in
the absence of .. ............................................................................................... 91
6-4 Effect of -complex Sensor 1 Thr mutations on rate of ATP hydrolysis in
presence of . ..................................................................................................... 92
7-1 Structure of ATPS. ............................................................................................ 95
7-2 Effect of ATPS on PCNA binding.. .................................................................... 96
7-3 Effect of ATPS on PCNA opening.. ................................................................... 97
7-4 Effect of ATPS on the rate of PCNA opening. ................................................... 99

10
7-5 Effect of ATPS on binding ............................................................................ 100
7-6 Effect of ATPS on opening ........................................................................... 101

11
LIST OF ABBREVIATIONS
AAA ATPases associated with diverse cellular activities
AF488 Alexa Fluor 488
ATPS Adenosine 5’-O-(3-thiotriphosphate)
CPS Counts per second
DCC 7-diethylaminocoumarin-3-carboxylic acid, succinimidyl ester
DTT Dithiothreitol
EDTA Ethylenediaminetetraacetic acid
FRET Fluorescence resonance energy transfer
HEPES 4-(2-Hydroxyethyl)piperazine-1-ethanesulfonic acid
IPTG Isopropyl -D-1-thiogalactopyranoside
Kd Dissociation constant
MCS Multiple cloning site
MDCC N-(2-(1-maleimidyl) ethyl)-7-(diethylamino)coumarin-3-carboxamide
NAD Nicotinamide adenine dinucleotide
ORC Origin recognition complex
PAGE Poly acrylamide gel electrophoresis
PCNA Proliferating cell nuclear antigen
p/t DNA primer-template DNA
Pyrene N-(1-pyrenyl)maleimide
RFC Replication factor C
RhX X-rhodamine isothiocyanate
SDM Site directed mutagenesis
SPR Surface plasmon resonance
SRH Second region of homology

12
TNP 2’,3’-O-(2,4,6-trinitrophenyl)
WA Walker A
WB Walker B
13
Abstract of Dissertation Presented to the Graduate School of the University of Florida in Partial Fulfillment of the Requirements for the Degree of Doctor of Philosophy
ROLE OF DIFFERENT RESIDUES INVOLVED IN ATP INTERACTION BY THE
CLAMP LOADER
By
Ankita Chiraniya
August 2012
Chair: Linda B. Bloom Major: Medical Sciences--Biochemistry and Molecular Biology
DNA polymerases synthesize long stretches of DNA with high efficiency and
processivity. This is made possible by ring-shaped proteins called sliding clamps, which
topologically link the polymerases to DNA. The clamps need to be opened and loaded
onto the DNA, which is done in an ATP-dependent manner by another set of proteins
called clamp loaders. Clamp loaders belong to a vast super-family of proteins called
AAA+ proteins. AAA+ proteins contain a highly conserved domain made of 200-250
amino acids called AAA+ domain, which includes several conserved motifs involved in
ATP binding, ATP hydrolysis and other functions associated with the activity of the
AAA+ protein. Some of the well-studied AAA+ motifs are the Walker A motif, which is
involved in ATP binding, the Walker B motif which is involved in ATP hydrolysis and the
Arg finger motif which is involved in sensing the bound ATP molecule and catalyzing
ATP hydrolysis. Our central hypothesis is that, in addition to the classic functions carried
out by the conserved AAA+ motifs; they are also involved in making conformational
changes, which are required for an efficient clamp loading reaction. The clamp loading
reaction involves multiple steps such as binding the clamp, opening the clamp, closing
the clamp around DNA and releasing the clamp•DNA product. Some of these steps

14
involve ATP binding while others involve ATP hydrolysis. We have made mutations in
coding sequence of some of the conserved AAA+ motifs of bacterial (E. coli) and
eukaryotic (S. cerevisiae) clamp loaders and analyzed the clamp loading reaction to
determine whether the AAA+ motifs have any additional role besides the functions
already known to be associated with them. Specifically, we have made mutations
affecting the Walker B motif of the eukaryotic clamp loader and the Arg finger and
Sensor 1 motifs in the bacterial clamp loader. We have used fluorescence based
assays to monitor individual clamp loading steps such as clamp binding, clamp opening,
DNA binding and ATP hydrolysis. Our data suggest that in addition to the classical
function associated with the three motifs, they are also involved in making
conformational changes required for clamp loading.
15
CHAPTER 1 INTRODUCTION
AAA+ Proteins
The AAA+ (ATPases associated with diverse cellular activities) (1) family is a
large, functionally diverse protein family and the members belong to the super-family of
ring-shaped P-loop ATPases (2). Conserved in all three domains of life, these proteins
are macromolecular machines that use the energy released by ATP hydrolysis to
remodel their target substrates in various ways (3). For example, AAA+ proteins are
involved in membrane fusion (NSF) (4), protein degradation (Clp/Hsp 100 family) (5),
DNA replication (helicases, clamp loaders) (6) and the movement of microtubule motors
(Dynein) (7). Their functional diversity is simplified by one unifying concept; that upon
nucleotide binding and hydrolysis, these enzymes undergo conformational changes that
are ultimately responsible for their function. One characteristic feature of the AAA+
family of proteins is their assembly into oligomers, which is the biologically active form.
Second feature is presence of a 200-250 amino acid ATP-binding domain (AAA
domain). This domain contains Walker-A and Walker-B motifs, which are the hallmarks
of classic P-loop NTPases and, additional motifs that distinguish it from P-loop NTPases
(reviewed in (8)), (NTP refers to ATP or GTP).
Structural Elements of the AAA+ Domain
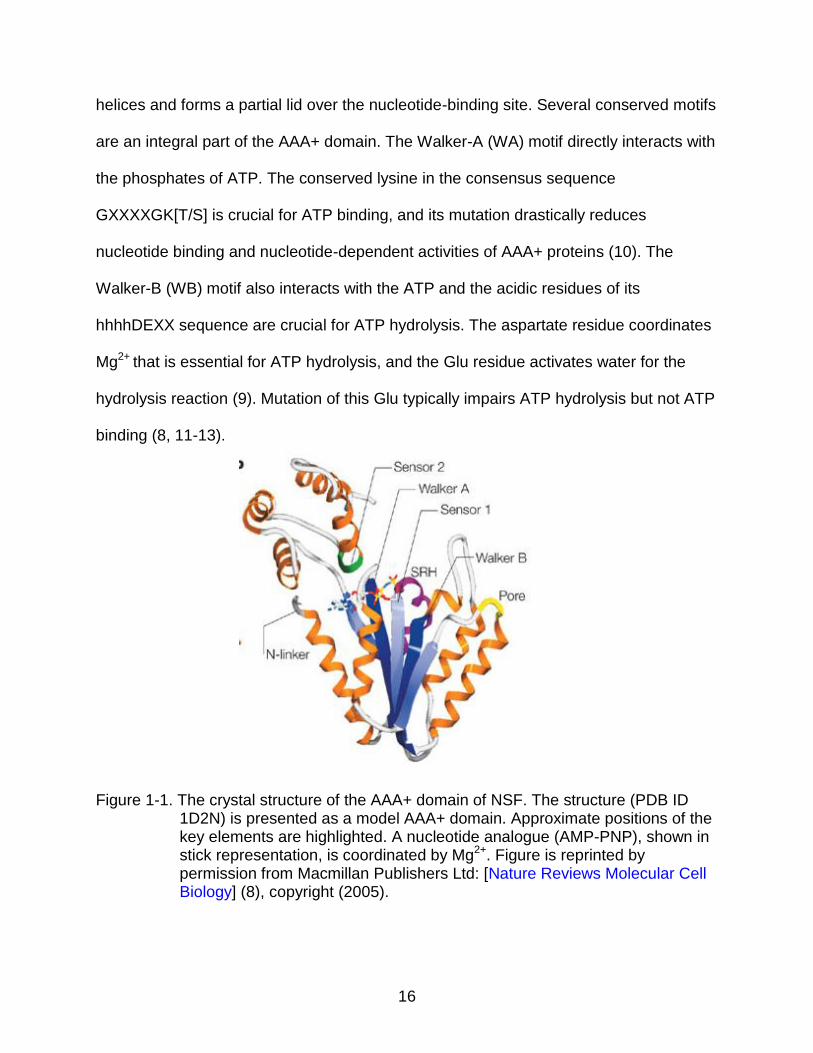
Conserved features of the AAA+ domain are shown in Figure 1-1, with the helices
and strands as designated by Iyer and collegues (8, 9). The AAA+ domain is made of
two sub-domains, an N-terminal / Rossman fold and a C-terminal -helical sub-
domain. The N-terminal sub-domain has a parallel -sheet and contributes to the
adenine-ring-binding pocket. The C-terminal sub-domain is composed of several -
16
helices and forms a partial lid over the nucleotide-binding site. Several conserved motifs
are an integral part of the AAA+ domain. The Walker-A (WA) motif directly interacts with
the phosphates of ATP. The conserved lysine in the consensus sequence
GXXXXGK[T/S] is crucial for ATP binding, and its mutation drastically reduces
nucleotide binding and nucleotide-dependent activities of AAA+ proteins (10). The
Walker-B (WB) motif also interacts with the ATP and the acidic residues of its
hhhhDEXX sequence are crucial for ATP hydrolysis. The aspartate residue coordinates
Mg2+ that is essential for ATP hydrolysis, and the Glu residue activates water for the
hydrolysis reaction (9). Mutation of this Glu typically impairs ATP hydrolysis but not ATP
binding (8, 11-13).
Figure 1-1. The crystal structure of the AAA+ domain of NSF. The structure (PDB ID 1D2N) is presented as a model AAA+ domain. Approximate positions of the key elements are highlighted. A nucleotide analogue (AMP-PNP), shown in stick representation, is coordinated by Mg2+. Figure is reprinted by permission from Macmillan Publishers Ltd: [Nature Reviews Molecular Cell Biology] (8), copyright (2005).

17
Another conserved region called the second region of homology (SRH) is present
C-terminal to the WB motif. The SRH consists of two specific structural elements,
Sensor 1 and the Arg finger, one at either end. These elements have been proposed to
coordinate nucleotide hydrolysis and conformational changes between AAA+ subunits.
Sensor 1 is found at the N terminus of SRH and a conserved polar residue (commonly
an asparagine) is located between the WA and WB motifs. This residue is thought to
distinguish between ADP and ATP (14) and mutation of this residue has been shown to
impair ATP hydrolysis (15). The Arg finger is found at the C terminus of SRH and
constitutes part of the nucleotide-binding site of the adjacent subunit, so named
because of a conserved Arg (14). The Arg finger motif plays an important role in
sensing the bound ATP and promoting binding of the clamp loader to DNA (16) leading
to catalysis of ATP hydrolysis (17). Mutation of the conserved Arg has been shown to
impair hydrolysis but not ATP binding (17, 18). Sensor 2 is located near the C-terminus
of the AAA+ domain and its residues (conserved Arg) also participate in nucleotide
binding (19). The N-linker domain is located at the N-terminus of the AAA+ domain and
connects it to other (non AAA+) domains (8). The pore loop is believed to be involved in
substrate binding.
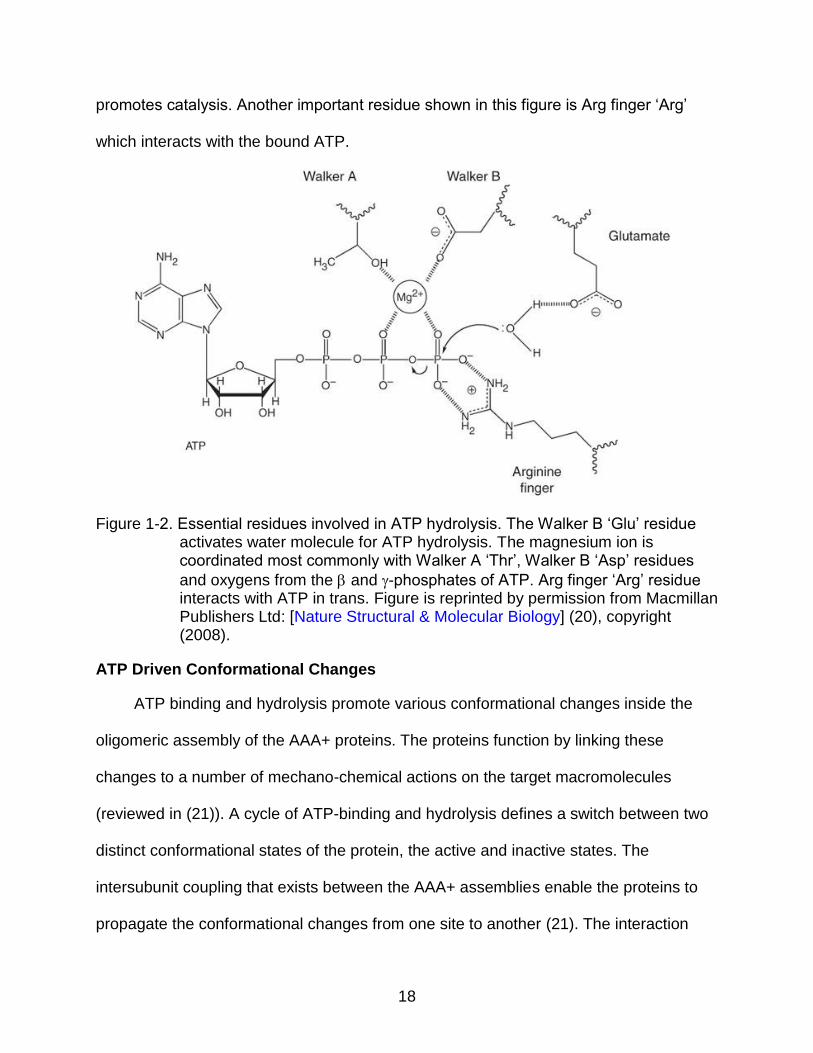
Various AAA+ residues interact among each other to coordinate efficient ATP
binding and hydrolysis. Figure 1-2 (20) shows critical residues involved in ATP binding
and hydrolysis. Walker B ‘Glu’ residue deprotonates a water molecule and makes it a
better nucleophile for in-line attack on the -phosphorus (20). Figure 1-2 also shows
contribution of Walker A ‘Thr’, Walker B ‘Asp’ in coordinating a magnesium ion, which
18
promotes catalysis. Another important residue shown in this figure is Arg finger ‘Arg’
which interacts with the bound ATP.
Figure 1-2. Essential residues involved in ATP hydrolysis. The Walker B ‘Glu’ residue activates water molecule for ATP hydrolysis. The magnesium ion is coordinated most commonly with Walker A ‘Thr’, Walker B ‘Asp’ residues
and oxygens from the and -phosphates of ATP. Arg finger ‘Arg’ residue interacts with ATP in trans. Figure is reprinted by permission from Macmillan Publishers Ltd: [Nature Structural & Molecular Biology] (20), copyright (2008).
ATP Driven Conformational Changes
ATP binding and hydrolysis promote various conformational changes inside the
oligomeric assembly of the AAA+ proteins. The proteins function by linking these
changes to a number of mechano-chemical actions on the target macromolecules
(reviewed in (21)). A cycle of ATP-binding and hydrolysis defines a switch between two
distinct conformational states of the protein, the active and inactive states. The
intersubunit coupling that exists between the AAA+ assemblies enable the proteins to
propagate the conformational changes from one site to another (21). The interaction

19
with various ligands at different steps of the reaction, further fine-tune the
conformational changes.
Variation among AAA+ Proteins
AAA+ proteins display a remarkable diversity of mechanisms of action. At the core
of this diversity is the AAA+ molecular motor, which has evolved differently in different
proteins to adapt to the specific functions (reviewed in (22)). To carry out an enormous
variety of cellular functions, the AAA+ modules have undergone direct structural
modifications at the amino acid sequence level. For example, the two sub-domain
architecture of the AAA+ domains is more conserved than the actual amino acid
sequence (8). Another mechanism by which they have adopted different functions is
through presence of additional domains at the amino and carboxyl termini of the
conserved modules. For example, clamp loaders have an additional sub-domain, C-
terminal to the AAA+ domain, which oligomerizes to form a ring, which stabilizes the
complex (23, 24). Finally, within the active AAA+ assembly, there are some examples of
AAA+ modules that have degenerated into proteins that lack ATP-binding and
hydrolysis activity altogether. Examples of this class include the and ’ subunits of the
bacterial clamp loader (23, 25). These modified subunits typically serve as modulators
between active AAA+ ATPase subunits within an oligomeric complex (21).
Clamp and Clamp Loaders
One of the best-characterized groups of AAA+ super family is the clamp loader.
These multimeric complexes are an essential part of the DNA replication machinery.
Chromosome replication requires a DNA polymerase that can rapidly duplicate
thousands of nucleotides. In all organisms, the replicative polymerase is anchored to
the DNA by a ring-shaped clamp that encircles DNA and slides freely along the DNA.

20
The closed circular structure of the ring-shaped clamps requires an active mechanism
to open and assemble them onto the DNA. The clamp loader is an AAA+ enzyme,
which opens the clamps and loads them onto the replication fork in an ATP-driven
reaction (reviewed in (26)). Functional and structural analyses indicate that the
architecture and mechanism of clamps and clamp loaders are conserved across the
three domains of life (6, 27, 28). In this study, the clamp and clamp loader of the
bacterial Escherichia coli and the eukaryotic Saccharomyces cerevisiae were studied.
Structure of the Sliding Clamp
The eukaryotic proliferating cell nuclear antigen (PCNA) and prokaryotic beta ()
clamps have unrelated amino acid sequences, yet they have striking structural
similarities (29, 30). PCNA is a homotrimer, while is a homodimer (Figure 1-3).
Figure 1-3. Ribbon diagrams of the sliding clamps. A, S. cerevisiae clamp PCNA (PDB
ID 3K4X) and B, E. coli clamp (PDB ID 3BEP). The clamps are structurally organized into six domains of similar fold arranged in a ring. A PCNA monomer is formed by covalently linking two domains (therefore a trimer),
and a monomer is formed by covalently linking three domains (therefore a dimer). The subunits are arranged in a head to tail fashion imparting different front and back faces to the sliding clamps. The ribbon diagrams were rendered using pymol.

21
Both clamps are ring-shaped proteins made of crescent-shaped protomers with a
large central channel that can easily accommodate double-stranded DNA (29, 31). Both
clamps contain six globular domains of similar fold but differing primary sequence
creating six-fold pseudo-symmetry. PCNA contains three interdomain interfaces, and
contains two, which interact only through noncovalent bonds, and can be opened by the
clamp loader to allow DNA to pass into the center of the ring.
Structure of the Clamp Loader
The functional core of clamp loaders is composed of five subunits, each of which
contains three structurally homologous domains joined by flexible linkers (23, 24)
(Figure 1-4).
Figure 1-4. Ribbon diagrams of the clamp loaders. A, S. cerevisiae clamp loader RFC
(PDB ID 1SXJ) and B, E. coli clamp loader -complex (PDB ID 3GLF) looking down on the ‘collar’ are shown. The color code used for RFC subunits is as follows: purple; Rfc1, blue; Rfc4, red; Rfc3, green; Rfc2 and
yellow; Rfc5. The color code used for -complex subunits is as follows:
purple; , blue; and yellow; ’. The ATPS is shown in gray spheres. The ribbon diagrams were rendered using pymol.

22
The N-terminal domains (I & II) contain characteristic AAA+ motifs, and the C-
terminal domain (III) is unique to clamp loaders. The C-terminal domains interact tightly
forming a ‘collar’ at the top, from which the five subunits appear to hang down. The N-
terminal domains I and II interact loosely forming a ring shaped assembly of the five
subunits. The clamp loaders are replication factor C (RFC) in S. cerevisiae and gamma-
complex (-complex) in E. coli respectively.
Figure 1-5. Ribbon diagrams of individual subunits. A, S. cerevisiae Rfc4 subunit (PDB
ID 1SXJ) and B, E. coli -subunit (PDB ID 3GLF). For clarity, only Domains I and II shared with AAA+ family are shown. The individual subunits are
bound to ATPS (gray) and their interaction with crucial residues of different motifs such as WA ‘Lys’ (cyan), WB ‘Glu’ (red), Sensor 1 ‘Asn’ or ‘Thr’ (green) Sensor 2 ‘Arg’ (orange) and Arg finger ‘Arg’ (magenta). The Arg finger interacts with the ATP of the adjacent subunit and its ‘Arg’ residue was mutated to ‘Gln’ in the RFC crystal structure (24). The ribbon diagrams were rendered using pymol.
RFC consists of five different homologous subunits, and each subunit belongs to
the AAA+ family (27). The subunits are referred to as either subunits A to E or 1 to 5.
Subunits 2 to 5 contain the three-domain architecture (Figure 1-5), while subunit 1

23
contains N- and C-terminal extensions to the three domains (24, 27). The N-terminal
extension shows homology to bacterial DNA ligase (32), binds DNA nonspecifically in in
vitro assays (33) and its function in vivo is unknown. Although each of the subunits likely
binds ATP, the Rfc5 subunit contains mutations in the WB motif and lacks a transacting
Arg finger so that it lacks ATPase activity (34).
The -complex consists of seven subunits, which are three copies of DnaX protein
( or ) and one copy each of , ’, and (reviewed in (35)). The and subunits do
not belong to the AAA+ family (36), and although and ’ share homology with AAA+
proteins, they do not bind ATP (37). Therefore, the ATPase activity resides only in the
and -subunits. Mixed clamp loaders containing both and -subunits or containing only
or -subunits have been characterized (38, 39). The 3’ complex, which lacks , is
sufficient to load clamps under experimental conditions (40). In this study, the 3’
clamp loader has been used and referred to as wild-type (wt) -complex.
Clamp Loading Reaction
Clamp loading is a highly dynamic and rapid process. On the leading strand,
where DNA synthesis is continuous, one clamp is required at each replication fork. On
the lagging strand, where DNA is synthesized discontinuously, a clamp is needed for
each Okazaki fragment synthesized. In E. coli, where the replication fork progresses at
rates of at least 500 nt/s (41), clamp loading on the lagging strand must be rapid.
The overall process of loading the clamps onto the DNA by the clamp loader
involves many individual steps such as binding ATP, binding the clamp, opening the
clamp, binding the DNA, closing the clamp around the DNA and finally releasing the
closed clamp onto the DNA (Figure 1-6) (42). These steps involve many interactions of

24
the clamp loader with its substrates, which are ATP, clamp and DNA at different points
of the clamp loading reaction. After loading the clamp onto the DNA, the clamp loader
needs to move away so that DNA polymerase can access the clamp. This means that
initially, the clamp loader must have a high affinity for the clamp and the DNA to bring
these two macromolecules together and later, after placing the clamp around DNA, it
must have low affinity to release them. These ‘intermolecular’ interactions are
modulated by several ‘intramolecular’ conformational changes in the clamp loader
brought about by the interaction with the appropriate ligands, which are ATP, clamp and
the DNA.
Figure 1-6. Clamp loading reaction.The reaction can be divided into two phases based on ATP requirements: 1) formation of a ternary clamp loader•clamp•DNA complex promoted by ATP binding, and 2) release of the clamp on DNA promoted by ATP hydrolysis. The diagram illustrates a structural model for RFC and PCNA based on crystal structures of clamp loaders and clamps (24, 43, 44). Individual protein domains represented by spheres or ovals.
Statement of Problem
The AAA+ superfamily is a large family of proteins involved in varied cellular
functions. Structure-function studies have been done with these proteins primarily by

25
making mutations in conserved residues and thus hoping to define their particular role in
the function of the protein in question (8). On one hand, all AAA+ proteins share the
conserved residues and the roles played by them, while on the other hand, proteins
evolved for a particular cellular function have also incorporated changes not shared by
other AAA+ proteins. These adaptations regulate the stability of the complex, their
interaction with the substrates, the conformational changes and finally, the mechanism
by which they manipulate their target macromolecules (reviewed in (21)). In this study,
we have analyzed the role of different conserved residues in the AAA+ domain of clamp
loader. Our central hypothesis is that, in addition to the known ATP binding/hydrolysis
functions carried out by them, the conserved residues also play important roles in
making conformational changes within the AAA+ assembly.
Chapter 4 investigates the role of the WB ‘Glu’ residue in the clamp loading
reaction by RFC. We have discovered a novel function for this residue. Our study shows
that the WB motif is involved in making ATP-dependent conformational changes
required for clamp binding, opening and DNA binding. In addition to this, the WB motif is
also required for DNA-dependent stimulation of ATP hydrolysis. Chapter 5 describes a
novel role of the Arg finger ‘Arg’ residue in the clamp binding and opening by -complex.
Chapter 6 describes the role of the Sensor 1 ‘Thr’ residue in promoting ATP-dependent
conformational changes in the -complex. Taken together, our study shows that, in the
clamp loaders, the residues involved in interaction with ATP perform other tasks in
addition to the roles previously assigned to them, which are mediating conformational
changes in response to ligand binding.

26
In addition to this, we have also studied the effect of adenosine 5’-O-(3-
thiotriphosphate) (ATPS) on the clamp binding and opening reactions. ATPS is a non-
hydrolysable analogue of ATP and is commonly used to test reactions, which involve
ATP hydrolysis. Chapter 7 describes the difference between ATP and ATPS in the
clamp binding and opening reactions by both RFC and -complex. Our study shows that
ATPS does not support all the conformational changes needed to open the clamp.
Design of the Research Project
Mutations used in this Study
To study the role of various conserved residues, specific mutations were made.
The conserved Glu (E) residue in the WB motif of RFC was mutated to Gln (Q) or Ala
(A) to generate two types of WB mutants, referred to as WB-EQ and WB-EA mutant
respectively. Mutations were made in the four active ATPase subunits, Rfc1 (Glu-425),
Rfc2 (Glu-141), Rfc3 (Glu-118), and Rfc4 (Glu-115), thus generating quadruple
mutants. Rfc5 contains a non-consensus WB motif (hhhhNEAN instead of hhhhDEXX)
and lacks a trans-acting Arg finger, both of which reduce its ATPase activity. In addition,
the N-terminal region of Rfc1 containing the first 283 residues, is not required for cell
viability (45) and shows nonspecific DNA binding activity (33). All RFC complexes used
in this study were deleted for this N-terminal region and the complex containing no
additional mutations is referred to as wild-type RFC.
To study the role of the Arg finger motif in the clamp loading reaction by -
complex, the conserved ‘Arg’ was mutated to ‘Ala’. In the -complex, two of the -
subunits and the ’ subunit extend their Arg finger towards the ATP site of the
neighboring subunit. Because of this functional asymmetry, two different types of
27
mutants can be made. One containing the mutation in the -subunits (R169A), and
another in the ’ subunit (R158A). These two mutants were used in our study. To study
the role of the Sensor 1 motif in -complex, the ‘Thr’ residue was mutated to ‘Ala’
(T157A) in all three -subunits.
Assays used in this Study
All the proteins used in our study were expressed in E. coli. The purified proteins
were used to perform in vitro assays to determine the role of the AAA+ residues. The
individual steps of the clamp loading reaction were monitored using several
fluorescence-based assays. We have used the fluorescence-based assays to study the
interactions and reactions both at equilibrium and in real time.
Significance of this Study in Medical Science
The clamp loader plays an essential role in DNA replication and repair process.
Given the importance of this function, there is a growing set of human diseases related
to genetic alterations in human RFC. An example of these diseases is Wiliams-Beuren
syndrome, which is a developmental disorder with multiple system manifestations and is
caused by heterozygosity for a chromosomal deletion of part of band 7q11.23 (46). The
deletion involves approximately 25 genes including RFC2 subunit (46). In another
example, a study was performed to identify Breast Cancer 1 (BRCA1) associated
proteins (47). Among the DNA repair proteins found to be associated with this large
protein complex, RFC1-RFC2-RFC4 complex was also identified. Additionally, Mutation
and loss of expression of RFC3 subunit have also been associated with genomic
instability and increased incidence of Gastric and Colorectal Cancers (48). And recently,
an N-terminal deletion in RFC1 subunit was found to be associated with Hutchinson
28
Gilford Progeria Syndrome (HGPS), which results in premature aging (49). Our study
aims to provide further insight into the mechanism of clamp loading reaction, thus
providing the knowledge to make correlations between defects in DNA replication and
diseases.

29
CHAPTER 2 LITERATURE REVIEW
Clamp Loading Reaction
The clamp loading reaction requires several interactions of the clamp loader with
ATP, the clamp and the DNA. It has been proposed that each interaction promotes
conformational changes within the clamp loader, which facilitates the next step of the
reaction (35). At the very basic level, the clamp loading reaction can be divided into two
phases based on ATP requirements: A) formation of a ternary clamp loader•clamp•DNA
complex promoted by ATP binding, and B) release of the clamp on DNA promoted by
ATP hydrolysis (Figure 2-1).
Figure 2-1. Clamp loading reaction divided into two phases based upon ATP requirement. The diagram illustrates a structural model for RFC and PCNA based on crystal structures of clamp loaders and clamps (24). Spheres or ovals represent individual protein domains.
Events Coupled with ATP Binding
ATP binding promotes formation of the ternary complex. The clamp loader binds
the clamp with high affinity in the presence of ATP. This has been shown for both RFC

30
(34) and the -complex (50). Based on structural data (23), it has been proposed that, in
the absence of ATP, the -complex remains in a relatively closed state and , which is
the interacting element, is hidden by ’. After binding ATP, the N-terminal face of the
-complex opens up and allows to bind to (23). Both RFC (51, 52) and the -complex
(53) have been shown to open clamps in the absence of ATP hydrolysis. Recently, data
from pre-steady-state analysis and kinetic modeling of S. cerevisiae RFC activities were
used to propose a model in which the clamp loader binds two to three ATPs, followed
by binding of the PCNA clamp and additional one to two ATPs (34). Upon binding, the
‘closed’ RFC•PCNA complex undergoes slow activation steps leading to formation of
the ‘open’ RFC•PCNA complex (54). Additionally, the -complex has been shown to
actively open the clamp, rather than stabilizing already open clamps present in
solution (44). Therefore, clamp opening appears to be an active process enhanced by
ATP and clamp binding, although it does not need ATP hydrolysis.
PCNA opening has also been proposed to be independent of ATP hydrolysis
based upon kinetic modeling (54). In the RFC•PCNA crystal structure (24), the Arg
finger ‘Arg’ was replaced by ‘Gln’ and the RFC•PCNA was co-crystallized with ATPS.
In this structure, the PCNA was in a ‘closed’ state. Therefore, it is possible that Arg
finger mutation and/or ATPS affect the conformational changes required for PCNA
opening. After opening the clamp, the clamp loader binds primer-template (p/t) DNA.
Both ATP and clamp binding stimulate DNA binding. The -complex binds DNA with low
affinity in the presence of ATP, and the binding is significantly enhanced in the presence
of (55). Similarly, PCNA also enhances RFC binding to p/t DNA. Equilibrium
measurement of RFC binding to DNA was made in the presence of ATPS and the

31
dissociation constant (Kd) was shown to be about six-fold lower in the presence of
PCNA (34). Mechanistically, it makes sense for DNA binding to be stimulated by clamp
binding. If this was not the case, the clamp loader alone might bind DNA with the same
affinity as the clamp loader•clamp complex. Binding to DNA triggers ATP hydrolysis
leading to release of the DNA. ATP hydrolysis in a ternary (clamp loader•clamp•DNA)
complex will result in productive clamp loading onto the DNA, in contrast, in the case of
clamp loader•DNA complex, this will create a futile cycle of DNA binding and release
without any clamps being loaded. Another reason for this stimulation comes from the
structural constraints. The clamp is a ring-shaped structure and needs to be cracked
open by the clamp loader in order to let the DNA pass through the ring. A clamp loader
bound to DNA first cannot bind the clamp, however when bound to the clamp first, it
opens the clamp forming an overall ring shaped assembly through which DNA can be
threaded. Thus stimulation of DNA binding by clamp favors the binding of clamp
loader•clamp complex to the DNA over binding of clamp loader alone to the DNA
leading to a productive clamp loading reaction.
Structures of the S. cerevisiae RFC•PCNA complex (24) and E. coli -
complex•DNA complex (56) show how clamps and clamp loaders may interact during
the clamp loading reaction as well as how clamp-loaders bind DNA. The clamp loaders
bind the clamp via the N-terminal domains of the clamp-loader subunits. One interface
between adjacent monomers in the clamp is opened, possibly through movement both
in and out of the plane of the ring formed by clamp monomers (57, 58). Individual
clamp-loader subunits adopt a conformation such that they spiral around an axis going
from the C-terminal to N-terminal domains of the proteins in the complex. Duplex DNA

32
at the 3′ primer/template junction enters the clamp loader•clamp complexes through the
open side formed by the N-terminal domains, and the spiraling conformation of the
subunits matches the spiral of the DNA helix such that the clamp loader resembles a
“screw-cap” (24, 58). The single-stranded template overhang exits through the gap
between the S. cerevisiae Rfc1 and Rfc5 subunits or the analogous E. coli ′ and
subunits (56, 59).
Events Coupled with ATP Hydrolysis
ATP hydrolysis promotes dissociation of the ternary complex leading to the
release of the clamp•DNA product. DNA triggers ATP hydrolysis; ATP hydrolysis in the
absence of DNA is significantly slower (60). The RFC ATPase rate is stimulated up to
~20 fold by DNA alone and further as much as ~25 fold in the presence of both DNA
and PCNA (34). RFC can hydrolyze up to four ATP molecules. Recent pre-steady state
ATPase analysis and kinetic modeling study (61) suggest that 3 to 4 ATP molecules are
hydrolyzed after formation of the ternary complex. ATP hydrolysis promotes
conformational changes leading to the closure of PCNA around the DNA, which
promotes release of 3 to 4 inorganic phosphate (Pi) molecules. Release of Pi brings
about further conformational changes lowering the affinity of RFC for PCNA•DNA and
release of the clamp around the DNA. The exact sequence of events coupled with ATP
hydrolysis is understood in more detail for the -complex. The -complex can hydrolyze
up to 3 molecules of ATP. Pre-steady-state ATPase assays (62) have shown that,
hydrolysis of 2 molecules of ATP is associated with conformational changes, which
reduce binding interactions with DNA, whereas hydrolysis of the third molecule is
associated with conformational changes that retract the subunit and release .

33
Therefore, the general mechanism of ATP hydrolysis and release of the clamp•DNA
product appears to be the same. Both DNA and the clamp trigger ATP hydrolysis. Again
this makes sense mechanistically, as if this was not the case then the clamp loader
would bind and hydrolyze ATP on its own. This will lead to a futile cycle of ATP
hydrolysis without any clamps being loaded. The stimulation of ATP hydrolysis by the
DNA and clamp ensures that a productive clamp loading takes place. Similarly, a
defined temporal order for binding and releasing the clamp and DNA would increase the
efficiency of the clamp loading reaction. For example, if the clamp loader were to
release its grip on DNA prior to clamp closing, the DNA would slip out of the open
clamp. Therefore, each interaction the clamp loader makes with the ligands, and the
conformational changes induced by them plays an important role in ensuring that clamp
loading reaction occurs in a defined and efficient manner.
Previous work in Bloom laboratory
Work done by former members of the Bloom laboratory has contributed immensely
to the current understanding in the field of clamp loading mechanism. Brandon Ason
studied the interaction of -complex with primed template DNA and showed that the
DNA binds -complex rapidly followed by ATP hydrolysis leading to a rapid dissociation
of DNA from -complex (63). Based on this work he proposed a model where -complex
cycles between an ‘active’ state which has high affinity for DNA and an ‘inactive’ state
which has a low affinity for DNA. The ‘active’ state allows DNA binding and loading
clamp onto the DNA, while the ‘inactive’ state releases the clamp•DNA product and
thus, does not compete with DNA polymerase for binding to the clamp•DNA. He also
compared the clamp loading and ATP hydrolysis by -complex in presence of primed

34
template DNA containing 5’ template overhang (elongation-proficient DNA) and 5’
template blunt end (elongation-deficient DNA) (64). His results showed that the
elongation-proficient DNA is absolutely necessary to hydrolyze ATP and release
clamp onto the DNA.
Two former members, Christopher Williams and Anita Snyder worked extensively
on the ATP binding and hydrolysis dependent interaction of -complex with and DNA.
Christopher studied the pre-steady state kinetics of ATP hydrolysis by -complex (62)
and showed that hydrolysis of 2 molecules of ATP is associated with conformational
changes in the -complex, which reduce binding interactions with DNA, whereas
hydrolysis of the third molecule of ATP is associated with conformational changes which
retracts the subunit and releases the clamp. Anita studied the effect of Arg finger
‘Arg’ mutation in -complex on interaction with and DNA (16). Her results showed that
interaction of the Arg finger motif with ATP bound to 1 has a larger role to play in
interaction with , while the interaction of the Arg finger motif with ATP bound to 2 and
3 has a larger role to play in interaction with DNA, thus suggesting a mechanism where
the and DNA binding activities of the -complex are uncoupled.
Stephen Anderson measured the clamp loading activities of different forms of -
complex, one containing -subunit (3’) and one lacking it (3’) (40). His results
showed that the -subunit plays a role in stabilizing the ATP-induced conformational
state of -complex, which has a high affinity for DNA. Based on his studies, he
suggested a mechanism for regulation of temporal order of clamp loading in -complex,
in which binding precedes DNA binding. Stephen also studied the pre-steady state

35
kinetics of clamp release by -complex using a Fluoresecence resonance energy
transfer (FRET)-based assay (65). His results showed that -complex releases the
clamp prior to DNA and that DNA release may be coupled to clamp closing around the
DNA.
Followed up on these studies, Jennifer Thompson developed a N-(1-
pyrenyl)maleimide (pyrene)-based binding assay. She also measured the kinetics of
clamp and DNA binding by -complex and showed that the ATP-induced conformational
changes involved in binding are different than those for DNA binding (66). Moving
onto the eukaryotic clamp loader•clamp system, she developed an Alexa Fluor 488 (AF-
488)-based PCNA opening assay and measured the PCNA binding and opening by
RFC (67). Her studies showed that RFC binds and opens PCNA rather than capturing
and stabilizing open PCNA molecules in solution.
Christopher Paschall developed an AF-488-based opening assay and measured
opening by -complex (44). His results showed a similar mechanism for -complex,
where the -complex binds and opens rather than capturing and stabilizing open
molecules in solution.
And recently, Melissa Marzahn developed a N-(2-(1-maleimidyl) ethyl)-7-
(diethylamino) coumarin-3-carboxamide (MDCC)-based PCNA binding assay
(unpublished) and studied the effect of Walker A mutations on clamp loading activities
of RFC (unpublished). Based on all these previous studies, our study aims to
investigate the mechanism of clamp loading reaction in further detail.
36
Mutational Studies with AAA+ Proteins
Given the important role the AAA+ proteins play in various cellular functions, they
have been studied extensively. There are several studies in which the conserved
residues were mutated and the effects were correlated with the function of the particular
residue. For example, mutation of the WB ‘Glu’ typically impairs nucleotide hydrolysis
but not nucleotide binding (reviewed in (8)). Given this known function, mutations in the
WB motif are often made, and resulting defects in AAA+ activities are assumed to be
the result of deficiencies in NTPase activity only (10, 13, 68, 69). In a previous study
with an archaeal clamp loader (12), WB mutations were made in individual subunits,
creating single mutants. Assuming that the mutation affects ATP hydrolysis only,
individual steps of the clamp loading reaction were linked to ATP hydrolysis function by
each RFC subunit. According to our hypothesis, the mutations may have affected
conformational changes in addition to ATP hydrolysis leading to the observed effects on
clamp loading.
Our study aims to determine if there are other roles associated with the conserved
residues in addition to the specific roles that have already been assigned to them. The
strength of our study is that we can study each step of the camp loading reaction
individually using different fluorescence-based assays. Therefore, instead of studying
the end product of the reaction such as the clamp loaded onto the DNA, we are able to
determine exactly which step is affected by the particular mutation.

37
CHAPTER 3 MATERIALS AND METHODS
Reagents and Oligonucleotides
Reagents
ATP was from Sigma-Aldrich Co. (St. Louis, MO) and adenosine 5’-O-(3-
thiotriphosphate) (ATPS) was from Roche Molecular Biochemicals. For RFC and -
complex experiments, ATP and ATPS solutions were prepared in 30 mM HEPES-
NaOH, pH 7.5 and 20 mM Tris-HCl, pH 7.5, respectively. Buffers used for protein
storage and enzyme assays are listed in Tables 3-1 and 3-2. For protein dilution, the
repective storage buffers were used.
Table 3-1. Buffers used in RFC experiments.
RFC storage buffer PCNA storage buffer Assay buffer
30 mM HEPES-NaOH, pH 7.5
30 mM HEPES-NaOH, pH 7.5
30 mM HEPES-NaOH, pH 7.5
300 mM NaCl 150 mM NaCl 150 mM NaCl 0.5 mM EDTA 0.5 mM EDTA 0.5 mM EDTA 2 mM DTT 2 mM DTT 2 mM DTT 10% glycerol 10% glycerol 2% glycerol 10 mM MgCl2
Table 3-2. Buffers used in -complex experiments.
-complex storage buffer storage buffer Assay buffer
20 mm Tris-HCl, pH 7.5 20 mm Tris-HCl, pH 7.5 20 mm Tris-HCl, pH 7.5 50 mM NaCl 50 mM NaCl 0.5 mM EDTA 0.5 mM EDTA 2 mM DTT 2 mM DTT 10% glycerol 10% glycerol 4% glycerol 8 mM MgCl2
Oligonucleotide Substrates
All the oligonucleotide substrates used in this study were purified and labeled by
another member of the Bloom laboratory. Briefly, A 60-mer template TTC AGG TCA
GAA GGG TTC TAT CTC TGT TGG CCA GAA TGT CCC TTT TAT TAC TGG TCG

38
TGT and a 26-mer primer ACA CGA CCA GTA ATA AAA GGG ACA TT were
synthesized and purified. For anisotropy experiments, an amino linker (5’ Amino
Modifier C6) was incorporated at the 5’-end of the 60-mer. This amino linker was
covalently labeled by X-rhodamine isothiocyanate (RhX) (Molecular Probes Inc.,
Eugene, OR) as described (55). For DNA-7-diethylaminocoumarin-3-carboxylic acid,
succinimidyl ester (DCC) binding experiments, the template was labeled with DCC,
(Molecular Probes) at 37th position from the 5’-end as described (40).The primer was
annealed to the template by incubating equal moles of both in a water bath at 80ºC and
allowed to slowly cool to room temperature.
Proteins
Replication Factor C (RFC)
Expression vectors
In all RFC1 constructs, the first 283 residues were deleted and replaced with a
(His)10-tag and kinase motif (70). Some RFC constructs were obtained from M.
O’Donnell (Rockefeller University) and others were made in this study (TS). Expression
vectors used to produce wild-type and mutant RFC complexes in E. coli are listed in
Table 3-3.
Table 3-3. Expression vectors used for making RFC complex.
RFC Complex Expression Vectors Coding Sequences References
Wild-type RFC pLANT/RIL pET
RFC1 and RFC5 RFC2, RFC3 and RFC4
(70) (70)
RFC WB-EQ pLANT/RIL pET pCDFDuet
RFC1 and RFC5 RFC3 and RFC4 RFC2
TS TS MOD (unpublished)
RFC WB-EA pLANT/RIL pET pCDFDuet
RFC1 and RFC5 RFC3 and RFC4 RFC2
TS TS TS
39
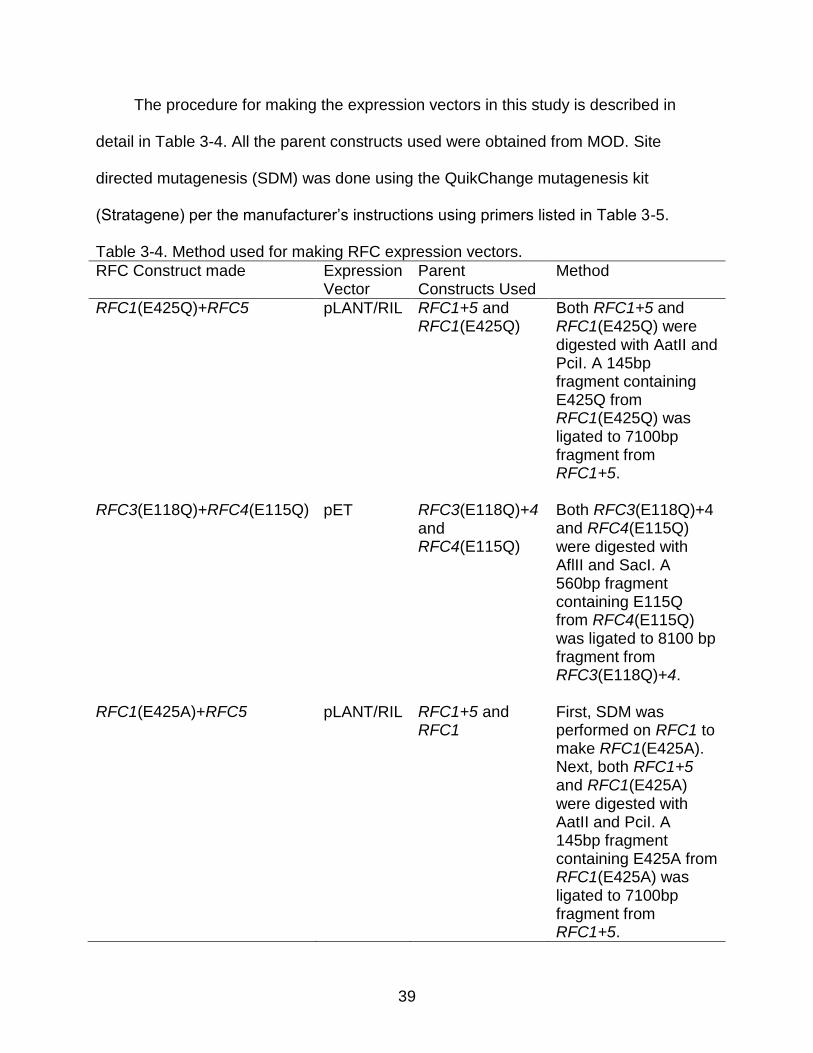
The procedure for making the expression vectors in this study is described in
detail in Table 3-4. All the parent constructs used were obtained from MOD. Site
directed mutagenesis (SDM) was done using the QuikChange mutagenesis kit
(Stratagene) per the manufacturer’s instructions using primers listed in Table 3-5.
Table 3-4. Method used for making RFC expression vectors.
RFC Construct made Expression Vector
Parent Constructs Used
Method
RFC1(E425Q)+RFC5 pLANT/RIL
RFC1+5 and RFC1(E425Q)
Both RFC1+5 and RFC1(E425Q) were digested with AatII and PciI. A 145bp fragment containing E425Q from RFC1(E425Q) was ligated to 7100bp fragment from RFC1+5.
RFC3(E118Q)+RFC4(E115Q) pET
RFC3(E118Q)+4 and RFC4(E115Q)
Both RFC3(E118Q)+4 and RFC4(E115Q) were digested with AflII and SacI. A 560bp fragment containing E115Q from RFC4(E115Q) was ligated to 8100 bp fragment from RFC3(E118Q)+4.
RFC1(E425A)+RFC5 pLANT/RIL
RFC1+5 and RFC1
First, SDM was performed on RFC1 to make RFC1(E425A). Next, both RFC1+5 and RFC1(E425A) were digested with AatII and PciI. A 145bp fragment containing E425A from RFC1(E425A) was ligated to 7100bp fragment from RFC1+5.
40
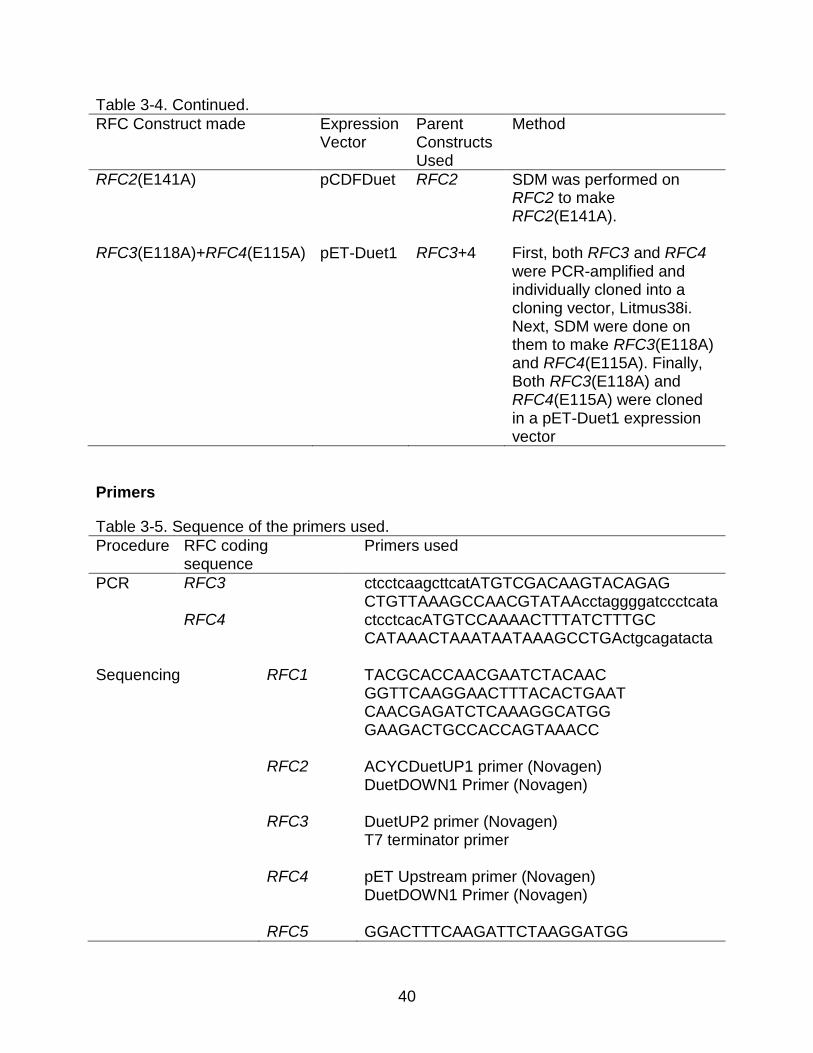
Table 3-4. Continued.
RFC Construct made Expression Vector
Parent Constructs Used
Method
RFC2(E141A) pCDFDuet
RFC2 SDM was performed on RFC2 to make RFC2(E141A).
RFC3(E118A)+RFC4(E115A) pET-Duet1 RFC3+4 First, both RFC3 and RFC4 were PCR-amplified and individually cloned into a cloning vector, Litmus38i. Next, SDM were done on them to make RFC3(E118A) and RFC4(E115A). Finally, Both RFC3(E118A) and RFC4(E115A) were cloned in a pET-Duet1 expression vector
Primers
Table 3-5. Sequence of the primers used.
Procedure RFC coding sequence
Primers used
PCR RFC3
ctcctcaagcttcatATGTCGACAAGTACAGAG CTGTTAAAGCCAACGTATAAcctaggggatccctcata
RFC4 ctcctcacATGTCCAAAACTTTATCTTTGC CATAAACTAAATAATAAAGCCTGActgcagatacta
Sequencing
RFC1 TACGCACCAACGAATCTACAAC GGTTCAAGGAACTTTACACTGAAT CAACGAGATCTCAAAGGCATGG GAAGACTGCCACCAGTAAACC
RFC2 ACYCDuetUP1 primer (Novagen) DuetDOWN1 Primer (Novagen)
RFC3 DuetUP2 primer (Novagen) T7 terminator primer
RFC4 pET Upstream primer (Novagen)
DuetDOWN1 Primer (Novagen)
RFC5 GGACTTTCAAGATTCTAAGGATGG

41
Representative vector maps for the expression vectors used to make RFC
cmplexes are shown in Figure 3-1. Detailed vector maps of pCDFDuet-RFC2 and pET-
Duet1-RFC3(E118A)+RFC4(E115A) are shown in Figure 3-2 and 3-3, respectively. The
detailed vector maps were generated using PlasmaDNA software (71) and show the
position of the RFC coding sequence in the respective Multiple Cloning Site (MCS) of
the vectors. At this point complete sequence of the pET-based and pLANT/RIL-based
expression vectors are not known, therefore their detailed maps could not be generated.
Figure 3-1. Representative maps of the final expression vectors used. A) Expression vectors used to make wt RFC complex (figure adapted from (70)), B) Expression vectors used to make RFC WB-EQ complex and C) Expression vectors used to make RFC WB-EA complex.
RFC1
RFC5
pLANT/RIL
RIL
p15A
ori
KanR
RFC4
pET(11a)
RFC2
RFC3
ColE1
ori
AmpR
LacI
RFC1
E425Q
RFC5
pLANT/RIL
RIL
p15A
ori
KanR
RFC4
E115Q
pET(11a)
RFC3
E118Q
ColE1
ori
AmpR
LacI
cDFDuet-1
RFC2
E141Q
CDF
ori
StrR
LacI
RFC1
E425A
RFC5
pLANT/RIL
RIL
p15A
ori
KanR
RFC4
E115A
pETDuet-1
RFC3
E118A
AmpR
LacI
cDFDuet-1
RFC2
E141A
CloDF13
ori
StrR
LacI
A
B
C
ColE1
ori

42
Figure 3-2. Representative map of the pCDFDuet-1-RFC2 expression vector. This vector was used to make wt RFC complex. The RFC2 coding sequence was cloned in MCS1 using NcoI and BamHI restriction sites.To make WB-EQ and WB-EA RFC complexes, E141Q and E141A mutations were made in this vector respectively.
Figure 3-3. Representative map of the pETDuet-1-RFC3(E118A)+RFC4(E115A) expression vector. This vector was used to make WB-EA RFC complex. RFC3(E118A) was cloned in MCS2 using NdeI and AvrII sites, and RFC4(E115A) was cloned in MCS1 using NcoI and PstI restriction sites.

43
Protein Overexpression and Purification
RFC purification Buffer A contains 30 mM HEPES (pH 7.5), 10% (v/v) glycerol, 0.5
mM EDTA, 1 mM DTT and 0.04% Bio-Lyte 3/10 ampholyte (Bio-Rad). RFC purification
Buffer B contains 30 mM HEPES (pH 7.5), 500 mM NaCl and 30 mM imidazole.
The expression and purification method was derived from the procedure described
(17). All RFC complexes were purified as follows. Two (for WT) or three (for mutant)
plasmids were co-transformed into E. coli strain BL21(DE3). Antibiotics used for
selection were Ampicillin (100 µg/ml), Kanamycin (50 µg/ml) and Streptomycin (50
µg/ml). Streptomycin was used only for mutants (three-vector transformation). Starter
cultures were prepared by inoculating 3 ml LB medium containing appropriate
antibiotics with one freshly transformed colony and grown at 30ºC for ~12 h. Next, 100
ml LB containing appropriate antibiotics was inoculated with 1 ml starter culture and
grown at 30ºC. Upon reaching an Optical density (OD) of 0.6, the cells were pelleted by
centrifugation at 6690 x g for 10 min. The cell pellet was resuspended in 4 ml LB and
used to inoculate 2.4 L LB, split into four flasks, containing appropriate antibiotics. The
cultures were grown again at 30ºC. Upon reaching an OD of 0.8, the cells were cooled
down to 15ºC and IPTG was added to a final concentration of 1 mM, followed by 18 h
incubation at 15ºC. Cells were harvested by centrifugation at 5000 x g for 30 min and
stored at -80ºC. For purification, the pellet was resuspended in 30 ml Buffer A
containing 1 M NaCl and lysed using a French press at 14,000 p.s.i. The lysate was
clarified by centrifugation at 18,900 x g for 30 min and slowly diluted with Buffer A to a
final NaCl concentration of 150 mM. The diluted supernatant was applied to two 5 ml Hi-
trap SP columns (GE healthcare) attached in tandem and equilibrated with buffer A
containing 150 mM NaCl. The protein was eluted in a 100 ml gradient of 150-600 mM
44
NaCl. Two peaks were obtained. The first peak at ~350 mM NaCl contained RFC sub-
complexes, while a later peak at ~450 mM NaCl contained the five-subunit RFC
complex. The fractions containing five-subunit RFC complex were pooled and dialyzed
overnight against Buffer B. The dialyzed protein was applied to a 1 ml Hi-trap chelating
column (GE healthcare) charged with NiSO4 and equilibrated with Buffer B. Protein was
eluted using a 10 ml gradient of 30-500 mM imidazole. The protein eluted in a single
peak at ~450 mM imidazole. The fractions were pooled; dialyzed against RFC storage
buffer and stored at -80ºC. The protein yield was typically 10 mg from 2.4 liters of E. coli
culture.
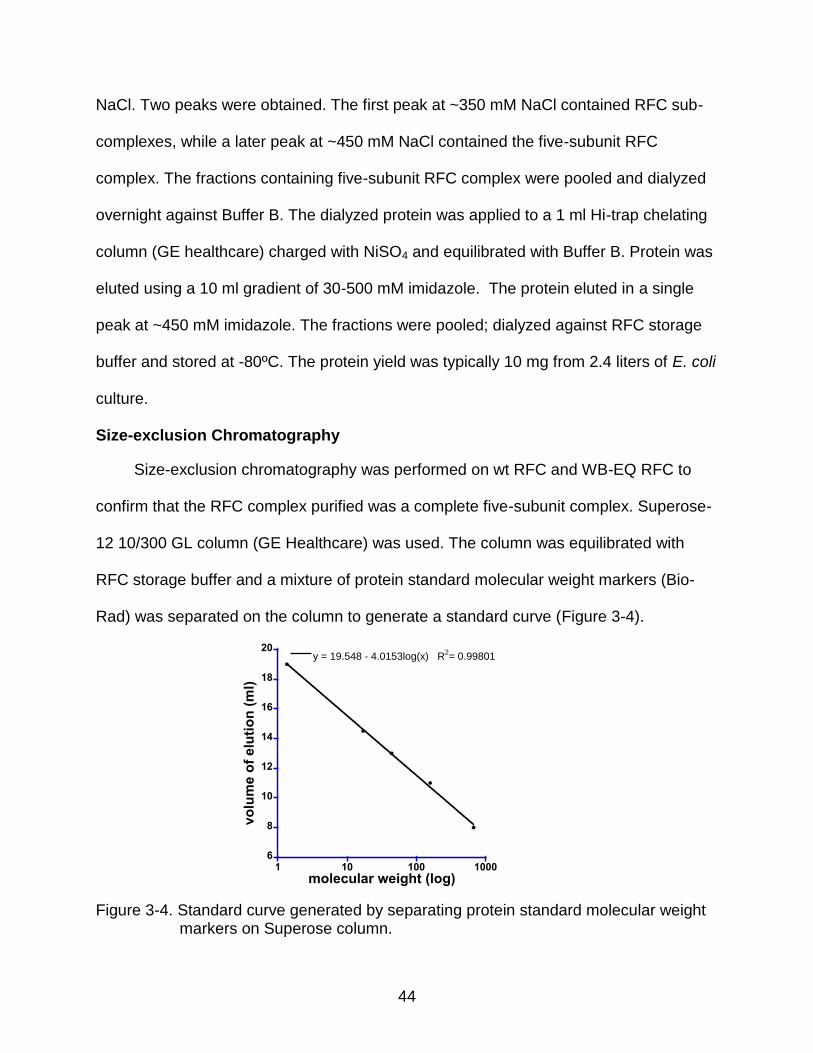
Size-exclusion Chromatography
Size-exclusion chromatography was performed on wt RFC and WB-EQ RFC to
confirm that the RFC complex purified was a complete five-subunit complex. Superose-
12 10/300 GL column (GE Healthcare) was used. The column was equilibrated with
RFC storage buffer and a mixture of protein standard molecular weight markers (Bio-
Rad) was separated on the column to generate a standard curve (Figure 3-4).
Figure 3-4. Standard curve generated by separating protein standard molecular weight markers on Superose column.
6
8
10
12
14
16
18
20
1 10 100 1000
y = 19.548 - 4.0153log(x) R2= 0.99801
vo
lum
e o
f e
luti
on
(m
l)
molecular weight (log)

45
Briefly, the protein standards were resuspended in RFC storage buffer and
centrifuged at 10,000 x g for 10 min prior to loading onto the column. An elution volume
of 30 mL was collected in 0.5 mL fractions at a flow rate of 0.5 mL/min. The peak
heights (monitored by absorbance at 280 nm) were determined and their retention time
(elution volume) was plotted against the log10 of the molecular weight of the standards.
The points were fit to a line and this standard curve was used to determine the size of
proteins eluting from the RFC samples. The column was equilibrated again with RFC
storage buffer and the purified RFC complex was loaded and eluted. The elution
method was same as for the standards, except that the fraction volume was reduced to
0.3 ml. Two peaks were obtained. A small peak (peak 1) eluted in the void volume and
a later larger peak (peak 2) eluted in the fractions corresponding exactly to the
molecular weight of the five-subunit RFC complex (218 kDa). Proteins collected in both
peaks were analyzed by SDS-Polyacrylamide gel electrophoresis (PAGE) (Figure 3-5).
Figure 3-5. SDS-PAGE analysis of fractions collected of RFC elution from Superose column. Lane 1 contains the protein size marker. Lane 2 contains previously purified RFC (loaded as standard). Lane 3 contains the peak obtained in the void volume (peak 1) and lane 4 contains the pooled fractions obtained in a later eluting peak (peak 2).

46
The SDS-PAGE analysis showed that both the peaks contained pure RFC protein.
The reason for some of the RFC eluting in void volume is not clear, but may be due to
protein aggregation. For the assays used in this study, the RFC collected in peak 2 was
used. Protein obtained in peak 1 corresponded to about 5% of the total protein
obtained, an inconsequential amount, therefore size exclusion chromatography was not
performed with other RFC protein preparations as a purification step. The RFC
concentration was determined with the Bio-Rad Bradford assay using bovine serum
albumin as standard. For calculating the molar concentration of RFC, an extinction
coefficient of 162,120 M-1cm-1 was used.
Other Proteins
-complex containing the Arg finger mutation was prepared by the O’Donnell
laboratory as described (72). All the other proteins were expressed, purified and labeled
by other members of the Bloom laboratory. These proteins included wt -complex, wt ,
pyrene-labeled and AF-488-labeled as described (44) and wt PCNA, MDCC-labeled
PCNA and AF-488-labeled PCNA as described (43). -complex containing T157A
mutation was prepared by C. Paschall (unpublished).
Steady State Assays
All steady-state measurements were made on a QuantaMaster QM1
spectrofluorometer (Photon Technology International) equipped with a 75W arc lamp
and emission monochromators with red-sensitive Hamamatsu R928 photomultiplier
tubes. All the assays were performed at room temperature using a quartz cuvette with a
3 x 3 mm light path (Hellma 105.251-QS). In all the equilibrium assays, the reagents
were added in the cuvette, followed by mixing with a pipetman (approximately 30 s) and

47
the data was recorded immediately after the mixing. Three independent experiments
were done for each assay (unless noted otherwise). The data obtained and standard
deviations were graphed and fit using Kaleidagraph (43). The average value and
standard deviation for three independent calculations are reported.
ATP Binding Assay
To measure ATP binding, a fluorescent analogue of ATP, 2’,3’-O-(2,4,6-
TrinitroPhenyl) (TNP)-ATP was used. In TNP-ATP, the fluorophore TNP is covalently
attached to the ribose moiety and undergoes change in fluorescence when ATP binds
to another molecule (73). TNP-ATP is hydrolyzable (74). In our assays, it was excited at
403 nm and emission spectra were measured over a wavelength range of 510 – 560 nm
using a 8 nm bandpass. Representative emission spectra are shown in Figure 3-6.
Figure 3-6. Representative emission spectra showing ATP binding assay. The emission spectra recorded for 1 µM TNP-ATP before adding RFC (free) and after adding 3 µM wt RFC (bound) are shown as blue and orange traces, respectively. The spectra were corrected for both buffer background and dilution effect.
-1x10⁴
0
1x10⁴
2x10⁴
3x10⁴
4x10⁴
510 520 530 540 550 560
flu
ore
sc
en
ce
(c
ps)
wavelength (nm)
free TNP-ATP
bound TNP-ATP

48
To generate each point, emission spectra were recorded after reagents were
sequentially added to the cuvette. First, assay buffer was measured for a background
signal, then 1 µM TNP-ATP for unbound ATP, and then RFC, from 0 to 3 µM (wt RFC)
or from 0 to 1 µM (mutant RFC) was added to measure the signal for bound ATP.
Storage buffer was added instead of RFC to generate the 0 nM RFC point. After
correcting for buffer background the intensity of bound ATP was divided by the intensity
for free ATP for each point. Each value at 545 nm was then divided by that obtained for
0 nM RFC, setting this point to 1, to account for the change in fluorescence due to
dilution. All other points are relative to this value. The Kd values for each were
calculated using Equation 3-1, where ATP is the total concentration of ATP, RFC is the
total concentration of RFC, Imax is the maximum intensity, and Imin is the minimum
intensity:
2d d
obs max min min
(K +RFC+ATP)- (K +RFC+ATP) -4RFCATPI = x (I -I ) + I (3-1)
2ATP
PCNA Binding Assay
To measure PCNA binding, PCNA labeled with MDCC was used. The MDCC-
based PCNA binding assay was developed by Melissa Marzahn (unpublished). Briefly,
Ser-43, which is located on the surface of PCNA to which RFC binds (24), was mutated
to Cys making a triple Ser to Cys PCNA mutant. Cys-43 was covalently labeled with an
environmentally sensitive fluorophore, MDCC, to form PCNA-MDCC. MDCC undergoes
change in fluorescence intensity upon binding to RFC (43). MDCC-labeled PCNA was
excited at 420 nm and emission spectra were measured over a wavelength range of

49
450 - 480 nm using a 3.5 nm bandpass. Representative emission spectra are shown in
Figure 3-7.
2x10⁴
4x10⁴
6x10⁴
8x10⁴
1x10⁵
1.2x10⁵
445 450 455 460 465 470 475 480
flu
ore
sc
en
ce
(c
ps
)
wavelength (nm)
free PCNA-MDCC
bound PCNA-MDCC
Figure 3-7. Representative emission spectra showing PCNA binding assay. The emission spectra recorded for 10 nM PCNA-MDCC before adding RFC (free) and after adding 1 µM wt RFC (bound) are shown as blue and orange traces respectively. The spectra were corrected for both buffer background and dilution effect.
To generate each point, emission spectra were recorded after reagents were
sequentially added to the cuvette. First, assay buffer with 500 µM ATP was measured
for a background signal, then 10 nM PCNA-MDCC for unbound PCNA, and then RFC,
from 0 to 1 µM was added to measure the signal for bound PCNA. Storage buffer was
added instead of RFC to generate the 0 nM RFC point. After correcting for buffer
background the intensity of bound PCNA was divided by the intensity for free PCNA for
each point. Each value at 470 nm was then divided by that obtained for 0 nM RFC,
setting this point to 1, to account for the change in fluorescence due to dilution. All other

50
points are relative to this value. The Kd values for each were calculated using Equation
3-2, where clamp is the total concentration of PCNA, clamp loader is the total
concentration of RFC, Imax is the maximum intensity, and Imin is the minimum intensity:
2d d
obs max min
min
(K +clamp loader+clamp)- (K +clamp loader+clamp) -4 clamp loader x clampI = x (I -I )
2clamp
+ I (3-2)
Binding Assay
To measure binding, labeled with pyrene was used. Pyrene is also an
environmentally sensitive fluorophore and undergoes change in fluorescence intensity
upon binding to -complex (66). Pyrene-based binding assay was developed by
Jennifer Thompson (66). Briefly, Gln-299, which is located on the surface of to which
-complex binds, was mutated to Cys making a double Gln to Cys mutant and Cys-
299 was covalently labeled with pyrene. Pyrene-labeled was excited at 345 nm and
emission spectra were measured over a wavelength range of 355 – 435 nm using a 4
nm bandpass. Representative emission spectra are shown in Figure 3-8. To generate
each point, emission spectra were recorded after reagents were sequentially added to
the cuvette. First, assay buffer with 500 µM ATP was measured for a background
signal, then 10 nM -pyrene for unbound , and then -complex, from 0 to 1 µM was
added to measure the signal for bound . Storage buffer was added instead of -
complex to generate the 0 nM -complex point. After correcting for buffer background
the intensity of bound was divided by the intensity for free for each point. Each value
at 375 nm was then divided by that obtained for 0 nM -complex, setting this point to 1,
to account for the change in fluorescence due to dilution. All other points are relative to

51
this value. The Kd values for each were calculated using Equation 3-2, where clamp is
the total concentration of , clamp loader is the total concentration of -complex, Imax is
the maximum intensity, and Imin is the minimum intensity.
Figure 3-8. Representative emission spectra showing binding assay. The emission
spectra recorded for 10 nM -pyrene before adding -complex (free) and
after adding 960 nM wt -complex (bound) are shown as blue and orange traces respectively. The spectra were corrected for both buffer background and dilution effect.
PCNA Opening Assay
To measure PCNA opening, PCNA labeled with AF488 was used. This assay was
developed by Jennifer Thompson (67), in which three naturally occurring Cys residues
on the surface of PCNA were converted to Ser to avoid any labeling at these sites. Two
new Cys residues were introduced by mutating Ile-111 and Ile-181, which are located at
the opening interface of PCNA. Finally, Cys-111 and Cys-181 were labeled with AF-

52
488. The AF-488 based opening assay takes advantage of the property that two
fluorophores within close proximity will self-quench. When RFC is added to AF488-
labeled PCNA , the fluorophores move away from each other and the quenching is
relieved (67).The assay was done similar to the PCNA binding assay except that
AF488-labeled PCNA was excited at 495 nm and emission spectra were measured over
a wavelength range of 505 – 545 nm using a 2.5 nm bandpass. The emission was
recorded at 517 nm. Kd values for each were calculated using Equation 3-2.
Representative emission spectra are shown in Figure 3-9.
1x10⁴
2x10⁴
3x10⁴
4x10⁴
5x10⁴
6x10⁴
7x10⁴
8x10⁴
500 510 520 530 540 550
flu
ore
sc
en
ce
(c
ps
)
wavelength (nm)
free PCNA-AF488
bound PCNA-AF488
Figure 3-9. Representative emission spectra showing PCNA opening assay. The emission spectra recorded for 10 nM PCNA-AF488 before adding RFC (free) and after adding 1 µM wt RFC (bound) are shown as blue and orange traces respectively. The spectra were corrected for both buffer background and dilution effect.

53
Opening Assay
Figure 3-10. Representative emission spectra showing opening assay. The emission
spectra recorded for 10 nM -AF488 before adding -complex (free) and
after adding 1 µM wt -complex (bound) are shown as blue and orange traces respectively. The spectra were corrected for both buffer background and dilution effect.
To measure opening, labeled with AF488 was used. This assay was
developed by Christopher Paschall (44) and works on the same principle as the PCNA
opening assay. Briefly, two surface Cys residues of were converted to Ser and two
new Cys residues were introduced by mutating Arg-103 and Ile-305 to Cys. This
allowed selective labeling of Cys-103 and Cys-305, which are located on the opening
interface of , with AF-488. The assay was done similar to the binding assay except
that AF488-labeled was excited at 495 nm and emission spectra were measured over
a wavelength range of 505 – 545 nm using 2.5 nm bandpass. The emission was

54
recorded at 517 nm. Kd values for each were calculated using Equation 3-2.
Representative emission spectra are shown in Figure 3-10.
DNA Binding Assay
DNA-DCC Based Assay
2x10⁴
4x10⁴
6x10⁴
8x10⁴
1x10⁵
450 460 470 480 490 500 510 520
flu
ore
sc
en
ce
(c
ps
)
wavelength (nm)
Figure 3-11. Representative emission spectra showing DNA-DCC based binding assay. The emission spectra recorded for 20 nM DNA-DCC before adding RFC (free), after adding 1 µM wt RFC (bound), and finally after adding 2 µM PCNA are shown as blue, orange and green traces respectively. The spectra were corrected for both buffer background and dilution effect.
To measure DNA binding, DNA was labeled with DCC. In this assay, DCC is
located 3 nt away from the primer 3’ end and any change in the DCC fluorescence upon
binding of the clamp loader reports on the binding at p/t junction (40). The assay was
done similar to the PCNA binding assay except that DNA-DCC was excited at 440 nm
and emission spectra were measured over a wavelength range of 460 – 510 nm using a
5 nm bandpass. Representative emission spectra are shown in Figure 3-11. First, assay

55
buffer with 500 µM ATPS was measured for a background signal, then 20 nM DNA-
DCC for unbound DNA, and then RFC, from 0 to 1 µM was added to measure the signal
for bound DNA. Finally, 2 µM PCNA was added to the cuvette to measure the signal for
bound DNA in presence of PCNA. Emission was recorded at 475 nm. Kd values for
each were calculated using Equation 3-2, except that clamp value was substituted by
DNA value.
DNA-RhX Based Assay
For measuring DNA binding, an anisotropy-based assay was also used. Primed
template DNA was covalently labeled with X-rhodamine (RhX) on the 5’-template end.
The anisotropy of RhX increases when clamp loader binds p/t-DNA-RhX (55). Steady-
state anisotropy measurements were made with polarizers (Glan-Thompson). Samples
were excited at 585 nm with vertically and horizontally polarized light using a 8 nm
bandpass and both horizontal and vertical emissions were monitored at 605 nm for 30 s
and the average value was calculated. Representative spectra are shown in Figure 3-
12. Anisotropy values were calculated using a G factor, to account for polarization bias
Equation 3-3, determined under the same experimental conditions:
HV(DNA) HV(bkgd)
HH(DNA) HH(bkgd)
I -IG =
I -I (3-3)
To generate each point, polarized emissions were recorded after reagents were
sequentially added to the cuvette. First, assay buffer with 500 µM ATPS was added for
background signal, then 20 nM DNA-RhX for the free DNA signal, then RFC from 0 to 1
µM for the bound DNA, and then 2 µM PCNA for the bound DNA signal in presence of
PCNA were added. Anisotropy values were calculated using Equation 3-4, where IVV

56
and IVH are vertical and horizontal intensities, respectively, when excited with vertically
polarized light:
vv VV(bkgd) VH VH(bkgd)
vv VV(bkgd) VH VH(bkgd)
I -I - G(I -I )r =
I -I + 2G(I -I ) (3-4)
Kd values for each were calculated using Equation 3-2, except that clamp value was
substituted by DNA value.
For -complex DNA-RhX binding assay, similar experiments were done except that
25 nM DNA-RhX was used. For the bound DNA signal, 0 to 1 µM -complex was added
and for bound DNA in presence of , 4 µM was added.
7000
8000
9000
1x10⁴
1.1x10⁴
1.2x10⁴
0 5 10 15 20 25 30 35
flu
ore
sc
en
ce
(cp
s)
time (s)
Figure 3-12. Representative emission spectra showing DNA-RhX based binding assay. For simplicity, only the spectra recorded after exciting the samples with vertically polarized light are shown. The horizontal and vertical emission spectra recorded for 20 nM DNA-RhX before adding RFC (free) are shown as dark blue solid and light blue dotted traces, respectively. The horizontal and vertical emission spectra recorded after adding 1 µM RFC (free) are shown as dark orange solid and light orange dotted traces respectively. Finally, the horizontal and vertical emission spectra recorded after adding 2 µM PCNA are shown dark green solid and light green dotted traces, respectively. The spectra were corrected for buffer background.

57
ATP Hydrolysis Assay
ATPase activity was measured using an enzyme-coupled reaction in which the
production of ADP is coupled to the depletion of NADH by pyruvate kinase (PK) and
lactate dehydrogenase (LDH) (75, 76). The rate of NADH depletion was monitored by
fluorescence spectrometry. NADH was excited at 340 nm and emission was measured
at 460 nm using a 2 nm bandpass. A representative spectrum is shown in Figure 3-13.
1.15x10⁵
1.2x10⁵
1.25x10⁵
1.3x10⁵
1.35x10⁵
1.4x10⁵
100 200 300 400 500 600 700
time (s)
flu
ore
sc
en
ce
(c
ps
)
Figure 3-13. Representative emission spectrum showing ATP hydrolysis assay. The emission spectrum was recorded for the sample containing 1 µM DNA and all other reagents at specified concentrations except RFC for 100 s (not shown) followed by addition of wt RFC at 100 s and recording the spectrum for another 500 s (orange trace). The slope represents [ADP]/time.
The ATPase activity was measured by continuously monitoring the oxidation of
NADH to NAD+. To the assay buffer, 1 mM phosphoenolpyruvate, 0.2 mg/mL NADH, 68
units/mL PK, 99 units/mL LDH, 0.5 mM ATP and varying concentrations of p/t DNA
were added and mixed. For measuring the ATPase activity in presence of , 1 µM
was also added in the reaction mix. The reaction was then started by adding 0.45 μM

58
RFC or 0.25 µM -complex. The reaction velocity was linearly fit to the slope of data
recorded over a time period of 100 - 600 s. Storage buffer was added instead of RFC or
-complex to obtain the dilution effect on NADH fluorescence.
To calculate the concentration of ATP hydrolyzed/s, a standard curve was
generated by adding all the above reagents except ATP, DNA and RFC or -complex.
Known quantities (0-200 µM) of ADP were added and the change in NADH
fluorescence was measured (Figure 3-14). The ADP data was fit to a linear curve and
the slope obtained was used to convert the slopes obtained from the ATPase data to
nM ATP hydrolyzed/s.
0
1x10⁴
2x10⁴
3x10⁴
4x10⁴
5x10⁴
6x10⁴
0 50 100 150 200 250
y = -5978.5 + 301.2x R2= 0.95977
ch
an
ge
in
flu
ore
sc
en
ce
(c
ps
)
ADP (µM)
Figure 3-14. A representative standard curve used in ATP hydrolysis assay. The curve was generated by adding known quantities of ADP to the sample containing all the reagents for coupled ATP hydrolysis assay except RFC, ATP and DNA. The slope represents fluorescence intensity/[ADP].

59
Pre-Steady State PCNA Opening Assay
Stopped-flow fluorescence measurements were made using a SX20MV stopped-
flow fluorometer (Applied Photophysic, Ltd.). Single mix experiments were performed
mixing equal volumes of a solution of PCNA-AF488 and ATP to a solution of RFC and
ATP. The reaction was excited at 495 nm using a 3.7 nm bandpass and emission was
measured using a 515 nm cut-on filter. Measurements were collected for 5 s, and three
or more individual kinetic traces were averaged. Time courses were corrected for
background by subtracting the signal for buffer. Three independent experiments were
done and one is shown. The time courses were empirically fit using KaleidaGraph
software to a single exponential Equation 3-5, in which a is the amplitude, kobs is the
observed rate constant, and t is the reaction time.
obs-k t y = a (1- e ) + c
(3-5)
Assays Containing ATPS
All the experiments with ATPS were done in a similar way to the experiments
done with ATP except that, 0.5 µM ATP was replaced with 0.5 µM ATPS.

60
CHAPTER 4 NOVEL FUNCTIONS FOR THE CONSERVED ‘GLU’ RESIDUE IN THE WB MOTIF OF
RFC
Background Information
The S. cerevisiae clamp loader, RFC, is a pentameric protein complex and a
member of the AAA+ protein family. Like other AAA+ proteins, RFC contains conserved
residues in AAA+ motifs that interact with ATP, such as WA, WB, Sensor 1, Sensor 2
and Arg finger motifs. Studies with various P-loop type NTPases have shown that
mutation of the WB ‘Glu’ residue impairs ATP hydrolysis, but has no effect on ATP
binding (8, 11-13). This study aims to determine if the RFC WB motif is involved in
functions in addition to ATP hydrolysis. All five subunits of RFC, named Rfc1 to 5, likely
bind ATP, but only four can hydrolyze ATP. Rfc5 has a non-consensus WB motif (‘Asn’
at position 141 instead of ‘Asp’), does not have a contribution from the Arg finger motif
and therefore does not hydrolyze ATP (Figure 4-1).
Figure 4-1. Sequence of the WB motif in each of the RFC subunits. The sites sharing identical residues are shaded black and those sharing similar residues are shaded gray. Note that the WB motif in Rfc5 differs from the consensus sequence.
RFC loads the S. cerevisiae sliding clamp, PCNA onto p/t junctions during
replication. The clamp loading reaction involves binding PCNA, opening the PCNA ring,

61
binding DNA, closing the PCNA ring around the DNA and finally releasing the
PCNA•DNA product. Binding and opening PCNA and binding the DNA are stimulated in
the presence of ATP and none of these steps require ATP hydrolysis (34). It is believed
that each interaction RFC makes with ATP or other ligands, such as PCNA or DNA,
leads to conformational changes within its pentameric assembly, facilitating the next
step of the clamp loading reaction (34, 35). We have made mutations in the WB motif of
RFC. The ‘Glu’ (D) residue was mutated to ‘Gln’ (Q) or ‘Ala’ (A) in all four ATPase
subunits, Rfc1 to 4, creating two types of RFC mutants referred to as WB-EQ and WB-
EA, respectively. We have used fluorescence-based assays to study each step of the
clamp loading reaction. Our data shows that WB mutations affect ligand-dependent
conformational changes.
Results
Equilibrium PCNA Binding
WB mutations in AAA+ proteins are known to affect ATP hydrolysis, but show no
effect on ATP binding (8, 11-13). As a result, the activities related to ATP binding should
only be affected if WB motif is involved in making conformational changes. To test this
hypothesis, we measured PCNA binding to RFC to determine if WB mutations have any
effect on binding. A fluorescence intensity based binding assay (43) was used to
measure equilibrium binding of PCNA to RFC. Briefly, PCNA was labeled with an
environmentally sensitive fluorophore MDCC and the fluorescence of 10 nM MDCC-
labeled PCNA (PCNA-MDCC) was measured in the presence of 0.5 mM ATP and
increasing concentrations of RFC. Binding of RFC to PCNA-MDCC increased the
fluorescence of MDCC in a concentration-dependent manner as expected for an
equilibrium binding reaction. The fold change in fluorescence intensity was plotted
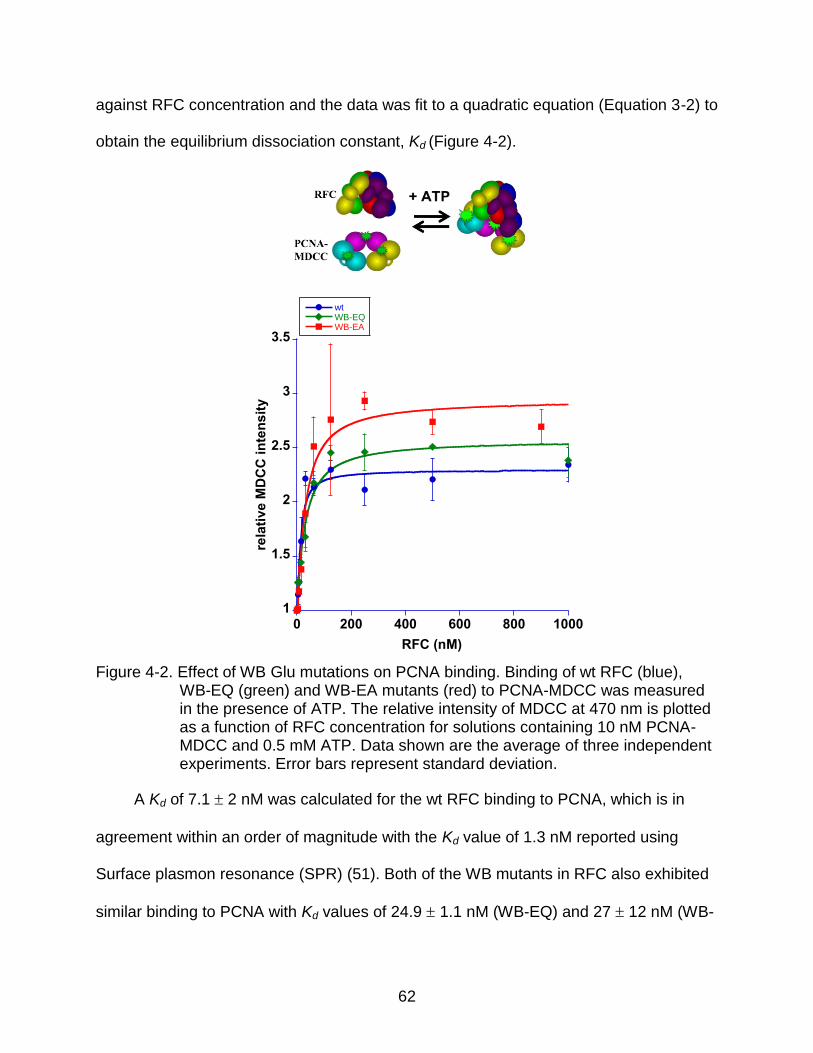
62
against RFC concentration and the data was fit to a quadratic equation (Equation 3-2) to
obtain the equilibrium dissociation constant, Kd (Figure 4-2).
Figure 4-2. Effect of WB Glu mutations on PCNA binding. Binding of wt RFC (blue), WB-EQ (green) and WB-EA mutants (red) to PCNA-MDCC was measured in the presence of ATP. The relative intensity of MDCC at 470 nm is plotted as a function of RFC concentration for solutions containing 10 nM PCNA-MDCC and 0.5 mM ATP. Data shown are the average of three independent experiments. Error bars represent standard deviation.
A Kd of 7.1 2 nM was calculated for the wt RFC binding to PCNA, which is in
agreement within an order of magnitude with the Kd value of 1.3 nM reported using
Surface plasmon resonance (SPR) (51). Both of the WB mutants in RFC also exhibited
similar binding to PCNA with Kd values of 24.9 1.1 nM (WB-EQ) and 27 12 nM (WB-
1
1.5
2
2.5
3
3.5
0 200 400 600 800 1000
wtWB-EQWB-EA
RFC (nM)
rela
tive
MD
CC
in
ten
sit
y

63
EA). These data show that WB mutations result in a ~4-fold decrease in the affinity of
RFC for PCNA. More interestingly, the Kd values for the mutants are similar to the Kd
obtained for wt RFC in absence of ATP, which is 28 8 nM (67), suggesting a defect in
mutants in responding to ATP.
PCNA Ring Opening
As with PCNA binding, PCNA opening is also stimulated in the presence of ATP,
but does not need ATP hydrolysis. To determine if the WB mutations affect PCNA
opening also, the opening was measured by using a different fluorescence-based assay
(67). Briefly, the opening interface of PCNA was labeled with a self-quenching
fluorophore, AF488. Opening of the PCNA at the interface results in the fluorophores
moving away from each other and relief of quenching.
Equilibrium PCNA Opening in the Presence of 0.5 mM ATP
The fluorescence of 10 nM AF488 labeled PCNA (PCNA-AF488) was measured in
presence of 0.5 mM ATP and increasing concentration of RFC. The fold change in
fluorescence intensity was plotted against RFC concentration (Figure 4-3). Two
important types of information can be obtained from this assay. The relative values of
AF488 intensity reflect the fraction of PCNA molecules in an open conformation, and the
Kd value calculated from the opening data is a measure of the binding affinity of RFC to
the AF488 labeled PCNA. The fluorescence intensity of PCNA-AF488 increased by a
factor of about 2 at saturating concentrations of wt RFC. Surprisingly, the WB mutants
gave only about a 1.2-fold increase in AF488 fluorescence. These data indicate that at
equilibrium, wt RFC forms about 5 times more open RFC•PCNA complex than is formed
with either of the WB mutant RFC complexes.
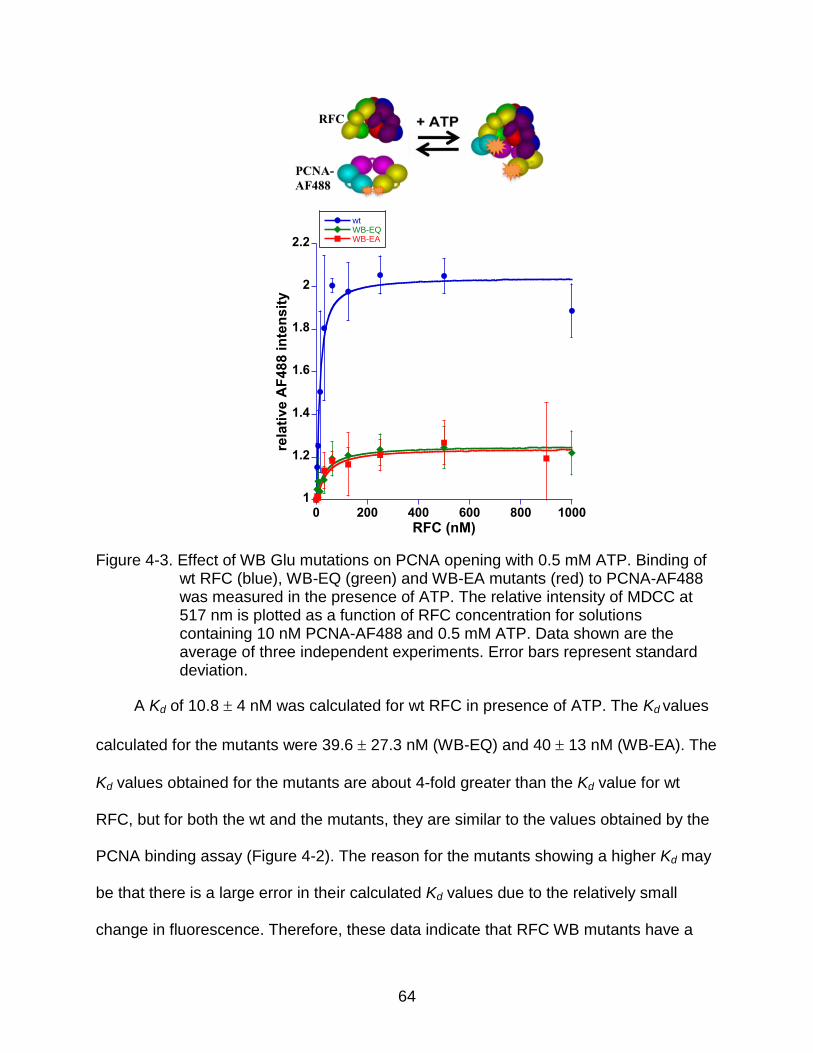
64
Figure 4-3. Effect of WB Glu mutations on PCNA opening with 0.5 mM ATP. Binding of wt RFC (blue), WB-EQ (green) and WB-EA mutants (red) to PCNA-AF488 was measured in the presence of ATP. The relative intensity of MDCC at 517 nm is plotted as a function of RFC concentration for solutions containing 10 nM PCNA-AF488 and 0.5 mM ATP. Data shown are the average of three independent experiments. Error bars represent standard deviation.
A Kd of 10.8 4 nM was calculated for wt RFC in presence of ATP. The Kd values
calculated for the mutants were 39.6 27.3 nM (WB-EQ) and 40 13 nM (WB-EA). The
Kd values obtained for the mutants are about 4-fold greater than the Kd value for wt
RFC, but for both the wt and the mutants, they are similar to the values obtained by the
PCNA binding assay (Figure 4-2). The reason for the mutants showing a higher Kd may
be that there is a large error in their calculated Kd values due to the relatively small
change in fluorescence. Therefore, these data indicate that RFC WB mutants have a
1
1.2
1.4
1.6
1.8
2
2.2
0 200 400 600 800 1000
wtWB-EQWB-EA
rela
tiv
e A
F48
8 i
nte
ns
ity
RFC (nM)

65
lower affinity for PCNA than does wt RFC. The PCNA binding assay (Figure 4-2) also
indicated a lower affinity of the WB mutants for PCNA.
Equilibrium PCNA Opening in the Presence of Excess ATP
The RFC WB mutants showed weaker opening of the PCNA ring (Figure 4-3), and
one possible explanation for this would be that the mutants bind ATP with decreased
affinity. As a result, they cannot open PCNA well. If this is true, then adding more ATP
should stimulate PCNA opening by the mutants. To determine if that is true, the
equilibrium PCNA opening assay was performed in a different manner. The opening of
10 nM PCNA-AF488 by 250 nM RFC was measured in the presence of increasing
concentrations of ATP. The fold change in emission intensity was plotted against ATP
concentration (Figure 4-4).
Figure 4-4. Effect of RFC WB Glu mutations on PCNA opening with excess ATP. Binding of wt RFC (blue), the WB-EQ mutant (green) and the WB-EA mutant (red) to PCNA-AF488 was measured in the presence of ATP at the concentrations indicated. The relative intensity of AF488 at 517 nm is plotted as a function of ATP concentration for solutions containing 10 nM PCNA-AF488 and 250 nM each RFC. Data shown are the average of three independent experiments (wt and WB-EQ mutant) and two independent experiments (WB-EA mutant). Error bars represent standard deviation.

66
The mutants did not show any further opening at higher ATP concentrations. At all
ATP concentrations measured the mutants showed ~1.2 fold change in the AF488
fluorescence, compared to ~2 fold change observed for the wt RFC. This suggests that,
the poor PCNA opening is not because of a defect in ATP binding. Another interesting
observation was that the same fraction of PCNA molecules are open for the mutants in
the presence of ATP as for wt RFC in the absence of ATP (0 mM ATP). This suggests
that, with respect to the PCNA opening activity, the WB mutants do not respond to ATP.
Pre-steady State PCNA Opening
The RFC WB mutants showed weak opening of the PCNA ring (Figure 4-3 and 4-
4). To study the rate at which these mutants open the PCNA ring, pre-steady state
opening was measured. RFC (final concentration 200 nM) and PCNA-AF488 (final
concentration 20 nM) were mixed rapidly using stopped-flow in the presence of 0.5 mM
ATP and the reaction was monitored in real-time. An apparent opening rate of 2.7 0.7
s-1, 43.1 9.7 s-1 and 46.6 15 s-1 was calculated for the wt, WB-EQ and WB-EA RFC,
respectively (Figure 4-5). The rate obtained for the wt is in agreement with the rate of
2.23 0.02 s-1, reported using a FRET-based assay (77).
It is important to note here that the rates obtained are apparent rates (kobs) of
opening, in other words, a combination of kon (rate of opening PCNA) and koff (rate of
closing PCNA). Large kobs values may be observed due to a large kon or a large koff.
Therefore, a higher apparent rate for the WB mutants does not necessarily mean that
they open PCNA faster; rather it indicates that they approach the PCNA equilibrium
faster than wt RFC. The fluorescence intensity levels at reaction end points were the
same as observed in steady-state assays (Figure 4-3).

67
Figure 4-5. Effect of RFC WB Glu mutations on rate of PCNA ring opening. Stopped-flow fluorescence measurements were made in which a solution of RFC and ATP was added to a solution of PCNA and ATP. Final concentrations after mixing were 20 nM PCNA-AF488, 200 nM RFC and 0.5 mM ATP. Three independent experiments were done for wt RFC (blue trace), the WB-EQ mutant (green trace), the WB-EA mutant (red trace). Representative time courses are shown. The data for individual time courses fit to a single exponential rise (black traces), and the average values of the observed rate constants are given in the text.
Taken together, the PCNA opening data (Figure 4-3, 4-4 and 4-5) suggest that the
RFC WB mutations exert a large effect on PCNA opening.
1
1.2
1.4
1.6
1.8
2
0 0.5 1 1.5 2
wtWB-EQWB-EA
time (s)
rela
tiv
e A
F48
8 i
nte
ns
ity

68
Equilibrium DNA Binding
DNA binding by RFC requires ATP binding, but not hydrolysis (61). Therefore, we
would not expect the WB mutations to affect DNA binding. However, given that the WB
Glu mutations affect other ATP-dependent interactions, the effects of these mutations
on DNA binding were measured. DNA binding is stimulated in the presence of PCNA
(34, 72), therefore, the effect of PCNA on DNA binding was also measured. In all the
DNA binding assays, ATPS was used instead of ATP because p/t DNA triggers ATP
hydrolysis, which leads to the release of PCNA and DNA. Thus, DNA binding cannot be
measured under equilibrium conditions in assays with ATP.
DNA-DCC Based Assay
A 26/60 mer p/t DNA labeled with DCC was used (40). In this assay, the
fluorophore, DCC is located at 3 nt away from the p/t junction and any change in the
DCC fluorescence upon binding of the clamp loader reports on the binding at the p/t
junction. To the cuvette, 0.5 mM ATPS, 20 nM DNA-DCC, 0-1 µM RFC and 2 µM
PCNA were added sequentially and the change in fluorescence intensity was recorded
(Figure 4-6). DNA binding was measured for wt RFC and the data collected in the
absence and presence of PCNA were plotted separately. The Kd values calculated were
33 nM and 16 nM in the absence and presence of PCNA, respectively. The experiment
was performed only once. Although, the DCC fluorescence changed with RFC in a
concentration dependent manner and followed a binding curve, the end points with and
without PCNA were very different. This may be due to the fact that DCC interacts
differently with RFC with and without PCNA. If that is the case, then this assay cannot

69
be used to compare DNA binding with and without PCNA. Therefore, another assay
based on fluorescence anisotropy was used to measure the equilibrium DNA binding.
Figure 4-6. DCC-based equilibrium DNA binding. Binding of wt RFC to DNA was measured in the absence (blue) and presence (black) of PCNA. The relative intensity of DCC at 475 nm is plotted as a function of RFC concentration for
solutions containing 20 nM DNA-DCC, 0.5 mM ATPS and 2 µM PCNA. Data shown represent single experiment.
DNA-RhX Based Assay
An assay based on anisotropy was used to measure the DNA binding of RFC. A
26/60 mer p/t DNA labeled with RhX was used (55). In this assay, the fluorophore, RhX
is located at the 5’ end of the template and anisotropy of RhX increases when RFC
1
1.1
1.2
1.3
1.4
1.5
1.6
1.7
0 200 400 600 800 1000
- PCNA+ PCNA
RFC (nM)
rela
tive
DC
C i
nte
ns
ity
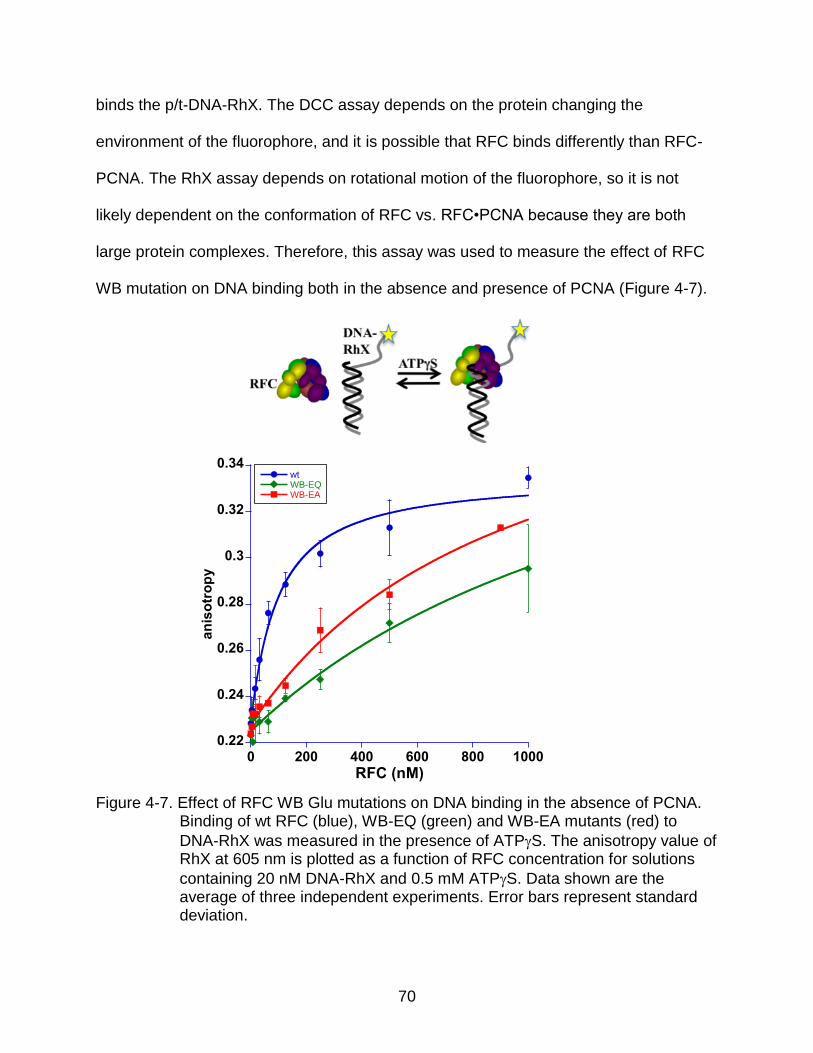
70
binds the p/t-DNA-RhX. The DCC assay depends on the protein changing the
environment of the fluorophore, and it is possible that RFC binds differently than RFC-
PCNA. The RhX assay depends on rotational motion of the fluorophore, so it is not
likely dependent on the conformation of RFC vs. RFC•PCNA because they are both
large protein complexes. Therefore, this assay was used to measure the effect of RFC
WB mutation on DNA binding both in the absence and presence of PCNA (Figure 4-7).
Figure 4-7. Effect of RFC WB Glu mutations on DNA binding in the absence of PCNA. Binding of wt RFC (blue), WB-EQ (green) and WB-EA mutants (red) to
DNA-RhX was measured in the presence of ATPS. The anisotropy value of RhX at 605 nm is plotted as a function of RFC concentration for solutions
containing 20 nM DNA-RhX and 0.5 mM ATPS. Data shown are the average of three independent experiments. Error bars represent standard deviation.
0.22
0.24
0.26
0.28
0.3
0.32
0.34
0 200 400 600 800 1000
wtWB-EQWB-EA
RFC (nM)
an
iso
tro
py

71
To the cuvette, 0.5 mM ATPS, 20 nM DNA-RhX, 0-1 µM RFC and 2 µM PCNA
were added sequentially and the polarized intensities were recorded. From these
measurements, the anisotropies were calculated. The data collected for the absence
and presence of PCNA are plotted on separate graphs.
Figure 4-8. Effect of RFC WB Glu mutations on DNA binding in the presence of PCNA. Binding of wt RFC (blue), WB-EQ (green) and WB-EA mutants (red) to
DNA-RhX was measured in the presence of ATPS and PCNA. The anisotropy value of RhX at 605 nm is plotted as a function of RFC
concentration for solutions containing 20 nM DNA-RhX, 0.5 mM ATPS and 2 µM PCNA. Data shown are the average of three independent experiments. Error bars represent standard deviation.
0.2
0.22
0.24
0.26
0.28
0.3
0.32
0.34
0 200 400 600 800 1000
wtWB-EQWB-EA
RFC (nM)
an
iso
tro
py

72
Figure 4-7 and 4-8 represent DNA binding in the absence and presence of PCNA,
respectively. The Kd values calculated from DNA binding data in the absence of PCNA
were 91 28 nM (wt RFC), 692 399 nM (WB-EQ) and 1058 197 nM (WB-EA). The
WB mutants clearly show reduced binding to the p/t DNA. The Kd values calculated from
DNA binding data in the presence of PCNA were 37 13 nM (WT), 460 200 nM (WB-
EQ) and 1820 720 nM (WB-EA). The Kd obtained for wt RFC are slightly higher than
15 nM (without PCNA) and 5 nM (with PCNA) Kd values reported using SPR assays
(51). The difference may be due to different types of assays used in the two studies.
Our data suggest that PCNA stimulates DNA binding by the wt RFC slightly, but in the
case of WB mutants, there is very little or no stimulation. These data support our PCNA
opening results that, because the WB mutants are less efficient PCNA openers, the
PCNA stimulation of DNA binding is also hampered.
DNA binding experiments were performed in the presence of ATPS, which does
not support PCNA opening to the full extent (discussed in Chapter 7). Therefore, it is
possible that the PCNA stimulation of DNA binding is greater for wt RFC, WB mutants
or both. With that caveat, our DNA binding data indicates that WB mutations not only
affect PCNA opening but also the downstream steps in the clamp loading reaction.
Equilibrium ATP Binding
WB mutations do not affect ATP binding (8, 11-13), but given that all the clamp
loading steps coupled with ATP binding are affected, ATP binding was also measured.
For this assay, ATP labeled with a fluorophore TNP was used. Briefly, the fluorescence
of 1 µM TNP-ATP was measured with increasing concentration of RFC. Binding of RFC
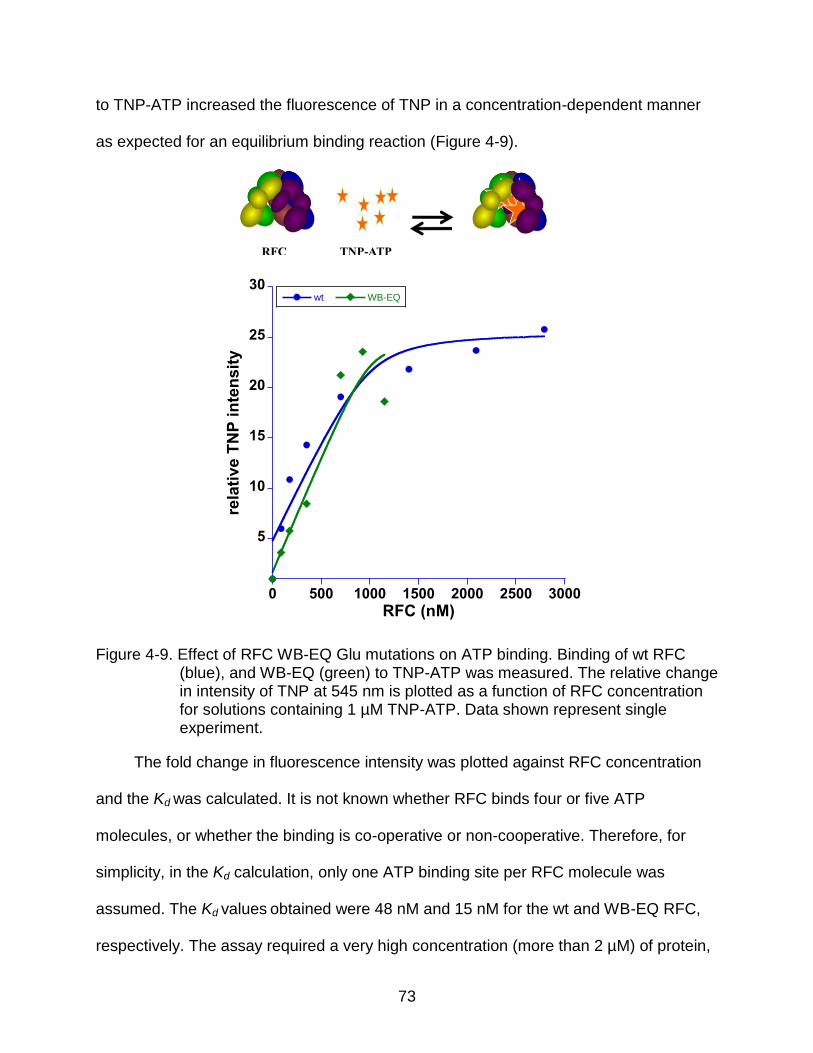
73
to TNP-ATP increased the fluorescence of TNP in a concentration-dependent manner
as expected for an equilibrium binding reaction (Figure 4-9).
Figure 4-9. Effect of RFC WB-EQ Glu mutations on ATP binding. Binding of wt RFC (blue), and WB-EQ (green) to TNP-ATP was measured. The relative change in intensity of TNP at 545 nm is plotted as a function of RFC concentration for solutions containing 1 µM TNP-ATP. Data shown represent single experiment.
The fold change in fluorescence intensity was plotted against RFC concentration
and the Kd was calculated. It is not known whether RFC binds four or five ATP
molecules, or whether the binding is co-operative or non-cooperative. Therefore, for
simplicity, in the Kd calculation, only one ATP binding site per RFC molecule was
assumed. The Kd values obtained were 48 nM and 15 nM for the wt and WB-EQ RFC,
respectively. The assay required a very high concentration (more than 2 µM) of protein,
5
10
15
20
25
30
0 500 1000 1500 2000 2500 3000
wt WB-EQ
rela
tive
TN
P in
ten
sit
y
RFC (nM)

74
which was not attained in our protein preparations, and thus could not be repeated or
performed with the WB-EA mutant. With that caveat, our data from a single experiment
with wt and WB-EQ RFC suggest that, the WB mutation has little or no effect on ATP
binding.
ATP Hydrolysis
The WB Glu residue is believed to activate a water molecule for ATP hydrolysis;
therefore, WB mutations are expected to result in weaker ATP hydrolysis. Steady state
ATP hydrolysis was measured using PK/LDH coupled oxidation of NADH (75, 76). In
this assay, one molecule of ADP formation corresponds to one molecule of NAD+
generated. We measured the conversion of NADH to NAD+ by following the decrease in
fluorescence at 460 nm. A standard curve was generated by adding known amounts of
ADP to the coupled enzyme system, and this curve was used to convert rates of ATP
hydrolysis in fluorescence units per time to concentration units per time (Figure 4-10).
ATP hydrolysis was measured at 450 nM RFC and different concentrations of DNA. The
assay contained 0.5 mM ATP, which is about 50-fold higher than the Km reported for wt
RFC (78). The steady-state hydrolysis rates obtained from ATPase data in the absence
of DNA were 17.4 0.4 (wt), 15.3 2.1 (WB-EQ) and 9.3 3.9 (WB-EA) nMs-1. Hence,
the basal rate of ATP hydrolysis does not appear to be affected by the mutations. On
the other hand, the effect of the WB mutations on DNA-stimulated ATPase activity was
large. In assays with 2 µM DNA, ATP hydrolysis rates were 125 20 (WT), 16 1 (WB-
EQ) and 11 1 (WB-EA) nMs-1. While adding DNA exhibits a profound and
concentration dependent stimulation of wt RFC ATPase activity, it does not stimulate
that of the mutant complexes. Based on fractions of RFC bound at 2 µM DNA calculated
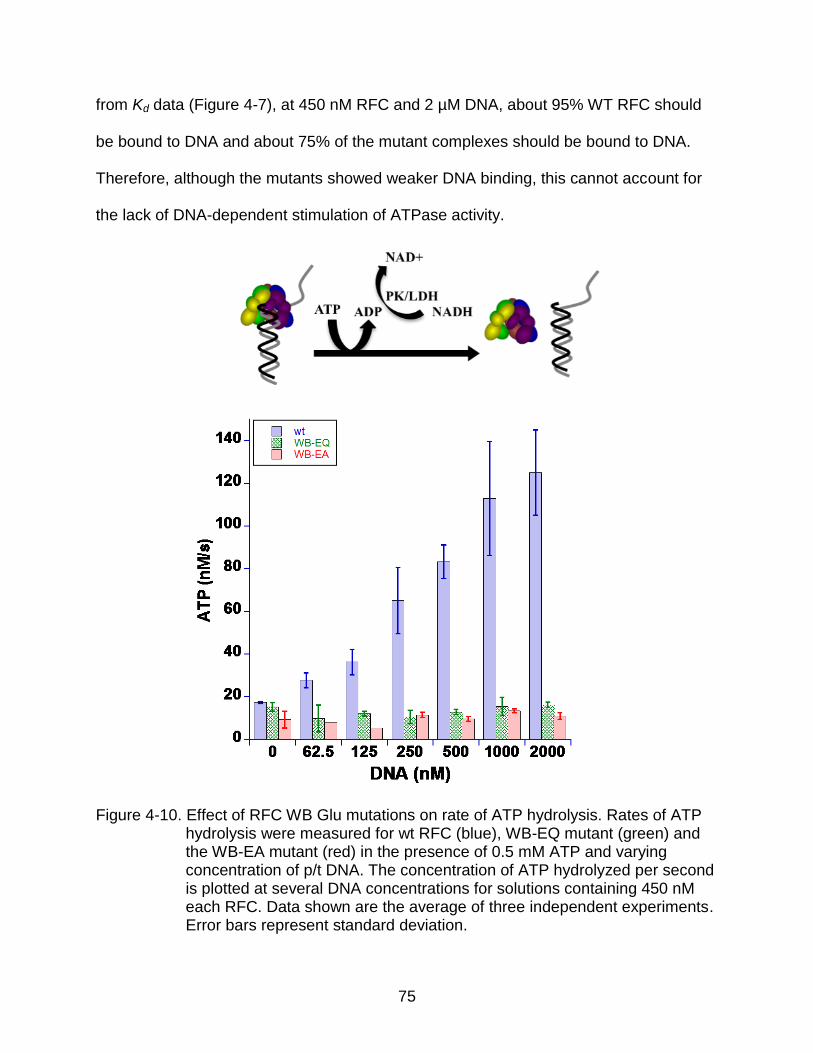
75
from Kd data (Figure 4-7), at 450 nM RFC and 2 µM DNA, about 95% WT RFC should
be bound to DNA and about 75% of the mutant complexes should be bound to DNA.
Therefore, although the mutants showed weaker DNA binding, this cannot account for
the lack of DNA-dependent stimulation of ATPase activity.
Figure 4-10. Effect of RFC WB Glu mutations on rate of ATP hydrolysis. Rates of ATP hydrolysis were measured for wt RFC (blue), WB-EQ mutant (green) and the WB-EA mutant (red) in the presence of 0.5 mM ATP and varying concentration of p/t DNA. The concentration of ATP hydrolyzed per second is plotted at several DNA concentrations for solutions containing 450 nM each RFC. Data shown are the average of three independent experiments. Error bars represent standard deviation.

76
Figure 4-11. Effect of RFC WB Glu mutations on rate of ATP hydrolysis. The data shown in Figure 4-10 are plotted here as a linear plot. The data shows increase in the rate of ATP hydrolysis as a function of DNA concentration in the case of wt RFC.
The ATPase data obtained were also plotted in a linear plot on a separate graph
(Figure 4-11). This graph shows that the ATPase activity reaches saturation for wt RFC
at the highest DNA concentration measured. A Kd value of 274 303 nM was calculated
for the wt RFC binding DNA from the data shown in Figure 4-11. The large standard
deviation value may be a result of measuring DNA binding indirectly from ATP
hydrolysis rates in this assay. This Kd value is similar to 91 20 nM obtained from the
DNA binding data (Figure 4-7), the slight difference may be a result of different assays
0
20
40
60
80
100
120
140
0 500 1000 1500 2000
wtWB-EQWB-EA
DNA (nM)
AT
P [
nM
] s
-1

77
used. Taken together, our data suggest that the RFC WB mutations affect DNA-
mediated stimulation of ATPase activity.
Conclusions
Our data shows that the RFC clamp loading steps, such as PCNA binding (Figure
4-2), PCNA opening (Figure 4-3 and 4-5) and DNA binding (Figure 4-7), which involve
ATP binding but not hydrolysis, are affected by the WB mutations. More importantly, the
various ligand-mediated changes such as ATP-stimulated PCNA ring opening (Figure 4-
4), PCNA-stimulated DNA binding (Figure 4-8) and DNA-stimulated ATP hydrolysis
(Figure 4-10), have a large effect because of the WB mutations. The mutants appear to
not respond to respective ligands in the assays. Taken together, our data suggest a role
of the WB motif in promoting ligand-induced conformational changes.
A possible mechanism by which Walker B ‘Glu’ residue might work is by
interacting with the ATP molecule via a bridging water molecule. This interaction
possibly keeps other residues in optimal conformation to bind PCNA and DNA. As a
result, a mutation in the Glu residue leads to weaker interaction with PCNA and DNA,
as well as reduced ATP hydrolysis.
In addition, the two mutations in WB motif, WB-EQ and WB-EA, show the same
effect in all the activities measured, as reflected in their similar Kd and rate of pre-steady
state reactions and ATP hydrolysis. This means that the WB Glu residue is essential in
making the right conformational changes and cannot function when changed to either
Gln or Ala.

78
CHAPTER 5
-COMPLEX ARG FINGER MUTANTS ARE DEFECTIVE IN CLAMP OPENING
Background Information
In the AAA+ family members, including the -complex, subunits are arranged such
that each of the ATP binding sites is located at a subunit-subunit interface. Furhermore,
a conserved Arg residue or Arg finger from one subunit interacts with the ATP bound to
the neighboring subunit (reviewed in (19)). The Arg finger plays an important role in
sensing the bound ATP and promoting DNA binding (16). Arg finger mutants have been
shown to bind ATP well (72), but have impaired ATP hydrolysis (18, 72). The -complex
has three ATP binding sites, one in each subunit. ’ and all three subunits extend
their Arg finger towards the ATP binding site of the adjacent subunit (Figure 5-1) (16).
Due to this structural arrangement, ATP bound with the first subunit, 1, interacts with
the Arg finger of ’ subunit, that of 2, interacts with the Arg finger of 1 subunit and that
of 3, interacts with the Arg finger of 2 subunit. The 3 subunit also extends an Arg finger
towards the subunit, which does not bind ATP. We have mutated the Arg residue of
the Arg finger motif to Ala. Due to the asymmetry in interaction of Arg fingers with ATP,
two types of mutants can be made. One containing the mutation in the ’ subunit
(’R158A), which affects ’-1 interface and another containing mutation in the subunits
(R169A), which affects both 1-2 and 2-3 interfaces. Previous studies have shown that
these two classes of mutations have different effects on the interactions of the -
complex with and DNA. The ATP-dependent interaction with the clamp was reduced
for ’R158A mutant, while both ’R158A and R169A mutants showed a reduction in
DNA binding activity (16). However, the DNA binding assays were done using single

79
stranded DNA. We have studied the effect of the Arg finger mutations on binding and
opening, using fluorescence-based assays. Our data show that the mutants do not open
well.
Figure 5-1. Schematic diagram of the arrangement of ATP-binding sites within the 3’-
complex. Each subunit possesses an ATP-binding site that is located at
the interface with an adjacent subunit. The ’ subunit and each subunit contain a conserved SRH sequence motif, and the Arg finger present in this motif extends toward the ATP-binding site of the neighboring subunit.
Mutation of Arg-158 to Ala in the ’ subunit removes the Arg finger
interaction with the ATP site in 1, and mutation of Arg-169 to Ala in the
subunits removes the Arg finger interactions with the ATP sites in 2 and 3.
This figure was originally published in The Journal of Biological Chemistry. Snyder, A. K., Williams, C. R., Johnson, A., O’donnell, M., and Bloom, L. B. Mechanism of loading the Escherichia coli DNA polymerase III sliding clamp: II. Uncoupling the beta and DNA binding activities of the gamma
complex. J Biol Chem. 2004; 279:4386–439. the American Society for Biochemistry and Molecular Biology.

80
Results
Equilibrium Binding
Anisotropy-based assays have shown reduced -binding activity in the case of
’R158A (16). However, a limitation of this assay is that it is not sensitive at low
nanomolar protein concentrations, where Kd values are accurately determined. In our
study, labeled with pyrene (-pyrene) was used in an equilibrium fluorescence
emission intensity-based assay to measure the effect of the mutations on binding.
Briefly, the fluorescence of 10 nM -pyrene was measured in presence of 0.5 mM ATP
and increasing concentrations of -complex. Binding of -complex to increased the
fluorescence of pyrene in a concentration-dependent manner, as expected for an
equilibrium binding reaction. The fold change in fluorescence intensity was plotted
against -complex concentration and the data were fitted to a quadratic equation to
obtain the Kd value (Figure 5-2). For comparison, binding to wt -complex in the
absence of ATP was also measured. The calculated Kd values were 0.9 0.3 and 191
33 nM in the presence and absence of ATP, respectively, showing that ATP increases
the affinity of the -complex for by at least 2 orders of magnitude. The Kd values
obtained in the presence and absence of ATP are in agreement with the values
reported previously using a pyrene anisotropy-based assay, 0.1 0.05 nM and 151 6
nM, respectively (16). At saturating concentrations of -complex, the quantum yield of
pyrene is lower in the absence of ATP than in the presence. It has been shown
previously that is not opened in the absence of ATP (79). This indicates that the
pyrene fluorescence is lower in the closed -complex• complex than in the open -
complex• complex. (16, 55). Binding of the Arg finger mutants to -pyrene was
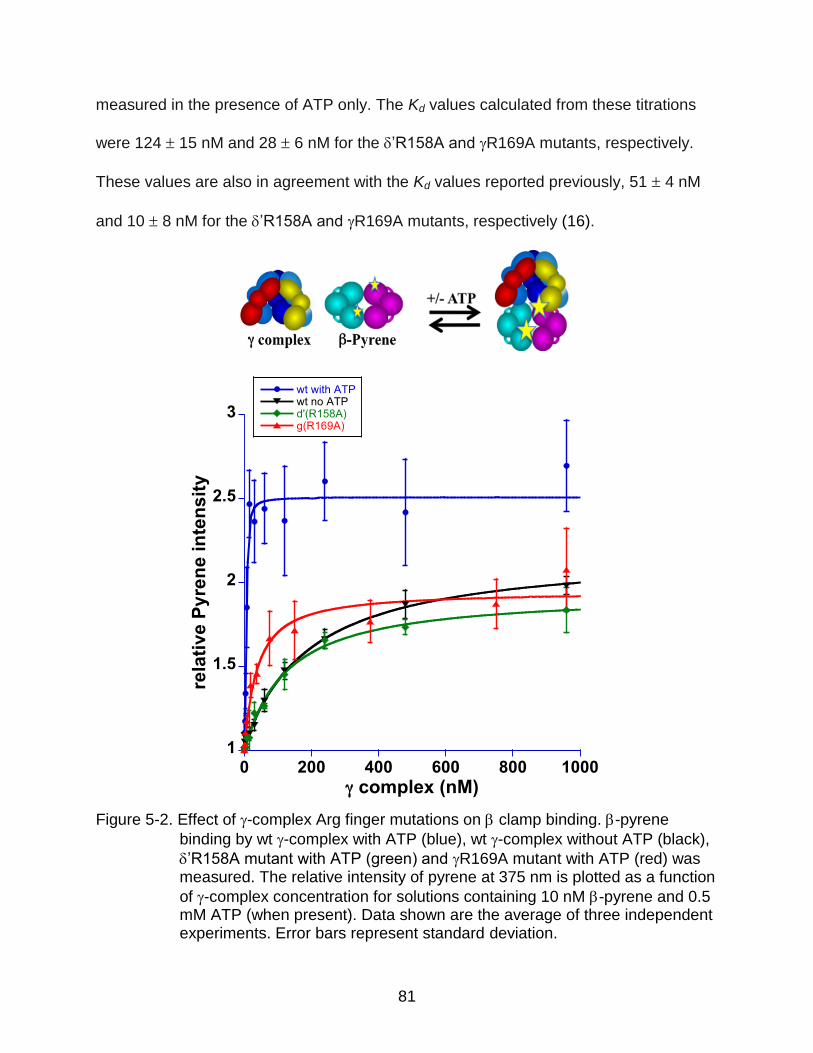
81
measured in the presence of ATP only. The Kd values calculated from these titrations
were 124 15 nM and 28 6 nM for the ’R158A and R169A mutants, respectively.
These values are also in agreement with the Kd values reported previously, 51 4 nM
and 10 8 nM for the ’R158A and R169A mutants, respectively (16).
Figure 5-2. Effect of -complex Arg finger mutations on clamp binding. -pyrene
binding by wt -complex with ATP (blue), wt -complex without ATP (black),
’R158A mutant with ATP (green) and R169A mutant with ATP (red) was measured. The relative intensity of pyrene at 375 nm is plotted as a function
of -complex concentration for solutions containing 10 nM -pyrene and 0.5 mM ATP (when present). Data shown are the average of three independent experiments. Error bars represent standard deviation.
82
The Kd values for the two mutants obtained in our studies are ~138- and ~30-fold
greater than that for the wt -complex, showing that the mutations greatly decrease the
affinity of the -complex for . Additionally, at the saturation point, the total fold change
in pyrene intensity for the mutants is similar to that for the wt -complex in the absence
of ATP, suggesting that the mutants may have a opening defect.
Equilibrium Clamp Opening
The -complex does not open well in the absence of ATP (79). Also, in the
absence of ATP, the total fold change in pyrene intensity is less than in the presence of
ATP in case of the wt -complex (Figure 5-2), suggesting that low pyrene intensity may
be due to poor opening of . The Arg finger mutants also show less change in the
pyrene intensity compared to the wt -complex (Figure 5-2), suggesting that they may
have a defect in opening. To test this, clamp opening was measured. An assay
based on labeled with AF488 (-AF488) was used (44). This assay works on the
principle that two fluorophores in proximity, quench each other. is labeled at the
opening interface with two AF488 molecules, one on each monomer. When is closed,
the fluorescence is quenched, and when it is opened by the -complex, the quenching is
relieved. Briefly, the fluorescence of -AF488 was measured in the presence of 0.5 mM
ATP and increasing concentrations of -complex (Figure 5-3). The final concentration of
-AF488 used in the assay was 10 nM (wt), 2 nM (’R158A) and 5 nM (R169A)
respectively. The ’R158A mutant showed only a 30–35% increase in AF488
fluorescence, while the R169A mutant gave no measurable increase in AF488

83
fluorescence at concentrations of 800 –1000 nM clamp loader, where binding
approached saturation (Figure 5-2).
Figure 5-3. Effect of -complex Arg finger mutations on opening. Binding of wt -
complex (blue), ’R158A mutant (green) and R169A mutant (red) to -AF488 was measured in the presence of 0.5 mM ATP. The relative intensity
of AF488 at 517 nm is plotted as a function of -complex concentration for
solutions containing 0.5 mM ATP and 10 nM (wt) 2 nM ’R158A) and 5 nM
(R169A) -AF488 respectively. Data shown are the average of three (wt
and ’R158A) and two (R169A) independent experiments. Error bars represent standard deviation.

84
Based on the relative AF488 intensities at saturation, the ’R158A mutant
produced about 16% of the open -complex• complexes that the wt -complex formed,
and the R169A mutant produced less than 2% of the open complexes. The Kd value
calculated for the wt -complex was 4.3 2.4 nM. The mutants did not show a
measurable increase in AF488 intensity, therefore, the data for the mutants were not fit
to a binding curve. Together, these results show that the Arg finger mutants are
defective in opening.
Conclusions
The -complex Arg finger mutants bind three molecules of ATP as does the wt
(72). Our results show that the mutants behave like wt -complex without ATP with
respect to binding (Figure 5-2) and show a severely reduced opening (by a factor of
50 in the case of the R169A mutant), which is again an ATP-dependent activity. This
suggests that interactions between the Arg fingers and the bound ATP molecules help
to drive ATP-dependent conformational changes in the -complex that promote
binding and opening.
Previous work (16) has shown that the function of Arg finger at the ’-1 interface is
important in interaction with , while those at 1-2 and 2-3 are important for interaction
with DNA. Our studies suggest that poor DNA binding may be due to poor opening,
due to a defect in making optimal conformational changes required for both opening
and DNA binding, or a combination of both.
Previous work (25) has identified ’-subunit as a rigid protein and the term ‘stator’
has been given to it (30), implying that ’ maintains a rigid conformation while other
85
subunits such as the three -subunits and the -subunit undergo conformational
changes upon interaction with various ligands. Our data show that the mutation in the
Arg finger motif of ’ subunit has a larger effect on interaction with , while the mutations
in -subunits have larger effect on interaction with DNA. It is possible that the Arg finger
motif of ’ subunit interacts with ATP bound at ’-1 interface and promotes
conformational changes responsible for binding via -subunit. On the other hand, the
Arg finger motifs of 1 and 2 subunits interacts with ATP bound at 1-2 and 2-3
interfaces and promote a different set of conformational changes responsible for
opening.

86
CHAPTER 6
THE CONSERVED ‘THR’ RESIDUE IN THE SENSOR 1 MOTIF OF -COMPLEX PROMOTES ATP-DEPENDENT CONFORMATIONAL CHANGES
Background Information
In all AAA+ proteins, the Sensor 1 motif is located at the N-terminal end of the
SRH loop. The Sensor 1 motif contains a polar residue which is most often Asn, as in S.
cerevisiae RFC, but is sometimes Ser, His or, as in the E. coli -complex, Thr, which
interacts with the phosphate of ATP (reviewed in (8)). In our study, we have mutated
the Thr (T157) to Ala and analyzed the effect of the mutation on clamp loading. One
proposed function for this residue is to sense ATP and mediate ATP-dependent
conformational changes (80). All clamp loading steps are stimulated in the presence of
ATP. Therefore, if this is true, all the steps, such as binding, opening, DNA binding
and ATP hydrolysis, will be affected by the T157A mutation. Another proposed function
of this residue is to aid in ATP hydrolysis (15). If that is true, only the clamp loading
steps coupled with ATP hydrolysis will be affected. However, it is also possible that
defects in ATP-induced conformational changes indirectly decrease ATPase activity.
For example, DNA binding triggers ATP hydrolysis by the clamp loader, and if the
Sensor 1 residue is required for ATP-dependent DNA binding, then defective DNA
binding would result in reduced ATP hydrolysis. Another recently proposed model,
states that a polar residue, named ‘Glu switch’ is involved in keeping the WB Glu
residue in an inactive conformation until the right substrate binds (20). In other words,
the ‘Glu switch’ residue interacts with the WB Glu residue and moves Glu out of the
catalytic position until DNA binds. If the Sensor 1 ‘Thr’ residue acts as the ‘Glu switch’,
then DNA-dependent ATP hydrolysis activity will be affected by the T157A mutation.

87
Also, in the case of the mutant, since Glu is not pulled out of the way, the DNA-
independent ATPase activity would be higher compared to wt -complex.
In our laboratory, the Thr residue was mutated in each of the three subunits to
make the T157A mutant complex (Christopher Paschall, unpublished), and the effect
of the mutation on binding and opening was measured (Farzaneh Tondnevis,
unpublished). Equilibrium binding and opening assays were performed and the
following results were obtained. A pyrene-based assay (described in Chapter 5) was
used to measure binding and the Kd values determined were 2 1 nM (wt) and 39 8
nM (mutant). Apart from showing a reduced affinity for , the mutants also showed
reduction in pyrene intensity at saturation levels. While the wt -complex showed a ~2.5
fold increase in pyrene intensity, the mutants showed only a ~2 fold increase. This
suggests that the mutation not only affects the binding affinity for , but it also affects
the way the -complex interacts with , thus reducing the total change in pyrene-
intensity upon binding. To measure clamp opening, the AF488-based assay
(described in Chapter 5) was used and the Kd values determined, were 2 1 nM (wt)
and 67 12 nM (mutant). In addition to this, the total fold change in AF488-intensity was
~2.5 (wt) and ~1.2 (mutant). This data suggests that the mutation affects both the
binding affinity to and the total number of molecules open at equilibrium. Altogether,
the data showed that the Sensor 1 Thr mutation reduces both binding and opening.
In this study, the effects on DNA binding and ATP hydrolysis were measured. Our
data show that the mutation reduces both DNA binding and ATP hydrolysis.

88
Results
Equilibrium DNA Binding
Given that the Sensor 1 Thr-157 to Ala mutation in the -complex affects ATP-
dependent interactions, such as binding and opening, effects of the mutation on DNA
binding were also measured. DNA binding by the -complex is stimulated in the
presence of (55), therefore the effect of on DNA binding was also measured. The
DNA-RhX based anisotropy assay (described in Chapter 4) was used with final
concentrations of 0.5 mM ATPS, 25 nM DNA-RhX, 0-2 µM -complex and 4 µM . The
data collected for DNA binding measured in the absence and presence of are plotted
on separate graphs.
Figure 6-1 and 6-2 represent DNA binding in the absence and presence of
respectively. The Kd values calculated from DNA binding data in the absence of were
164 72 nM (wt) and 1200 330 nM (T157A mutant). The T157A mutant clearly shows
reduced binding to the p/t DNA. The Kd values calculated from DNA binding data in the
presence of were 26 6 nM (wt) and 441 82 nM (T157A mutant).
Our data suggest that reduces the DNA binding Kd by a factor of six in the case
of wt -complex, but in the case of the T157A mutant the reduction in Kd is only by a
factor of 2.7. These data support our opening results that, because the mutant is a
less efficient opener, the stimulation of DNA binding is also reduced. DNA binding
experiments were performed in presence of ATPS, which does not support opening
to the full extent (discussed in Chapter 7). Therefore, it is possible that in presence of
ATP, the stimulation of DNA binding by is greater for the wt -complex, T157A mutant

89
or both. With that caveat, our DNA binding data indicates that the T157A mutation not
only affects the opening but also the downstream steps in the clamp loading reaction.
Figure 6-1. Effect of the -complex Sensor 1 Thr mutation on -complex•DNA binding in
the absence of . Binding of wt -complex (blue) and the T157A mutant
(green) to DNA-RhX was measured in the presence of ATPS. The change
in anisotropy of RhX at 605 nm is plotted as a function of -complex
concentration for solutions containing 25 nM DNA-RhX and 0.5 mM ATPS. Data shown are the average of three independent experiments. Error bars represent standard deviation.

90
Figure 6-2. Effect of -complex Sensor 1 Thr mutation on -complex•DNA binding in the
presence of . Binding of wt -complex (blue) and the T157A mutant (green)
to DNA-RhX was measured in the presence of ATPS. The change in
anisotropy of RhX at 605 nm is plotted as a function of -complex
concentration for solutions containing 25 nM DNA-RhX, 0.5 mM ATPS and
4 µM . Data shown are the average of three independent experiments. Error bars represent standard deviation.
ATP Hydrolysis
One of the functions proposed for the Sensor 1 Thr residue is to aid in ATP
hydrolysis by coordinating the water molecule (15); therefore, the T157A mutation is
expected to result in weaker ATP hydrolysis. Steady state ATP hydrolysis was

91
measured using the PK/LDH coupled oxidation of NADH assay (as described in
Chapter 4). ATP hydrolysis was measured at 250 nM -complex (wt and T157A mutant)
and different concentrations of DNA (Figure 6-3). The assay contained 0.5 mM ATP,
which is about 50-fold higher than the Km reported for the wt -complex (81). The
steady-state hydrolysis rates obtained from ATPase data in the absence of DNA, were
36 3 (wt) and 1.4 2.1 (T157A mutant) nMs-1.
Figure 6-3. Effect of -complex Sensor 1 Thr mutations on the rate of ATP hydrolysis in
the absence of . Rates of ATP hydrolysis were measured for wt -complex (blue) and the T157A mutant (green) in the presence of 0.5 mM ATP and varying concentrations of p/t DNA. The concentration of ATP hydrolyzed per second is plotted at several DNA concentrations for solutions containing 250
nM each -complex. Data shown are the average of three independent experiments. Error bars represent standard deviation.
0
20
40
60
80
100
120
140
160
0.000 100.0 250.0 500.0 1000
wtT157A
DNA (nM)
AT
P (
nM
s-1
)
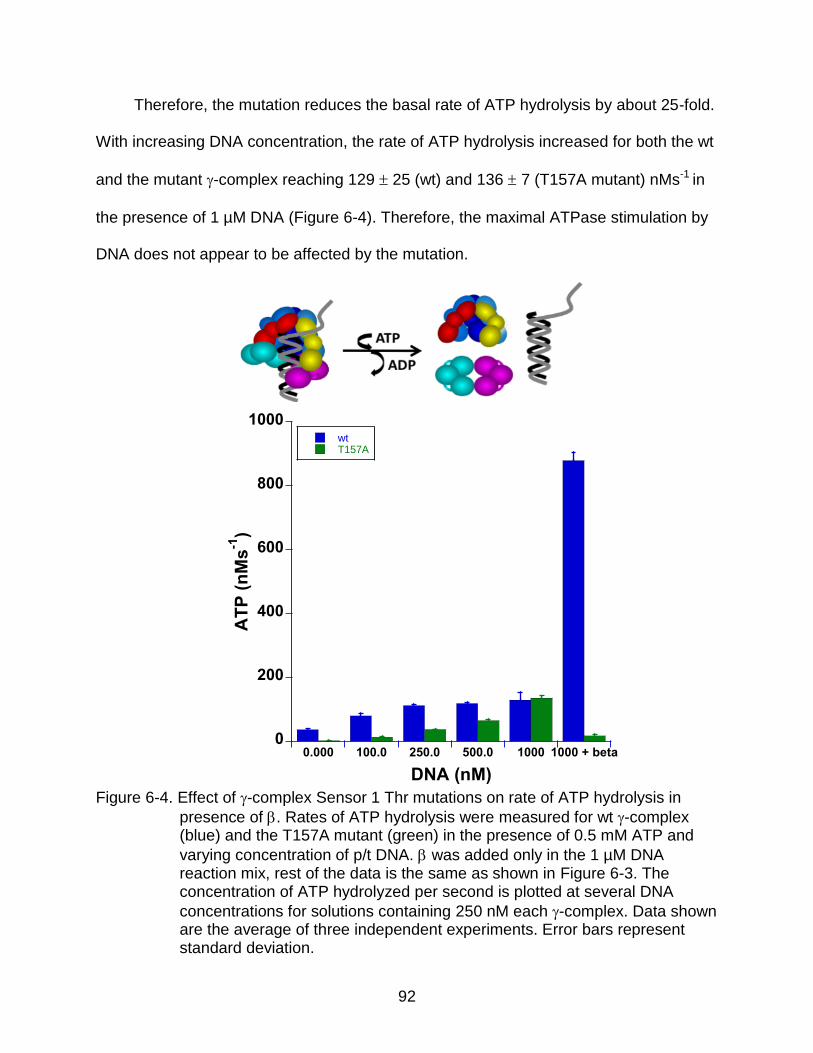
92
Therefore, the mutation reduces the basal rate of ATP hydrolysis by about 25-fold.
With increasing DNA concentration, the rate of ATP hydrolysis increased for both the wt
and the mutant -complex reaching 129 25 (wt) and 136 7 (T157A mutant) nMs-1 in
the presence of 1 µM DNA (Figure 6-4). Therefore, the maximal ATPase stimulation by
DNA does not appear to be affected by the mutation.
Figure 6-4. Effect of -complex Sensor 1 Thr mutations on rate of ATP hydrolysis in
presence of . Rates of ATP hydrolysis were measured for wt -complex (blue) and the T157A mutant (green) in the presence of 0.5 mM ATP and
varying concentration of p/t DNA. was added only in the 1 µM DNA reaction mix, rest of the data is the same as shown in Figure 6-3. The concentration of ATP hydrolyzed per second is plotted at several DNA
concentrations for solutions containing 250 nM each -complex. Data shown are the average of three independent experiments. Error bars represent standard deviation.
0
200
400
600
800
1000
0.000 100.0 250.0 500.0 1000 1000 + beta
wtT157A
DNA (nM)
AT
P (
nM
s-1
)

93
Another interesting observation was made when was added to the ATPase
reaction mix containing 1 µM DNA (Figure 6-4). stimulates ATP hydrolysis by the wt -
complex (60). In our assay, the rates obtained from the ATPase data in the presence of
1 µM DNA and 1 µM , were 880 25 (wt) and 16.7 4.1 (mutant) nMs-1. When
compared to the data for ATPase rate in the presence of 1 µM DNA alone, increased
the rate of ATP hydrolysis by about seven-fold in the case of wt -complex. On the other
hand, the rate of ATP hydrolysis by the mutant was decreased by about eight-fold. The
inhibitory effect of on the mutant ATPase activity may be because the mutant does not
open well. As a result, when in presence of , the mutant becomes trapped in the
closed -complex conformation, which is unable to hydrolyze ATP.
Conclusions
Other studies have shown that the -complex Sensor 1 Thr mutation reduces
binding and opening (Farzaneh Tondnevis, unpublished). Our data show that the
mutation also affects other ATP-dependent functions, such as DNA binding and ATP
hydrolysis. Taken together, all ATP-dependent activities are reduced in the T157A
mutant. Therefore, our study supports the model (80), that the Sensor 1 Thr residue is
involved in making ATP-dependent conformational changes. A defect in ATP-dependent
conformational changes is also predicted to reduce ATP hydrolysis, therefore, our data
also supports another view (15), that the Sensor 1 Thr residue aids in ATP hydrolysis. A
third model (20) predicts, that a polar residue, named ‘Glu switch’ keeps the WB Glu in
an inactive conformation until DNA binds. If the Sensor 1 ‘Thr’ residue were to act as
the ‘Glu switch’, then DNA would stimulate ATP hydrolysis only in case of the wt -
complex, but not in the T157A mutant. Our data show DNA-dependent stimulation of

94
ATP hydrolysis in the case of both the wt -complex and the T157A mutant therefore,
does not support the function of T157 residue as ‘Glu switch’.

95
CHAPTER 7
ATPS REDUCES CLAMP OPENING
Background Information
ATPS is commonly used as a “poorly-hydrolyzable” analogue of ATP. It contains
a sulfur atom replacing one of the oxygen atoms linked to the phosphate (Figure 7-1).
The molecule has the same shape as ATP, but cannot be cleaved at the phosphate
position by enzymes efficiently to release energy. The rate of ATPS hydrolysis by -
complex is approximately 50,000 fold slower than ATP in case of the -complex (53).
ATPS is very widely used to study reaction mechanisms, which involve ATP hydrolysis
(34, 82). ATP is substituted by ATPS in order to avoid any complications due to ATP
hydrolysis. Both clamp binding and opening are stimulated by ATP binding but are not
affected by hydrolysis. Therefore, these activities should not be affected by substitution
of ATP by ATPS. We studied clamp binding and opening in the presence of ATPS to
determine if ATPS has an effect on these functions.
Figure 7-1. Structure of ATPS.

96
Results
PCNA Binding
The equilibrium PCNA binding assay (described in Chapter 4) was used to
measure PCNA binding by wt RFC in the presence of ATPS (Figure 7-2).
Figure 7-2. Effect of ATPS on PCNA binding. Binding of wt RFC was measured in the
presence of ATP (blue) or ATPS (orange). The relative intensity of MDCC at 470 nm is plotted as a function of RFC concentration for solutions
containing 10 nM PCNA-MDCC and 0.5 mM ATP or ATPS. Data shown are the average of three independent experiments. Error bars represent standard deviation.
The final concentrations of the reagents were 10 nM PCNA-MDCC, 0-1 µM RFC
and 0.5 mM ATP or ATPS. The Kd values obtained for these measurements were 7.1
1
1.5
2
2.5
3
0 200 400 600 800 1000
ATP ATPgS
rela
tiv
e M
DC
C i
nte
ns
ity
RFC (nM)

97
2 nM in the presence of ATP and 13.3 1.8 nM in the presence of ATPS. These
values are slightly different within the range of standard deviation measured. Therefore,
ATPS appears to have little or no effect on PCNA binding.
Equilibrium PCNA Opening
The equilibrium PCNA opening assay (described in Chapter 4) was used to
measure PCNA ring opening by wt RFC in the presence of ATPS (Figure 7-3). The
final concentrations of the reagents were 10 nM PCNA-AF488, 0-1 µM RFC and 0.5 mM
ATP or ATPS.
Figure 7-3. Effect of ATPS on PCNA opening. Opening of wt RFC was measured in the
presence of ATP (blue) or ATPS (orange). The relative intensity of AF488 at 517 nm is plotted as a function of RFC concentration for solutions
containing 10 nM PCNA-AF488 and 0.5 mM ATP or ATPS. Data shown are the average of three independent experiments. Error bars represent standard deviation.
1
1.5
2
2.5
0 200 400 600 800 1000
ATP ATPgS
rela
tiv
e A
F-4
88
in
ten
sit
y
RFC (nM)

98
The Kd values obtained for these measurements were 10.8 4 nM in the presence
of ATP and 5.8 2.6 nM in the presence of ATPS. The total fold change in AF488
intensity was approximately 2 fold (ATP) and 1.5 fold (ATPS). The Kd value is a
measurement of binding affinity; therefore, similar values suggest that the binding
affinity of wt RFC for PCNA is not affected by ATPS. On the other hand, change in
intensity is a measurement of the total number of open PCNA molecules at equilibrium;
therefore, the data suggest that ATPS reduces the fraction of PCNA molecules in an
open conformation.
Pre-Steady State PCNA Opening
Because the fraction of PCNA molecules open was reduced in equilibrium assays
with ATPS, the rate of PCNA opening was measured to determine whether the
equilibrium constant was altered by a decrease in the opening rate. A pre-steady state
opening assay (described in Chapter 4) was used. The final concentrations were 20 nM
PCNA-AF488, 200 nM wt RFC and 0.5 mM ATP or ATPS. An apparent opening rate of
2.7 0.7 s-1 and 1.9 0.1 s-1 was obtained in the presence of ATP and ATPS,
respectively (Figure 7-4). The fluorescence intensity levels at reaction end points were
the same as observed in the equilibrium assay (Figure 7-3). These data suggest that
ATPS has a small effect on the apparent rate of PCNA opening. The apparent rate of
PCNA opening (kobs) is a combination of the rate of PCNA opening (kon) and the rate of
PCNA closing (koff). Therefore, the difference observed in apparent rate in presence of
ATP and ATPS may be due to a difference in the rate of PCNA opening, in the rate of
PCNA closing, or a combination of both.

99
Figure 7-4. Effect of ATPS on the rate of PCNA opening. Stopped-flow fluorescence
measurements were made in which a solution of wt RFC and ATPS was
added to a solution of PCNA and ATPS. Final concentrations after mixing
were 20 nM PCNA-AF488, 200 nM RFC and 0.5 mM ATP or ATPS. Three and two independent experiments were done for ATP (blue trace) and
ATPS (orange trace), respectively. Representative time courses are shown. The data for individual time courses fit to a single exponential rise (black traces), and the average values of observed rate constants are given in the text.
1
1.2
1.4
1.6
1.8
2
0 0.5 1 1.5 2
ATP ATPgS
time (s)
rela
tiv
e A
F4
88
in
ten
sit
y

100
Binding
Our data suggest that ATPS has a small effect on PCNA binding and a moderate
effect on PCNA opening by RFC, to determine whether it has similar effects on
binding and opening by -complex, the equilibrium binding and opening by the wt -
complex were measured in the presence of ATPS. To measure binding, the
equilibrium binding assay (described in Chapter 5) was used.
Figure 7-5. Effect of ATPS on binding. Binding of wt -complex to -pyrene was
measured in the presence of ATP (blue) or ATPS (orange). The relative
intensity of pyrene at 375 nm is plotted as a function of -complex
concentration for solutions containing 10 nM -pyrene and 0.5 mM ATP or
ATPS. Data shown are the average of three independent experiments. Error bars represent standard deviation.

101
The fluorescence of 10 nM -pyrene was measured in the presence of increasing
concentration of -complex and 0.5 mM ATP or ATPS. The calculated Kd values were
0.9 0.3 and 1.9 0.8 nM in the presence of ATP and ATPS, respectively (Figure 7-5).
Therefore, ATPS appears to have little or no effect on binding.
Opening
To measure opening, the equilibrium opening assay (described in Chapter 5)
was used. The fluorescence of 10 nM -AF488 was measured in the presence of
increasing concentrations of -complex and 0.5 mM ATP or ATPS (Figure 7-6).
Figure 7-6. Effect of ATPS on opening. Binding of wt -complex to -AF488 was
measured in the presence of ATP (blue) or ATPS (orange). The relative
intensity of AF488 at 517 nm is plotted as a function of -complex
concentration for solutions containing 10 nM -AF488 and 0.5 mM ATP or
ATPS. Data shown are the average of three independent experiments. Error bars represent standard deviation.

102
The calculated Kd values were 4.3 2.4 nM and 12 4 nM in the presence of ATP
and ATPS, respectively. These values are similar within the range of standard
deviation measured. The total change in AF488 fluorescence intensity was
approximately 4 fold and 3.5 fold in the presence of ATP and ATPS, respectively.
Therefore, ATPS does not affect the binding affinity of -complex to -AF488, but has a
small effect on the number of open molecules at equilibrium.
Conclusions
Our data shows very little or no effect of ATPS on both PCNA and binding by
the respective clamp loaders (Figures 7-2 and 7-5). In both the cases, the Kd values are
very similar in presence of ATP or ATPS. On the other hand, in case of PCNA and
opening (Figures 7-3, 7-4 and 7-6) the fold change in AF488 intensity is reduced in
presence of ATPS, suggesting that it reduces the number of open molecules of both
PCNA and . An interesting observation is that the effect of ATPS on PCNA opening is
approximately half of the effect of WB mutations. The WB mutations reduced clamp
opening by approximately 5-fold while the ATPS reduced it by 2-fold. Also, PCNA
opening was affected more (2-fold) than opening (1.5-fold). These differences may be
due to the fact that RFC makes different interactions with PCNA compared to the -
complex makes with . Altogether, our data show that ATPS reduces clamp opening.
Because clamp opening does not require ATP hydrolysis, these data suggest that
ATPS does not support all the conformational changes required for opening the clamp.
This is an important observation, as ATPS is treated simply as a “non-hydrolyzable”
analogue of ATP. Our data suggest that, in spite of having a similar shape like ATP, it
does not mimic all the conformational changes made by ATP. One possible mechanism

103
for this may be because of the low electro-negativity of sulfur atom compared to oxygen.
It is possible that the oxygen atom replaced by sulphur atom in case of ATPS is
required to make interactions with important residues in the ATP binding site in order to
promote proper conformational changes.

104
CHAPTER 8 DISCUSSION AND FUTURE DIRECTIONS
We have studied the effect of single amino acid mutations in several key protein
sequence motifs belonging to the AAA+ domain. Specifically, we studied the WB ‘Glu’
mutation in RFC (Chapter 4), Arg finger ‘Arg’ mutation in -complex (Chapter 5) and the
Sensor 1 ‘Thr’ mutation in -complex (Chapter 6). Our results show effects of these
mutations on clamp loading activities that are not commonly associated with the
proposed roles of these residues in the AAA+ domain.
Walker B Motif
The WB Glu residue is believed to act as a general base by deprotonating a water
molecule and making it more nucleophilic for catalysis of ATP hydrolysis (9). Classically,
the WB motif has been associated only with ATP hydrolysis and not with ATP binding
(8, 11-13). Our results show that clamp loading steps, such as PCNA binding, PCNA
opening and DNA binding, which involve only ATP binding but no hydrolysis are also
reduced in case of the WB mutants. Furthermore, ligand-induced changes, such as
ATP-stimulated PCNA opening, PCNA-stimulated DNA binding and DNA-stimulated
ATP hydrolysis were affected significantly. Taken together, our results indicate that the
WB motif Glu plays an important role in promoting conformational changes made by
RFC upon binding the respective ligands. These changes are not dependent upon ATP
hydrolysis but may require interaction of the WB Glu residue with other molecules such
as water, magnesium ion, neighboring amino acid residues or substrates in the clamp
loading reaction, such as ATP, PCNA and DNA. It is also possible that the Glu residue
is involved in coordination of the water molecule required for ATP hydrolysis indirectly.
For example, the Glu residue may be located too far away to interact with the

105
phosphate of ATP on its own, but may interact with the water molecule, which make
hydrogen bonds with the phosphate. This positioning of the water molecule would not
be possible in the absence of ATP. Further studies are needed to understand the exact
mechanism by which the Glu residue contributes to making optimal conformational
changes.
Arg Finger Motif
The Arg finger motif is believed to sense the phosphate of bound ATP (16) and
to catalyze ATP hydrolysis (18, 72). The -complex Arg finger mutants bind ATP well
(17, 72), but show reduced and DNA binding (16). Our results show the effect of these
mutations on binding and opening. In our studies, the mutants behaved as if they had
a defect in ATP binding. ATP-dependent opening activity was reduced by as much as
six-fold (’R158A) and 50-fold (R169A) in these mutants. Given that the mutants bind
ATP well, our results indicate that they do not respond well to the bound ATP. Again,
both binding and opening are independent of ATP hydrolysis (53); therefore, our
results suggest a role for the Arg finger motif in promoting ATP-dependent
conformational changes. One possible mechanism is that the interaction of the Arg
finger motif with ATP promotes opening, and the loss of interaction after ATP
hydrolysis leads to closure of the ring around DNA.
Sensor 1 Motif
Two different models have been proposed for the role of the Sensor 1 Thr residue.
These are; 1) to mediate ATP-dependent conformational changes (80) and 2) to aid in
ATP hydrolysis (15). Another model proposes that a polar residue, named ‘Glu switch’
keeps the WB Glu in inactive conformation until DNA binds (20). Our studies with the -

106
complex T157A mutants show that the mutation affects all ATP-dependent activities,
such as binding, opening, DNA binding and ATP hydrolysis therefore supporting the
first and the second models. In addition to this, our data show DNA-dependent
stimulation of ATP hydrolysis in the case of the mutant therefore suggesting that the
Sensor 1 ‘Thr’ residue does not act as the ‘Glu switch’..
Final Thoughts
Although our studies included different AAA+ motifs (WB, Arg finger and Sensor 1)
and from different domains of life, such as eukaryotes (RFC) and bacteria (-complex),
some very interesting common results were obtained. Our major conclusion is that the
key AAA+ residues play an important role in promoting conformational changes in
addition to the roles classically assigned to them. All the mutants studied showed a
defect in the classic function linked to them, but at the same time they showed large
effects on other activities attributable to conformational changes. For instance, the WB
mutations showed a five-fold reduction in PCNA ring opening activity, in addition to the
expected defect in ATP hydrolysis. The Arg finger mutants showed six-fold (’R158A) to
50-fold (R169A) reduced opening in addition to a defect in ATP sensing. Similarly,
the Sensor 1 mutants showed 1.5-fold reduced DNA binding in addition to a defect in
ATP hydrolysis.
Another interesting observation was that all the mutations had a very large effect
on clamp opening. For instance, the effect of WB mutations was 1.2-fold on DNA
binding compared to as much as five-fold on PCNA opening. The effect of Arg finger
mutations on opening was as much as six-fold (’R158A) to 50-fold (R169A). And,
the effect of Sensor 1 mutations was 1.5-fold on DNA binding compared to two-fold on
107
opening. One possible explanation is that the mutations studied here have a larger
effect on the conformational changes required for clamp opening than those required for
DNA binding.
Another common observation was that the studied residues are involved in
sensing and responding to the various ligands at individual steps of the overall reaction.
The conformational changes made after binding to a ligand facilitates the next step of
the reaction. For instance, PCNA stimulated DNA binding (2.4-fold increase in binding
affinity) in the case of wt RFC. Also, DNA stimulated ATP hydrolysis by seven-fold in the
case of wt RFC. Ligand-binding induced changes are believed to be a mechanism to
drive the reaction in a defined order (35). Our studies provide an insight into the
possible mechanism behind the overall clamp loading reaction. For instance, the WB
mutants are known to be defective in ATP hydrolysis, but our data showed that the
defect comes from the loss of DNA-dependent stimulation of ATP hydrolysis. In other
words, the basal ATP hydrolysis is not affected due to the mutation, but the level of
hydrolysis in DNA-bound state is reduced by as much as about ten-fold. In the case of
Arg finger mutants, they are known to be defective in and DNA binding (16), but our
data showed an effect on ATP-dependent opening. Reduced opening possibly
hampers downstream steps such as DNA binding and eventually ATP hydrolysis.
A very interesting observation was that changing a single amino acid residue
resulted in profound effects on the overall function of the proteins in question. Both the
wt S. cerevisiae RFC and the wt E. coli -complex used in our studies are 200-250 KDa
proteins comprised of ~2000 amino acids. The single mutations were made in individual
ATPase subunits thus changing a total of three to four amino acids in the complexes,
108
yet the effect of the mutations were quite significant. In the case of the RFC WB
mutants, the PCNA opening activity was reduced five-fold, while the ATP hydrolysis was
reduced as much as eight-fold. Similarly, the Arg finger mutations reduced opening by
as much as 50-fold, while the Sensor 1 mutations reduced ATP hydrolysis by 50-fold.
On one hand, these effects seem to be quite large, while on the other hand this explains
why these residues are so well conserved in all the AAA+ proteins. Single amino acid
changes in the key residues may result in partial or near complete loss of function;
therefore, nature has allowed few or no substitutions at these sites.
Implications
The AAA+ family is a huge family comprising of proteins involved in a myriad of
cellular functions. These proteins share various key residues belonging to the AAA+
domain, but at the same time they have some unique structural features to adapt to the
particular function being carried out (reviewed in (21)). They may have extra N- or C-
terminal domains (clamp loaders (27)), extra subunits ( and subunits in -complex
(83)), subunits defective in a particular function ( and ’ in -complex (25) and Rfc5 in
RFC defective in ATPase activity (27)) or different interactions with substrates (DNA
binding represses ATPase activity of ORC (84)). Our results show an important role of
the AAA+ residues in driving the conformational changes required for the clamp loading
reaction. Although, ligand-binding induced conformational changes are known to be one
of the basic mechanisms behind the overall function of AAA+ proteins, it is possible that
the clamp loaders have evolved to link ligand binding to the conformational changes
and the resulting mechano-chemical transductions in a specific way to adapt to the
clamp-loading pathway. For instance, involvement of the WB Glu residue in promoting
109
conformational changes may be unique to the clamp loaders. Further studies are
needed to understand how much this mechanism is shared among the various AAA+
proteins. For instance, does a mutation in WB aspartate residue cause similar effects?
Or, does a similar mechanism exist in all AAA+ proteins, or only in the AAA+ proteins,
which have with common substrates (Helicase, Polymerase), or only in clamp loaders,
or just in RFC? These studies will provide further insight into the way the AAA+ proteins
have evolved to elicit their specific cellular functions.
Our studies involved the RFC WB motif and -complex Arg finger and Sensor 1
motifs. The studies focused on very specific roles of these motifs in the clamp loading
pathway. For instance, our data showed that the S. cerevisiae RFC WB Glu to Gln or
Ala change reduced PCNA opening and ATP hydrolysis. Nonetheless, the results may
be applicable to a wide variety of mechanisms in a wide variety of proteins. The AAA+
proteins show a remarkable degree of conservation in their structural features and
various mechanisms. The specific results obtained in our studies may hold true in case
of other clamp loaders, similar AAA+ proteins or all AAA+ proteins.
Our results also provide a cautionary note against monitoring the end product of a
multistep enzymatic reaction and extrapolating the results to the individual steps of the
reaction. In previous studies, the WB mutation was made in individual subunits of
archaeal RFC and, assuming that the mutation affected ATP hydrolysis only, individual
steps of the clamp loading reaction were assigned to each subunit (12). In another
study, based on the assumption that Arg finger mutations affect only ATP hydrolysis,
the Arg finger residues were mutated to Gln in RFC to help prevent ATP hydrolysis in
the crystal (59) and the crystal structure shows RFC•PCNA in closed complex. Our data

110
would suggest that the reason that PCNA is not open in the structure is that RFC Arg
finger mutants are also defective in clamp opening.
We have also studied the effect of ATPS on clamp loading steps (Chapter 7). Our
results show that ATPS reduces clamp opening, again cautioning against the
assumption that ATPS affects only ATP hydrolysis and related functions.
Future Studies
Our study showed the effect of various mutations on conformational changes and
the role of the changes in driving the clamp loading reaction. A comparison of the
structure of the wt and mutant proteins will further elucidate the underlying mechanism.
X-ray crystallography combined with computational analysis will help to understand the
exact mechanism by which the AAA+ residues contribute to the conformational
changes. For instance, some of the questions addressed may be to what extent do
single amino acid mutations change the overall structure of the protein? Are the
changes confined to the site of mutation or are they transmitted to distant regions? How
does the change affect the interaction of the clamp loader with the various ligands? How
does ligand binding affect conformational changes in the case of wt and mutants? Do
the changes directly contribute to the defect in clamp loading activities?
Our study focused on proteins harboring mutations in key conserved residue in all
of the functional subunits. For instance, the RFC WB mutant harbored mutation in all
four WB sites, thus making a quadruple mutant. Similarly, both the Arg finger and
Sensor 1 -complex mutants contained mutation in all three subunits, thus making a
triple mutant. It will be interesting to study the effect of similar mutations in single,
double, triple or various combinations of the specific sites. These studies will address

111
some questions like is the effect of single mutation lesser than multiple mutations? Is
there a synergistic effect of multiple mutations? Do the multiple sites function
independently or is there a defined sequence of action? Which subunit plays a more
significant role in interaction with a specific ligand?
Another very interesting area of study will be to understand if there is any link
between the different residues studied here. For instance, a recently proposed model
states that a polar residue located between Walker A and B motifs acts as ‘Glu switch’,
which keeps the WB ‘Glu’ in an inactive conformation until DNA binds (20). The Sensor
1 ‘Thr’ residue is located in between Walker A and B motifs and is a likely candidate for
being the ‘Glu switch’ residue. Although our study does not support the Glu switch
function for the -complex Sensor 1 Thr residue, it will be interesting to see if there are
any other residues acting as Glu switch possibly in the Sensor 1 motif or any other
motifs. It is also possible that the Sensor 1 Thr residue does not act as a Glu switch in
the -complex or in all clamp loaders, but does so in other AAA+ proteins. On a similar
note, in the AAA+ domain, the Sensor 1 motif and the Arg finger motif are located at the
N and C-terminals of a common region called Second Region of Homology (SRH),
respectively (14). Also, the Arg finger motif functions in trans; thus projecting into the
neighboring subunit’s ATP binding site. One possible mechanism is that the Arg finger
senses ATP binding in a subunit and the conformational change is conveyed to the
Sensor 1 motif via the SRH, leading to changes in the preceding subunit. It will be
interesting to see if there is any cross talk between these different motifs and if there are
any compensatory mutations that can be made at these sites.

112
LIST OF REFERENCES
1. Erdmann, R., Wiebel, F. F., Flessau, A., Rytka, J., Beyer, A., Fröhlich, K. U., and Kunau, W. H. (1991) PAS1, a yeast gene required for peroxisome biogenesis, encodes a member of a novel family of putative ATPases. Cell 64, 499–510
2. Beyer, A. (1997) Sequence analysis of the AAA protein family. Protein Sci. 6, 2043–2058
3. Neuwald, A., Aravind, L., Spouge, J., and Koonin, E. (1999) AAA+: A class of chaperone-like ATPases associated with the assembly, operation, and disassembly of protein complexes. Genome research 9, 27–43
4. Rowe, T., and Balch, W. E. (1997) Membrane fusion. Bridging the gap by AAA ATPases. Nature 388, 20–21
5. Kim, Y. I., Levchenko, I., Fraczkowska, K., Woodruff, R. V., Sauer, R. T., and Baker, T. A. (2001) Molecular determinants of complex formation between Clp/Hsp100 ATPases and the Clpp peptidase. Nat. Struct. Biol. 8, 230–233
6. O'donnell, M., Onrust, R., Dean, F. B., Chen, M., and Hurwitz, J. (1993) Homology in accessory proteins of replicative polymerases-E. Coli to humans. Nucleic Acids Research 21, 1–3
7. Burgess, S. A., Walker, M. L., Sakakibara, H., Knight, P. J., and Oiwa, K. (2003) Dynein structure and power stroke. Nature 421, 715–718
8. Hanson, P. I., and Whiteheart, S. W. (2005) AAA+ proteins: have engine, will work. Nat Rev Mol Cell Biol 6, 519–529
9. Iyer, L. M., Leipe, D. D., Koonin, E. V., and Aravind, L. (2004) Evolutionary history and higher order classification of AAA+ ATPases. J. Struct. Biol. 146, 11–31
10. Babst, M., Wendland, B., Estepa, E. J., and Emr, S. D. (1998) The Vps4p AAA ATPase regulates membrane association of a Vps protein complex required for normal endosome function. EMBO J 17, 2982–2993
11. Whiteheart, S. W., Rossnagel, K., Buhrow, S. A., Brunner, M., Jaenicke, R., and Rothman, J. E. (1994) N-ethylmaleimide-sensitive fusion protein: a trimeric ATPase whose hydrolysis of ATP is required for membrane fusion. J. Cell Biol. 126, 945–954

113
12. Seybert, A., and Wigley, D. B. (2004) Distinct roles for ATP binding and hydrolysis at individual subunits of an archaeal clamp loader. EMBO J 23, 1360–1371
13. Sweeney, T. R., Cisnetto, V., Bose, D., Bailey, M., Wilson, J. R., Zhang, X., Belsham, G. J., and Curry, S. (2010) Foot-and-Mouth Disease Virus 2C Is a Hexameric AAA+ Protein with a Coordinated ATP Hydrolysis Mechanism. J Biol Chem 285, 24347–24359
14. Lupas, A. N., and Martin, J. (2002) AAA proteins. Curr. Opin. Struct. Biol. 12, 746–753
15. Hattendorf, D. A., and Lindquist, S. L. (2002) Cooperative kinetics of both Hsp104 ATPase domains and interdomain communication revealed by AAA sensor-1 mutants. EMBO J 21, 12–21
16. Snyder, A. K., Williams, C. R., Johnson, A., O’donnell, M., and Bloom, L. B. (2004) Mechanism of loading the Escherichia coli DNA polymerase III sliding clamp: II. Uncoupling the beta and DNA binding activities of the gamma complex. J Biol Chem 279, 4386–4393
17. Johnson, A., Yao, N. Y., Bowman, G. D., Kuriyan, J., and O'donnell, M. (2006) The Replication Factor C Clamp Loader Requires Arginine Finger Sensors to Drive DNA Binding and Proliferating Cell Nuclear Antigen Loading. J Biol Chem 281, 35531–35543
18. Karata, K., Inagawa, T., Wilkinson, A. J., Tatsuta, T., and Ogura, T. (1999) Dissecting the role of a conserved motif (the second region of homology) in the AAA family of ATPases. Site-directed mutagenesis of the ATP-dependent protease FtsH. J Biol Chem 274, 26225–26232
19. Ogura, T., Whiteheart, S. W., and Wilkinson, A. J. (2004) Conserved arginine residues implicated in ATP hydrolysis, nucleotide-sensing, and inter-subunit interactions in AAA and AAA+ ATPases. J. Struct. Biol. 146, 106–112
20. Zhang, X., and Wigley, D. B. (2008) The “glutamate switch” provides a link between ATPase activity and ligand binding in AAA+ proteins. Nat Struct Mol Biol 15, 1223–1227
21. Erzberger, J. P., and Berger, J. M. (2006) evolutionary relationships and structural mechanisms of AAA+ proteins. Annu. Rev. Biophys. Biomol. Struct. 35, 93–114

114
22. Snider, J., Thibault, G., and Houry, W. A. (2008) The AAA+ superfamily of functionally diverse proteins. Genome Biol. 9, 216
23. Jeruzalmi, D., O'donnell, M., and Kuriyan, J. (2001) Crystal structure of the processivity clamp loader gamma (gamma) complex of E. Coli DNA polymerase III. Cell 106, 429–441
24. Bowman, G. D., O'donnell, M., and Kuriyan, J. (2004) Structural analysis of a eukaryotic sliding DNA clamp-clamp loader complex. Nature 429, 724–730
25. Guenther, B., Onrust, R., Sali, A., O'donnell, M., and Kuriyan, J. (1997) Crystal structure of the delta' subunit of the clamp-loader complex of E. Coli DNA polymerase III. Cell 91, 335–345
26. Davey, M. J., Jeruzalmi, D., Kuriyan, J., and O'donnell, M. (2002) Motors and switches: AAA+ machines within the replisome. Nat Rev Mol Cell Biol 3, 826–835
27. Cullmann, G., Fien, K., Kobayashi, R., and Stillman, B. (1995) Characterization of the five replication factor C genes of Saccharomyces cerevisiae. Mol. Cell. Biol. 15, 4661–4671
28. Cann, I. K., and Ishino, Y. (1999) Archaeal DNA replication: identifying the pieces to solve a puzzle. Genetics 152, 1249–1267
29. Krishna, T. S., Kong, X. P., Gary, S., Burgers, P. M., and Kuriyan, J. (1994) Crystal structure of the eukaryotic DNA polymerase processivity factor PCNA. Cell 79, 1233–1243
30. Johnson, A., and O’donnell, M. (2005) Cellular DNA Replicases: Components and Dynamics at the Replication Fork. Annu. Rev. Biochem. 74, 283–315
31. Stukenberg, P. T., Studwell-Vaughan, P. S., and O'donnell, M. (1991) Mechanism of the sliding beta-clamp of DNA polymerase III holoenzyme. J Biol Chem 266, 11328–11334
32. Burbelo, P. D., Utani, A., Pan, Z. Q., and Yamada, Y. (1993) Cloning of the large subunit of activator 1 (replication factor C) reveals homology with bacterial DNA ligases. Proc Natl Acad Sci USA 90, 11543–11547
33. Gomes, X. V., Gary, S. L., and Burgers, P. M. (2000) Overproduction in Escherichia coli and characterization of yeast replication factor C lacking the ligase homology domain. J Biol Chem 275, 14541–14549

115
34. Chen, S., Levin, M. K., Sakato, M., Zhou, Y., and Hingorani, M. M. (2009) Mechanism of ATP-Driven PCNA Clamp Loading by S. Cerevisiae RFC. Journal of Molecular Biology 388, 431–442
35. Bloom, L. B. (2009) Loading clamps for DNA replication and repair. DNA Repair (Amst) 8, 570–578
36. Gulbis, J. M., Kazmirski, S. L., Finkelstein, J., Kelman, Z., O’donnell, M., and Kuriyan, J. (2004) Crystal structure of the chi:psi subassembly of the Escherichia coli DNA polymerase clamp-loader complex. Eur J Biochem 271, 439–449
37. Tsuchihashi, Z., and Kornberg, A. (1989) ATP interactions of the tau and gamma subunits of DNA polymerase III holoenzyme of Escherichia coli. J Biol Chem 264, 17790–17795
38. Onrust, R., and O'donnell, M. (1993) DNA polymerase III accessory proteins. II. Characterization of delta and delta'. J Biol Chem 268, 11766–11772
39. Pritchard, A. E., Dallmann, H. G., Glover, B. P., and mchenry, C. S. (2000) A novel assembly mechanism for the DNA polymerase III holoenzyme dnax complex: association of deltadelta' with Dnax(4) forms Dnax(3)deltadelta'. EMBO J 19, 6536–6545
40. Anderson, S. G., Williams, C. R., O’donnell, M., and Bloom, L. B. (2007) A function for the psi subunit in loading the Escherichia coli DNA polymerase sliding clamp. J Biol Chem 282, 7035–7045
41. Mok, M., and Marians, K. J. (1987) The Escherichia coli preprimosome and DNA B helicase can form replication forks that move at the same rate. J Biol Chem 262, 16644–16654
42. Bloom, L. B. (2006) Dynamics of Loading the Escherichia coli DNA Polymerase Processivity Clamp. Critical Reviews in Biochemistry and Molecular Biology 41, 179–208
43. Marzahn, M. R., and Bloom, L. B. (2012) Improved solubility of replication factor C (RFC) Walker A mutants. Protein Expr Purif 83, 135–144
44. Paschall, C. O., Thompson, J. A., Marzahn, M. R., chiraniya, A., Hayner, J. N., O’donnell, M., Robbins, A. H., mckenna, R., and Bloom, L. B. (2011) The Escherichia coli clamp loader can actively pry open the β-sliding clamp. J Biol Chem 286, 42704–42714

116
45. Uhlmann, F., Cai, J., Gibbs, E., O'donnell, M., and Hurwitz, J. (1997) Deletion analysis of the large subunit p140 in human replication factor C reveals regions required for complex formation and replication activities. J Biol Chem 272, 10058–10064
46. Peoples, R., Franke, Y., Wang, Y.-K., Pérez-Jurado, L., Paperna, T., Cisco, M., and Francke, U. (2000) A Physical Map, Including a BAC/PAC Clone Contig, of the Williams-Beuren Syndrome–Deletion Region at 7q11.23. The American Journal of Human Genetics 66, 47–68
47. Wang, Y., Cortez, D., Yazdi, P., Neff, N., Elledge, S. J., and Qin, J. (2000) BASC, a super complex of BRCA1-associated proteins involved in the recognition and repair of aberrant DNA structures. Genes Dev. 14, 927–939
48. MS, Y. R. K., MD, S. Y. S., MD, S. S. K., MD, C. H. A., MD, S. H. L., and MD, N. J. Y. (2010) Mutational and expressional analysis of RFC3, a clamp loader in DNA replication, in gastric and colorectal cancers. Human Pathology 41, 1431–1437
49. Tang, H., Hilton, B., Musich, P. R., Fang, D. Z., and Zou, Y. (2012) Replication factor C1, the large subunit of replication factor C, is proteolytically truncated in Hutchinson-Gilford progeria syndrome. Aging Cell 11, 363–365
50. Naktinis, V., Onrust, R., Fang, L., and O'donnell, M. (1995) Assembly of a chromosomal replication machine: two DNA polymerases, a clamp loader, and sliding clamps in one holoenzyme particle. II. Intermediate complex between the clamp loader and its clamp. J Biol Chem 270, 13358–13365
51. Gomes, X. V. (2001) ATP Utilization by Yeast Replication Factor C. I. ATP-mediated interaction with DNA and with proliferating cell nuclear antigen. Journal of Biological Chemistry 276, 34768–34775
52. Gomes, X. V. (2001) ATP Utilization by Yeast Replication Factor C. II. Multiple stepwise ATP binding events are required to load proliferating cell nuclear antigen onto primed DNA. Journal of Biological Chemistry 276, 34776–34783
53. Hingorani, M. M., and O'donnell, M. (1998) ATP binding to the Escherichia coli clamp loader powers opening of the ring-shaped clamp of DNA polymerase III holoenzyme. J Biol Chem 273, 24550–24563
54. Sakato, M., O’donnell, M., and Hingorani, M. M. (2012) A central swivel point in the RFC clamp loader controls PCNA opening and loading on DNA. Journal of Molecular Biology 416, 163–175

117
55. Bloom, L. B., Turner, J., Kelman, Z., Beechem, J. M., O'donnell, M., and Goodman, M. F. (1996) Dynamics of loading the beta sliding clamp of DNA polymerase III onto DNA. J Biol Chem 271, 30699–30708
56. Simonetta, K. R., Kazmirski, S. L., Goedken, E. R., Cantor, A. J., Kelch, B. A., Mcnally, R., Seyedin, S. N., Makino, D. L., O'donnell, M., and Kuriyan, J. (2009) The Mechanism of ATP-Dependent Primer-Template Recognition by a Clamp Loader Complex. Cell 137, 659–671
57. Kazmirski, S. L., Zhao, Y., Bowman, G. D., O’donnell, M., and Kuriyan, J. (2005) Out-of-plane motions in open sliding clamps: molecular dynamics simulations of eukaryotic and archaeal proliferating cell nuclear antigen. Proc Natl Acad Sci USA 102, 13801–13806
58. Miyata, T., Suzuki, H., Oyama, T., Mayanagi, K., Ishino, Y., and Morikawa, K. (2005) Open clamp structure in the clamp-loading complex visualized by electron microscopic image analysis. Proc Natl Acad Sci USA 102, 13795–13800
59. Bowman, G. D., Goedken, E. R., Kazmirski, S. L., O’donnell, M., and Kuriyan, J. (2005) DNA polymerase clamp loaders and DNA recognition. FEBS Lett. 579, 863–867
60. Onrust, R., Stukenberg, P., and O'donnell, M. (1991) Analysis of the ATPase Subassembly Which Initiates Processive DNA-Synthesis by DNA Polymerase-III Holoenzyme. J Biol Chem 266, 21681–21686
61. Sakato, M., Zhou, Y., and Hingorani, M. M. (2012) ATP Binding and Hydrolysis-Driven Rate-Determining Events in the RFC-Catalyzed PCNA Clamp Loading Reaction. Journal of Molecular Biology 416, 176–191
62. Williams, C. R., Snyder, A. K., Kuzmic, P., O’donnell, M., and Bloom, L. B. (2004) Mechanism of loading the Escherichia coli DNA polymerase III sliding clamp: I. Two distinct activities for individual ATP sites in the gamma complex. J Biol Chem 279, 4376–4385
63. Ason, B., Bertram, J. G., Hingorani, M. M., Beechem, J. M., O'donnell, M., Goodman, M. F., and Bloom, L. B. (2000) A model for Escherichia coli DNA polymerase III holoenzyme assembly at primer/template ends. DNA triggers a change in binding specificity of the gamma complex clamp loader. J Biol Chem 275, 3006–3015
64. Ason, B. (2003) Mechanism of Loading the Escherichia coli DNA Polymerase III beta Sliding Clamp on DNA. Bona fide primer/templates preferentially trigger the gamma complex to hydrolyze ATP and load the clamp. Journal of Biological Chemistry 278, 10033–10040

118
65. Anderson, S. G., Thompson, J. A., Paschall, C. O., O’donnell, M., and Bloom, L. B. (2009) Temporal Correlation of DNA Binding, ATP Hydrolysis, and Clamp Release in the Clamp Loading Reaction Catalyzed by the Escherichia coli γ complex. Biochemistry 48, 8516–8527
66. Thompson, J. A., Paschall, C. O., O’donnell, M., and Bloom, L. B. (2009) A slow ATP-induced conformational change limits the rate of DNA binding but not the rate of beta clamp binding by the Escherichia coli gamma complex clamp loader. J Biol Chem 284, 32147–32157
67. Thompson, J. A., Marzahn, M. R., O'donnell, M., and Bloom, L. B. (2012) Replication Factor C is a more effective Proliferating Cell Nuclear Antigen (PCNA) opener than the Checkpoint Clamp Loader, Rad24-RFC. J Biol Chem 287, 2203–2209
68. Weibezahn, J., Schlieker, C., Bukau, B., and Mogk, A. (2003) Characterization of a trap mutant of the AAA+ chaperone clpb. J Biol Chem 278, 32608–32617
69. Lee, S.-H., Moon, J.-H., Yoon, S. K., and Yoon, J.-B. (2012) Stable Incorporation of ATPase Subunits into 19 S Regulatory Particle of Human Proteasome Requires Nucleotide Binding and C-terminal Tails. J Biol Chem 287, 9269–9279
70. Finkelstein, J., Antony, E., Hingorani, M., and O'donnell, M. (2003) Overproduction and analysis of eukaryotic multiprotein complexes in Escherichia coli using a dual-vector strategy. Analytical biochemistry 319, 78–87
71. Angers-Loustau, A., Rainy, J., and Wartiovaara, K. (2007) plasmaDNA: a free, cross-platform plasmid manipulation program for molecular biology laboratories. BMC Mol Biol 8, 77
72. Johnson, A. (2003) Ordered ATP Hydrolysis in the gamma Complex Clamp Loader AAA+ Machine. J Biol Chem 278, 14406–14413
73. Hiratsuka, T., and Uchida, K. (1973) Preparation and properties of 2'(or 3‘)-O-(2,4,6-trinitrophenyl) adenosine 5’-triphosphate, an analog of adenosine triphosphate. Biochim. Biophys. Acta 320, 635–647
74. Cable, M. B., Feher, J. J., and Briggs, F. N. (1985) Mechanism of allosteric regulation of the Ca,Mg-ATPase of sarcoplasmic reticulum: studies with 5'-adenylyl methylenediphosphate. Biochemistry 24, 5612–5619
119
75. Kornberg, A., and Pricer, W. E. (1951) Enzymatic phosphorylation of adenosine and 2,6-diaminopurine riboside. J Biol Chem 193, 481–495
76. Mcnally, R., Bowman, G. D., Goedken, E. R., O'donnell, M., and Kuriyan, J. (2010) Analysis of the role of PCNA-DNA contacts during clamp loading. BMC Struct Biol 10, 3
77. Zhuang, Z., Yoder, B. L., Burgers, P. M. J., and Benkovic, S. J. (2006) The structure of a ring-opened proliferating cell nuclear antigen-replication factor C complex revealed by fluorescence energy transfer. Proc Natl Acad Sci USA 103, 2546–2551
78. Schmidt, S. L. G. (2001) ATP Utilization by Yeast Replication Factor C. III. The ATP-binding domains of Rfc2, Rfc3 and Rfc4 are essential for DNA recognition and clamp loading. J Biol Chem 276, 34784–34791
79. Turner, J., Hingorani, M. M., Kelman, Z., and O'donnell, M. (1999) The internal workings of a DNA polymerase clamp-loading machine. EMBO J 18, 771–783
80. Story, R. M., and Steitz, T. A. (1992) Structure of the recA protein-ADP complex. Nature 355, 374–376
81. Hingorani, M. M., Bloom, L. B., Goodman, M. F., and O'donnell, M. (1999) Division of labor--sequential ATP hydrolysis drives assembly of a DNA polymerase sliding clamp around DNA. EMBO J 18, 5131–5144
82. Sanchez-Berrondo, J., Mesa, P., Ibarra, A., Martinez-Jimenez, M. I., Blanco, L., Mendez, J., Boskovic, J., and Montoya, G. (2012) Molecular architecture of a multifunctional MCM complex. Nucleic Acids Research 40, 1366–1380
83. Maki, S., and Kornberg, A. (1988) DNA polymerase III holoenzyme of Escherichia coli. II. A novel complex including the gamma subunit essential for processive synthesis. J Biol Chem 263, 6555–6560
84. Klemm, R. D., Austin, R. J., and Bell, S. P. (1997) Coordinate binding of ATP and origin DNA regulates the ATPase activity of the origin recognition complex. Cell 88, 493–502

120
BIOGRAPHICAL SKETCH
Ankita Chiraniya was born in Bihar, India. She finished her schooling and
undergraduate studies in India. She also received a master’s degree from the
Ambedkar Center for Biomedical research, New Delhi in 2004. In 2007, she joined the
graduate program in the College of Medicine, Department of Biochemistry and
Molecular Biology (IDP) at the University of Florida. Her research was performed under
the supervision of Dr. Linda Bloom in the Department of Biochemistry and Molecular
Biology. She received her Ph.D. from the University of Florida in summer 2012.