rogers state university of total assets, liabilities, and net ... • rogers state university is one...
TRANSCRIPT
INSTITUTIONAL FACT BOOK
2010 Edition
ROGERS STATE UNIVERSITY Claremore, Oklahoma
Office of Institutional Research, Planning, and Assessment
RSU Institutional Fact Book The information contained in the Institutional Fact Book is collected from several institutional offices. The enrollment and faculty data are based on the preliminary data stored after the last day to drop courses with no grade record which is traditionally the end of the second week of classes. The tuition information is provided by the Office of the Bursar and the fiscal data is provided by the Budgeting and Accounting Department.
Please note that, to the extent possible, the data presented on the following pages represent snapshots taken at the same time of the academic year. In some instances, however, variations in reporting cycles have limited our ability to do so. For this reason, the reader who attempts to cross-reference certain data tables may find discrepancies which not due to inaccuracies in the data.
Prepared by Michelle Canan Research Analyst Institutional Research, Planning and Assessment October 2010
Institutional Fact Book 2010 Edition
Institutional Research, Planning, and Assessment Page 2 of 88
Table of Contents
Introduction 6Degrees Offered by Level 8RSU Fast Facts 10Organization Chart 13Strategic Planning Engine 2010‐2015 14Student Clubs and Organizations 15Athletics 15Glossary of Terms 16Glossary of Funding Terms 17Unduplicated Head Count and FTE 18Total Semester Hours 18Duplicated Head Count by Site 19Unduplicated Head Count by Site 19Head Count by Gender and Level 20Concurrent High School Student Head Count 21Unduplicated Head Count by Age 21Unduplicated Head Count by Goal 22Unduplicated Head Count by Race/Ethnicity 22Average ACT Score for Students Who Submitted Scores 23Unduplicated Head Count by Major 24
Bachelor 24Associate in Arts 25Associate in Science 26Associate in Applied Science 26Miscellaneous 27
Degrees Awarded 28Distribution of Student Enrollment by Credit Load 31Unduplicated Head Count by County (Oklahoma) 32Unduplicated Head Count by City (Oklahoma): With Ten or More 34First‐time Freshmen Average ACT Scores 35First‐time Freshmen by High School: With Ten or More 35First‐time Freshmen by City (Oklahoma): With Ten or More 36First‐time Transfers Head Count 37First‐time Transfers by Last Institution Attended: With Five or More 37Online Head Count 38Faculty Profile 39Student to Faculty Ratio 39Full‐time Faculty by Rank 39
Institutional Fact Book 2010 Edition
Institutional Research, Planning, and Assessment Page 3 of 88
Tuition and Fees 40Funding History 41
Funding History‐E&G 1 41Revenue History 41E&G I Expenditures by Function 41Percent of Expenditures by Function 41Expenditures by Object Category 42Percent of Budget Expenditures by Object 42Statements of Cash Flows for the Years Ended June 30 43Summary of Total Assets, Liabilities, and Net Assets for the Years Ended June 30 43
Holdings of Stratton Taylor Library by Volume Type 44Summary of Stratton Taylor Library Purchases 44Claremore Campus 45
Claremore Duplicated Head Count and FTE 45Claremore Total Semester Hours 45Claremore Head Count by Gender and Level 46Claremore Concurrent High School Student Head Count 47Claremore Head Count by Age 47Claremore Head Count by Goal 48Claremore Head Count by Race/Ethnicity 49Average ACT for Claremore Students Who Submitted Scores 49Claremore First‐time Freshmen Average ACT Scores 50Claremore First‐time Transfers Head Count 50Claremore Head Count by Major 51Claremore Head Count by County (Oklahoma) 54
Pryor Campus 56Pryor Duplicated Head Count and FTE 56Pryor Total Semester Hours 56Pryor Head Count by Gender and Level 57Pryor Concurrent High School Student Head Count 58Pryor Head Count by Age 58Pryor Head Count by Goal 59Pryor Head Count by Race/Ethnicity 60Average ACT for Pryor Students Who Submitted Scores 60Pryor First‐time Freshmen Average ACT Scores 61Pryor First‐time Transfers Head Count 61Pryor Head Count by Major 62Pryor Head Count by County (Oklahoma) 65
Bartlesville Campus 67Bartlesville Duplicated Head Count and FTE 67
Institutional Fact Book 2010 Edition
Institutional Research, Planning, and Assessment Page 4 of 88
Bartlesville Total Semester Hours 67Bartlesville Head Count by Gender and Level 68Bartlesville Concurrent High School Student Head Count 69Bartlesville Head Count by Age 69Bartlesville Head Count by Goal 70Bartlesville Head Count by Race/Ethnicity 71Average ACT for Bartlesville Students Who Submitted Scores 71Bartlesville First‐time Freshmen Average ACT Scores 72Bartlesville First‐time Transfers Head Count 72Bartlesville Head Count by Major 73Bartlesville Head Count by County (Oklahoma) 76
Online Campus 78Online Duplicated Head Count and FTE 78Online Total Semester Hours 78Online Head Count by Gender and Level 79Online Concurrent High School Student Head Count 80Online Head Count by Age 80Online Head Count by Goal 81Online Head Count by Race/Ethnicity 82Average ACT for Online Students Who Submitted Scores 82Online First‐time Freshmen Average ACT Scores 83Online First‐time Transfers Head Count 83Online Head Count by Major 84Online Head Count by County (Oklahoma) 87
Institutional Fact Book 2010 Edition
Institutional Research, Planning, and Assessment Page 5 of 88
Introduction
• Administration Dr. Larry Rice, President Dr. Richard Beck, Vice President for Academic Affairs Dr. Ray Brown, Vice President for Economic and Community Development Dr. Danette Boyle, Vice President for Development and Alumni Mr. Tom Volturo, Executive Vice President for Administration and Finance Mr. Mark Meadors, Comptroller/Assistant Vice President for Business Affairs Ms. Linda Andrews, Assistant Vice President for Institutional Research, Planning
and Assessment Dr. Tobie Titsworth, Vice President for Student Affairs Mr. Bill Beierschmitt, Provost and Chief Operating Office, Bartlesville Campus Ms. Sherry Alexander, Director, Pryor Campus
• Established: 1999 (Previously: Eastern Oklahoma Preparatory Academy, 1909-1917; Oklahoma Military Academy, 1917-1971; Claremore Junior College, 1971-1982; Rogers State College, 1982-1996; Rogers University, 1996-1998)
• Congressional District: Second • University Accreditation: The Higher Learning Commission (NCA), North Central
Association of Colleges and Schools, and the National League for Nursing Accrediting Commission
• Carnegie Classification: Level 4-year or above; Public; Baccalaureate/Associate’s Colleges
• U.S. Department of Education’s Central Registry Number: 1736017987A6 • FICE Code: 003168 • U.S. Department of Education IPEDS Number: 207661 • Schools
School of Business and Technology School of Liberal Arts School of Mathematics, Science, and Health Sciences
• Departments Applied Technology Business Sport Management Communications English and Humanities Fine Arts History and Political Science Psychology, Sociology, and Criminal Justice Biology Health Sciences
Institutional Fact Book 2010 Edition
Institutional Research, Planning, and Assessment Page 6 of 88

Mathematics and Physical Sciences • Calendar: Semester • Minutes from Tulsa: 30 • Known for: Personal attention, small class sizes, affordability, proximity to Tulsa • Classes offered: on-site at three campuses, online, via television • Mascot: Hillcat • University colors: blue and crimson • Unique features: RSU Radio FM 91.3, RSU Public Television, Innovation Center
(economic development and business incubator), RSU Foundation, TRIO student support programs, Child Development Center, 120-acre nature reserve, Oklahoma Military Academy Museum, athletic fields, RSU Police Department, three full-service campuses
• Admission requirements at a glance: for bachelor’s degree programs, 20 ACT or above or 940 SAT or above, 2.7 high school GPA or above; for associate’s degree programs, open admissions; transfer students, 2.0 college GPA or above
• Total faculty: 260 • Female students: 63 percent • Male students: 37percent • Students age 18-25: 60 percent • Students over the age of 25: 34 percent • From Oklahoma: 96 percent
Out-of-state: 4 percent • Cooperative & articulation agreements: Tulsa Community College, Northeastern
Oklahoma A&M College (NEO), Tulsa Technology Centers (all campuses), Northeast Technology Centers (all campuses), Coffeyville (Kan.) Community College, Independence (Kan.) Community College
• Academic & Leadership Programs: Honors Program, President’s Leadership Council, Washington Center Internship Program, Study Abroad Program, Studies at Large
• Athletics: Men’s and women’s basketball, baseball, softball, men’s and women’s soccer, men’s and women’s golf, men’s and women’s cross country; member of the National Association of Intercollegiate Athletics (NAIA) and Sooner Athletic Conference (SAC)
• Housing: On-campus residence hall and student apartments (Claremore campus) • Food: Hillcat Hut, RSU Convenience Store • Financial aid: all forms available; 77 percent of students receive financial aid;
application deadline, June 1 for fall semester; average financial aid package, $7913.00
Institutional Fact Book 2010 Edition
Institutional Research, Planning, and Assessment Page 7 of 88
• Degrees Offered by Level Bachelor of Arts Communications—Communication Arts Option Communications—Corporate Communications Option Communications—Radio-Television Option Liberal Arts—English Option Liberal Arts—Global Humanities Option Military History* Public Administration—Accounting and Budgeting Option* Public Administration— General Management Option* Public Administration— Human Resources Management Option* Public Administration— Public Affairs Option* Public Administration— Research and Analysis Option* Bachelor of Fine Art Visual Arts—Graphic Design Option Visual Arts—Multimedia Option Visual Arts—Photographic Arts Option* Visual Arts—Studio Art Option Bachelor of Science Biology—Environmental Conservation Option
Biology—Medical & Molecular Option Business Administration—Accounting Option Business Administration—Entrepreneurship Option Business Administration—Forensic Accounting Option Business Administration– Human Resources Management Option Business Administration—Management Option Business Administration—Manufacturing Management Option Business Administration—Marketing Option Business Information Technology—Computer Network Administration
Option Business Information Technology—Software Development & Multimedia
Option Business Information Technology—Telecommunications Foundations
Option Community Counseling Game Development Justice Administration Nursing Organizational Leadership—Business Studies Focus Area Organizational Leadership—Communication Strategies Focus Area Organizational Leadership—Liberal Studies Focus Area Organizational Leadership—Social Studies Focus Area
Institutional Fact Book 2010 Edition
Institutional Research, Planning, and Assessment Page 8 of 88
Social Science—Environmental Studies Option* Social Science—History Option Social Science—Political Science Option Social Science—Psychology Option Social Science—Sociology Option Sport Management
Bachelor of Technology Applied Technology Associate in Arts
Accounting Business Administration Criminal Justice Studies—COP Option Criminal Justice Studies—Law/Justice Option Elementary Education Secondary Education Liberal Arts—General Option Liberal Arts—English Option Liberal Arts—Native American Studies Option Social Sciences—History Option Social Sciences—Political Science Option Social Sciences—Psychology Option Social Sciences—Sociology Option
Associate in Science Biological Science Computer Science Physical Science Physical Science—Chemistry Option Physical Science—Engineering/Physics/Math Option Physical Science—Geology Option
Associate in Applied Science Applied Technology Emergency Medical Services Nursing Nursing—Bridge NREMT-Paramedic/LPN to RN Option
*Pending approval by the Oklahoma State Regents for Higher Education.
Institutional Fact Book 2010 Edition
Institutional Research, Planning, and Assessment Page 9 of 88
RSU Fast Facts
• RSU is a dynamic, progressive university widely recognized for its high-quality academic programs, distance learning options, and high-technology learning environment.
• Rogers State University is one of the fastest-growing universities in Oklahoma. In fall 2010, over 4,300 students enrolled at RSU. Since RSU was accredited as a four-year university in 2000, enrollment has grown by over 94 percent (based on student credit hours.)
• RSU is the only public four-year, residential university in the Tulsa area and is located near several major Tulsa high-technology employers and the Tulsa International Airport.
• RSU was granted continued accreditation from the Higher Learning Commission of the North Central Association of Colleges and Schools without further required evaluation for 10 years – a rarity in higher education and a major accomplishment achieved by few universities.
• RSU has implemented a wide variety of new bachelor degree programs in high-demand areas such as business administration, communications, and nursing, as well as unique disciplines such as game development, justice administration, sport management and military history*. RSU is one of a few universities in Oklahoma to offer both bachelor and associate degrees.
• In 2005, RSU relocated its Bartlesville campus to a historic nine-story downtown building, enabling the university to offer more classes, more degree programs, and more services for area residents. The building is presently undergoing major renovations to accommodate new bachelor’s degree programs such as business and nursing and the expansion of student services.
• RSU has completed a major $1.3 million expansion of its Pryor campus, doubling the size of its facility, providing additional classrooms, laboratories, and student-focused amenities. RSU is the only university serving the Pryor and Mayes County area.
• RSU recently opened its new $13 million Centennial Center – a state-of-the-art, two-level, 50,000 square-foot facility that combines a variety of student programs under one roof, serves as a central location for students to study and socialize, and provides a focal point for the RSU campus in Claremore.
• RSU recently completed renovation of Baird Hall doubling its size to 57,000 square feet. Baird Hall now contains classrooms equipped with Smart Boards, a performance studio and an amphitheater-style outdoor classroom. Baird Hall always provided a location for the university’s art gallery, and when the building reopened, it boasted a new gallery for RSU students and faculty artists, as well as visiting artists, to exhibit their work. Those entering the main plaza entrance on the southeast *Pending approval by the Oklahoma State Regents for Higher Education.
Institutional Fact Book 2010 Edition
Institutional Research, Planning, and Assessment Page 10 of 88

corner of the building will be greeted by a six-foot-tall statue of Will Rogers, the area’s iconic folk hero. It is also the headquarters for four academic departments including the Department of Communications, Department of English and Humanities, Department of Fine Arts and Department of History and Political Science. The RSU/Cameron Education Program and Honors Program are also located in Baird Hall.
• RSU has transformed its main campus in Claremore through several new building and renovation projects, including the state-of-the-art Stratton Taylor Library, on-campus student living community, several athletic fields and the Innovation Center, a business incubator. All major historic buildings on the Claremore campus have been completed renovated. Preparatory Hall and Meyer Hall are listed on the National Register of Historic Places. RSU’s beautiful main campus also features a military museum, an art gallery, Will Rogers Auditorium, two lakes, a 120-acre nature conservatory, amphitheater, and nature trails for the community.
• The Claremore campus is accentuated with some of the largest and most elaborate sculptures located on any university campus in Oklahoma, including sculptures of George Washington, Thomas Jefferson, and Abraham Lincoln.
• RSU is the only university in Oklahoma to operate a full-power public television station, reaching more than 1 million viewers across Oklahoma and surrounding states. The university also operates a radio station which serves as a learning laboratory for communications students.
• RSU operates its own radio station, RSU Radio (KRSC) 91.3 FM, which can be heard in Claremore, Tulsa, and across northeast Oklahoma. RSU Radio is the only alternative college radio station on a campus in Oklahoma. Much of the programming is produced and hosted by RSU students.
• Five endowed faculty chairs have been established at RSU. The private gifts funding these faculty chairs have been matched dollar for dollar by the Oklahoma State Regents for Higher Education's Endowment Trust Fund. RSU's endowed faculty chairs are: the Kunz Endowed Chair in Communications, funded by Warner Brothers (WB) television; the Sarkeys Endowed Chair in Business Information Technology, funded by the Sarkeys Foundation; the John W. Norman Endowed Chair in Business Information Technology, funded by anonymous donors; the Oliver Dewey Mayor Endowed Chair, funded by the Oliver Dewey Mayor Foundation for an endowed faculty position at RSU's campus in Pryor; and an Endowed Chair in Nursing.
• RSU is dedicated to providing programs and activities to foster student development outside the classroom. The Office of Student Affairs provides services to promote student development, diversity, campus activities, career services, and more. Nearly 30 student organizations are active on campus.
• The RSU Student Health Center is located in Downs Hall on the Claremore campus. The center provides health care for students, faculty, and staff for treating minor
Institutional Fact Book 2010 Edition
Institutional Research, Planning, and Assessment Page 11 of 88
injuries and illnesses, as well as providing individual, group, and family counseling for students.
• RSU's Innovation Center is a 7,000-square-foot facility that houses a business incubator and provides office space for several economic development organizations. Established in 2002, the Innovation Center fosters regional economic development and addresses the educational needs of business and industry.
• RSU’s emergency medical technology program is one of only two college-level paramedic programs in the state of Oklahoma and the only such program in northeast Oklahoma.
• RSU has a $2.2 million off-campus equestrian center that houses the Bit by Bit Therapeutic Horseback Riding Program and the RSU Rodeo Team. The Frank and Wanda Sanders Family Trust donated 23 acres of land for the facility, which is located just off U.S. Highway 169 five miles south of Oologah. Bit by Bit is a cooperative program between RSU and Oologah-Talala Public Schools to promote physical and mental health for disabled children and adults through horseback riding.
• The Oklahoma Military Academy Museum, located on the second floor of Meyer Hall on the RSU campus in Claremore, tells the story of the more than 10,000 cadets who attended the Oklahoma Military Academy (OMA) from 1919 to 1971. The museum, which is open to the public, features thousands of historical documents, photographs, military uniforms, and other memorabilia. The OMA, one of the predecessor institutions of RSU, was known throughout the U.S. as the “West Point of the Southwest.” Distinguished graduates include Lt. Gen. William E. Potts, Admiral William J. Crowe, and Col. Edwin P. Ramsey.
• A collection of 57 porcelain sculptures of birds in their natural habitat by Edward Marshall Boehm, one of the leading wildlife artists of the 20th Century, was donated to RSU by Bill and Betty Holman of Claremore. The collection can be viewed by the public at the university’s Stratton Taylor Library.
Institutional Fact Book 2010 Edition
Institutional Research, Planning, and Assessment Page 12 of 88

Organization Chart
Institutional Fact Book 2010 Edition
Institutional Research, Planning, and Assessment Page 13 of 88

Strategic Planning Engine 2010-2015 October 6, 2010
Mission
• Governing Bodies (NCA/HLC, OSRHE, OU Regents) • University Organizational Structure • Policies and Procedures
Commitments • Provide associate, baccalaureate, and graduate degrees • Promote academic and intellectual freedom • Provide a general liberal arts education • Provide a diverse, innovative faculty • Provide university-wide student services, activities, and resources • Support and strengthen student, faculty, and administrative structures • Promote and encourage student, faculty, staff, and community interaction
Goals, Objectives, Strategies, and Actions
• Goals: Strategic Planning Committee identifies high-level planning targets
• Objectives: University Planning Group defines and prioritizes measurable results
• Strategies: Divisions develop broad plans to fulfill objectives within their purview
• Actions: Departments initiate specific tasks in support of identified strategies
• Planning Unit Purpose • Planning Unit Actions • Evaluation of Action Plan
Implementation and Results
Plans • Academic Plan • Annual Budget • Campus Master Plan • Enrollment Management Plan • Marketing Plan • Safety Plan • Strategic Plan • Technology Plan
Implementation • Academic Council • Center for Teaching and Learning • Faculty Senate • President’s Cabinet • Standing Committees • Student Affairs Council • Student Government Association • University Planning Group • Xitracs Accreditation Management System
Review and Evaluation • Academic Program Review • Administrative & Educational Support Evaluations • Alumni Survey • College Outcomes Survey • Degree Program Learning Outcomes • Evaluation of Instruction • Faculty Evaluation, Promotion and Tenure
Process • General Education Learning Outcomes • Institutional Audits • IRPA Reports and Publications • NCA/HLC & Specialty Accreditation Reviews • Survey of Student Opinions
Institutional Fact Book 2010 Edition
Institutional Research, Planning, and Assessment Page 14 of 88

Student Clubs and Organizations
• Alpha Sigma Alpha Sorority (ASA) • Alpha Sigma Tau Sorority (AST) • Baptist Collegiate Ministry (BCM) • Biology Club • Campus Crusade for Christ (CRU) • Civitan Club (Bartlesville Campus) • College Republicans • Community Counseling Student
Association • Criminal Justice Society • Emergency Medical Student Services
(EMSSA) • Epsilon Sigma Alpha (EΣA) • Native American Student Association
(NASA) • Objectivist Club • Oklahoma Intercollegiate Legislature
(O.I.L.)
• President's Leadership Class (PLC) • Psi Chi (National Honor Society in
Psychology) • Psychology Club • Rogers State Gaming Association • RSU Accounting Society • RSU Community Counseling • S.P.Q.R. (Paintball) • Spanish Club • Student Art Association • Student Broadcasting Association (SBA) • Student Government Association (SGA) • Student Newspaper Organization (SNO) • Student Theater Association (STO) • Students in Free Enterprise (SIFE) • Student Nursing Association (SNA) • Student Veteran’s Organization • VOICE
Athletics
• Basketball—Men’s and Women’s • Baseball—Men’s • Cross Country—Men’s and Women’s • Golf—Men’s and Women’s • Soccer—Men’s and Women’s • Softball—Women’s • Cheerleading • Rodeo
Institutional Fact Book 2010 Edition
Institutional Research, Planning, and Assessment Page 15 of 88
Glossary of Terms
• Credit (Semester) Hour—One 50 minute class period per week in a subject for one 16 week semester. Most college level courses are 3-5 credit hours.
• Audit—A student not interested in obtaining a course grade, but who is enrolled simply to gain course information. No credit hours will be awarded for “audit” enrollments.
• Full-time—A student enrolled in at least 12 credit hours for a regular semester (fall or spring) or 6 credit hours for a summer session.
• Part-time—A student enrolled in less than 12 credit hours for a regular semester (fall or spring) or less than 6 credit hours for a summer session.
• Duplicated Count—Count includes duplicate student enrollment at more than one campus. For example, if a student is enrolled at Claremore and Pryor, the student will be counted twice.
• Unduplicated Count—Each student is counted one time based on a hierarchical standard (Claremore, Online, Pryor, and Bartlesville). If a student is enrolled at Claremore and Pryor, in the unduplicated count, the student will only be included in the Claremore head count.
• Site—A campus of Rogers State University (RSU). RSU has four main sites: Claremore, Pryor, Bartlesville, and Online.
• Classification o Freshman—A student who has earned less than 30 credit hours. o Sophomore—A student who has earned 30-59 credit hours. o Junior—A student who has earned 60-89 credit hours. o Senior—A student who has earned 90 or more credit hours.
• First-time Freshman—A first time student who has not previously attended college or who has attempted less than 7 college level credit hours excluding credit hours attempted while a concurrent high school student.
• First-time Transfer—A first time student who is transferring at least 7 college level credit hours including F’s, and excluding W’s and credit hours attempted while a concurrent high school student.
• Concurrent High School Student— A high school student who meets the Oklahoma State Regents for Higher Education admission requirements allowing enrollment in college level courses.
• Non-Degree Seeking—An enrolled student who is not seeking a degree. Usually, the student is admitted without documentation (e.g. transcripts, entry-level testing) and can enroll in up to nine (9) credit hours before required to submit admission documentation.
Institutional Fact Book 2010 Edition
Institutional Research, Planning, and Assessment Page 16 of 88

Glossary of Funding Terms
• E & G 1—Educational and General 1 fund. Used to support general educational operations, including faculty salaries, operating expenses of instructional departments, library operations and acquisitions, general administration, student services, campus security, operation and maintenance of educational and general buildings and facilities. The Educational and General Fund accounts for all assets and resources are used for financing the instruction and general administration of the university. Typically, state appropriations, tuition, and other income are the revenue sources.
• E & G 2—Education and General 2 fund. Used to support programs funded by federal, state and local grants, as well as gifts and donations.
• Auxiliary—Fund used to support business type activities including food services, print shop, mail room, child development center and motor pool, and other activities which operate on a fee for service basis.
• Capital—Fund used to account for funds obtained for purchase of equipment and building construction.
• Instruction—This category includes expenditures for most activities that are part of an institution’s instruction program.
• Public Service—This category includes funds expended for activities established primarily to provide non-instructional services beneficial to individuals and groups associated with particular sectors of the community outside the institution, such as community service programs (excluding instructional activities), cooperative extension services, conferences, institutes, general advisory services, reference bureaus, radio and television, consulting, and similar non-instructional services.
• Academic Support—This category includes funds expended primarily to provide support services for the institution’s three primary missions (primary programs)--instruction, research, and public service.
• Student Services—This category includes funds expended for the admissions and registrar's offices and for activities whose primary purpose is to contribute to a student’s emotional and physical well-being and intellectual, cultural, and social development outside the context of a formal instruction program.
• Institutional Support—This category includes expenditures for central executive-level activities involving management and long-range planning for the entire institution, such as the governing board, planning and programming, and legal services; fiscal operations, including the investment office; administrative data processing; space management; and employee personnel and records.
• Operation and Maintenance of Plant—This category includes all expenditures of current operating funds for the operation and maintenance of physical plant, in all cases net of amounts charged to auxiliary enterprises, hospitals, and independent operations; expenditures for operations established to provide services and maintenance related to grounds and facilities; utilities, fire protection, and certain types of maintenance expenditures.
Institutional Fact Book 2010 Edition
Institutional Research, Planning, and Assessment Page 17 of 88

Fall 2005 Fall 2006 Fall 2007 Fall 2008 Fall 2009 Fall 2010Unduplicated Count 3861 3952 3855 3858 4154 4386FTE 2630 2641 2701 2736 3002 3144
Unduplicated Head Count and FTE
Total Semester Hours
0500
100015002000250030003500400045005000
Fall 2005 Fall 2006 Fall 2007 Fall 2008 Fall 2009 Fall 2010
Unduplicated Count*
FTE*
44000
46000
48000
Fall 2005 Fall 2006 Fall 2007 Fall 2008 Fall 2009 Fall 2010Semester Hours 39451 39621 40512 41046 45031 47160
0500
100015002000250030003500400045005000
Fall 2005 Fall 2006 Fall 2007 Fall 2008 Fall 2009 Fall 2010
Unduplicated Count*
FTE*
34000
36000
38000
40000
42000
44000
46000
48000
Fall 2005 Fall 2006 Fall 2007 Fall 2008 Fall 2009 Fall 2010
Semester Hours
Institutional Fact Book 2010 Edition
Institutional Research, Planning, and Assessment Page 18 of 88
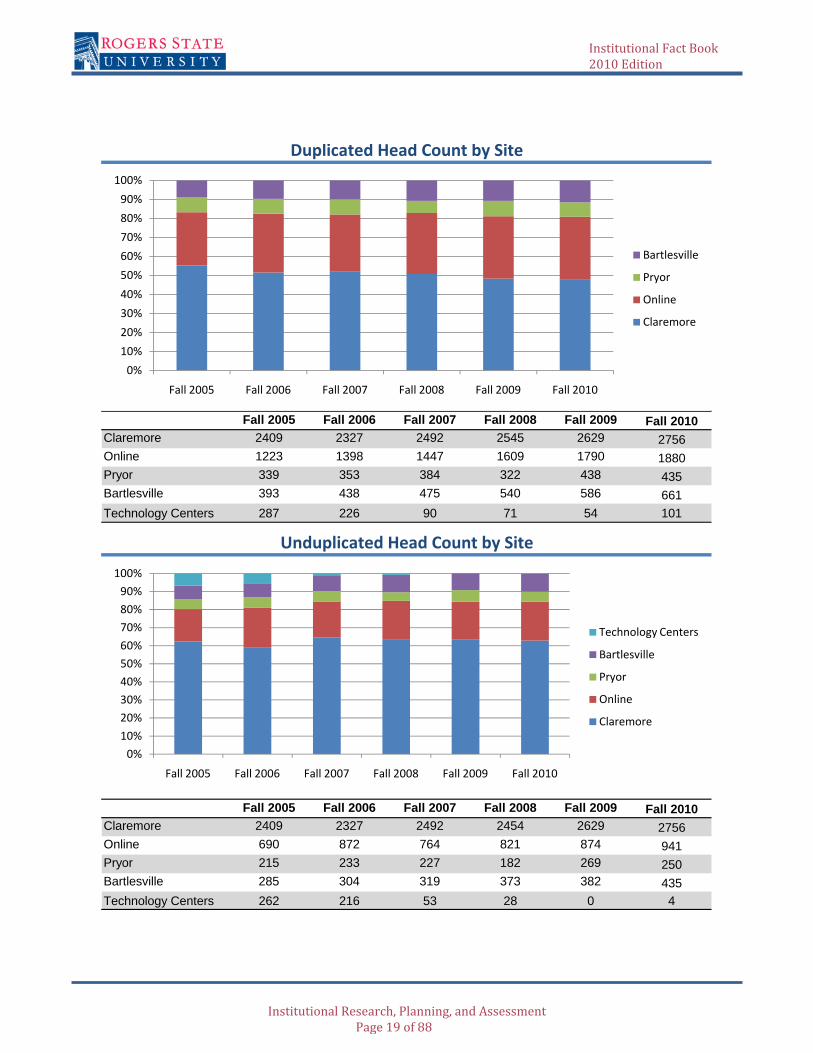
Fall 2005 Fall 2006 Fall 2007 Fall 2008 Fall 2009 Fall 2010Claremore 2409 2327 2492 2545 2629 2756Online 1223 1398 1447 1609 1790 1880Pryor 339 353 384 322 438 435Bartlesville 393 438 475 540 586 661Technology Centers 287 226 90 71 54 101
Duplicated Head Count by Site
Unduplicated Head Count by Site
0%10%20%30%40%50%60%70%80%90%
100%
Fall 2005 Fall 2006 Fall 2007 Fall 2008 Fall 2009 Fall 2010
Bartlesville
Pryor
Online
Claremore
60%70%80%90%
100%
Technology Centers
Fall 2005 Fall 2006 Fall 2007 Fall 2008 Fall 2009 Fall 2010Claremore 2409 2327 2492 2454 2629 2756Online 690 872 764 821 874 941Pryor 215 233 227 182 269 250Bartlesville 285 304 319 373 382 435Technology Centers 262 216 53 28 0 4
0%10%20%30%40%50%60%70%80%90%
100%
Fall 2005 Fall 2006 Fall 2007 Fall 2008 Fall 2009 Fall 2010
Bartlesville
Pryor
Online
Claremore
0%10%20%30%40%50%60%70%80%90%
100%
Fall 2005 Fall 2006 Fall 2007 Fall 2008 Fall 2009 Fall 2010
Technology Centers
Bartlesville
Pryor
Online
Claremore
Institutional Fact Book 2010 Edition
Institutional Research, Planning, and Assessment Page 19 of 88

Please note these counts do not include concurrent high school students.Two-Week Report Counts
Male Female Male Female Male Female Male Female Male Female Male FemaleFreshmen (FT) 465 777 485 703 476 749 467 692 511 776 495 797Freshmen (PT) 252 425 261 435 149 325 141 271 125 244 152 241
First-time Freshmen (FT) 265 418 262 337 255 388 251 340 293 437 266 399First-time Freshmen (PT) 111 129 82 107 44 64 51 63 38 64 52 71
Sophomores (FT) 127 231 130 241 172 296 179 273 206 313 208 327Sophomores (PT) 99 245 102 225 96 208 81 209 73 192 74 198
Juniors (FT) 75 138 104 146 125 187 141 227 168 252 164 261Juniors (PT) 73 176 69 187 74 175 81 157 66 181 80 198
Seniors (FT) 82 142 81 122 87 111 120 189 163 224 182 251Seniors (PT) 136 193 114 186 112 206 106 202 119 239 141 274
Special Non-Degree Seeking (FT) 0 0 0 0 0 0 0 1 0 0 0 0
Special Non-Degree Seeking (PT) 21 40 25 40 23 26 26 43 20 18 22 27
Total Full-time 749 1288 800 1212 860 1343 907 1382 1048 1565 1049 1636Total Part-time 581 1079 571 1073 454 940 435 882 403 874 469 938
Head Count by Gender and Level
Fall 2010Fall 2005 Fall 2006 Fall 2007 Fall 2008 Fall 2009
Institutional Fact Book 2010 Edition
Institutional Research, Planning, and Assessment Page 20 of 88

Concurrent High School Student Head Count
Unduplicated Head Count by Age
Fall 2005 Fall 2006 Fall 2007 Fall 2008 Fall 2009 Fall 2010
Total Enrolled 164 296 258 252 264 294
0
50
100
150
200
250
300
350
1000
1200
1400
1600
1800
under 21
21‐25
26 30
Fall 2005 Fall 2006 Fall 2007 Fall 2008 Fall 2009 Fall 2010under 21 1397 1563 1639 1588 1636 169421-25 992 1011 998 1052 1155 120526-30 512 472 425 439 468 52831-35 355 334 286 285 311 34036-40 229 238 196 221 255 258over 40 376 334 311 273 329 361
Fall 2005 Fall 2006 Fall 2007 Fall 2008 Fall 2009 Fall 2010
Total Enrolled 164 296 258 252 264 294
0
50
100
150
200
250
300
350
0
200
400
600
800
1000
1200
1400
1600
1800
Fall 2005 Fall 2006 Fall 2007 Fall 2008 Fall 2009 Fall 2010
under 21
21‐25
26‐30
31‐35
36‐40
over 40
Institutional Fact Book 2010 Edition
Institutional Research, Planning, and Assessment Page 21 of 88

Fall 2005 Fall 2006 Fall 2007 Fall 2008 Fall 2009 Fall 2010Bachelors 1252 1472 1693 1619 1789 1942Associate of Arts or Science 1805 1851 1645 1533 1589 1581Associate of Applied Science 636 488 436 618 737 792Non-Degree 166 141 81 88 39 71
Unduplicated Head Count by Goal
Unduplicated Head Count by Race/Ethnicity
0
500
1000
1500
2000
2500
Fall 2005 Fall 2006 Fall 2007 Fall 2008 Fall 2009 Fall 2010
Bachelors
Associate of Arts or Science
Associate of Applied Science
Non‐Degree
30.0%
40.0%
50.0%
60.0%
70.0% American Indian or Alaskan NativeAsian or Pacific Islander
Black, Non-Hispanic
Hispanic
Fall 2005 Fall 2006 Fall 2007 Fall 2008 Fall 2009 Fall 2010American Indian or Alaskan Native 27.3% 29.7% 27.9% 29.6% 29.9% 29.2%Asian or Pacific Islander 0.9% 0.9% 0.8% 1.4% 1.7% 1.4%Black, Non-Hispanic 3.1% 2.9% 2.9% 2.6% 2.9% 3.3%Hispanic 2.8% 2.4% 2.6% 2.4% 2.2% 3.6%Native Hawaiian or Pacific Islander 0.2% 0.2% 0.2% 0.2% 0.1% 0.3%White, Non-Hispanic 65.8% 64.0% 65.7% 63.8% 63.1% 62.2%Race/ethnicity unknown 0.0% 0.0% 0.0% 0.0% 0.0% 0.0%
0
500
1000
1500
2000
2500
Fall 2005 Fall 2006 Fall 2007 Fall 2008 Fall 2009 Fall 2010
Bachelors
Associate of Arts or Science
Associate of Applied Science
Non‐Degree
0.0%
10.0%
20.0%
30.0%
40.0%
50.0%
60.0%
70.0%
Fall 2005 Fall 2006 Fall 2007 Fall 2008 Fall 2009 Fall 2010
American Indian or Alaskan NativeAsian or Pacific Islander
Black, Non-Hispanic
Hispanic
Native Hawaiian or Pacific IslanderWhite, Non-Hispanic
Race/ethnicity unknown
Institutional Fact Book 2010 Edition
Institutional Research, Planning, and Assessment Page 22 of 88
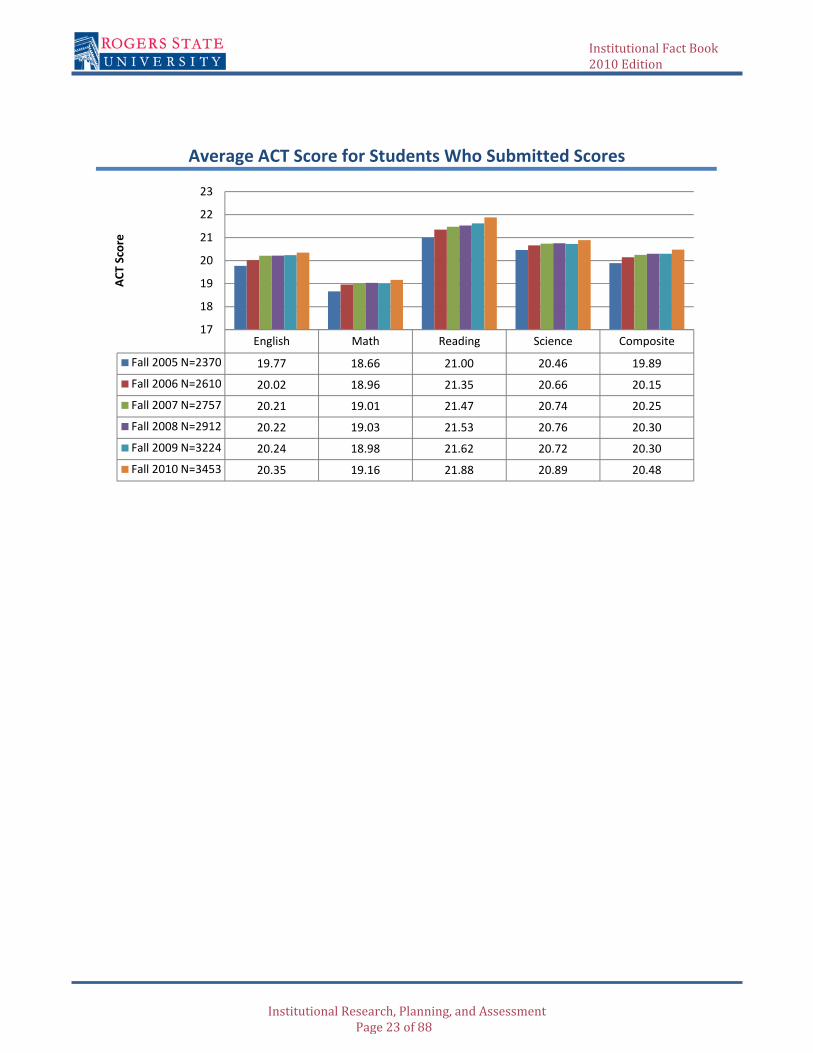
Average ACT Score for Students Who Submitted Scores
English Math Reading Science Composite
Fall 2005 N=2370 19.77 18.66 21.00 20.46 19.89
Fall 2006 N=2610 20.02 18.96 21.35 20.66 20.15
Fall 2007 N=2757 20.21 19.01 21.47 20.74 20.25
Fall 2008 N=2912 20.22 19.03 21.53 20.76 20.30
Fall 2009 N=3224 20.24 18.98 21.62 20.72 20.30
Fall 2010 N=3453 20.35 19.16 21.88 20.89 20.48
17
18
19
20
21
22
23
ACT Score
Institutional Fact Book 2010 Edition
Institutional Research, Planning, and Assessment Page 23 of 88

Bachelor
Degree Code Major/OptionFall 2005
Fall 2006
Fall 2007
Fall 2008
Fall 2009
Fall 2010
BA 114 Communications--BA 34 38 25 29 18 16
BA 114ACommunications-Communication Arts Option 0 0 6 7 7 16
BA 114CCommunications-Corporate Communications Option 16 15 13 17 23 27
BA 114X Communications-Radio-Television Option 17 27 23 33 49 47BA 109 Liberal Arts--BA 92 127 101 44 33 25BA 109E Liberal Arts--English Option 0 0 6 25 36 54BA 109H Liberal Arts--Global Humanities Option 0 0 1 5 11 14BA 123 Public Administration--BA 0 0 0 0 3 7
BA 123APublic Administration--Accounting and Budgeting Option* 0 0 0 0 0 1
BA 123MPublic Administration--General Management Option* 0 0 0 0 0 2
BA 123HPublic Administration--Human Resources Management Option* 0 0 0 0 0 0
BA 123PPublic Administration--Pulbic Affairs Option* 0 0 0 0 0 0
BA 123RPublic Administration--Research and Analysis Option* 0 0 0 0 0 0
BFA 119 Visual Arts--BFA 0 0 18 24 12 12BFA 119G Visual Arts--Graphic Design Option 0 0 17 27 43 54BFA 119M Visual Arts--Multimedia Option 0 0 5 6 16 22BFA 119P Visual Arts--Photographic Arts Option* 0 0 0 0 0 3BFA 119A Visual Arts--Studio Arts Option 0 0 21 22 31 49BS 112 Biology--BS 14 18 27 19 16 4
BS 112EBiology--Environmental Conservation Option 55 63 58 52 56 63
BS 112M Biology--Medical/Molecular Option 152 164 198 212 229 243BS 113 Business Administration--BS 32 90 75 63 43 22
BS 113ABusiness Administration-Accounting Option 87 112 147 139 169 166
BS 113EBusiness Administration-Entrepreneurship Option 0 2 12 10 15 19
BS 113FBusiness Administration-Forensic Accounting Option 0 0 0 1 8 12
BS 113HBusiness Administration-Human Resources Option 3 18 31 30 38 44
BS 113MBusiness Administration-Management Option 180 216 186 165 177 183
BS 113GBusiness Administration-Manufacturing Management Option 0 0 0 0 3 6
BS 113K Business Administration-Marketing Option 0 1 35 49 74 77BS 108 Business Information Technology--BS 45 51 32 22 13 6
BS 108NBusiness Information Technology--Computer Network Administration Option 21 32 45 48 58 59
Unduplicated Head Count by Major
Institutional Fact Book 2010 Edition
Institutional Research, Planning, and Assessment Page 24 of 88

BS 108S
Business Information Technology--Software Development & Multimedia Option 32 35 30 33 43 41
BS 108TBusiness Information Technology--Telecommunications Foundations Option 0 2 1 4 4 2
BS 120 Community Counseling--BS 0 0 9 24 48 50BS 117 Game Development--BS 0 15 28 27 32 37BS 115 Justice Administration--BS 46 59 54 66 59 53
BS 115LJustice Administration--Law Enforcement Option 0 7 0 2 0 0
BS 118 Nursing--BS 0 0 20 12 19 21BS 118U Nursing (not admitted to the program) 0 0 15 35 35 57BS 775 Organizational Leadership--BS 0 0 5 25 42 27
BS 775BOrganizational Leadership--Business Focus 0 0 2 2 9 18
BS 775COrganizational Leadership--Communications Focus 0 0 0 0 1 1
BS 775SOrganizational Leadership--Social Studies Focus 0 0 0 0 0 1
BS 110 Social Science---BS 28 17 6 3 4 1
BS 110HSocial Science--History & Political Science Option‡ 30 37 24 13 3 0
BS 110PSocial Science--Psychology & Sociology Option‡ 141 155 102 47 19 5
BS 110T Social Science--History Option 0 0 6 13 17 23
BS 110L Social Science--Political Science Option 0 0 3 7 13 16BS 110Y Social Science--Psychology Option 0 0 44 78 92 124BS 110S Social Science--Sociology Option 0 0 2 14 16 24BS 122 Sport Management--BS 0 0 47 73 83 99BT 107 Applied Technology--BT 71 77 92 49 68 74
Bachelor Degree Total 1096 1378 1572 1576 1788 1916
Associate of Arts
Degree Code Major/OptionFall 2005
Fall 2006
Fall 2007
Fall 2008
Fall 2009
Fall 2010
AA 043 Accounting 57 56 54 58 77 76AA 001 Art-General Option‡ 13 19 13 13 4 2AA 001D Art-Graphic Design Option‡ 0 0 9 4 2 0AA 001G Art-Graphics Option‡ 25 22 7 1 1 0AA 001H Art-Art History Option‡ 0 1 0 2 0 0AA 053 Broadcasting‡ 2 2 1 1 0 0AA 004 Business Administration 219 206 150 148 154 165AA 121 Criminal Justice Studies 0 0 6 6 10 3AA 121C Criminal Justice Studies - COP Option 0 0 14 15 36 42
AA 121LCriminal Justice Studied - Law/Justice Option 0 0 22 26 20 39
AA 011Education - Elementary/Early Childhood Option‡ 156 183 78 26 15 2
AA 011E Elementary Education 0 0 138 145 174 167AA 096 Law & Justice Careers‡ 57 71 10 5 1 1AA 116 Legal Assisting‡ 0 9 17 7 6 2AA 023 Liberal Arts 87 69 52 41 22 44AA 023E Liberal Arts--English Option 7 6 5 7 12 16
Institutional Fact Book 2010 Edition
Institutional Research, Planning, and Assessment Page 25 of 88
AA 023NLiberal Arts-Native American Studies Option 1 4 1 0 2 5
AA 053X Radio-Television‡ 24 15 3 1 0 0AA 012 Secondary Education 87 90 68 53 71 67AA 019 Social Science 18 17 11 7 8 2AA 019H Social Sciences--History Option 2 3 5 4 5 2
AA 019G Social Sciences--Political Science Option 5 2 2 5 4 4AA 019P Social Sciences--Psychology Option 70 48 50 41 37 47AA 019S Social Sciences--Sociology Option 10 10 6 12 7 10
Associate of Arts Total 840 833 722 628 668 696
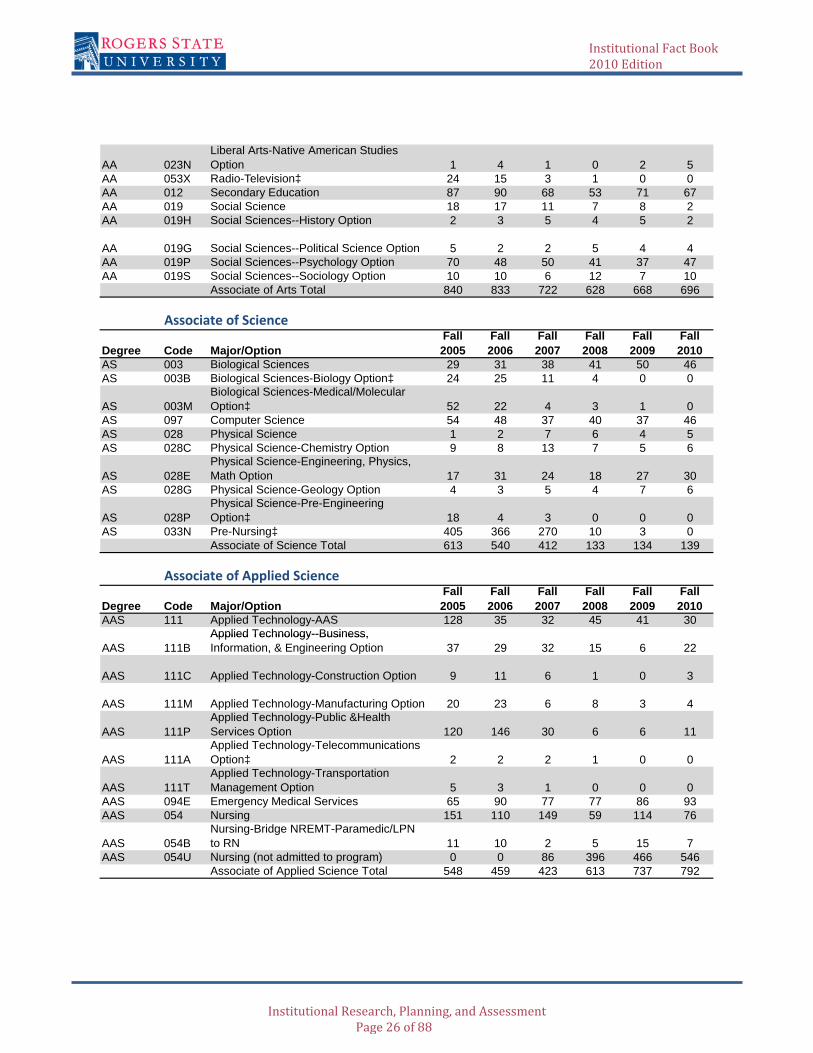
Associate of Science
Degree Code Major/OptionFall 2005
Fall 2006
Fall 2007
Fall 2008
Fall 2009
Fall 2010
AS 003 Biological Sciences 29 31 38 41 50 46AS 003B Biological Sciences-Biology Option‡ 24 25 11 4 0 0
AS 003MBiological Sciences-Medical/Molecular Option‡ 52 22 4 3 1 0
AS 097 Computer Science 54 48 37 40 37 46AS 028 Physical Science 1 2 7 6 4 5AS 028C Physical Science-Chemistry Option 9 8 13 7 5 6
AS 028EPhysical Science-Engineering, Physics, Math Option 17 31 24 18 27 30
AS 028G Physical Science-Geology Option 4 3 5 4 7 6
AS 028PPhysical Science-Pre-Engineering Option‡ 18 4 3 0 0 0
AS 033N Pre-Nursing‡ 405 366 270 10 3 0Associate of Science Total 613 540 412 133 134 139
Associate of Applied Science
Degree Code Major/OptionFall 2005
Fall 2006
Fall 2007
Fall 2008
Fall 2009
Fall 2010
AAS 111 Applied Technology-AAS 128 35 32 45 41 30Applied Technology--Business,
AAS 111BApplied Technology--Business, Information, & Engineering Option 37 29 32 15 6 22
AAS 111C Applied Technology-Construction Option 9 11 6 1 0 3
AAS 111M Applied Technology-Manufacturing Option 20 23 6 8 3 4
AAS 111PApplied Technology-Public &Health Services Option 120 146 30 6 6 11
AAS 111AApplied Technology-Telecommunications Option‡ 2 2 2 1 0 0
AAS 111TApplied Technology-Transportation Management Option 5 3 1 0 0 0
AAS 094E Emergency Medical Services 65 90 77 77 86 93AAS 054 Nursing 151 110 149 59 114 76
AAS 054BNursing-Bridge NREMT-Paramedic/LPN to RN 11 10 2 5 15 7
AAS 054U Nursing (not admitted to program) 0 0 86 396 466 546Associate of Applied Science Total 548 459 423 613 737 792
Institutional Fact Book 2010 Edition
Institutional Research, Planning, and Assessment Page 26 of 88

Misc
Degree Code Major/OptionFall 2005
Fall 2006
Fall 2007
Fall 2008
Fall 2009
Fall 2010
777 Non-Degree Seeking 166 141 80 88 40 71888 Undecided 530 580 643 820 787 761
Misc Total 696 721 723 908 827 832
*Pending approval by the Oklahoma State Regents for Higher Education.‡Deleted
Institutional Fact Book 2010 Edition
Institutional Research, Planning, and Assessment Page 27 of 88
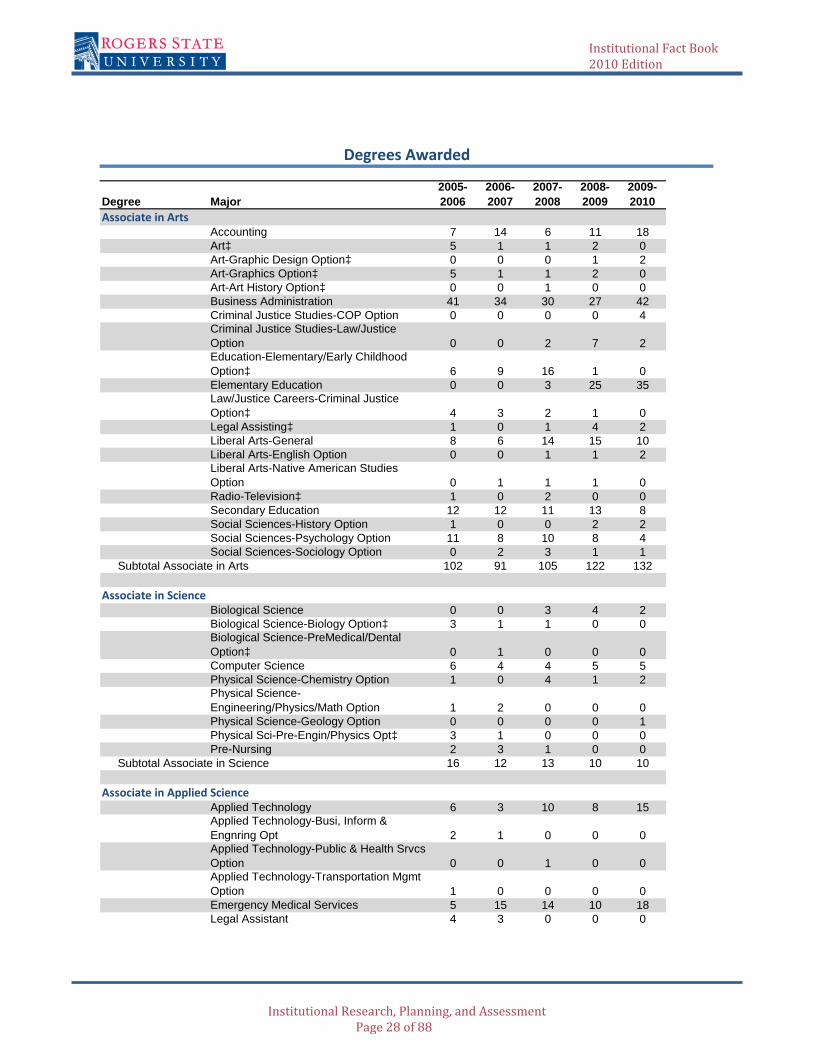
Degree Major2005-2006
2006-2007
2007-2008
2008-2009
2009-2010
Associate in ArtsAccounting 7 14 6 11 18Art‡ 5 1 1 2 0Art-Graphic Design Option‡ 0 0 0 1 2Art-Graphics Option‡ 5 1 1 2 0Art-Art History Option‡ 0 0 1 0 0Business Administration 41 34 30 27 42Criminal Justice Studies-COP Option 0 0 0 0 4Criminal Justice Studies-Law/Justice Option 0 0 2 7 2Education-Elementary/Early Childhood Option‡ 6 9 16 1 0Elementary Education 0 0 3 25 35Law/Justice Careers-Criminal Justice Option‡ 4 3 2 1 0Legal Assisting‡ 1 0 1 4 2Liberal Arts-General 8 6 14 15 10Liberal Arts-English Option 0 0 1 1 2Liberal Arts-Native American Studies Option 0 1 1 1 0Radio-Television‡ 1 0 2 0 0Secondary Education 12 12 11 13 8Social Sciences-History Option 1 0 0 2 2Social Sciences-Psychology Option 11 8 10 8 4Social Sciences-Sociology Option 0 2 3 1 1
Subtotal Associate in Arts 102 91 105 122 132
Associate in ScienceBiological Science 0 0 3 4 2Biological Science-Biology Option‡ 3 1 1 0 0Biological Science PreMedical/Dental
Degrees Awarded
Biological Science-PreMedical/Dental Option‡ 0 1 0 0 0Computer Science 6 4 4 5 5Physical Science-Chemistry Option 1 0 4 1 2Physical Science-Engineering/Physics/Math Option 1 2 0 0 0Physical Science-Geology Option 0 0 0 0 1Physical Sci-Pre-Engin/Physics Opt‡ 3 1 0 0 0Pre-Nursing 2 3 1 0 0
Subtotal Associate in Science 16 12 13 10 10
Associate in Applied ScienceApplied Technology 6 3 10 8 15Applied Technology-Busi, Inform & Engnring Opt 2 1 0 0 0Applied Technology-Public & Health Srvcs Option 0 0 1 0 0Applied Technology-Transportation Mgmt Option 1 0 0 0 0Emergency Medical Services 5 15 14 10 18Legal Assistant 4 3 0 0 0
Institutional Fact Book 2010 Edition
Institutional Research, Planning, and Assessment Page 28 of 88

Nursing 54 44 45 58 46Nursing-Bridge Paramedic/LPN to RN 9 5 6 3 9Police Science-Collegiate Officer Program Option‡ 3 5 3 0 0
Police Science-Law Enforcement Option‡ 0 3 0 0 0 Subtotal Associate in Applied Science 84 79 79 79 88
Bachelor of ArtsCommunications-Communication Arts Option 0 0 0 1 1Communications-Corporate Communications Option 0 3 3 1 6
Communications-Radio-Television Option 1 10 4 4 2Liberal Arts 16 8 16 5 2Liberal Arts-English Option 0 0 0 2 5Liberal Arts-Global Humanities Option 0 0 0 2 5
Subtotal Bachelor of Arts 17 21 23 15 21
Bachelor of Fine ArtVisual Arts-Graphic Design Option 0 0 1 3 6Visual Arts-Studio Art Option 0 0 2 3 6
Subtotal Bachelor of Fine Art 0 0 3 6 12
Bachelor of ScienceBiology-Environmental Conservation Option 6 8 11 6 12Biology-Medical/Molecular Option 6 13 11 16 22Business Administration-Accounting Option 9 18 15 16 23Business Administration-Entrepreneurship Option 0 0 1 0 2Business Administration-Forensic Accounting Option 0 0 0 0 2Accounting Option 0 0 0 0 2Business Administration-Human Resources Mgmt Opt 2 2 9 5 6Business Administration-Management Option 34 23 25 26 25
Business Administration-Marketing Option 0 0 1 11 13Business Info Tech-Computer Network Admin Option 7 1 3 6 5Business Info Tech-Sftwr Dev & Multimedia Option 13 12 6 4 4Community Counseling 0 0 0 3 3Justice Administration 5 3 5 9 12Justice Administration-Law Enforcement Option 1 3 1 3 1Nursing 0 0 0 1 1Organizational Leadership-Business Studies Focus 0 0 0 2 16Organizational Leadership-Liberal Studies Focus 0 0 0 1 0Social Science-History Option 0 0 0 0 2
Institutional Fact Book 2010 Edition
Institutional Research, Planning, and Assessment Page 29 of 88
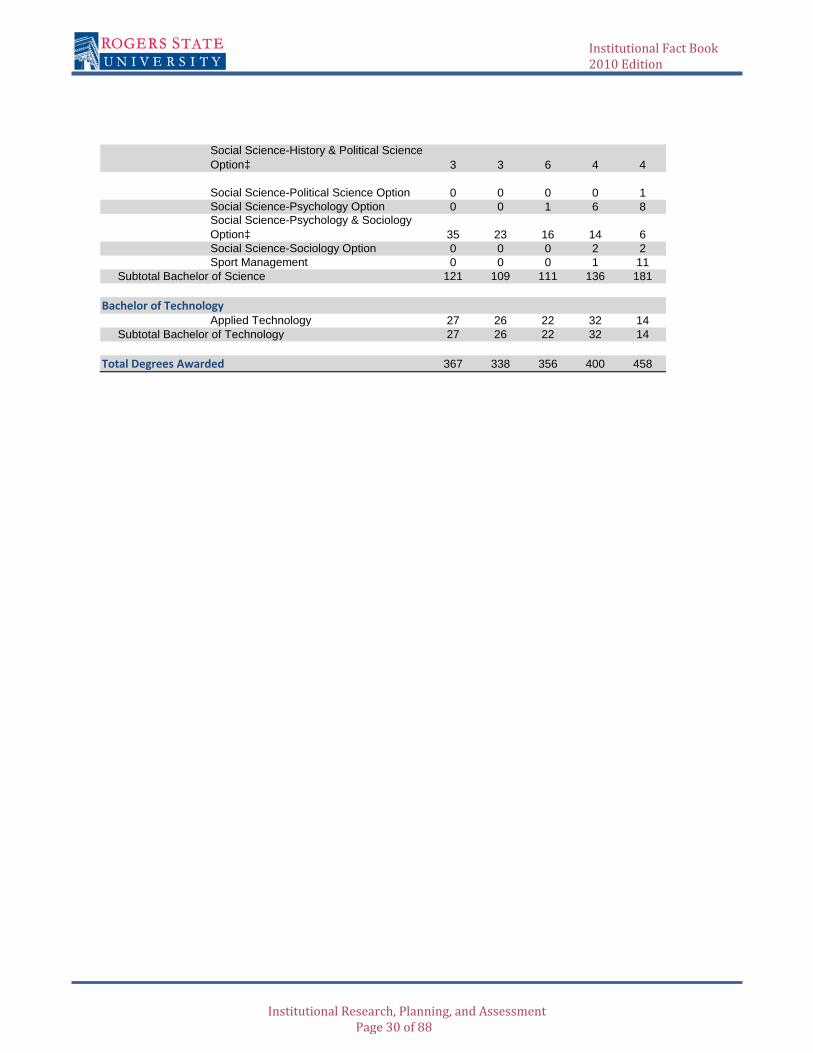
Social Science-History & Political Science Option‡ 3 3 6 4 4
Social Science-Political Science Option 0 0 0 0 1Social Science-Psychology Option 0 0 1 6 8Social Science-Psychology & Sociology Option‡ 35 23 16 14 6Social Science-Sociology Option 0 0 0 2 2Sport Management 0 0 0 1 11
Subtotal Bachelor of Science 121 109 111 136 181
Bachelor of TechnologyApplied Technology 27 26 22 32 14
Subtotal Bachelor of Technology 27 26 22 32 14
Total Degrees Awarded 367 338 356 400 458
Institutional Fact Book 2010 Edition
Institutional Research, Planning, and Assessment Page 30 of 88

N Hours Fall 2005 Fall 2006 Fall 2007 Fall 2008 Fall 2009 Fall 20100.00 35 25 23 18 13 231.00 9 15 5 5 3 82.00 0 0 0 0 0 03.00 361 403 364 349 342 3424.00 83 62 53 64 37 535.00 29 22 13 12 19 156.00 532 640 490 465 467 5327.00 121 127 139 109 130 1278.00 129 103 90 86 78 949.00 320 315 290 269 273 323
10.00 123 155 111 124 129 11111.00 82 71 60 65 50 7312.00 765 792 847 862 1036 104413.00 488 510 552 566 672 68114.00 277 237 230 241 239 27215.00 308 294 343 360 357 37816.00 120 115 173 166 200 19817.00 25 34 33 41 47 5618.00 51 27 36 51 58 4519.00 2 3 3 4 4 1020.00 1 2 0 0 0 021.00 0 0 0 1 0 1
Distribution of Student Enrollment by Credit Load
Institutional Fact Book 2010 Edition
Institutional Research, Planning, and Assessment Page 31 of 88
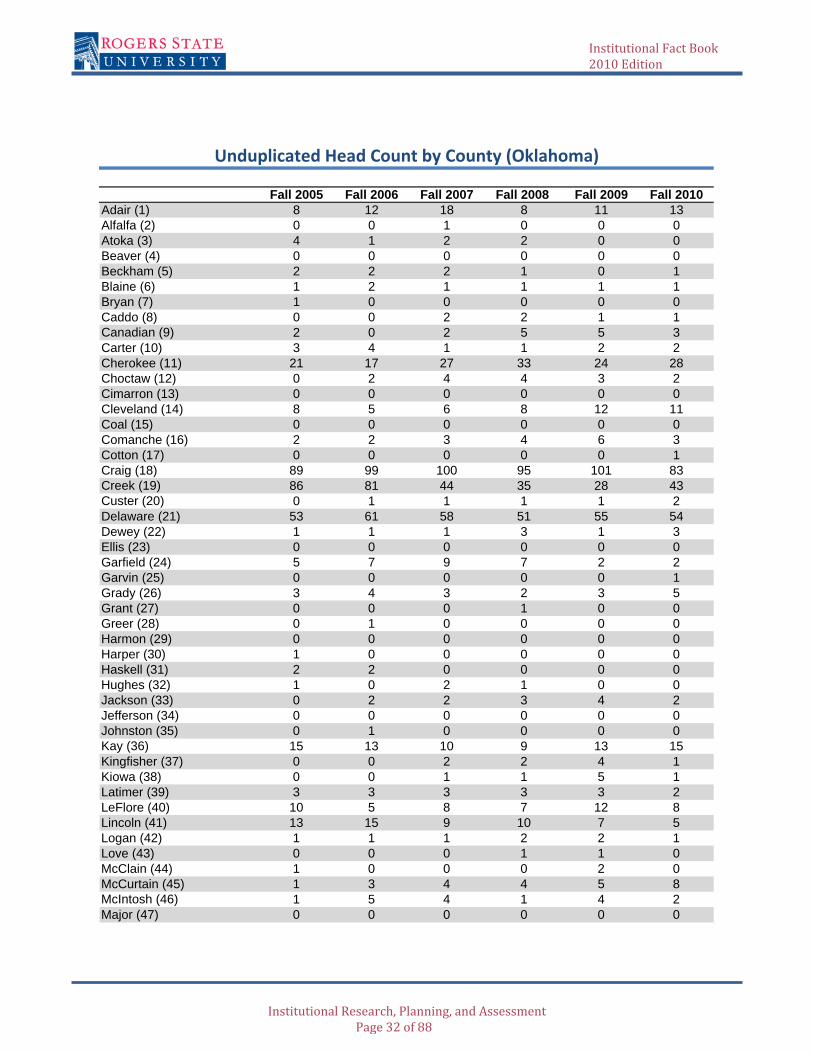
Fall 2005 Fall 2006 Fall 2007 Fall 2008 Fall 2009 Fall 2010Adair (1) 8 12 18 8 11 13Alfalfa (2) 0 0 1 0 0 0Atoka (3) 4 1 2 2 0 0Beaver (4) 0 0 0 0 0 0Beckham (5) 2 2 2 1 0 1Blaine (6) 1 2 1 1 1 1Bryan (7) 1 0 0 0 0 0Caddo (8) 0 0 2 2 1 1Canadian (9) 2 0 2 5 5 3Carter (10) 3 4 1 1 2 2Cherokee (11) 21 17 27 33 24 28Choctaw (12) 0 2 4 4 3 2Cimarron (13) 0 0 0 0 0 0Cleveland (14) 8 5 6 8 12 11Coal (15) 0 0 0 0 0 0Comanche (16) 2 2 3 4 6 3Cotton (17) 0 0 0 0 0 1Craig (18) 89 99 100 95 101 83Creek (19) 86 81 44 35 28 43Custer (20) 0 1 1 1 1 2Delaware (21) 53 61 58 51 55 54Dewey (22) 1 1 1 3 1 3Ellis (23) 0 0 0 0 0 0Garfield (24) 5 7 9 7 2 2Garvin (25) 0 0 0 0 0 1Grady (26) 3 4 3 2 3 5Grant (27) 0 0 0 1 0 0Greer (28) 0 1 0 0 0 0Harmon (29) 0 0 0 0 0 0Harper (30) 1 0 0 0 0 0Haskell (31) 2 2 0 0 0 0Hughes (32) 1 0 2 1 0 0Jackson (33) 0 2 2 3 4 2Jefferson (34) 0 0 0 0 0 0Johnston (35) 0 1 0 0 0 0Kay (36) 15 13 10 9 13 15Kingfisher (37) 0 0 2 2 4 1Kiowa (38) 0 0 1 1 5 1Latimer (39) 3 3 3 3 3 2LeFlore (40) 10 5 8 7 12 8Lincoln (41) 13 15 9 10 7 5Logan (42) 1 1 1 2 2 1Love (43) 0 0 0 1 1 0McClain (44) 1 0 0 0 2 0McCurtain (45) 1 3 4 4 5 8McIntosh (46) 1 5 4 1 4 2Major (47) 0 0 0 0 0 0
Unduplicated Head Count by County (Oklahoma)
Institutional Fact Book 2010 Edition
Institutional Research, Planning, and Assessment Page 32 of 88

Marshall (48) 0 0 0 0 1 1Mayes (49) 517 590 526 498 623 640Murray (50) 0 0 0 0 0 0Muskogee (51) 16 17 18 15 9 21Noble (52) 0 0 0 0 0 0Nowata (53) 97 83 90 94 97 92Okfuskee (54) 0 0 0 0 0 0Oklahoma (55) 22 33 22 34 28 36Okmulgee (56) 11 13 15 18 24 21Osage (57) 154 142 116 90 105 120Ottawa (58) 15 23 23 16 15 22Pawnee (59) 6 9 10 11 10 6Payne (60) 23 19 8 9 7 5Pittsburg (61) 3 2 2 2 1 2Pontotoc (62) 3 3 1 0 0 1Pottawatomie (63) 6 4 4 3 5 3Pushmataha (64) 1 0 1 1 0 2Roger Mills (65) 1 1 2 0 0 0Rogers (66) 1263 1334 1320 1375 1406 1460Seminole (67) 2 1 1 2 3 4Sequoyah (68) 4 5 2 4 3 3Stephens (69) 2 1 3 1 2 2Texas (70) 1 1 1 0 0 0Tillman (71) 1 0 0 0 0 0Tulsa (72) 728 624 646 585 629 676Wagoner (73) 67 49 53 58 68 72Washington (74) 442 510 498 574 624 695Washita (75) 0 0 2 1 0 0Woods (76) 1 2 1 1 2 2Woodward (77) 0 0 3 2 2 1Unknown (99) 0 0 0 0 0 9Total 3724 3818 3699 3702 3982 4200
Institutional Fact Book 2010 Edition
Institutional Research, Planning, and Assessment Page 33 of 88

Based on permanent mailing address.
Fall 2005 Fall 2006 Fall 2007 Fall 2008 Fall 2009 Fall 2010Claremore 971 980 992 1024 1030 1069Bartlesville 368 436 416 468 521 589Pryor 268 309 271 256 312 313Tulsa 369 273 251 244 256 285Owasso 142 138 156 177 179 199Collinsville 92 86 98 101 116 143Broken Arrow 132 105 120 110 117 130Inola 97 116 110 126 132 128Chelsea 86 107 110 101 105 94Locust Grove 53 67 61 51 79 92Oologah 62 90 65 79 80 81Salina 64 68 56 66 70 81Nowata 69 49 66 66 67 72Adair 40 42 41 48 60 71Dewey 47 58 48 62 61 60Vinita 65 63 73 56 75 57Catoosa 74 64 62 46 59 56Chouteau 41 59 61 41 51 54Skiatook 49 47 42 34 29 38Talala 31 46 38 27 31 38Pawhuska 43 43 40 33 42 37Big Cabin 22 25 23 23 27 29Barnsdall 19 22 21 15 15 26Ochelata 19 17 20 26 20 23Copan 17 16 18 13 13 20Sapulpa 13 20 14 17 17 19Coweta 19 13 9 11 13 17Sand Springs 19 14 17 16 18 17Oklahoma City 8 7 9 14 11 15Ramona 6 9 8 17 19 15Tahlequah 7 9 20 22 9 14Foyil 10 2 7 7 7 13Jay 13 18 9 7 9 13Langley 9 9 8 9 14 13Bixby 10 10 11 11 7 12Wann 14 12 12 13 13 12Wagoner 12 8 6 8 14 11Sperry 11 10 13 11 9 10Strang 8 8 11 5 8 10
Unduplicated Head Count by City (Oklahoma): With Ten or More
Institutional Fact Book 2010 Edition
Institutional Research, Planning, and Assessment Page 34 of 88
SchoolFall 2005
Fall 2006
Fall 2007
Fall 2008
Fall 2009
Fall 2010
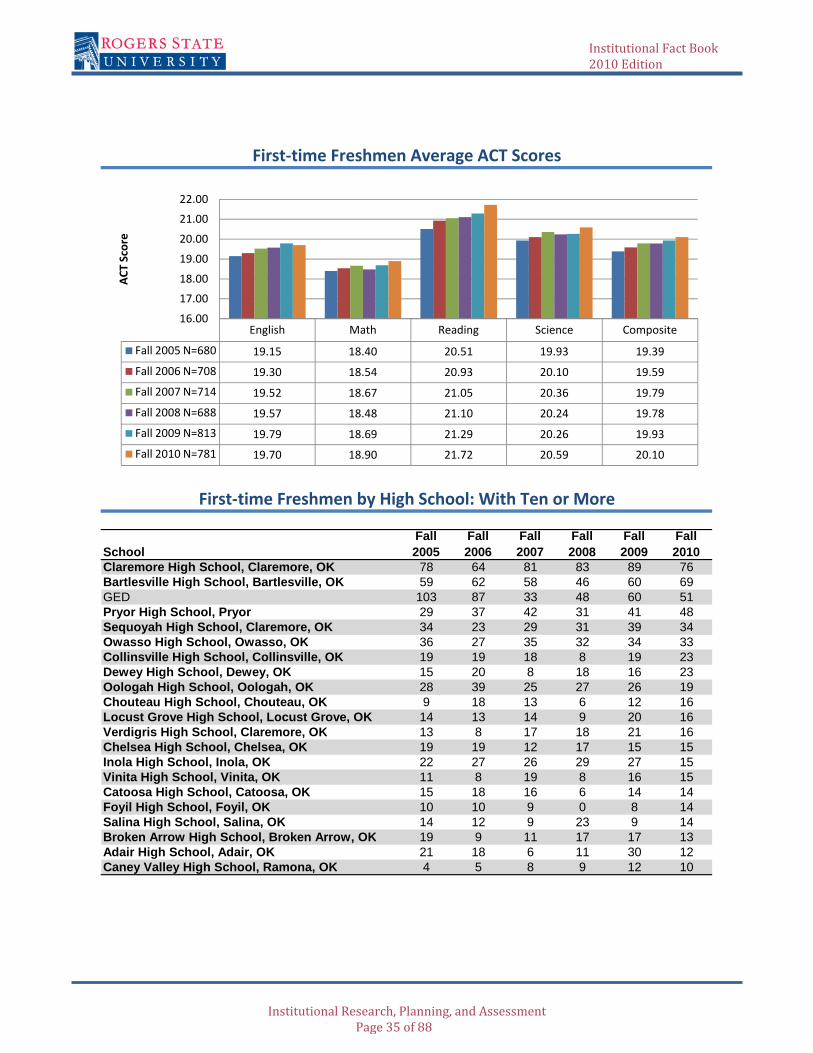
Claremore High School, Claremore, OK 78 64 81 83 89 76Bartlesville High School, Bartlesville, OK 59 62 58 46 60 69GED 103 87 33 48 60 51Pryor High School, Pryor 29 37 42 31 41 48Sequoyah High School, Claremore, OK 34 23 29 31 39 34
First‐time Freshmen Average ACT Scores
First‐time Freshmen by High School: With Ten or More
English Math Reading Science Composite
Fall 2005 N=680 19.15 18.40 20.51 19.93 19.39
Fall 2006 N=708 19.30 18.54 20.93 20.10 19.59
Fall 2007 N=714 19.52 18.67 21.05 20.36 19.79
Fall 2008 N=688 19.57 18.48 21.10 20.24 19.78
Fall 2009 N=813 19.79 18.69 21.29 20.26 19.93
Fall 2010 N=781 19.70 18.90 21.72 20.59 20.10
16.00
17.00
18.00
19.00
20.00
21.00
22.00
ACT Score
Owasso High School, Owasso, OK 36 27 35 32 34 33Collinsville High School, Collinsville, OK 19 19 18 8 19 23Dewey High School, Dewey, OK 15 20 8 18 16 23Oologah High School, Oologah, OK 28 39 25 27 26 19Chouteau High School, Chouteau, OK 9 18 13 6 12 16Locust Grove High School, Locust Grove, OK 14 13 14 9 20 16Verdigris High School, Claremore, OK 13 8 17 18 21 16Chelsea High School, Chelsea, OK 19 19 12 17 15 15Inola High School, Inola, OK 22 27 26 29 27 15Vinita High School, Vinita, OK 11 8 19 8 16 15Catoosa High School, Catoosa, OK 15 18 16 6 14 14Foyil High School, Foyil, OK 10 10 9 0 8 14Salina High School, Salina, OK 14 12 9 23 9 14Broken Arrow High School, Broken Arrow, OK 19 9 11 17 17 13Adair High School, Adair, OK 21 18 6 11 30 12Caney Valley High School, Ramona, OK 4 5 8 9 12 10
English Math Reading Science Composite
Fall 2005 N=680 19.15 18.40 20.51 19.93 19.39
Fall 2006 N=708 19.30 18.54 20.93 20.10 19.59
Fall 2007 N=714 19.52 18.67 21.05 20.36 19.79
Fall 2008 N=688 19.57 18.48 21.10 20.24 19.78
Fall 2009 N=813 19.79 18.69 21.29 20.26 19.93
Fall 2010 N=781 19.70 18.90 21.72 20.59 20.10
16.00
17.00
18.00
19.00
20.00
21.00
22.00
ACT Score
Institutional Fact Book 2010 Edition
Institutional Research, Planning, and Assessment Page 35 of 88
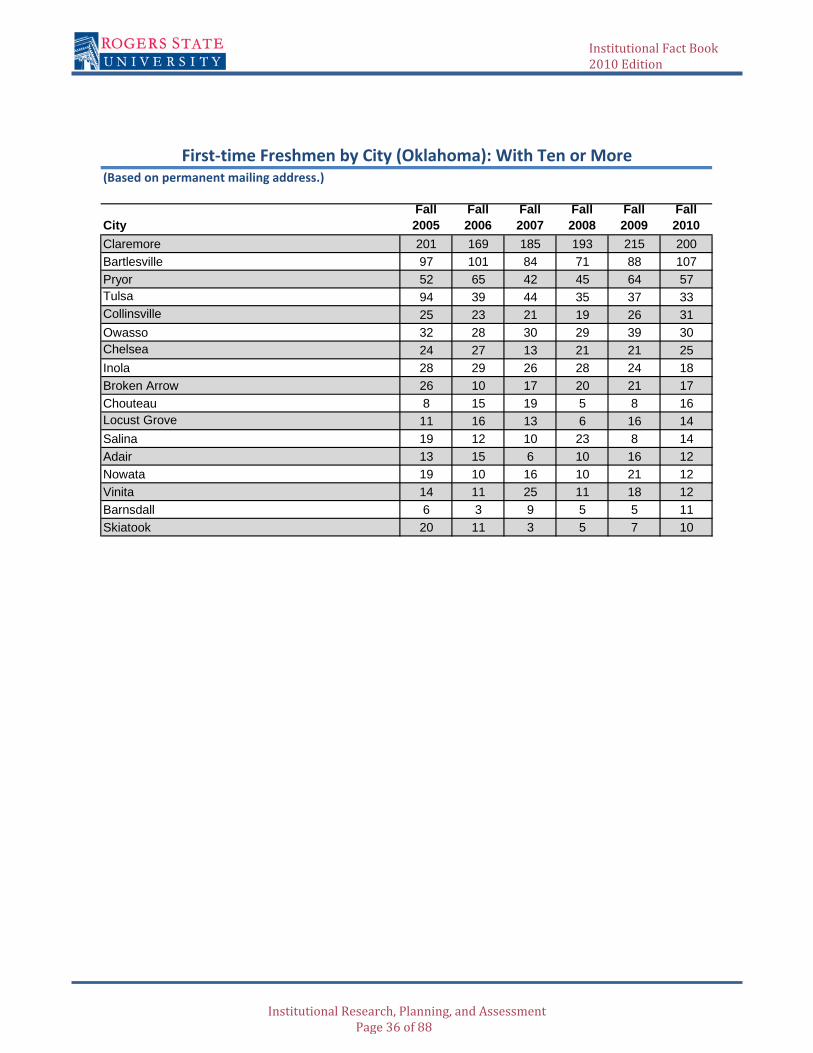
(Based on permanent mailing address.)
CityFall 2005
Fall 2006
Fall 2007
Fall 2008
Fall 2009
Fall 2010
Claremore 201 169 185 193 215 200Bartlesville 97 101 84 71 88 107Pryor 52 65 42 45 64 57Tulsa 94 39 44 35 37 33Collinsville 25 23 21 19 26 31Owasso 32 28 30 29 39 30Chelsea 24 27 13 21 21 25Inola 28 29 26 28 24 18Broken Arrow 26 10 17 20 21 17Chouteau 8 15 19 5 8 16Locust Grove 11 16 13 6 16 14Salina 19 12 10 23 8 14Adair 13 15 6 10 16 12Nowata 19 10 16 10 21 12Vinita 14 11 25 11 18 12Barnsdall 6 3 9 5 5 11Skiatook 20 11 3 5 7 10
First‐time Freshmen by City (Oklahoma): With Ten or More
Institutional Fact Book 2010 Edition
Institutional Research, Planning, and Assessment Page 36 of 88

Fall 2005
Fall 2006
Fall 2007
Fall 2008
Fall 2009
Fall 2010
First-time Transfers 426 415 446 377 350 362
First‐time Transfers Head Count
First‐time Transfers by Last Institution Attended: With Five or More
Fall 2005 Fall 2006 Fall 2007 Fall 2008 Fall 2009 Fall 2010
First‐time Transfers 426 415 446 377 350 362
0
50
100
150
200
250
300
350
400
450
500
SchoolFall 2005
Fall 2006
Fall 2007
Fall 2008
Fall 2009
Fall 2010
Tulsa Community College, OK 135 111 124 100 84 107Northeastern State University, OK 50 42 38 42 28 34Oklahoma State University (Stillwater), OK 24 21 21 30 23 22Northeastern Oklahoma A&M College, OK 19 36 40 21 9 16Northern Oklahoma College, OK 12 14 16 10 11 14Coffeyville Community College, KS 11 10 20 7 14 8Oklahoma State University/Okmulgee, OK 9 4 4 6 11 7University Of Central Oklahoma, OK 14 11 8 9 7 6University Of Oklahoma, OK 8 7 6 12 10 6
Fall 2005 Fall 2006 Fall 2007 Fall 2008 Fall 2009 Fall 2010
First‐time Transfers 426 415 446 377 350 362
0
50
100
150
200
250
300
350
400
450
500
Institutional Fact Book 2010 Edition
Institutional Research, Planning, and Assessment Page 37 of 88

Online Head Count
Fall 2005 Fall 2006 Fall 2007 Fall 2008 Fall 2009 Fall 2010
Number of Students 1223 1398 1447 1609 1790 1880
Number of Total Credit Hours 7258 8659 8247 9147 10506 10936
0
2000
4000
6000
8000
10000
12000
Institutional Fact Book 2010 Edition
Institutional Research, Planning, and Assessment Page 38 of 88
TotalMembers of Minority
Groups Female MaleDoctorate or
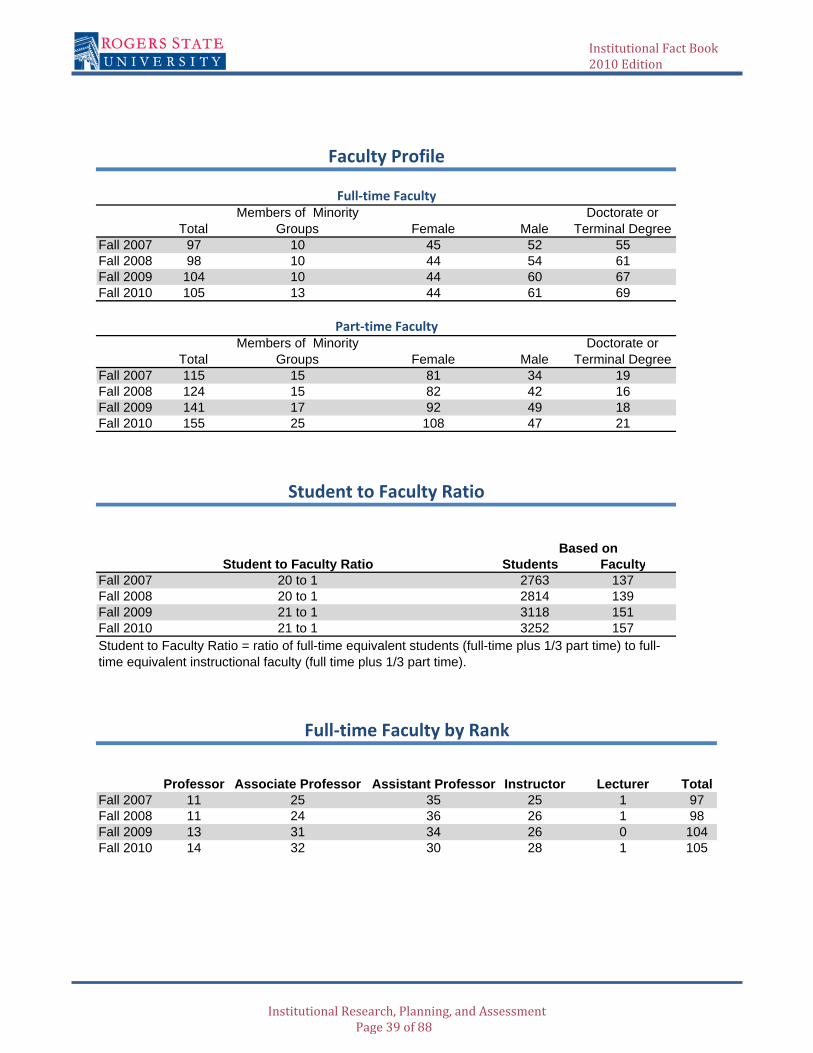
Terminal DegreeFall 2007 97 10 45 52 55Fall 2008 98 10 44 54 61Fall 2009 104 10 44 60 67Fall 2010 105 13 44 61 69
TotalMembers of Minority
Groups Female MaleDoctorate or
Terminal DegreeFall 2007 115 15 81 34 19Fall 2008 124 15 82 42 16Fall 2009 141 17 92 49 18Fall 2010 155 25 108 47 21
Student to Faculty Ratio Students FacultyFall 2007 20 to 1 2763 137Fall 2008 20 to 1 2814 139Fall 2009 21 to 1 3118 151Fall 2010 21 to 1 3252 157
Professor Associate Professor Assistant Professor Instructor Lecturer TotalFall 2007 11 25 35 25 1 97Fall 2008 11 24 36 26 1 98Fall 2009 13 31 34 26 0 104Fall 2010 14 32 30 28 1 105
Faculty Profile
Student to Faculty Ratio
Full‐time Faculty by Rank
Student to Faculty Ratio = ratio of full-time equivalent students (full-time plus 1/3 part time) to full-time equivalent instructional faculty (full time plus 1/3 part time).
Full‐time Faculty
Part‐time Faculty
Based on
Institutional Fact Book 2010 Edition
Institutional Research, Planning, and Assessment Page 39 of 88
RSU
Courses
RSU Online
CoursesAdult Degree Completion
RSU Courses
RSU Online
Courses Adult Degree Completion
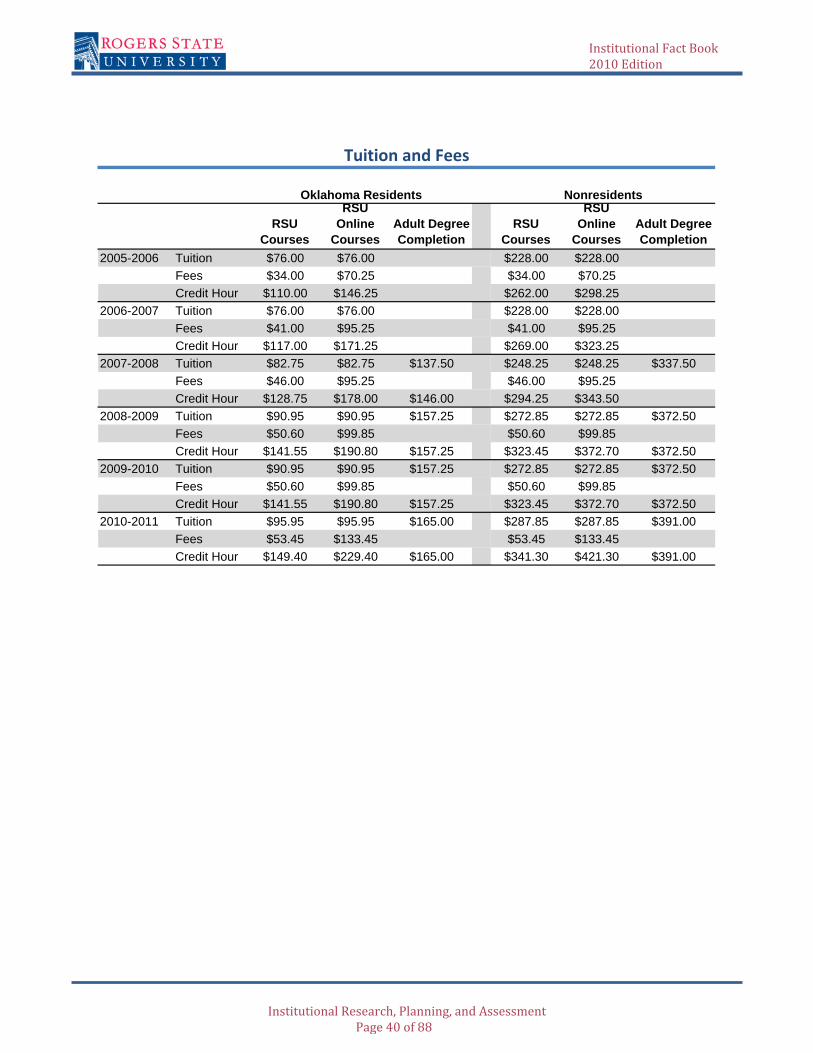
2005-2006 Tuition $76.00 $76.00 $228.00 $228.00Fees $34.00 $70.25 $34.00 $70.25Credit Hour $110.00 $146.25 $262.00 $298.25
2006-2007 Tuition $76.00 $76.00 $228.00 $228.00Fees $41.00 $95.25 $41.00 $95.25Credit Hour $117.00 $171.25 $269.00 $323.25
2007-2008 Tuition $82.75 $82.75 $137.50 $248.25 $248.25 $337.50Fees $46.00 $95.25 $46.00 $95.25Credit Hour $128.75 $178.00 $146.00 $294.25 $343.50
2008-2009 Tuition $90.95 $90.95 $157.25 $272.85 $272.85 $372.50Fees $50.60 $99.85 $50.60 $99.85Credit Hour $141.55 $190.80 $157.25 $323.45 $372.70 $372.50
2009-2010 Tuition $90.95 $90.95 $157.25 $272.85 $272.85 $372.50Fees $50.60 $99.85 $50.60 $99.85Credit Hour $141.55 $190.80 $157.25 $323.45 $372.70 $372.50
2010-2011 Tuition $95.95 $95.95 $165.00 $287.85 $287.85 $391.00Fees $53.45 $133.45 $53.45 $133.45Credit Hour $149.40 $229.40 $165.00 $341.30 $421.30 $391.00
Oklahoma Residents Nonresidents
Tuition and Fees
Institutional Fact Book 2010 Edition
Institutional Research, Planning, and Assessment Page 40 of 88
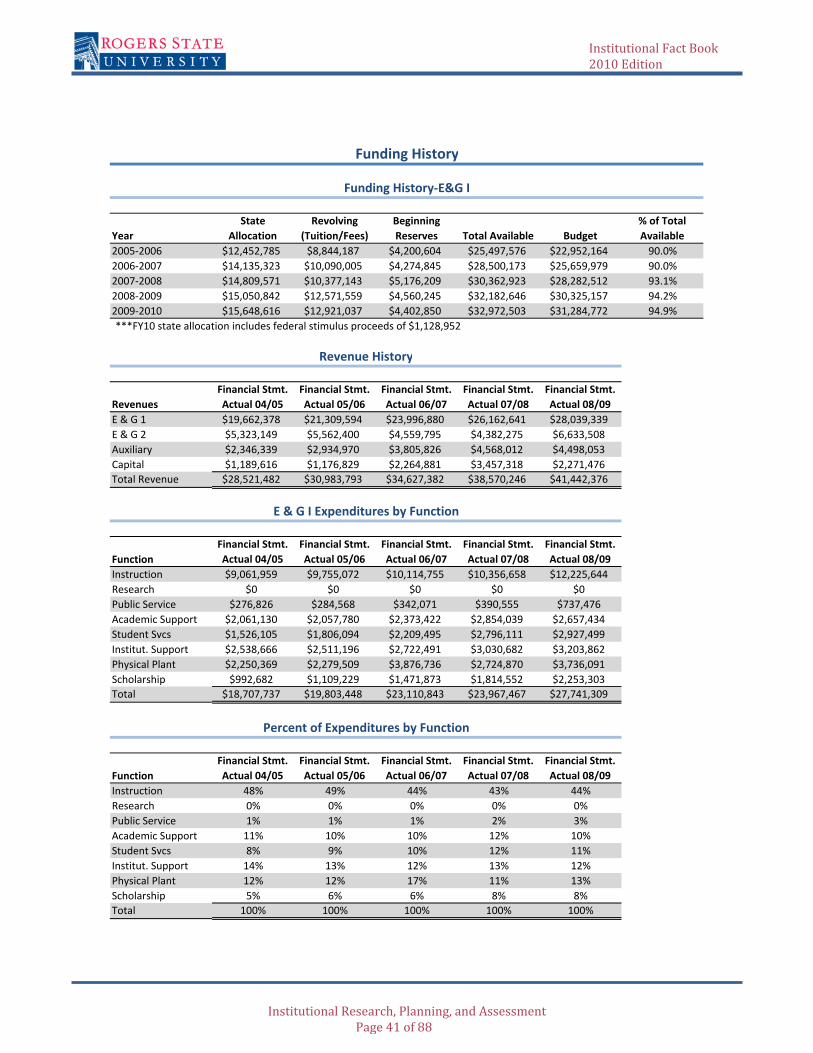
YearState
AllocationRevolving
(Tuition/Fees)Beginning Reserves Total Available Budget
% of Total Available
2005‐2006 $12,452,785 $8,844,187 $4,200,604 $25,497,576 $22,952,164 90.0%2006‐2007 $14,135,323 $10,090,005 $4,274,845 $28,500,173 $25,659,979 90.0%2007‐2008 $14,809,571 $10,377,143 $5,176,209 $30,362,923 $28,282,512 93.1%2008‐2009 $15,050,842 $12,571,559 $4,560,245 $32,182,646 $30,325,157 94.2%2009‐2010 $15,648,616 $12,921,037 $4,402,850 $32,972,503 $31,284,772 94.9%***FY10 state allocation includes federal stimulus proceeds of $1,128,952
RevenuesFinancial Stmt. Actual 04/05
Financial Stmt. Actual 05/06
Financial Stmt. Actual 06/07
Financial Stmt. Actual 07/08
Financial Stmt. Actual 08/09
E & G 1 $19,662,378 $21,309,594 $23,996,880 $26,162,641 $28,039,339E & G 2 $5,323,149 $5,562,400 $4,559,795 $4,382,275 $6,633,508Auxiliary $2,346,339 $2,934,970 $3,805,826 $4,568,012 $4,498,053Capital $1,189,616 $1,176,829 $2,264,881 $3,457,318 $2,271,476Total Revenue $28,521,482 $30,983,793 $34,627,382 $38,570,246 $41,442,376
FunctionFinancial Stmt. Actual 04/05
Financial Stmt. Actual 05/06
Financial Stmt. Actual 06/07
Financial Stmt. Actual 07/08
Financial Stmt. Actual 08/09
Instruction $9,061,959 $9,755,072 $10,114,755 $10,356,658 $12,225,644Research $0 $0 $0 $0 $0Public Service $276,826 $284,568 $342,071 $390,555 $737,476Academic Support $2,061,130 $2,057,780 $2,373,422 $2,854,039 $2,657,434Student Svcs $1,526,105 $1,806,094 $2,209,495 $2,796,111 $2,927,499Institut. Support $2,538,666 $2,511,196 $2,722,491 $3,030,682 $3,203,862Physical Plant $2,250,369 $2,279,509 $3,876,736 $2,724,870 $3,736,091Scholarship $992,682 $1,109,229 $1,471,873 $1,814,552 $2,253,303Total $18,707,737 $19,803,448 $23,110,843 $23,967,467 $27,741,309
FunctionFinancial Stmt. Actual 04/05
Financial Stmt. Actual 05/06
Financial Stmt. Actual 06/07
Financial Stmt. Actual 07/08
Financial Stmt. Actual 08/09
Instruction 48% 49% 44% 43% 44%Research 0% 0% 0% 0% 0%Public Service 1% 1% 1% 2% 3%Academic Support 11% 10% 10% 12% 10%Student Svcs 8% 9% 10% 12% 11%Institut. Support 14% 13% 12% 13% 12%Physical Plant 12% 12% 17% 11% 13%Scholarship 5% 6% 6% 8% 8%Total 100% 100% 100% 100% 100%
Funding History
Funding History‐E&G I
Revenue History
E & G I Expenditures by Function
Percent of Expenditures by Function
Institutional Fact Book 2010 Edition
Institutional Research, Planning, and Assessment Page 41 of 88
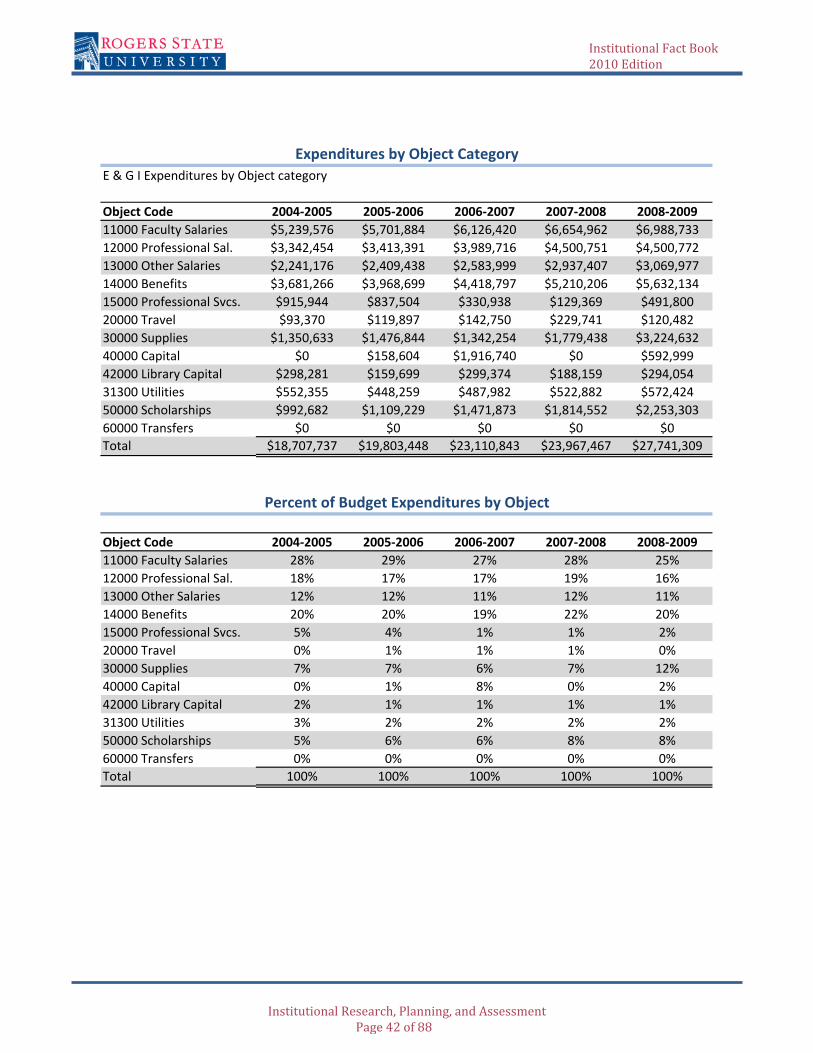
E & G I Expenditures by Object category
Object Code 2004‐2005 2005‐2006 2006‐2007 2007‐2008 2008‐200911000 Faculty Salaries $5,239,576 $5,701,884 $6,126,420 $6,654,962 $6,988,73312000 Professional Sal. $3,342,454 $3,413,391 $3,989,716 $4,500,751 $4,500,77213000 Other Salaries $2,241,176 $2,409,438 $2,583,999 $2,937,407 $3,069,97714000 Benefits $3,681,266 $3,968,699 $4,418,797 $5,210,206 $5,632,13415000 Professional Svcs. $915,944 $837,504 $330,938 $129,369 $491,80020000 Travel $93,370 $119,897 $142,750 $229,741 $120,48230000 Supplies $1,350,633 $1,476,844 $1,342,254 $1,779,438 $3,224,63240000 Capital $0 $158,604 $1,916,740 $0 $592,99942000 Library Capital $298,281 $159,699 $299,374 $188,159 $294,05431300 Utilities $552,355 $448,259 $487,982 $522,882 $572,42450000 Scholarships $992,682 $1,109,229 $1,471,873 $1,814,552 $2,253,30360000 Transfers $0 $0 $0 $0 $0Total $18,707,737 $19,803,448 $23,110,843 $23,967,467 $27,741,309
Object Code 2004‐2005 2005‐2006 2006‐2007 2007‐2008 2008‐200911000 Faculty Salaries 28% 29% 27% 28% 25%12000 Professional Sal. 18% 17% 17% 19% 16%13000 Other Salaries 12% 12% 11% 12% 11%14000 Benefits 20% 20% 19% 22% 20%15000 Professional Svcs. 5% 4% 1% 1% 2%20000 Travel 0% 1% 1% 1% 0%30000 Supplies 7% 7% 6% 7% 12%40000 Capital 0% 1% 8% 0% 2%42000 Library Capital 2% 1% 1% 1% 1%31300 Utilities 3% 2% 2% 2% 2%50000 Scholarships 5% 6% 6% 8% 8%60000 Transfers 0% 0% 0% 0% 0%Total 100% 100% 100% 100% 100%
Expenditures by Object Category
Percent of Budget Expenditures by Object
Institutional Fact Book 2010 Edition
Institutional Research, Planning, and Assessment Page 42 of 88
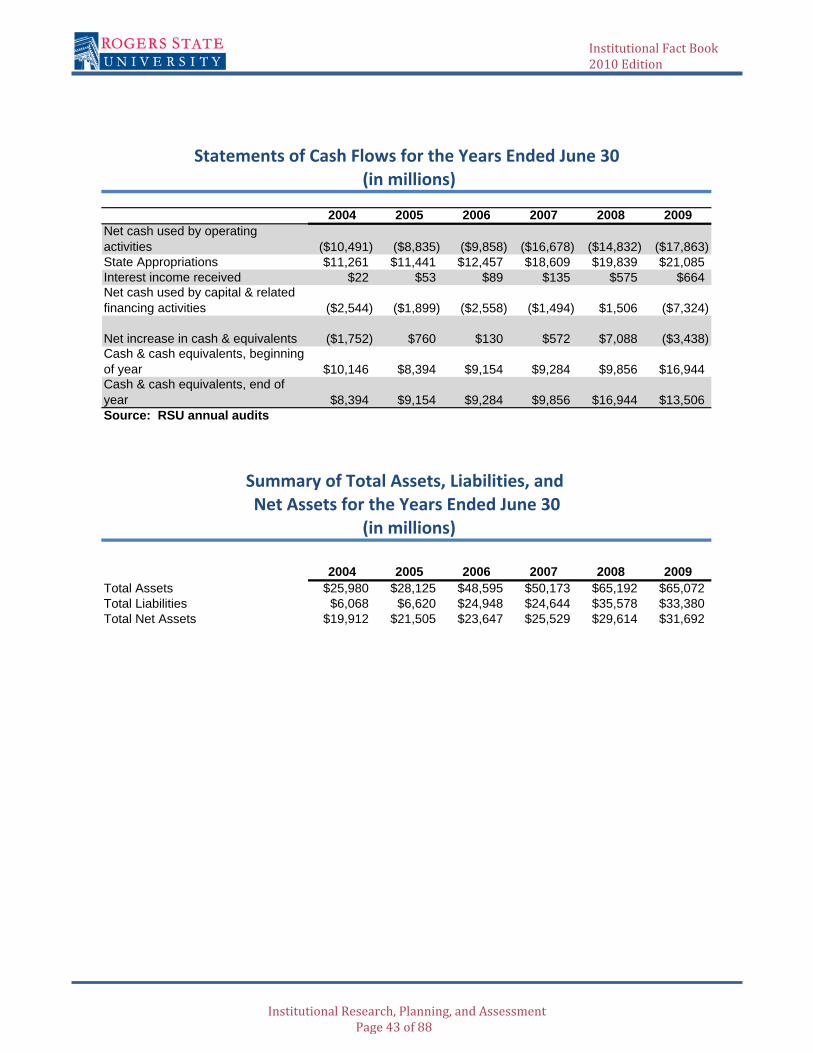
2004 2005 2006 2007 2008 2009Net cash used by operating activities ($10,491) ($8,835) ($9,858) ($16,678) ($14,832) ($17,863)State Appropriations $11,261 $11,441 $12,457 $18,609 $19,839 $21,085Interest income received $22 $53 $89 $135 $575 $664Net cash used by capital & related financing activities ($2,544) ($1,899) ($2,558) ($1,494) $1,506 ($7,324)
Net increase in cash & equivalents ($1,752) $760 $130 $572 $7,088 ($3,438)Cash & cash equivalents, beginning of year $10,146 $8,394 $9,154 $9,284 $9,856 $16,944Cash & cash equivalents, end of year $8,394 $9,154 $9,284 $9,856 $16,944 $13,506Source: RSU annual audits
2004 2005 2006 2007 2008 2009Total Assets $25,980 $28,125 $48,595 $50,173 $65,192 $65,072Total Liabilities $6,068 $6,620 $24,948 $24,644 $35,578 $33,380Total Net Assets $19,912 $21,505 $23,647 $25,529 $29,614 $31,692
Statements of Cash Flows for the Years Ended June 30(in millions)
Summary of Total Assets, Liabilities, and Net Assets for the Years Ended June 30
(in millions)
Institutional Fact Book 2010 Edition
Institutional Research, Planning, and Assessment Page 43 of 88
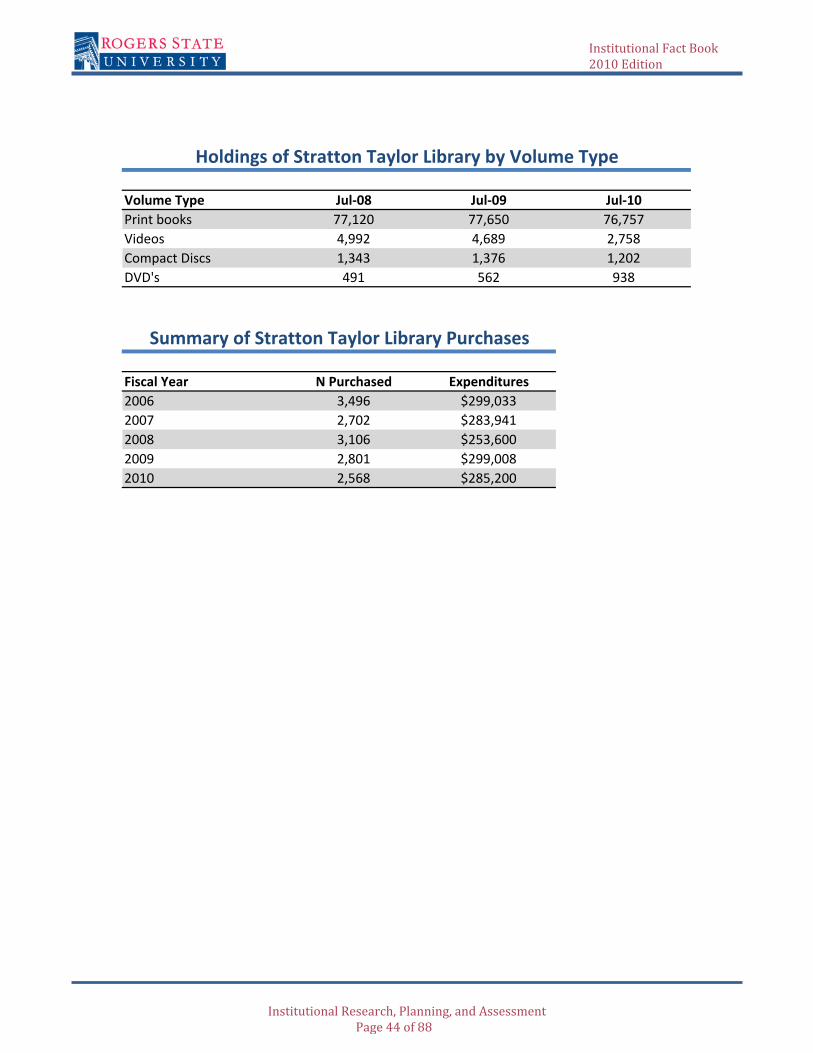
Volume Type Jul‐08 Jul‐09 Jul‐10Print books 77,120 77,650 76,757Videos 4,992 4,689 2,758Compact Discs 1,343 1,376 1,202DVD's 491 562 938
Fiscal Year N Purchased Expenditures2006 3,496 $299,0332007 2,702 $283,9412008 3,106 $253,6002009 2,801 $299,0082010 2,568 $285,200
Holdings of Stratton Taylor Library by Volume Type
Summary of Stratton Taylor Library Purchases
Institutional Fact Book 2010 Edition
Institutional Research, Planning, and Assessment Page 44 of 88
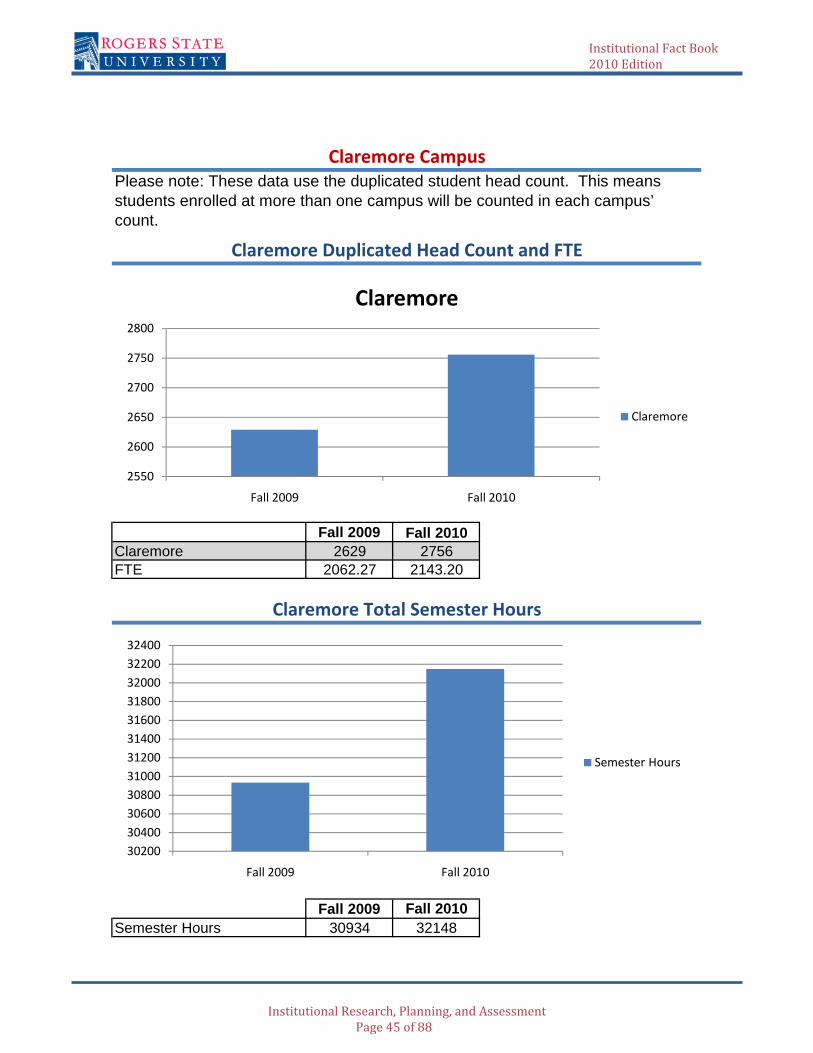
Fall 2009 Fall 2010Claremore 2629 2756FTE 2062.27 2143.20
Claremore CampusPlease note: These data use the duplicated student head count. This means students enrolled at more than one campus will be counted in each campus’ count.
Claremore Duplicated Head Count and FTE
Claremore Total Semester Hours
32400
2550
2600
2650
2700
2750
2800
Fall 2009 Fall 2010
Claremore
Claremore
Fall 2009 Fall 2010Semester Hours 30934 32148
302003040030600308003100031200314003160031800320003220032400
Fall 2009 Fall 2010
Semester Hours
2550
2600
2650
2700
2750
2800
Fall 2009 Fall 2010
Claremore
Claremore
Institutional Fact Book 2010 Edition
Institutional Research, Planning, and Assessment Page 45 of 88
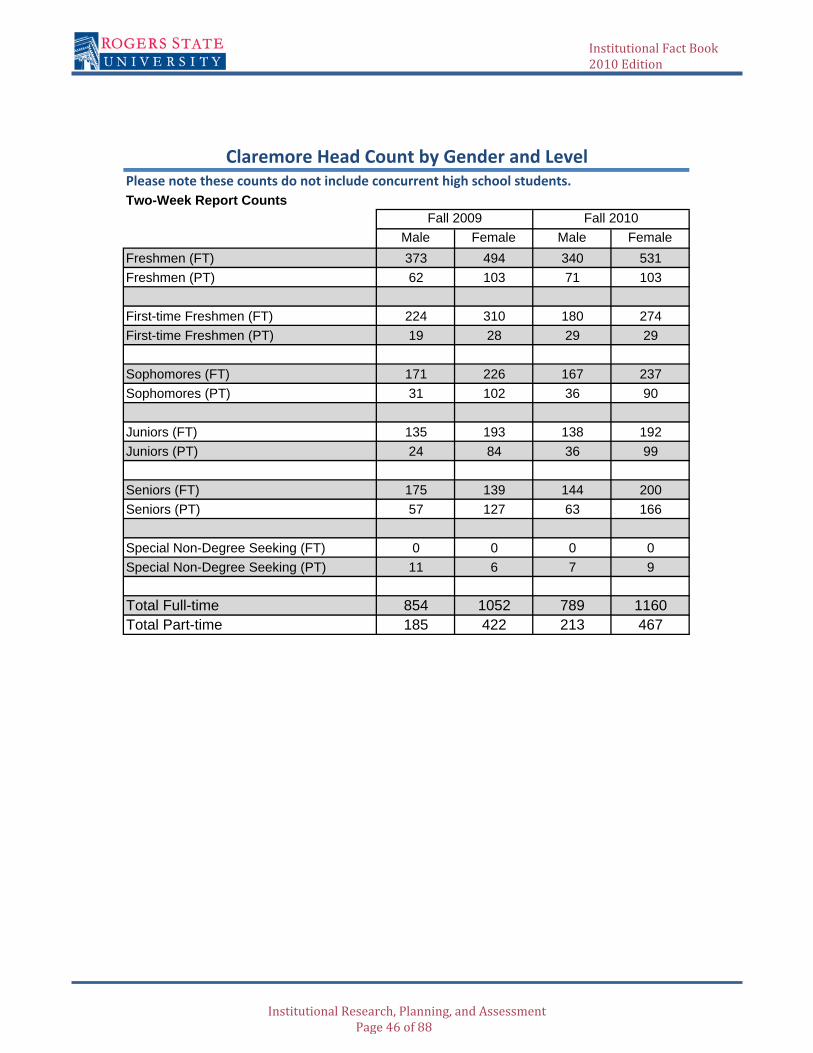
Please note these counts do not include concurrent high school students.Two-Week Report Counts
Male Female Male FemaleFreshmen (FT) 373 494 340 531Freshmen (PT) 62 103 71 103
First-time Freshmen (FT) 224 310 180 274First-time Freshmen (PT) 19 28 29 29
Sophomores (FT) 171 226 167 237Sophomores (PT) 31 102 36 90
Juniors (FT) 135 193 138 192Juniors (PT) 24 84 36 99
Seniors (FT) 175 139 144 200Seniors (PT) 57 127 63 166
Special Non-Degree Seeking (FT) 0 0 0 0Special Non-Degree Seeking (PT) 11 6 7 9
Total Full-time 854 1052 789 1160Total Part-time 185 422 213 467
Fall 2009 Fall 2010
Claremore Head Count by Gender and Level
Institutional Fact Book 2010 Edition
Institutional Research, Planning, and Assessment Page 46 of 88

Claremore Concurrent High School Student Head Count
Claremore Head Count By Age
Fall 2009 Fall 2010
Total Enrolled 116 127
110
112
114
116
118
120
122
124
126
128
400
600
800
1000
1200
under 21
21‐25
26‐30
31‐35
Fall 2009 Fall 2010under 21 1142 113021-25 810 86126-30 265 30331-35 148 17336-40 117 127over 40 147 162Average Age 24 24
Fall 2009 Fall 2010
Total Enrolled 116 127
110
112
114
116
118
120
122
124
126
128
0
200
400
600
800
1000
1200
Fall 2009 Fall 2010
under 21
21‐25
26‐30
31‐35
36‐40
over 40
Institutional Fact Book 2010 Edition
Institutional Research, Planning, and Assessment Page 47 of 88

Fall 2009 Fall 20101236 1351809 807566 57918 19
BachelorsAssociate of Arts or ScienceAssociate of Applied ScienceNon-Degree
Claremore Head Count by Goal
0
200
400
600
800
1000
1200
1400
1600
Fall 2009 Fall 2010
Bachelors
Associate of Arts or Science
Associate of Applied Science
Non‐Degree
0
200
400
600
800
1000
1200
1400
1600
Fall 2009 Fall 2010
Bachelors
Associate of Arts or Science
Associate of Applied Science
Non‐Degree
Institutional Fact Book 2010 Edition
Institutional Research, Planning, and Assessment Page 48 of 88
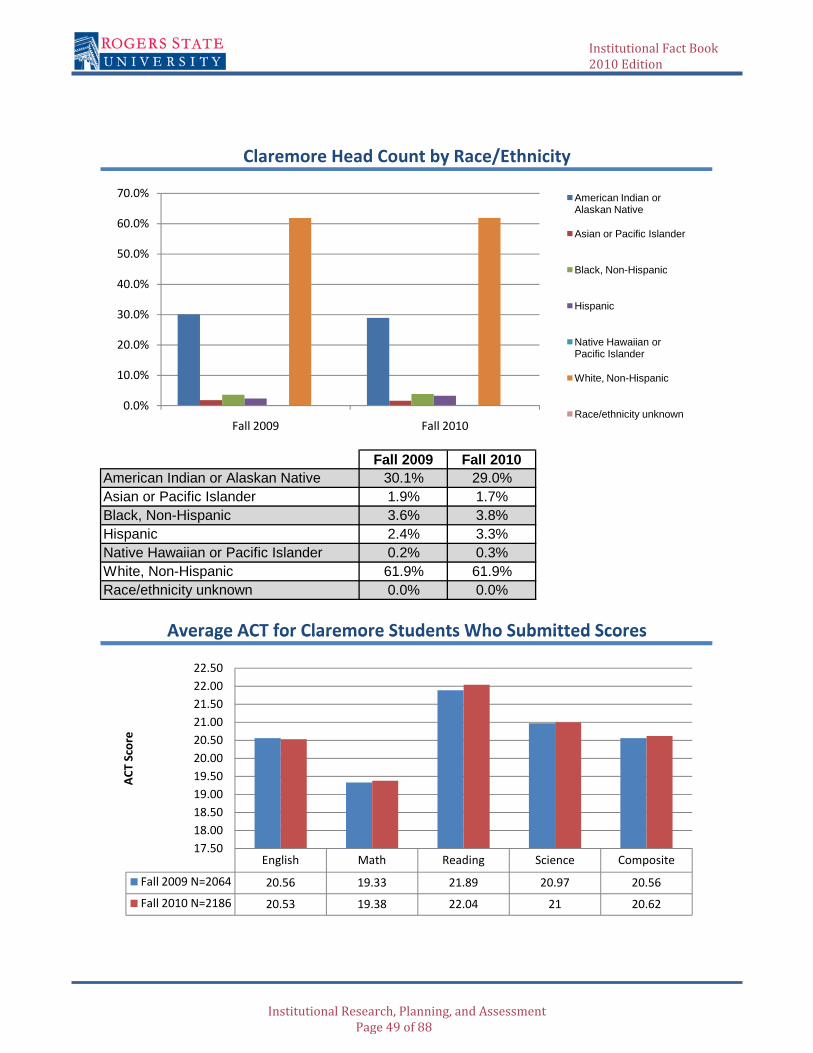
Fall 2009 Fall 201030.1% 29.0%1.9% 1.7%3.6% 3.8%2.4% 3.3%0.2% 0.3%61.9% 61.9%0.0% 0.0%
Claremore Head Count by Race/Ethnicity
Race/ethnicity unknown
Average ACT for Claremore Students Who Submitted Scores
Native Hawaiian or Pacific IslanderWhite, Non-Hispanic
American Indian or Alaskan NativeAsian or Pacific IslanderBlack, Non-HispanicHispanic
0.0%
10.0%
20.0%
30.0%
40.0%
50.0%
60.0%
70.0%
Fall 2009 Fall 2010
American Indian or Alaskan Native
Asian or Pacific Islander
Black, Non-Hispanic
Hispanic
Native Hawaiian or Pacific Islander
White, Non-Hispanic
Race/ethnicity unknown
Average ACT for Claremore Students Who Submitted Scores
0.0%
10.0%
20.0%
30.0%
40.0%
50.0%
60.0%
70.0%
Fall 2009 Fall 2010
American Indian or Alaskan Native
Asian or Pacific Islander
Black, Non-Hispanic
Hispanic
Native Hawaiian or Pacific Islander
White, Non-Hispanic
Race/ethnicity unknown
English Math Reading Science Composite
Fall 2009 N=2064 20.56 19.33 21.89 20.97 20.56
Fall 2010 N=2186 20.53 19.38 22.04 21 20.62
17.5018.0018.5019.0019.5020.0020.5021.0021.5022.0022.50
ACT Score
Institutional Fact Book 2010 Edition
Institutional Research, Planning, and Assessment Page 49 of 88

Claremore First‐time Freshmen Average ACT Scores
Claremore First‐time Transfers Head Count
English Math Reading Science Composite
Fall 2009 N=568 19.99 18.99 21.43 20.51 20.13
Fall 2010 N=507 19.93 19.28 21.91 20.83 20.34
17.5
1818.5
19
19.520
20.521
21.522
22.5
ACT Score
240
English Math Reading Science Composite
Fall 2009 N=568 19.99 18.99 21.43 20.51 20.13
Fall 2010 N=507 19.93 19.28 21.91 20.83 20.34
17.5
1818.5
19
19.520
20.521
21.522
22.5
ACT Score
Fall 2009 Fall 2010
First‐time Transfers 216 236
205
210
215
220
225
230
235
240
Institutional Fact Book 2010 Edition
Institutional Research, Planning, and Assessment Page 50 of 88
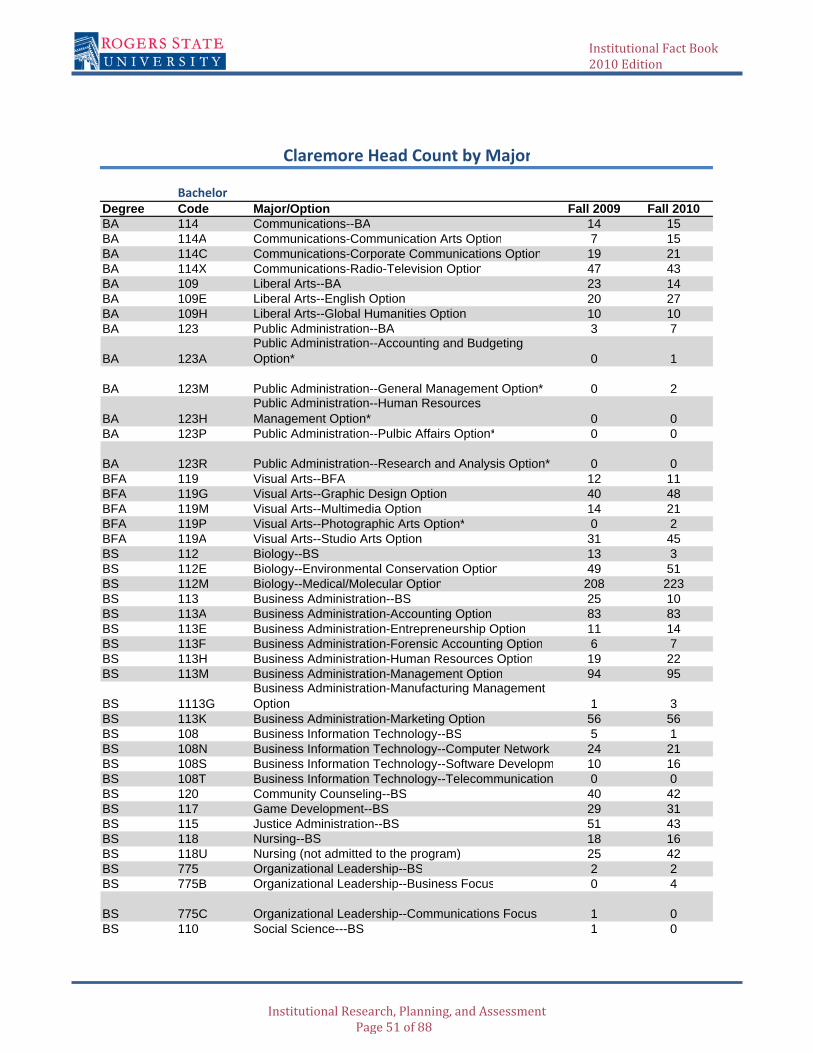
BachelorDegree Code Major/Option Fall 2009 Fall 2010BA 114 Communications--BA 14 15BA 114A Communications-Communication Arts Option 7 15BA 114C Communications-Corporate Communications Option 19 21BA 114X Communications-Radio-Television Option 47 43BA 109 Liberal Arts--BA 23 14BA 109E Liberal Arts--English Option 20 27BA 109H Liberal Arts--Global Humanities Option 10 10BA 123 Public Administration--BA 3 7
BA 123APublic Administration--Accounting and Budgeting Option* 0 1
BA 123M Public Administration--General Management Option* 0 2
BA 123HPublic Administration--Human Resources Management Option* 0 0
BA 123P Public Administration--Pulbic Affairs Option* 0 0
BA 123R Public Administration--Research and Analysis Option* 0 0BFA 119 Visual Arts--BFA 12 11BFA 119G Visual Arts--Graphic Design Option 40 48BFA 119M Visual Arts--Multimedia Option 14 21BFA 119P Visual Arts--Photographic Arts Option* 0 2BFA 119A Visual Arts--Studio Arts Option 31 45BS 112 Biology--BS 13 3BS 112E Biology--Environmental Conservation Option 49 51BS 112M Biology--Medical/Molecular Option 208 223BS 113 Business Administration--BS 25 10BS 113A Business Administration-Accounting Option 83 83BS 113E Business Administration-Entrepreneurship Option 11 14BS 113F Business Administration-Forensic Accounting Option 6 7BS 113H Business Administration-Human Resources Option 19 22BS 113M Business Administration-Management Option 94 95
BS 1113GBusiness Administration-Manufacturing Management Option 1 3
BS 113K Business Administration-Marketing Option 56 56BS 108 Business Information Technology--BS 5 1BS 108N Business Information Technology--Computer Network A 24 21BS 108S Business Information Technology--Software Developm 10 16BS 108T Business Information Technology--Telecommunication 0 0BS 120 Community Counseling--BS 40 42BS 117 Game Development--BS 29 31BS 115 Justice Administration--BS 51 43BS 118 Nursing--BS 18 16BS 118U Nursing (not admitted to the program) 25 42BS 775 Organizational Leadership--BS 2 2BS 775B Organizational Leadership--Business Focus 0 4
BS 775C Organizational Leadership--Communications Focus 1 0BS 110 Social Science---BS 1 0
Claremore Head Count by Major
Institutional Fact Book 2010 Edition
Institutional Research, Planning, and Assessment Page 51 of 88

BS 110H Social Science--History & Political Science Option‡ 3 0BS 110P Social Science--Psychology & Sociology Option‡ 17 3BS 110T Social Science--History Option 15 23BS 110L Social Science--Political Science Option 12 12BS 110Y Social Science--Psychology Option 74 106BS 110S Social Science--Sociology Option 12 19BS 122 Sport Management--BS 76 91BT 107 Applied Technology--BT 15 24
Bachelor Degree Total 1235 1345
Associate of ArtsDegree Code Major Fall 2009 Fall 2010AA 043 Accounting 14 22AA 001 Art-General Option‡ 3 1AA 001D Art-Graphic Design Option‡ 1 0AA 001G Art-Graphics Option‡ 1 0AA 001H Art-Art History Option‡ 0 0AA 004 Business Administration 46 62AA 121 Criminal Justice Studies 8 2AA 121C Criminal Justice Studies - COP Option 32 30AA 121L Criminal Justice Studied - Law/Justice Option 14 26AA 011 Education - Elementary/Early Childhood Option‡ 8 1AA 011E Elementary Education 97 83AA 096 Law/Justice Careers‡ 0 1AA 116 Legal Assisting‡ 3 0AA 023 Liberal Arts 9 26AA 023E Liberal Arts--English Option 6 5AA 023N Liberal Arts-Native American Studies Option 1 3AA 012 Secondary Education 40 44AA 019 Social Science 5 1AA 019H Social Sciences--History Option 2 2AA 019G Social Sciences--Political Science Option 3 2AA 019P Social Sciences--Psychology Option 21 33AA 019S Social Sciences--Sociology Option 5 5
Associate of Arts Total 319 349
Associate of ScienceDegree Code Major Fall 2009 Fall 2010AS 003 Biological Sciences 23 23AS 003B Biological Sciences-Biology Option‡ 0 0AS 003M Biological Sciences-Medical/Molecular Option‡ 1 0AS 097 Computer Science 14 19AS 028 Physical Science 4 5AS 028C Physical Science-Chemistry Option 4 3AS 028E Physical Science-Engineering, Physics, Math Option 19 20AS 028G Physical Science-Geology Option 7 5AS 033N Pre-Nursing‡ 1 0
Associate of Science Total 73 75
Institutional Fact Book 2010 Edition
Institutional Research, Planning, and Assessment Page 52 of 88

Associate of Applied ScienceDegree Code Major Fall 2009 Fall 2010AAS 111 Applied Technology-AAS 23 12AAS 111B Applied Technology--Business, Information, & Enginee 2 13AAS 111C Applied Technology-Construction Option 0 2AAS 111M Applied Technology-Manufacturing Option 2 2AAS 111P Applied Technology-Public & Health Services Option 6 5AAS 111A Applied Technology-Telecommunications Option 0 0AAS 111T Applied Technology-Transportation Management Optio 0 0AAS 094E Emergency Medical Services 78 79AAS 054 Nursing 85 63AAS 054B Nursing-Bridge NREMT-Paramedic/LPN to RN 13 5AAS 054U Nursing (not admitted to program) 357 399
Associate of Applied Science Total 566 580
MiscDegree Code Major Fall 2009 Fall 2010
777 Non-Degree Seeking 19 19888 Undecided 417 388
Misc Total 436 407
*Pending approval by the Oklahoma State Regents for Higher Education.‡Deleted
Institutional Fact Book 2010 Edition
Institutional Research, Planning, and Assessment Page 53 of 88

Fall 2009 Fall 2010Adair 6 9Alfalfa 0 0Atoka 0 0Beaver 0 0Beckham 0 0Blaine 0 0Bryan 0 0Caddo 1 1Canadian 1 0Carter 1 2Cherokee 16 13Choctaw 1 1Cimarron 0 0Cleveland 9 6Coal 0 0Comanche 0 1Cotton 0 0Craig 67 55Creek 23 37Custer 0 2Delaware 33 33Dewey 0 2Ellis 0 0Garfield 2 2Garvin 0 0Grady 1 1Grant 0 0Greer 0 0Harmon 0 0Harper 0 0Haskell 0 0Hughes 0 0Jackson 2 1Jefferson 0 0Johnston 0 0Kay 5 5Kingfisher 4 0Kiowa 0 0Latimer 2 2LeFlore 2 1Lincoln 5 4Logan 2 1Love 0 0McClain 0 0
Claremore Head Count by County (Oklahoma)
Institutional Fact Book 2010 Edition
Institutional Research, Planning, and Assessment Page 54 of 88

McCurtain 5 7McIntosh 4 2Major 0 0Marshall 0 0Mayes 252 259Murray 0 0Muskogee 9 16Noble 0 0Nowata 55 48Okfuskee 0 0Oklahoma 15 22Okmulgee 17 15Osage 39 43Ottawa 9 13Pawnee 4 3Payne 3 2Pittsburg 1 1Pontotoc 0 0Pottawatomie 5 1Pushmataha 0 1Roger Mills 0 0Rogers 1219 1277Seminole 2 3Sequoyah 2 2Stephens 1 0Texas 0 0Tillman 0 0Tulsa 506 547Wagoner 55 53Washington 107 108Washita 0 0Woods 0 0Woodward 0 0Unknown 0 9Total 2493 2611
Institutional Fact Book 2010 Edition
Institutional Research, Planning, and Assessment Page 55 of 88

Fall 2009 Fall 2010Pryor 438 435FTE 313.27 305.13
Pryor CampusPlease note: These data use the duplicated student head count. This means students enrolled at more than one campus will be counted in each campus’ count.
Pryor Duplicated Head Count and FTE
Pryor Total Semester Hours
4750
430
432
434
436
438
440
Fall 2009 Fall 2010
Pryor
Pryor
Fall 2009 Fall 2010Semester Hours 4699 4577
4500
4550
4600
4650
4700
4750
Fall 2009 Fall 2010
Semester Hours
430
432
434
436
438
440
Fall 2009 Fall 2010
Pryor
Pryor
Institutional Fact Book 2010 Edition
Institutional Research, Planning, and Assessment Page 56 of 88
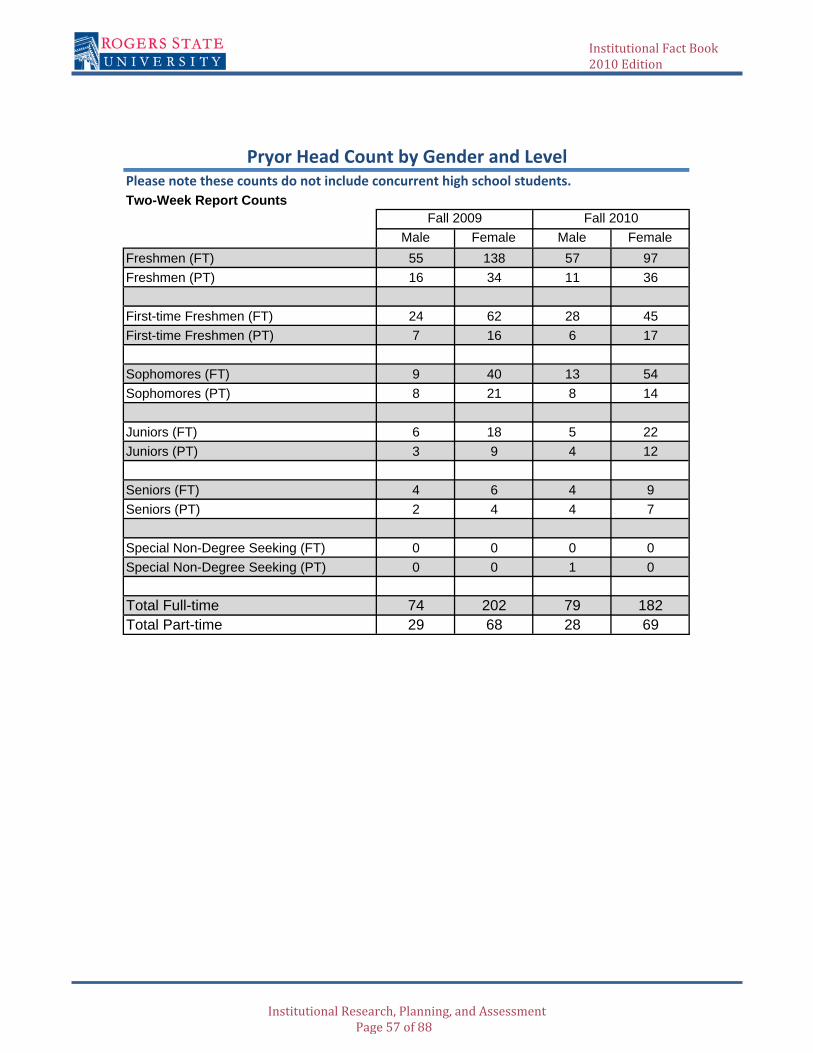
Please note these counts do not include concurrent high school students.Two-Week Report Counts
Male Female Male FemaleFreshmen (FT) 55 138 57 97Freshmen (PT) 16 34 11 36
First-time Freshmen (FT) 24 62 28 45First-time Freshmen (PT) 7 16 6 17
Sophomores (FT) 9 40 13 54Sophomores (PT) 8 21 8 14
Juniors (FT) 6 18 5 22Juniors (PT) 3 9 4 12
Seniors (FT) 4 6 4 9Seniors (PT) 2 4 4 7
Special Non-Degree Seeking (FT) 0 0 0 0Special Non-Degree Seeking (PT) 0 0 1 0
Total Full-time 74 202 79 182Total Part-time 29 68 28 69
Pryor Head Count by Gender and Level
Fall 2009 Fall 2010
Institutional Fact Book 2010 Edition
Institutional Research, Planning, and Assessment Page 57 of 88
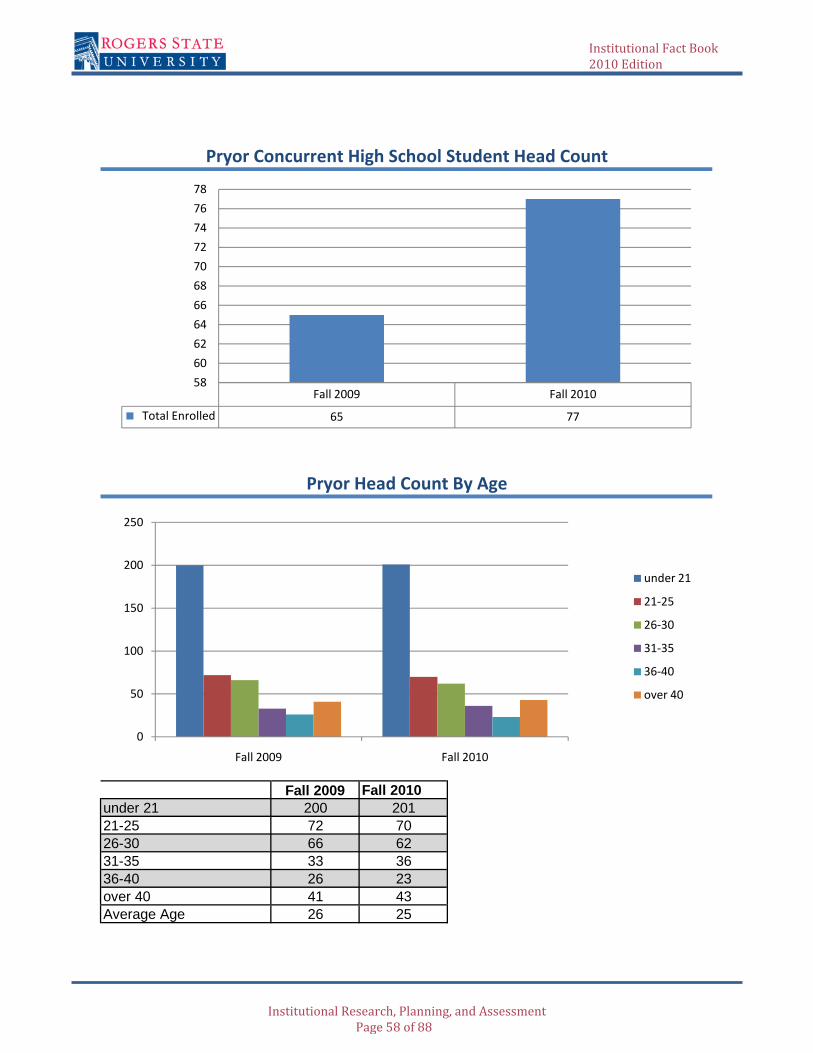
Pryor Concurrent High School Student Head Count
Pryor Head Count By Age
Fall 2009 Fall 2010
Total Enrolled 65 77
5860626466687072747678
150
200
250
under 21
21‐25
26‐30
Fall 2009 Fall 2010under 21 200 20121-25 72 7026-30 66 6231-35 33 3636-40 26 23over 40 41 43Average Age 26 25
Fall 2009 Fall 2010
Total Enrolled 65 77
5860626466687072747678
0
50
100
150
200
250
Fall 2009 Fall 2010
under 21
21‐25
26‐30
31‐35
36‐40
over 40
Institutional Fact Book 2010 Edition
Institutional Research, Planning, and Assessment Page 58 of 88

Fall 2009 Fall 201072 81298 29668 560 2
Associate of Applied Science
Pryor Head Count by Goals
BachelorsAssociate of Arts or Science
Non-Degree
0
50
100
150
200
250
300
350
Fall 2009 Fall 2010
Bachelors
Associate of Arts or Science
Associate of Applied Science
Non‐Degree
0
50
100
150
200
250
300
350
Fall 2009 Fall 2010
Bachelors
Associate of Arts or Science
Associate of Applied Science
Non‐Degree
Institutional Fact Book 2010 Edition
Institutional Research, Planning, and Assessment Page 59 of 88
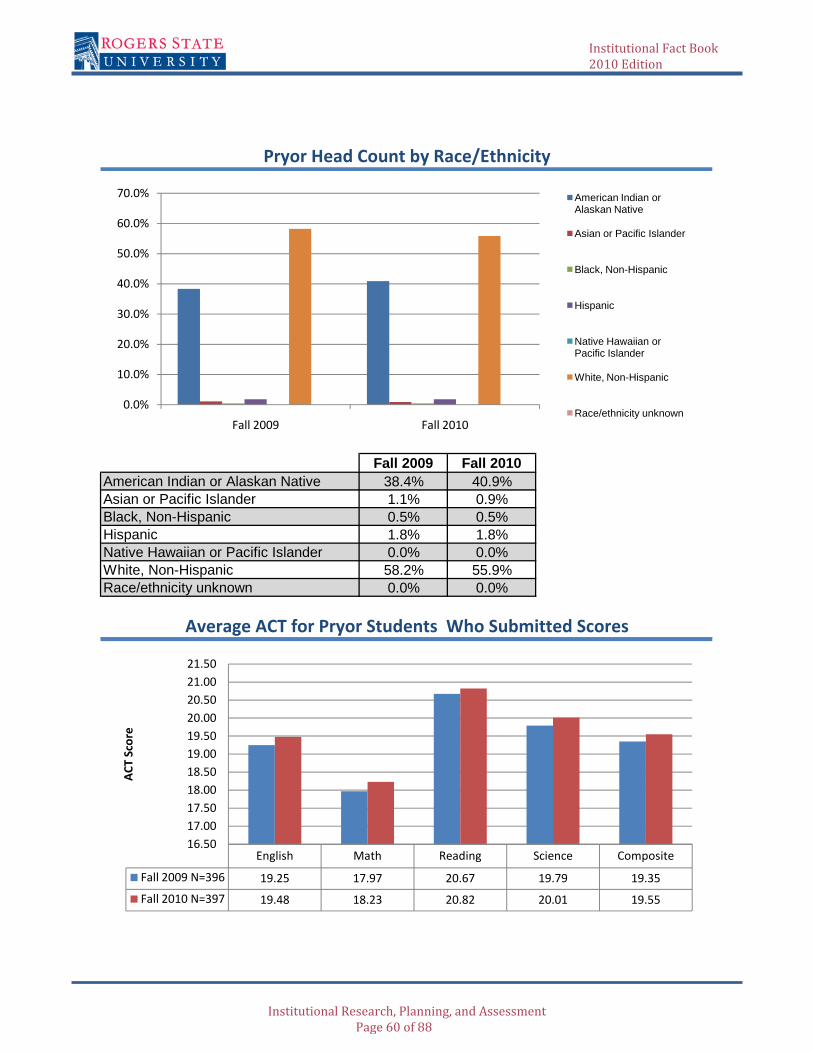
Fall 2009 Fall 201038.4% 40.9%1.1% 0.9%0.5% 0.5%1.8% 1.8%0.0% 0.0%58.2% 55.9%0.0% 0.0%
Pryor Head Count by Race/Ethnicity
American Indian or Alaskan NativeAsian or Pacific IslanderBlack, Non-HispanicHispanicNative Hawaiian or Pacific IslanderWhite, Non-HispanicRace/ethnicity unknown
Average ACT for Pryor Students Who Submitted Scores
0.0%
10.0%
20.0%
30.0%
40.0%
50.0%
60.0%
70.0%
Fall 2009 Fall 2010
American Indian or Alaskan Native
Asian or Pacific Islander
Black, Non-Hispanic
Hispanic
Native Hawaiian or Pacific Islander
White, Non-Hispanic
Race/ethnicity unknown
g y
0.0%
10.0%
20.0%
30.0%
40.0%
50.0%
60.0%
70.0%
Fall 2009 Fall 2010
American Indian or Alaskan Native
Asian or Pacific Islander
Black, Non-Hispanic
Hispanic
Native Hawaiian or Pacific Islander
White, Non-Hispanic
Race/ethnicity unknown
English Math Reading Science Composite
Fall 2009 N=396 19.25 17.97 20.67 19.79 19.35
Fall 2010 N=397 19.48 18.23 20.82 20.01 19.55
16.5017.0017.5018.0018.5019.0019.5020.0020.5021.0021.50
ACT Score
Institutional Fact Book 2010 Edition
Institutional Research, Planning, and Assessment Page 60 of 88

Pryor First‐Time Transfers Head Count
Pryor First‐time Freshmen Average ACT Scores
English Math Reading Science Composite
Fall 2009 N=107 18.96 17.42 20.30 19.19 18.83
Fall 2010 N=96 18.39 17.8 19.9 19.65 18.76
15.5016.0016.5017.0017.5018.0018.5019.0019.5020.0020.5021.00
ACT Score
25
English Math Reading Science Composite
Fall 2009 N=107 18.96 17.42 20.30 19.19 18.83
Fall 2010 N=96 18.39 17.8 19.9 19.65 18.76
15.5016.0016.5017.0017.5018.0018.5019.0019.5020.0020.5021.00
ACT Score
Fall 2009 Fall 2010
First‐time Transfers 21 12
0
5
10
15
20
25
Institutional Fact Book 2010 Edition
Institutional Research, Planning, and Assessment Page 61 of 88

BachelorDegrees Code Major/Option Fall 2009 Fall 2010BA 114 Communications--BA 0 0BA 114A Communications-Communication Arts Option 0 0BA 114C Communications-Corporate Communications Option 2 1BA 114X Communications-Radio-Television Option 1 0BA 109 Liberal Arts--BA 0 0BA 109E Liberal Arts--English Option 1 1BA 109H Liberal Arts--Global Humanities Option 0 0BA 123 Public Administration--BA 0 0
BA 123A Public Administration--Accounting and Budgeting Option* 0 0BA 123M Public Administration--General Management Option* 0 0
BA 123HPublic Administration--Human Resources Management Option* 0 0
BA 123P Public Administration--Pulbic Affairs Option* 0 0BA 123R Public Administration--Research and Analysis Option* 0 0BFA 119 Visual Arts--BFA 1 1BFA 119G Visual Arts--Graphic Design Option 1 2BFA 119M Visual Arts--Multimedia Option 2 0BFA 119P Visual Arts--Photographic Arts Option* 0 0BFA 119A Visual Arts--Studio Arts Option 0 1BS 112 Biology--BS 0 0BS 112E Biology--Environmental Conservation Option 0 3BS 112M Biology--Medical/Molecular Option 9 11BS 113 Business Administration--BS 3 1BS 113A Business Administration-Accounting Option 14 12BS 113E Business Administration-Entrepreneurship Option 1 0BS 113F Business Administration-Forensic Accounting Option 2 2BS 113H Business Administration-Human Resources Option 1 3BS 113M Business Administration-Management Option 4 7
BS 1113GBusiness Administration-Manufacturing Management Option 1 2
BS 113K Business Administration-Marketing Option 2 1BS 108 Business Information Technology--BS 0 0
BS 108NBusiness Information Technology--Computer Network Administration Option 0 3
BS 108SBusiness Information Technology--Software Development & Multimedia Option 2 3
BS 108TBusiness Information Technology--Telecommunications Foundations Option 0 0
BS 120 Community Counseling--BS 5 2BS 117 Game Development--BS 0 0BS 115 Justice Administration--BS 2 6BS 118 Nursing--BS 0 3BS 118U Nursing (not admitted to the program) 2 3BS 775 Organizational Leadership--BS 0 1BS 775B Organizational Leadership--Business Focus 0 1BS 775C Organizational Leadership--Communications Focus 0 0BS 110 Social Science---BS 0 0
Pryor Head Count by Major
Institutional Fact Book 2010 Edition
Institutional Research, Planning, and Assessment Page 62 of 88

BS 110H Social Science--History & Political Science Option‡ 0 0BS 110P Social Science--Psychology & Sociology Option‡ 1 0BS 110T Social Science--History Option 1 1BS 110L Social Science--Political Science Option 0 0BS 110Y Social Science--Psychology Option 9 6BS 110S Social Science--Sociology Option 0 2BS 122 Sport Management--BS 2 0BT 107 Applied Technology--BT 3 2
Bachelor Degree Total 72 81
Associate of ArtsDegrees Code Major/Option Fall 2009 Fall 2010AA 043 Accounting 22 16AA 001 Art-General Option‡ 0 0AA 001D Art-Graphic Design Option‡ 1 0AA 001G Art-Graphics Option‡ 0 0AA 001H Art-Art History Option‡ 0 0AA 004 Business Administration 45 42AA 121 Criminal Justice Studies 2 1AA 121C Criminal Justice Studies - COP Option 4 3AA 121L Criminal Justice Studied - Law/Justice Option 2 5AA 011 Education - Elementary/Early Childhood Option‡ 7 1AA 011E Elementary Education 27 27AA 116 Legal Assisting‡ 0 0AA 023 Liberal Arts 3 6AA 023E Liberal Arts--English Option 1 3AA 023N Liberal Arts-Native American Studies Option 0 0AA 012 Secondary Education 26 12AA 019 Social Science 1 1AA 019H Social Sciences--History Option 1 0AA 019G Social Sciences--Political Science Option 0 0AA 019P Social Sciences--Psychology Option 15 10AA 019S Social Sciences--Sociology Option 1 2
Associate of Arts Total 158 129
Associate of ScienceDegrees Code Major/Option Fall 2009 Fall 2010AS 003 Biological Sciences 9 8AS 097 Computer Science 8 10AS 028 Physical Science 0 1AS 028C Physical Science-Chemistry Option 1 2AS 028E Physical Science-Engineering, Physics, Math Option 4 1AS 028G Physical Science-Geology Option 0 0AS 033N Pre-Nursing‡ 0 0
Associate of Science Total 22 22
Institutional Fact Book 2010 Edition
Institutional Research, Planning, and Assessment Page 63 of 88
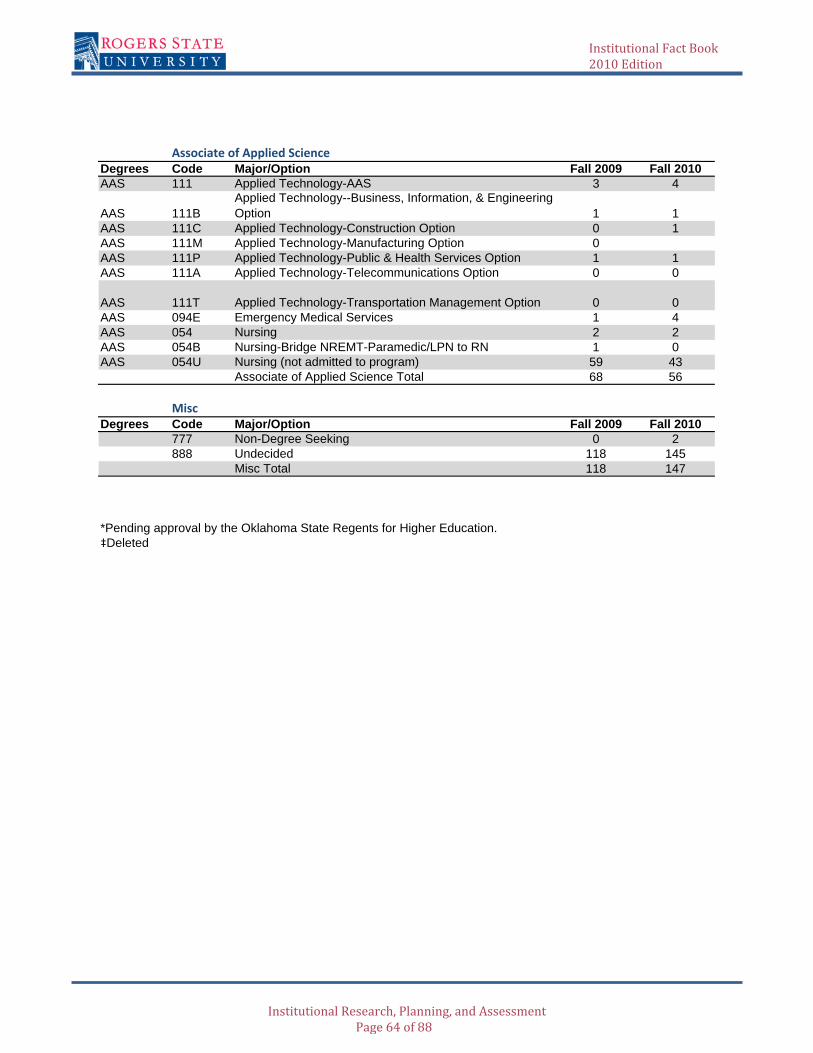
Associate of Applied ScienceDegrees Code Major/Option Fall 2009 Fall 2010AAS 111 Applied Technology-AAS 3 4
AAS 111BApplied Technology--Business, Information, & Engineering Option 1 1
AAS 111C Applied Technology-Construction Option 0 1AAS 111M Applied Technology-Manufacturing Option 0AAS 111P Applied Technology-Public & Health Services Option 1 1AAS 111A Applied Technology-Telecommunications Option 0 0
AAS 111T Applied Technology-Transportation Management Option 0 0AAS 094E Emergency Medical Services 1 4AAS 054 Nursing 2 2AAS 054B Nursing-Bridge NREMT-Paramedic/LPN to RN 1 0AAS 054U Nursing (not admitted to program) 59 43
Associate of Applied Science Total 68 56
MiscDegrees Code Major/Option Fall 2009 Fall 2010
777 Non-Degree Seeking 0 2888 Undecided 118 145
Misc Total 118 147
*Pending approval by the Oklahoma State Regents for Higher Education.‡Deleted
Institutional Fact Book 2010 Edition
Institutional Research, Planning, and Assessment Page 64 of 88
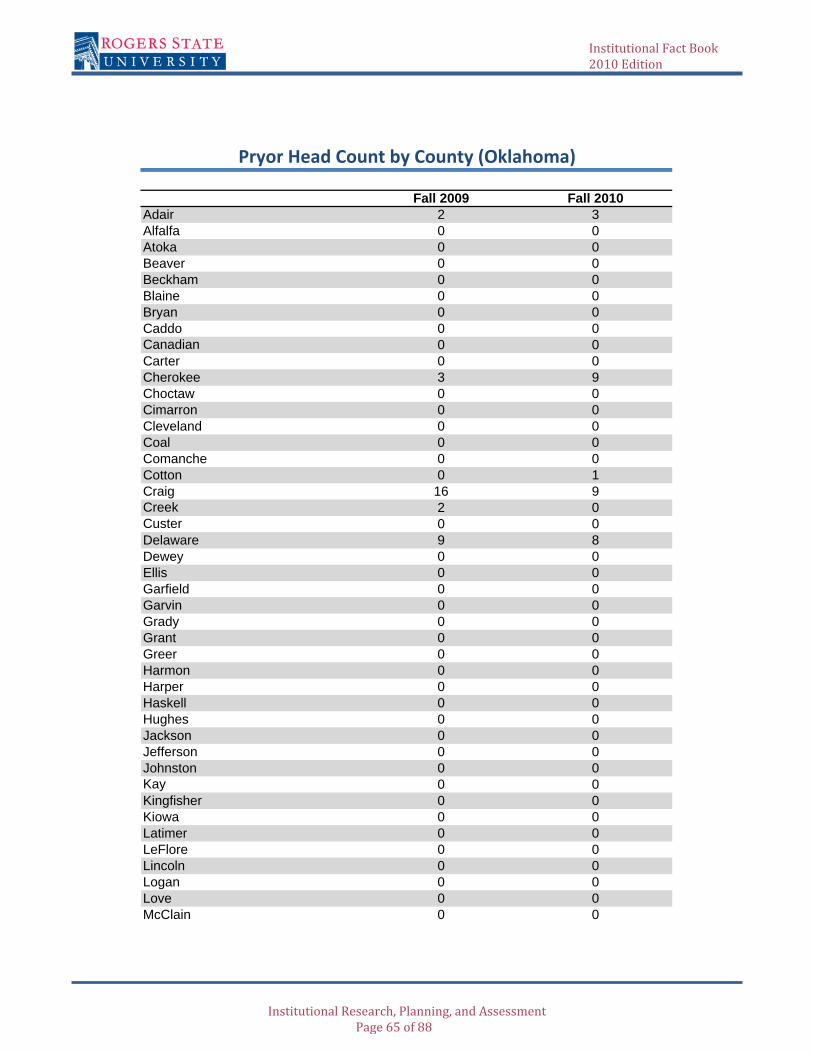
Fall 2009 Fall 2010Adair 2 3Alfalfa 0 0Atoka 0 0Beaver 0 0Beckham 0 0Blaine 0 0Bryan 0 0Caddo 0 0Canadian 0 0Carter 0 0Cherokee 3 9Choctaw 0 0Cimarron 0 0Cleveland 0 0Coal 0 0Comanche 0 0Cotton 0 1Craig 16 9Creek 2 0Custer 0 0Delaware 9 8Dewey 0 0Ellis 0 0Garfield 0 0Garvin 0 0Grady 0 0Grant 0 0Greer 0 0Harmon 0 0Harper 0 0Haskell 0 0Hughes 0 0Jackson 0 0Jefferson 0 0Johnston 0 0Kay 0 0Kingfisher 0 0Kiowa 0 0Latimer 0 0LeFlore 0 0Lincoln 0 0Logan 0 0Love 0 0McClain 0 0
Pryor Head Count by County (Oklahoma)
Institutional Fact Book 2010 Edition
Institutional Research, Planning, and Assessment Page 65 of 88

McCurtain 0 0McIntosh 0 0Major 0 0Marshall 0 0Mayes 369 359Murray 0 0Muskogee 0 1Noble 0 0Nowata 0 1Okfuskee 0 0Oklahoma 0 0Okmulgee 0 0Osage 0 0Ottawa 1 4Pawnee 0 0Payne 0 0Pittsburg 0 0Pontotoc 0 0Pottawatomie 0 0Pushmataha 0 0Roger Mills 0 0Rogers 19 23Seminole 0 0Sequoyah 0 0Stephens 0 0Texas 0 0Tillman 0 0Tulsa 7 5Wagoner 6 7Washington 2 2Washita 0 0Woods 0 0Woodward 0 0Unknown 0 0Total 436 432
Institutional Fact Book 2010 Edition
Institutional Research, Planning, and Assessment Page 66 of 88

Fall 2009 Fall 2010Bartlesville 586 661FTE 386.87 442.27
Bartlesville CampusPlease note: These data use the duplicated student head count. This means students enrolled at more than one campus will be counted in each campus’ count.
Bartlesville Duplicated Head Count and FTE
Bartlesville Total Semester Hours
6800
540560580600620640660680
Fall 2009 Fall 2010
Bartlesville
Bartlesville
Fall 2009 Fall 2010Semester Hours 5803 6634
5200
5400
5600
5800
6000
6200
6400
6600
6800
Fall 2009 Fall 2010
Semester Hours
540560580600620640660680
Fall 2009 Fall 2010
Bartlesville
Bartlesville
Institutional Fact Book 2010 Edition
Institutional Research, Planning, and Assessment Page 67 of 88

Please note these counts do not include concurrent high school students.Two-Week Report Counts
Male Female Male FemaleFreshmen (FT) 68 128 90 151Freshmen (PT) 27 58 37 55
First-time Freshmen (FT) 38 68 53 74First-time Freshmen (PT) 10 16 10 13
Sophomores (FT) 27 50 22 41Sophomores (PT) 9 39 10 39
Juniors (FT) 8 13 11 28Juniors (PT) 8 23 9 26
Seniors (FT) 8 16 7 15Seniors (PT) 4 22 21 6
Special Non-Degree Seeking (FT) 0 0 0 0Special Non-Degree Seeking (PT) 3 5 7 5
Total Full-time 111 207 130 235Total Part-time 51 147 84 131
Bartlesville Head Count by Gender and Level
Fall 2009 Fall 2010
Institutional Fact Book 2010 Edition
Institutional Research, Planning, and Assessment Page 68 of 88

Bartlesville Concurrent High School Student Head Count
Bartlesville Head Count By Age
Fall 2009 Fall 2010
Total Enrolled 70 81
64
66
68
70
72
74
76
78
80
82
150
200
250
300
350
under 21
21‐25
26‐30
31‐35
Fall 2009 Fall 2010under 21 258 32321-25 152 13926-30 54 6731-35 37 5436-40 30 39over 40 55 39Average Age 25 24
Fall 2009 Fall 2010
Total Enrolled 70 81
64
66
68
70
72
74
76
78
80
82
0
50
100
150
200
250
300
350
Fall 2009 Fall 2010
under 21
21‐25
26‐30
31‐35
36‐40
over 40
Institutional Fact Book 2010 Edition
Institutional Research, Planning, and Assessment Page 69 of 88

Fall 2009 Fall 2010162 193298 308118 1308 30Non-Degree
Associate of Applied Science
Bartlesville Head Count by Goal
BachelorsAssociate of Arts or Science
0
50
100
150
200
250
300
350
Fall 2009 Fall 2010
Bachelors
Associate of Arts or Science
Associate of Applied Science
Non‐Degree
0
50
100
150
200
250
300
350
Fall 2009 Fall 2010
Bachelors
Associate of Arts or Science
Associate of Applied Science
Non‐Degree
Institutional Fact Book 2010 Edition
Institutional Research, Planning, and Assessment Page 70 of 88
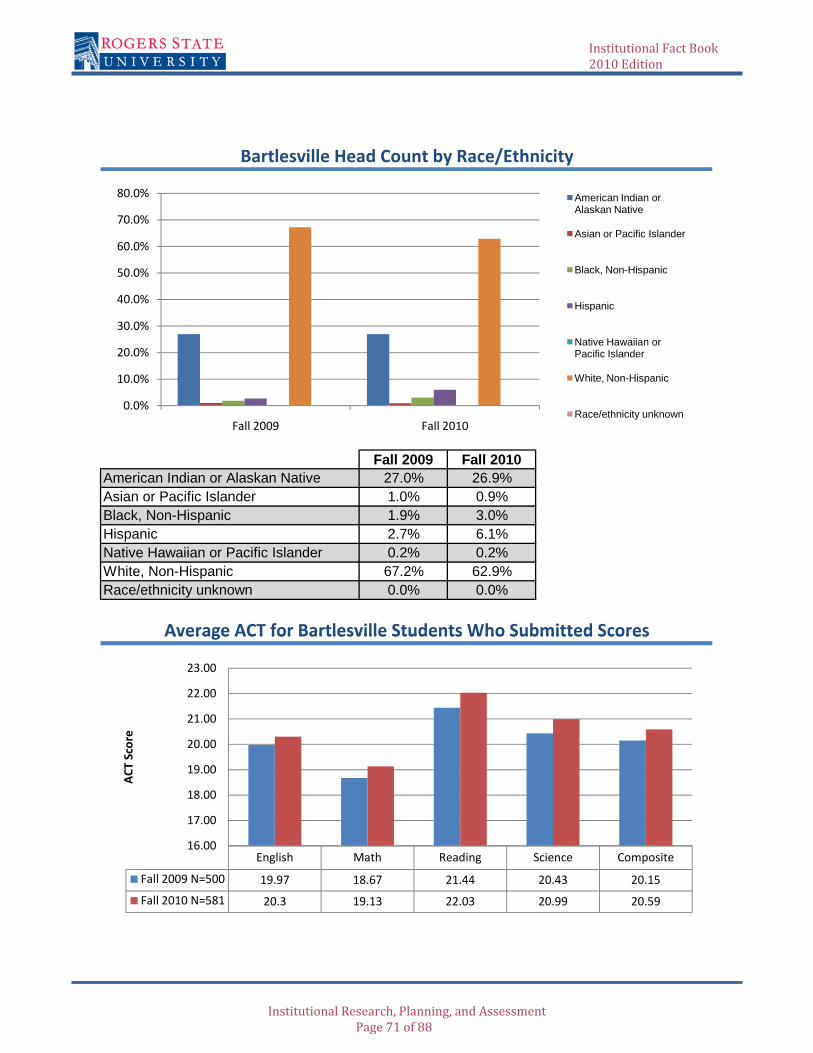
Fall 2009 Fall 201027.0% 26.9%1.0% 0.9%1.9% 3.0%2.7% 6.1%0.2% 0.2%67.2% 62.9%0.0% 0.0%
Bartlesville Head Count by Race/Ethnicity
American Indian or Alaskan NativeAsian or Pacific IslanderBlack, Non-HispanicHispanicNative Hawaiian or Pacific IslanderWhite, Non-HispanicRace/ethnicity unknown
Average ACT for Bartlesville Students Who Submitted Scores
0.0%
10.0%
20.0%
30.0%
40.0%
50.0%
60.0%
70.0%
80.0%
Fall 2009 Fall 2010
American Indian or Alaskan Native
Asian or Pacific Islander
Black, Non-Hispanic
Hispanic
Native Hawaiian or Pacific Islander
White, Non-Hispanic
Race/ethnicity unknown
Average ACT for Bartlesville Students Who Submitted Scores
0.0%
10.0%
20.0%
30.0%
40.0%
50.0%
60.0%
70.0%
80.0%
Fall 2009 Fall 2010
American Indian or Alaskan Native
Asian or Pacific Islander
Black, Non-Hispanic
Hispanic
Native Hawaiian or Pacific Islander
White, Non-Hispanic
Race/ethnicity unknown
English Math Reading Science Composite
Fall 2009 N=500 19.97 18.67 21.44 20.43 20.15
Fall 2010 N=581 20.3 19.13 22.03 20.99 20.59
16.00
17.00
18.00
19.00
20.00
21.00
22.00
23.00
ACT Score
Institutional Fact Book 2010 Edition
Institutional Research, Planning, and Assessment Page 71 of 88

Bartlesville First‐time Transfers Head Count
Bartlesville First‐time Freshmen Average ACT Scores
English Math Reading Science Composite
Fall 2009 N=132 19.30 18.27 20.82 19.84 19.60
Fall 2010 N=150 19.63 18.65 21.82 20.47 20.06
16.00
17.00
18.00
19.00
20.00
21.00
22.00
23.00
ACT Score
46.5
English Math Reading Science Composite
Fall 2009 N=132 19.30 18.27 20.82 19.84 19.60
Fall 2010 N=150 19.63 18.65 21.82 20.47 20.06
16.00
17.00
18.00
19.00
20.00
21.00
22.00
23.00
ACT Score
Fall 2009 Fall 2010
First‐time Transfers 44 46
43
43.5
44
44.5
45
45.5
46
46.5
Institutional Fact Book 2010 Edition
Institutional Research, Planning, and Assessment Page 72 of 88
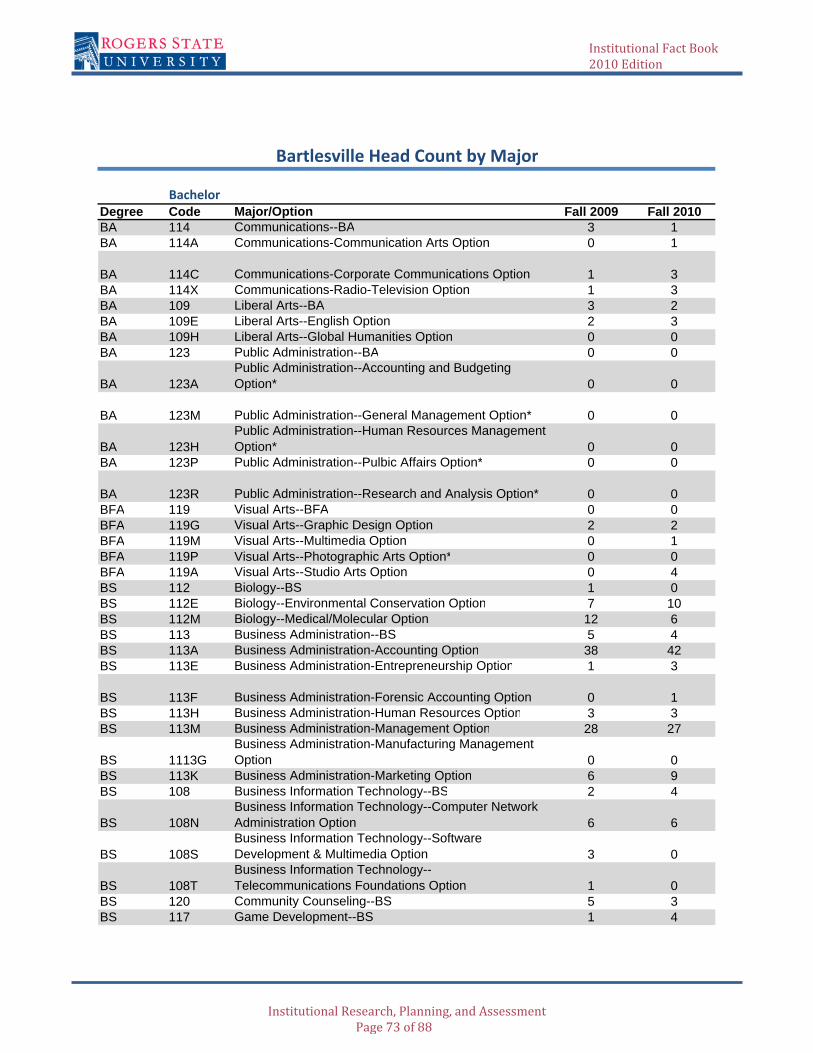
BachelorDegree Code Major/Option Fall 2009 Fall 2010BA 114 Communications--BA 3 1BA 114A Communications-Communication Arts Option 0 1
BA 114C Communications-Corporate Communications Option 1 3BA 114X Communications-Radio-Television Option 1 3BA 109 Liberal Arts--BA 3 2BA 109E Liberal Arts--English Option 2 3BA 109H Liberal Arts--Global Humanities Option 0 0BA 123 Public Administration--BA 0 0
BA 123APublic Administration--Accounting and Budgeting Option* 0 0
BA 123M Public Administration--General Management Option* 0 0
BA 123HPublic Administration--Human Resources Management Option* 0 0
BA 123P Public Administration--Pulbic Affairs Option* 0 0
BA 123R Public Administration--Research and Analysis Option* 0 0BFA 119 Visual Arts--BFA 0 0BFA 119G Visual Arts--Graphic Design Option 2 2BFA 119M Visual Arts--Multimedia Option 0 1BFA 119P Visual Arts--Photographic Arts Option* 0 0BFA 119A Visual Arts--Studio Arts Option 0 4BS 112 Biology--BS 1 0BS 112E Biology--Environmental Conservation Option 7 10BS 112M Biology--Medical/Molecular Option 12 6BS 113 Business Administration--BS 5 4BS 113A Business Administration-Accounting Option 38 42BS 113E Business Administration-Entrepreneurship Option 1 3
BS 113F Business Administration-Forensic Accounting Option 0 1BS 113H Business Administration-Human Resources Option 3 3BS 113M Business Administration-Management Option 28 27
BS 1113GBusiness Administration-Manufacturing Management Option 0 0
BS 113K Business Administration-Marketing Option 6 9BS 108 Business Information Technology--BS 2 4
BS 108NBusiness Information Technology--Computer Network Administration Option 6 6
BS 108SBusiness Information Technology--Software Development & Multimedia Option 3 0
BS 108TBusiness Information Technology--Telecommunications Foundations Option 1 0
BS 120 Community Counseling--BS 5 3BS 117 Game Development--BS 1 4
Bartlesville Head Count by Major
Institutional Fact Book 2010 Edition
Institutional Research, Planning, and Assessment Page 73 of 88
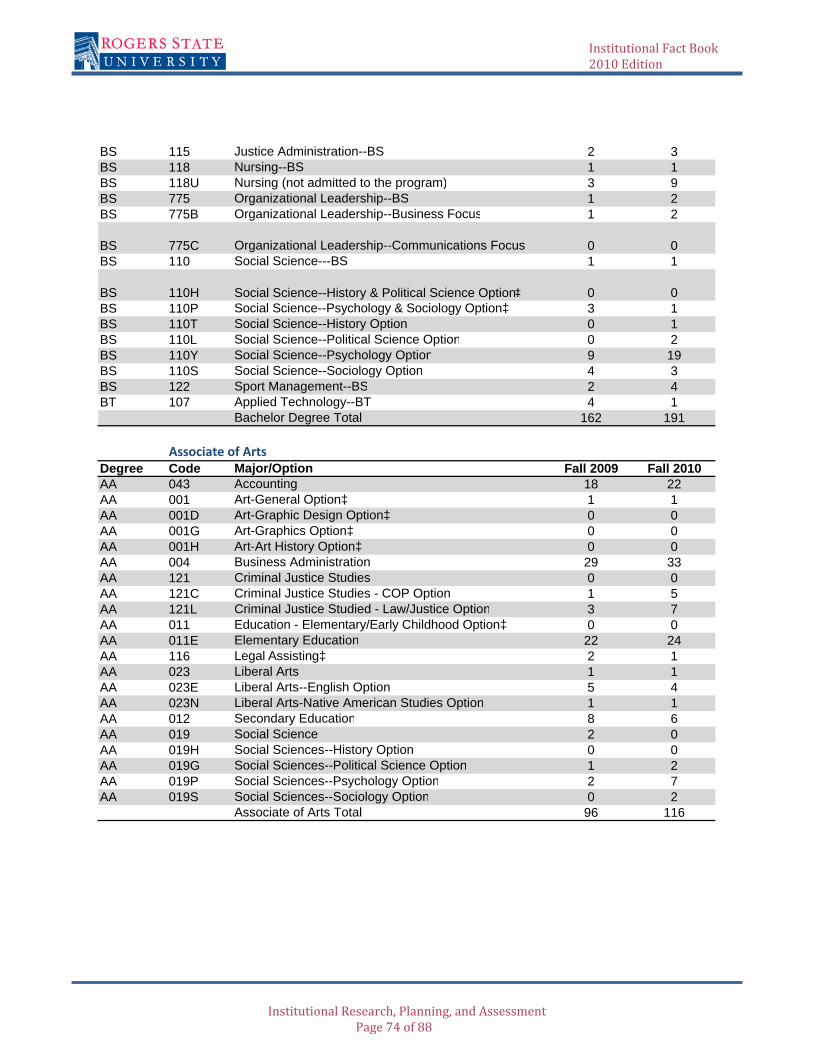
BS 115 Justice Administration--BS 2 3BS 118 Nursing--BS 1 1BS 118U Nursing (not admitted to the program) 3 9BS 775 Organizational Leadership--BS 1 2BS 775B Organizational Leadership--Business Focus 1 2
BS 775C Organizational Leadership--Communications Focus 0 0BS 110 Social Science---BS 1 1
BS 110H Social Science--History & Political Science Option‡ 0 0BS 110P Social Science--Psychology & Sociology Option‡ 3 1BS 110T Social Science--History Option 0 1BS 110L Social Science--Political Science Option 0 2BS 110Y Social Science--Psychology Option 9 19BS 110S Social Science--Sociology Option 4 3BS 122 Sport Management--BS 2 4BT 107 Applied Technology--BT 4 1
Bachelor Degree Total 162 191
Associate of ArtsDegree Code Major/Option Fall 2009 Fall 2010AA 043 Accounting 18 22AA 001 Art-General Option‡ 1 1AA 001D Art-Graphic Design Option‡ 0 0AA 001G Art-Graphics Option‡ 0 0AA 001H Art-Art History Option‡ 0 0AA 004 Business Administration 29 33AA 121 Criminal Justice Studies 0 0AA 121C Criminal Justice Studies - COP Option 1 5AA 121L Criminal Justice Studied - Law/Justice Option 3 7AA 011 Education - Elementary/Early Childhood Option‡ 0 0AA 011E Elementary Education 22 24AA 116 Legal Assisting‡ 2 1AA 023 Liberal Arts 1 1AA 023E Liberal Arts--English Option 5 4AA 023N Liberal Arts-Native American Studies Option 1 1AA 012 Secondary Education 8 6AA 019 Social Science 2 0AA 019H Social Sciences--History Option 0 0AA 019G Social Sciences--Political Science Option 1 2AA 019P Social Sciences--Psychology Option 2 7AA 019S Social Sciences--Sociology Option 0 2
Associate of Arts Total 96 116
Institutional Fact Book 2010 Edition
Institutional Research, Planning, and Assessment Page 74 of 88
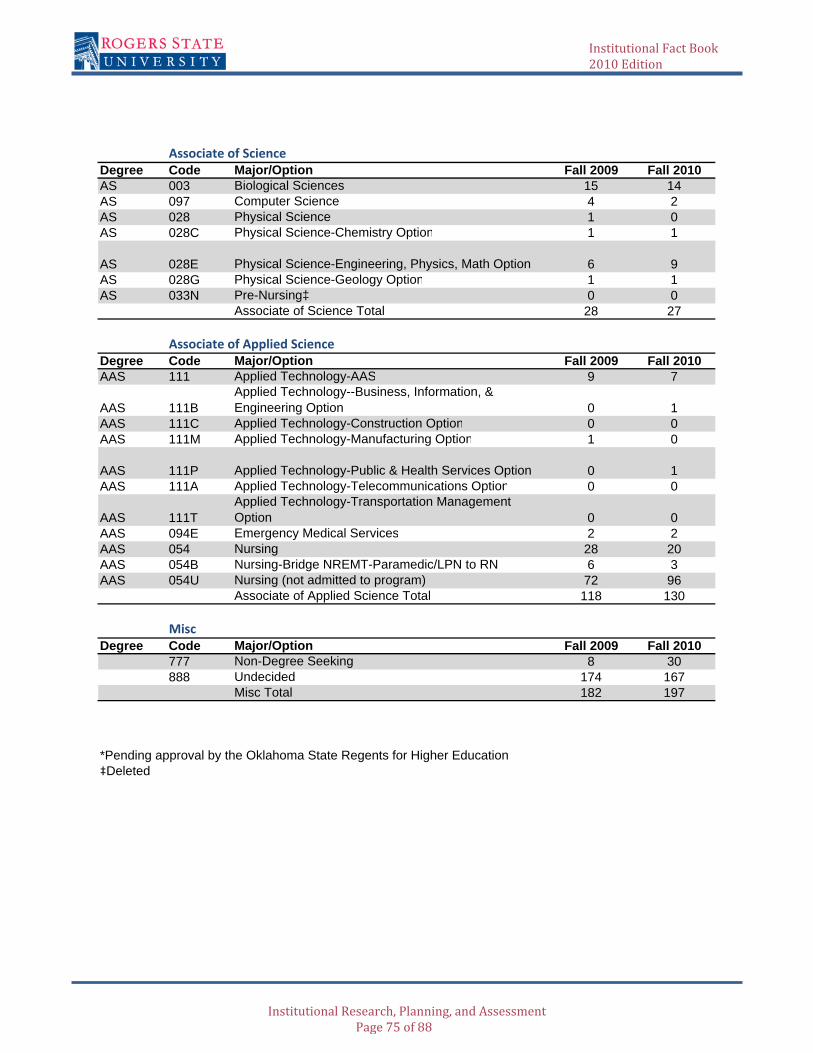
Associate of ScienceDegree Code Major/Option Fall 2009 Fall 2010AS 003 Biological Sciences 15 14AS 097 Computer Science 4 2AS 028 Physical Science 1 0AS 028C Physical Science-Chemistry Option 1 1
AS 028E Physical Science-Engineering, Physics, Math Option 6 9AS 028G Physical Science-Geology Option 1 1AS 033N Pre-Nursing‡ 0 0
Associate of Science Total 28 27
Associate of Applied ScienceDegree Code Major/Option Fall 2009 Fall 2010AAS 111 Applied Technology-AAS 9 7
AAS 111BApplied Technology--Business, Information, & Engineering Option 0 1
AAS 111C Applied Technology-Construction Option 0 0AAS 111M Applied Technology-Manufacturing Option 1 0
AAS 111P Applied Technology-Public & Health Services Option 0 1AAS 111A Applied Technology-Telecommunications Option 0 0
AAS 111TApplied Technology-Transportation Management Option 0 0
AAS 094E Emergency Medical Services 2 2AAS 054 Nursing 28 20AAS 054B Nursing-Bridge NREMT-Paramedic/LPN to RN 6 3AAS 054U Nursing (not admitted to program) 72 96
Associate of Applied Science Total 118 130
MiscDegree Code Major/Option Fall 2009 Fall 2010
777 Non-Degree Seeking 8 30888 Undecided 174 167
Misc Total 182 197
*Pending approval by the Oklahoma State Regents for Higher Education‡Deleted
Institutional Fact Book 2010 Edition
Institutional Research, Planning, and Assessment Page 75 of 88
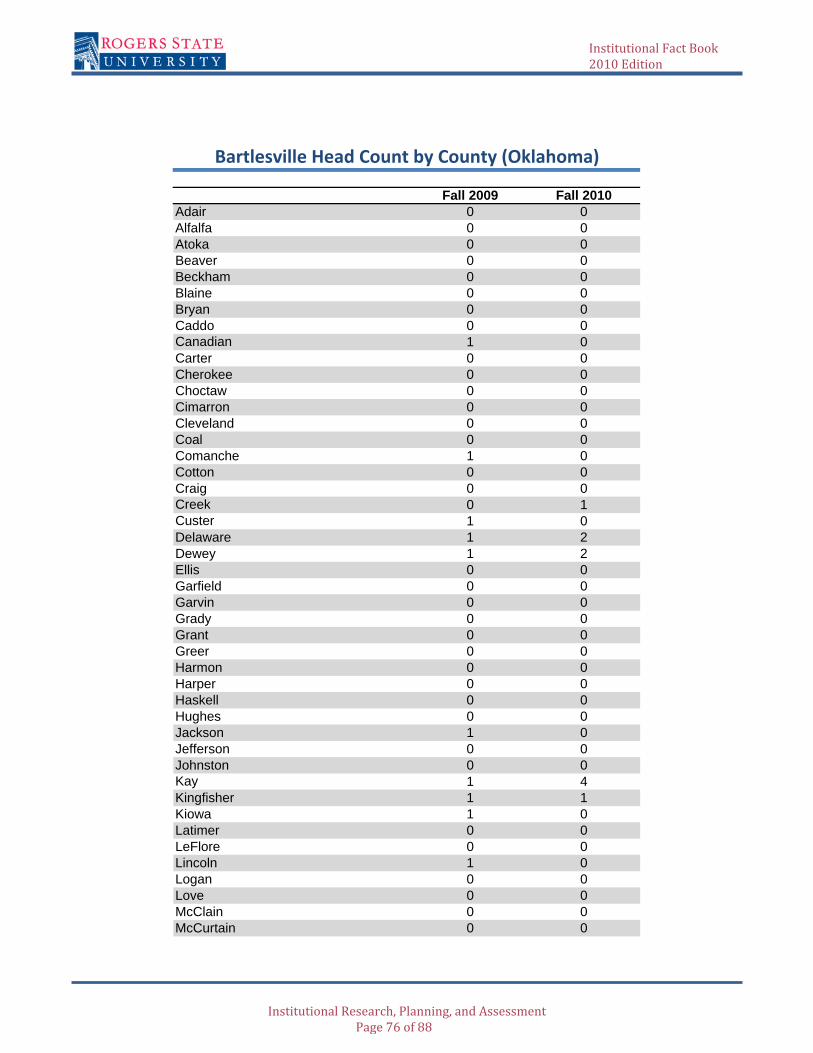
Fall 2009 Fall 2010Adair 0 0Alfalfa 0 0Atoka 0 0Beaver 0 0Beckham 0 0Blaine 0 0Bryan 0 0Caddo 0 0Canadian 1 0Carter 0 0Cherokee 0 0Choctaw 0 0Cimarron 0 0Cleveland 0 0Coal 0 0Comanche 1 0Cotton 0 0Craig 0 0Creek 0 1Custer 1 0Delaware 1 2Dewey 1 2Ellis 0 0Garfield 0 0Garvin 0 0Grady 0 0Grant 0 0Greer 0 0Harmon 0 0Harper 0 0Haskell 0 0Hughes 0 0Jackson 1 0Jefferson 0 0Johnston 0 0Kay 1 4Kingfisher 1 1Kiowa 1 0Latimer 0 0LeFlore 0 0Lincoln 1 0Logan 0 0Love 0 0McClain 0 0McCurtain 0 0
Bartlesville Head Count by County (Oklahoma)
Institutional Fact Book 2010 Edition
Institutional Research, Planning, and Assessment Page 76 of 88

Fall 2009 Fall 2010
Bartlesville Head Count by County (Oklahoma)
McIntosh 0 0Major 0 0Marshall 0 0Mayes 0 0Murray 0 0Muskogee 0 0Noble 0 0Nowata 32 31Okfuskee 0 0Oklahoma 0 4Okmulgee 0 0Osage 42 56Ottawa 0 0Pawnee 0 0Payne 0 1Pittsburg 0 0Pontotoc 0 0Pottawatomie 0 0Pushmataha 0 0Roger Mills 0 0Rogers 4 7Seminole 0 0Sequoyah 0 0Stephens 0 0Texas 0 0Tillman 0 0Tulsa 8 5Wagoner 0 0Washington 475 528Washita 0 0Woods 1 1Woodward 0 0Unknown 0 0Total 572 643
Institutional Fact Book 2010 Edition
Institutional Research, Planning, and Assessment Page 77 of 88
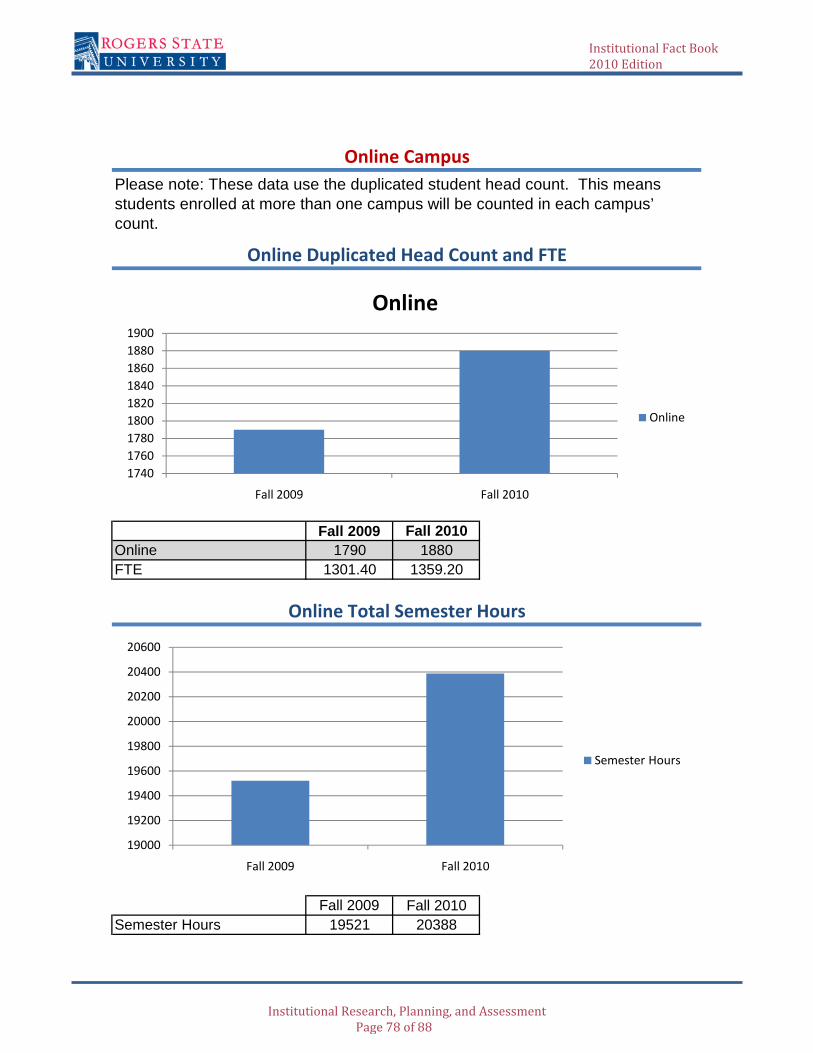
Fall 2009 Fall 2010Online 1790 1880FTE 1301.40 1359.20
Online CampusPlease note: These data use the duplicated student head count. This means students enrolled at more than one campus will be counted in each campus’ count.
Online Duplicated Head Count and FTE
Online Total Semester Hours
20600
174017601780180018201840186018801900
Fall 2009 Fall 2010
Online
Online
Fall 2009 Fall 2010Semester Hours 19521 20388
19000
19200
19400
19600
19800
20000
20200
20400
20600
Fall 2009 Fall 2010
Semester Hours
174017601780180018201840186018801900
Fall 2009 Fall 2010
Online
Online
Institutional Fact Book 2010 Edition
Institutional Research, Planning, and Assessment Page 78 of 88

Please note these counts do not include concurrent high school students.Two-Week Report Counts
Male Female Male FemaleFreshmen (FT) 130 223 102 238Freshmen (PT) 36 106 55 96
First-time Freshmen (FT) 48 81 39 68First-time Freshmen (PT) 5 15 12 21
Sophomores (FT) 113 178 99 181Sophomores (PT) 35 93 34 107
Juniors (FT) 90 145 83 179Juniors (PT) 43 111 50 111
Seniors (FT) 98 136 124 143Seniors (PT) 78 139 90 145
Special Non-Degree Seeking (FT) 0 0 0 0Special Non-Degree Seeking (PT) 8 8 10 13
Total Full-time 431 682 408 741Total Part-time 200 457 239 472
Online Head Count by Gender and Level
Fall 2009 Fall 2010
Institutional Fact Book 2010 Edition
Institutional Research, Planning, and Assessment Page 79 of 88

Online Concurrent High School Student Head Count
Online Head Count By Age
Fall 2009 Fall 2010
Total Enrolled 20 20
0
5
10
15
20
25
300
400
500
600
700
under 21
21‐25
26‐30
31 35
Fall 2009 Fall 2010under 21 443 41521-25 572 61226-30 265 28731-35 181 19836-40 153 152over 40 176 216Average Age 27 28
Fall 2009 Fall 2010
Total Enrolled 20 20
0
5
10
15
20
25
0
100
200
300
400
500
600
700
Fall 2009 Fall 2010
under 21
21‐25
26‐30
31‐35
36‐40
over 40
Institutional Fact Book 2010 Edition
Institutional Research, Planning, and Assessment Page 80 of 88
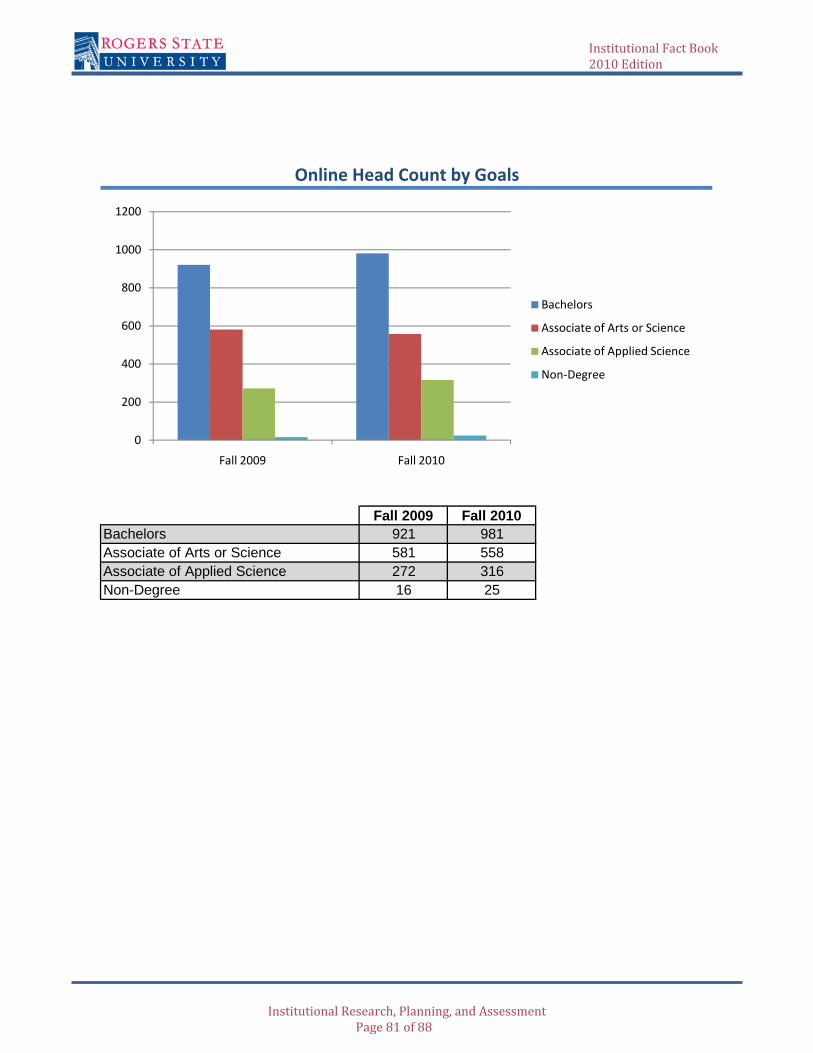
Fall 2009 Fall 2010921 981581 558272 31616 25Non-Degree
Associate of Applied Science
Online Head Count by Goals
BachelorsAssociate of Arts or Science
0
200
400
600
800
1000
1200
Fall 2009 Fall 2010
Bachelors
Associate of Arts or Science
Associate of Applied Science
Non‐Degree
0
200
400
600
800
1000
1200
Fall 2009 Fall 2010
Bachelors
Associate of Arts or Science
Associate of Applied Science
Non‐Degree
Institutional Fact Book 2010 Edition
Institutional Research, Planning, and Assessment Page 81 of 88
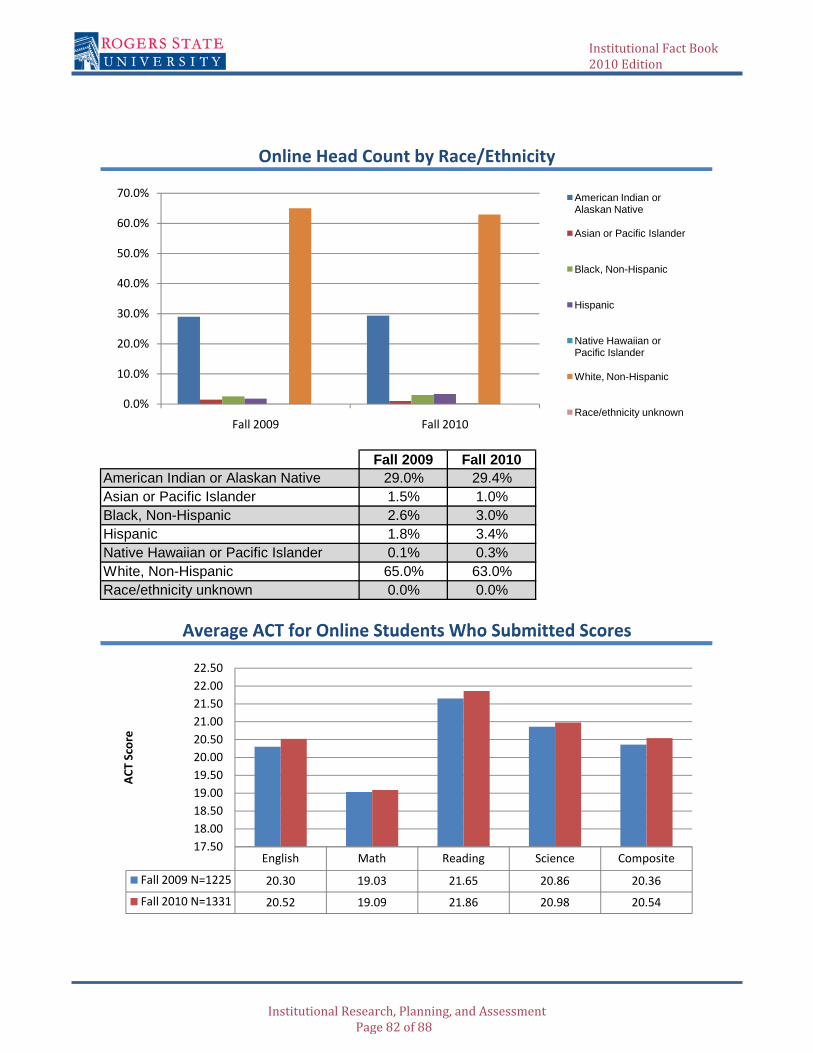
Fall 2009 Fall 201029.0% 29.4%1.5% 1.0%2.6% 3.0%1.8% 3.4%0.1% 0.3%65.0% 63.0%0.0% 0.0%
Online Head Count by Race/Ethnicity
American Indian or Alaskan NativeAsian or Pacific IslanderBlack, Non-HispanicHispanicNative Hawaiian or Pacific IslanderWhite, Non-HispanicRace/ethnicity unknown
Average ACT for Online Students Who Submitted Scores
0.0%
10.0%
20.0%
30.0%
40.0%
50.0%
60.0%
70.0%
Fall 2009 Fall 2010
American Indian or Alaskan Native
Asian or Pacific Islander
Black, Non-Hispanic
Hispanic
Native Hawaiian or Pacific Islander
White, Non-Hispanic
Race/ethnicity unknown
Average ACT for Online Students Who Submitted Scores
0.0%
10.0%
20.0%
30.0%
40.0%
50.0%
60.0%
70.0%
Fall 2009 Fall 2010
American Indian or Alaskan Native
Asian or Pacific Islander
Black, Non-Hispanic
Hispanic
Native Hawaiian or Pacific Islander
White, Non-Hispanic
Race/ethnicity unknown
English Math Reading Science Composite
Fall 2009 N=1225 20.30 19.03 21.65 20.86 20.36
Fall 2010 N=1331 20.52 19.09 21.86 20.98 20.54
17.5018.0018.5019.0019.5020.0020.5021.0021.5022.0022.50
ACT Score
Institutional Fact Book 2010 Edition
Institutional Research, Planning, and Assessment Page 82 of 88

Online First‐time Transfers Head Count
Online First‐time Freshmen Average ACT Scores
English Math Reading Science Composite
Fall 2009 N=147 20.27 18.68 21.86 20.75 20.28
Fall 2010 N=139 19.79 18.63 22.21 20.88 20.39
16
17
18
19
20
21
22
23
ACT Score
185
English Math Reading Science Composite
Fall 2009 N=147 20.27 18.68 21.86 20.75 20.28
Fall 2010 N=139 19.79 18.63 22.21 20.88 20.39
16
17
18
19
20
21
22
23
ACT Score
Fall 2009 Fall 2010
First‐time Transfers 161 179
150
155
160
165
170
175
180
185
Institutional Fact Book 2010 Edition
Institutional Research, Planning, and Assessment Page 83 of 88
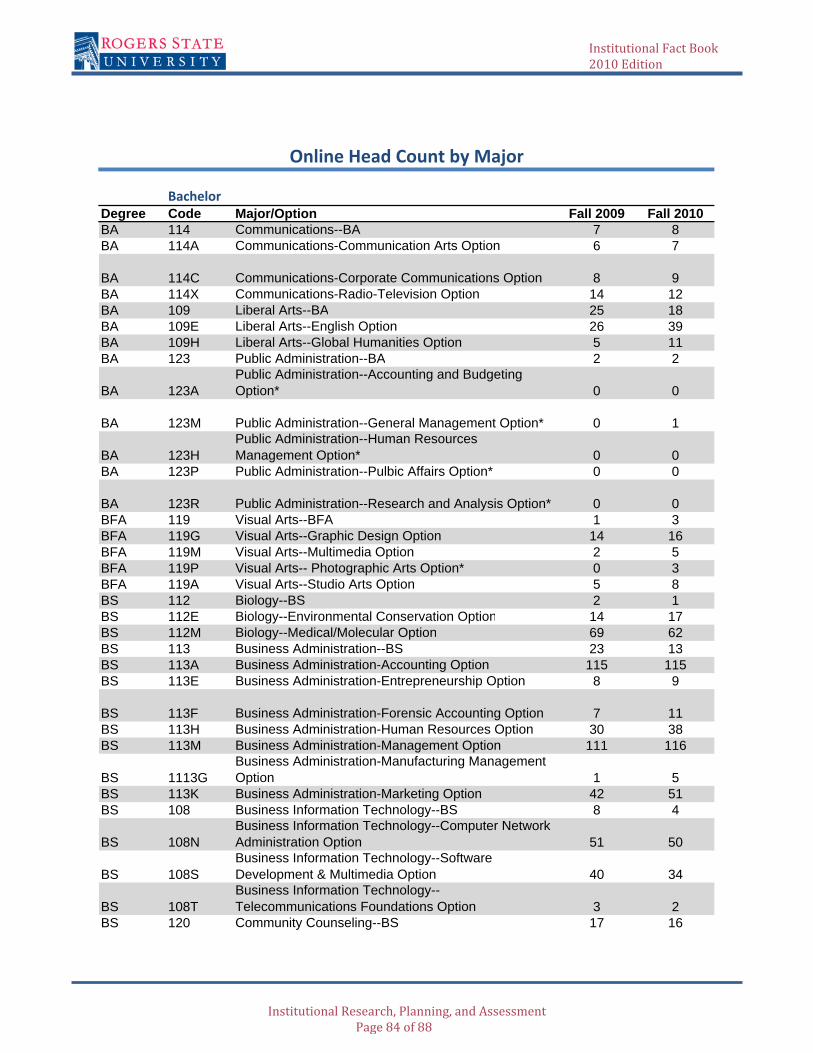
BachelorDegree Code Major/Option Fall 2009 Fall 2010BA 114 Communications--BA 7 8BA 114A Communications-Communication Arts Option 6 7
BA 114C Communications-Corporate Communications Option 8 9BA 114X Communications-Radio-Television Option 14 12BA 109 Liberal Arts--BA 25 18BA 109E Liberal Arts--English Option 26 39BA 109H Liberal Arts--Global Humanities Option 5 11BA 123 Public Administration--BA 2 2
BA 123APublic Administration--Accounting and Budgeting Option* 0 0
BA 123M Public Administration--General Management Option* 0 1
BA 123HPublic Administration--Human Resources Management Option* 0 0
BA 123P Public Administration--Pulbic Affairs Option* 0 0
BA 123R Public Administration--Research and Analysis Option* 0 0BFA 119 Visual Arts--BFA 1 3BFA 119G Visual Arts--Graphic Design Option 14 16BFA 119M Visual Arts--Multimedia Option 2 5BFA 119P Visual Arts-- Photographic Arts Option* 0 3BFA 119A Visual Arts--Studio Arts Option 5 8BS 112 Biology--BS 2 1BS 112E Biology--Environmental Conservation Option 14 17BS 112M Biology--Medical/Molecular Option 69 62BS 113 Business Administration--BS 23 13BS 113A Business Administration-Accounting Option 115 115BS 113E Business Administration-Entrepreneurship Option 8 9
BS 113F Business Administration-Forensic Accounting Option 7 11BS 113H Business Administration-Human Resources Option 30 38BS 113M Business Administration-Management Option 111 116
BS 1113GBusiness Administration-Manufacturing Management Option 1 5
BS 113K Business Administration-Marketing Option 42 51BS 108 Business Information Technology--BS 8 4
BS 108NBusiness Information Technology--Computer Network Administration Option 51 50
BS 108SBusiness Information Technology--Software Development & Multimedia Option 40 34
BS 108TBusiness Information Technology--Telecommunications Foundations Option 3 2
BS 120 Community Counseling--BS 17 16
Online Head Count by Major
Institutional Fact Book 2010 Edition
Institutional Research, Planning, and Assessment Page 84 of 88

BS 117 Game Development--BS 20 26BS 115 Justice Administration--BS 25 27BS 118 Nursing--BS 6 7BS 118U Nursing (not admitted to the program) 18 26BS 775 Organizational Leadership--BS 42 25BS 775B Organizational Leadership--Business Focus 9 16
BS 775C Organizational Leadership--Communications Focus 0 1BS 775S Organizational Leadership--Social Studies Focus 0 1BS 110 Social Science---BS 2 0
BS 110H Social Science--History & Political Science Option‡ 0 0BS 110P Social Science--Psychology & Sociology Option‡ 7 2BS 110T Social Science--History Option 4 4BS 110L Social Science--Political Science Option 4 6BS 110Y Social Science--Psychology Option 26 33BS 110S Social Science--Sociology Option 6 7BS 122 Sport Management--BS 32 41BT 107 Applied Technology--BT 64 63
Bachelor Degree Total 921 971
Associate of ArtsDegree Code Major/Option Fall 2009 Fall 2010AA 043 Accounting 42 38AA 001 Art-General Option‡ 1 0AA 001D Art-Graphic Design Option‡ 0 0AA 001G Art-Graphics Option‡ 1 0AA 001H Art-Art History Option‡ 0 0AA 004 Business Administration 80 75AA 121 Criminal Justice Studies 1 0AA 121C Criminal Justice Studies - COP Option 11 15AA 121L Criminal Justice Studied - Law/Justice Option 10 14AA 011 Education - Elementary/Early Childhood Option‡ 11 1AA 011E Elementary Education 90 94AA 096 Law/Justice Careers-Criminal Justice‡ 1 1AA 116 Legal Assisting‡ 2 1AA 023 Liberal Arts 17 20AA 023E Liberal Arts--English Option 5 7AA 023N Liberal Arts-Native American Studies Option 0 2AA 012 Secondary Education 29 35AA 019 Social Science 2 1AA 019H Social Sciences--History Option 3 0AA 019G Social Sciences--Political Science Option 0 0AA 019P Social Sciences--Psychology Option 14 15AA 019S Social Sciences--Sociology Option 3 4
Associate of Arts Total 323 323
Institutional Fact Book 2010 Edition
Institutional Research, Planning, and Assessment Page 85 of 88

Associate of ScienceDegree Code Major/Option Fall 2009 Fall 2010AS 003 Biological Sciences 15 16AS 097 Computer Science 24 32AS 028 Physical Science 2 0AS 028C Physical Science-Chemistry Option 1 0
AS 028E Physical Science-Engineering, Physics, Math Option 9 7AS 028G Physical Science-Geology Option 2 0AS 033N Pre-Nursing‡ 2 0
Associate of Science Total 55 55
Associate of Applied ScienceDegree Code Major/Option Fall 2009 Fall 2010AAS 111 Applied Technology-AAS 19 17
AAS 111BApplied Technology--Business, Information, & Engineering Option 4 11
AAS 111C Applied Technology-Construction Option 0 1AAS 111M Applied Technology-Manufacturing Option 1 3
AAS 111P Applied Technology-Public & Health Services Option 2 4AAS 111A Applied Technology-Telecommunications Option 0 0
AAS 111TApplied Technology-Transportation Management Option 0 0
AAS 094E Emergency Medical Services 26 29AAS 054 Nursing 36 29AAS 054B Nursing-Bridge NREMT-Paramedic/LPN to RN 9 2AAS 054U Nursing (not admitted to program) 175 219
Associate of Applied Science Total 272 315
MiscDegree Code Major/Option Fall 2009 Fall 2010
777 Non-Degree Seeking 16 25888 Undecided 203 191
Misc Total 219 216
*Pending approval by the Oklahoma State Regents for Higher Education.‡Deleted
Institutional Fact Book 2010 Edition
Institutional Research, Planning, and Assessment Page 86 of 88

Fall 2009 Fall 2010Adair 6 6Alfalfa 0 0Atoka 0 0Beaver 0 0Beckham 0 1Blaine 1 1Bryan 0 0Caddo 0 1Canadian 5 3Carter 1 1Cherokee 11 12Choctaw 2 2Cimarron 0 0Cleveland 4 9Coal 0 0Comanche 6 2Cotton 0 0Craig 50 43Creek 13 13Custer 0 1Delaware 28 27Dewey 1 2Ellis 0 0Garfield 1 1Garvin 0 1Grady 2 4Grant 0 0Greer 0 0Harmon 0 0Harper 0 0Haskell 0 0Hughes 0 0Jackson 2 2Jefferson 0 0Johnston 0 0Kay 9 10Kingfisher 3 0Kiowa 4 1Latimer 2 2LeFlore 11 8Lincoln 3 2Logan 1 1Love 1 0McClain 2 0McCurtain 0 3
Online Head Count by County (Oklahoma)
Institutional Fact Book 2010 Edition
Institutional Research, Planning, and Assessment Page 87 of 88

McIntosh 1 0Major 0 0Marshall 1 1Mayes 239 272Murray 0 0Muskogee 3 5Noble 0 0Nowata 44 51Okfuskee 0 0Oklahoma 20 17Okmulgee 16 11Osage 53 58Ottawa 8 10Pawnee 7 3Payne 6 2Pittsburg 0 1Pontotoc 0 1Pottawatomie 0 3Pushmataha 0 1Roger Mills 0 0Rogers 592 574Seminole 1 2Sequoyah 3 2Stephens 1 2Texas 0 0Tillman 0 0Tulsa 281 330Wagoner 27 32Washington 233 250Washita 0 0Woods 1 1Woodward 2 1Unknown 0 3Total 1708 1792
Institutional Fact Book 2010 Edition
Institutional Research, Planning, and Assessment Page 88 of 88