rod larson president es de t - oceaneering · 2017-03-27 · rod larson president scotia howard...
TRANSCRIPT
Rod LarsonRod LarsonPresidentPresident
Scotia Howard Weil Energy ConferenceScotia Howard Weil Energy ConferenceM h 29 2017M h 29 2017
es de tes de t
March 29, 2017 March 29, 2017 New Orleans, LANew Orleans, LA

Forward-Looking Statements
Statements we make in this presentation that express a belief, expectation, or intention are forward looking. Forward-looking statements are generally accompanied by words such asare generally accompanied by words such as “estimate,” “project,” “predict,” “believe,” “expect,” “anticipate,” “plan,” “forecast,” “budget,” “goal,” or other words that convey the uncertainly of future events or outcomes. These forward looking statements are basedThese forward-looking statements are based on our current information and expectations that involve a number of risks, uncertainties, and assumptions. Among the factors that could cause the actual results to differ materially from those indicated in the forward-looking statements are: industry conditions, prices of crude oil and natural gas, our ability to obtain and the timing of new projects, and changes in competitive factors. Should one or g pmore of these risks or uncertainties materialize, or should the assumptions underlying the forward-looking statements prove incorrect, actual outcomes could vary materially from those indicatedmaterially from those indicated.
For additional information regarding these and other factors, see our periodic filings with the Securities and Exchange Commission,
2
including our most recent Reports on Forms 10-K and 10-Q.

Why Oceaneering?
Global provider of diversified services and products in all phases Global provider of diversified services and products in all phases Global provider of diversified services and products in all phases of the offshore oilfield life cycle Global provider of diversified services and products in all phases
of the offshore oilfield life cycle
Strong market positions
S lid b l h t d h fl
Strong market positions
S lid b l h t d h fl Solid balance sheet and cash flow
Return of capital to our shareholders
Solid balance sheet and cash flow
Return of capital to our shareholdersReturn of capital to our shareholders
Leveraged to deepwater - longer term, deepwater is still critical to
Return of capital to our shareholders
Leveraged to deepwater - longer term, deepwater is still critical to reserve replenishmentreserve replenishment
3

5 Operating Segments
1 Remotely Operated Vehicles (“ROVs”)1 Remotely Operated Vehicles (“ROVs”)1. Remotely Operated Vehicles ( ROVs )
2 Subsea Products
1. Remotely Operated Vehicles ( ROVs )
2 Subsea Products2. Subsea Products
3 Subsea Projects
2. Subsea Products
3 Subsea Projects3. Subsea Projects
4. Asset Integrity
3. Subsea Projects
4. Asset Integrity4. Asset Integrity
5. Advanced Technologies
4. Asset Integrity
5. Advanced Technologies gg
4

In All Phases of the Offshore Oilfield Life CycleEXPLORATION
10%
DEVELOPMENT
50%
PRODUCTION
35%
DECOMMISSIONING
5%
# of Operating # of Subsea Tree # of Subsea Trees # of Field
PHASE
% OII Revenue
#1 Market # of OperatingFloating Drilling Rigs
# of Subsea Tree Installations
# of Subsea TreesIn Service
# of Field Abandonments
#1 Market Driver
Business Segment Product
and S i
•• ROVROV•• Survey (SP)Survey (SP)•• Tooling (SSP)Tooling (SSP)
Service Revenue Streams
• ROV• Survey (SP)• Tooling (SSP)• IWOCS – Installation &
Workover Control Systems
• ROV• Tooling (SSP)• IWOCS (SSP)• Subsea Hardware (SSP)• Vessel-based Inspection,
• ROV • Tooling (SSP)• IWOCS (SSP)
(SSP)• Subsea Hardware (SSP)• Umbilicals (SSP)• Vessel-based Installation
Services (SP)• Inspection Services (AI)
Maintenance & Repair Services (SP)
• Inspection Services (AI)
ROV = Remotely Operated Vehicles SSP = Subsea Products SP = Subsea Projects AI = Asset Integrity
5
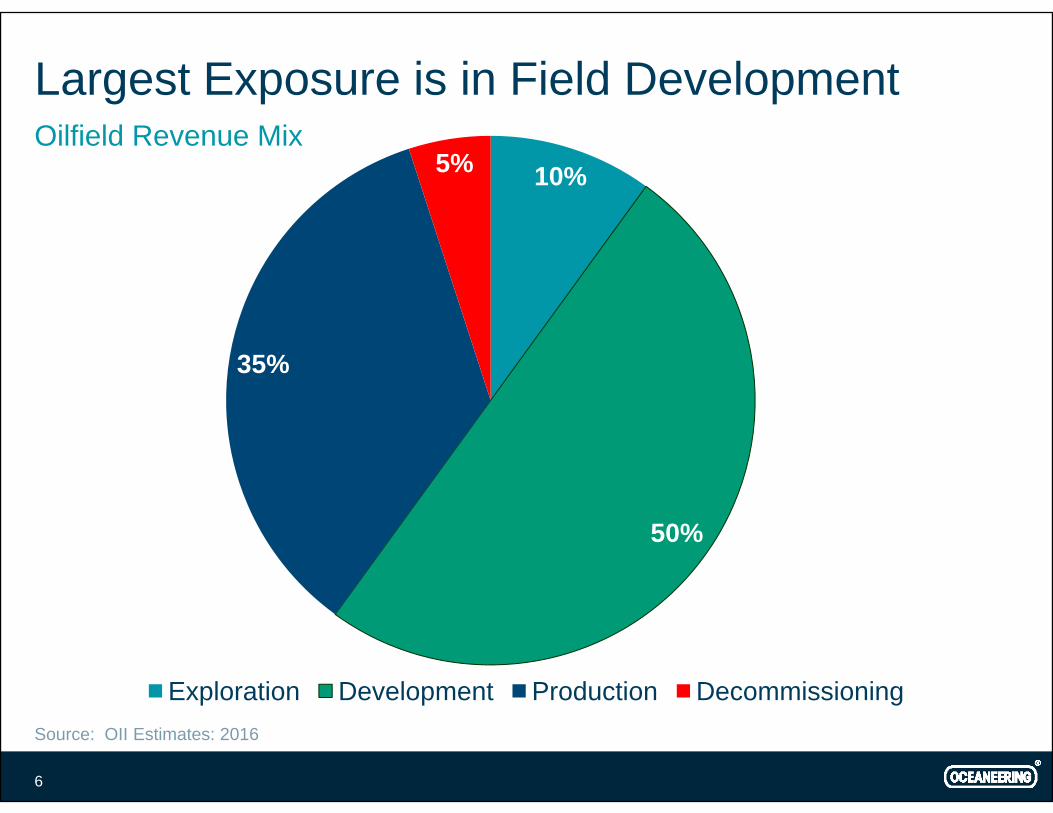
Largest Exposure is in Field Development
10%5%Oilfield Revenue Mix
35%
50%
Exploration Development Production Decommissioningp p gSource: OII Estimates: 2016
6
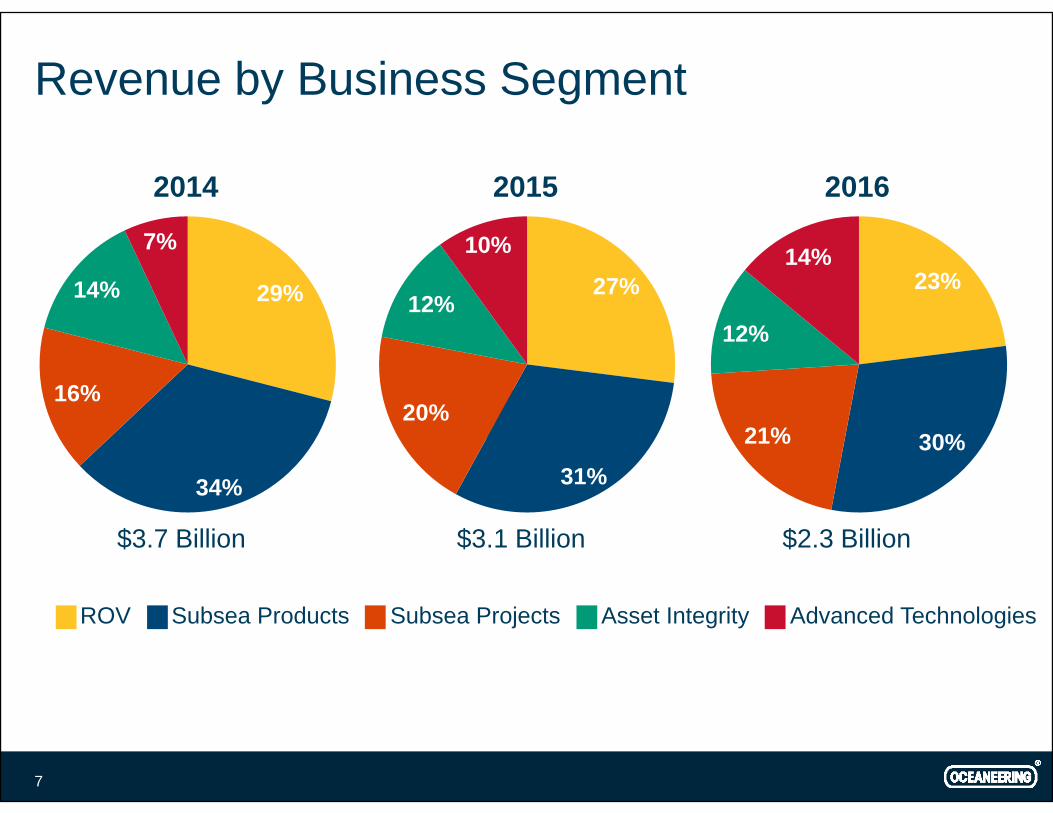
Revenue by Business Segment
2014 2015 2016
29%14%
7%
27%12%
10%23%
14%
16%20%
12%12%
34% 31%
20%30%21%
$3.7 Billion $3.1 Billion $2.3 Billion
ROV Subsea Products Subsea Projects Asset Integrity Advanced Technologies
7

Remotely Operated Vehicles 23%
Revenue Contribution 2016
Flagship of the Oceaneering Franchise
8

Oceaneering ROV Fleet Size – 280 ROVs
350
as of December 31, 2016
350
End
300
nt a
t Per
iod
250
ehic
le C
oun
Ve
2002008 2009 2010 2011 2012 2013 2014 2015 2016*
9
* Retired 39 ROVs in Q3 2016.

Oceaneering ROV Pricing and Fleet Utilization
100%$11 000Revenue / Day on Hire Fleet Utilization
53% Fleet Utilization as of December 31, 2016
80%
90%
100%
$9,000
$10,000
$11,000
Hire
60%
70%
$6,000
$7,000
$8,000
iliza
tion
ue /
Day
on
30%
40%
50%
$3 000
$4,000
$5,000
Flee
t Ut
Rev
enu
10%
20%
$1,000
$2,000
$3,000
0%$02008 2009 2010 2011 2012 2013 2014 2015 2016
10

Floating Rig Demand History
100%300Floaters Contracted % with OII ROVs
Oceaneering 53% Market Share as of December 31, 2016
75%
100%
250
300
d En
d
75%200
I RO
Vs
gs a
t Per
iod
50%
100
150
% w
ith O
I
Floa
ting
Rig
25%50
Con
tract
ed F
0%02014 Q1
2014 Q2
2014 Q3
2014 Q4
2015 Q1
2015 Q2
2015 Q3
2015 Q4
2016 Q1
2016 Q2
2016 Q3
2016 Q4
C
Source: IHS-Petrodata, December 31, 2016
11
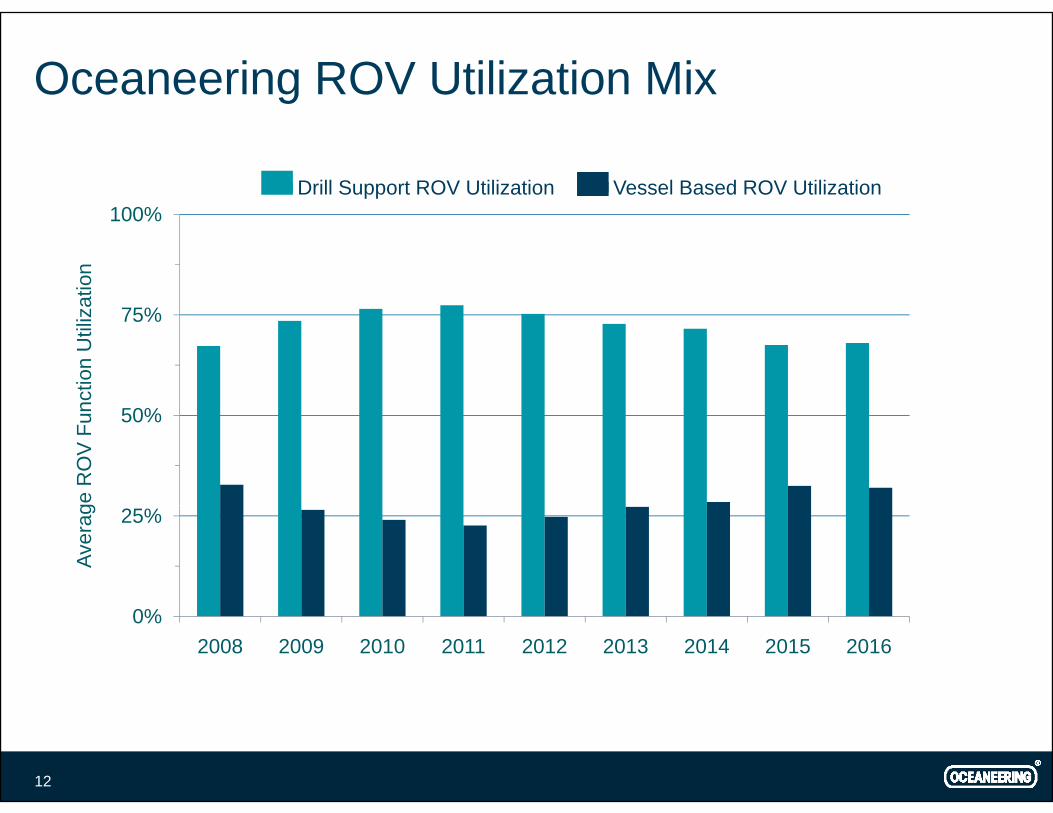
Oceaneering ROV Utilization Mix
100%Drill Support ROV Utilization Vessel Based ROV Utilization
75%
100%
atio
n
75%
nctio
n U
tiliz
50%
ge R
OV
Fun
25%
Aver
ag
0%2008 2009 2010 2011 2012 2013 2014 2015 2016
12

More Focus on Vessel-Based Services
10 ROVs to Heerema Marine Contractors 10 ROVs to Heerema Marine Contractors Providing ROVs and subsea tooling aboard Heerema’s deepwater
construction vessels and semi-submersible crane vessels on aconstruction vessels and semi submersible crane vessels on a global basis through 2020.
8 ROVs to Maersk Supply Services 8 ROVs to Maersk Supply Services Providing ROVs, survey and associated services, including subsea
tooling, engineering, communication and data solutions, to supporttooling, engineering, communication and data solutions, to support Mærsk’s global operations.
13

ROV New Technologies
14

Subsea Products 30%
Manufactured Products
Production Control UmbilicalsS
Revenue Contribution 2016
S i lt S b H d
Supply electric and hydraulic power to subsea trees and inject chemicals into reservoirs and well streams.
Specialty Subsea HardwareField development hardware used to connect production trees to umbilicals and flow lines.Also includes connectors and valves.
Service and Rental
Also includes connectors and valves.
T li & S b W k S tTooling & Subsea Work SystemsSupport drilling, construction, field maintenance, and plugging and abandonment activities.
Support drilling, construction, field maintenance, and plugging and abandonment activities
Installation and Workover Control Systems (IWOCS)
15
abandonment activities.

Subsea Hardware Capex Forecast
$6 000$1 000Subsea Capex, Infield Jan 2017 SS Products Backlog
Backlog at December 31, 2016, $ in millions
$4,800
$6,000
$800
$1,000
xg
$3,600$600
war
e C
apex
ucts
Bac
klog
$2,400$400
bsea
Har
dw
II S
S P
rodu
$1,200$200
SuO
$0$02012 2013 2014 2015 2016 2017F 2018F 2019F 2020F 2021F
Source: Infield Systems, Jan 2017; EPIC covers Capex for subsea trees, templates, manifolds, subsea boosters/compression/separation, umbilicals
16

Subsea Installations Forecast
$1 500500Trees Onstream SSProducts Revenue
$1,200
$1,500
400
500
Mill
ions
am
$900300
enue
, $ in
M
es O
nstre
a
$600200
oduc
ts R
evTre
$300100
OII
SS
Pro
$002012 2013 2014 2015 2016 2017F 2018F 2019F 2020F 2021F
Source: Infield Systems, January 2017
17
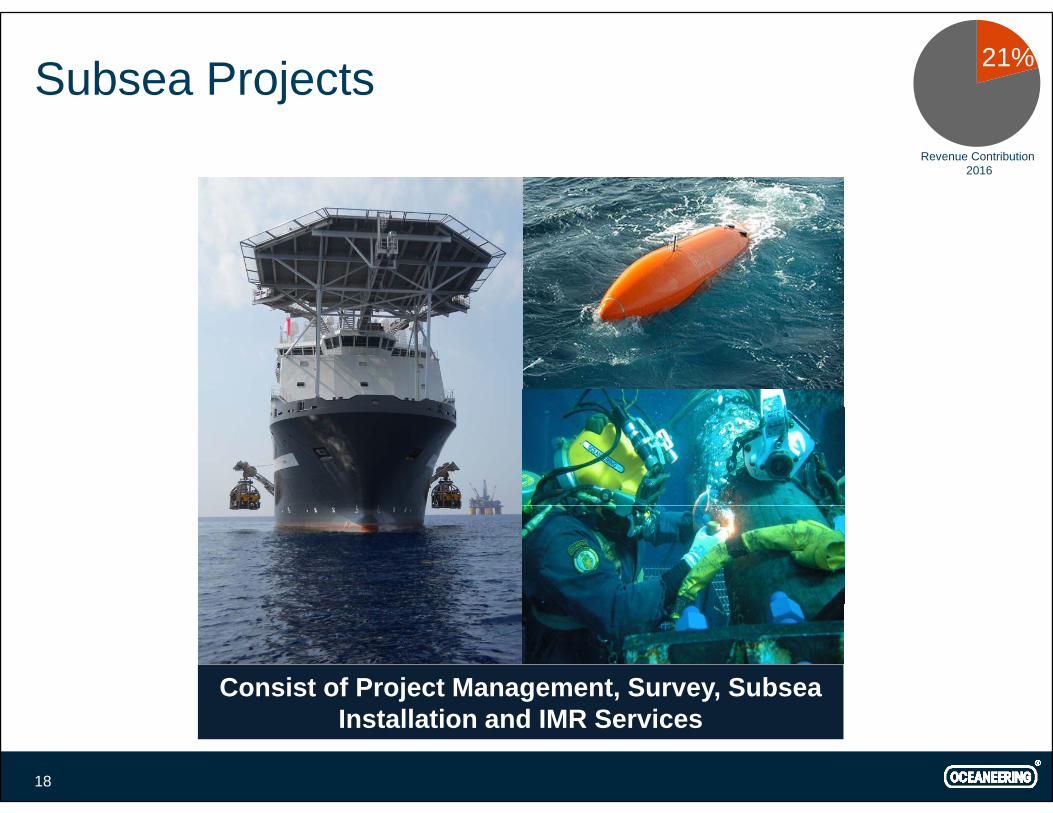
Subsea Projects 21%
Revenue Contribution 2016
Change out photo and replace with
AUVAUV
Consist of Project Management, Survey, Subsea
18
Installation and IMR Services

Subsea Projects Overview
Spot or Contract Location
CharterEnd
Assets Available for this Market
Deepwater Multi-Purpose Supply VesselsContract Location End
3 Owned
*Ocean Intervention Spot GOM N/A*Ocean Intervention
*Ocean Intervention II
*Ocean Evolution (available mid 2017)
SpotSpot N/A
GOMGOM
N/AN/AN/A
1 Chartered on Spot Market
*Ocean Alliance Spot GOM Mar ‘18
2 Chartered with Term2 Chartered with TermOcean Intervention IIIIsland Pride
ContractContract
AngolaIndia
Jul ‘17Nov ‘17
Di i S t V l Diving Support Vessels Survey/AUV Services Global Data Solutions Global Data Solutions
19
* Jones Act Vessel

Strong Balance Sheet and Liquidity
Liquidity at 2016 year end
Capital Sources and Allocations
Liquidity at 2016 year end o $450 million of cash, over $300 million in the U.S. o $500 million undrawn revolving credit facility, $450 million expiring
October 2021October 2021o First debt maturities $30 million in October 2018
Organic capital expendituresOrganic capital expenditureso Expect to range from $90 million to $120 million in 2017
Acquisitions qo Continue to consider investments that augment our service or product
offerings, with more focus on our customers’ OPEX
Di id d Dividendso Quarterly $0.15 per share, sustainable
Consider share repurchases Consider share repurchases
20

Leveraged to Deepwater
Projects take years to develop Projects take years to developProjects take years to develop
Largely oil reservoirs
Projects take years to develop
Largely oil reservoirso With high production flow rates
Well capitalized customer base
o With high production flow rates
Well capitalized customer baseWell capitalized customer baseo ~50% revenue from E&P majors in prior 3 years
Well capitalized customer baseo ~50% revenue from E&P majors in prior 3 years
Investment based on long-term commodity price expectations Investment based on long-term commodity price expectations
21
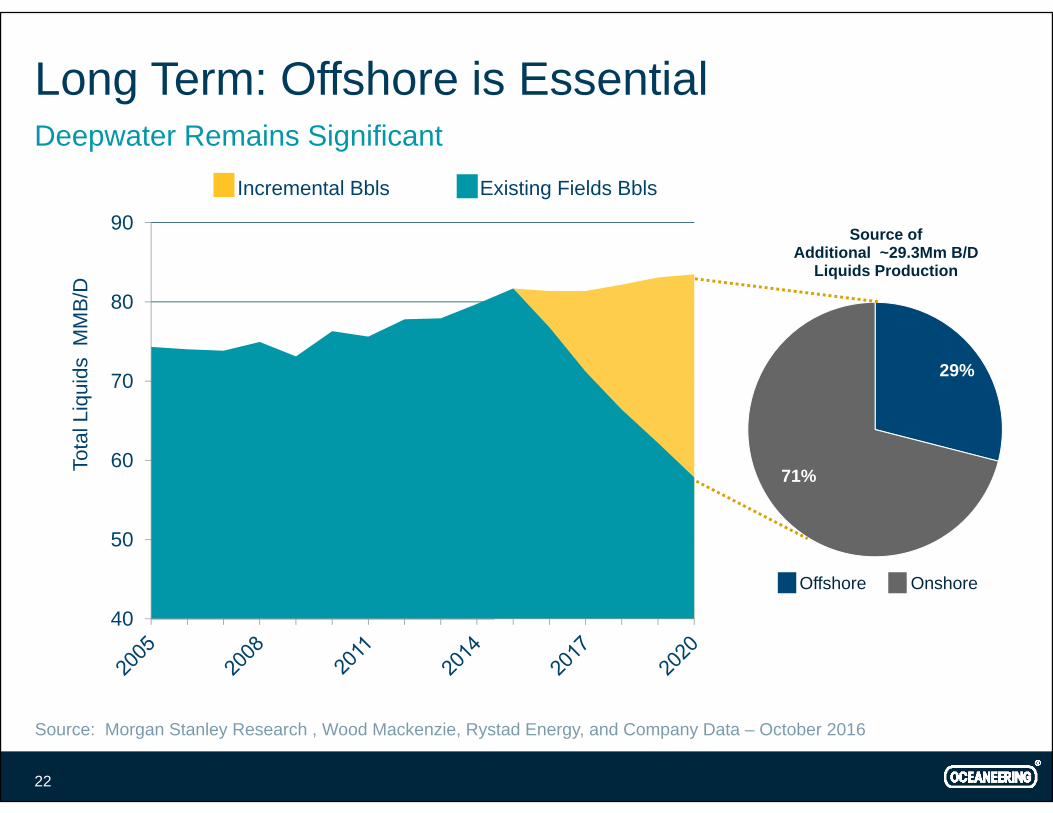
Long Term: Offshore is Essential
Incremental Bbls Existing Fields Bbls
Deepwater Remains Significant
Source of Additional ~29.3Mm B/D
Liquids Production
80
90
B/D
29%70
80
quid
s M
MB
71%60To
tal L
i
Offshore Onshore
50
40
Source: Morgan Stanley Research , Wood Mackenzie, Rystad Energy, and Company Data – October 2016
22

2017 Full Year and First Quarter Outlook
Challenging market continues Challenging market continues
Aligned our operations with anticipated level of activity
P j ti f th d li i fit bilit f th f ll 2017 Projecting a further decline in profitability for the full year 2017
o Expecting marginally profitable at the operating income level
Forecasting 1Q 2017 considerably lower than adjusted 4Q 2016
o Sequentially lower operating income mainly from Asset Integrity, and higher Unallocated Expenses
o Expect a discrete additional income tax provision in accordance with a new accounting standard associated with our share based incentive plan
23

Conclusion
Longer term deepwater is still critical to reserve replenishment Longer term, deepwater is still critical to reserve replenishment
Global provider in all phases of offshore oilfield life cycle, with p p ya deepwater focus
Further differentiate with integrated solutions Further differentiate with integrated solutions
Strong liquidity and cash flowStrong liquidity and cash flow
Maintain or grow our market positions
Emerge from the current cycle ready for the upturn
24


EBITDA Reconciliation to Net Income
Earnings before interest, taxes, depreciation and amortization (EBITDA) is a non-GAAP financial measurement. Oceaneering’s management uses EBITDA because we believe that this measurement is a widely accepted financial indicator used by investors and
l t t l d i th b i f ti f d th t thi t b d b
(USD in millions)
analysts to analyze and compare companies on the basis of operating performance, and that this measurement may be used by some investors and others to make informed investment decisions. You should not consider EBITDA in isolation from or as a substitute for net income or cash flow measures prepared in accordance with generally accepted accounting principles or as a measure of profitability or liquidity. EBITDA calculations by one company may not be comparable to EBITDA calculations made by another company. The following table provides a reconciliation between net income (a GAAP financial measure) and EBITDA (a non-GAAP financial measure) for Oceaneering’s historical and projected results on a consolidated basis for the periods indicated:
Period Ended 2011 2012 2013 2014 2015 2016
for Oceaneering s historical and projected results on a consolidated basis for the periods indicated:
Net Income $ 235.7 $ 289.0 $ 371.5 $ 428.3 $ 231.0 $ 24.6
Depreciation & Amortization 151.2 176.5 202.2 229.8 241.2 250.2
Subtotal 386.9 465.5 573.7 658.1 472.2 274.8
Interest Expense/Income, Net 0.2 2.3 1.7 4.4 23.4 20.3
Income Tax Expense 102.2 132.9 170.8 195.2 105.3 18.8
EBITDA $ 489.3 $ 600.7 $ 746.2 $ 857.7 $ 600.9 $ 313.9
26

Free Cash Flow (Through the Cycle)
“Free Cash Flow” (FCF) is a non-GAAP financial measurement. FCF represents cash flow provided by operating activities less organic capital expenditures (i e purchases of property and equipment other than those in business
(USD in millions)
activities less organic capital expenditures (i.e., purchases of property and equipment other than those in business acquisitions. Management believes that this is an important measure because it represents funds available to reduce debt and pursue opportunities that enhance shareholder value, such as making acquisitions and returning cash to shareholders through dividends or share repurchases.
Period Ended 2011 2012 2013 2014 2015 2016
Net Income $ 235.7 $ 289.0 $ 371.5 $ 428.3 $ 231.0 $ 24.6
Depreciation & Amortization 151.2 176.5 202.2 229.8 241.2 250.2
Other Changes in Cash ProvidedOther Changes in Cash Provided by Operating Activities (98.3) (27.7) (42.3) 63.7 88.2 65.7
Cash Provided by Operating Activities 288.6 437.8 531.4 721.8 560.4 340.5Purchases ofPurchases of Property & Equipment (235.0) (300.6) ( 382.5) (386.9) (200.0) (112.4)
Free Cash Flow $ 53.5 $ 137.2 $ 148.9 $ 334.9 $ 360.4 $ 228.1
27

Oceaneering ROV Leading Market Position
Ownership Drill Support Market Share
Remotely Operated Vehicles
Ownership pp
28028%
OII
8053%
Subsea 7FugroDOF SubseaC-InnovationsHelixSaipemTMTTechnippIKM GroupOtherWorldwide Fleet
1010 Vehicles*151 Floating Rigs Contracted**
Source: *OII Estimates - December 2016; **IHS Petrodata and OII Estimates – December 31, 2016
28

Oceaneering ROV Fleet – 280 ROVs
100
Geographic Profile – December 31, 2016
88
7280
90
100
53
72
50
60
70
OV
s
2229
30
40
50
RO
2216
10
20
0GOM Africa North
SeaBrazil Asia/Pac Other
Other includes Canada, Mexico, and the Middle East.
29
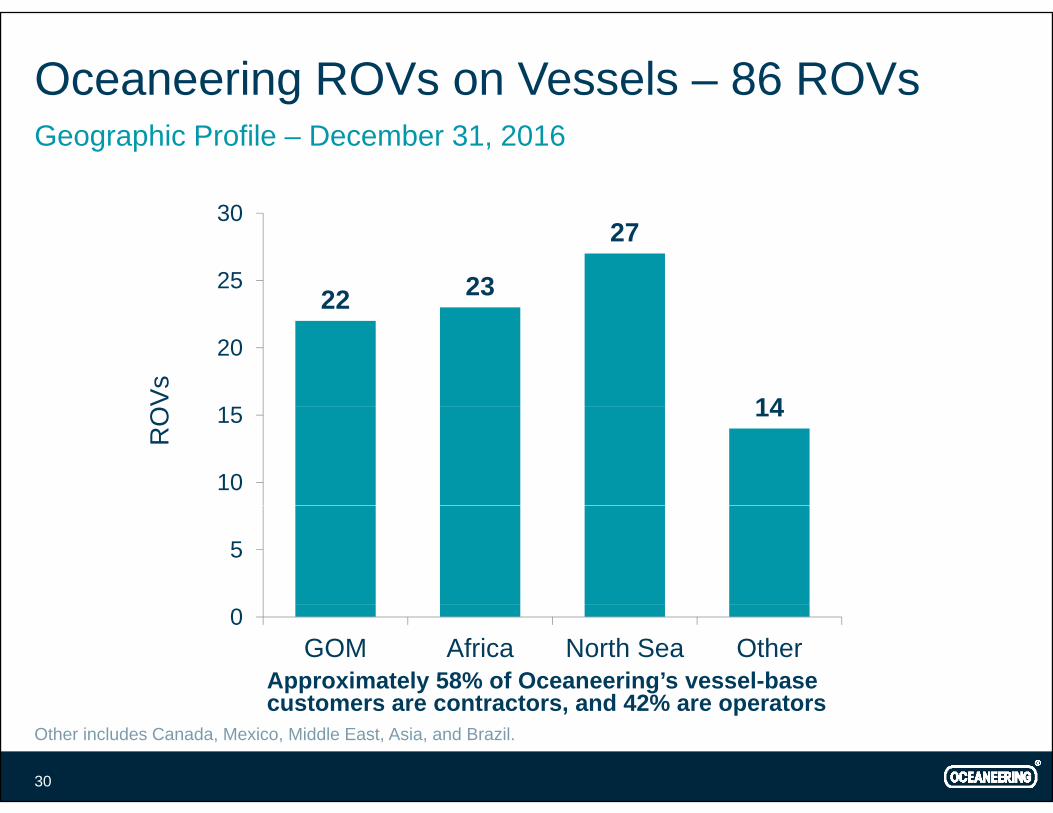
Oceaneering ROVs on Vessels – 86 ROVs
30
Geographic Profile – December 31, 2016
22 23
27
25
30
22
1415
20
Vs
14
10
15
RO
5
0GOM Africa North Sea Other
Approximately 58% of Oceaneering’s vessel-base customers are contractors and 42% are operators
Other includes Canada, Mexico, Middle East, Asia, and Brazil.
30
customers are contractors, and 42% are operators

Investor Relations ContactInvestor Relations Contact
Suzanne SperaSuzanne SperaDirector, Investor [email protected]
31