rocky boy’s reservation - lmi.mt.gov > home · sales and office occupations 182 182 natural...
TRANSCRIPT
Rocky Boy’sReservationDemographic and Economic Information
Revised October 2013
Photo Courtesy of Suzie and Rick Graetz
Chippewa Cree Tribe31 Agency Square
PO Box 544Box Elder, MT 59521
Phone: (406) 395-5705 | Fax: (406) 395-5702www.chippewacree.org

2
Rocky Boy’s Reservation
The Rocky Boy’s Reservation, home to the Chippewa Cree Tribe, encompasses nearly 130,000 acres in north central Montana. Located nearly 50 miles south of the Canadian border, the reservation area comprises a wide range of landscapes from rolling high-plains grasslands to the subalpine mountains of the Bear Paw. The major communities within the reservation include Box Elder, Rocky Boy Agency, Azure, Bonneau, Parker School, Saint Pierre and Sangrey. Major highway access is through U.S. Highway 87 (north/south) and U.S. Highway 2 (east/west). Air travelers will take pleasure in viewing the beautiful landscape on the way from the Havre City-County Airport, Great Falls International Airport, Malta Airport, and Cut Bank Municipal airport.
Approximately 60 percent of over 6,000 enrolled Chippewa Cree tribal members reside on the reservation. The name “Rocky Boy” was derived from the name of a leader of a band of Chippewa Indians. It actually meant “Stone Child,” but it was not translated correctly and “Rocky Boy” evolved. The tribe calls itself “Ne Hiyawak,” meaning “those who speak the same language.”
The Chippewa Cree Business Council, headquartered in Rocky Boy Agency, governs the Tribe. It comprises nine elected members representing the reservation at large and includes the Chairman and Vice-Chairman. Entities interested in doing business with the Chippewa Cree Tribe or on the reservation should engage the Office of the Chairman. Visitors should be mindful of tribal protocol, laws and regulations. Interested business parties are encouraged to become familiar with the Chippewa Cree Planning and Development Office, and the Chippewa Cree Tribal Employment Rights Ordinance (TERO) Office. Additional information regarding the tribal government is available online at www.chippewacree.org.
In 2012, the Chippewa Cree Business Council adopted the Model Tribal Secured Transaction Act, a set of codified rules that govern lender-borrower transactions and facilitate the flow of credit on the Rocky Boy’s Reservation. A Uniform Commercial Code Compact signed with the Montana Secretary of State’s Office established a joint sovereign filing system for lenders to perfect security interests in personal property collateral on the reservation. A Tribal Probate Code has also been established to simplify the probate process. Business ventures of the Tribe include Chippewa Cree Construction Company, Plain Green Financial, Northern Winz Casino, and the Dry Fork Farm and Ranch. Major employers
3
on the reservation are Stone Child College and Rocky Boy Schools, which are compacted, the tribal government, Chippewa Cree Housing Authority, Gramma’s Market, and the Rocky Boy Health Board. Small business is a growing sector on the reservation.
The Chippewa Cree Multi-Purpose Building hosts employment activities such as certifications, trainings, job fairs, and tribal member businesses activities. The Stone Child College provides post-secondary educational programs to prepare students for meaningful employment through degrees, certificates and continuing education, while integrating the Chippewa Cree language, culture, and history. The average annual college enrollment is over 400 students. Additional information regarding the tribal college services is available online at www.stonechild.edu.
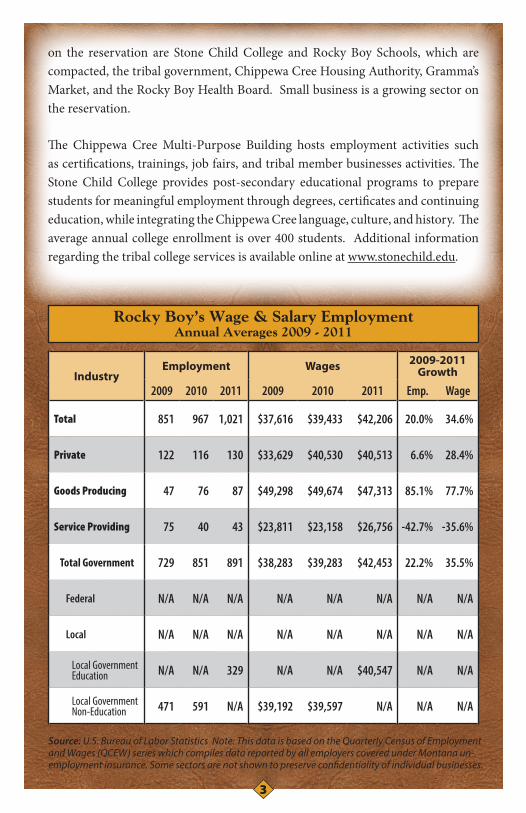
Source: U.S. Bureau of Labor Statistics Note: This data is based on the Quarterly Census of Employment and Wages (QCEW) series which compiles data reported by all employers covered under Montana un-employment insurance. Some sectors are not shown to preserve confidentiality of individual businesses.
Rocky Boy’s Wage & Salary EmploymentAnnual Averages 2009 - 2011
IndustryEmployment Wages 2009-2011
Growth
2009 2010 2011 2009 2010 2011 Emp. Wage
Total 851 967 1,021 $37,616 $39,433 $42,206 20.0% 34.6%
Private 122 116 130 $33,629 $40,530 $40,513 6.6% 28.4%
Goods Producing 47 76 87 $49,298 $49,674 $47,313 85.1% 77.7%
Service Providing 75 40 43 $23,811 $23,158 $26,756 -42.7% -35.6%
Total Government 729 851 891 $38,283 $39,283 $42,453 22.2% 35.5%
Federal N/A N/A N/A N/A N/A N/A N/A N/A
Local N/A N/A N/A N/A N/A N/A N/A N/A
Local Government Education N/A N/A 329 N/A N/A $40,547 N/A N/A
Local Government Non-Education 471 591 N/A $39,192 $39,597 N/A N/A N/A

4
American Indian and Total Population forRocky Boy’s Reservation and Related Areas
Source: U.S. Census Bureau n/a = Not available
CDP = Census designated places. CDPs are delineated for each decennial census as the statistical counterparts of incorporated places. CDPs are delineated to provide data for settled concentrations of population that are identifiable by name but are not legally incorporated under the laws of the state in which they are located. The boundaries usually are defined in cooperation with local and tribal officials. These boundaries, which usually coincide with visible features or the boundary of an adjacent incorporated place or other legal entity boundary, have no legal status, nor do these places have officials elected to serve traditional municipal functions.
Rocky Boy’s Reservation - Educational AttainmentPopulation 25 Years and Older
Source: U.S. Census Bureau, 2007-2011 American Community Survey 5-Year Estimates
Educational AttainmentAmerican Indian Total
PopulationMale Female Total %
Less than high school diploma 27.4% 16.0% 21.6% 20.6%
High school graduate, GED, or alternative 24.0% 18.4% 21.2% 22.8%
Some college or associate's degree 42.2% 52.9% 47.7% 45.1%
Bachelor's degree or higher 6.3% 12.6% 9.5% 11.6%
DRAFT
American Indian Population
Census % Change Estimate % Change
Geography 2000 2010 2000-2010 2011 2012 2011-2012Rocky Boy's Reservation 2,578 3,221 24.94% n/a n/a n/a Chouteau County 860 1,270 47.67% 1,235 1,198 -3.00% Boneau CDP 185 367 98.38% n/a n/a n/a Hill County 2,907 3,511 20.78% 3,545 3,612 1.89% Agency CDP 241 278 15.35% n/a n/a n/a Azure CDP 344 336 -2.33% n/a n/a n/a Parker School CDP 303 334 10.23% n/a n/a n/a St. Pierre CDP 282 343 21.63% n/a n/a n/a Sangrey CDP 252 299 18.65% n/a n/a n/a
Total Population
Census % Change Estimate % ChangeGeography 2000 2010 2000-2010 2011 2012 2011-2012Rocky Boy's Reservation 2,676 3,323 24.18% n/a n/a n/a Chouteau County 6,062 5,813 -4.11% 5,793 5,904 1.92% Boneau CDP 190 380 100.00% n/a n/a n/a Hill County 16,605 16,096 -3.07% 16,397 16,366 -0.19% Agency CDP 253 286 13.04% n/a n/a n/a Azure CDP 352 340 -3.41% n/a n/a n/a Parker School CDP 324 355 9.57% n/a n/a n/a St. Pierre CDP 289 350 21.11% n/a n/a n/a Sangrey CDP 263 306 16.35% n/a n/a n/a

5
Rocky Boy’s Reservation - Distribution of Incomeby Family and Household, 5-Year Estimates 2006-2010
Household Income: This includes the income of the householder and all other individuals 15 years or older in the household, whether they are related to the householder or not. Because many households consist of only one person, average household income is usually less than average family income.
Family Income: In compiling statistics on family income, the incomes of all members 15 years old and over related to the householder are summed and treated as a single amount.
Source: U.S. Census Bureau, 2007-2011 American Community Survey 5-Year Estimates
Rocky Boy’s Reservation* - Occupation by GenderEmployed Civilian Population 16 Years and Over
Occupation American Indian Total
Total - All Occupations 913 969Total Male 415 431
Management, business, science, and arts occupations 108 113Service occupations 89 89Sales and office occupations 55 55Natural resources, construction, and maintenance occupations 119 119Production, transportation, and material moving occupations 44 55
Total Female 498 538Management, business, science, and arts occupations 161 187Service occupations 142 156Sales and office occupations 182 182Natural resources, construction, and maintenance occupations 13 13Production, transportation, and material moving occupations 0 0
*Includes both Rocky Boy’s Reservation and Off-Reservation Trust Land, MTSource: 2007-2011 American Community Survey 5-Year Estimates

6
Source: U.S. Census Bureau, American Community Survey 2007 to 2011
Rocky Boy’s Reservation - Labor Force StatisticsThe labor force statistics come from three separate sources. The dissimilar numbers result from the differing definitions and statistical techniques used by each source. These differences are explained below:
Source Year Labor Force Employed Unemp. Unemp.
Rate
MT Dept. of Labor & Industry 2012 1,207 1,006 201 16.7%
• Statistics represent labor characteristics of the reservation, not the tribe.
• Labor Force definition• Civilian, non-institutional population 16 years and older• The sum of Employment and Unemployment
• Employment definition• Did any work as paid employees • Worked in their own business, profession, or farm• Worked 15 hours or more as unpaid workers in a family owned enterprise
• Unemployment definition• Have not worked during monthly survey period (usually the week of the 12th of the month)• Available for work • Actively seeking a job during last four weeks
• Unemployment Rate equals the number Unemployed divided by number in the Labor Force
Source Year Labor Force Employed Unemp. Unemp.
Rate
U.S. Census Bureau 2007-11 1,158 969 189 16.3%
• Statistics represent labor characteristics of the reservation, not the tribe.
• Uses the same definitions for Labor Force, Employment, and Unemployment as U.S. Bureau of Labor Statistics
• From the American Community Survey
• Rate reflects the five-year estimates from the years 2007 to 2011
Source Year Labor Force Employed Unemp. Unemp.
Rate
U.S. Bureau of Indian Affairs 2005 2,030 652 1,378 67.9%
• Statistics represent labor characteristics of the tribe, not the reservation.
• Labor Force definition• Number of tribal members between 16 and 64 years old• Available for work • Not disabled or incarcerated
• Employment definition
• Tribal members working for money• Unemployment calculated by subtracting Employment from Labor Force
Housing American Indian Total
Owner Occupied 46.2% 44.3%
Rental Occupied 53.8% 55.7%
Owner and Renter Occupied Housing Units

7
(D): Not Disclosable Source: U.S. Department of Agriculture, National Agricultural Statistics Service
Rocky Boy’s Reservation - Agricultural Statistics2007 Census of Agriculture
2002 2007
All Farms Farms Operated by American Indians All Farms Farms Operated by
American IndiansFarms
Farms: (number) 42 39 100 97Land in farms (acres) 105,193 93,365 98,976 91,203Average size of farms (acres) 2,505 2,394 990 940
Farms by size: (number)Less than 1,000 acres 29 29 91 901,000 acres or more 13 10 9 7
Farms by value of products sold and government payments received: (number)Less than $100,000 39 37 95 93$100,000 or more 3 2 5 4
Farms by type of organization: (number)Family, Individual, Partnership 35 34 94 92Corporation, Cooperative, Trust 7 5 6 5
Livestock Inventory and Crops HarvestedLivestock and Poultry Inventory (number)
Cattle and calves 2,213 2,213 2,996 (D)Hogs and pigs (D) (D) - -Sheep and lambs - - 3 3Horses and ponies 347 347 530 (D)Bison (D) (D) - -Chickens (layers and broilers) 0 0 32 32
Crops Harvested (acres)Corn for grain - - - -Corn for silage or greenchop - - - -Wheat for grain, All 6,473 (D) (D) (D)Winter wheat for grain - - (D) (D)Durum wheat for grain (D) - - -Spring wheat for grain (D) (D) 3,441 (D)Barley for grain (D) (D) - -Oats for grain (D) (D) 680 680Sunflower seed, All - - - -Soybeans for beans - - - -Hay, haylage, grass silage 2,227 2,227 2,735 (D)
Operator DemographicsPrimary occupation: (number)
Farming 24 19 35 32Other 30 25 78 78
Place of residence: (number)On farm operated 47 39 76 73Not on farm operated 7 5 37 37
Years on present farm: (number)Less than 10 years 22 17 14 1410 years or more 32 27 99 96
Age group: (number)Under 55 years 40 32 60 6055 years and over 14 12 53 50
Average age of operators 50.4 50.9 54.8 54.4

Governor’s Office of Indian AffairsState Capitol Building, Room 202 - P. O. Box 200801 - Helena, Montana 59620Ph: (406) 444-3702 - Email: [email protected] - http://tribalnations.mt.gov
Census & Economic Information CenterP. O. Box 200505, Helena, MT 59620-0505Ph: (406) 841-2740 - Email: [email protected] - www.ceic.mt.gov
State Tribal Economic Development CommissionP. O. Box 200505, Helena, MT 59620-0505Ph: (406) 841-2821 - www.tribal.mt.gov
Research & Analysis BureauP. O. Box 1728 - Helena, MT 59624-1728Ph: (406) 444-2430 or (800) 541-3904 Email: [email protected] - www.ourfactsyourfuture.org
All Tribal Demographic and Economic Information Flyers are available online at:http://www.ourfactsyourfuture.org/?PAGEID=67&SUBID=121.
Produced collaboratively by the State of Montana Governor’s Office of Indian Affairs, the Department of Commerce, the Department of Labor and Industry, and the Chippewa Cree Indian Community.
2,000 copies of this public document were published at an estimated cost of $0.25 per copy, for a total cost of $509.00 which includes $509.00 for printing and $0.0 for distribution.
Source: U.S. Census Bureau, Census 2010
Rocky Boy’s Reservation - Population PyramidPercent of Total Reservation Population by Age Group