rocksat 2010 final report template - nasa · rocksat-c 2015 final report . ... across the state of...
TRANSCRIPT
West Virginia University July 2015 RockSat-C 2015
RockSat-C 2015 Final Report
WV Rocketeers
Spaceflight through Earth’s Atmosphere and Ionosphere
Team: Greg Lusk,6 Matt Gramlich,1 Andrew Tiffin,2 Eric Kramer,2 Seth Baker,3 Matt Haldeman,3 Tyler Bonnett,3 Rachelle Huff,4 Andy Shtanko,4 Zack Dixon,5
Alex Flores,5 Josh Waggoner1
Mentors: Steven Hard,1,7 Dimitris Vassiliadis,1 Tracey Delaney,2 Jon Saken,3 Ralph
Wojtowicz,4 Farshid Zabihian5
(1) West Virginia University (2) West Virginia Wesleyan College
(3) Marshall University (4) Shepherd University
(5) West Virginia University Institute of Technology (6) Fairmont State University
(7) NASA IV&V
July 2015
West Virginia University July 2015 RockSat-C 2015
1.0 Mission Statement
The mission was to embark on a collaborative effort with academic institutions across the state of West Virginia for development of knowledge and practical experience in designing, building, launching, and operating space payloads
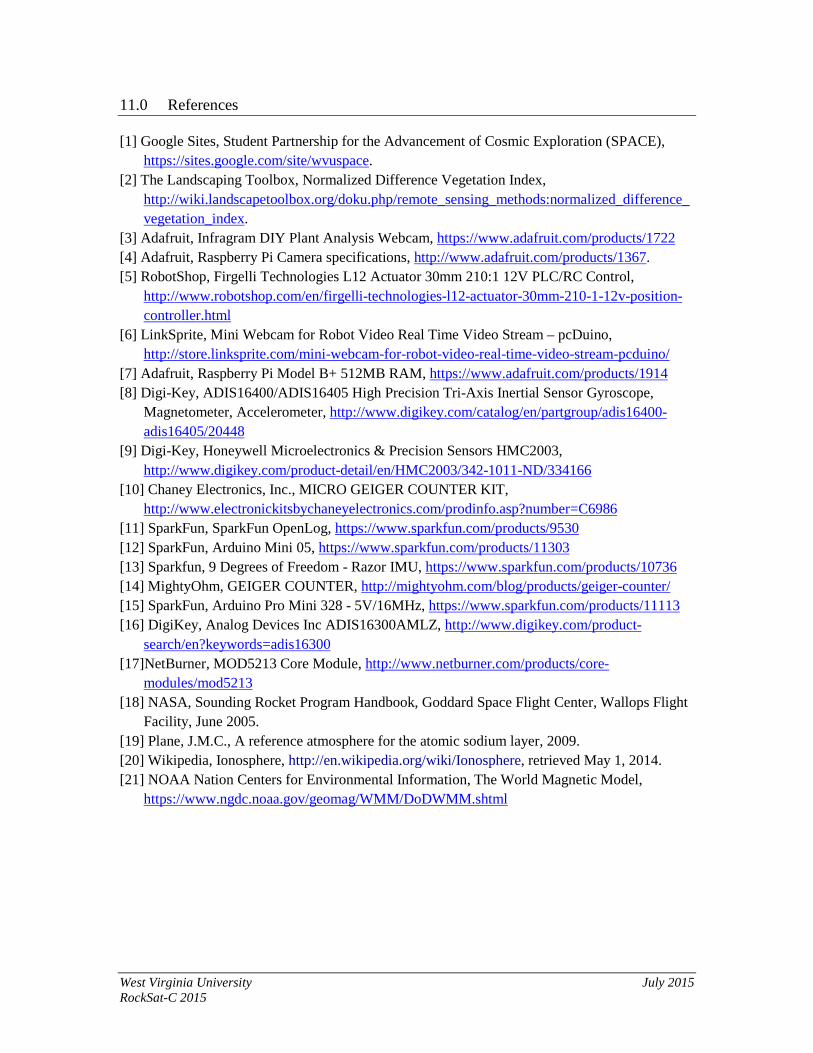
The goal of the 2015 RockSat-C project is to involve students from West Virginia University (WVU), Marshall University (MU), West Virginia Institute of Technology (WVU-Tech), West Virginia Wesleyan College (WVWC), Fairmont State University (FSU), and Shepherd University (SU) in building experiments to operate in and measure properties of the space environment and flight variables of the launch vehicle. The experiments will be launched on a two-stage Terrier-Improved Orion sounding rocket from NASA’s Wallops Flight Facility. The target altitude is ~120km, but any altitude above 100km should be sufficient (Appendices - Fig. 1).
The first objective was to measure flight dynamics from several different Inertial Measurement Units (IMUs) to gain a redundant set of flight dynamics data for comparison and reliability analysis. Each school participating in the WV Collaboration has incorporated an IMU in their SPACE [1] experiment. In some cases, two types of IMUs are incorporated in a single experiment to analyze the feasibility of using an inexpensive COTS IMU versus a higher resolution COTS IMU. This is beneficial for the CubeSat community through the development of a low-cost attitude estimation solution.
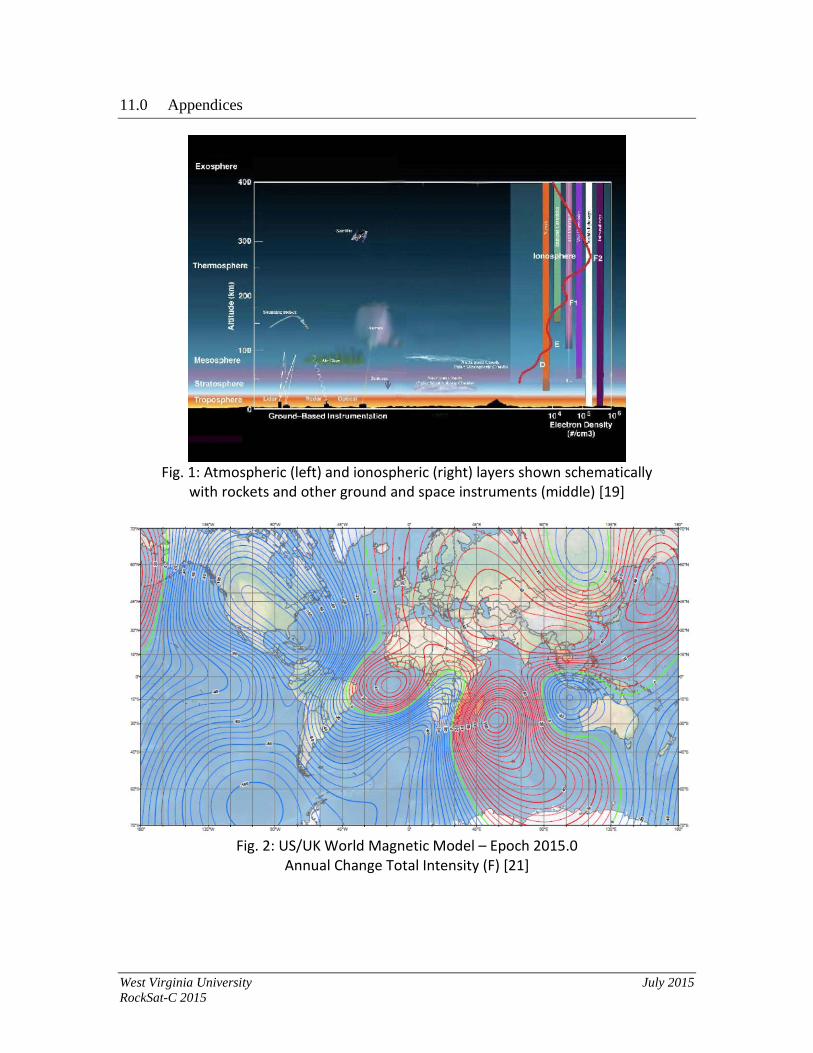
An important physical property of the space environment is the Earth’s magnetic field. The magnitude of the B-field decreases approximately as a power law with distance from the Earth’s center. The magnetic field is important in shaping the trajectories of charged particles such as ions and electrons. Models of the magnetic field are available from the National Oceanic and Atmospheric Administration (NOAA) and other sources (Appendices - Fig. 2).
The second objective of this mission is to measure the magnetic field in the xyz axes during flight. Each of the experiments in the WV Collaboration will measure the Earth’s field as a function of height and compare with the current NOAA model in future research efforts. Understanding the Earth’s magnetic field is important for many industries including communication, GPS satellites, navigation, and customer electronic devices.
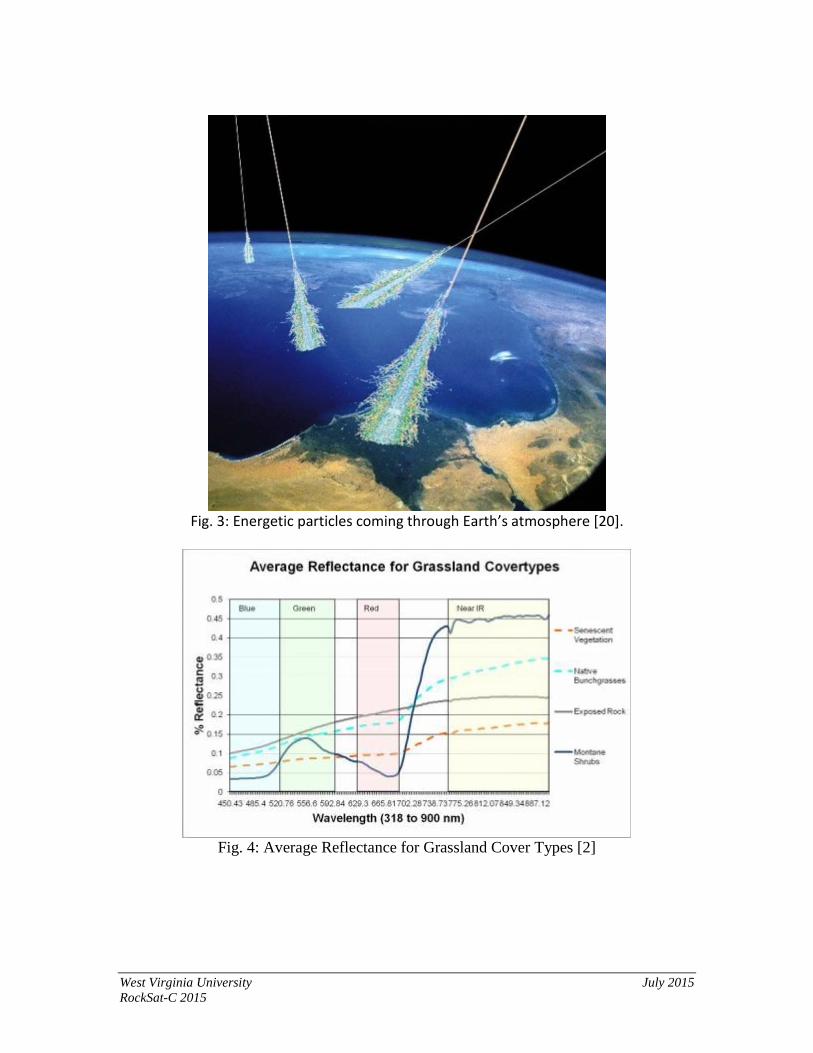
A third objective was set to measure radiation of charged particles in the ionosphere as a function of altitude. Energetic electrons coming into the ionosphere from higher atmospheric layers can be measured using Geiger counters and similar detectors. While plasma electrons have energies of several electron-volts, energetic electrons have energies of several kilo-electron-volts or higher. A schematic of higher energy particles is shown in Appendices - Fig. 3.
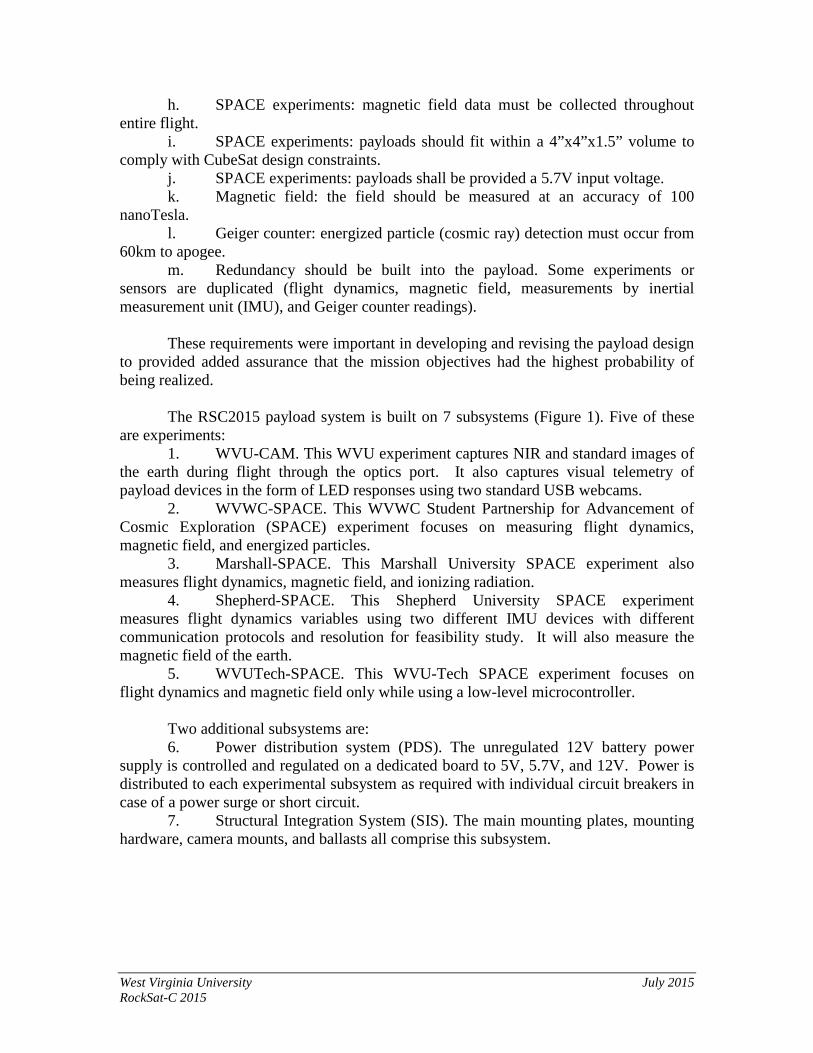
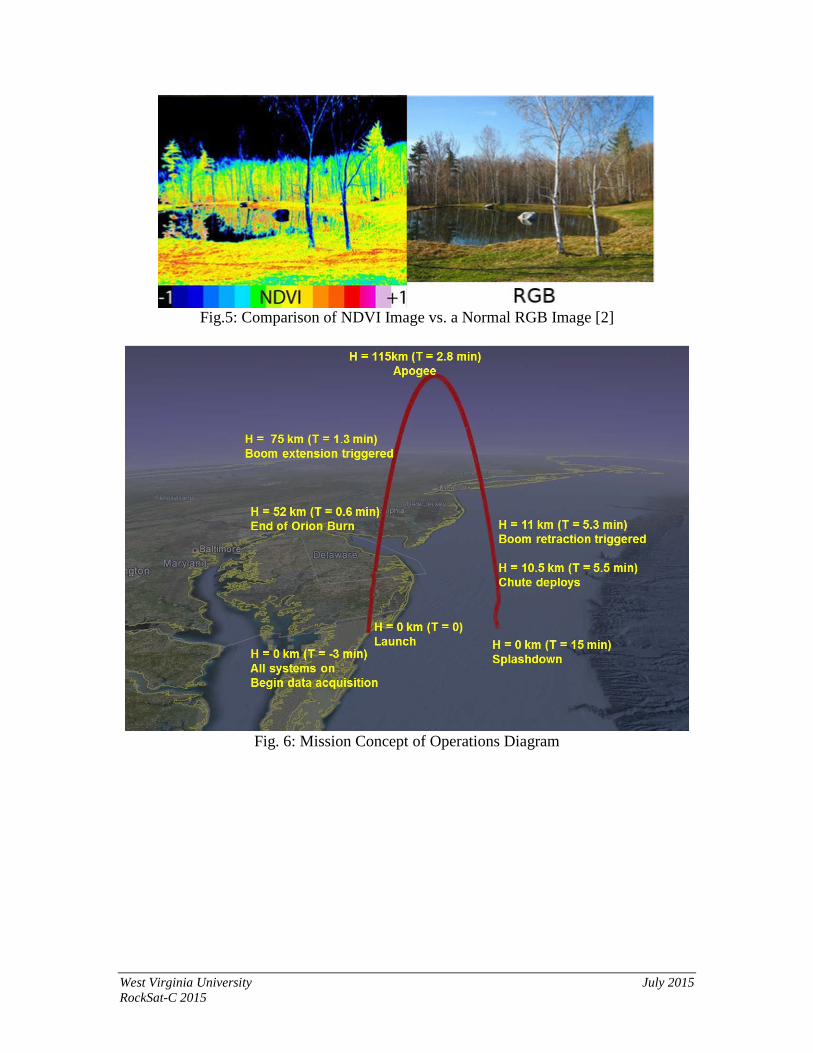
The final objective for the RSC2015 mission is to develop a Normalized Difference Vegetation Index (NDVI) [2] of the Northern Virginia coastline and to gather visual telemetry of the payload experiments using on-board cameras located in strategic positions. A NDVI mapping of an image can be performed using the following equation [2]:
West Virginia University July 2015 RockSat-C 2015
where the NIR image pixel is taken from a special camera outfitted with a filter to collect near-infrared (NIR) light only and the RED pixel is taken from the RGB value of the image pixel taken from a standard camera lens. The concept is that greenery reflects more NIR light than shrubbery, tree bark, and rocks (Appendices – Fig. 4). By creating an NDVI map, the higher areas of NIR reflection intensity can be seen (Appendices – Fig. 5).
In summary, the mission of the RockSat 2014 project is to understand several properties of the space and terrestrial environment and by building experiments to measure and illustrate these properties. Specifically, we expect to learn about the physical environment, how low-cost flight components withstand this harsh environment, and about the techniques and challenges associated with Earth-viewing from space.
2.0 Mission Requirements and Description
In order to reach the mission goals presented in the previous section, several requirements for the rocket and the payload must be met.
First we present the requirements for the overall mission and payload: a. The mission trajectory should cover a part of the upper atmosphere above
60 km. The mission should spend at least 2 minutes above 60 km. b. The payload should fit in the provided volume. We have chosen to use
half a canister (9” in diameter and approximately 4.5” height). c. Power is not provided by the rocket so we must use batteries to power the
payload. In accordance with the RockSat-C User’s Guide, no rechargeable lithium-ion cells may be used on site so the power is supplied by disposable lithium batteries. Also, no high-voltage sources will be used in this payload other than that contained within the Geiger counter device.
d. The payload must be electrically isolated from the canister. e. An optical port is required for the cameras.
The following are requirements specifically for individual experiments and other
subsystems: a. All data-acquiring experiments: the acquisition rate should be 10 Hz or
higher. b. All data-acquiring experiments: a data collection system is required to
store the measurements (in-flight). c. Imagine experiment: Camera must be able to view earth’s surface and
configurable to take video at 30 fps or higher. d. Imaging experiment: the cameras need to be small enough to fit in the
required canister and access to an 1.5”-diameter optical port on the rocket’s body. e. Imagine experiment: additional camera must be positioned to view
necessary telemetry information and provided adequate lighting. f. Imagine experiment: cameras must mount to a solid structure to provide
adequate support of the lenses in-flight. g. SPACE experiments: flight dynamics data must be collected throughout
entire flight.
West Virginia University July 2015 RockSat-C 2015
h. SPACE experiments: magnetic field data must be collected throughout entire flight.
i. SPACE experiments: payloads should fit within a 4”x4”x1.5” volume to comply with CubeSat design constraints.
j. SPACE experiments: payloads shall be provided a 5.7V input voltage. k. Magnetic field: the field should be measured at an accuracy of 100
nanoTesla. l. Geiger counter: energized particle (cosmic ray) detection must occur from
60km to apogee. m. Redundancy should be built into the payload. Some experiments or
sensors are duplicated (flight dynamics, magnetic field, measurements by inertial measurement unit (IMU), and Geiger counter readings).
These requirements were important in developing and revising the payload design
to provided added assurance that the mission objectives had the highest probability of being realized.
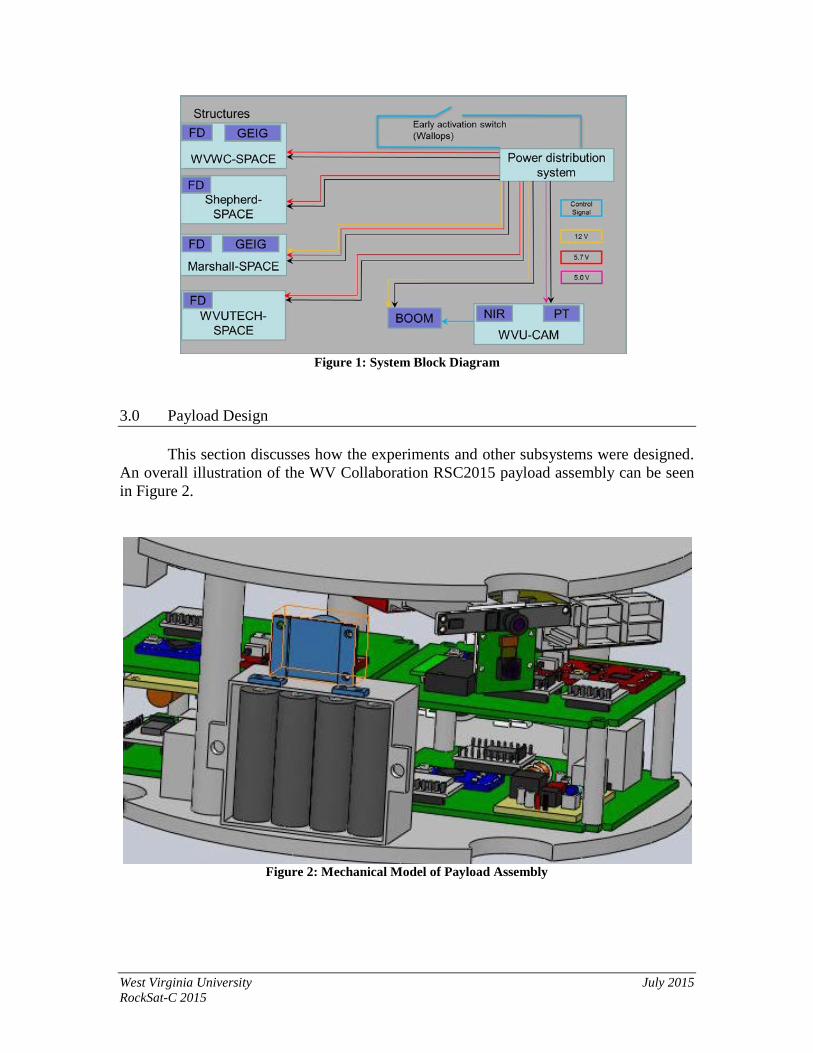
The RSC2015 payload system is built on 7 subsystems (Figure 1). Five of these
are experiments: 1. WVU-CAM. This WVU experiment captures NIR and standard images of
the earth during flight through the optics port. It also captures visual telemetry of payload devices in the form of LED responses using two standard USB webcams.
2. WVWC-SPACE. This WVWC Student Partnership for Advancement of Cosmic Exploration (SPACE) experiment focuses on measuring flight dynamics, magnetic field, and energized particles.
3. Marshall-SPACE. This Marshall University SPACE experiment also measures flight dynamics, magnetic field, and ionizing radiation.
4. Shepherd-SPACE. This Shepherd University SPACE experiment measures flight dynamics variables using two different IMU devices with different communication protocols and resolution for feasibility study. It will also measure the magnetic field of the earth.
5. WVUTech-SPACE. This WVU-Tech SPACE experiment focuses on flight dynamics and magnetic field only while using a low-level microcontroller.
Two additional subsystems are: 6. Power distribution system (PDS). The unregulated 12V battery power
supply is controlled and regulated on a dedicated board to 5V, 5.7V, and 12V. Power is distributed to each experimental subsystem as required with individual circuit breakers in case of a power surge or short circuit.
7. Structural Integration System (SIS). The main mounting plates, mounting hardware, camera mounts, and ballasts all comprise this subsystem.
West Virginia University July 2015 RockSat-C 2015
Figure 1: System Block Diagram
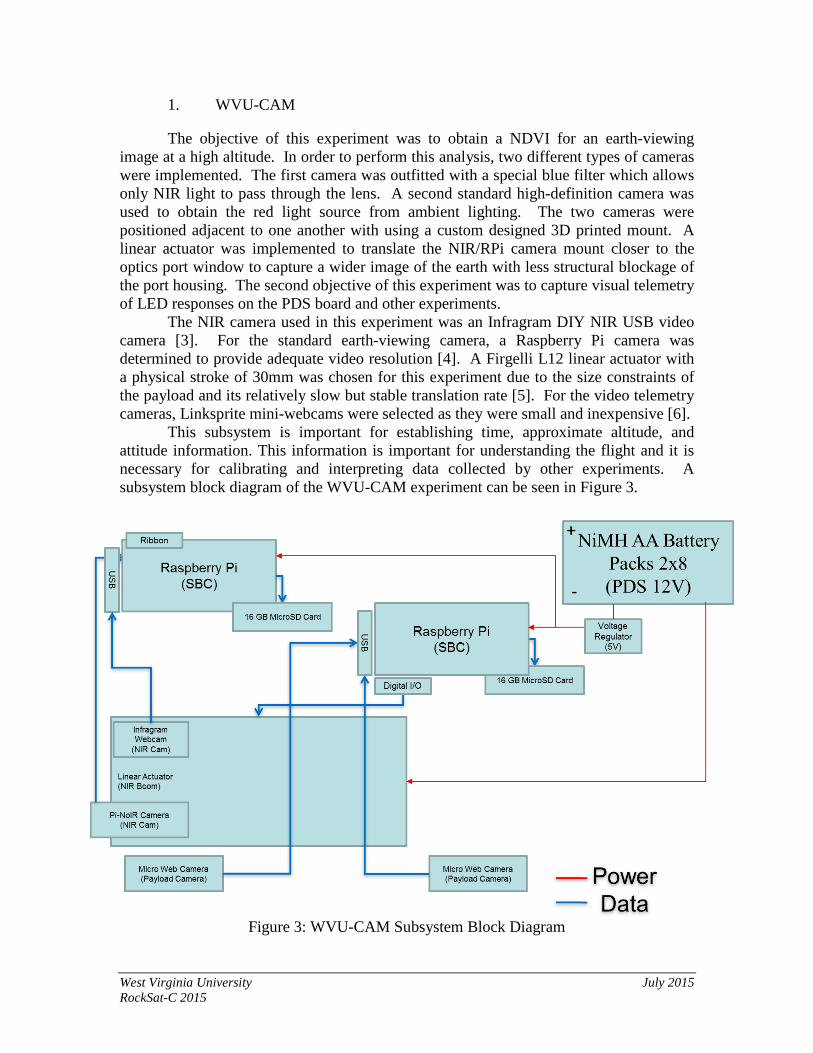
3.0 Payload Design
This section discusses how the experiments and other subsystems were designed. An overall illustration of the WV Collaboration RSC2015 payload assembly can be seen in Figure 2.
Figure 2: Mechanical Model of Payload Assembly
West Virginia University July 2015 RockSat-C 2015
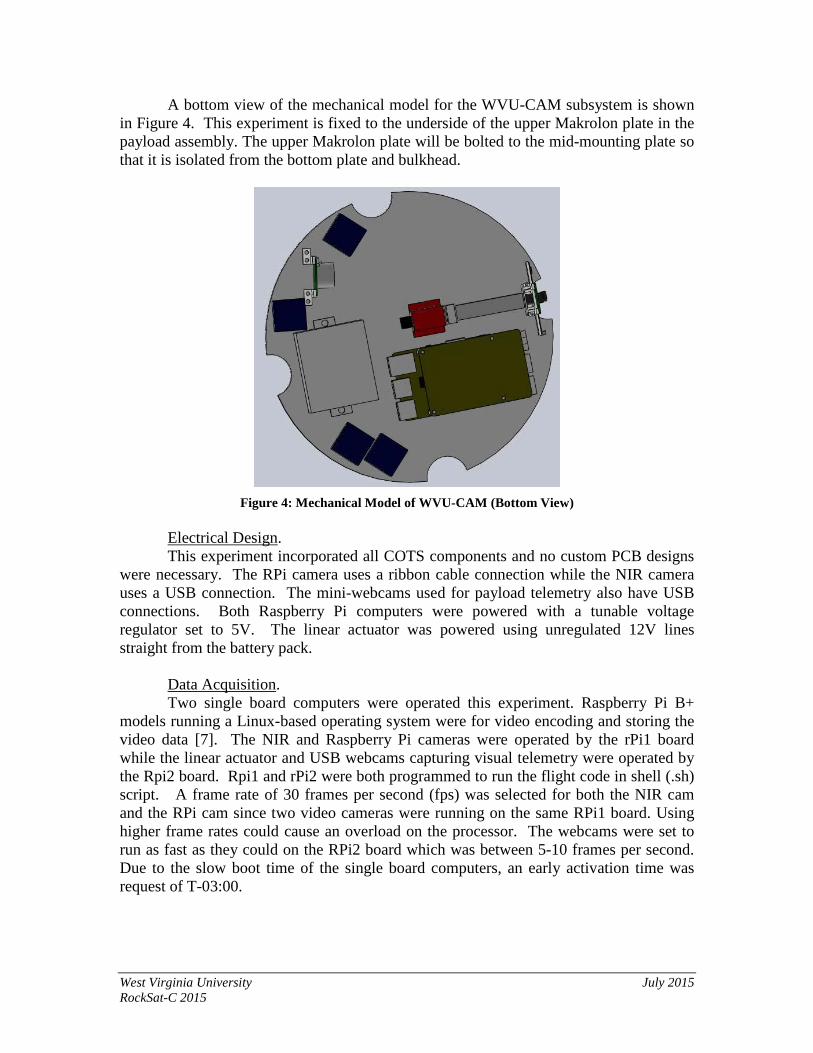
1. WVU-CAM
The objective of this experiment was to obtain a NDVI for an earth-viewing image at a high altitude. In order to perform this analysis, two different types of cameras were implemented. The first camera was outfitted with a special blue filter which allows only NIR light to pass through the lens. A second standard high-definition camera was used to obtain the red light source from ambient lighting. The two cameras were positioned adjacent to one another with using a custom designed 3D printed mount. A linear actuator was implemented to translate the NIR/RPi camera mount closer to the optics port window to capture a wider image of the earth with less structural blockage of the port housing. The second objective of this experiment was to capture visual telemetry of LED responses on the PDS board and other experiments.
The NIR camera used in this experiment was an Infragram DIY NIR USB video camera [3]. For the standard earth-viewing camera, a Raspberry Pi camera was determined to provide adequate video resolution [4]. A Firgelli L12 linear actuator with a physical stroke of 30mm was chosen for this experiment due to the size constraints of the payload and its relatively slow but stable translation rate [5]. For the video telemetry cameras, Linksprite mini-webcams were selected as they were small and inexpensive [6].
This subsystem is important for establishing time, approximate altitude, and attitude information. This information is important for understanding the flight and it is necessary for calibrating and interpreting data collected by other experiments. A subsystem block diagram of the WVU-CAM experiment can be seen in Figure 3.
Figure 3: WVU-CAM Subsystem Block Diagram
West Virginia University July 2015 RockSat-C 2015
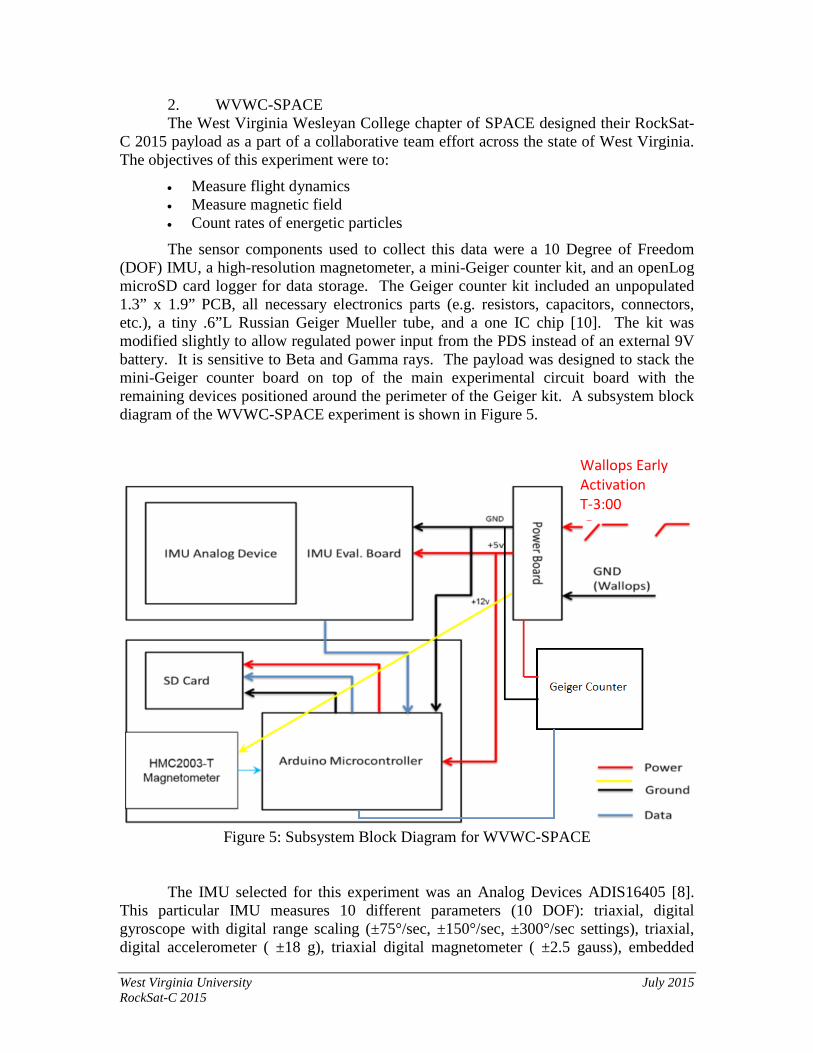
A bottom view of the mechanical model for the WVU-CAM subsystem is shown in Figure 4. This experiment is fixed to the underside of the upper Makrolon plate in the payload assembly. The upper Makrolon plate will be bolted to the mid-mounting plate so that it is isolated from the bottom plate and bulkhead.
Figure 4: Mechanical Model of WVU-CAM (Bottom View)
Electrical Design. This experiment incorporated all COTS components and no custom PCB designs
were necessary. The RPi camera uses a ribbon cable connection while the NIR camera uses a USB connection. The mini-webcams used for payload telemetry also have USB connections. Both Raspberry Pi computers were powered with a tunable voltage regulator set to 5V. The linear actuator was powered using unregulated 12V lines straight from the battery pack.
Data Acquisition. Two single board computers were operated this experiment. Raspberry Pi B+
models running a Linux-based operating system were for video encoding and storing the video data [7]. The NIR and Raspberry Pi cameras were operated by the rPi1 board while the linear actuator and USB webcams capturing visual telemetry were operated by the Rpi2 board. Rpi1 and rPi2 were both programmed to run the flight code in shell (.sh) script. A frame rate of 30 frames per second (fps) was selected for both the NIR cam and the RPi cam since two video cameras were running on the same RPi1 board. Using higher frame rates could cause an overload on the processor. The webcams were set to run as fast as they could on the RPi2 board which was between 5-10 frames per second. Due to the slow boot time of the single board computers, an early activation time was request of T-03:00.
West Virginia University July 2015 RockSat-C 2015
2. WVWC-SPACE The West Virginia Wesleyan College chapter of SPACE designed their RockSat-
C 2015 payload as a part of a collaborative team effort across the state of West Virginia. The objectives of this experiment were to:
• Measure flight dynamics • Measure magnetic field • Count rates of energetic particles
The sensor components used to collect this data were a 10 Degree of Freedom (DOF) IMU, a high-resolution magnetometer, a mini-Geiger counter kit, and an openLog microSD card logger for data storage. The Geiger counter kit included an unpopulated 1.3” x 1.9” PCB, all necessary electronics parts (e.g. resistors, capacitors, connectors, etc.), a tiny .6”L Russian Geiger Mueller tube, and a one IC chip [10]. The kit was modified slightly to allow regulated power input from the PDS instead of an external 9V battery. It is sensitive to Beta and Gamma rays. The payload was designed to stack the mini-Geiger counter board on top of the main experimental circuit board with the remaining devices positioned around the perimeter of the Geiger kit. A subsystem block diagram of the WVWC-SPACE experiment is shown in Figure 5.
Figure 5: Subsystem Block Diagram for WVWC-SPACE
The IMU selected for this experiment was an Analog Devices ADIS16405 [8]. This particular IMU measures 10 different parameters (10 DOF): triaxial, digital gyroscope with digital range scaling (±75°/sec, ±150°/sec, ±300°/sec settings), triaxial, digital accelerometer ( ±18 g), triaxial digital magnetometer ( ±2.5 gauss), embedded
Wallops Early Activation T-3:00
West Virginia University July 2015 RockSat-C 2015
temperature sensor (−40°C to +105°C). It features an SPI-compatible serial interface and is powered with a single-supply operation range of 4.75 V – 5.25 V. It also has a 2000 g shock survivability to withstand the high G-forces of the launch vehicle. This IMU was selected due to its accuracy and robustness as well as the SPI interface for fast data sampling. It is the single most expensive component on the entire payload, however it is a heritage component that has flown on previous RockSat suborbital launches and proven to be accurate and reliable.
The high-resolution micro-magnetometer selected to measure the magnetic field for this experiment was a 3-axis Honeywell HMC2003 [9]. It features a 40 uGauss to 2 Gauss dynamic range and an analog output at 1V/Gauss (2.5V @ 0 Gauss). The input voltage range varies from 6V – 15V. This micro-magnetometer was selected due to its high resolution and relatively low cost. It is also a heritage component that has flown on previous RockSat suborbital launches, proven to be precise and reliable and it is also fairly simple to interface with software.
Electrical Design. All sensors were calibrated according to the procedures specified in the respective
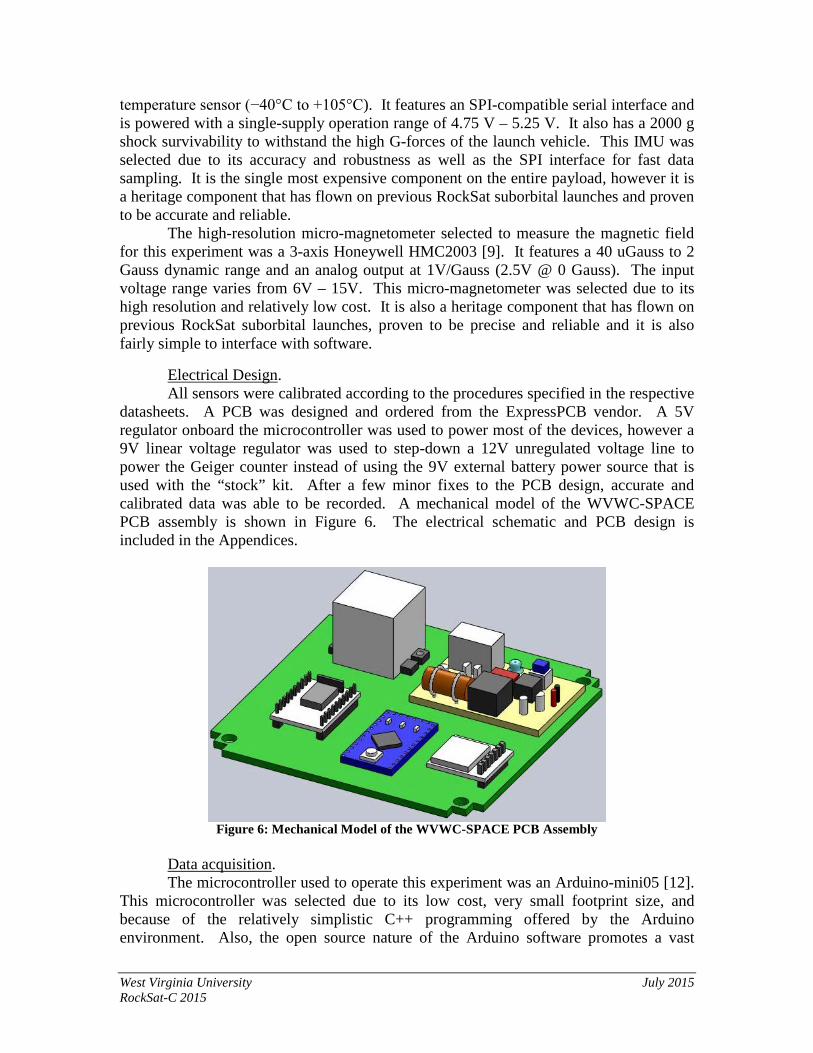
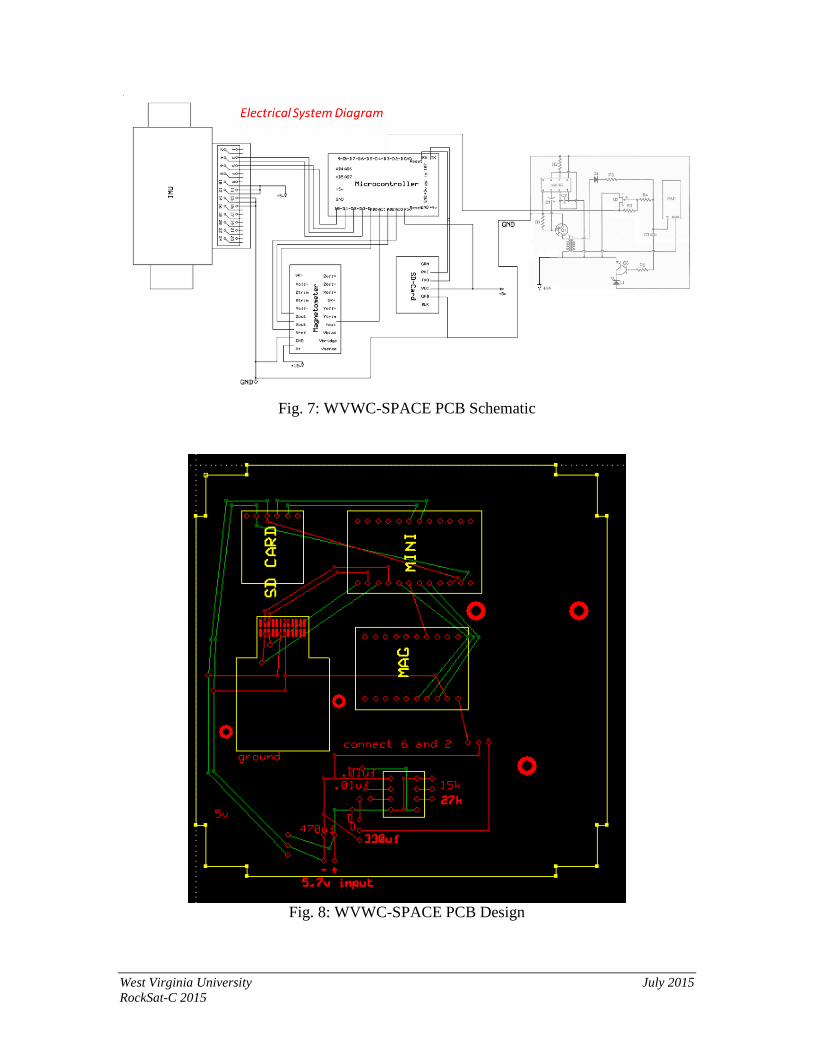
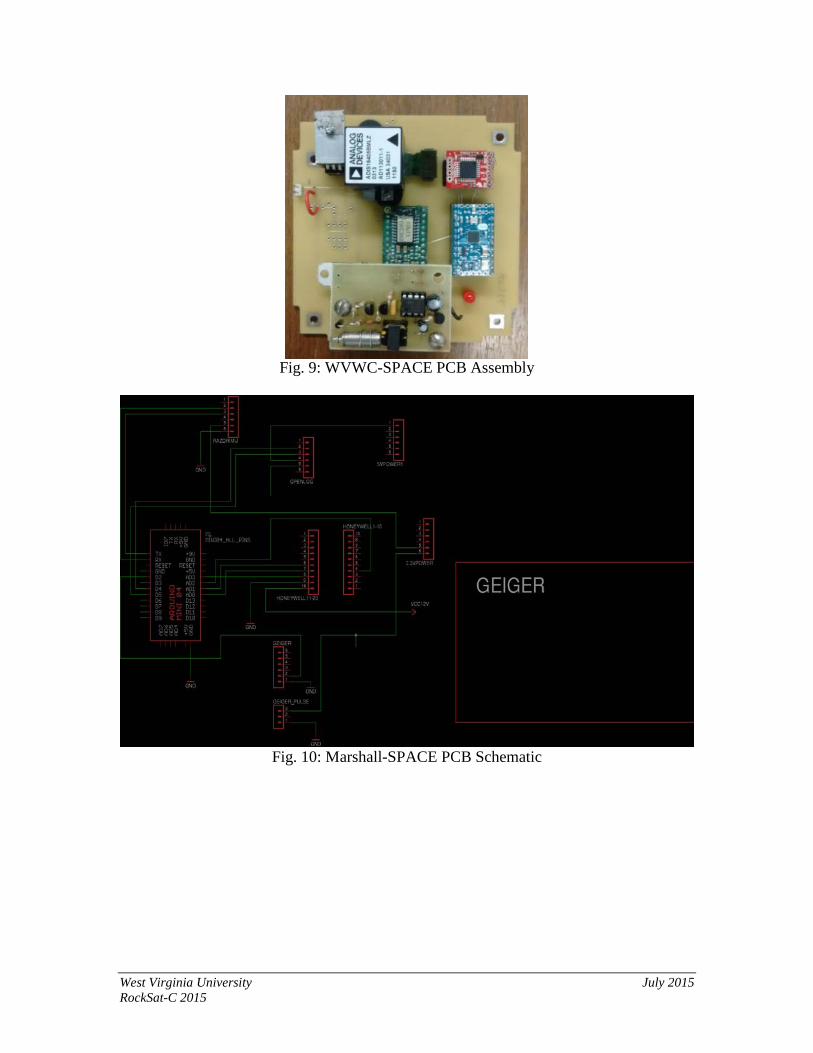
datasheets. A PCB was designed and ordered from the ExpressPCB vendor. A 5V regulator onboard the microcontroller was used to power most of the devices, however a 9V linear voltage regulator was used to step-down a 12V unregulated voltage line to power the Geiger counter instead of using the 9V external battery power source that is used with the “stock” kit. After a few minor fixes to the PCB design, accurate and calibrated data was able to be recorded. A mechanical model of the WVWC-SPACE PCB assembly is shown in Figure 6. The electrical schematic and PCB design is included in the Appendices.
Figure 6: Mechanical Model of the WVWC-SPACE PCB Assembly
Data acquisition. The microcontroller used to operate this experiment was an Arduino-mini05 [12].
This microcontroller was selected due to its low cost, very small footprint size, and because of the relatively simplistic C++ programming offered by the Arduino environment. Also, the open source nature of the Arduino software promotes a vast
West Virginia University July 2015 RockSat-C 2015
online source of tutorial, technical, and troubleshooting information. Finally, the Arduino-mini05 has an adequate number of analog and digital I/O pins to interface with all sensors used in this experiment. A class 10 16GB microSD card was used in the openLog device [11] as the data storage solution since this was determined to provide plenty of space for data acquisition with the large flight margin.
3. Marshall-SPACE. The Marshall University Student Partnership for the Advancement of Cosmic
Exploration designed this RockSat-C 2015 payload as a part of a collaborative team across the state of West Virginia. Several of the schools involved in this collaboration created very similar payloads with very similar goals. These objectives include:
• To measure the magnetic field of Earth • To collect redundant flight dynamics data • To detect and measure ionized particles
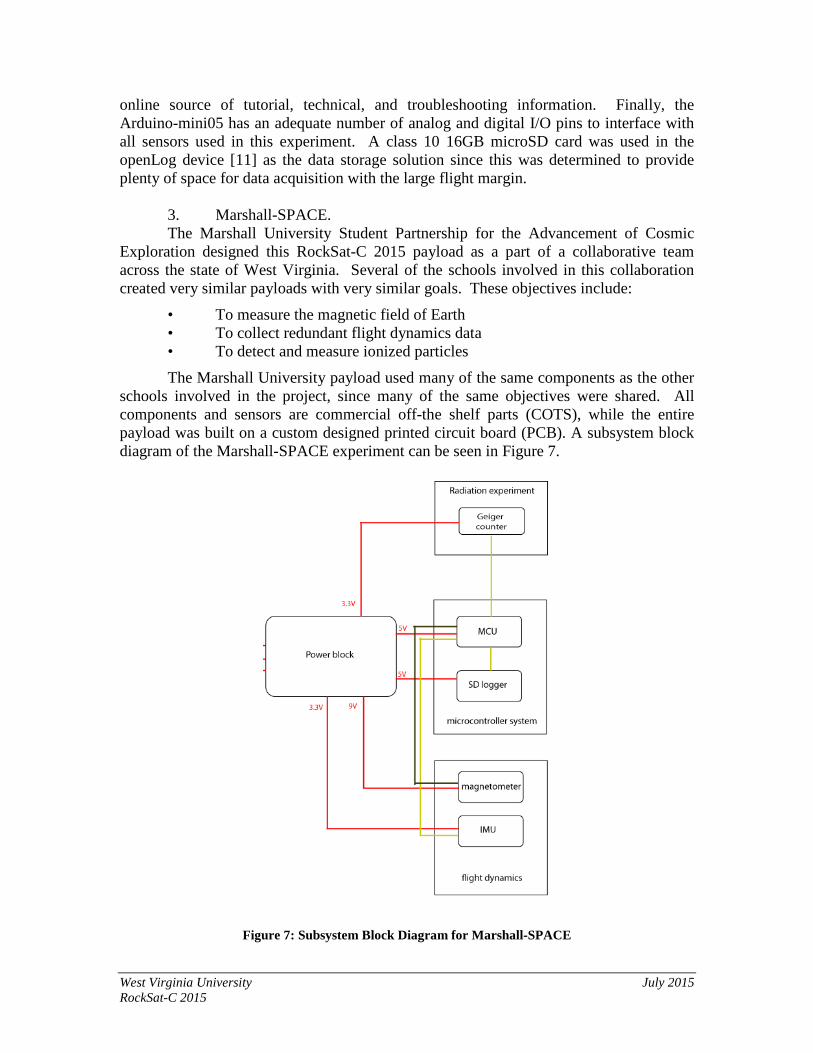
The Marshall University payload used many of the same components as the other schools involved in the project, since many of the same objectives were shared. All components and sensors are commercial off-the shelf parts (COTS), while the entire payload was built on a custom designed printed circuit board (PCB). A subsystem block diagram of the Marshall-SPACE experiment can be seen in Figure 7.
Figure 7: Subsystem Block Diagram for Marshall-SPACE
West Virginia University July 2015 RockSat-C 2015
An Arduino Pro Mini microcontroller was used to run all other components and process data [15]. A Honeywell HMC2003 magnetometer was used to measure the magnetic field of Earth, outputting three axes of data on three analog lines to the Arduino [9]. Two inertial measurement units were used for redundancy. The Sparkfun Razor 9 DOF IMU was programmed to output data from all nine data registers on digital lines to the Arduino using serial communication [13]. The 9 DOF comes from an InvenSense ITG-3200 triple-axis digital gyroscope with ±2,000 °/sec full-scale range, an Analog Devices ADXL345 13-bit resolution, ±16g, triple-axis accelerometer, and a Honeywell HMC5883L triple-axis digital magnetometer with a 12-Bit ADC coupled with low noise Anisotropic Magneto-Resistive AMR sensors that achieve 2 milli-gauss field resolution in ±8 Gauss Fields enabling 1° to 2° degree compass heading accuracy.
The second IMU is the Analog Devices ADIS16300 [16], a 4 degree of freedom IMU (three axis accelerometer, one axis gyro) that outputs digital data through SPI communication to the Arduino. It features a 14-bit digital gyroscope with digital range scaling (±75°/sec, ±150°/sec, ±300°/sec settings), a tri-axis 14-bit digital accelerometer with ±3 g measurement range, 13-bit pitch and roll incline calculations, 330 Hz bandwidth, SPI-compatible serial interface, single-supply operation range from 4.75 V to 5.25 V, 2000-g shock survivability, and an operating temperature range between −40°C to +85°C.
For the purposes of measuring ionizing radiation, a MightyOhm Geiger counter kit was used [14]. This kit includes its own PCB and all the components required to assemble a working Geiger counter. The payload was designed to stack the Geiger counter board on top of the main experimental circuit board with the remaining devices positioned underneath of the Geiger kit. Since the MightyOhm Geiger counter kit dimensions exceed the CubeSat design requirement, a waiver for this design requirement was requested and granted by the NASA IV&V program. The Geiger counter kit processes data onboard and sends it to the Arduino to be recorded. All data is written by the Arduino to an SD card via the Sparkfun Openlog [11], which simply records any serial data sent to the component to a microSD card.
In order for any of these sensors to output reasonable data, they should be calibrated. The Razor IMU comes with a default firmware that includes a calibration program; this program involves rotating the device around several thousand measurements and recording maximums, minimums, and average values. These values are then placed in the setup program that the board runs on in order to normalize data. The Analog Devices IMU comes factory calibrated, and testing seemed to indicate that it was very accurate, so it was not re-calibrated for this experiment. A simple program was written for the Honeywell magnetometer in order to record maximums and minimums and normalize data, and it was very successful in getting highly accurate magnetic field readings during testing. This method takes hard iron and soft iron errors into account. However, to maximize the success of this calibration method, the magnetometer should be again re-calibrated in the final project enclosure with all other parts of the payload installed. Due to the setup of the RockSat canister, it was relatively hard to access when placed in the canister, so it was not re-calibrated in the canister. The initial calibration should have still been relevant and helped to normalize the data.
West Virginia University July 2015 RockSat-C 2015
Electrical design: All sensors were calibrated according to the procedures specified in the respective
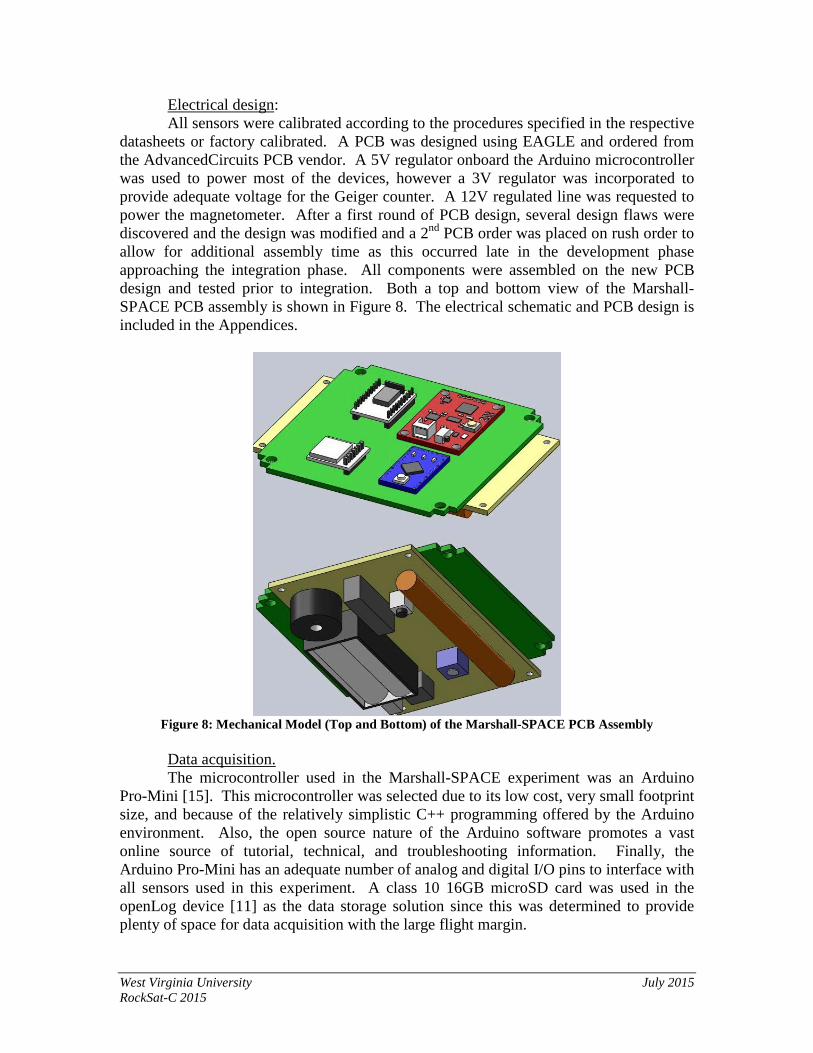
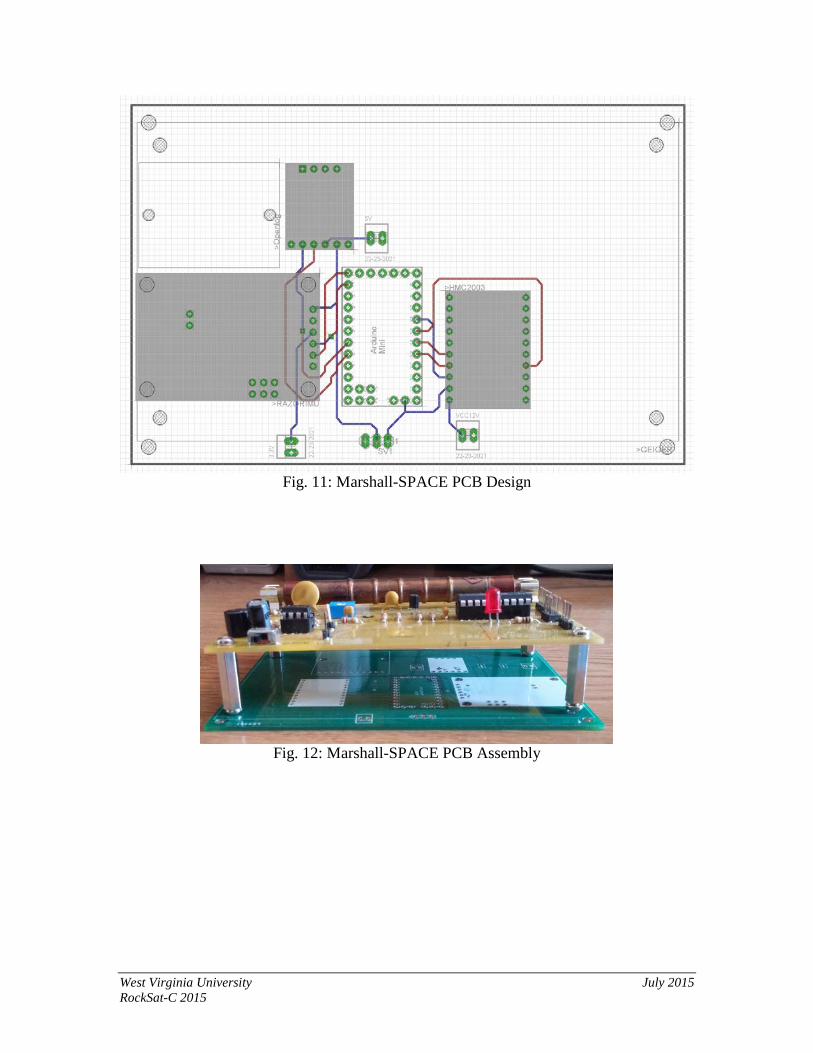
datasheets or factory calibrated. A PCB was designed using EAGLE and ordered from the AdvancedCircuits PCB vendor. A 5V regulator onboard the Arduino microcontroller was used to power most of the devices, however a 3V regulator was incorporated to provide adequate voltage for the Geiger counter. A 12V regulated line was requested to power the magnetometer. After a first round of PCB design, several design flaws were discovered and the design was modified and a 2nd PCB order was placed on rush order to allow for additional assembly time as this occurred late in the development phase approaching the integration phase. All components were assembled on the new PCB design and tested prior to integration. Both a top and bottom view of the Marshall-SPACE PCB assembly is shown in Figure 8. The electrical schematic and PCB design is included in the Appendices.
Figure 8: Mechanical Model (Top and Bottom) of the Marshall-SPACE PCB Assembly
Data acquisition. The microcontroller used in the Marshall-SPACE experiment was an Arduino
Pro-Mini [15]. This microcontroller was selected due to its low cost, very small footprint size, and because of the relatively simplistic C++ programming offered by the Arduino environment. Also, the open source nature of the Arduino software promotes a vast online source of tutorial, technical, and troubleshooting information. Finally, the Arduino Pro-Mini has an adequate number of analog and digital I/O pins to interface with all sensors used in this experiment. A class 10 16GB microSD card was used in the openLog device [11] as the data storage solution since this was determined to provide plenty of space for data acquisition with the large flight margin.
West Virginia University July 2015 RockSat-C 2015
4. Shepherd-SPACE. The Shepherd University chapter of SPACE designed this RockSat-C 2015
payload as a part of a collaborative team effort across the state of West Virginia. Several of the schools involved in this collaboration created very similar payloads with very similar objectives. These objectives include:
• To measure the magnetic field of Earth • To collect redundant flight dynamics data • To assess the feasibility of using a low-cost IMU
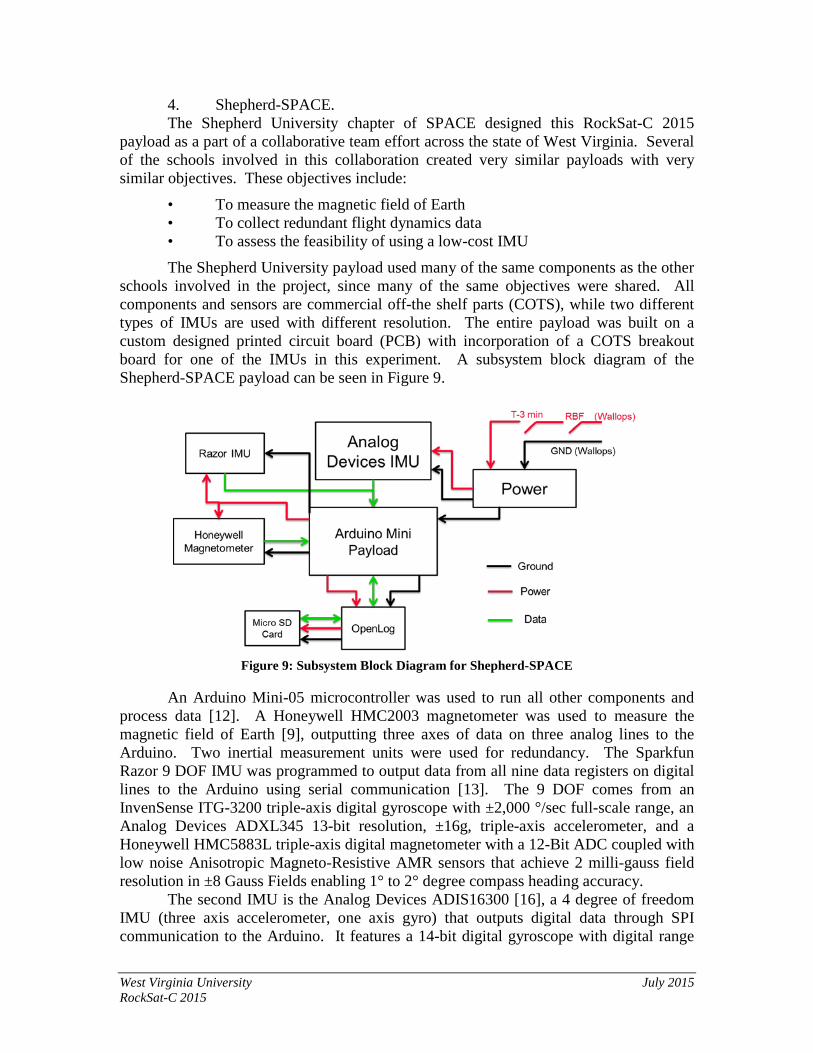
The Shepherd University payload used many of the same components as the other schools involved in the project, since many of the same objectives were shared. All components and sensors are commercial off-the shelf parts (COTS), while two different types of IMUs are used with different resolution. The entire payload was built on a custom designed printed circuit board (PCB) with incorporation of a COTS breakout board for one of the IMUs in this experiment. A subsystem block diagram of the Shepherd-SPACE payload can be seen in Figure 9.
An Arduino Mini-05 microcontroller was used to run all other components and
process data [12]. A Honeywell HMC2003 magnetometer was used to measure the magnetic field of Earth [9], outputting three axes of data on three analog lines to the Arduino. Two inertial measurement units were used for redundancy. The Sparkfun Razor 9 DOF IMU was programmed to output data from all nine data registers on digital lines to the Arduino using serial communication [13]. The 9 DOF comes from an InvenSense ITG-3200 triple-axis digital gyroscope with ±2,000 °/sec full-scale range, an Analog Devices ADXL345 13-bit resolution, ±16g, triple-axis accelerometer, and a Honeywell HMC5883L triple-axis digital magnetometer with a 12-Bit ADC coupled with low noise Anisotropic Magneto-Resistive AMR sensors that achieve 2 milli-gauss field resolution in ±8 Gauss Fields enabling 1° to 2° degree compass heading accuracy.
The second IMU is the Analog Devices ADIS16300 [16], a 4 degree of freedom IMU (three axis accelerometer, one axis gyro) that outputs digital data through SPI communication to the Arduino. It features a 14-bit digital gyroscope with digital range
Figure 9: Subsystem Block Diagram for Shepherd-SPACE
West Virginia University July 2015 RockSat-C 2015
scaling (±75°/sec, ±150°/sec, ±300°/sec settings), a tri-axis 14-bit digital accelerometer with ±3 g measurement range, 13-bit pitch and roll incline calculations, 330 Hz bandwidth, SPI-compatible serial interface, single-supply operation range from 4.75 V to 5.25 V, 2000-g shock survivability, and an operating temperature range between −40°C to +85°C.
In order for any of these sensors to output reasonable data, they should be calibrated. The Razor IMU comes with a default firmware that includes a calibration program; this program involves rotating the device around to obtain several thousand measurements and recording maximums, minimums, and average values. These values are then placed in the setup program that the board runs on in order to normalize data. The Analog Devices IMU comes factory calibrated, and testing seemed to indicate that it was very accurate, so it was not re-calibrated for this experiment. A simple program was obtained by Marshall University for the Honeywell magnetometer in order to record maximums and minimums and normalize data, and it was very successful in getting highly accurate magnetic field readings during testing.
Electrical design: All sensors were calibrated according to the procedures specified in the respective
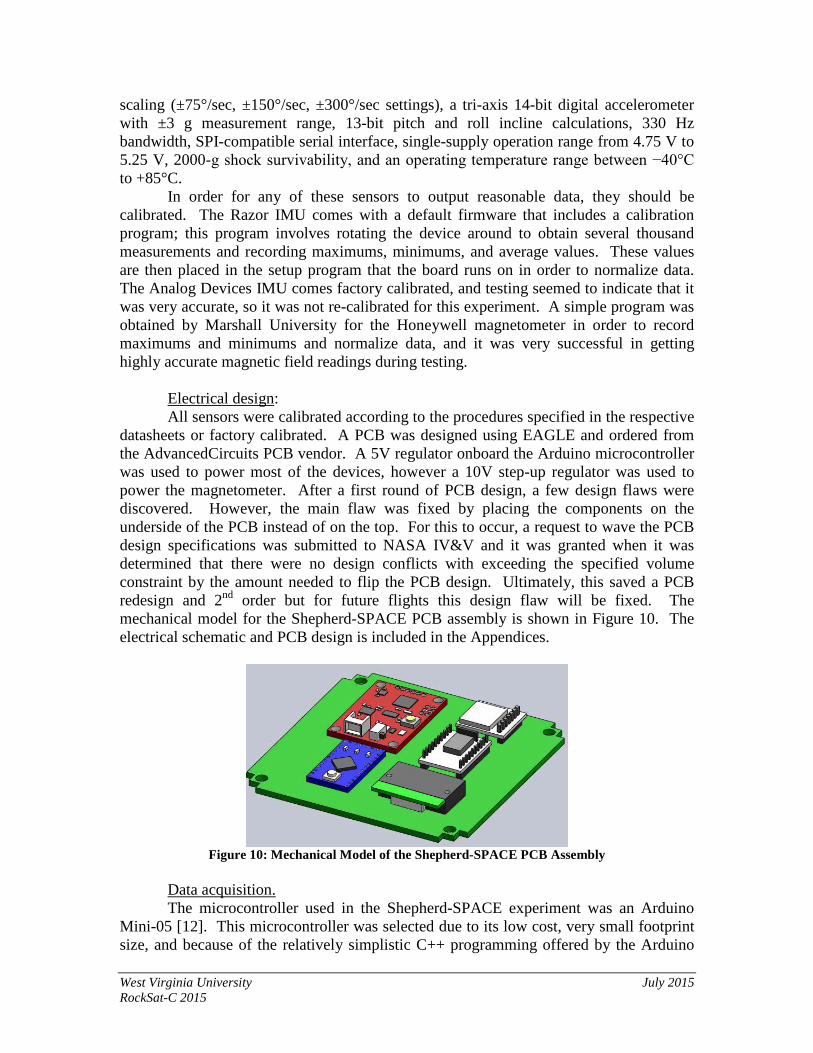
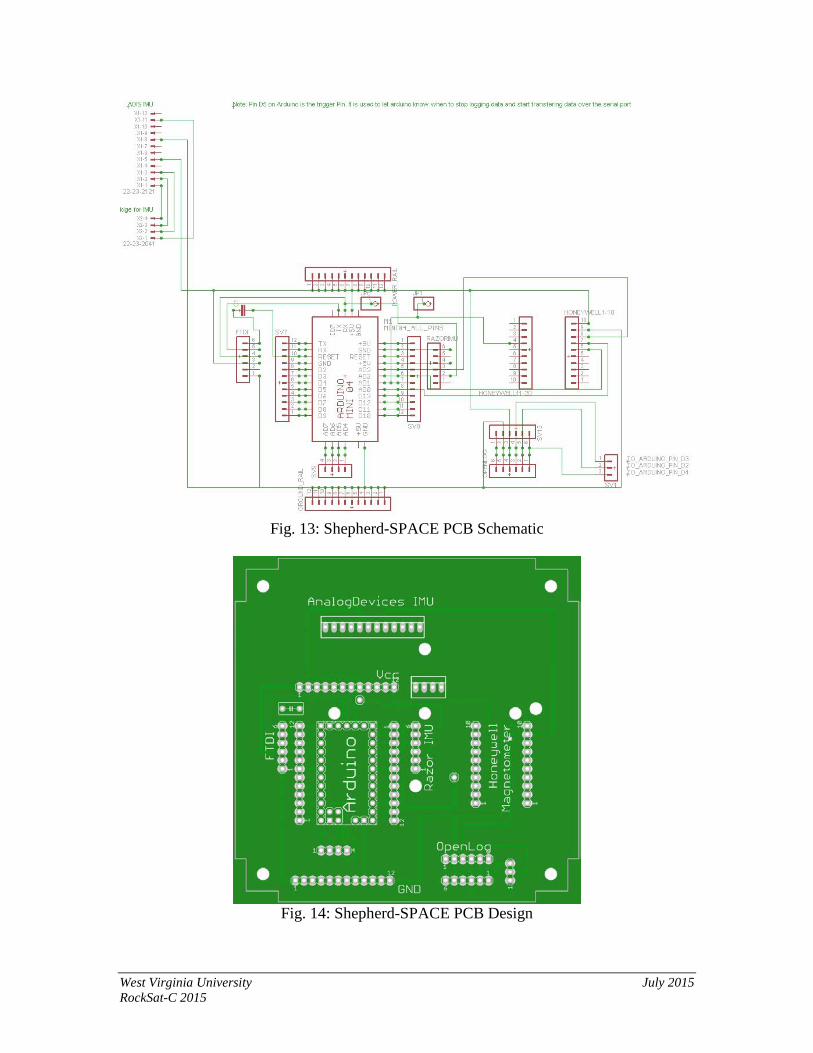
datasheets or factory calibrated. A PCB was designed using EAGLE and ordered from the AdvancedCircuits PCB vendor. A 5V regulator onboard the Arduino microcontroller was used to power most of the devices, however a 10V step-up regulator was used to power the magnetometer. After a first round of PCB design, a few design flaws were discovered. However, the main flaw was fixed by placing the components on the underside of the PCB instead of on the top. For this to occur, a request to wave the PCB design specifications was submitted to NASA IV&V and it was granted when it was determined that there were no design conflicts with exceeding the specified volume constraint by the amount needed to flip the PCB design. Ultimately, this saved a PCB redesign and 2nd order but for future flights this design flaw will be fixed. The mechanical model for the Shepherd-SPACE PCB assembly is shown in Figure 10. The electrical schematic and PCB design is included in the Appendices.
Figure 10: Mechanical Model of the Shepherd-SPACE PCB Assembly
Data acquisition. The microcontroller used in the Shepherd-SPACE experiment was an Arduino
Mini-05 [12]. This microcontroller was selected due to its low cost, very small footprint size, and because of the relatively simplistic C++ programming offered by the Arduino
West Virginia University July 2015 RockSat-C 2015
environment. Also, the open source nature of the Arduino software promotes a vast online source of tutorial, technical, and troubleshooting information. Finally, the Arduino Mini has an adequate number of analog and digital I/O pins to interface with all sensors used in this experiment. A 16GB class 10 microSD card was used in the openLog device as the data storage solution since this was determined to provide plenty of space for data acquisition with the large flight margin [11].
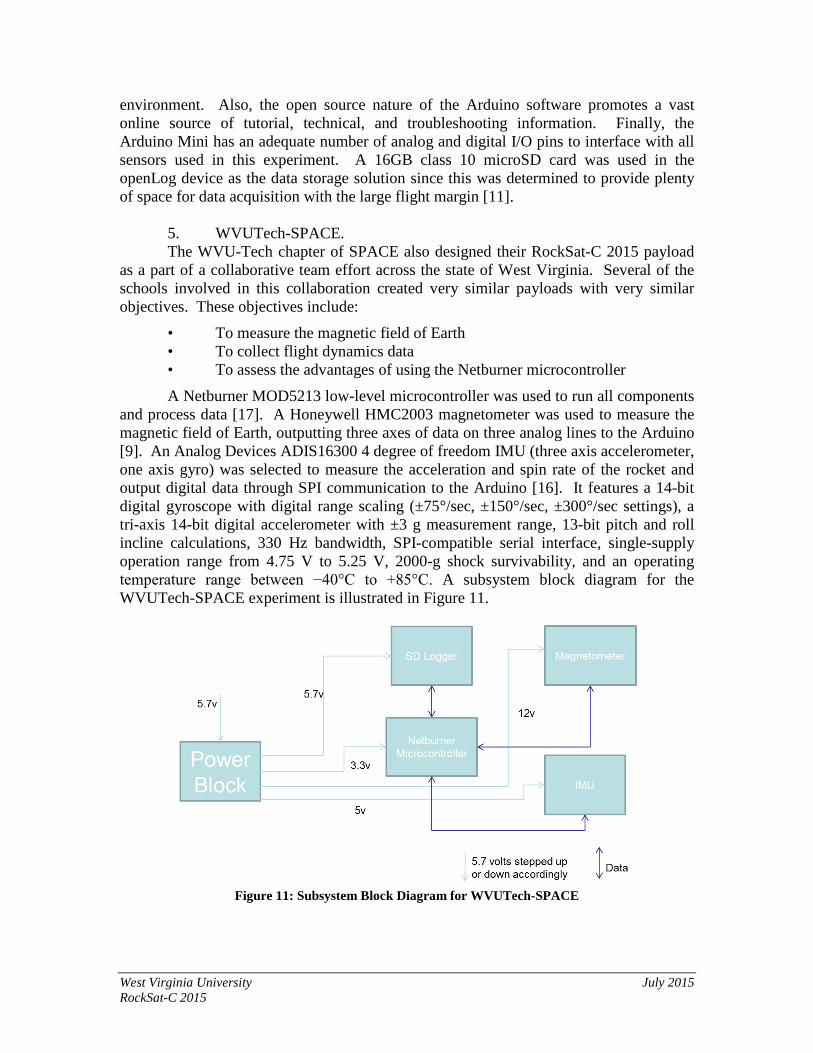
5. WVUTech-SPACE. The WVU-Tech chapter of SPACE also designed their RockSat-C 2015 payload
as a part of a collaborative team effort across the state of West Virginia. Several of the schools involved in this collaboration created very similar payloads with very similar objectives. These objectives include:
• To measure the magnetic field of Earth • To collect flight dynamics data • To assess the advantages of using the Netburner microcontroller
A Netburner MOD5213 low-level microcontroller was used to run all components and process data [17]. A Honeywell HMC2003 magnetometer was used to measure the magnetic field of Earth, outputting three axes of data on three analog lines to the Arduino [9]. An Analog Devices ADIS16300 4 degree of freedom IMU (three axis accelerometer, one axis gyro) was selected to measure the acceleration and spin rate of the rocket and output digital data through SPI communication to the Arduino [16]. It features a 14-bit digital gyroscope with digital range scaling (±75°/sec, ±150°/sec, ±300°/sec settings), a tri-axis 14-bit digital accelerometer with ±3 g measurement range, 13-bit pitch and roll incline calculations, 330 Hz bandwidth, SPI-compatible serial interface, single-supply operation range from 4.75 V to 5.25 V, 2000-g shock survivability, and an operating temperature range between −40°C to +85°C. A subsystem block diagram for the WVUTech-SPACE experiment is illustrated in Figure 11.
Figure 11: Subsystem Block Diagram for WVUTech-SPACE
West Virginia University July 2015 RockSat-C 2015
Electrical design: All sensors were calibrated according to the procedures specified in the respective
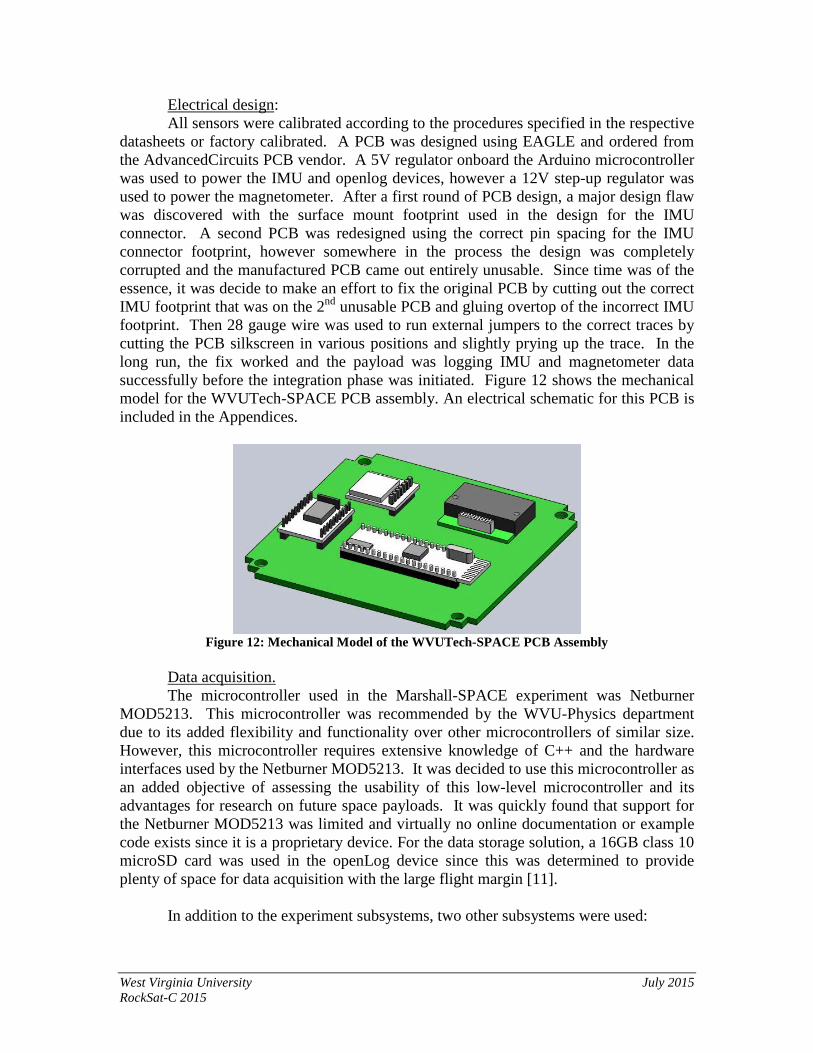
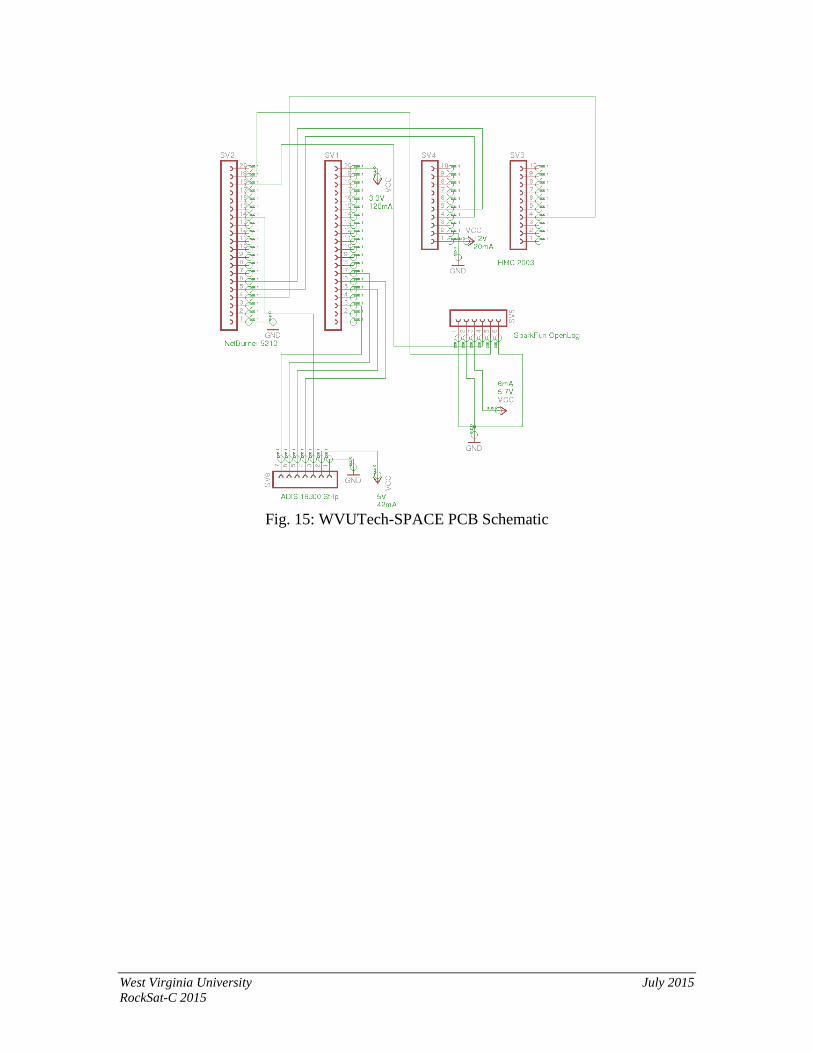
datasheets or factory calibrated. A PCB was designed using EAGLE and ordered from the AdvancedCircuits PCB vendor. A 5V regulator onboard the Arduino microcontroller was used to power the IMU and openlog devices, however a 12V step-up regulator was used to power the magnetometer. After a first round of PCB design, a major design flaw was discovered with the surface mount footprint used in the design for the IMU connector. A second PCB was redesigned using the correct pin spacing for the IMU connector footprint, however somewhere in the process the design was completely corrupted and the manufactured PCB came out entirely unusable. Since time was of the essence, it was decide to make an effort to fix the original PCB by cutting out the correct IMU footprint that was on the 2nd unusable PCB and gluing overtop of the incorrect IMU footprint. Then 28 gauge wire was used to run external jumpers to the correct traces by cutting the PCB silkscreen in various positions and slightly prying up the trace. In the long run, the fix worked and the payload was logging IMU and magnetometer data successfully before the integration phase was initiated. Figure 12 shows the mechanical model for the WVUTech-SPACE PCB assembly. An electrical schematic for this PCB is included in the Appendices.
Figure 12: Mechanical Model of the WVUTech-SPACE PCB Assembly
Data acquisition. The microcontroller used in the Marshall-SPACE experiment was Netburner
MOD5213. This microcontroller was recommended by the WVU-Physics department due to its added flexibility and functionality over other microcontrollers of similar size. However, this microcontroller requires extensive knowledge of C++ and the hardware interfaces used by the Netburner MOD5213. It was decided to use this microcontroller as an added objective of assessing the usability of this low-level microcontroller and its advantages for research on future space payloads. It was quickly found that support for the Netburner MOD5213 was limited and virtually no online documentation or example code exists since it is a proprietary device. For the data storage solution, a 16GB class 10 microSD card was used in the openLog device since this was determined to provide plenty of space for data acquisition with the large flight margin [11].
In addition to the experiment subsystems, two other subsystems were used:
West Virginia University July 2015 RockSat-C 2015
6. Power Distribution System (PDS) The main objective of this subsystem was to regulate constant voltage to each of
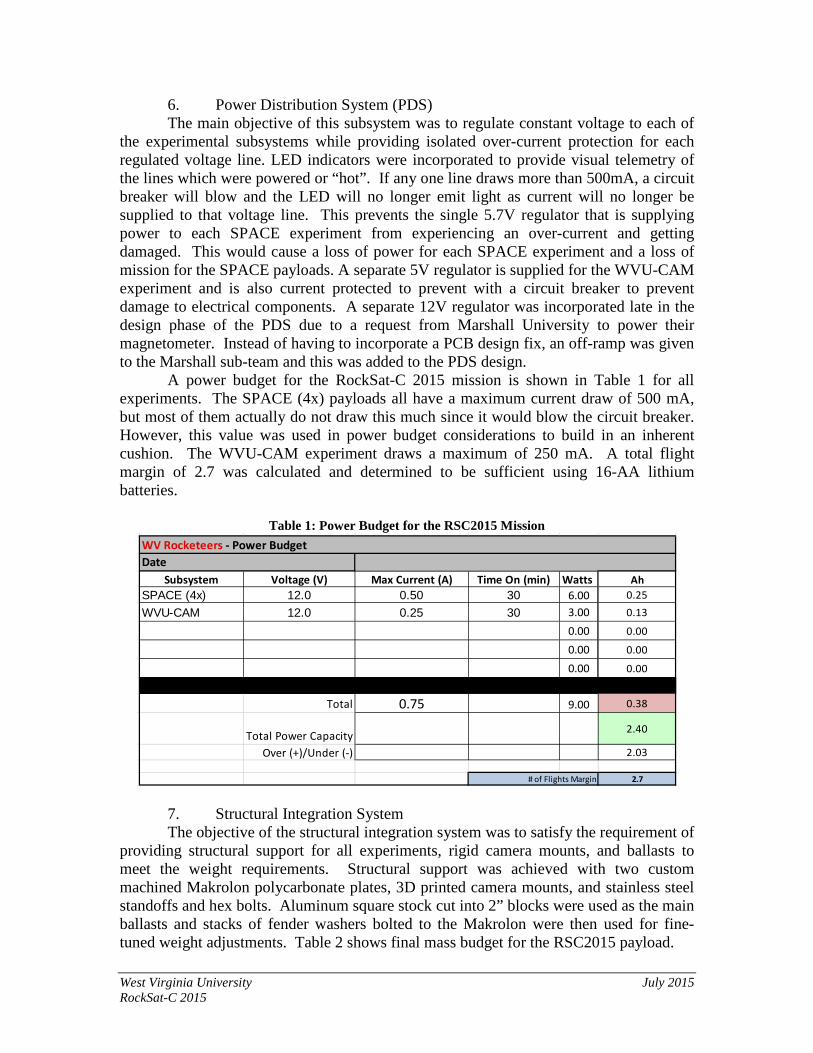
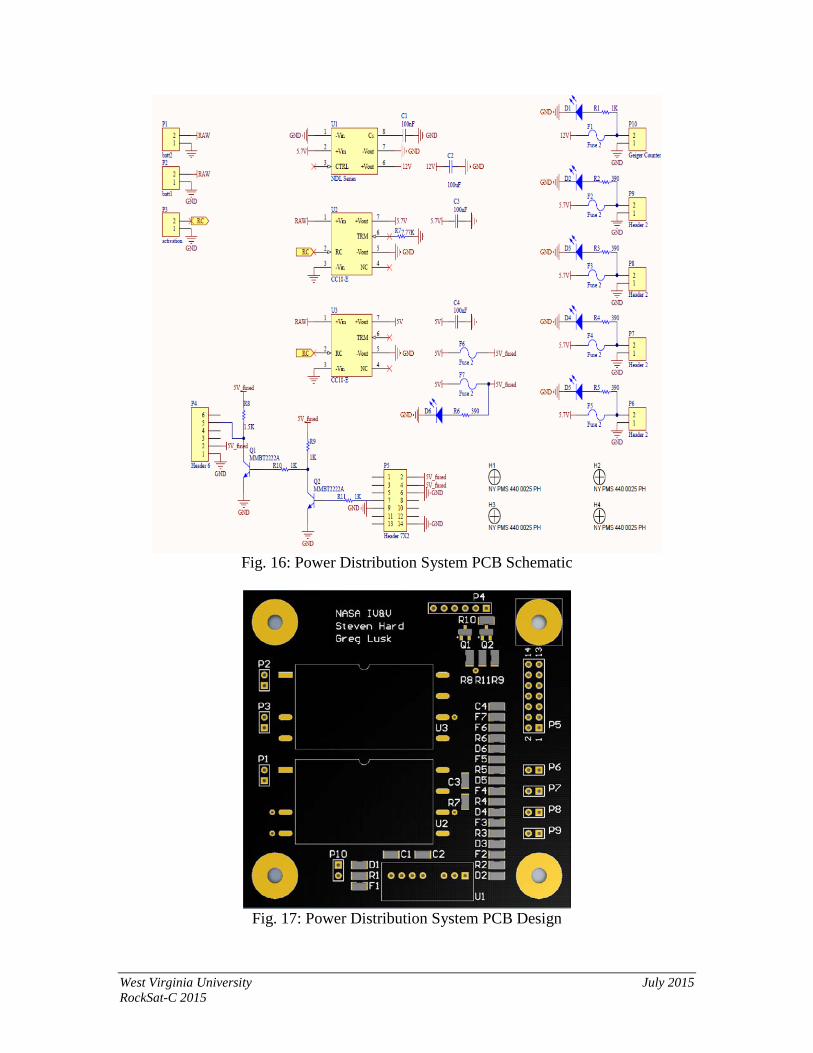
the experimental subsystems while providing isolated over-current protection for each regulated voltage line. LED indicators were incorporated to provide visual telemetry of the lines which were powered or “hot”. If any one line draws more than 500mA, a circuit breaker will blow and the LED will no longer emit light as current will no longer be supplied to that voltage line. This prevents the single 5.7V regulator that is supplying power to each SPACE experiment from experiencing an over-current and getting damaged. This would cause a loss of power for each SPACE experiment and a loss of mission for the SPACE payloads. A separate 5V regulator is supplied for the WVU-CAM experiment and is also current protected to prevent with a circuit breaker to prevent damage to electrical components. A separate 12V regulator was incorporated late in the design phase of the PDS due to a request from Marshall University to power their magnetometer. Instead of having to incorporate a PCB design fix, an off-ramp was given to the Marshall sub-team and this was added to the PDS design.
A power budget for the RockSat-C 2015 mission is shown in Table 1 for all experiments. The SPACE (4x) payloads all have a maximum current draw of 500 mA, but most of them actually do not draw this much since it would blow the circuit breaker. However, this value was used in power budget considerations to build in an inherent cushion. The WVU-CAM experiment draws a maximum of 250 mA. A total flight margin of 2.7 was calculated and determined to be sufficient using 16-AA lithium batteries.
Table 1: Power Budget for the RSC2015 Mission
DateSubsystem Voltage (V) Max Current (A) Time On (min) Watts Ah
SPACE (4x) 12.0 0.50 30 6.00 0.25WVU-CAM 12.0 0.25 30 3.00 0.13
0.00 0.00
0.00 0.00
0.00 0.00
Total 0.75 9.00 0.38
Total Power Capacity 2.40
Over (+)/Under (-) 2.03
2.7
WV Rocketeers - Power .udget
# of Clights Margin 7. Structural Integration System The objective of the structural integration system was to satisfy the requirement of
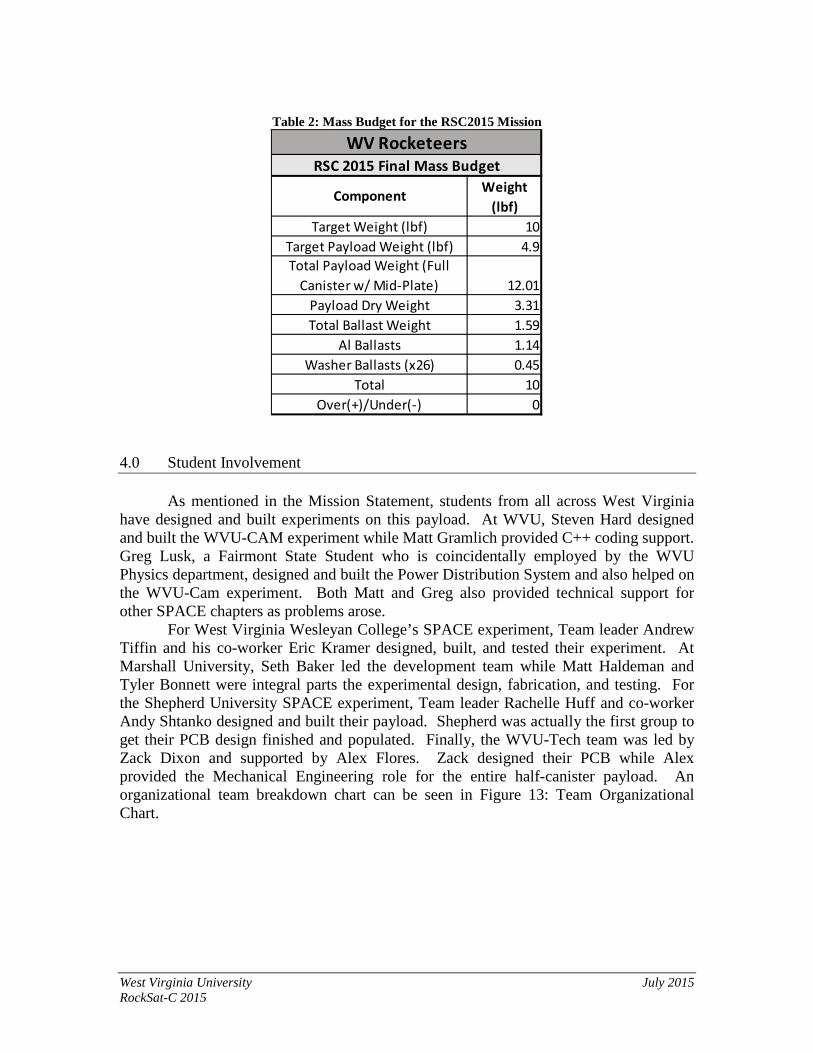
providing structural support for all experiments, rigid camera mounts, and ballasts to meet the weight requirements. Structural support was achieved with two custom machined Makrolon polycarbonate plates, 3D printed camera mounts, and stainless steel standoffs and hex bolts. Aluminum square stock cut into 2” blocks were used as the main ballasts and stacks of fender washers bolted to the Makrolon were then used for fine-tuned weight adjustments. Table 2 shows final mass budget for the RSC2015 payload.
West Virginia University July 2015 RockSat-C 2015
Table 2: Mass Budget for the RSC2015 Mission
Weight (lbf)
104.9
12.013.311.591.140.45
100
WV RocketeersRSC 2015 Final Mass .udget
Payload Dry WeightTotal Ballast Weight
Target Payload Weight (lbf)
Al BallastsWasher Ballasts (x26)
Component
Over(+)/Under(-)Total
Total Payload Weight (Cull Canister w/ Mid-Plate)
Target Weight (lbf)
4.0 Student Involvement
As mentioned in the Mission Statement, students from all across West Virginia have designed and built experiments on this payload. At WVU, Steven Hard designed and built the WVU-CAM experiment while Matt Gramlich provided C++ coding support. Greg Lusk, a Fairmont State Student who is coincidentally employed by the WVU Physics department, designed and built the Power Distribution System and also helped on the WVU-Cam experiment. Both Matt and Greg also provided technical support for other SPACE chapters as problems arose.
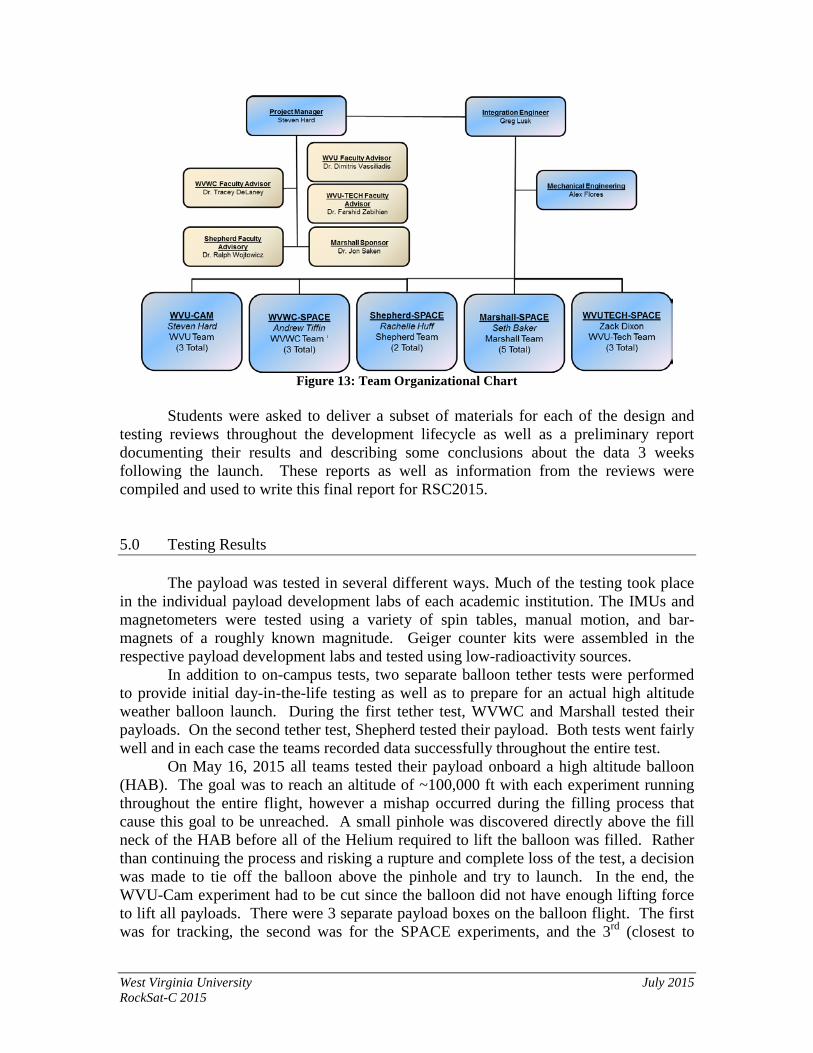
For West Virginia Wesleyan College’s SPACE experiment, Team leader Andrew Tiffin and his co-worker Eric Kramer designed, built, and tested their experiment. At Marshall University, Seth Baker led the development team while Matt Haldeman and Tyler Bonnett were integral parts the experimental design, fabrication, and testing. For the Shepherd University SPACE experiment, Team leader Rachelle Huff and co-worker Andy Shtanko designed and built their payload. Shepherd was actually the first group to get their PCB design finished and populated. Finally, the WVU-Tech team was led by Zack Dixon and supported by Alex Flores. Zack designed their PCB while Alex provided the Mechanical Engineering role for the entire half-canister payload. An organizational team breakdown chart can be seen in Figure 13: Team Organizational Chart.
West Virginia University July 2015 RockSat-C 2015
Figure 13: Team Organizational Chart
Students were asked to deliver a subset of materials for each of the design and
testing reviews throughout the development lifecycle as well as a preliminary report documenting their results and describing some conclusions about the data 3 weeks following the launch. These reports as well as information from the reviews were compiled and used to write this final report for RSC2015.
5.0 Testing Results
The payload was tested in several different ways. Much of the testing took place in the individual payload development labs of each academic institution. The IMUs and magnetometers were tested using a variety of spin tables, manual motion, and bar-magnets of a roughly known magnitude. Geiger counter kits were assembled in the respective payload development labs and tested using low-radioactivity sources.
In addition to on-campus tests, two separate balloon tether tests were performed to provide initial day-in-the-life testing as well as to prepare for an actual high altitude weather balloon launch. During the first tether test, WVWC and Marshall tested their payloads. On the second tether test, Shepherd tested their payload. Both tests went fairly well and in each case the teams recorded data successfully throughout the entire test.
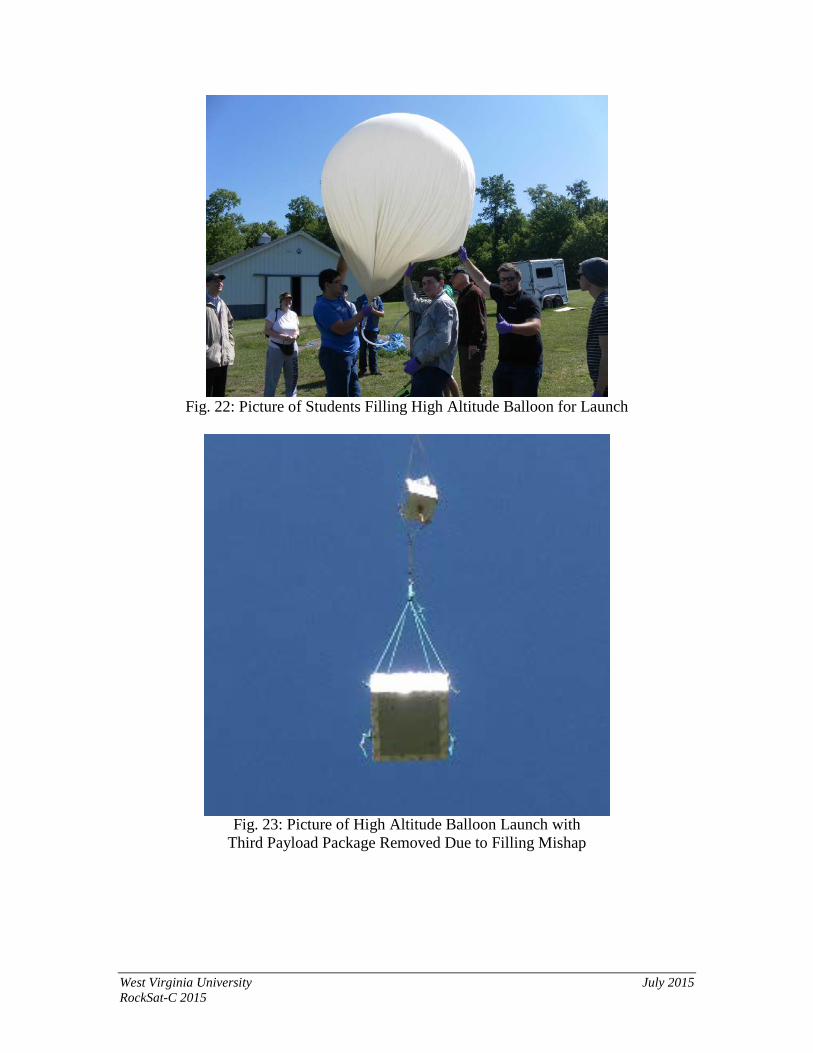
On May 16, 2015 all teams tested their payload onboard a high altitude balloon (HAB). The goal was to reach an altitude of ~100,000 ft with each experiment running throughout the entire flight, however a mishap occurred during the filling process that cause this goal to be unreached. A small pinhole was discovered directly above the fill neck of the HAB before all of the Helium required to lift the balloon was filled. Rather than continuing the process and risking a rupture and complete loss of the test, a decision was made to tie off the balloon above the pinhole and try to launch. In the end, the WVU-Cam experiment had to be cut since the balloon did not have enough lifting force to lift all payloads. There were 3 separate payload boxes on the balloon flight. The first was for tracking, the second was for the SPACE experiments, and the 3rd (closest to
West Virginia University July 2015 RockSat-C 2015
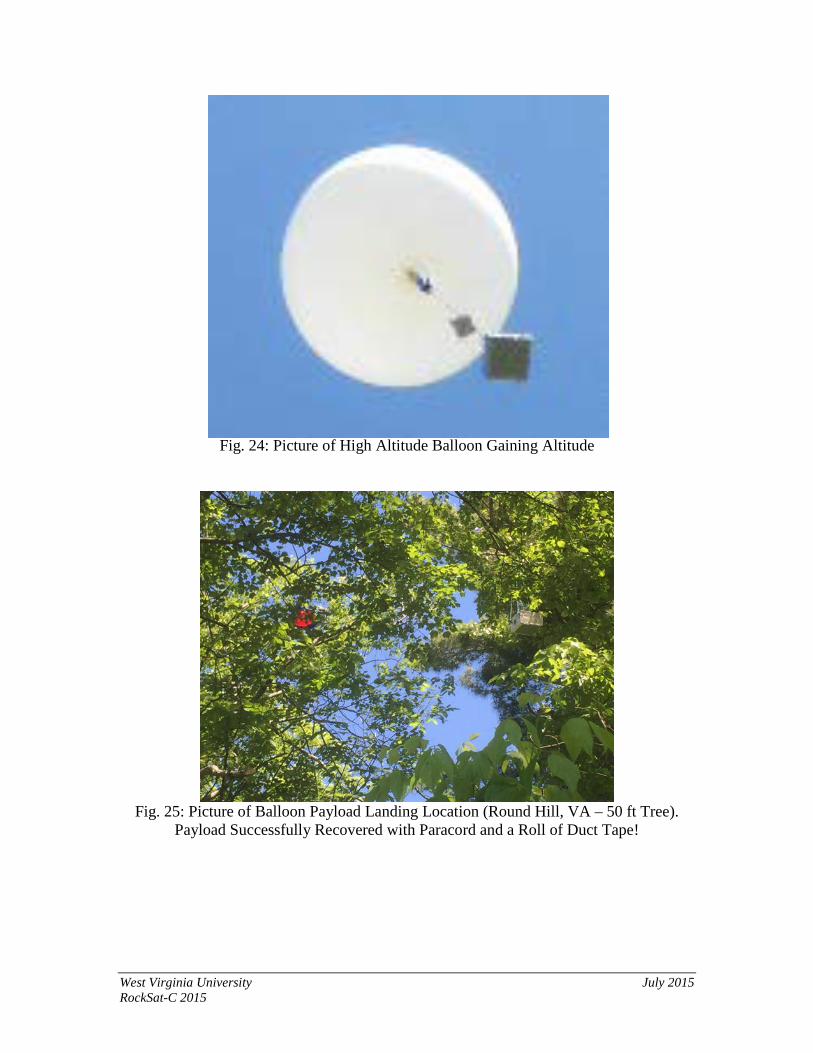
ground) housed the WVU-Cam experiment. After cutting the WVU-Cam experiment loose, the balloon was able to gain altitude at a reasonable rate (see Appendices). However, since the volume of the balloon was reduce as it was squeezed to tie off above the pinhole, the balloon did not have as much “stretch” and it popped sooner at 62,000 ft instead of reaching the desired 100,000 ft.
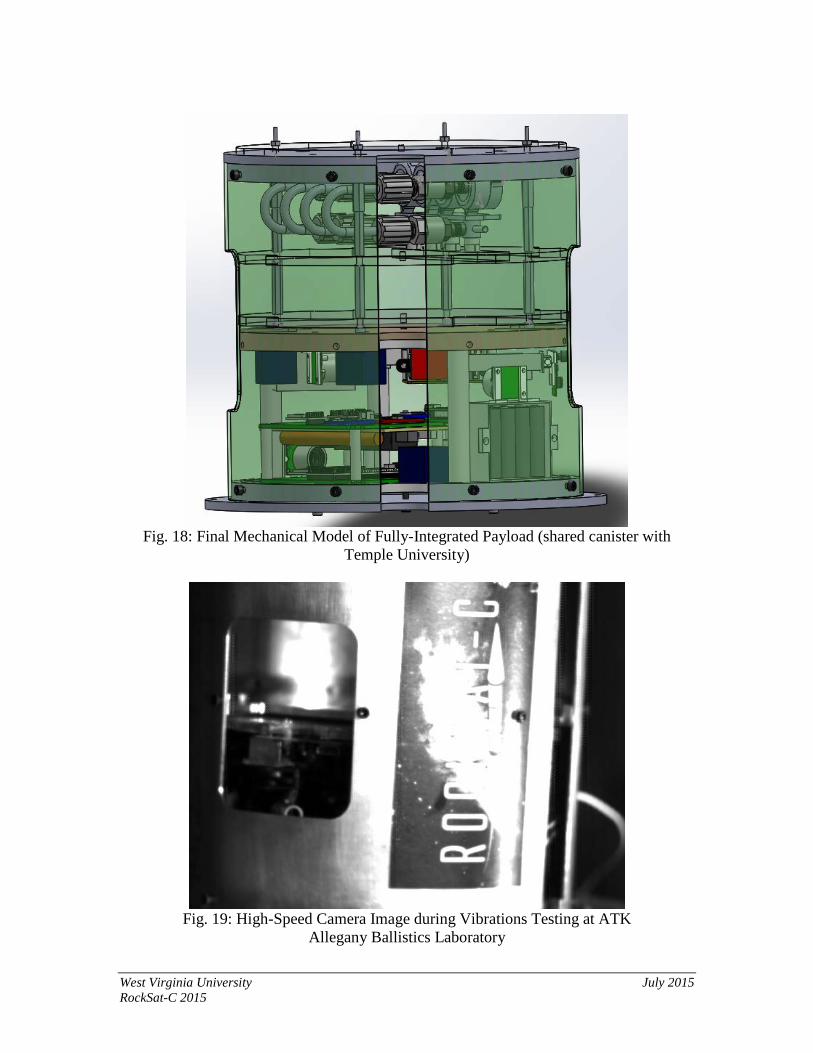
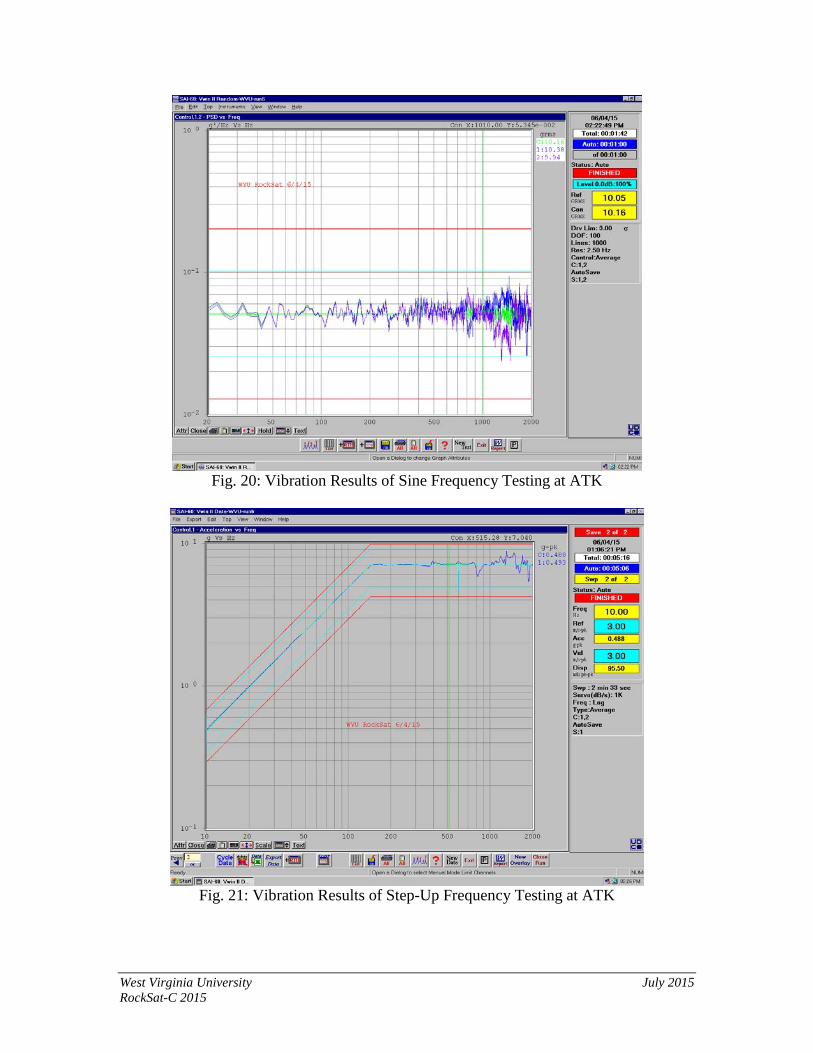
On June 4th 2015 the payload underwent initial vibe testing (3-axis vibration & electronics inspection) in ATK’s Allegany Ballistics Laboratory facilities (see Appendices). The electronic inspections occurred first. For the most part, there were no major comments or issues pointed out with the exception of the PCB patch work on WVU-Tech’s payload which was considered a failing item as we expected. It was pointed out that it was “fly or die” at this point and it was known that patching PCBs is poor design practice but options were limited. The ATK inspection staff provided useful feedback for general electronic circuits and assembly practices. Next was the 3-axis vibration testing on their two shaker-tables. Both a sine wave sweep through a range of 1-2000 Hz and a random sweep were performed. It was decided that power would not be on during the test and a successful test was defined as all components working after vibrations. A high speed camera was also set up to photograph the test to see if any component was shaking lose during the test. No items were found to be problematic during the vibrations test. However, next time power will be on during the test to ensure data collection throughout entire vibrations range.
Finally, spin and vibrations testing was performed during the integration week at Wallops. No major problems were found during these tests. A minor issue was found that one of the AA batteries had become disconnected in the battery holder even though a strip of tape was wrapped around the center of the battery pack. To solve this problem, two more strips of tape were applied to the top and bottom uncovered portions of the battery pack holders. This adequately addressed the problem.
6.0 Mission Results
The Terrier-Improved Orion launched at approximately 06:05 am on June 25, 2014 (Fig. 21). Although the main objectives of the mission were achieved, there were a few incidences which caused a loss of data for some components or in one case the entire experiment. Minimum mission success was achieved in that the students learned a tremendous amount of hands-on and technical knowledge during the entire design, fabrication, and integration process. However, only 3.5 out of 5 experiments returned useful data.
Due to the WVU-CAM experiment’s boot time, the activation was modified from launch-time (T+00:00) to early (T-03:00). Because of microcontroller startup process, data and image acquisition started at approximately T-02:20.
1. WVU-CAM:
The WVU-CAM experiment did not meet all of the mission objectives requirements, however it was partially successful in returning useful data. No images deemed scientifically useful were returned from either the NIR camera or the RPi camera for two different reasons. The NIR camera utilizes a USB connection to the Raspberry Pi and during launch this connection must have vibrated to the point that the operating
West Virginia University July 2015 RockSat-C 2015
system lost the device ID and no file was encoded or saved. The device was recognized sometime after the flight and splashdown occurred as images were collected floating in the ocean and during payload recovery process. As for the RPi camera, the position of the lens was too far off the mid-canister centerline and images of the external rocket skin were collected which were basically black images. This issue stemmed from a fundamental oversight in the design phase with the decision to use a Mid-Mounting plate. This basically takes away the midline of the optics port which is crucial for imaging experiments.
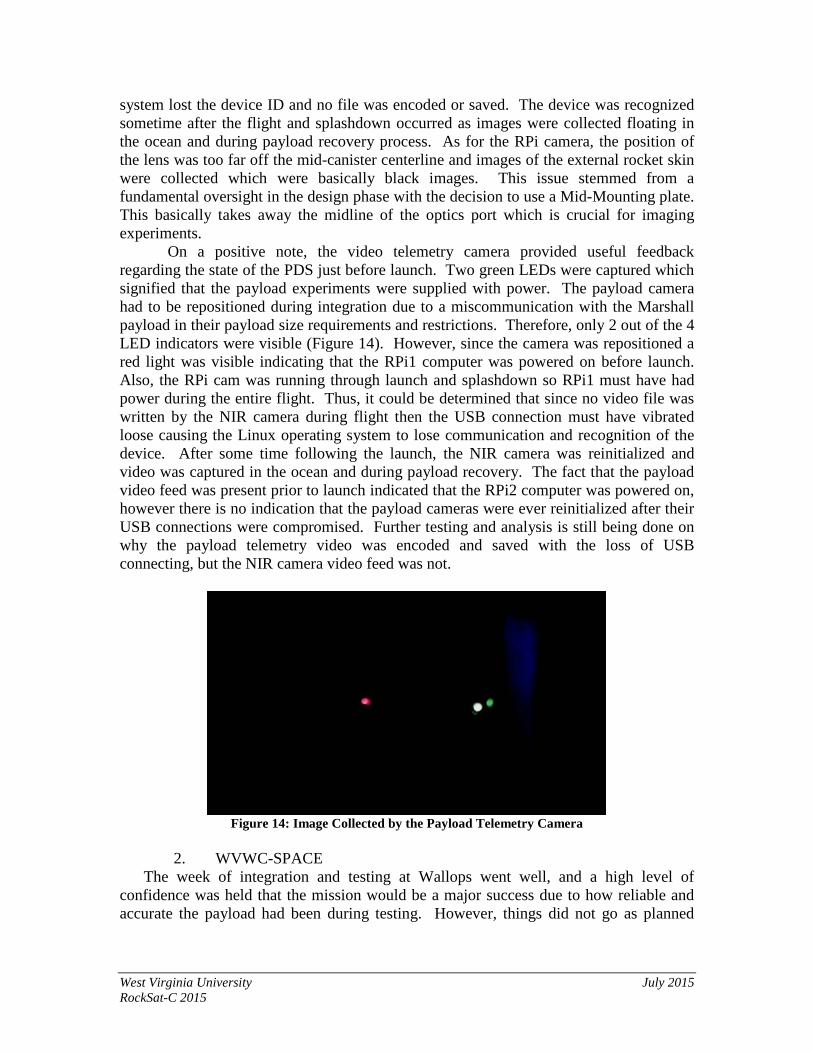
On a positive note, the video telemetry camera provided useful feedback regarding the state of the PDS just before launch. Two green LEDs were captured which signified that the payload experiments were supplied with power. The payload camera had to be repositioned during integration due to a miscommunication with the Marshall payload in their payload size requirements and restrictions. Therefore, only 2 out of the 4 LED indicators were visible (Figure 14). However, since the camera was repositioned a red light was visible indicating that the RPi1 computer was powered on before launch. Also, the RPi cam was running through launch and splashdown so RPi1 must have had power during the entire flight. Thus, it could be determined that since no video file was written by the NIR camera during flight then the USB connection must have vibrated loose causing the Linux operating system to lose communication and recognition of the device. After some time following the launch, the NIR camera was reinitialized and video was captured in the ocean and during payload recovery. The fact that the payload video feed was present prior to launch indicated that the RPi2 computer was powered on, however there is no indication that the payload cameras were ever reinitialized after their USB connections were compromised. Further testing and analysis is still being done on why the payload telemetry video was encoded and saved with the loss of USB connecting, but the NIR camera video feed was not.
Figure 14: Image Collected by the Payload Telemetry Camera
2. WVWC-SPACE
The week of integration and testing at Wallops went well, and a high level of confidence was held that the mission would be a major success due to how reliable and accurate the payload had been during testing. However, things did not go as planned
West Virginia University July 2015 RockSat-C 2015
during launch because the payload did not appear to receive power for the flight, which meant no data was recorded. This was likely due to a damaged/faulty connecter.
During the integration of the payload into the canister with payloads from other West Virginia schools, Wesleyan’s payload was still accurately and reliably recording data every time it received power. After the spin and vibration test, the data were checked and everything was still working fine; the circuit was still recording accurate data. However, there was an issue during the final integration. During final integration and after other West Virginia teams finished making modification to their payloads, a final stacking process was performed on a few excess cables but the connecter on one of the power lines was damaged due to being pulled on while glued. After launch de-integration, it was verified through visual inspection that all connecters where still connected.
It was first thought that the g-forces from the rocket may have caused something to malfunction, but it seems that this is not the case because the payload had a T-3:00 minute early activation. If there was power for the first 3 minutes before flight there should have been a single data file for that time as the SD card was wiped clean before final check-in and launch integration, but there was no data present on the SD card at all after de-integration. After the flight, the connector was removed and the payload was able to be powered and record accurate data. However, the plug was damaged slightly. Due to this behavior, it can be concluded that the connector was the most likely cause of the failure of the payload.
3. Marshall-SPACE: After launch, the payload was no longer structurally intact. Most of the payload
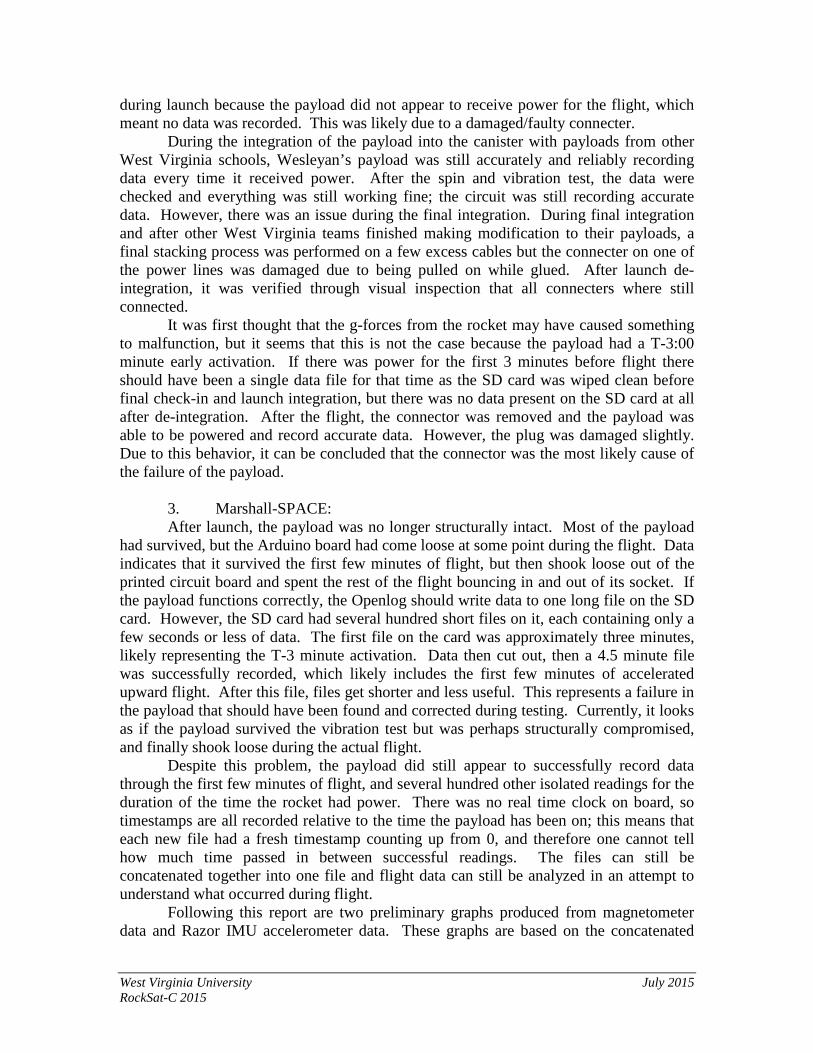
had survived, but the Arduino board had come loose at some point during the flight. Data indicates that it survived the first few minutes of flight, but then shook loose out of the printed circuit board and spent the rest of the flight bouncing in and out of its socket. If the payload functions correctly, the Openlog should write data to one long file on the SD card. However, the SD card had several hundred short files on it, each containing only a few seconds or less of data. The first file on the card was approximately three minutes, likely representing the T-3 minute activation. Data then cut out, then a 4.5 minute file was successfully recorded, which likely includes the first few minutes of accelerated upward flight. After this file, files get shorter and less useful. This represents a failure in the payload that should have been found and corrected during testing. Currently, it looks as if the payload survived the vibration test but was perhaps structurally compromised, and finally shook loose during the actual flight. Despite this problem, the payload did still appear to successfully record data through the first few minutes of flight, and several hundred other isolated readings for the duration of the time the rocket had power. There was no real time clock on board, so timestamps are all recorded relative to the time the payload has been on; this means that each new file had a fresh timestamp counting up from 0, and therefore one cannot tell how much time passed in between successful readings. The files can still be concatenated together into one file and flight data can still be analyzed in an attempt to understand what occurred during flight. Following this report are two preliminary graphs produced from magnetometer data and Razor IMU accelerometer data. These graphs are based on the concatenated
West Virginia University July 2015 RockSat-C 2015
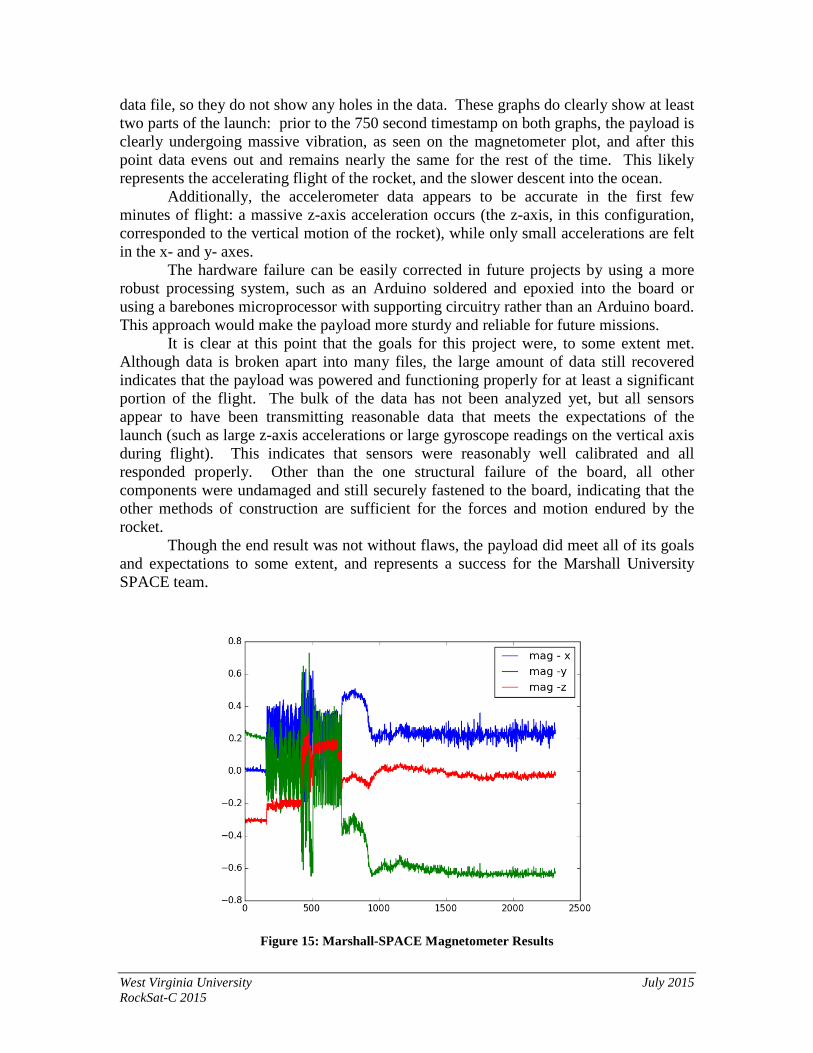
data file, so they do not show any holes in the data. These graphs do clearly show at least two parts of the launch: prior to the 750 second timestamp on both graphs, the payload is clearly undergoing massive vibration, as seen on the magnetometer plot, and after this point data evens out and remains nearly the same for the rest of the time. This likely represents the accelerating flight of the rocket, and the slower descent into the ocean. Additionally, the accelerometer data appears to be accurate in the first few minutes of flight: a massive z-axis acceleration occurs (the z-axis, in this configuration, corresponded to the vertical motion of the rocket), while only small accelerations are felt in the x- and y- axes. The hardware failure can be easily corrected in future projects by using a more robust processing system, such as an Arduino soldered and epoxied into the board or using a barebones microprocessor with supporting circuitry rather than an Arduino board. This approach would make the payload more sturdy and reliable for future missions. It is clear at this point that the goals for this project were, to some extent met. Although data is broken apart into many files, the large amount of data still recovered indicates that the payload was powered and functioning properly for at least a significant portion of the flight. The bulk of the data has not been analyzed yet, but all sensors appear to have been transmitting reasonable data that meets the expectations of the launch (such as large z-axis accelerations or large gyroscope readings on the vertical axis during flight). This indicates that sensors were reasonably well calibrated and all responded properly. Other than the one structural failure of the board, all other components were undamaged and still securely fastened to the board, indicating that the other methods of construction are sufficient for the forces and motion endured by the rocket. Though the end result was not without flaws, the payload did meet all of its goals and expectations to some extent, and represents a success for the Marshall University SPACE team.
Figure 15: Marshall-SPACE Magnetometer Results
West Virginia University July 2015 RockSat-C 2015
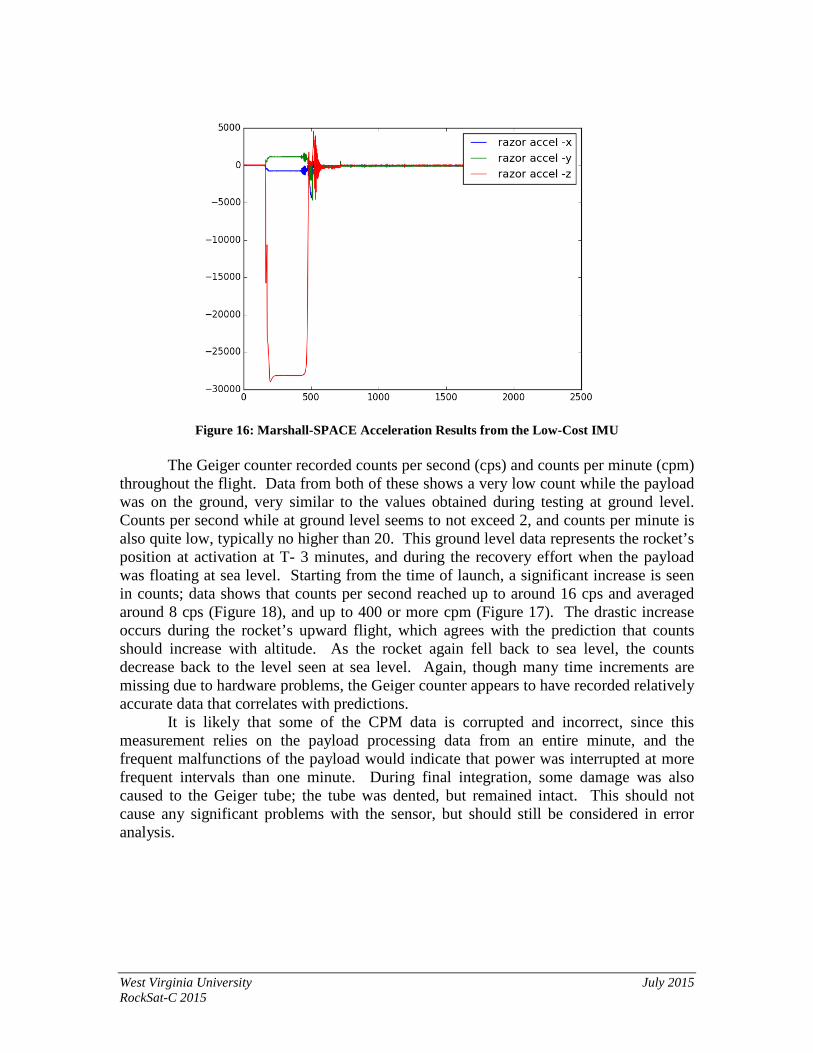
Figure 16: Marshall-SPACE Acceleration Results from the Low-Cost IMU
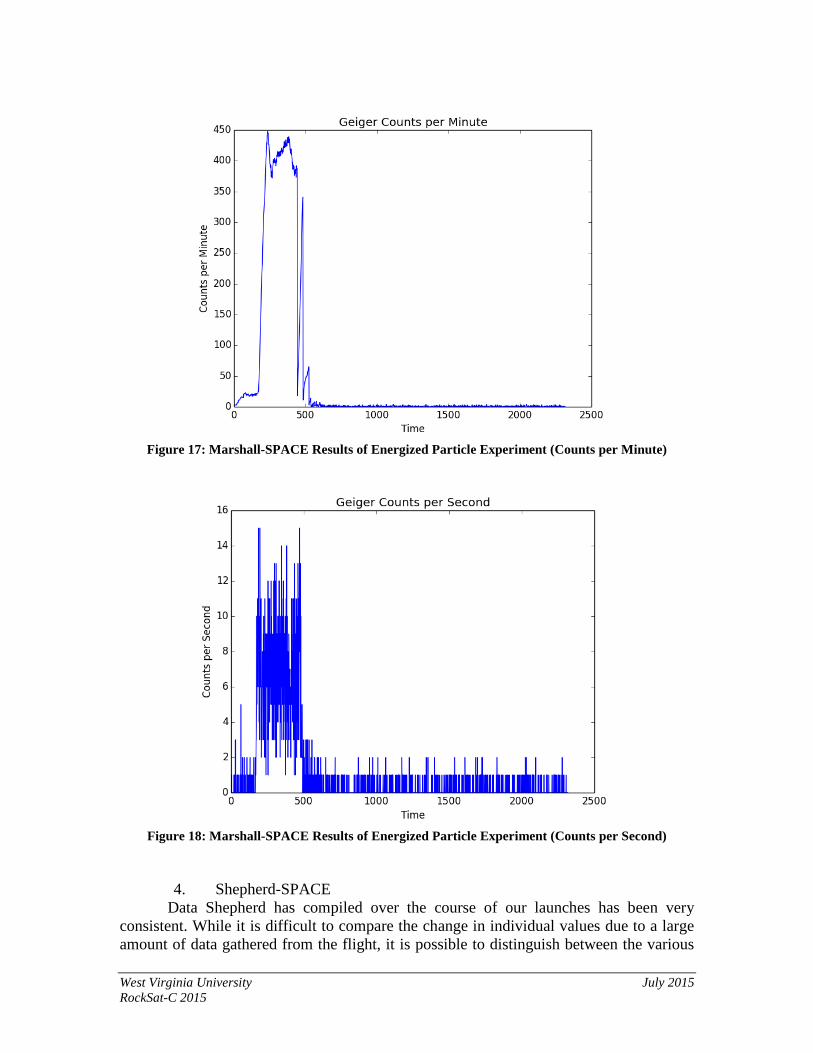
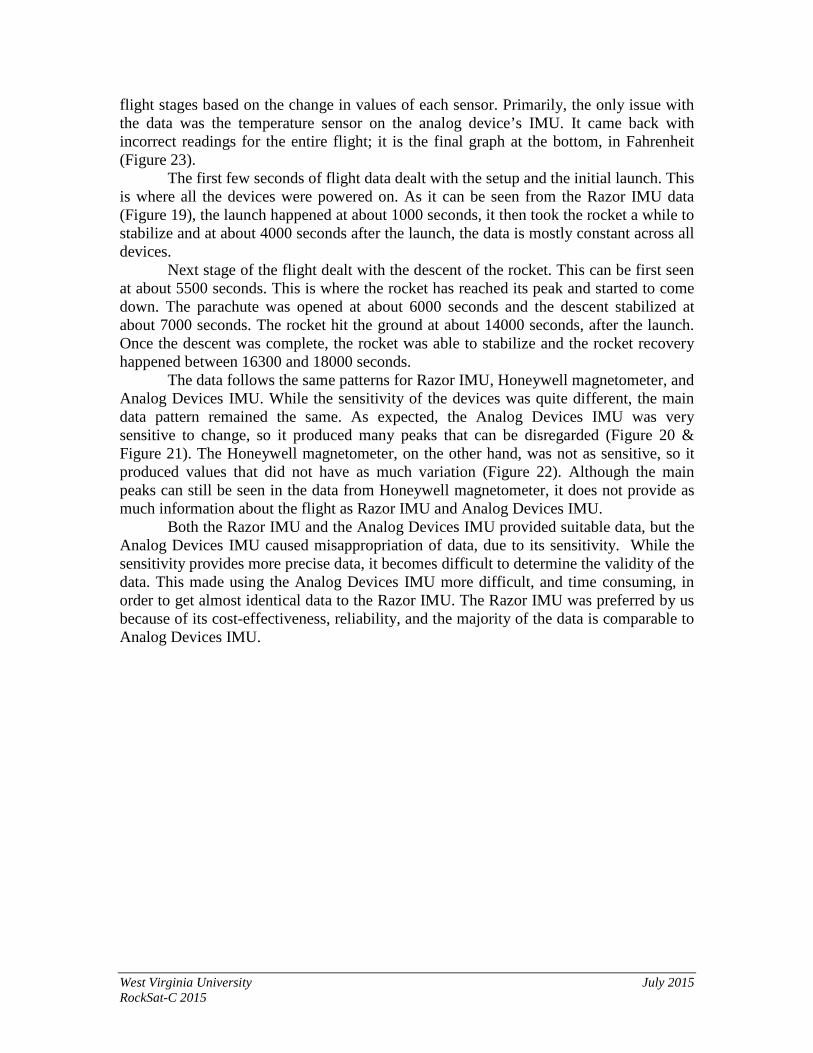
The Geiger counter recorded counts per second (cps) and counts per minute (cpm)
throughout the flight. Data from both of these shows a very low count while the payload was on the ground, very similar to the values obtained during testing at ground level. Counts per second while at ground level seems to not exceed 2, and counts per minute is also quite low, typically no higher than 20. This ground level data represents the rocket’s position at activation at T- 3 minutes, and during the recovery effort when the payload was floating at sea level. Starting from the time of launch, a significant increase is seen in counts; data shows that counts per second reached up to around 16 cps and averaged around 8 cps (Figure 18), and up to 400 or more cpm (Figure 17). The drastic increase occurs during the rocket’s upward flight, which agrees with the prediction that counts should increase with altitude. As the rocket again fell back to sea level, the counts decrease back to the level seen at sea level. Again, though many time increments are missing due to hardware problems, the Geiger counter appears to have recorded relatively accurate data that correlates with predictions.
It is likely that some of the CPM data is corrupted and incorrect, since this measurement relies on the payload processing data from an entire minute, and the frequent malfunctions of the payload would indicate that power was interrupted at more frequent intervals than one minute. During final integration, some damage was also caused to the Geiger tube; the tube was dented, but remained intact. This should not cause any significant problems with the sensor, but should still be considered in error analysis.
West Virginia University July 2015 RockSat-C 2015
Figure 17: Marshall-SPACE Results of Energized Particle Experiment (Counts per Minute)
Figure 18: Marshall-SPACE Results of Energized Particle Experiment (Counts per Second)
4. Shepherd-SPACE
Data Shepherd has compiled over the course of our launches has been very consistent. While it is difficult to compare the change in individual values due to a large amount of data gathered from the flight, it is possible to distinguish between the various
West Virginia University July 2015 RockSat-C 2015
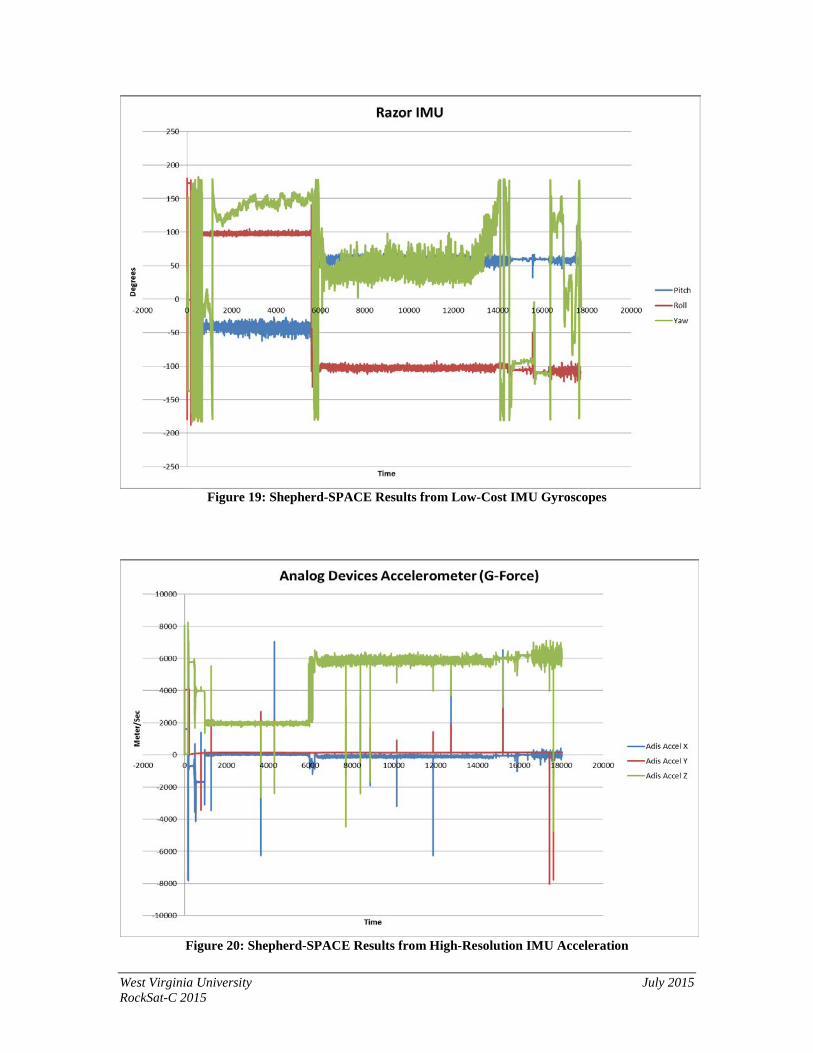
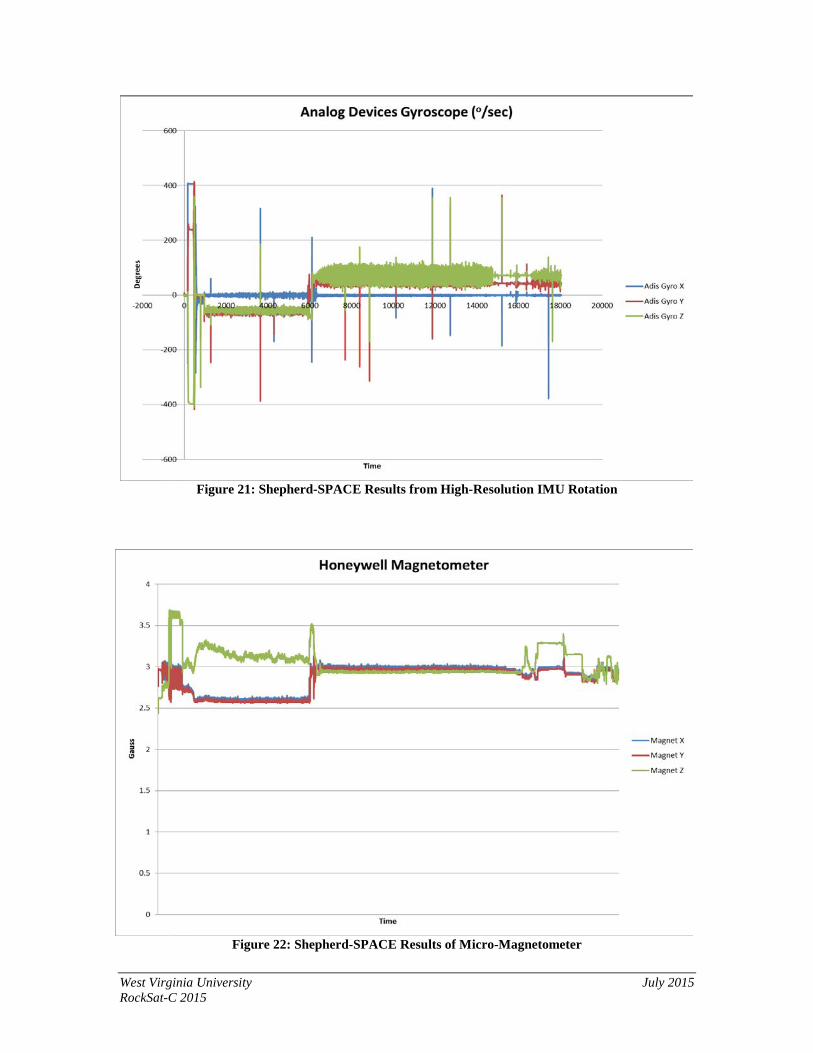
flight stages based on the change in values of each sensor. Primarily, the only issue with the data was the temperature sensor on the analog device’s IMU. It came back with incorrect readings for the entire flight; it is the final graph at the bottom, in Fahrenheit (Figure 23). The first few seconds of flight data dealt with the setup and the initial launch. This is where all the devices were powered on. As it can be seen from the Razor IMU data (Figure 19), the launch happened at about 1000 seconds, it then took the rocket a while to stabilize and at about 4000 seconds after the launch, the data is mostly constant across all devices. Next stage of the flight dealt with the descent of the rocket. This can be first seen at about 5500 seconds. This is where the rocket has reached its peak and started to come down. The parachute was opened at about 6000 seconds and the descent stabilized at about 7000 seconds. The rocket hit the ground at about 14000 seconds, after the launch. Once the descent was complete, the rocket was able to stabilize and the rocket recovery happened between 16300 and 18000 seconds. The data follows the same patterns for Razor IMU, Honeywell magnetometer, and Analog Devices IMU. While the sensitivity of the devices was quite different, the main data pattern remained the same. As expected, the Analog Devices IMU was very sensitive to change, so it produced many peaks that can be disregarded (Figure 20 & Figure 21). The Honeywell magnetometer, on the other hand, was not as sensitive, so it produced values that did not have as much variation (Figure 22). Although the main peaks can still be seen in the data from Honeywell magnetometer, it does not provide as much information about the flight as Razor IMU and Analog Devices IMU. Both the Razor IMU and the Analog Devices IMU provided suitable data, but the Analog Devices IMU caused misappropriation of data, due to its sensitivity. While the sensitivity provides more precise data, it becomes difficult to determine the validity of the data. This made using the Analog Devices IMU more difficult, and time consuming, in order to get almost identical data to the Razor IMU. The Razor IMU was preferred by us because of its cost-effectiveness, reliability, and the majority of the data is comparable to Analog Devices IMU.
West Virginia University July 2015 RockSat-C 2015
Figure 19: Shepherd-SPACE Results from Low-Cost IMU Gyroscopes
Figure 20: Shepherd-SPACE Results from High-Resolution IMU Acceleration
West Virginia University July 2015 RockSat-C 2015
Figure 21: Shepherd-SPACE Results from High-Resolution IMU Rotation
Figure 22: Shepherd-SPACE Results of Micro-Magnetometer
West Virginia University July 2015 RockSat-C 2015
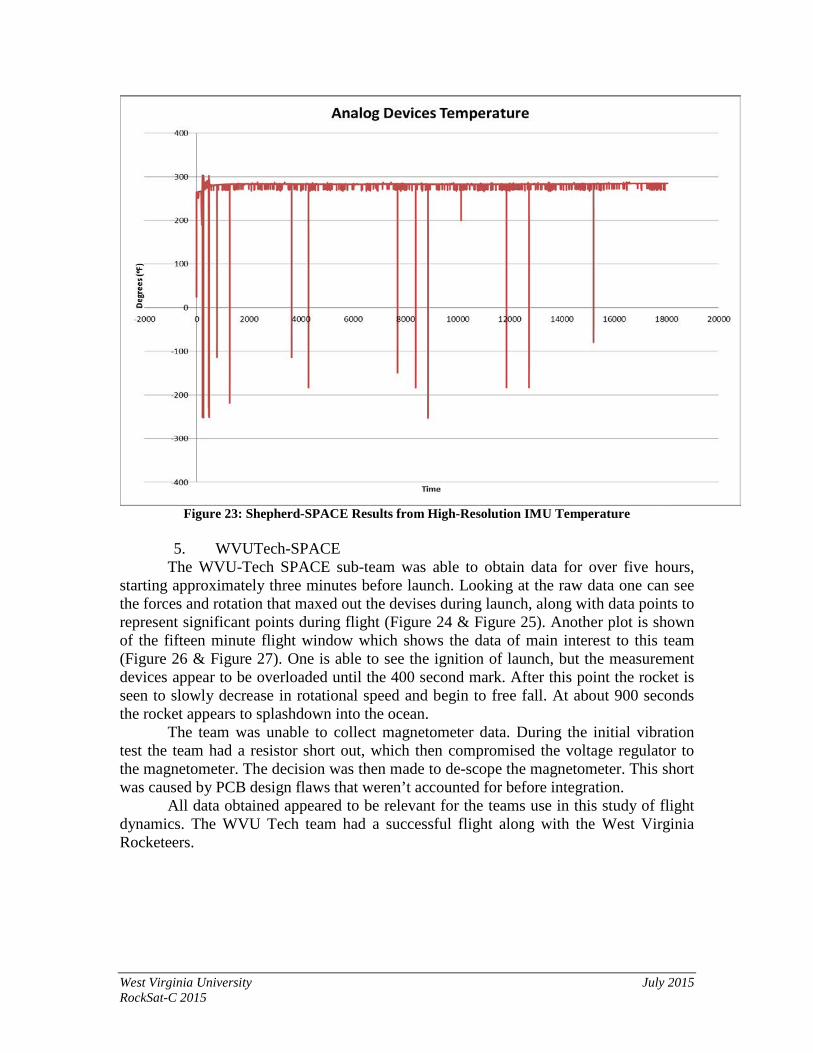
Figure 23: Shepherd-SPACE Results from High-Resolution IMU Temperature
5. WVUTech-SPACE
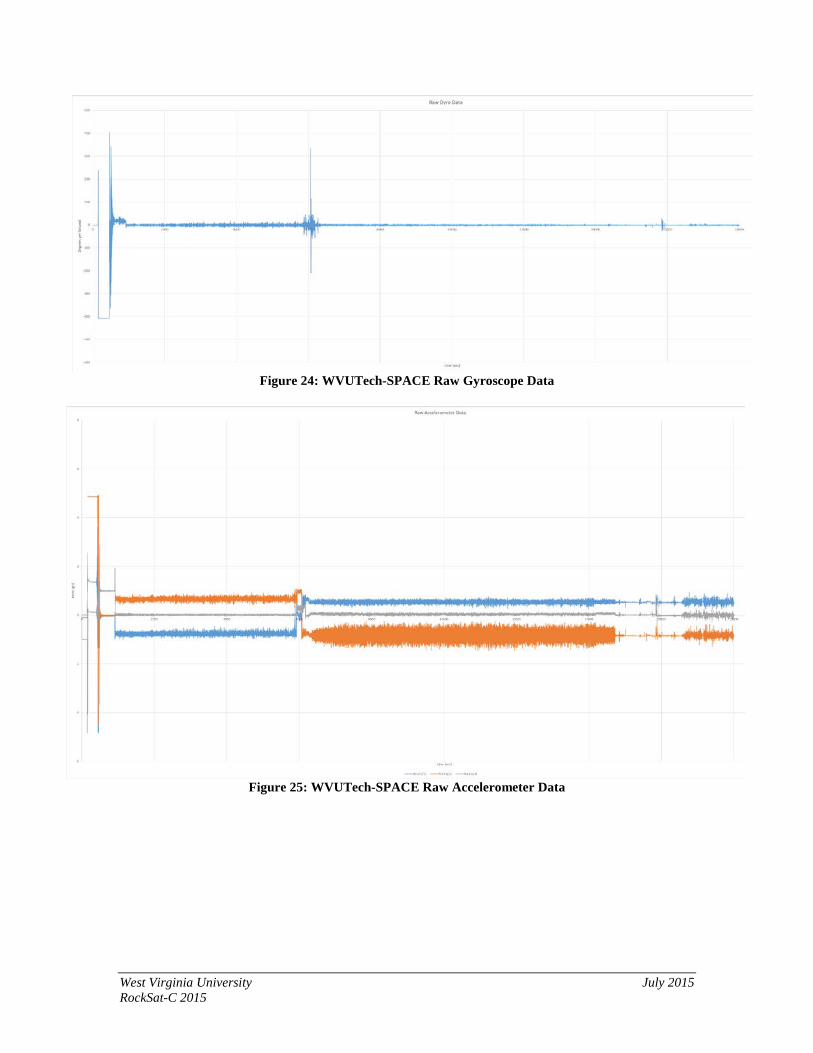
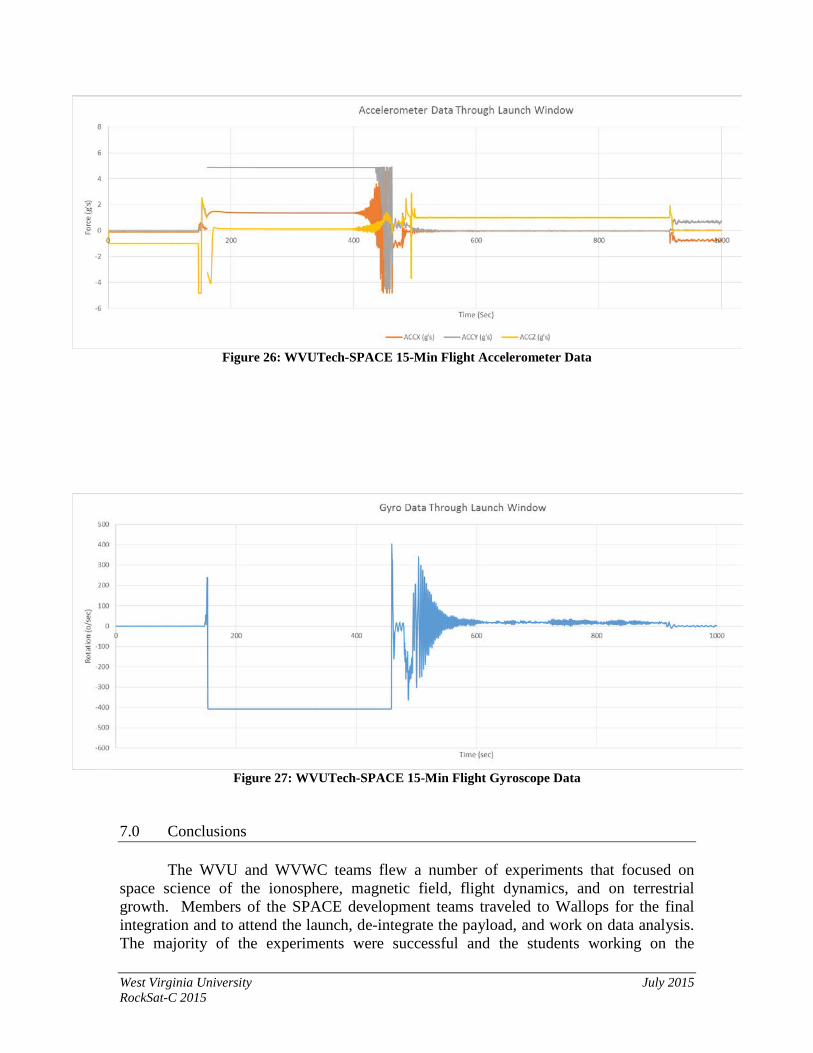
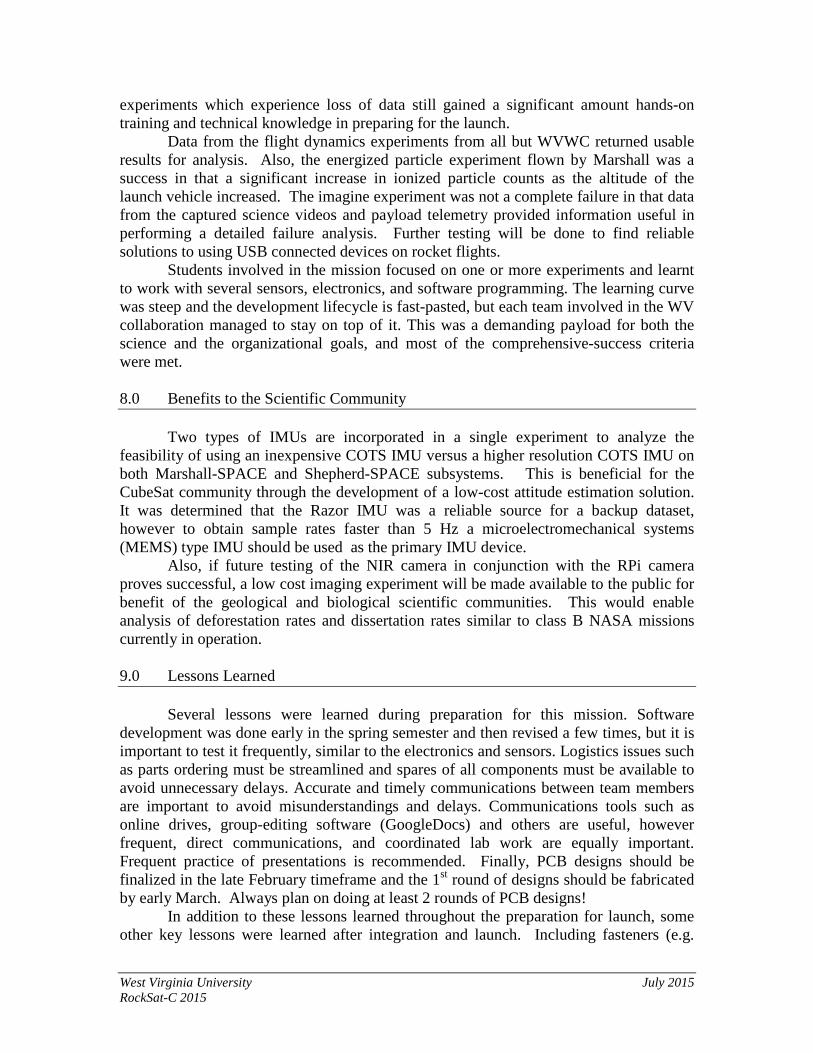
The WVU-Tech SPACE sub-team was able to obtain data for over five hours, starting approximately three minutes before launch. Looking at the raw data one can see the forces and rotation that maxed out the devises during launch, along with data points to represent significant points during flight (Figure 24 & Figure 25). Another plot is shown of the fifteen minute flight window which shows the data of main interest to this team (Figure 26 & Figure 27). One is able to see the ignition of launch, but the measurement devices appear to be overloaded until the 400 second mark. After this point the rocket is seen to slowly decrease in rotational speed and begin to free fall. At about 900 seconds the rocket appears to splashdown into the ocean. The team was unable to collect magnetometer data. During the initial vibration test the team had a resistor short out, which then compromised the voltage regulator to the magnetometer. The decision was then made to de-scope the magnetometer. This short was caused by PCB design flaws that weren’t accounted for before integration. All data obtained appeared to be relevant for the teams use in this study of flight dynamics. The WVU Tech team had a successful flight along with the West Virginia Rocketeers.
West Virginia University July 2015 RockSat-C 2015
Figure 24: WVUTech-SPACE Raw Gyroscope Data
Figure 25: WVUTech-SPACE Raw Accelerometer Data
West Virginia University July 2015 RockSat-C 2015
Figure 26: WVUTech-SPACE 15-Min Flight Accelerometer Data
Figure 27: WVUTech-SPACE 15-Min Flight Gyroscope Data
7.0 Conclusions
The WVU and WVWC teams flew a number of experiments that focused on space science of the ionosphere, magnetic field, flight dynamics, and on terrestrial growth. Members of the SPACE development teams traveled to Wallops for the final integration and to attend the launch, de-integrate the payload, and work on data analysis. The majority of the experiments were successful and the students working on the
West Virginia University July 2015 RockSat-C 2015
experiments which experience loss of data still gained a significant amount hands-on training and technical knowledge in preparing for the launch.
Data from the flight dynamics experiments from all but WVWC returned usable results for analysis. Also, the energized particle experiment flown by Marshall was a success in that a significant increase in ionized particle counts as the altitude of the launch vehicle increased. The imagine experiment was not a complete failure in that data from the captured science videos and payload telemetry provided information useful in performing a detailed failure analysis. Further testing will be done to find reliable solutions to using USB connected devices on rocket flights.
Students involved in the mission focused on one or more experiments and learnt to work with several sensors, electronics, and software programming. The learning curve was steep and the development lifecycle is fast-pasted, but each team involved in the WV collaboration managed to stay on top of it. This was a demanding payload for both the science and the organizational goals, and most of the comprehensive-success criteria were met.
8.0 Benefits to the Scientific Community
Two types of IMUs are incorporated in a single experiment to analyze the feasibility of using an inexpensive COTS IMU versus a higher resolution COTS IMU on both Marshall-SPACE and Shepherd-SPACE subsystems. This is beneficial for the CubeSat community through the development of a low-cost attitude estimation solution. It was determined that the Razor IMU was a reliable source for a backup dataset, however to obtain sample rates faster than 5 Hz a microelectromechanical systems (MEMS) type IMU should be used as the primary IMU device.
Also, if future testing of the NIR camera in conjunction with the RPi camera proves successful, a low cost imaging experiment will be made available to the public for benefit of the geological and biological scientific communities. This would enable analysis of deforestation rates and dissertation rates similar to class B NASA missions currently in operation.
9.0 Lessons Learned
Several lessons were learned during preparation for this mission. Software development was done early in the spring semester and then revised a few times, but it is important to test it frequently, similar to the electronics and sensors. Logistics issues such as parts ordering must be streamlined and spares of all components must be available to avoid unnecessary delays. Accurate and timely communications between team members are important to avoid misunderstandings and delays. Communications tools such as online drives, group-editing software (GoogleDocs) and others are useful, however frequent, direct communications, and coordinated lab work are equally important. Frequent practice of presentations is recommended. Finally, PCB designs should be finalized in the late February timeframe and the 1st round of designs should be fabricated by early March. Always plan on doing at least 2 rounds of PCB designs!
In addition to these lessons learned throughout the preparation for launch, some other key lessons were learned after integration and launch. Including fasteners (e.g.
West Virginia University July 2015 RockSat-C 2015
nuts/bolts, and standoffs) in the mechanical model to avoid clearance issues during canister integration. There were several instances where holes were experiments were placed to close together making it much more difficult to tighten the fasteners with standard tools. Also, the subsystem design requirements were not heavily enforced or properly communicated to each team member and in some instances off-ramps/de-scopes were taken to waive some of these requirements and not properly communicated to the rest of the team. This lesson learned emphasizes the importance of establishing design requirements and levying them on the design team. This also outlines the importance of strong communication and expression of concern amongst all team members involved.
After preliminary data reduction analysis, it was found that the early activation not only provided adequate time for the computers to boot up and start executing the flight software, but it also allowed for a steady-state to be reached for all other experiments prior to the launch making data analysis and fault assessment less complicated. Finally, it was learned that USB connections should be glued or soldered into the USB socket to prevent loss of connection during high vibrations. In fact, all removable connections should be permanently fixed (solder or epoxy) to the PCB prior to launch unless the need to have a removable connection is justified.
10.0 Potential Follow-on Work
Now that each of the participating schools of the RockSat-C 2015 launch have the experience of putting together a basic payload for suborbital flight, there is a high probability that each team will either design new payload for 2016, or modify their existing payload and fly again in 2016. Since the imaging experiment did not meet the comprehensive success criteria for this mission, this will be flown on a high altitude balloon flight this fall. Hopefully this flight will allow the collection of Earth-viewing images necessary to perform the NDVI analysis along the flight path of the balloon. Furthermore, a more detailed comparison is ongoing between the data collected from the Razor IMU and the Analog Devices IMU to provide a better assessment of the feasibility of using the Razor IMU in a low-cost attitude estimation system for CubeSats.
Also, there will be 2 new participants in the WV Collaboration in 2016, West Virginia State University and Blue Ridge Community & Technical College. In order to bring these new students up to speed on the payload design and software development, a 2nd high altitude balloon is planned for early next spring.
Acknowledgments: A special thanks goes to RockSat manager Becca Lidvall for
her help, guidance, and patience throughout the year as there were several added complexities associated with having several groups across an entire state participate in a single payload development effort. We also thank Chris Koehler for creating an amazing program, and we are truly grateful for having the opportunity to work alongside the phenomenal Wallops staff. A personal thank you goes to Andrew Mandigo for answering specific mechanical and rocket-related questions and to Brittany McKinlay for being awesome! Tremendous thanks goes to the NASA IV&V Program for provide financial support and synergy to this effort. Last but not least, the West Virginia Space Grant Consortium have been a strong advocate of this program from the very beginning and we are grateful to them for all their administrative support!
West Virginia University July 2015 RockSat-C 2015
11.0 References [1] Google Sites, Student Partnership for the Advancement of Cosmic Exploration (SPACE),
https://sites.google.com/site/wvuspace. [2] The Landscaping Toolbox, Normalized Difference Vegetation Index,
http://wiki.landscapetoolbox.org/doku.php/remote_sensing_methods:normalized_difference_vegetation_index.
[3] Adafruit, Infragram DIY Plant Analysis Webcam, https://www.adafruit.com/products/1722 [4] Adafruit, Raspberry Pi Camera specifications, http://www.adafruit.com/products/1367. [5] RobotShop, Firgelli Technologies L12 Actuator 30mm 210:1 12V PLC/RC Control,
http://www.robotshop.com/en/firgelli-technologies-l12-actuator-30mm-210-1-12v-position-controller.html
[6] LinkSprite, Mini Webcam for Robot Video Real Time Video Stream – pcDuino, http://store.linksprite.com/mini-webcam-for-robot-video-real-time-video-stream-pcduino/
[7] Adafruit, Raspberry Pi Model B+ 512MB RAM, https://www.adafruit.com/products/1914 [8] Digi-Key, ADIS16400/ADIS16405 High Precision Tri-Axis Inertial Sensor Gyroscope,
Magnetometer, Accelerometer, http://www.digikey.com/catalog/en/partgroup/adis16400-adis16405/20448
[9] Digi-Key, Honeywell Microelectronics & Precision Sensors HMC2003, http://www.digikey.com/product-detail/en/HMC2003/342-1011-ND/334166
[10] Chaney Electronics, Inc., MICRO GEIGER COUNTER KIT, http://www.electronickitsbychaneyelectronics.com/prodinfo.asp?number=C6986
[11] SparkFun, SparkFun OpenLog, https://www.sparkfun.com/products/9530 [12] SparkFun, Arduino Mini 05, https://www.sparkfun.com/products/11303 [13] Sparkfun, 9 Degrees of Freedom - Razor IMU, https://www.sparkfun.com/products/10736 [14] MightyOhm, GEIGER COUNTER, http://mightyohm.com/blog/products/geiger-counter/ [15] SparkFun, Arduino Pro Mini 328 - 5V/16MHz, https://www.sparkfun.com/products/11113 [16] DigiKey, Analog Devices Inc ADIS16300AMLZ, http://www.digikey.com/product-
search/en?keywords=adis16300 [17]NetBurner, MOD5213 Core Module, http://www.netburner.com/products/core-
modules/mod5213 [18] NASA, Sounding Rocket Program Handbook, Goddard Space Flight Center, Wallops Flight
Facility, June 2005. [19] Plane, J.M.C., A reference atmosphere for the atomic sodium layer, 2009. [20] Wikipedia, Ionosphere, http://en.wikipedia.org/wiki/Ionosphere, retrieved May 1, 2014. [21] NOAA Nation Centers for Environmental Information, The World Magnetic Model,
https://www.ngdc.noaa.gov/geomag/WMM/DoDWMM.shtml
West Virginia University July 2015 RockSat-C 2015
11.0 Appendices
Cig. 1: Atmospheric (left) and ionospheric (right) layers shown schematically
with rockets and other ground and space instruments (middle) [19]
Cig. 2: US/UK World Magnetic Model – Epoch 2015.0
Annual Change Total Intensity (C) [21]
West Virginia University July 2015 RockSat-C 2015
Cig. 3: Energetic particles coming through Earth’s atmosphere [20].
Fig. 4: Average Reflectance for Grassland Cover Types [2]
West Virginia University July 2015 RockSat-C 2015
Fig.5: Comparison of NDVI Image vs. a Normal RGB Image [2]
Fig. 6: Mission Concept of Operations Diagram
West Virginia University July 2015 RockSat-C 2015
Fig. 7: WVWC-SPACE PCB Schematic
Fig. 8: WVWC-SPACE PCB Design
West Virginia University July 2015 RockSat-C 2015
Fig. 9: WVWC-SPACE PCB Assembly
Fig. 10: Marshall-SPACE PCB Schematic
West Virginia University July 2015 RockSat-C 2015
Fig. 11: Marshall-SPACE PCB Design
Fig. 12: Marshall-SPACE PCB Assembly
West Virginia University July 2015 RockSat-C 2015
Fig. 13: Shepherd-SPACE PCB Schematic
Fig. 14: Shepherd-SPACE PCB Design
West Virginia University July 2015 RockSat-C 2015
Fig. 15: WVUTech-SPACE PCB Schematic
West Virginia University July 2015 RockSat-C 2015
Fig. 16: Power Distribution System PCB Schematic
Fig. 17: Power Distribution System PCB Design
West Virginia University July 2015 RockSat-C 2015
Fig. 18: Final Mechanical Model of Fully-Integrated Payload (shared canister with
Temple University)
Fig. 19: High-Speed Camera Image during Vibrations Testing at ATK
Allegany Ballistics Laboratory
West Virginia University July 2015 RockSat-C 2015
Fig. 20: Vibration Results of Sine Frequency Testing at ATK
Fig. 21: Vibration Results of Step-Up Frequency Testing at ATK
West Virginia University July 2015 RockSat-C 2015
Fig. 22: Picture of Students Filling High Altitude Balloon for Launch
Fig. 23: Picture of High Altitude Balloon Launch with
Third Payload Package Removed Due to Filling Mishap
West Virginia University July 2015 RockSat-C 2015
Fig. 24: Picture of High Altitude Balloon Gaining Altitude
Fig. 25: Picture of Balloon Payload Landing Location (Round Hill, VA – 50 ft Tree).
Payload Successfully Recovered with Paracord and a Roll of Duct Tape!
West Virginia University July 2015 RockSat-C 2015
Fig. 26-: RockSat-C/Rock-On 2015 Launch Group Photo