rockland wastewater treatment plant revie clean water agency engineering services city of...
TRANSCRIPT
City of Clarence-Rockland
Rockland Wastewater Treatment Plant Review
Submitted by
February 2015
ENGINEERING SERVICES
Sheridan Centre TEL: 905-491-3030
2225 Erin Mills Parkway FAX: 905-855-3232
Suite 1200 www.ocwa.com
Mississauga, Ontario Dir Line: 905-491-3053
Canada L5K 1T9
March 4, 2015 Mr. Denis Longpré City of Clarence-Rockland 1560 Laurier Street, Rockland, Ontario K4K 1P7 RE: City of Clarence-Rockland Rockland Wastewater Treatment Plant Review
Dear Mr. Longpré, Please find attached Ontario Clean Water Agency’s report documenting our review and assessment of the Rockland Wastewater Treatment Plant. The report has been completed using the information gathered from our site visit on Monday, October 20, 2014, and discussions with City and OCWA staff on Tuesday, October 21, 2014, along with information obtained during the assignment. We trust that our report is complete and adequately describes our conclusions. Should you have any questions or concerns, please contact the undersigned for any clarification. We thank you for the opportunity to provide you with OCWA’s engineering services and look forward to working closely with the City of Clarence-Rockland again. Sincerely, Andy K. Valickis, P.Eng. Senior Project Manager Engineering Services HW/ enclosures
Ontario Clean Water Agency Engineering Services City of Clarence-Rockland Rockland Wastewater Treatment Plant Review February 2015
Page i
TABLE OF CONTENTS
1.0 Introduction ....................................................................................................................... 1
2.0 Facility Description ............................................................................................................ 1
3.0 Plant Capacity ................................................................................................................... 2
3.1 Growth ............................................................................................................................ 2 3.2 Flow Projections ............................................................................................................. 2 2.3 Facility Expansion ........................................................................................................... 4
4.0 Capacity Assessment ........................................................................................................ 5
4.1 Facility Assessment ............................................................................................................. 5 4.2 Performance Assessment .................................................................................................... 6 4.3 Major Unit Process Evaluation ........................................................................................... 12 4.4 Factors ............................................................................................................................... 16 4.5 Evaluation .......................................................................................................................... 17
5.0 Odour Issues ................................................................................................................... 18
5.1 Odour Causes .............................................................................................................. 19 5.2 Site Evaluation .............................................................................................................. 19
5.2.1 Screening/Grit Removal Review ............................................................................. 19 5.2.2 Biosolids Handling Facility ....................................................................................... 21
5.3 Recommendations ........................................................................................................ 22
6 Capital Plan ..................................................................................................................... 22
6.1 Headworks .................................................................................................................... 22 6.2 Aerobic Digester ........................................................................................................... 23 6.3 Chemical Feed System ................................................................................................ 23 6.4 Pumps and Blowers ...................................................................................................... 24 6.5 Sequent Batch Reactor ................................................................................................ 24 6.6 Effluent (Decant) Equalization/Chlorine Contact Tank ................................................. 24 6.7 Plant Outfall Sewer ....................................................................................................... 24 6.8 Process Sump Pumps .................................................................................................. 25 6.9 Equalization Storage .................................................................................................... 25 6.10 Biosolids System .......................................................................................................... 25 6.11 Standby Power Facility ................................................................................................. 25 6.12 Building and Other Components .................................................................................. 25 6.13 Plant Expansion ............................................................................................................ 26 6.14 Other Works ................................................................................................................. 27 5.15 Capital Plan Summary .................................................................................................. 28
7 Summary and Recommendations ................................................................................... 28
8 Appendices ..................................................................................................................... 31
Appendix A Flow Calculations ............................................................................................... 32 Appendix B Tech Memo – Capital Works Required to Address Odour Issues ..................... 33 Appendix C Capacity Assessment Report ............................................................................ 34 Appendix D Capital Plan ....................................................................................................... 35
Ontario Clean Water Agency Engineering Services City of Clarence-Rockland Rockland Wastewater Treatment Plant Review February 2015
Page ii
LIST OF TABLES
Table 1: Rockland WWTP Design Flows ...................................................................................... 1
Table 2: Rockland WWTP Environmental Compliance Approval Effluent Objectives and Limits . 1
Table 3: Rockland WWTP Environmental Compliance Approval Effluent Objectives, Limits, and Current Data ............................................................................................................................... 10
Table 4: Rockland WWTP Flows and Loads Compared to Typical Domestic Sewage .............. 10
Table 5: Key Process Parameter Evaluation Results for the Rockland WWTP .......................... 11
Table 6: Data and criteria for Rockland WWTP Major Unit Process Evaluation ......................... 12
Table 7: Prioritization of Poor Plant Performance ....................................................................... 17
LIST OF FIGURES
Figure 1: Projected Future Sewage Flows .................................................................................... 3
Figure 2: Rockland WWTP Oct 2013 to Sept 2014 Average Monthly and Peak Daily Flows ....... 6
Figure 3: Rockland WWTP Oct 2013 to Sept 2014 – Final Effulent BOD5 Concentration ............ 6
Figure 4: Rockland WWTP Oct 2013 to Sept 2014 – Final Effulent BOD5 Loading ...................... 7
Figure 5: Rockland WWTP Oct 2013 to Sept 2014 – Final Effluent TSS Concentration .............. 7
Figure 6: Rockland WWTP Oct 2013 to Sept 2014 – Final Effluent TSS Loading ........................ 8
Figure 7: Rockland WWTP Oct 2013 to Sept 2014 – Final Effulent TP Concentration................. 8
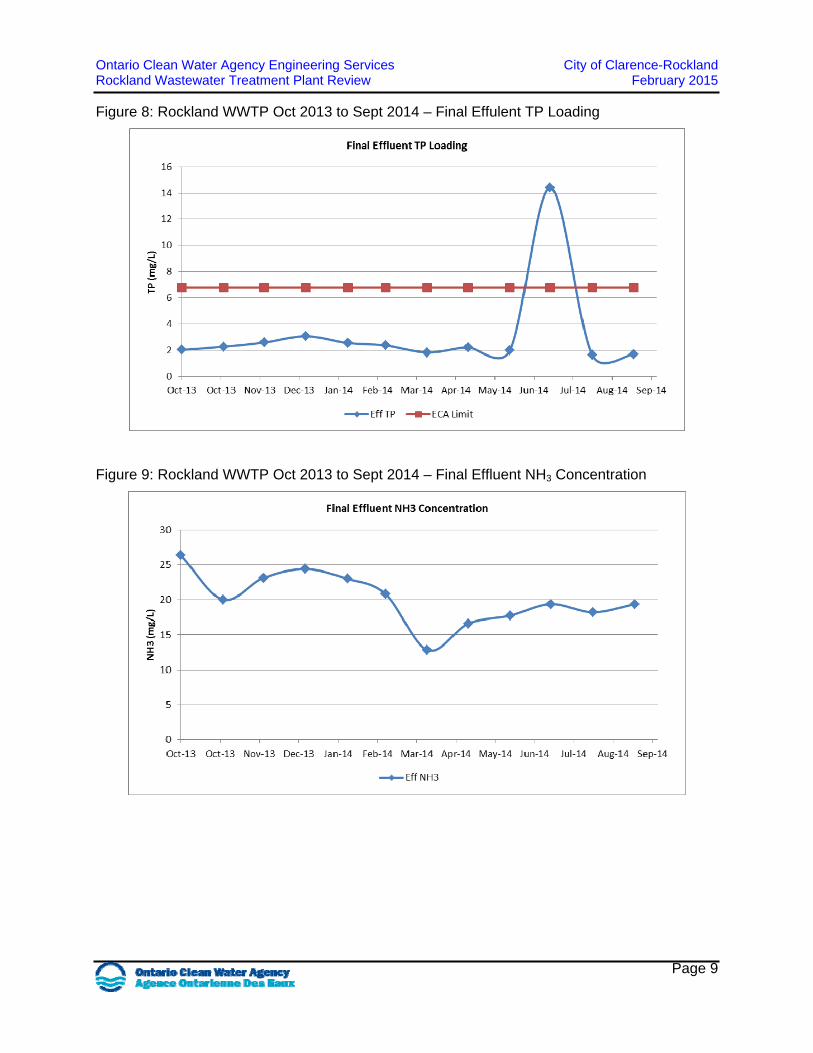
Figure 8: Rockland WWTP Oct 2013 to Sept 2014 – Final Effulent TP Loading .......................... 9
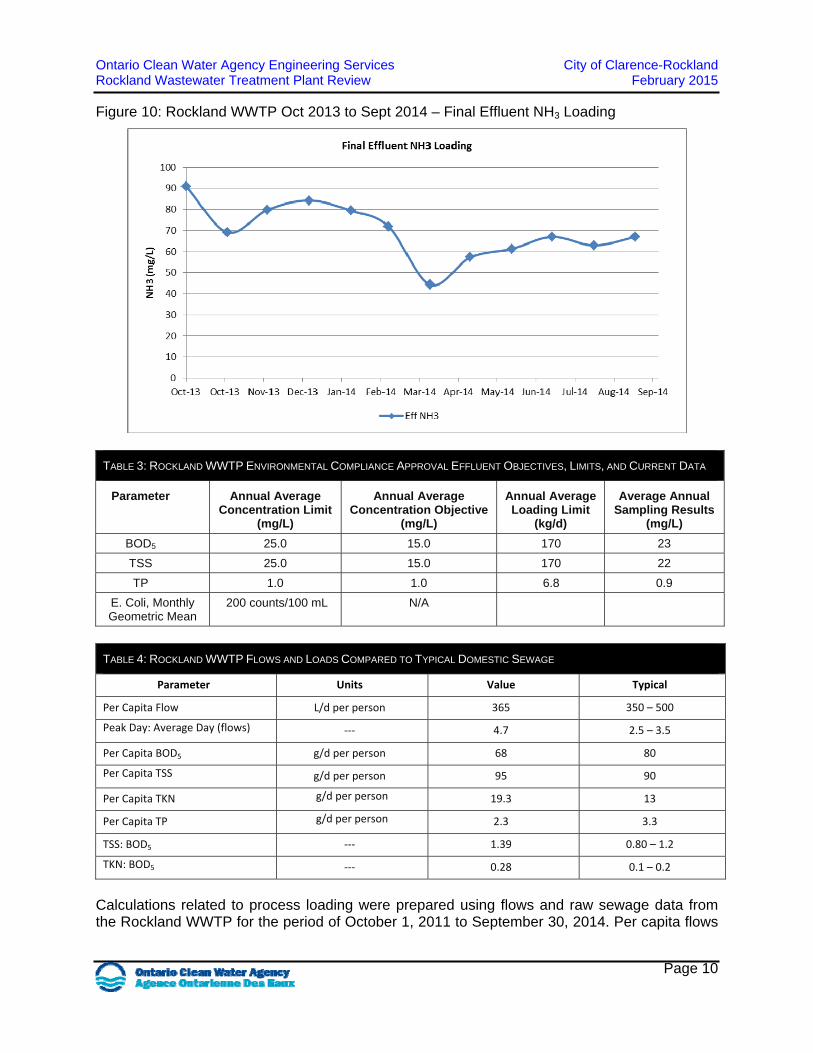
Figure 9: Rockland WWTP Oct 2013 to Sept 2014 – Final Effluent NH3 Concentration ............... 9
Figure 10: Rockland WWTP Oct 2013 to Sept 2014 – Final Effluent NH3 Loading .................... 10
Figure 11: Performance Potential Graph for the Rockland WWTP 2014 – Current Operation ... 13
Ontario Clean Water Agency Engineering Services City of Clarence-Rockland Rockland Wastewater Treatment Plant Review February 2015
Page 1
1.0 INTRODUCTION In the fall of 2014, the Engineering Services Group of the Ontario Clean Water Agency (OCWA) was retained by City of Clarence-Rockland (City) to carry out a review of the Rockland Wastewater Treatment Plant (WWTP) located in Rockland, Ontario. The project scope included a review of the site, prepare future flow projections, review WWTP capacity, determine the necessary future capital improvements, and prepare a 20 year capital plan. The City of Clarence-Rockland is located beside the Ottawa River and about 32 kilometres east of Ottawa. The population is currently 23,000 people. As of 2011, the community of Rockland had a population of approximately 11,100 served by the Rockland WWTP. OCWA Engineering Services (ES) visited the Rockland WWTP on October 20/21, 2014 and obtained additional information from the City and OCWA Operations to complete the project.
2.0 FACILITY DESCRIPTION The Rockland WWTP is a Sequencing Batch Reactor (SBR) activated sludge facility. The facility has an average daily design flow of 6,800 m3/day, maximum day design flow of 17,340 m3/day, and a peak design flow of 20,400 m3/day. The facility currently serves a population of approximately 11,100. The facility does not have flow equalization, but there is an aerobic digester for sludge stabilization and treatment. Alum solution is added to the process for phosphorous removal, sodium hypochorite is added for disinfection and calcium thiosulfate is added for dechlorination. The City of Clarence-Rockland has a sewer use by-law that was first implemented in the 1970’s. The bylaw is currently being updated, but has not been finalized.
TABLE 1: ROCKLAND WWTP DESIGN FLOWS
Parameter Design
Average Day Design Flow 6,800 m3/day
Maximum Day Design Flow 17,340 m3/day
Peak Design Flow 20,400 m3/day
TABLE 2: ROCKLAND WWTP ENVIRONMENTAL COMPLIANCE APPROVAL EFFLUENT OBJECTIVES AND LIMITS
Parameter Annual Average Concentration Limit
(mg/L)
Annual Average Concentration Objective
(mg/L)
Annual Average Loading Limit
(kg/d)
BOD5 25.0 15.0 170
TSS 25.0 15.0 170
TP 1.0 1.0 6.8
E. Coli, Monthly Geometric Mean 200 counts/100 mL N/A
All raw sewage is pumped through Pump Station #1 (PS#1) to the Rockland WWTP. The raw sewage flows through trash baskets in the wet well of PS#1 before being pumped to the WWTP and flows through two in-line sewage grinders and a pressurized vortex grit removal system.
Ontario Clean Water Agency Engineering Services City of Clarence-Rockland Rockland Wastewater Treatment Plant Review February 2015
Page 2
The influent then flows into one of three Sequencing Batch Reactors (SBR). The liquid from the SBR flows through the decanter to the chlorine contact tank for disinfection with chlorine and then thiosulfate for dechlorination before discharging to the outfall and flowing into the Ottawa River. Waste activated sludge (WAS) from the SBRs is sent to the aerobic digester for sludge stabilization and treatment. Oxygen is supplied to the aerobic digester by two 150 hp blowers (1 duty, 1 standby). Supernatant from the aerobic digester is decanted back to the SBR process on a daily basis. Sludge from the aerobic digester is stored in two onsite storage lagoons.
3.0 PLANT CAPACITY There are many variables to review to be able to determine the timeframe when the plant will reach its design capacity. This section will outline the assumptions that we used to project when the plant will require an expansion.
3.1 Growth
The City is growing at approximately twice the average growth rate in Canada. The City had a population of 20,790 in 2006, which increased to 23,185 in 2011. This resulted in an 11.5% increase, whereas Canada increased by 5.9% and Ontario increased by 5.7% during the same timeframe. The community of Rockland has about half of the City’s overall population and is serviced by the Rockland WWTP. As the City is experiencing high growth rates, City staff would like to determine when the next expansion will be required for the Rockland WWTP. In discussion with City staff, it was disclosed that the community of Rockland is increasing at a higher rate due to its close proximity to Ottawa. The City has approved several subdivision plans to be constructed within the Rockland sewage service area. Although the subdivision plans are approved, it is difficult to determine how quickly these homes will be constructed and occupied. In subsequent discussions with City staff, it was decided that the growth rate for Rockland should be estimated at an additional 170 homes per year. In June 2014, the City received a Capital Investment Report completed by WSP (WSP Report). The City requested that the projected flow data from the WSP Report be included in the analysis. In the WSP report, there were growth estimates for 5 and 10 years. In the report, they assumed a growth rate of 2.76%. An additional flow projection comparison was completed based on the growth rate of 2.76%. WSP Report contained the assumption of 2.7 people in each household and as this is close to the national average (2.5 people per household in 2006). The assumption of 2.7 people per household will be used for this report.
3.2 Flow Projections
The Rockland WWTP is currently running at approximately 60% of the average day design flow, based on current average day flow of 4,050 m3/day for the last year. The facility is at approximately 75% of the design maximum day flow (17,340 m3/day), as the maximum day flow in 2014 was 13,085 m3/day. The maximum peak flow was approximately 19,000 m3/d and
Ontario Clean Water Agency Engineering Services City of Clarence-Rockland Rockland Wastewater Treatment Plant Review February 2015
Page 3
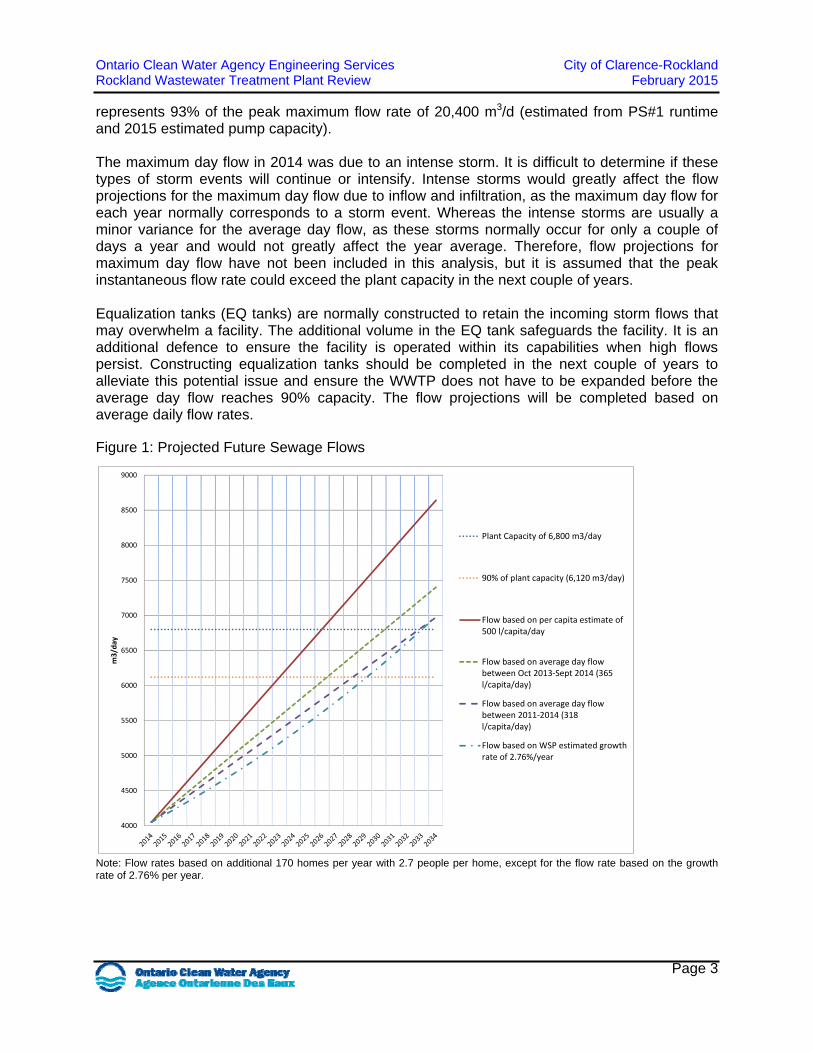
represents 93% of the peak maximum flow rate of 20,400 m3/d (estimated from PS#1 runtime and 2015 estimated pump capacity). The maximum day flow in 2014 was due to an intense storm. It is difficult to determine if these types of storm events will continue or intensify. Intense storms would greatly affect the flow projections for the maximum day flow due to inflow and infiltration, as the maximum day flow for each year normally corresponds to a storm event. Whereas the intense storms are usually a minor variance for the average day flow, as these storms normally occur for only a couple of days a year and would not greatly affect the year average. Therefore, flow projections for maximum day flow have not been included in this analysis, but it is assumed that the peak instantaneous flow rate could exceed the plant capacity in the next couple of years. Equalization tanks (EQ tanks) are normally constructed to retain the incoming storm flows that may overwhelm a facility. The additional volume in the EQ tank safeguards the facility. It is an additional defence to ensure the facility is operated within its capabilities when high flows persist. Constructing equalization tanks should be completed in the next couple of years to alleviate this potential issue and ensure the WWTP does not have to be expanded before the average day flow reaches 90% capacity. The flow projections will be completed based on average daily flow rates.
Figure 1: Projected Future Sewage Flows
4000
4500
5000
5500
6000
6500
7000
7500
8000
8500
9000
m3/day
Plant Capacity of 6,800 m3/day
90% of plant capacity (6,120 m3/day)
Flow based on per capita estimate of500 l/capita/day
Flow based on average day flowbetween Oct 2013‐Sept 2014 (365l/capita/day)
Flow based on average day flowbetween 2011‐2014 (318l/capita/day)
Flow based on WSP estimated growthrate of 2.76%/year
Note: Flow rates based on additional 170 homes per year with 2.7 people per home, except for the flow rate based on the growth rate of 2.76% per year.
Ontario Clean Water Agency Engineering Services City of Clarence-Rockland Rockland Wastewater Treatment Plant Review February 2015
Page 4
The determination of the flow per capita is complicated, as sewage flows fluctuate and can be influenced by inflow and infiltration (I/I). In reviewing the flow data, Rockland sewage flows vary based on precipitation and thus I/I needs to be considered when determining future flows. Average day flow projections are normally in the range of 350 to 500 l/day per capita. Based on actual flow data, the average day flow over the last five (5) years (2011-2014) is approximately 318 l/capita/day. Based on the previous year flow at the time of the site visit (October 2013 to September 2014), the average day flow is approximately 365 l/capita/day. The flow rates for 318, 365, and 500 l/capital/day were calculated for the 20 year timeframe. Additionally, the WSP report had assumed an annual growth rate of 2.76%. All of these flow rate calculations are included in the appendices and shown in Figure 1.
2.3 Facility Expansion
Plant expansions usually take three to five years to proceed from project initiation to when the upgrades are commissioned and made operational. There are many steps that will have to be completed, which include Class Environmental Assessment, design, construction, etc. Thus, plant expansions are normally initiated at or before the 90% capacity threshold is reached. Figure 1 shows the intersection of different flow rate scenarios with the WWTP capacity of 6,800 m3/day and 90% of the WWTP capacity. These delineations assist to determine if there is enough lead time to complete the entire expansion process before the WWTP reaches its design capacity. The data shows that all of the flow estimates would require initiation of a plant expansion within a few years of each other (2023 to 2029) and take about four to five years before reaching the design capacity. Four to five years should be an adequate timeframe to initiate the WWTP expansion project and have it completed. Based on the 365 l/capita/day flow rate projection, we estimate that the 90% capacity threshold will be reached in the year 2026. To ensure that the additional capacity required is brought on line in sufficient time, we recommend that the design work commence in 2025. The Class EA work should therefore start in 2020. This would allow for ample time for the City to apply for any subsidy funding programs that might be available at that time and determine if the design and construction work needs to be completed earlier or later than anticipated. As part of the Class EA process, the historical flow data will be reviewed to determine the timeframe required for the expansion. If it is determined that the flows increased more rapidly than anticipated in this report, the design and construction work should be moved ahead. If the flows have not increased as quickly as envisioned, then the design and construction could be put off for a few years. Given that a Class EA is valid for ten (10) years, the City will have the flexibility to start construction any time within that ten year time period. In the meantime, it is recommended that the City undertake periodic reviews of the actual growth rate within Rockland and monitor the actual sewage flow rates to determine if the WWTP expansion might need to be initiated earlier or deferred to a later date. As plant design capacity is normally rated on the equipment with the lowest capacity, a detailed plant assessment is outlined in the following section to confirm if any components are rated lower than the overall design capacity.
Ontario Clean Water Agency Engineering Services City of Clarence-Rockland Rockland Wastewater Treatment Plant Review February 2015
Page 5
4.0 CAPACITY ASSESSMENT In November 2014, a capacity assessment was completed on the Rockland WWTP with the following objectives:
To review the performance and capacity of the Rockland WWTP and identify any capacity limitations related to the design or operation of the facility.
To determine the need for a more detailed capacity assessment study at a later date. A summary of the information contained in the Rockland Capacity Assessment Report is outlined below. A copy of the report is located in the appendices.
4.1 Facility Assessment
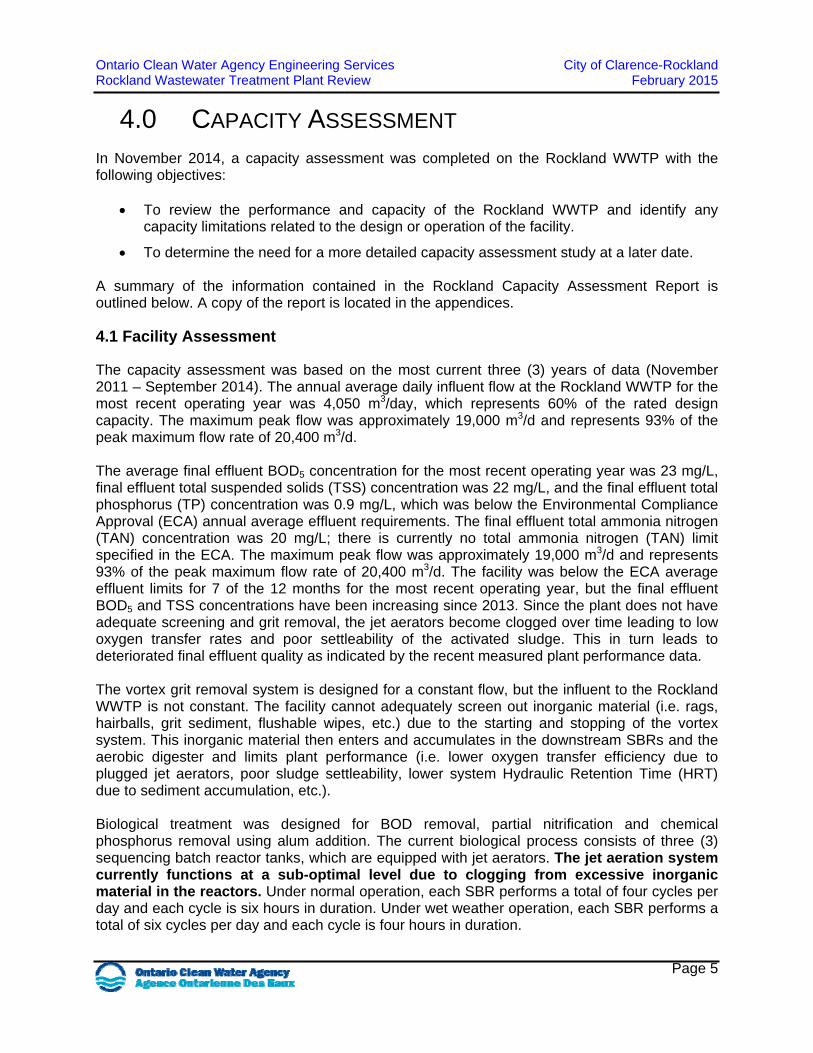
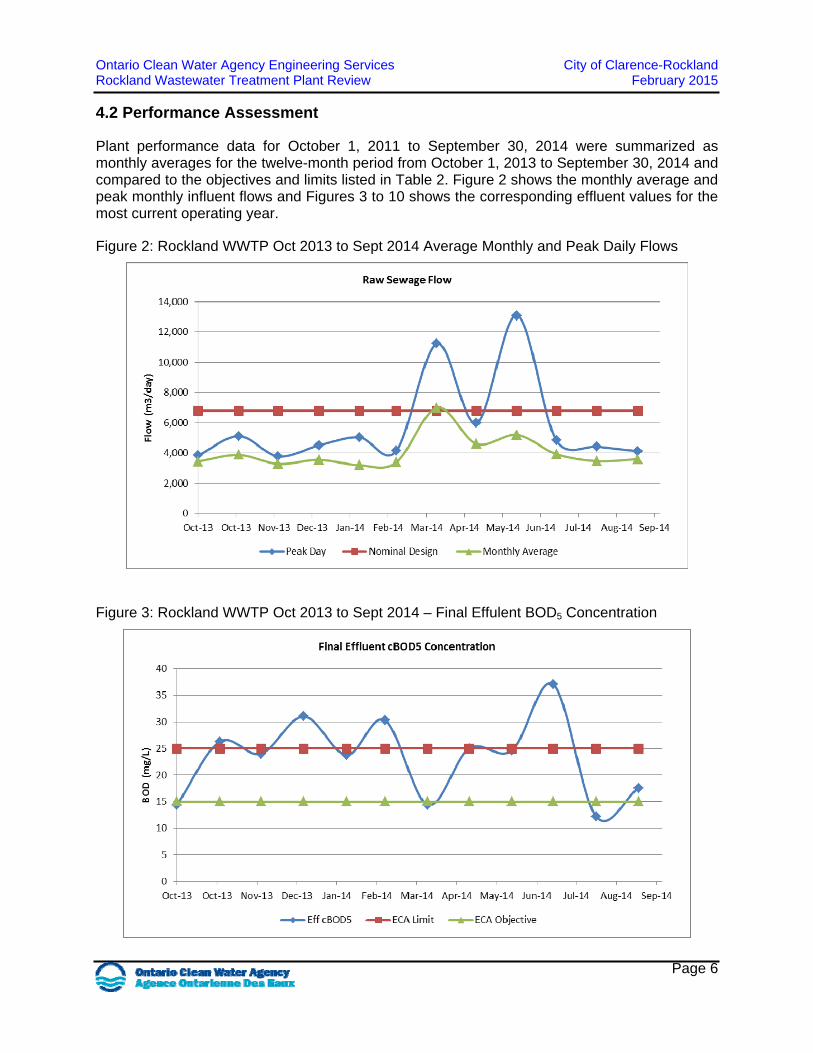
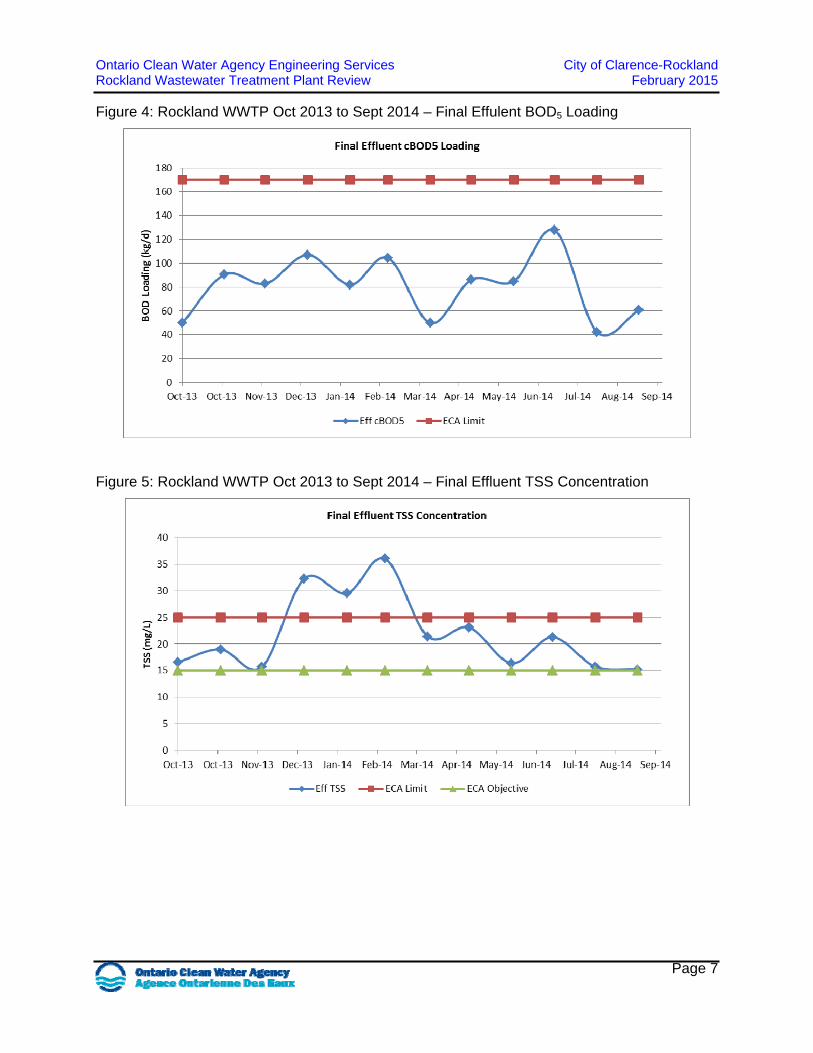
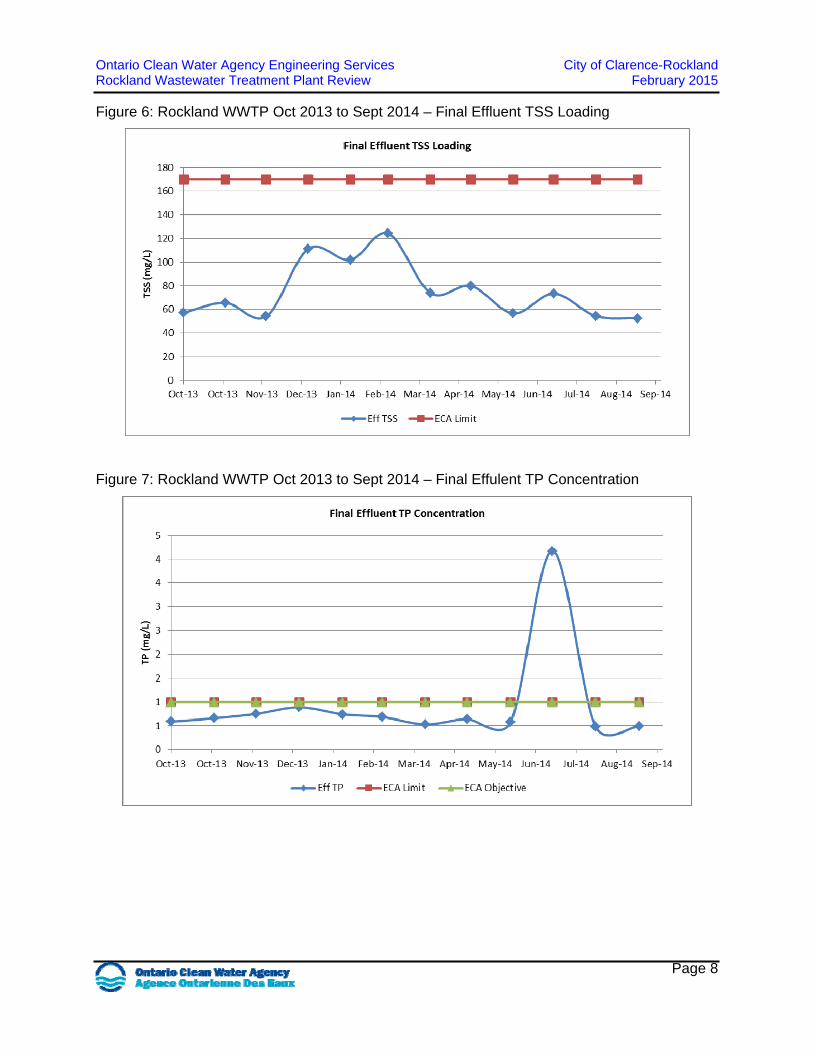
The capacity assessment was based on the most current three (3) years of data (November 2011 – September 2014). The annual average daily influent flow at the Rockland WWTP for the most recent operating year was 4,050 m3/day, which represents 60% of the rated design capacity. The maximum peak flow was approximately 19,000 m3/d and represents 93% of the peak maximum flow rate of 20,400 m3/d. The average final effluent BOD5 concentration for the most recent operating year was 23 mg/L, final effluent total suspended solids (TSS) concentration was 22 mg/L, and the final effluent total phosphorus (TP) concentration was 0.9 mg/L, which was below the Environmental Compliance Approval (ECA) annual average effluent requirements. The final effluent total ammonia nitrogen (TAN) concentration was 20 mg/L; there is currently no total ammonia nitrogen (TAN) limit specified in the ECA. The maximum peak flow was approximately 19,000 m3/d and represents 93% of the peak maximum flow rate of 20,400 m3/d. The facility was below the ECA average effluent limits for 7 of the 12 months for the most recent operating year, but the final effluent BOD5 and TSS concentrations have been increasing since 2013. Since the plant does not have adequate screening and grit removal, the jet aerators become clogged over time leading to low oxygen transfer rates and poor settleability of the activated sludge. This in turn leads to deteriorated final effluent quality as indicated by the recent measured plant performance data. The vortex grit removal system is designed for a constant flow, but the influent to the Rockland WWTP is not constant. The facility cannot adequately screen out inorganic material (i.e. rags, hairballs, grit sediment, flushable wipes, etc.) due to the starting and stopping of the vortex system. This inorganic material then enters and accumulates in the downstream SBRs and the aerobic digester and limits plant performance (i.e. lower oxygen transfer efficiency due to plugged jet aerators, poor sludge settleability, lower system Hydraulic Retention Time (HRT) due to sediment accumulation, etc.). Biological treatment was designed for BOD removal, partial nitrification and chemical phosphorus removal using alum addition. The current biological process consists of three (3) sequencing batch reactor tanks, which are equipped with jet aerators. The jet aeration system currently functions at a sub-optimal level due to clogging from excessive inorganic material in the reactors. Under normal operation, each SBR performs a total of four cycles per day and each cycle is six hours in duration. Under wet weather operation, each SBR performs a total of six cycles per day and each cycle is four hours in duration.
Ontario Clean Water Agency Engineering Services City of Clarence-Rockland Rockland Wastewater Treatment Plant Review February 2015
Page 6
4.2 Performance Assessment
Plant performance data for October 1, 2011 to September 30, 2014 were summarized as monthly averages for the twelve-month period from October 1, 2013 to September 30, 2014 and compared to the objectives and limits listed in Table 2. Figure 2 shows the monthly average and peak monthly influent flows and Figures 3 to 10 shows the corresponding effluent values for the most current operating year.
Figure 2: Rockland WWTP Oct 2013 to Sept 2014 Average Monthly and Peak Daily Flows
Figure 3: Rockland WWTP Oct 2013 to Sept 2014 – Final Effulent BOD5 Concentration
Ontario Clean Water Agency Engineering Services City of Clarence-Rockland Rockland Wastewater Treatment Plant Review February 2015
Page 7
Figure 4: Rockland WWTP Oct 2013 to Sept 2014 – Final Effulent BOD5 Loading
Figure 5: Rockland WWTP Oct 2013 to Sept 2014 – Final Effluent TSS Concentration
Ontario Clean Water Agency Engineering Services City of Clarence-Rockland Rockland Wastewater Treatment Plant Review February 2015
Page 8
Figure 6: Rockland WWTP Oct 2013 to Sept 2014 – Final Effluent TSS Loading
Figure 7: Rockland WWTP Oct 2013 to Sept 2014 – Final Effulent TP Concentration
Ontario Clean Water Agency Engineering Services City of Clarence-Rockland Rockland Wastewater Treatment Plant Review February 2015
Page 9
Figure 8: Rockland WWTP Oct 2013 to Sept 2014 – Final Effulent TP Loading
Figure 9: Rockland WWTP Oct 2013 to Sept 2014 – Final Effluent NH3 Concentration
Ontario Clean Water Agency Engineering Services City of Clarence-Rockland Rockland Wastewater Treatment Plant Review February 2015
Page 10
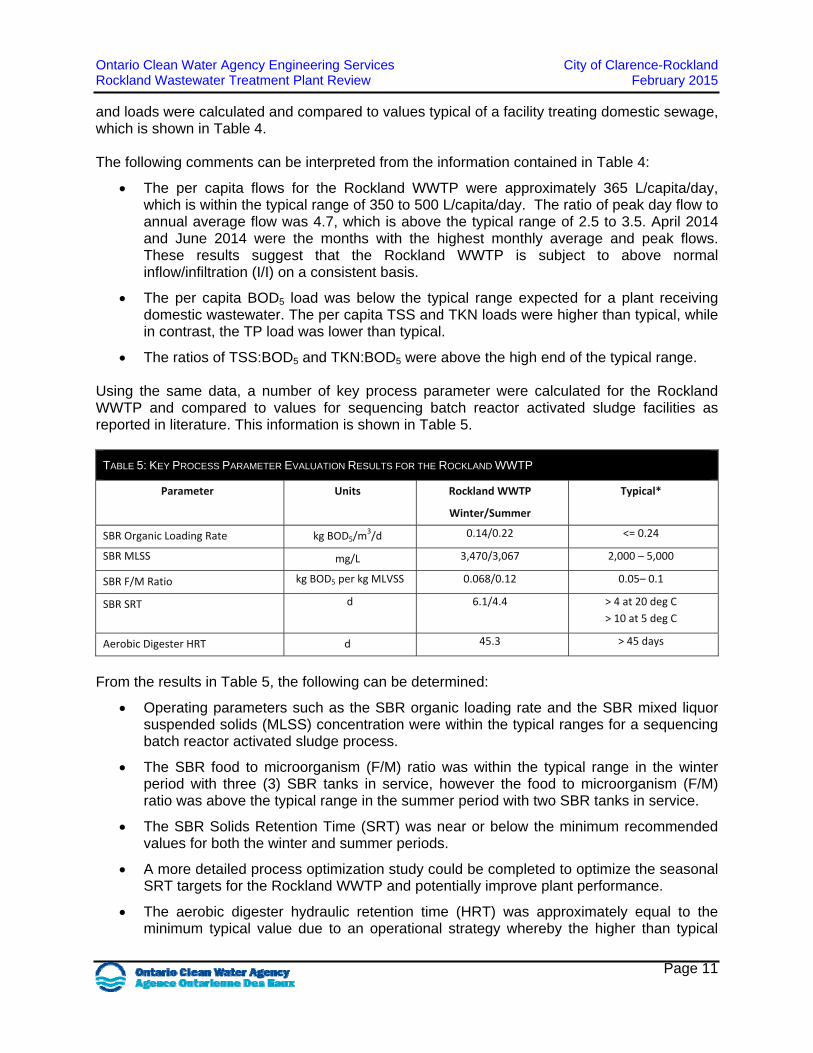
Figure 10: Rockland WWTP Oct 2013 to Sept 2014 – Final Effluent NH3 Loading
TABLE 3: ROCKLAND WWTP ENVIRONMENTAL COMPLIANCE APPROVAL EFFLUENT OBJECTIVES, LIMITS, AND CURRENT DATA
Parameter Annual Average Concentration Limit
(mg/L)
Annual Average Concentration Objective
(mg/L)
Annual Average Loading Limit
(kg/d)
Average Annual Sampling Results
(mg/L)
BOD5 25.0 15.0 170 23
TSS 25.0 15.0 170 22
TP 1.0 1.0 6.8 0.9
E. Coli, Monthly Geometric Mean
200 counts/100 mL N/A
TABLE 4: ROCKLAND WWTP FLOWS AND LOADS COMPARED TO TYPICAL DOMESTIC SEWAGE
Parameter Units Value Typical
Per Capita Flow L/d per person 365 350 – 500
Peak Day: Average Day (flows) ‐‐‐ 4.7 2.5 – 3.5
Per Capita BOD5 g/d per person 68 80
Per Capita TSS g/d per person 95 90
Per Capita TKN g/d per person 19.3 13
Per Capita TP g/d per person 2.3 3.3
TSS: BOD5 ‐‐‐ 1.39 0.80 – 1.2
TKN: BOD5 ‐‐‐ 0.28 0.1 – 0.2
Calculations related to process loading were prepared using flows and raw sewage data from the Rockland WWTP for the period of October 1, 2011 to September 30, 2014. Per capita flows
Ontario Clean Water Agency Engineering Services City of Clarence-Rockland Rockland Wastewater Treatment Plant Review February 2015
Page 11
and loads were calculated and compared to values typical of a facility treating domestic sewage, which is shown in Table 4. The following comments can be interpreted from the information contained in Table 4:
The per capita flows for the Rockland WWTP were approximately 365 L/capita/day, which is within the typical range of 350 to 500 L/capita/day. The ratio of peak day flow to annual average flow was 4.7, which is above the typical range of 2.5 to 3.5. April 2014 and June 2014 were the months with the highest monthly average and peak flows. These results suggest that the Rockland WWTP is subject to above normal inflow/infiltration (I/I) on a consistent basis.
The per capita BOD5 load was below the typical range expected for a plant receiving domestic wastewater. The per capita TSS and TKN loads were higher than typical, while in contrast, the TP load was lower than typical.
The ratios of TSS:BOD5 and TKN:BOD5 were above the high end of the typical range. Using the same data, a number of key process parameter were calculated for the Rockland WWTP and compared to values for sequencing batch reactor activated sludge facilities as reported in literature. This information is shown in Table 5.
TABLE 5: KEY PROCESS PARAMETER EVALUATION RESULTS FOR THE ROCKLAND WWTP
Parameter Units Rockland WWTP
Winter/Summer
Typical*
SBR Organic Loading Rate kg BOD5/m3/d 0.14/0.22 <= 0.24
SBR MLSS mg/L 3,470/3,067 2,000 – 5,000
SBR F/M Ratio kg BOD5 per kg MLVSS 0.068/0.12 0.05– 0.1
SBR SRT
d 6.1/4.4 > 4 at 20 deg C
> 10 at 5 deg C
Aerobic Digester HRT d 45.3 > 45 days
From the results in Table 5, the following can be determined:
Operating parameters such as the SBR organic loading rate and the SBR mixed liquor suspended solids (MLSS) concentration were within the typical ranges for a sequencing batch reactor activated sludge process.
The SBR food to microorganism (F/M) ratio was within the typical range in the winter period with three (3) SBR tanks in service, however the food to microorganism (F/M) ratio was above the typical range in the summer period with two SBR tanks in service.
The SBR Solids Retention Time (SRT) was near or below the minimum recommended values for both the winter and summer periods.
A more detailed process optimization study could be completed to optimize the seasonal SRT targets for the Rockland WWTP and potentially improve plant performance.
The aerobic digester hydraulic retention time (HRT) was approximately equal to the minimum typical value due to an operational strategy whereby the higher than typical
Ontario Clean Water Agency Engineering Services City of Clarence-Rockland Rockland Wastewater Treatment Plant Review February 2015
Page 12
daily waste activated sludge flow is offset by the daily digester supernatant decant volume to provide approximately 45 days of aerobic digester HRT.
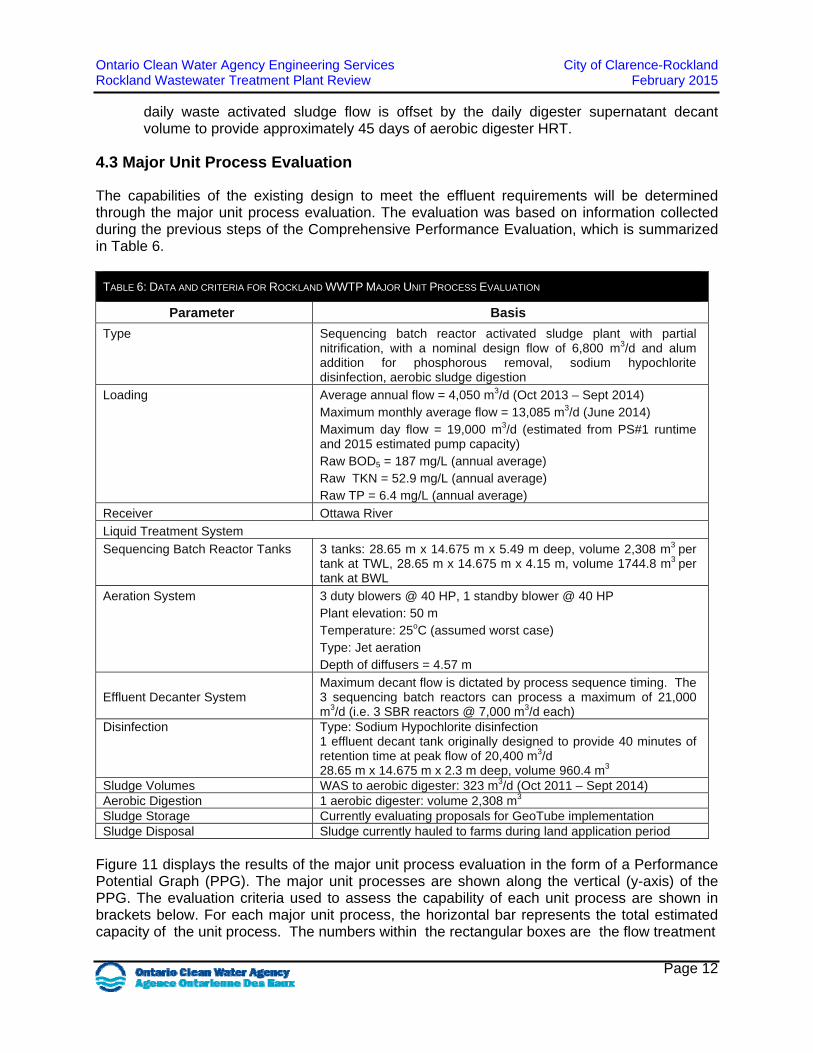
4.3 Major Unit Process Evaluation
The capabilities of the existing design to meet the effluent requirements will be determined through the major unit process evaluation. The evaluation was based on information collected during the previous steps of the Comprehensive Performance Evaluation, which is summarized in Table 6.
TABLE 6: DATA AND CRITERIA FOR ROCKLAND WWTP MAJOR UNIT PROCESS EVALUATION
Parameter Basis
Type Sequencing batch reactor activated sludge plant with partial nitrification, with a nominal design flow of 6,800 m3/d and alum addition for phosphorous removal, sodium hypochlorite disinfection, aerobic sludge digestion
Loading Average annual flow = 4,050 m3/d (Oct 2013 – Sept 2014) Maximum monthly average flow = 13,085 m3/d (June 2014) Maximum day flow = 19,000 m3/d (estimated from PS#1 runtime and 2015 estimated pump capacity) Raw BOD5 = 187 mg/L (annual average) Raw TKN = 52.9 mg/L (annual average) Raw TP = 6.4 mg/L (annual average)
Receiver Ottawa River
Liquid Treatment System
Sequencing Batch Reactor Tanks 3 tanks: 28.65 m x 14.675 m x 5.49 m deep, volume 2,308 m3 per tank at TWL, 28.65 m x 14.675 m x 4.15 m, volume 1744.8 m3 per tank at BWL
Aeration System 3 duty blowers @ 40 HP, 1 standby blower @ 40 HP Plant elevation: 50 m Temperature: 25oC (assumed worst case) Type: Jet aeration Depth of diffusers = 4.57 m
Effluent Decanter System Maximum decant flow is dictated by process sequence timing. The 3 sequencing batch reactors can process a maximum of 21,000 m3/d (i.e. 3 SBR reactors @ 7,000 m3/d each)
Disinfection Type: Sodium Hypochlorite disinfection 1 effluent decant tank originally designed to provide 40 minutes of retention time at peak flow of 20,400 m3/d 28.65 m x 14.675 m x 2.3 m deep, volume 960.4 m3
Sludge Volumes WAS to aerobic digester: 323 m3/d (Oct 2011 – Sept 2014) Aerobic Digestion 1 aerobic digester: volume 2,308 m3
Sludge Storage Currently evaluating proposals for GeoTube implementationSludge Disposal Sludge currently hauled to farms during land application period
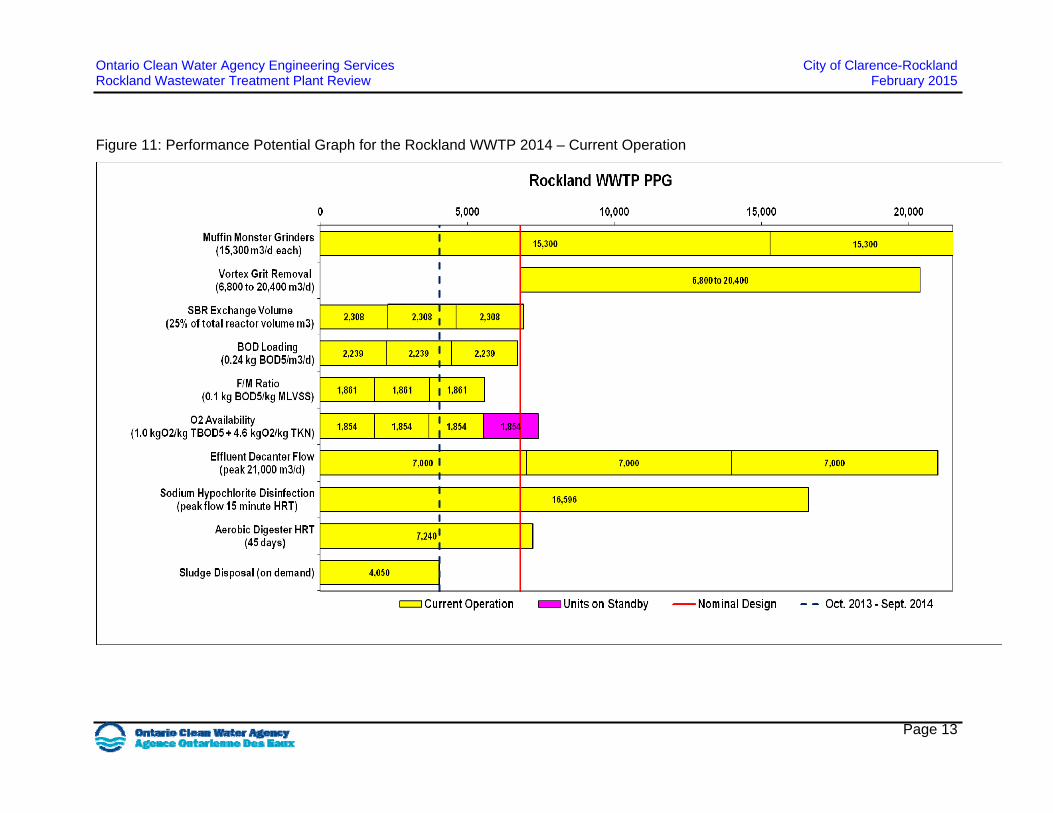
Figure 11 displays the results of the major unit process evaluation in the form of a Performance Potential Graph (PPG). The major unit processes are shown along the vertical (y-axis) of the PPG. The evaluation criteria used to assess the capability of each unit process are shown in brackets below. For each major unit process, the horizontal bar represents the total estimated capacity of the unit process. The numbers within the rectangular boxes are the flow treatment
Ontario Clean Water Agency Engineering Services City of Clarence-Rockland Rockland Wastewater Treatment Plant Review February 2015
Page 13
Figure 11: Performance Potential Graph for the Rockland WWTP 2014 – Current Operation
Ontario Clean Water Agency Engineering Services City of Clarence-Rockland Rockland Wastewater Treatment Plant Review February 2015
Page 14
capacity limits for each of the individual unit processes. For example, under the unit process BOD Loading, the individual 2,239 horizontal bars represent each of the three (3) sequencing batch reactor tanks having an individual capability to treat 2,239 m3/d for a total of 6,718 m3/d. The blue dashed vertical line shows the current average flow of 4,050 m3/d and the solid red vertical line marks the nominal design flow of 6,800 m3/d. A process is judged “capable” if the projected capacity exceeds the current flow rate (ie. the associated horizontal bar for that unit process is to the right of the 4,050 m3/d dashed line). A process is “marginal” if the capacity is 80 to 100 percent of current flow, (ie. 3,240 m3/d to 4,050 m3/d). A process is “not capable” if its capacity is less than 80% of current flow (ie. less than 3,240 m3/d). The shortest bars determine the overall plant rating as “capable”, “marginal”, or “not capable”. The evaluation criteria for the Performance Potential Graph for the Rockland WWTP were obtained from “The Ontario Composite Correction Program Manual for Optimization of Sewage Treatment Plants” (WTC and PAI, 1996) and other references on the design of activated sludge plants (WEF 2005; WEF 2010); and the Ministry of Environment and Climate Change (MOECC) “Design Guideline for Sewage Works, 2008”. The capacity of each of the major unit process at the Rockland WWTP will be discussed in detail.
Muffin Monster Grinders:
Each in-line sewage grinder is sized to handle 75% of the peak flow (i.e. 15,300 m3/d each) and both units are required to run at all times. The in-line grinder units are rated as capable at current flows with two units in operation.
Pressurized Vortex Grit Removal Unit:
The existing vortex grit removal unit is designed for a flow range between 6,800 m3/d and 20,400 m3/d, which is above the rated design capacity of the plant. Also, a vortex grit removal system functions best when the flow to the plant is continuous, (i.e. the vortex takes time to develop when the flow starts and stops). However, the influent flow to the Rockland WWTP is non-continuous due to a lack of influent flow control capabilities at PS#1 which feeds the WWTP. The pressurized vortex grit removal unit is rated as not capable at the current flow conditions.
Sequencing Batch Reactors:
The capacity of the bioreactors was rated based on the SBR exchange volume, the BOD loading rate, the food to microorganism (F/M) ratio and the ability of the aeration system to supply oxygen to the system. Using a design criteria of 25% of the total reactor volume for the SBR exchange volume, the rated total hydraulic capacity of the aeration tanks is 6,925 m3/d (3 tanks x 2,308 m3/d per tank). BOD5 loading rate to the aeration basin is expressed as kg of BOD5/d per unit of aeration basin volume and a value of 0.24 kg BOD5/m
3/d was used to rate the capacity of the sequencing batch reactors. The total low level volume of the sequencing batch reactors is 5,234 m3 with three (3) reactors in service and an annual average raw influent BOD5 concentration of 187 mg/L was used in the calculation. The capacity based on BOD5 loading is 6,718 m3/d based on the raw BOD5 concentration of 187 mg/L, which is higher than the original design concentration for the facility.
Ontario Clean Water Agency Engineering Services City of Clarence-Rockland Rockland Wastewater Treatment Plant Review February 2015
Page 15
The existing jet aeration system was evaluated for its ability to provide 1 kg O2 per kg of total oxygen demand. The total oxygen demand was calculated as the sum of the oxygen demand exerted by total BOD5 and TKN in the raw influent. Each kg of total BOD5 required 1 kg of dissolved oxygen, whereas 1 kg of TKN exerts a demand of 4.57 kg of dissolved oxygen. Oxygen availability is rated at 5,562 m3/d, assuming three 40 HP duty blowers and one 40 HP blower on standby (i.e. as operated during the evaluation). Also, until the preliminary screening and grit removal issues have been addressed, it is difficult to accurately determine the treatment capacity and oxygen transfer efficiency of the existing jet aeration system. The sequencing batch reactors are rated as capable for SBR exchange volume, BOD5 loading, food to microorganism (F/M) ratio and oxygen availability at current flows. Discussions with the plant operators and on-site observations indicated that DO levels do fall below 2 mg/L under certain conditions suggesting that oxygen availability may be a concern, however the low oxygen residual is likely due to lower than typical oxygen transfer efficiency due to clogged jet aerators.
SBR Effluent Decant Mechanisms:
The maximum effluent decant flow is dictated by the process sequence timing. The three (3) sequencing batch reactors can process a maximum of 21,000 m3/d (i.e. three (3) SBR reactors rated at 7,000 m3/d each) so effluent decant mechanisms are rated as capable at current flows with three SBRs in operation.
Sodium Hypochlorite Disinfection:
The operations and maintenance manual states that the effluent decant tank was originally designed to provide 40 minutes of retention time at peak flow of 20,400 m3/d. However, the design criteria used to evaluate the Rockland WWTP disinfection capacity was 15 minutes at the peak hourly flow rate. Assuming a reasonable baffling factor of 0.3 and a total daily decant time of 14.4 hours using the wet weather flow operation cycle settings, the rated capacity of the sodium hypochlorite disinfection system is 16,596 m3/d. The sodium hypochlorite disinfection system is therefore rated capable at current flows.
Aerobic Sludge Digestion:
The capacity of the aerobic digester was estimated based on the volume of the aerobic digester (2,308 m3) and a HRT evaluation criteria of 45 days. Waste activated sludge (WAS) from the sequencing batch reactors is sent to the aerobic digester for sludge stabilization and treatment. Supernatant from the aerobic digester is decanted back to the SBR process on a daily basis. The aerobic digester hydraulic retention time (HRT) is approximately equal to the minimum typical value due to an operational strategy whereby the higher than typical daily waste activated sludge flow is offset by the daily digester supernatant decant volume to provide approximately 45 days of aerobic digester HRT. Based on this operational scenario, the rated capacity of the aerobic digesters is 7,240 m3/d. At this rated capacity, the aerobic digester is considered to be capable at current flows. Sludge digestion capacity can be reduced over time due to grit/sediment accumulation in the digesters. The digester should be cleaned periodically to remove unwanted grit/sediment and maximize digester capacity and performance.
Sludge Storage and Disposal:
Sludge from the aerobic digester is currently stored in two onsite storage lagoons. However, the City is currently looking at replacing the existing biosolids storage lagoons with a permanent
Ontario Clean Water Agency Engineering Services City of Clarence-Rockland Rockland Wastewater Treatment Plant Review February 2015
Page 16
GeoTube sludge disposal system. Based on this rationale, the process was rated as capable at the current flow of 4,050 m3/d, as per the Comprehensive Performance Evaluation (CPE) protocol.
Summary
The Rockland WWTP was rated as capable based on the design guidelines that were used to evaluate the capacity of the facility (i.e. Type 1 according to the CPE protocol) under the current flow conditions. However, the design guidelines do not account for the fact that due to a lack of preliminary screening and an inadequately designed pressurized vortex grit removal system, the system cannot adequately remove inorganic material (i.e. rags, hairballs, grit sediment, flushable wipes, etc.) from the influent wastewater stream. This inorganic material enters the downstream sequencing batch reactor tanks and aerobic digester, negatively impacting the plant performance (i.e. lower oxygen transfer efficiency due to plugged jet aerators, poor sludge settleability, lower system HRT due to sediment accumulation). The grit removal system was designed for a flow range that is higher than the plant’s rated average design flow of 6,800 m3/d. Also, a pressurized vortex grit removal system functions best when the flow to the plant is continuous, however since the influent flow to the Rockland WWTP is intermittent due to a lack of influent flow control capabilities at the main pump station (PS#1), the performance of the grit removal system is ineffective. The Performance Potential Graph (PPG) in Figure 11 also shows that the BOD loading, the food-to-microorganism ratio and the oxygen availability are the most limiting factors of the existing SBR facility based on typical design parameters/guidelines. This is due to elevated influent loading conditions compared to the original design criteria. Once the preliminary screening and grit removal issues have been addressed, the plant capacity and the most limiting factors should be re-evaluated by determining plant-specific values based on the actual plant performance. However, until the preliminary screening and grit removal issues have been addressed, it is difficult to accurately determine the treatment capacity and oxygen transfer efficiency of the existing facility.
4.4 Factors
As developed by the U.S. Environmental Protection Agency, the Comprehensive Performance Evaluation (CPE) identifies and prioritizes causes of poor performance (i.e. factors which cause a plant’s effluent concentrations or loadings to exceed limits). A checklist of seventy (70) potential factors and their associated definitions is provided in “The Ontario Composite Correction Program Manual for Optimization of Sewage Treatment Plants” in the areas of design, operation, maintenance, and administration (WTC and PAI, 1996). This is shown in the following table. The selection of appropriate factors is based on the results of the historical performance review, the major unit process evaluation, reviews of plant operation and maintenance practices and interviews with plant staff and administrators. Historically, the Rockland WWTP final effluent quality has been consistently below the ECA limits, and the final effluent concentrations from the facility were below the ECA average effluent limits for 7 of the 12 months for the most recent operating year. The final effluent BOD5 and TSS concentrations have been increasing since 2013.
Ontario Clean Water Agency Engineering Services City of Clarence-Rockland Rockland Wastewater Treatment Plant Review February 2015
Page 17
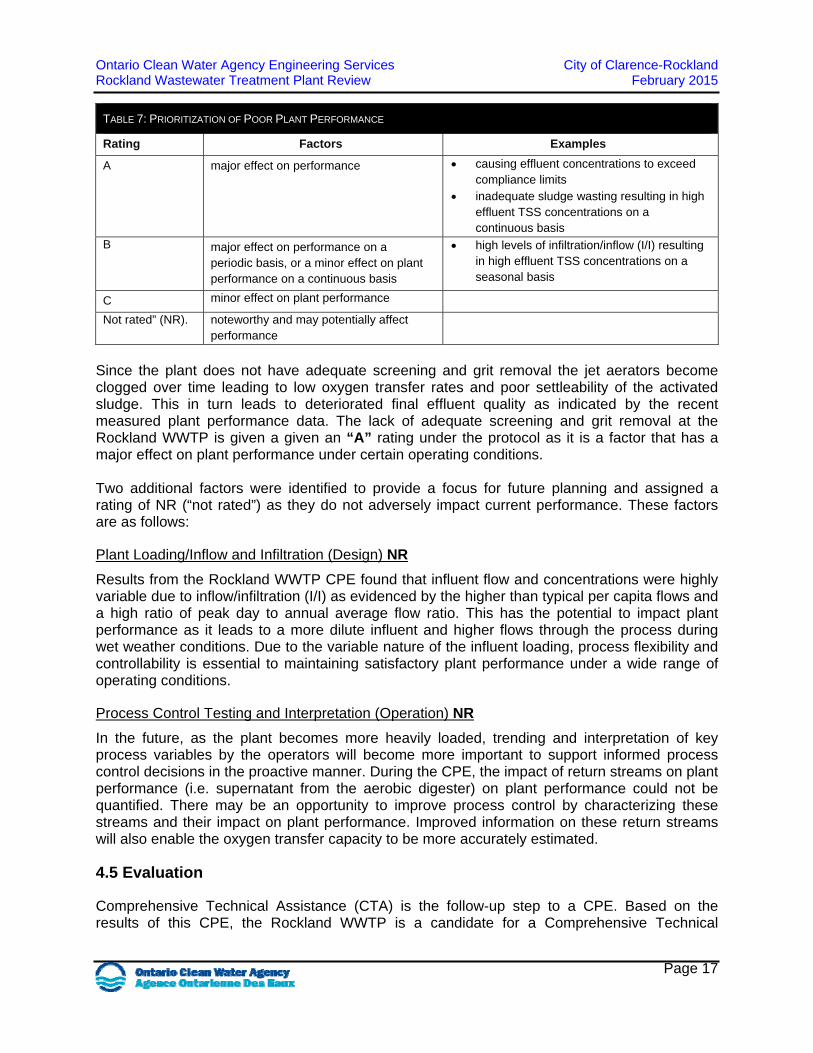
TABLE 7: PRIORITIZATION OF POOR PLANT PERFORMANCE
Rating Factors Examples
A major effect on performance causing effluent concentrations to exceed compliance limits
inadequate sludge wasting resulting in high effluent TSS concentrations on a continuous basis
B major effect on performance on a periodic basis, or a minor effect on plant performance on a continuous basis
high levels of infiltration/inflow (I/I) resulting in high effluent TSS concentrations on a seasonal basis
C minor effect on plant performance
Not rated” (NR). noteworthy and may potentially affect performance
Since the plant does not have adequate screening and grit removal the jet aerators become clogged over time leading to low oxygen transfer rates and poor settleability of the activated sludge. This in turn leads to deteriorated final effluent quality as indicated by the recent measured plant performance data. The lack of adequate screening and grit removal at the Rockland WWTP is given a given an “A” rating under the protocol as it is a factor that has a major effect on plant performance under certain operating conditions. Two additional factors were identified to provide a focus for future planning and assigned a rating of NR (“not rated”) as they do not adversely impact current performance. These factors are as follows:
Plant Loading/Inflow and Infiltration (Design) NR
Results from the Rockland WWTP CPE found that influent flow and concentrations were highly variable due to inflow/infiltration (I/I) as evidenced by the higher than typical per capita flows and a high ratio of peak day to annual average flow ratio. This has the potential to impact plant performance as it leads to a more dilute influent and higher flows through the process during wet weather conditions. Due to the variable nature of the influent loading, process flexibility and controllability is essential to maintaining satisfactory plant performance under a wide range of operating conditions.
Process Control Testing and Interpretation (Operation) NR
In the future, as the plant becomes more heavily loaded, trending and interpretation of key process variables by the operators will become more important to support informed process control decisions in the proactive manner. During the CPE, the impact of return streams on plant performance (i.e. supernatant from the aerobic digester) on plant performance could not be quantified. There may be an opportunity to improve process control by characterizing these streams and their impact on plant performance. Improved information on these return streams will also enable the oxygen transfer capacity to be more accurately estimated.
4.5 Evaluation
Comprehensive Technical Assistance (CTA) is the follow-up step to a CPE. Based on the results of this CPE, the Rockland WWTP is a candidate for a Comprehensive Technical
Ontario Clean Water Agency Engineering Services City of Clarence-Rockland Rockland Wastewater Treatment Plant Review February 2015
Page 18
Assistance (CTA) under the Composite Correction Program (CCP) Optimization Program, once the preliminary screening and grit removal issues have been addressed. Implementation of technical assistance at the Rockland WWTP under the CCP program will most likely demonstrate improved effluent quality and/or re-rated plant capacity. Additional benefits of a CTA may include optimized chemical usage and/or energy management procedures. With respect to upgrading the grit removal system, a modular-based grit removal system would most likely be the preferred alternative and has been used successfully in many other wastewater systems across Canada and North America. The flow at the Rockland WWTP is currently at 60% of the plant’s rated capacity. As the loading to the plant increases, a number of improvements will help to utilize available capacity while ensuring that excellent performance is maintained. To address the factors previously discussed, the following suggestions are provided for consideration: Plant Loading/Inflow and Infiltration (Design factor)
Continue ongoing efforts to reduce inflow and infiltration (I/I) into the collection system to reduce the flows to the wastewater treatment plant.
Process Control Testing and Interpretation (Operation)
Continue efforts by the City of Clarence-Rockland and OCWA to jointly trend and interpret key process/performance data and utilize these trend graphs to improve operational decision making.
OCWA’s new Process Data Management (PDM) system will enhance the utilization of collected data. Enhanced graphics and trending capabilities will provide operations with a new tool to assist in data interpretation and allow operators to respond to environmental changes and/or process upsets more efficiently.
5.0 ODOUR ISSUES The WWTP is currently having odour issues. The City would like to identify all the works necessary to control or eliminate odours generated at the WWTP and to develop an implementation plan along with associated budget costs to allow the City to systematically address the odour issues in the next few years. This would include the evaluation of proposed new influent screening facility for the WWTP at either the pumping stations or at the headworks of the existing plant. OCWA ES completed a technical memorandum (tech memo) to address these specific odour issues. A copy of the tech memo entitled Rockland WWTP - Capital Works Required to Address Odour Issues is located in the appendices for additional information. The tech memo included a review of:
Feasibility Study/Conceptual Design Report for Screening and Flow Metering for Rockland STF (2006) by CH2M Hill (“CH2M Hill report”)
Ontario Clean Water Agency Engineering Services City of Clarence-Rockland Rockland Wastewater Treatment Plant Review February 2015
Page 19
Capital Investment Report for the Sanitary Pumping Stations and Treatment System, 2014 prepared by WSP (“WSP report”)
5.1 Odour Causes
OCWA operations and engineering staff have identified two main causes for the odour events that normally result in complaints from local businesses and the public. These odour events are caused by:
The solids accumulation in the SBR due to lack of screening and operational constraints of the existing vortex grit removal system. This issue impacts the performance of the SBR as limited oxygen produces anaerobic conditions in the tanks resulting in odours. Installing screening facilities and improving the grit removal efficiency should solve this issue.
The biosolids generated at the plant are currently pumped into two small lagoons at the back of the plant site, where the sludge is naturally thickened and dried. The lagoons are periodically emptied. Occasionally, odour is generated from these lagoons under certain atmospheric conditions and during the sludge removal process. There is no easy way of eliminating the odours caused by the biosolids lagoons other than to eliminate the lagoons entirely and replace them with a biosolids handling and thickening facility that can better control the biosolids odours. The City is exploring options for alternative biosolids dewatering and storage methods.
5.2 Site Evaluation
OCWA engineering staff visited the WWTP and pumping station #1 on October 20th and, in conjunction with the local OCWA Operations staff, undertook a complete walkthrough assessment at each location. Below is the summary of the evaluation and the issues identified.
5.2.1 Screening/Grit Removal Review
The wastewater system will require a screening system to be installed to assist with current odour issues, but there are several options in terms of where these facilities can be located. A review of the wastewater treatment plant and pump station #1 was conducted to determine the best location for the screening system. There are also operational issues with the current vortex grit removal system. The system works well when there is constant flow, but whenever the pumps start and stop in Pump Station #1, the vortex takes time to develop and thus grit passes through the unit instead of being separated out. Thus, a new grit removal system should be incorporated into the installation of the screenings system.
Wastewater Treatment Plant
In review of the WWTP, there are a couple alternative locations for the screening/grit removal system. Our assessment looked at locating the new screening/grit removal system either in the existing building or in a new building located out in front of the existing building.
Ontario Clean Water Agency Engineering Services City of Clarence-Rockland Rockland Wastewater Treatment Plant Review February 2015
Page 20
There should be adequate space in the existing building that is currently being used for storage and an open workshop area. The CH2MHill Report outlined this area as a potential location for the screening equipment. The issues in using this area for the screening equipment are:
There might not be enough headroom for certain types of screening systems, thereby limiting the type and manufacturers available.
Modifications would be needed to ensure the area is Class 1 Division 1 compliant. This area would need to be enclosed and sealed off from the rest of the building and made to be essentially explosion proof (i.e. retrofitted with intrinsically safe lighting switches, special wiring conduits and new explosion proof heaters and fans).
As indicated in the CH2MHill Report, the design load capacity of the existing floor slab may not be able to sustain the new screening equipment. Our site investigation of the floor slab revealed significant cracking in the concrete slab and interior walls in the office area on the main floor, along with significant axial bending of the support members. There could be significant issues with the structural integrity of the floor slab. During our site visit, we had indicated that a structural evaluation should be undertaken immediately to ensure there is no chance of catastrophic failure based on the current loadings and to determine if there is sufficient load bearing capacity in the slab to install the screening equipment at this location. HP Engineering was retained to undertake a structural review of the floor slab in February.
The screening/grit removal equipment could also be installed in a new building at the front of the existing plant. There appears to be ample space to locate a new screening/grit removal building at this location, but there would be additional costs for constructing a new building. Although, when taking into account the cost of making the existing WWTP building area Class 1 Division 1 compliant and rectifying the potential issues with the floor slab, the option of building a separate new building could potentially turn out to be less expensive. Using the 2006 CH2MHill cost estimate as a starting point and based on our analysis, the updated 2015 cost estimate is $1.25M to $1.3M range (including engineering at 15% but excluding HST) to install the screening equipment in a separate building on the WWTP site.
Pumping Station #1
Another location for the screening equipment could be at Pumping Station #1. During the site review, the site is quite tight and constrained as it is surrounded by provincially significant wetlands, a newly constructed subdivision, old landfill site, and the intersection of forcemains. The access road is not suitable for access by larger trucks in the winter time, as it is quite steep, thus limiting year round removal of the screened solids. The site also has high ground water and very poor soil conditions at this location. As there is a provincially significant wetland nearby, it may be very difficult to obtain approval for dewatering of the site. Our review of the WSP cost estimate for constructing the screening facilities at the PS #1 seems to indicate that the cost estimate may not have included costs associated with dealing with all of the site constraints. Additional costs would be required for dewatering and sheet piling, rebuilding the access road, equipment redundancy, and additional excavation due to the location of the incoming gravity sewers. The additional amount would be approximately
Ontario Clean Water Agency Engineering Services City of Clarence-Rockland Rockland Wastewater Treatment Plant Review February 2015
Page 21
$560,000, which would increase the cost of building the screening facility at PS #1 to $1.8 to 1.9 million (including engineering but excluding HST).
Other Considerations
When reviewing the timeframe required to implement either of the two options, it seems that installing the screening facilities at the WWTP site could happen in a shorter timeframe. The new building at the WWTP site would be considered a Schedule A activity under the Class Environmental Assessment (EA) process, whereas constructing a new building at PS #1 would be considered a Schedule B activity. Meeting the Class EA requirements for a Schedule A activity does not add time to the project schedule, while undertaking a Class EA for a Schedule B activity would add 4 to 8 months to the project timeline. Furthermore, due to the provincially significant wetland adjacent to the PS #1 site, the additional environmental approvals that would be required could potentially result in further delays. In our discussions with the City, they were planning to have the construction commence in 2015 for the screening facility as they want to deal with the odour issues as soon as possible. Thus to fast track the project, the only option would be to construct the screening/grit removal facility at the WWTP site, as the pre-design and design could be started immediately for this option. Building the screening/grit removal facility at the WWTP site would also allow for new pumping stations to flow directly to the WWTP instead of having to be directed to Pump Station #1 or having screening facilities built in each pumping station that pumps sewage directly to the WWTP. Therefore, it would be more economical from both a capital and an operations and maintenance standpoint to have one central screening facility located at the WWTP.
5.2.2 Biosolids Handling Facility
The City was in contact with Bishop Water Technologies pertaining to a Geotube biosoids handling facility to replace the existing biosolids holding/drying lagoons. A Geotube system may allow for the City to receive and handle septage at the WWTP. The City has proposed to locate the Geotube facility next to the plant, where the current leaf and yard waste transfer station is located. The City could be moving to a curbside collection system for leaf and yard waste, thus this area potential could become available at that time. The construction of a new biosolids handling facility would be considered a Schedule A activity under the MEA Class EA process, so the work could start immediately once the land area becomes available. It is anticipated that from the commencement of the design work to the commissioning of the facilities should take approximately two (2) years. Since odours are a major concern at this site, including septage receiving and handling capabilities in the proposed Geotube biosolids handling facility could be an issue. Further study of the potential for mitigating the odours associated with septage handling would be warranted. We would also recommend that such a study undertake a review of other available biosolids dewatering technologies. An updated cost estimate from Bishop Water Technologies was received for the Geotube installation. Therefore based on preliminary costs provided, the project cost estimate would be in the range of $900,000 to $1,000,000 (including engineering but excluding HST).
Ontario Clean Water Agency Engineering Services City of Clarence-Rockland Rockland Wastewater Treatment Plant Review February 2015
Page 22
5.3 Recommendations
From the facility review, the following recommendations were determined:
Install the required screening/grit removal facility, which would alleviate the major odour causes. As there is limited space at PS #1 and inside the existing WWTP building, it is recommended to proceed with a standalone screening building in front of the existing plant building. As the current grinders are beyond their expected life-span and a maintenance issue. The replacement of the grinders should be reviewed during the pre-design phase.
An engineered biosolids dewatering/handling facility should be constructed and the existing sludge lagoons decommissioned. If the City is considering including septage receiving and handling capabilities in this new facility, an additional study should be completed at the pre-design stage to look at odour mitigation options.
A review of the WWTP site layouts should be completed to ensure all of the works required for the remedial measures, plant expansion, and proposed snow disposal area can be completed within the current WWTP site. This work should be completed as part of the design assignment for the screening/grit removal facility to confirm its location to ensure sufficient land area will be set aside for the proposed future expansion work.
A structural investigation of the concrete slab in the WWTP building be undertaken immediately to confirm its structural integrity and determine the remedial measures that need to be completed.
6 CAPITAL PLAN The 20 year Capital Plan was developed based on our flow projections outlined in Section 3.2 in which it is estimated that the Rockland WWTP would reach 90% of its capacity in 2026 and ultimate design capacity in 2031. All costs listed in the Capital Plan are in 2015 dollars and do not include HST. The Capital Plan is located in the Appendix D and outlines the capital work required the next 20 years. The following subsections provide a description of the work listed in the Capital Plan along with the rationale and any assumptions.
6.1 Headworks
The headworks consist of the 450 mm diameter inlet force main, one (1) pressurized vortex grit removal facility, two (2) in-line sewage grinders, and suction centrifugal grit removal facility. The suction centrifugal grit removal facility is equipped with one (1) 450 mm diameter inlet pipe and a vortex grit removal unit complete with two (2) end suction centrifugal grit pumps into an automatic grit classifier unit including a grit bin. As previously discussed in the report, the vortex grit system is not working properly and in conjunction with the grinders do not remove the grit and inorganic material (i.e. rags, hairballs, grit sediment, flushable wipes, etc.). This causes issues within the facility and it is proposed to install a new screening/grit removal facility as outlined in the tech memo (included in the appendices).
Ontario Clean Water Agency Engineering Services City of Clarence-Rockland Rockland Wastewater Treatment Plant Review February 2015
Page 23
OCWA Operations is currently spending approximately $25,000 per year to repair the grinders/shredders. When the screening/grit removal facility is constructed, the grinder/shredders will essentially become redundant and should be removed as part of the screening/grit removal facility construction contract. The cost of the design and installation of the screening/grit removal facility is split over 2015 and 2016, as it is assumed that design and only some of the construction work will be completed in 2015. The cost for the screening facility is estimated at $1.5 million (engineering and construction). As it will take two years to have the screening/grit removal system to be installed, the operational cost of $25,000 per year to repair the grinders and shredder is only allocated to 2015 and 2016. This work should not be needed after the screening facility has been installed and operational. There is a cost for the replacement of both of the degrit pumps in 2016, as the pumps are getting old and should be replaced.
6.2 Aerobic Digester
OCWA operations staff is currently spending approximately $3,000 per year in annual maintenance to clean and inspect the aeration system to remove the accumulated solids and grit. Once the screening/grit removal facility is installed, it is assumed that this work will not be required. The maintenance cost has been included for the first three years, as the screening facility will not be operational until sometime in 2016. The 2017 allocation would ensure operations can check the aeration system and determine if the grit/solids issue has been eliminated. The concept of building a new digester and converting the existing digester to an equalization tank have been discussed. The costs for this change are listed under the subsection Equalization Storage. The aeration system is in good condition, thus it is anticipated that the replacement or upgrade of the aeration system could be undertaken in 2021, when the aeration system is approximately 25 years old. As new digester should be constructed before that time, no future capital costs are allocated for the aeration system.
6.3 Chemical Feed System
The chemical feed systems are in very good condition, as the dechlorination system was recently installed and there were recent upgrades to the phosphorous removal and disinfection systems. Thus, the chemical feed systems should last until the WWTP expansion. With the WWTP expansion, the condition of the chemical feed systems should be review and upgraded or replaced. There is $100,000 allocated for the chemical feed systems in 2025-2029 for inclusion with the WWTP expansion.
Ontario Clean Water Agency Engineering Services City of Clarence-Rockland Rockland Wastewater Treatment Plant Review February 2015
Page 24
6.4 Pumps and Blowers
The pumps and blowers have periodically been refurbished over the years and thus are in good working order. They should last until the WWTP expansion and thus an allocation of $430,000 is noted for pump and blower replacement during 2025-2029. The four rotary positive displacement blowers have been discontinued and are repaired locally. If one of these blowers needs to be replaced before the WWTP expansion, all of its housing and appurtenances may also have to be changed, as new blowers will not fit these dimensions.
6.5 Sequent Batch Reactor
The concrete tanks were recently refurbished, as the concrete was deteriorating and in bad condition. The concrete that was failing was removed and the tanks repaired. The tanks were then coated. The tanks are currently in good condition and the operators are monitoring the condition of the coating and concrete. Additional time is required to determine the longevity of the concrete and coating repairs. An allocation of $300,000 has been included for concrete repair in the next 10 to 15 years. Operations currently allocates $15,000 per year to drain inspect and maintain the tanks. This allocation also includes some repairs to the air feed lines and replacement of air diffusers. An allocation for this work has been included for 2015, 2016, and 2017. Once the screening/grit removal facility is operational, the cleaning work will not be needed on an annual basis. There is an allocation of $15,000 every five years to inspect the SBRs and make repairs to the air feed lines and replacement of air diffusers.
6.6 Effluent (Decant) Equalization/Chlorine Contact Tank
Operations currently spend approximately $10,000 per year for cleaning and inspecting the chlorine contact tank. This allocation is allotted every year until the completion of the WWTP expansion. As discussed in more detail in the WWTP expansion section, this tank will most likely be converted into another SBR tank as part of the WWTP expansion. Thus no other costs are allocated related to this cover this annual maintenance cost. The costs related to the conversion of this tank into an SBR and the installation of new disinfection system have been be included as part of the WWTP expansion construction costs.
6.7 Plant Outfall Sewer
The outfall sewer was inspected in June 2010. It was found that the outfall was clogged. The outfall was cleaned out and a couple of diffusers were replaced. The outfall should be in good condition. We have included a cost of $20,000 in the 2020 to 2024 period to cover a video inspection of the outfall sewer to verify its condition. As sewers have long lifecycles and the outfall sewer is not even 20 years old, we have assumed that further work will not be required within the 20 years covered by this capital plan.
Ontario Clean Water Agency Engineering Services City of Clarence-Rockland Rockland Wastewater Treatment Plant Review February 2015
Page 25
6.8 Process Sump Pumps
The process sump pumps are in good working condition and should last until the WWTP expansion. An allocation of $12,000 has been allocated for replacement of the pumps during the WWTP expansion.
6.9 Equalization Storage
Due to high wet weather flows as described in Section 3.2, it is recommended that some form of flow equalization storage be constructed in the next few years. Dealing with the wet weather flows will forestall the need to expand the entire treatment plant. We have included $25,000 in 2017 for an engineering review of potential flow equalization options to deal with the instantaneous wet weather flows. Based on a very preliminary review, we would recommend that an option could be to convert the existing digester tank to a flow equalization tank. To replace the digester tank, we recommend the construction of two new glass-fused steel digester/biosolids storage tanks with an aeration system (next to the proposed Geotube biosolids handling facilities). We have included a total of $1.6 million in 2018 for this project (engineering and construction).
6.10 Biosolids System
The current biosolids system is comprised of two lagoons which store and naturally thicken the biosolids. These types of systems tend to have odour issues. The City would like to replace them and potentially review options to accept septage at the facility. Geotubes is a technology that should allow for the acceptance of septage, but other technologies will be reviewed to determine the best solution for the City. Costs to decommission the lagoon system (remove sludge and backfill the lagoon) have been included at $150,000 in 2016. This cost includes the removal of 1,800 m3 in each lagoon at a cost of $16 per m3 to field apply and create a NASM plan. As this project is a priority, there is $25,000 allocated in 2015 for a study to review available technologies for a new biosolids system. The City did obtain a quote for a Geotube system. The cost to construct the new biosolids facility is allocated for 2016 and 2017 based on an updated Geotube quote of $1,000,000. Engineering and project management for this project has been estimated at 15% of construction costs ($150,000).
6.11 Standby Power Facility
There is a 75 kW power propane powered generator with a fuel storage container at the WWTP. Generators typically last at least 25 years. The generator is in good condition and replacement costs have been allocated as part of the WWTP expansion project. A total of $150,000 has been allocated for this during the 2025 to 2029 timeframe.
6.12 Building and Other Components
The electrical systems have an allocation of $5,000 per year for regular maintenance and software upgrades. This would include control panels, MCC, SCADA, Outpost, etc. An additional $25,000 has been allocated in 2015 for a software upgrade.
Ontario Clean Water Agency Engineering Services City of Clarence-Rockland Rockland Wastewater Treatment Plant Review February 2015
Page 26
There has been an allocation of $5,000 per year for the replacement of sensors, meters, etc. that would be part of instrumentation. A new air conditioning system will be required soon and $10,000 has been allocated in 2016 for this item. While onsite, it was determined that a structural review is required for the SBR building. There was axial bending of the supports under the concrete slab and cracking in the facility. It was discussed that a structural review of the concrete slab should be undertaken as soon as possible. The draft report on the structural review was completed on February 10, 2015 by HP Engineering. They had indicated that the structural repair costs would be approximately $140,000. This did not included an amount for engineering, thus the amount of $165,000 listed in the Capital Plan includes approximately 15 % for engineering.
6.13 Plant Expansion
The WWTP facility is currently in good condition and most of the equipment should last until the WWTP expansion project. As outlined previously, the Rockland WWTP should reach 90% capacity in 2026 and ultimate design capacity in 2031. The facility expansion project will start with a Class Environmental Assessment (EA) in 2020. The cost for Class EA work is estimated at $200,000. Engineering costs (design, tendering, contract admin, etc.) related to the construction for the plant expansion, are normally estimated at 15% of construction costs. Project Management services are normally around 5%. An allocation of 20% has been added to the capital plan for engineering and project management. Plant expansion construction costs are difficult to determine as there are many different design alternatives that can be utilized depending on how much additional capacity will be required. There are also the regulatory issues, as it is expected that MOECC may require additional tertiary treatment once the request for increase capacity is submitted and it is unclear if there will be any other requirements due to new or revised regulations. Some of the expansion options and/or requirements could be:
Addition of tertiary filters for increased phosphorous removal
Building additional SBR units
Convert the chlorine contact tank to another SBR and use UV (or another disinfection alternative) instead of chlorine for disinfection
Convert the SBR from a batch reactor to ISAM system, thus increasing the capacity of each SBR cell
Normally when an ECA (formally Certificate of Approval) is revised, MOECC reviews the project with respect to the current regulations and thus applies any changes that are required to ensure it complies with the current standards. It is assumed that MOECC will lower the phosphorous discharge limits and therefore tertiary filters will have to be added for increased phosphorous removal. Installing tertiary filters could cost $1.5 million or more, as the cost increases exponentially with more stringent phosphorus limits.
Ontario Clean Water Agency Engineering Services City of Clarence-Rockland Rockland Wastewater Treatment Plant Review February 2015
Page 27
Increasing the plant capacity could be done in a number of ways depending on the amount of additional capacity required. Building new additional SBR units could be quite expensive, thus converting the equalization storage (currently the aerobic digester) and the chlorine contact tank to additional SBR units could be an alternative to increase the facility’s capacity, but then new equalization storage and/or alternative disinfection method would be required. Another alternative to increase capacity would be to convert the batch SBR cells to ISAM process (SAM stands for surge anoxic mix), as each cell would then be rated to a higher capacity as they would be able to process more flow in the same tankage. The Rockland WWTP has five (5) same sized celled compartments; where three (3) are currently SBR cells, one (1) is currently an aerobic digester (proposed to be used for equalization storage) and one (1) is the chlorine contact tank. The plant is rated at 6,800 m3/day, thus each SBR can process approximately 2,308 m3/day. Converting the existing chlorine contact tank into an SBR would increase the capacity by 2,308 m3/day. Converting the proposed equalization storage tank (currently the digester tank) into another SBR would increase the total additional capacity to 4,616 m3/day. The issue with converting these cells into SBRs is that these items will still be needed, but the chlorine contact chamber could be replaced with a UV system for disinfection. The UV system should not need as much space as a chlorine contact chamber, but will consume more power annually. Installation of a UV system will require a trench to be built for the effluent to flow through and a building to store the equipment. If one cell is converted to an SBR and a UV system added, the cost would be in the $2 to 3 million range. Converting to the ISAM process would increase the capacity of each of the SBR cells, due to influent solids settling out before reaching the SBR basins. In operating an ISAM, the influent solids settle out of the influent in the anaerobic basin (much like a primary clarifier), then the influent flows into the SAM surge basin or influent equalization basin, before flowing into the SBR basin. Elimination of primary solids in the anaerobic basin allows for much smaller SBR basins at equivalent SRT than conventional SBRs. The surge basin provides flow and nutrient equalization to optimize treatment at the full range of flows and loadings. The actual cost of the plant expansion will be heavily dependent on the amount of additional capacity that will be added, the additional regulatory requirements that will be stipulated (especially as it relates to phosphorus discharge limits) and the technologies and methodologies used in the expansion project. Our very preliminary project cost estimates for the WWTP expansion range between $5 to $8 million. For the purposes of the capital plan, the higher estimate was added. Depending on the preliminary design outlined in the Class EA, this amount may need to be adjusted.
6.14 Other Works
This section pertains to any other items that have not yet been assigned to the other sections. There are a few studies that should be done in the next few years. The most important study is the structural review of the concrete floor of the SBR building, as there are concerns with the structural integrity of the slab. There is $15,000 allocated for the structural review in 2015. In 2015, there is also an allocation of $10,000 to conduct a layout/feasibility study for future expansions. The study would review the site and all potential future works to determine if all works can be constructed on the current site and their placement. We recommend that such a
Ontario Clean Water Agency Engineering Services City of Clarence-Rockland Rockland Wastewater Treatment Plant Review February 2015
Page 28
study be undertaken to ensure that all of the planned works over the next 20 years can be efficiently laid out within the existing site. In 2017, there is an allocation of $25,000 to conduct a CTA. As outlined in the capacity assessment a CTA is the follow up step to at CPE (identifies and prioritizes causes of poor performance in a facility). The CTA should be undertaken once the issues pertaining to the preliminary screening and grit removal issues have been addressed. Additional benefits of a CTA may include optimized chemical usage and/or energy management procedures. The cost of a CTA would depend on the parameters of the assignment. Depending on the amount of detail and additional items included in the CTA, the cost would be between $10,000 to $25,000. The capital plan should be updated about every five (5) years to reflect actual growth rates and flows. Capital plans are produced based on many variables. If the area’s growth increases or decreases, the capital plan will not adequately predict the foreseen costs. $10,000 has been allocated every five (5) years for this item. The Capital Plan includes an allocation for emergency repairs. This allotment should encompass the smaller items that were not listed and any unforeseen emergencies. The amount is $20,000 per year until the WWTP expansion and then it is reduced to $10,000 per year. While there shouldn’t be issues with the newly installed equipment in at least the first five (5) years after the WWTP expansion project has been completed, sometimes issues do appear. Thus, there is still an amount for emergency repairs after the WWTP expansion.
5.15 Capital Plan Summary
The 20 year capital plan outlines the foreseeable required capital expenditures based on the growth rate of an additional 459 people each year (average sewage flow of 365 l/person) and includes an additional 15% contingency on top of the cost estimates. This resulted in an overall cost for the 20 years of approximately $18.9 million (2015 dollars without HST) plus an amount for any structural building items. The major items included in the Capital Plan that are not upgrades nor maintenance of existing equipment are:
Construction of a new screening facility in 2015/2016. Construction of a new biosolids handling system (and decommissioning of the old
lagoon system) in 2016/2017. Provision of equalization storage in 2017/2018 Recommendations from the structural analysis in 2015. Plant Expansion project in 2025 – 2029.
The plant expansion project should encompass the replacement of existing equipment that is listed in the 2025 – 2029 timeframe. These costs were listed separately to ensure they were reviewed at the planning stage for the expansion.
7 SUMMARY AND RECOMMENDATIONS Our review of the plant’s flow data in conjunction with the plant’s capacity indicates that the plant is currently operating at approximately 60% of its average day design flow, but it is almost at capacity (93%) based on its maximum peak flow. Once adequate flow equalization is
Ontario Clean Water Agency Engineering Services City of Clarence-Rockland Rockland Wastewater Treatment Plant Review February 2015
Page 29
provided at the plant to address the wet weather peak flow, the plant will have enough capacity to handle growth for at least the next 10 years. The capacity review and the resulting Capital Plan for the WWTP was prepared based on the condition of the plant, the findings from the site review and the projected growth rate. The future growth rate within the sewage service area was estimated by City staff to be an average of 170 homes per year with 2.7 people per household. Using the current flow rate of approximately 365 l/capita/day, we developed the projected flow rates as shown in Figure 1. These projected flow rates were used as the basis for determining the timing of the recommended upgrades and/or replacements as outlined in the 20 year capital plan. We undertook a facility assessment for the WWTP based on the most current three (3) years of data (November 2011 – September 2014). Each major unit process was evaluated and most were deemed “capable”. The only process that was deemed “not capable” was the pressurized vortex girt removal unit. This process is currently not functioning properly and causing grit issues with the other WWTP processes. The Comprehensive Performance Evaluation (CPE) identifies and prioritizes causes of poor performance (i.e. factors which cause a plant’s effluent concentrations or loadings to exceed limits). The lack of adequate screening and grit removal at the Rockland WWTP is given a given an “A” rating under the protocol as it is a factor that has a major effect on plant performance under certain operating conditions. Two additional factors were identified to provide a focus for future planning and assigned a rating of NR (“not rated”) as they do not adversely impact current performance. The two factors identified are plant loading/inflow and infiltration (Design) and process control testing and interpretation (Operation). Based on the results of this CPE, the Rockland WWTP is a candidate for a Comprehensive Technical Assistance (CTA) under the Composite Correction Program (CCP) Optimization Program. We recommend the CTA be undertaken once the preliminary screening and grit removal issues have been addressed. Implementation of technical assistance at the Rockland WWTP under the CCP program will most likely demonstrate improved effluent quality and/or re-rated plant capacity. Additional benefits of a CTA may include optimized chemical usage and/or energy management procedures. Our evaluation of the odour issues that are currently being experienced at the WWTP identified two main issues for the odours. One issue is the solids accumulation in the SBR due to the lack of screening and operational constraints of the existing vortex grit removal system. These odour issues will be reduced once adequate screening/grit removal system is installed and the vortex grit removal system is replaced. The other main odour causing issue is the biosolids storage lagoons. Odour is generated under certain atmospheric conditions and during the sludge removal process. An engineered biosolids dewatering/handling facility should be constructed to replace the existing lagoon system to mitigate these odour issues. The 20 year capital plan outlined the foreseeable capital expenditures required at the WWTP for the next 20 years. The proposed timing of the expenditures were based on the above mentioned growth and flow rates and could be subject to revision if growth patterns deviate significantly from what was projected. The capital plan shows that a total investment of approximately $18.9 million over the next 20 years will be required. The cost estimates are in 2015 dollars, do not include HST and have a 15% allowance for engineering.
Ontario Clean Water Agency Engineering Services City of Clarence-Rockland Rockland Wastewater Treatment Plant Review February 2015
Page 30
From our review, it was determined that the Rockland WWTP is in fairly good condition, but it is approaching its design capacities. There are a few items that will have to be completed in the near future which would delay the need for a plant expansion by at least 10 years. The recommendations in the report include:
1. A detailed concrete slab assessment and repair in the SBR building has to be completed as soon as possible.
2. Add a screening/grit removal facility and remove the current grinders/shredders.
o This should resolve the issue of the grit accumulating in the tanks and causing operation and odour issues.
o The WWTP should be evaluated by undertaking a CTA, a few years after the screening/grit removal facility is operational.
3. A new biosolids facility should be constructed to reduce odours at the WWTP. o The lagoon should be decommissioned after the new facility has been designed
and constructed. o The issue of whether or not to incorporate septage receiving capabilities into the
new biosolids facility should be reviewed as part of the pre-design work.
4. To address the wet weather flows, we recommend providing some equalization storage by converting the existing digester into an equalization tank and constructing new digester/sludge storage tanks with aeration systems.
o The equalization tank should be adequately sized to encompass the significantly higher peak instantaneous flows due to intense storm events and ensure these increased flows do not overwhelm the facility.
o The new digester tanks should be sized for future flows.
5. A review of the WWTP site layouts should be completed to ensure all of the works required for the remedial measures, plant expansion, and proposed snow disposal area can be completed within the current WWTP site.
6. A Class EA should be undertaken in 2020 to review the expansion options and provide
updated cost estimates. o Based on the current flow rate and the estimated growth rate provided by the
City, it is anticipated that the plant will reach its capacity by 2031 and will be at 90% capacity in 2026.
o Completing the Class EA a few years before construction starts will allow the City to review their costs for the project and potentially adjust rates if necessary.
7. The plant expansion should be initiated in 2025, as it is estimated the plant flow will be at
90% in 2026. o All of the costs for the plant expansion are listed for the timeframe of 2025 to
2029. o Class EAs are valid for ten (10) years, so depending on actual flow rates in 2020,
the design and construction for the plant expansion could be undertaken earlier or later than currently anticipated.
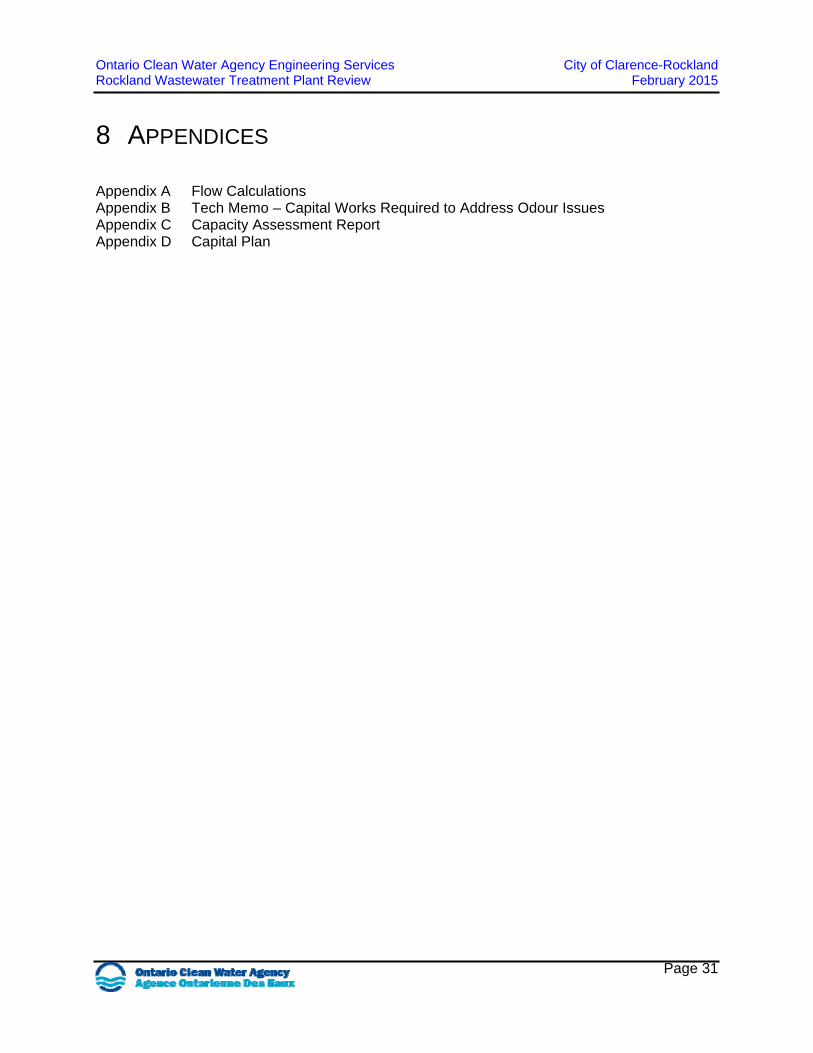
Ontario Clean Water Agency Engineering Services City of Clarence-Rockland Rockland Wastewater Treatment Plant Review February 2015
Page 31
8 APPENDICES Appendix A Flow Calculations Appendix B Tech Memo – Capital Works Required to Address Odour Issues Appendix C Capacity Assessment Report Appendix D Capital Plan
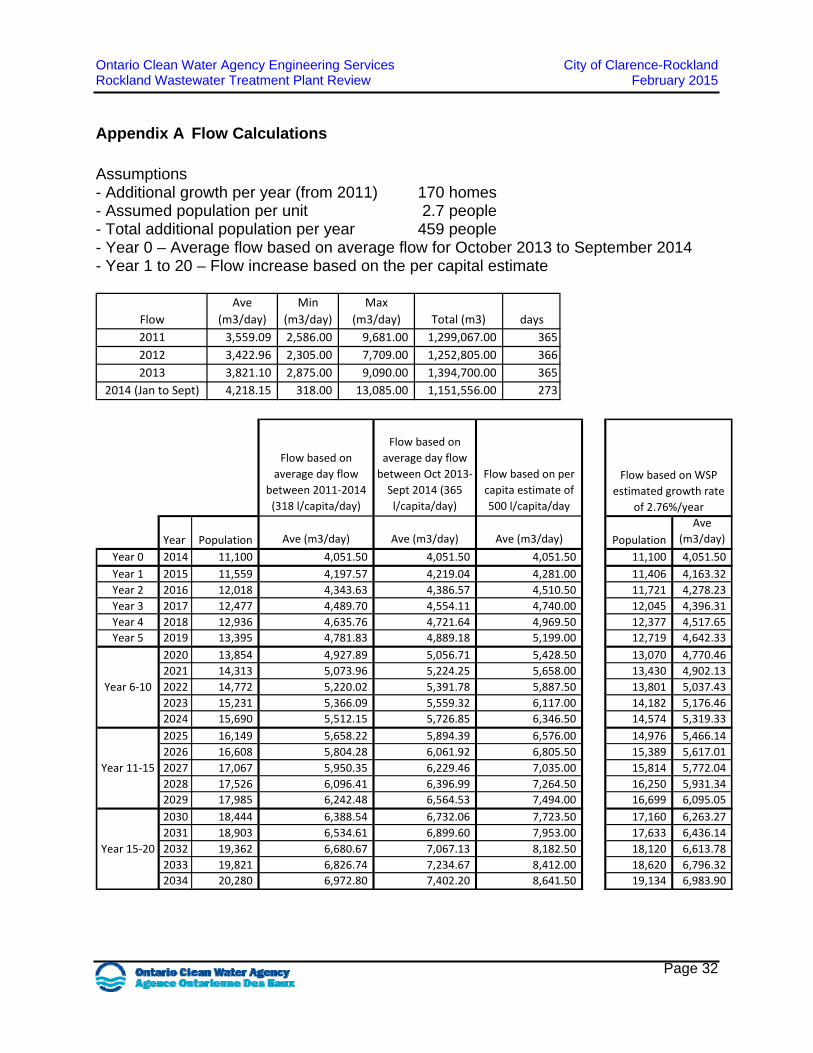
Ontario Clean Water Agency Engineering Services City of Clarence-Rockland Rockland Wastewater Treatment Plant Review February 2015
Page 32
Appendix A Flow Calculations Assumptions - Additional growth per year (from 2011) 170 homes - Assumed population per unit 2.7 people - Total additional population per year 459 people - Year 0 – Average flow based on average flow for October 2013 to September 2014 - Year 1 to 20 – Flow increase based on the per capital estimate
2011 3,559.09 2,586.00 9,681.00 1,299,067.00 365
2012 3,422.96 2,305.00 7,709.00 1,252,805.00 366
2013 3,821.10 2,875.00 9,090.00 1,394,700.00 365
2014 (Jan to Sept) 4,218.15 318.00 13,085.00 1,151,556.00 273
Flow
Ave
(m3/day)
Min
(m3/day)
Max
(m3/day) Total (m3) days
Flow based on
average day flow
between 2011‐2014
(318 l/capita/day)
Flow based on
average day flow
between Oct 2013‐
Sept 2014 (365
l/capita/day)
Flow based on per
capita estimate of
500 l/capita/day
Year Population Ave (m3/day) Ave (m3/day) Ave (m3/day) Population
Ave
(m3/day)
Year 0 2014 11,100 4,051.50 4,051.50 4,051.50 11,100 4,051.50
Year 1 2015 11,559 4,197.57 4,219.04 4,281.00 11,406 4,163.32
Year 2 2016 12,018 4,343.63 4,386.57 4,510.50 11,721 4,278.23
Year 3 2017 12,477 4,489.70 4,554.11 4,740.00 12,045 4,396.31
Year 4 2018 12,936 4,635.76 4,721.64 4,969.50 12,377 4,517.65
Year 5 2019 13,395 4,781.83 4,889.18 5,199.00 12,719 4,642.33
2020 13,854 4,927.89 5,056.71 5,428.50 13,070 4,770.46
2021 14,313 5,073.96 5,224.25 5,658.00 13,430 4,902.13
2022 14,772 5,220.02 5,391.78 5,887.50 13,801 5,037.43
2023 15,231 5,366.09 5,559.32 6,117.00 14,182 5,176.46
2024 15,690 5,512.15 5,726.85 6,346.50 14,574 5,319.33
2025 16,149 5,658.22 5,894.39 6,576.00 14,976 5,466.14
2026 16,608 5,804.28 6,061.92 6,805.50 15,389 5,617.01
2027 17,067 5,950.35 6,229.46 7,035.00 15,814 5,772.04
2028 17,526 6,096.41 6,396.99 7,264.50 16,250 5,931.34
2029 17,985 6,242.48 6,564.53 7,494.00 16,699 6,095.05
2030 18,444 6,388.54 6,732.06 7,723.50 17,160 6,263.27
2031 18,903 6,534.61 6,899.60 7,953.00 17,633 6,436.14
2032 19,362 6,680.67 7,067.13 8,182.50 18,120 6,613.78
2033 19,821 6,826.74 7,234.67 8,412.00 18,620 6,796.32
2034 20,280 6,972.80 7,402.20 8,641.50 19,134 6,983.90
Flow based on WSP
estimated growth rate
of 2.76%/year
Year 6‐10
Year 11‐15
Year 15‐20

Ontario Clean Water Agency Engineering Services City of Clarence-Rockland Rockland Wastewater Treatment Plant Review February 2015
Page 33
Appendix B Tech Memo – Capital Works Required to Address Odour Issues
Engineering Services
1
Sheridan Centre TEL: 905-491-3030 2225 Erin Mills Parkway FAX: 905-855-3232 Suite 1200 Dir: 905-491-3053 Mississauga, Ontario www.ocwa.com L5K 1T9
Technical Memorandum To: Denis Longpré
Gérant de l’environnement, Infrastructure et ingénierie Environment Manager, Infrastructure and Engineering Cité Clarence‐Rockland City
From: Andy Valickis, P.Eng.
Engineering Services
Re: Rockland Sewage Treatment Facility
Capital Works Required to Address Odour Issues
Date: December 19, 2014
PURPOSE
OCWA Engineering Services was initially retained to evaluate and determine the best option for locating
the proposed new influent screening facilities for the Rockland Sewage Treatment Facility (STF). Based
on previous assessments undertaken by other consultants, two basic options were outlined for locating
these facilities. The screening facilities could be incorporated into the headworks at the existing plant or
located at Pumping Station (PS) #1.
In addition the City would like to identify all the works necessary to control or eliminate odours
generated at the STF and to develop an implementation plan along with associated budget costs to
allow the City to systematically address the odour issues in the next few years.
This tech memo will serve to outline the necessary capital works, the associated budgets and outline a
proposed schedule for implementation.
BACKGROUND
The treatment facility on occasion generates significant odours, which result in complaints from local
businesses and the public. OCWA operations and engineering staff have identified two main causes for
these odour events.
1. Currently there is no screening provided in the system allowing solids to enter and accumulate
in the treatment plant tankage. In addition, the existing vortex grit removal system does not
completely remove the incoming grit due to several operational constraints. The accumulation
of solids/grit eventually reaches a level where the aeration ports within the SBR tanks get
2
plugged, restricting the amount of oxygen being supplied. This lack of oxygen creates anaerobic
conditions in areas of the tanks and within the solids layers accumulating at the bottom of the
tanks. This impacts the performance of the SBRs in addition to generating considerable odours.
To deal with the solids accumulation, plant staff sequentially take each SBR tank out of service
during the warm weather months, drain them, clean the aeration ports and manually remove
the accumulated solids. During these cleaning operations considerable odours are created
through the removal of the anaerobic solids.
Installing screening facilities and improving the grit removal efficiency will eliminate the solids
accumulation problems and the periodic anaerobic conditions currently being experienced at
the plant. This will eliminate a major source of the odours at the plant.
2. The biosolids generated at the plant are currently pumped into two small lagoons at the back of
the plant site, where the sludge is naturally thickened and dried. The lagoons are periodically
emptied as they get full. Occasionally, odour is generated from these lagoons under certain
atmospheric conditions and during the sludge removal process.
There is no easy way of eliminating the odours caused by the biosolids lagoons other than to
eliminate the lagoons entirely and replace them with a biosolids handling and thickening facility
that can better control the biosolids odours. The City has already undertaken a review of
available options and is exploring/pursuing the Geotube dewatering technology to dewater and
contain the biosolids sludge produced at the plant.
APPROACH
Our approach in determining the best site for the screening facilities was as follows:
1. Review all the previous reports dealing with the screening issue. Two reports were identified
and copies obtained.
i. Feasibility Study / Conceptual Design Report for Screening and Flow Metering
for Rockland STF (2006) by CH2M Hill (“CH2M Hill report”)
ii. Capital Investment Report for the Sanitary Pumping Stations and Treatment
System, 2014 prepared by WSP (“WSP report”)
2. Undertake a visit to both sites to familiarize ourselves with the facility layouts, existing
conditions and identify any constraints that would impact the design, construction, operation
and the short and long term costs of locating the new facilities at each site. The site visit was
undertaken on October 20th, 2014.
3. Meet with City staff to identify and discuss any other issues or constraints that might impact the
decision of where best to locate the new screening facilities. OCWA personnel met with City
staff on October 21st.
3
EVALUATION/FINDINGS
OCWA engineering staff visited the both sites on October 20th and in the company of OCWA Operations
staff did a complete walkthrough assessment at each location.
Screening/Grit Removal Review ‐ Sewage Treatment Facility
The exiting treatment plant has an available area inside the existing building that is currently being used
for storage of miscellaneous equipment and as an open workshop area. This area was identified by
CH2M Hill in their 2006 report as a potential area for installing the screening equipment.
This area appears to have sufficient floor area to house the necessary equipment but, as mentioned in
the CH2M Hill Report, there are concerns with respect to the available headroom. There is a concern
that not all the various supplier equipment would be able to fit in the available space, thereby limiting
the type and manufacturer of screening equipment available to the City.
As outlined in the CH2M Hill report, there would need to be significant modifications to this area to
make it Class 1 Division 1 compliant. The area would need to be enclosed and sealed off from the rest of
the building. The entire enclosed space would have to be made essentially explosion proof (i.e.
retrofitted with intrinsically safe lighting switches, special wiring conduits and new explosion proof
heaters and fans). In addition, all new screening equipment will need to have Division 1 compliant
motors and electrical components.
The other major concern of locating the screens in this area is load bearing capacity of the existing
concrete floor slab. The CH2M Hill report indicated that based on the design load capacity of the slab,
the weight from the proposed new screening equipment would exceed the load bearing capacity of this
floor slab. Our site investigation found significant cracking in the concrete slab and interior walls in the
office area on the main floor. In addition, the equipment support members below the slab show
significant axial bending, indicating that the floor slab has significantly deflected. We have serious
concerns about the structural integrity of the floor slab in this area. Given the excessive cracking and
deflection that is currently visible, an exhaustive structural review would need to be undertaken before
any decision is made to locate the new facilities in this area. In fact, we would recommend that such a
structural evaluation be undertaken immediately as a precaution to ensure there is no chance of
catastrophic failure based on current loadings.
The other option when looking to locate the screens at the plant is to construct an entirely new building
to house the screens at the front of the existing plant. There appears to be ample space in front of the
existing treatment plant building to locate a new screening building. The additional cost of constructing
a new building would on the outset make this a more costly option. But due to the identified
constraints related to making the screening area in the existing building Class 1 Division 1 compliant and
the potential problems with the floor slab, this would certainly be the easier option to implement and
potentially less costly in the long run.
There are several ways of improving the grit removal capabilities at the plant. Currently the existing
vortex grit removal process works well under constant flow. The problem occurs when the pumps in PS
4
#1 stop and start. It takes some time upon start‐up of the pumps for a vortex to develop inside the
vortex separator unit. For the period of time that it takes for the vortex to develop, the grit passes
through the unit and into the plant. Reducing the number of times the pumps at PS #1 stop/start will
help to reduce the amount of grit getting through, but the most effective way would be to incorporate
new grit removal equipment into the proposed new screening facility.
We undertook to update the conceptual cost estimate prepared by CH2M Hill in their 2006 report for
installing the screening equipment in a separate building to reflect 2015 construction costs. Our current
budgetary costs estimate is in the $1.25M to $1.3M range (including engineering at 15% but excluding
HST).
Screening/Grit Removal Review ‐ Pumping Station #1
The other potential location for the screening facilities as suggested in the previous reports is Pumping
Station #1. Our visit to the pumping station found the site quite tight and constrained. The access to the
site from the road is quite steep, not suitable for access by larger trucks in the winter time. If screening
was provided at this site then year round truck access would be required to remove the screened solids.
The area in front of the pumping station contains a number of manholes and several incoming sewers
making that area unsuitable for locating the screening facilities. There is a provincially significant
wetlands located immediately to the east and a newly constructed subdivision road immediately to the
west. We also understand that there is an old landfill site located on the west and north sides of the
site. This leaves only the area on the south side (behind the PS building), through which the forcemain
traverses, as the only suitable area for constructing additional facilities. While it is not impossible to
locate the new facilities at this site, it would take significant reconstruction work to fit everything in.
Furthermore, given the low elevation of the site and its proximity to the wetlands, it would be
reasonable to expect that the water table would be quite high and the soils conditions poor. As part of
our review we looked at the original construction drawings. The drawings indicate that several
boreholes were undertaken at the time the station was designed and the results confirm the presence
of high groundwater levels and very poor soil conditions at this location. As a result, any construction
requiring excavation would necessitate extensive dewater and/or sheet piling. This would significantly
increase the difficulty of construction and the resulting costs. In addition, environmental approvals
might be more difficult to obtain for dewatering the site given its close proximity to the provincially
significant wetlands and the potential for dewatering activities negatively impacting the wetlands.
We have reviewed the cost estimate prepared by WSP for locating the screening facilities at the PS #1
site. We believe the WSP cost estimate did not account for several of the site constraints. The amount
of excavating that will be required is understated, as the facilities will have to be located well below
grade to accommodate the incoming gravity sewers. Furthermore, no provision for dewatering and
sheet piling was included in the estimate. The access road would also have to be rebuilt to
accommodate truck access in the winter time to allow for the timely removal of screened material.
These items alone would add approximately $400,000 to the cost. Also only one piece of screening
equipment was included in the estimate. To account for the necessary equipment redundancy, an
additional $160,000 should be added. Taking all these additional costs into consideration, we feel the
5
cost of locating the screening facility at the PS #1 site would be in the range of $1.8 to $1.9M (including
engineering but excluding HST).
Screening/Grit Removal Review ‐ Other Considerations
Having read the CH2M Hill report in detail, we found no formal recommendation that the screening
facilities be located at the PS #1 site. The recommendation in the report states that the:
“…feasibility of installing screening equipment in the existing STF [building] is low and would
involve awkward access to the units for operations and maintenance, as well as a number of
difficulties in installation and potential unknown construction issues. The recommendation is to
proceed with Option #2 to construct a new screening building.”
In the body of the CH2M Hill report Option #2 is described as constructing a new screening building and
that:
“…one could consider a location at either the wastewater plant, or at PS #1.”
Given that the CH2M Hill report did not look at the PS #1 site in any depth or undertake any analysis on
how to incorporate such a building on the site, we would conclude that that locating the screening
building at the PS #1 was more of a suggestion (requiring further study), rather than a firm
recommendation.
Given the urgency of addressing the odour issues, the other consideration is that of timing and how
quickly the new screening facility can be constructed and put into service. Looking at the two sites from
a schedule stand point, we believe that constructing a separate screening building at the existing plant
site can be done in a much shorter time frame. All the work of constructing the new screening facility at
the plant would be considered a Schedule A activity for Class Environmental Assessment (EA) purposes.
Constructing the screens down at PS #1 would be a Schedule B activity as a new building or structure
would be required. Meeting the Class EA requirements for a Schedule A activity does not add time to
the project schedule, while undertaking a Class EA for a Schedule B activity would add 4 to 8 months to
the project timeline. Furthermore due to the provincially significant wetland adjacent to the PS #1 site,
the additional environmental approvals that would be required could potentially result in further delays.
At our meeting with City staff on October 21st, it was indicated that the City would like to move forward
with the screening project as quickly as possible in order to eliminate or reduce the odours emanating
from the treatment plant. They were hoping to have the construction commence in 2015. Given the
additional Class EA requirements for the PS #1 location, the only option that could be fast tracked to
commence construction in 2015 is the option of locating the screening building at the plant. In fact pre‐
design and the design could commence immediately for this option.
The other significant advantage of locating the screens at the treatment plant is that in the future new
pumping stations can be constructed to pump directly into the treatment plant and not have to flow
into PS #1. Locating the screens at PS #1 would require all future sewage flow to be pumped to PS #1
necessitating expanding the PS over the years. Conversely, if pumping flows from new future
developments directly to the plant is deemed a more feasible option, then screening facilities would be
6
required at all such new pumping stations. This scenario could potentially result in a number of
pumping station screening facilities located throughout the collection system. Therefore it would be
more economical from both a capital and an operations and maintenance standpoint to have one
central screening facility located at the STF.
Biosolids Handling Facility
The proposed Geotube biosolids handling facility as proposed by Bishop Water Technologies will allow
the City to decommission the existing biosolids holding/drying lagoons. The proposed Geotube facility
will be similar to the existing facility at the Eganville STP and could potentially be able to receive and
handle septage. It is proposed to locate this facility next to the plant where the leaf & yard transfer
station area is currently located. It is proposed to start a curbside collection of L&Y waste in the new
contract in early 2016 (or early if required) freeing up the land area for the construction of the Geotube
biosolids handling facility. The construction of this facility would be considered a Schedule A activity
under the MEA Class EA process so that work can commence immediately once the land area becomes
available. It is anticipated that from the commencement of the design work to the commissioning of the
facilities should take approximately two (2) years.
Since odours are a major concern at this site, we would recommend caution before including septage
receiving and handling capabilities in the proposed Geotube biosolids handling facility. Further study of
the potential for mitigating the odours associated with septage handling would be warranted.
We have contacted Bishop Water Technologies for an update of their cost estimates and to get a better
idea of the ancillary costs associated with servicing the Geotube facility. Based on preliminary costs
provided, we feel that a good budgetary project cost estimate would be in the range of $900,000 to
$1,000,000 (including engineering but excluding HST).
CONCLUSIONS AND RECOMMENDATIONS
1. In order to address the odour issues at the Rockland STF, the first priority would be to install the
required screening/grit removal facility. This would alleviate the major cause of odours at the plant
and also serve to improve the performance of the facility. Given the numerous constraints of
locating the screening/grit facility either at PS #1 or inside the existing STF building, we would
recommend that the City proceed with a stand‐alone screening building located at the front of the
plant. While it is our opinion that including new grit removal equipment as part of the proposed
new screens would be the best solution, this should be reviewed in greater detail at the facility pre‐
design stage. The project should also include the removal of the existing grinders as they will no
longer be required with the installation of the screening facilities. The grinders are currently well
beyond their expected life‐span and are a continual and significant maintenance problem.
2. The existing sludge lagoons also need to be decommissioned and replaced with a new Geotube
bioslolids handling facility or a similar engineered biosolids dewatering/handling facility. This facility
should be constructed as soon as the land adjacent to the existing plant becomes available. To fast
track this project, we would recommend that the design of this facility commence right away so that
7
a construction contract could be tendered immediately as the land becomes available. If the City is
considering including septage receiving and handling capabilities in this new facility, we would
recommend additional study at the pre‐design stage to look at odour mitigation options.
3. Furthermore, given that these two new facilities, along with the proposed snow disposal area will
use up a major portion of the available land area, we would recommend that as part of the design
assignment for the screening/grit removal facilities, the consultant undertakes a review of future
plant expansion options and their associated layouts. Our concern is that sufficient land area be set
aside for future expansions and to confirm that the new screening/grit removal facility, the Geotube
biosolids handling facility and the snow disposal facility be sited in a way that they will not interfere
with future expansions of the plant.
4. We would also recommend that a structural investigation of the concrete slab in the STF building be
undertaken immediately to confirm its structural integrity.
Andy Valickis, P.Eng
Engineering Services
Ontario Clean Water Agency Engineering Services City of Clarence-Rockland Rockland Wastewater Treatment Plant Review February 2015
Page 34
Appendix C Capacity Assessment Report
City of Clarence‐Rockland
Rockland Capacity Assessment Report
Submitted by
December 2014
Ontario Clean Water Agency Engineering Services City of Clarence‐Rockland Rockland Capacity Assessment Report December 2014
Page i
TABLE OF CONTENTS
1.0 BACKGROUND AND OBJECTIVES .................................................................................................... 1
1.1 FACILITY DESCRIPTION ............................................................................................................... 2
1.1.1 General ............................................................................................................................... 2
1.1.2 Liquid Train ......................................................................................................................... 2
1.1.3 Solids Train ......................................................................................................................... 3
1.2 PERFORMANCE ASSESSMENT .................................................................................................... 4
1.2.1 Historical Performance ....................................................................................................... 4
1.2.2 Load Evaluation .................................................................................................................. 9
1.2.3 Process Evaluation ............................................................................................................ 10
1.3 MAJOR UNIT PROCESS EVALUATION........................................................................................ 11
1.3.1 Approach .......................................................................................................................... 11
1.3.2 Results .............................................................................................................................. 12
1.3.3 Discussion ......................................................................................................................... 14
1.3.4 Summary........................................................................................................................... 15
1.4 FACTORS ................................................................................................................................... 16
1.5 EVALUATION FOLLOW‐UP ........................................................................................................ 17
2.0 Reference Material ....................................................................................................................... 18
3.0 Appendix A – CPE Supporting Calculations .................................................................................. 19
3.1 Loading Evaluation Calculations ............................................................................................... 19
3.2 Process Evaluation Calculations ............................................................................................... 21
3.3 Performance Potential Graph Calculations .............................................................................. 23
Ontario Clean Water Agency Engineering Services City of Clarence‐Rockland Rockland Capacity Assessment Report December 2014
Page ii
LIST OF FIGURES
Figure 1‐1: Rockland WWTP Oct 2013 to Sept 2014 Average Monthly and Peak Daily Flows ................. 4
Figure 1‐2: Rockland WWTP Oct 2013 to Sept 2014 – Final Effulent BOD5 Concentration ...................... 5
Figure 1‐3: Rockland WWTP Oct 2013 to Sept 2014 – Final Effulent BOD5 Loading ................................. 5
Figure 1‐4: Rockland WWTP Oct 2013 to Sept 2014 – Final Effluent TSS Concentration .......................... 6
Figure 1‐5: Rockland WWTP Oct 2013 to Sept 2014 – Final Effluent TSS Loading ..................................... 6
Figure 1‐6: Rockland WWTP Oct 2013 to Sept 2014 – Final Effulent TP Concentration ............................ 7
Figure 1‐7: Rockland WWTP Oct 2013 to Sept 2014 – Final Effulent TP Loading ...................................... 7
Figure 1‐8: Rockland WWTP Oct 2013 to Sept 2014 – Final Effluent NH3 Concentration ......................... 8
Figure 1‐9: Rockland WWTP Oct 2013 to Sept 2014 – Final Effluent NH3 Loadings .................................. 8
LIST OF TABLES
Table 1‐1: Rockland WWTP Certificate of Approval (C of A) Rated Capacity ............................................ 1
Table 1‐2: Rockland WWTP Certificate of Approval Effluent Objectives and Limits (MOE, 1996) ........... 1
Table 1‐3: Rockland WWTP SBR Operation Cycles ‐ Normal and Wet Weather Conditions ..................... 3
Table 1‐4: Rockland WWTP Certificate of Approval Effluent Objectives and Limits (MOE, 1996) ........... 4
Table 1‐5: Rockland WWTP Flows and Loads Compared to Typical Domestic Sewage ............................ 9
Table 1‐6: Key Process Parameter Evaluation Results for the Rockland WWTP ..................................... 10
Table 1‐7: Data and criteria for Rockland WWTP Major Unit Process Evaluation .................................. 11
Ontario Clean Water Agency Engineering Services City of Clarence‐Rockland Rockland Capacity Assessment Report December 2014
Page 1
1.0 BACKGROUNDANDOBJECTIVES
Using the Ministry of Environment guideline, “Guideline Manual for the Optimization of Ontario Water
Treatment Plants Using Composite Correction program (CCP) Approach”, a Comprehensive
Performance Evaluation (CPE) was conducted for the Rockland Wastewater Treatment Plant (WWTP)
in November 2014 with the following objectives:
To review the performance and capacity of the Rockland WWTP and identify any capacity
limitations related to the design or operation of the facility.
To determine the need for a more detailed capacity assessment study at a later date.
The Rockland WWTP is a Sequencing Batch Reactor (SBR) activated sludge facility with no flow
equalization. The plant has an aerobic digester for sludge stabilization and treatment. Alum solution is
added to the process for phosphorous removal, sodium hypochorite is added for disinfection and
calcium thiosulfate is added for dechlorination. The facility services a population of approximately
11,100, has a nominal design flow of 6,800 m3/d, and discharges to the Ottawa River. Table 1‐1 and
Table 1‐2 show the rated capacity and the effluent objectives and limits for the Rockland WWTP.
Table 1‐1: Rockland WWTP Certificate of Approval (C of A) Rated Capacity
Parameter m3/d m3/s
Average daily design flow rate 6,800 0.079
Maximum day flow rate 17,340 0.2
Peak flow rate 20,400 0.24
Table 1‐2: Rockland WWTP Certificate of Approval Effluent Objectives and Limits (MOE, 1996)
Parameter Annual Average
Concentration Limit
(mg/L)
Annual Average
Concentration
Objective (mg/L)
Annual Average
Loading Limit (kg/d)
BOD5 25.0 15.0 170
TSS 25.0 15.0 170
TP 1.0 1.0 6.8
E. Coli, Monthly Geometric
Mean
200 counts/100 mL N/A
Reported data were reviewed for the period of October 1, 2011 to September 30, 2014 (i.e. the most
current 3 years of data at the time the study was completed). The annual average daily influent flow at
the Rockland WWTP for the most recent operating year was 4,050 m3/day, which represents 60% of
Ontario Clean Water Agency Engineering Services City of Clarence‐Rockland Rockland Capacity Assessment Report December 2014
Page 2
the rated design capacity. The average final effluent BOD5 concentration for the most recent operating
year was 23 mg/L, final effluent total suspended solids (TSS) concentration was 22 mg/L, and the final
effluent total phosphorus (TP) concentration was 0.9 mg/L, which was below the Certificate of
Approval (C of A) annual average effluent requirements. The final effluent total ammonia nitrogen
(TAN) concentration was 20 mg/L; there is currently no total ammonia nitrogen (TAN) limit specified in
the C of A. The maximum peak flow was approximately 19,000 m3/d and represents 93% of the peak
maximum flow rate of 20,400 m3/d. The facility was below the C of A average effluent limits for 7 of
the 12 months for the most recent operating year, but the final effluent BOD5 and TSS concentrations
have been increasing since 2013. Since the plant does not have adequate screening and grit removal
the jet aerators become clogged over time leading to low oxygen transfer rates and poor settleability
of the activated sludge. This in turn leads to deteriorated final effluent quality as indicated by the
recent measured plant performance data.
1.1 FACILITY DESCRIPTION
1.1.1 General
The Rockland WWTP is owned by the City of Clarence‐Rockland and operated under contract by the
Ontario Clean Water Agency (OCWA). The OCWA staff is also responsible for the operation and
maintenance of the collection system. The City of Clarence‐Rockland has a sewer use by‐law that was
first implemented in the 1970’s. The bylaw is currently being updated, but has not been finalized.. The
plant services a population of 11,100 (WikiPedia, 2011) and has a rated design capacity flow of 6,800
m3/d. Treated effluent from the Rockland WWTP is discharged into the Ottawa River. The following
sections provide a general description of the Rockland WWTP facility.
1.1.2 Liquid Train
Raw sewage is pumped to the plant via pump station #1 (PS#1). The preliminary treatment system at
the Rockland WWTP currently utilizes trash baskets in the wet well of PS#1, along with two in‐line
sewage grinders and a pressurized vortex grit removal system located at the WWTP. The plant does
not currently have adequate preliminary screening and relies on the combination of processes
described above to perform the equivalent function of screening. Due to a lack of preliminary
screening and an inadequately designed pressurized vortex grit removal system, the current
preliminary treatment system does not function very well and cannot adequately remove inorganic
material (i.e. rags, hairballs, grit sediment etc.) from the influent wastewater stream. This inorganic
material enters and accumulates in the downstream sequencing batch reactor tanks and aerobic
digester, which has a negative impact on the plant performance (i.e. lower oxygen transfer efficiency
due to plugged jet aerators, poor sludge settleability, lower system HRT due to sediment accumulation
etc.). The grit removal system was designed for a flow range that is higher than the plant’s rated
average design flow of 6,800 m3/d. Also, a pressurized vortex grit removal system functions best when
the flow to the plant is continuous, however since the influent flow to the Rockland WWTP is
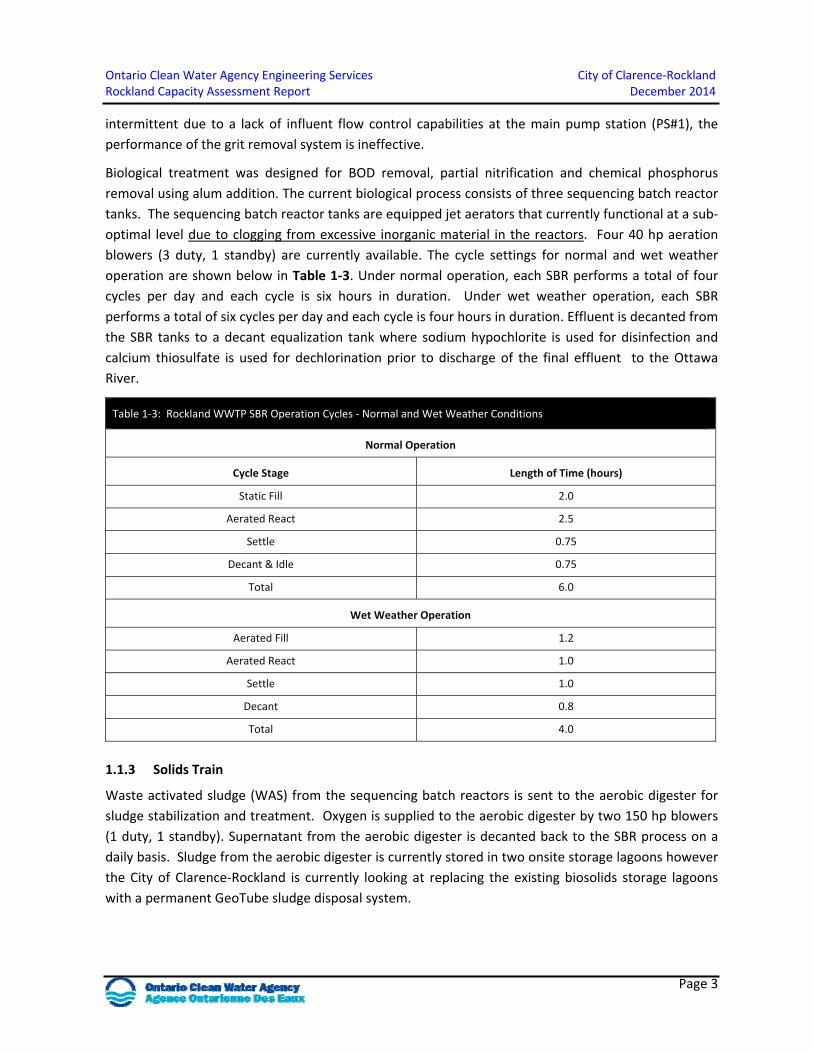
Ontario Clean Water Agency Engineering Services City of Clarence‐Rockland Rockland Capacity Assessment Report December 2014
Page 3
intermittent due to a lack of influent flow control capabilities at the main pump station (PS#1), the
performance of the grit removal system is ineffective.
Biological treatment was designed for BOD removal, partial nitrification and chemical phosphorus
removal using alum addition. The current biological process consists of three sequencing batch reactor
tanks. The sequencing batch reactor tanks are equipped jet aerators that currently functional at a sub‐
optimal level due to clogging from excessive inorganic material in the reactors. Four 40 hp aeration
blowers (3 duty, 1 standby) are currently available. The cycle settings for normal and wet weather
operation are shown below in Table 1‐3. Under normal operation, each SBR performs a total of four
cycles per day and each cycle is six hours in duration. Under wet weather operation, each SBR
performs a total of six cycles per day and each cycle is four hours in duration. Effluent is decanted from
the SBR tanks to a decant equalization tank where sodium hypochlorite is used for disinfection and
calcium thiosulfate is used for dechlorination prior to discharge of the final effluent to the Ottawa
River.
Table 1‐3: Rockland WWTP SBR Operation Cycles ‐ Normal and Wet Weather Conditions
Normal Operation
Cycle Stage Length of Time (hours)
Static Fill 2.0
Aerated React 2.5
Settle 0.75
Decant & Idle 0.75
Total 6.0
Wet Weather Operation
Aerated Fill 1.2
Aerated React 1.0
Settle 1.0
Decant 0.8
Total 4.0
1.1.3 Solids Train
Waste activated sludge (WAS) from the sequencing batch reactors is sent to the aerobic digester for
sludge stabilization and treatment. Oxygen is supplied to the aerobic digester by two 150 hp blowers
(1 duty, 1 standby). Supernatant from the aerobic digester is decanted back to the SBR process on a
daily basis. Sludge from the aerobic digester is currently stored in two onsite storage lagoons however
the City of Clarence‐Rockland is currently looking at replacing the existing biosolids storage lagoons
with a permanent GeoTube sludge disposal system.
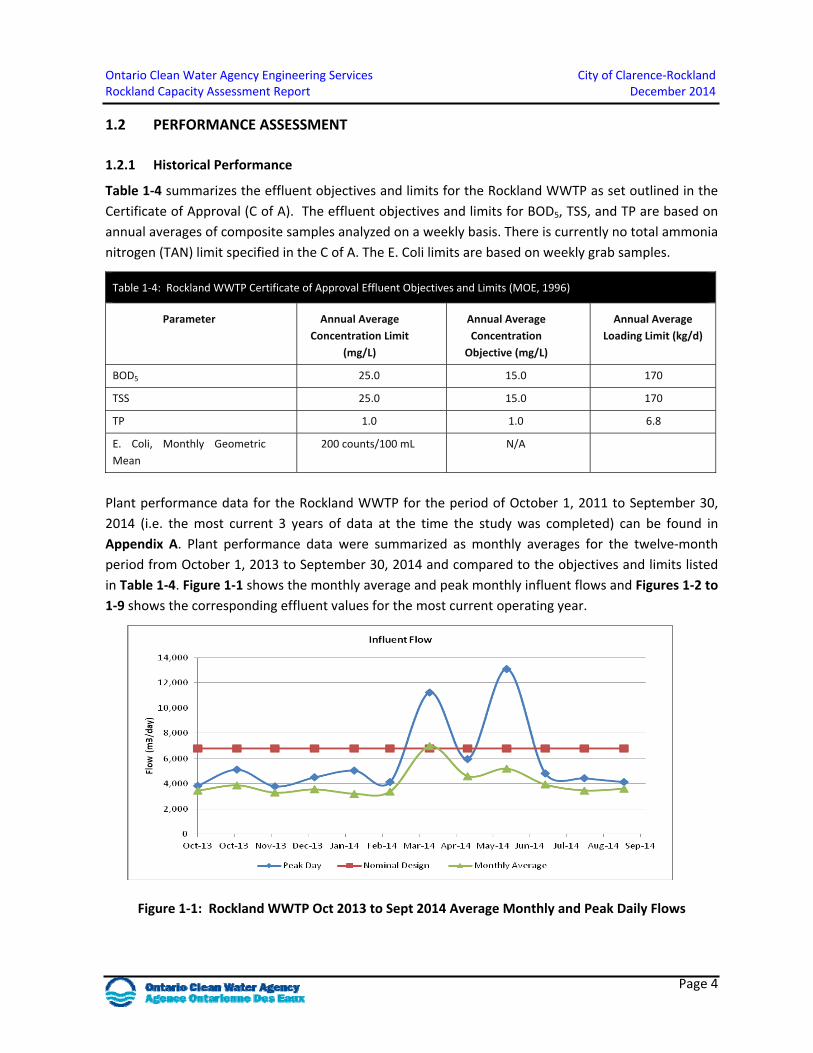
Ontario Clean Water Agency Engineering Services City of Clarence‐Rockland Rockland Capacity Assessment Report December 2014
Page 4
1.2 PERFORMANCE ASSESSMENT
1.2.1 Historical Performance
Table 1‐4 summarizes the effluent objectives and limits for the Rockland WWTP as set outlined in the
Certificate of Approval (C of A). The effluent objectives and limits for BOD5, TSS, and TP are based on
annual averages of composite samples analyzed on a weekly basis. There is currently no total ammonia
nitrogen (TAN) limit specified in the C of A. The E. Coli limits are based on weekly grab samples.
Table 1‐4: Rockland WWTP Certificate of Approval Effluent Objectives and Limits (MOE, 1996)
Parameter Annual Average
Concentration Limit
(mg/L)
Annual Average
Concentration
Objective (mg/L)
Annual Average
Loading Limit (kg/d)
BOD5 25.0 15.0 170
TSS 25.0 15.0 170
TP 1.0 1.0 6.8
E. Coli, Monthly Geometric
Mean
200 counts/100 mL N/A
Plant performance data for the Rockland WWTP for the period of October 1, 2011 to September 30,
2014 (i.e. the most current 3 years of data at the time the study was completed) can be found in
Appendix A. Plant performance data were summarized as monthly averages for the twelve‐month
period from October 1, 2013 to September 30, 2014 and compared to the objectives and limits listed
in Table 1‐4. Figure 1‐1 shows the monthly average and peak monthly influent flows and Figures 1‐2 to
1‐9 shows the corresponding effluent values for the most current operating year.
Figure 1‐1: Rockland WWTP Oct 2013 to Sept 2014 Average Monthly and Peak Daily Flows
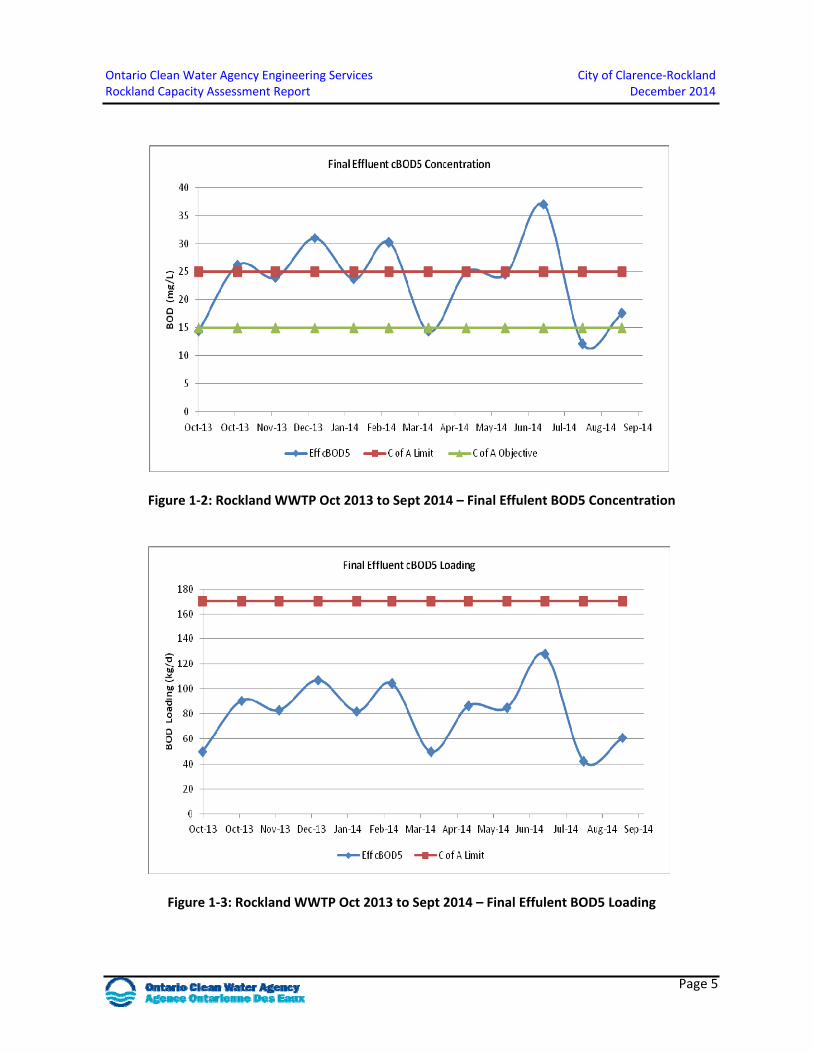
Ontario Clean Water Agency Engineering Services City of Clarence‐Rockland Rockland Capacity Assessment Report December 2014
Page 5
Figure 1‐2: Rockland WWTP Oct 2013 to Sept 2014 – Final Effulent BOD5 Concentration
Figure 1‐3: Rockland WWTP Oct 2013 to Sept 2014 – Final Effulent BOD5 Loading
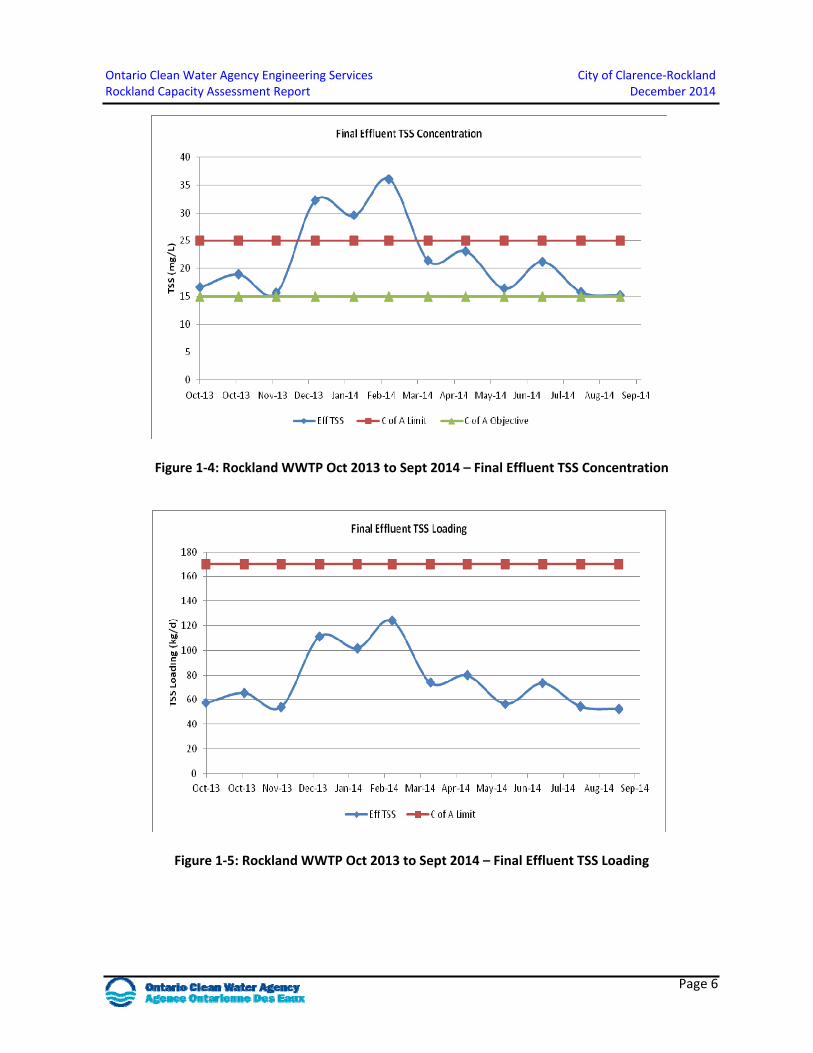
Ontario Clean Water Agency Engineering Services City of Clarence‐Rockland Rockland Capacity Assessment Report December 2014
Page 6
Figure 1‐4: Rockland WWTP Oct 2013 to Sept 2014 – Final Effluent TSS Concentration
Figure 1‐5: Rockland WWTP Oct 2013 to Sept 2014 – Final Effluent TSS Loading
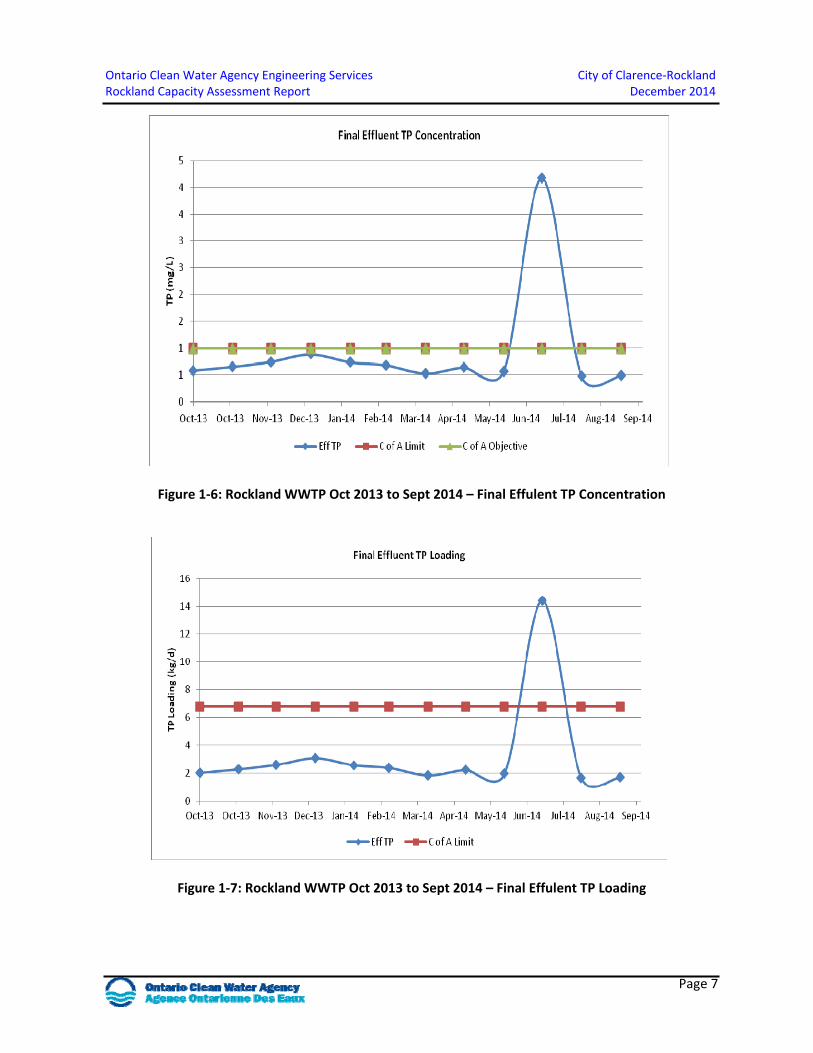
Ontario Clean Water Agency Engineering Services City of Clarence‐Rockland Rockland Capacity Assessment Report December 2014
Page 7
Figure 1‐6: Rockland WWTP Oct 2013 to Sept 2014 – Final Effulent TP Concentration
Figure 1‐7: Rockland WWTP Oct 2013 to Sept 2014 – Final Effulent TP Loading
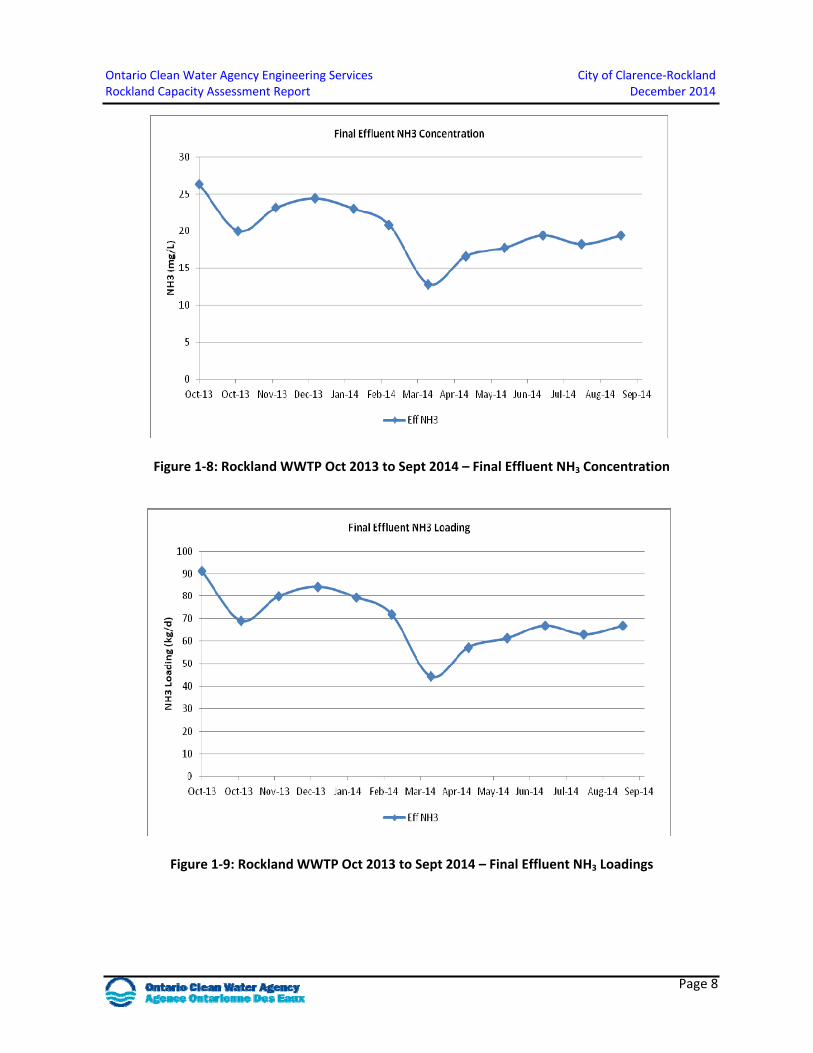
Ontario Clean Water Agency Engineering Services City of Clarence‐Rockland Rockland Capacity Assessment Report December 2014
Page 8
Figure 1‐8: Rockland WWTP Oct 2013 to Sept 2014 – Final Effluent NH3 Concentration
Figure 1‐9: Rockland WWTP Oct 2013 to Sept 2014 – Final Effluent NH3 Loadings
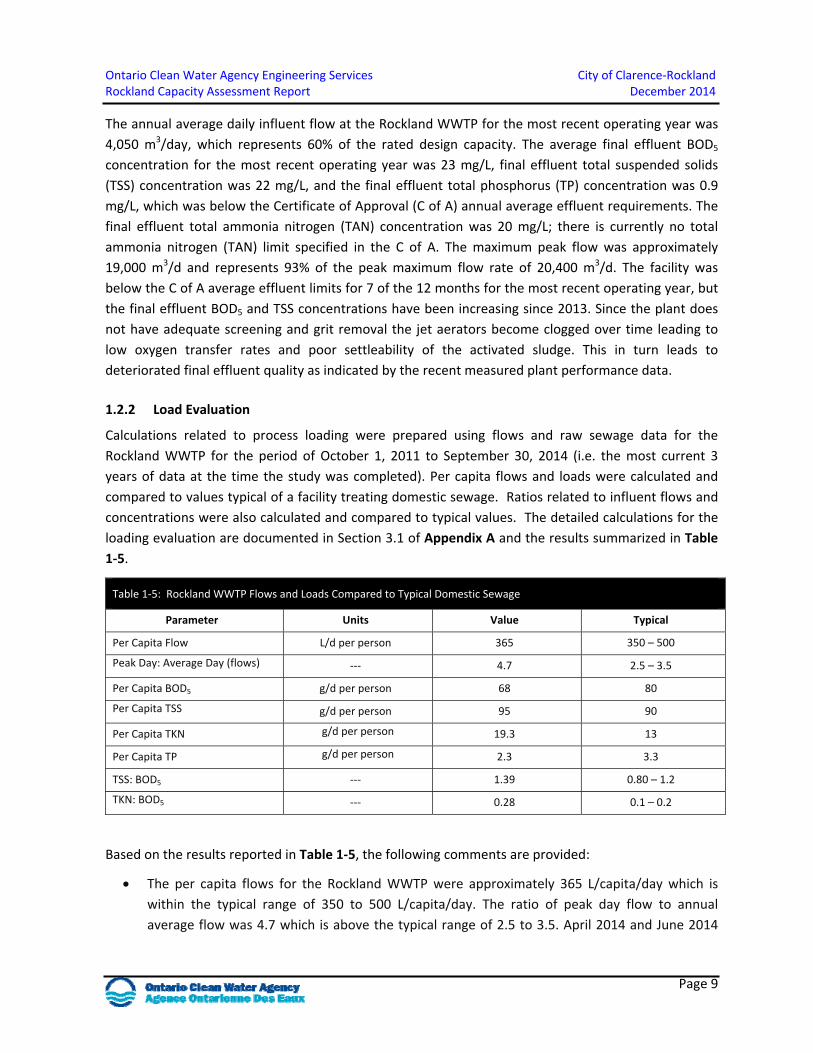
Ontario Clean Water Agency Engineering Services City of Clarence‐Rockland Rockland Capacity Assessment Report December 2014
Page 9
The annual average daily influent flow at the Rockland WWTP for the most recent operating year was
4,050 m3/day, which represents 60% of the rated design capacity. The average final effluent BOD5
concentration for the most recent operating year was 23 mg/L, final effluent total suspended solids
(TSS) concentration was 22 mg/L, and the final effluent total phosphorus (TP) concentration was 0.9
mg/L, which was below the Certificate of Approval (C of A) annual average effluent requirements. The
final effluent total ammonia nitrogen (TAN) concentration was 20 mg/L; there is currently no total
ammonia nitrogen (TAN) limit specified in the C of A. The maximum peak flow was approximately
19,000 m3/d and represents 93% of the peak maximum flow rate of 20,400 m3/d. The facility was
below the C of A average effluent limits for 7 of the 12 months for the most recent operating year, but
the final effluent BOD5 and TSS concentrations have been increasing since 2013. Since the plant does
not have adequate screening and grit removal the jet aerators become clogged over time leading to
low oxygen transfer rates and poor settleability of the activated sludge. This in turn leads to
deteriorated final effluent quality as indicated by the recent measured plant performance data.
1.2.2 Load Evaluation
Calculations related to process loading were prepared using flows and raw sewage data for the
Rockland WWTP for the period of October 1, 2011 to September 30, 2014 (i.e. the most current 3
years of data at the time the study was completed). Per capita flows and loads were calculated and
compared to values typical of a facility treating domestic sewage. Ratios related to influent flows and
concentrations were also calculated and compared to typical values. The detailed calculations for the
loading evaluation are documented in Section 3.1 of Appendix A and the results summarized in Table
1‐5.
Table 1‐5: Rockland WWTP Flows and Loads Compared to Typical Domestic Sewage
Parameter Units Value Typical
Per Capita Flow L/d per person 365 350 – 500
Peak Day: Average Day (flows) ‐‐‐ 4.7 2.5 – 3.5
Per Capita BOD5 g/d per person 68 80
Per Capita TSS g/d per person 95 90
Per Capita TKN g/d per person 19.3 13
Per Capita TP g/d per person 2.3 3.3
TSS: BOD5 ‐‐‐ 1.39 0.80 – 1.2
TKN: BOD5 ‐‐‐ 0.28 0.1 – 0.2
Based on the results reported in Table 1‐5, the following comments are provided:
The per capita flows for the Rockland WWTP were approximately 365 L/capita/day which is
within the typical range of 350 to 500 L/capita/day. The ratio of peak day flow to annual
average flow was 4.7 which is above the typical range of 2.5 to 3.5. April 2014 and June 2014
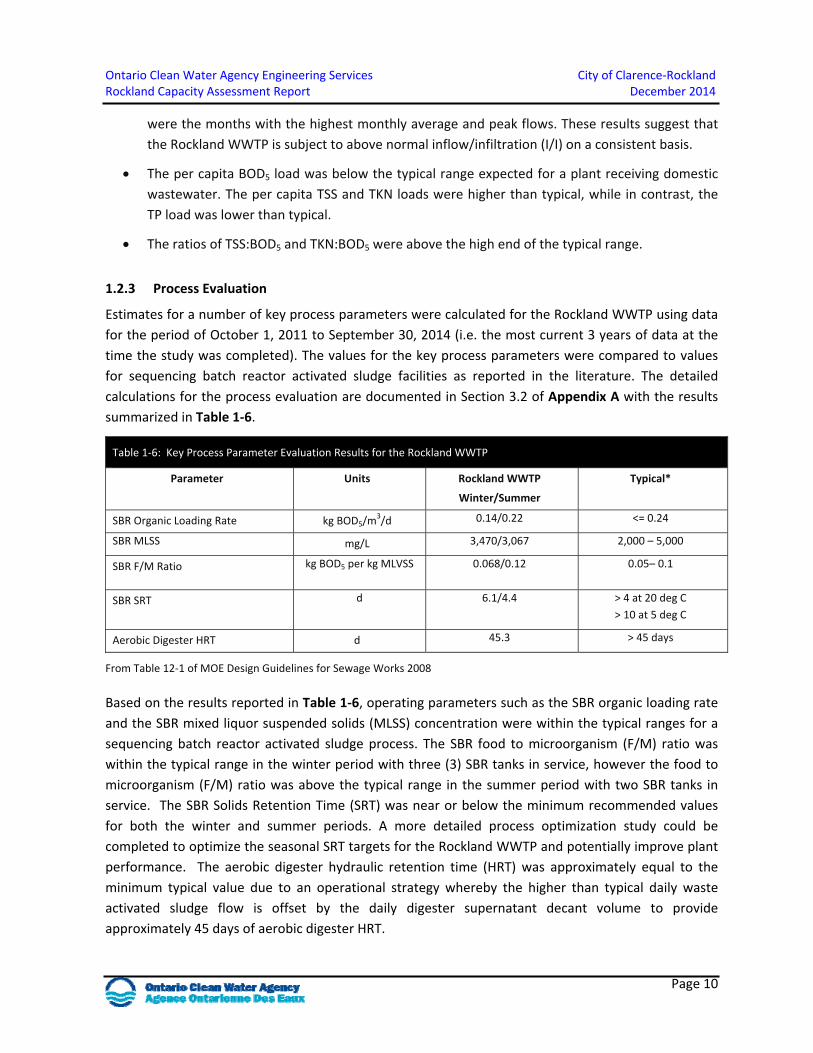
Ontario Clean Water Agency Engineering Services City of Clarence‐Rockland Rockland Capacity Assessment Report December 2014
Page 10
were the months with the highest monthly average and peak flows. These results suggest that
the Rockland WWTP is subject to above normal inflow/infiltration (I/I) on a consistent basis.
The per capita BOD5 load was below the typical range expected for a plant receiving domestic
wastewater. The per capita TSS and TKN loads were higher than typical, while in contrast, the
TP load was lower than typical.
The ratios of TSS:BOD5 and TKN:BOD5 were above the high end of the typical range.
1.2.3 Process Evaluation
Estimates for a number of key process parameters were calculated for the Rockland WWTP using data
for the period of October 1, 2011 to September 30, 2014 (i.e. the most current 3 years of data at the
time the study was completed). The values for the key process parameters were compared to values
for sequencing batch reactor activated sludge facilities as reported in the literature. The detailed
calculations for the process evaluation are documented in Section 3.2 of Appendix A with the results
summarized in Table 1‐6.
Table 1‐6: Key Process Parameter Evaluation Results for the Rockland WWTP
Parameter Units Rockland WWTP
Winter/Summer
Typical*
SBR Organic Loading Rate kg BOD5/m3/d 0.14/0.22 <= 0.24
SBR MLSS mg/L 3,470/3,067 2,000 – 5,000
SBR F/M Ratio kg BOD5 per kg MLVSS 0.068/0.12
0.05– 0.1
SBR SRT
d 6.1/4.4 > 4 at 20 deg C
> 10 at 5 deg C
Aerobic Digester HRT d 45.3 > 45 days
From Table 12‐1 of MOE Design Guidelines for Sewage Works 2008
Based on the results reported in Table 1‐6, operating parameters such as the SBR organic loading rate
and the SBR mixed liquor suspended solids (MLSS) concentration were within the typical ranges for a
sequencing batch reactor activated sludge process. The SBR food to microorganism (F/M) ratio was
within the typical range in the winter period with three (3) SBR tanks in service, however the food to
microorganism (F/M) ratio was above the typical range in the summer period with two SBR tanks in
service. The SBR Solids Retention Time (SRT) was near or below the minimum recommended values
for both the winter and summer periods. A more detailed process optimization study could be
completed to optimize the seasonal SRT targets for the Rockland WWTP and potentially improve plant
performance. The aerobic digester hydraulic retention time (HRT) was approximately equal to the
minimum typical value due to an operational strategy whereby the higher than typical daily waste
activated sludge flow is offset by the daily digester supernatant decant volume to provide
approximately 45 days of aerobic digester HRT.
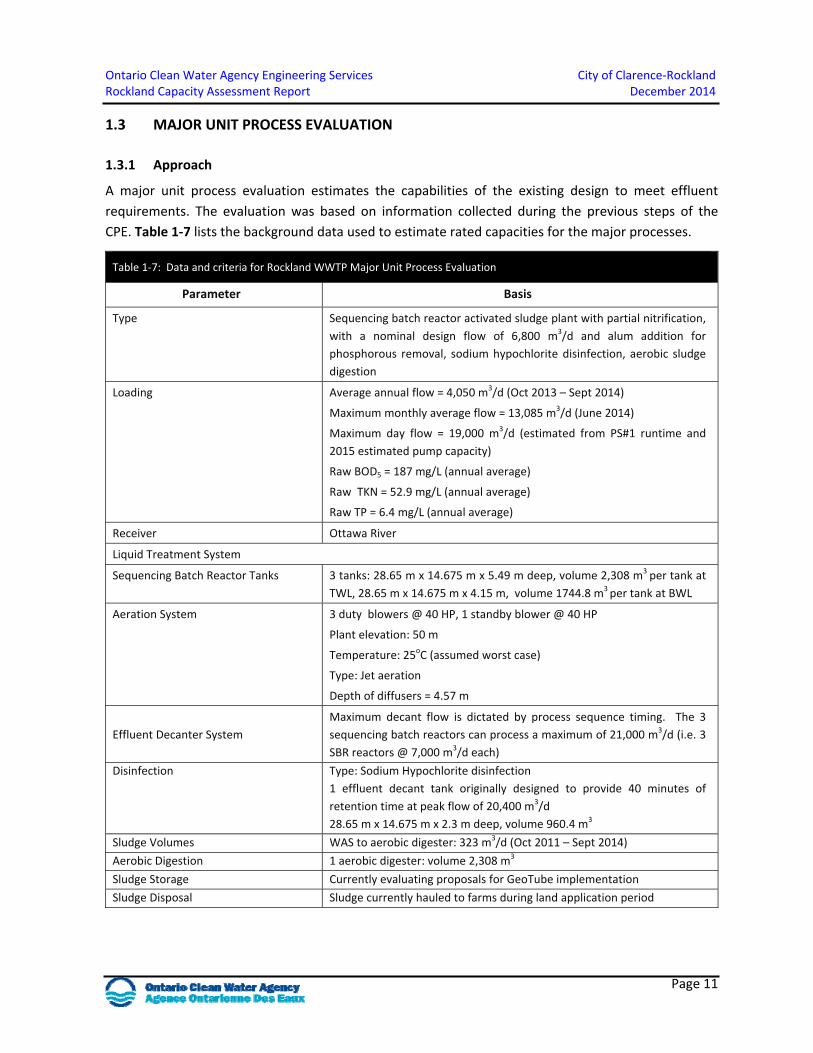
Ontario Clean Water Agency Engineering Services City of Clarence‐Rockland Rockland Capacity Assessment Report December 2014
Page 11
1.3 MAJOR UNIT PROCESS EVALUATION
1.3.1 Approach
A major unit process evaluation estimates the capabilities of the existing design to meet effluent
requirements. The evaluation was based on information collected during the previous steps of the
CPE. Table 1‐7 lists the background data used to estimate rated capacities for the major processes.
Table 1‐7: Data and criteria for Rockland WWTP Major Unit Process Evaluation
Parameter Basis
Type Sequencing batch reactor activated sludge plant with partial nitrification,
with a nominal design flow of 6,800 m3/d and alum addition for
phosphorous removal, sodium hypochlorite disinfection, aerobic sludge
digestion
Loading Average annual flow = 4,050 m3/d (Oct 2013 – Sept 2014)
Maximum monthly average flow = 13,085 m3/d (June 2014)
Maximum day flow = 19,000 m3/d (estimated from PS#1 runtime and
2015 estimated pump capacity)
Raw BOD5 = 187 mg/L (annual average)
Raw TKN = 52.9 mg/L (annual average)
Raw TP = 6.4 mg/L (annual average)
Receiver Ottawa River
Liquid Treatment System
Sequencing Batch Reactor Tanks 3 tanks: 28.65 m x 14.675 m x 5.49 m deep, volume 2,308 m3 per tank at
TWL, 28.65 m x 14.675 m x 4.15 m, volume 1744.8 m3 per tank at BWL
Aeration System 3 duty blowers @ 40 HP, 1 standby blower @ 40 HP
Plant elevation: 50 m
Temperature: 25oC (assumed worst case)
Type: Jet aeration
Depth of diffusers = 4.57 m
Effluent Decanter System
Maximum decant flow is dictated by process sequence timing. The 3
sequencing batch reactors can process a maximum of 21,000 m3/d (i.e. 3
SBR reactors @ 7,000 m3/d each)
Disinfection Type: Sodium Hypochlorite disinfection
1 effluent decant tank originally designed to provide 40 minutes of
retention time at peak flow of 20,400 m3/d
28.65 m x 14.675 m x 2.3 m deep, volume 960.4 m3
Sludge Volumes WAS to aerobic digester: 323 m3/d (Oct 2011 – Sept 2014)
Aerobic Digestion 1 aerobic digester: volume 2,308 m3
Sludge Storage Currently evaluating proposals for GeoTube implementation
Sludge Disposal Sludge currently hauled to farms during land application period
Ontario Clean Water Agency Engineering Services City of Clarence‐Rockland Rockland Capacity Assessment Report December 2014
Page 12
1.3.2 Results
Figure 1‐3 displays the results of the major unit process evaluation in the form of a Performance
Potential Graph (PPG). The major unit processes are shown along the vertical (y‐axis) of the
Performance Potential Graph. The evaluation criteria used to assess capability are identified in
brackets, below the name of the unit process. For each major unit process, the horizontal bar
represents the total estimated capacity of the unit process. The numbers within the rectangular boxes
are the flow treatment capacity limits for each of the individual unit processes. For example, under the
unit process BOD Loading, the individual 2,239 horizontal bars represent each of the 3 sequencing
batch reactor tanks having an individual capability to treat 2,239 m3/d for a total of 6,718 m3/d. The
blue dashed vertical line shows the current average flow of 4,050 m3/d and the solid red vertical line
marks the nominal design flow of 6,800 m3/d.
A process is judged “capable” if the projected capacity exceeds the current flow rate (ie. the associated
horizontal bar for that unit process is to the right of the 4,050 m3/d dashed line). A process is
“marginal” if the capacity is 80 to 100 percent of current flow, (ie. 3,240 m3/d to 4,050 m3/d). A
process is “not capable” if its capacity is less than 80% of current flow (ie. less than 3,240 m3/d). The
shortest bars determine the overall plant rating as “capable”, “marginal”, or “not capable”.
The evaluation criteria for the Performance Potential Graph for the Rockland WWTP were obtained
from “The Ontario Composite Correction Program Manual for Optimization of Sewage Treatment
Plants” (WTC and PAI, 1996) and other references on the design of activated sludge plants (WEF 2005;
WEF 2010); and the MOE “Design Guideline for Sewage Works, 2008”. The following sections provide a
discussion of the capacity of each of the major unit process at the Rockland WWTP. Section 3.3 of
Appendix A provides the detailed calculations for the PPG.
The Rockland WWTP is currently operated as a Sequencing Batch Reactor (SBR) activated sludge
facility with partial nitrification and alum addition for phosphorus removal. The major unit processes
were rated using appropriate evaluation criteria for this type of operation. Where applicable, the
major unit processes were rated separately for the current operation, shown in yellow with the
capacity of additional units on stand‐by in purple (refer to Figure 1‐3).
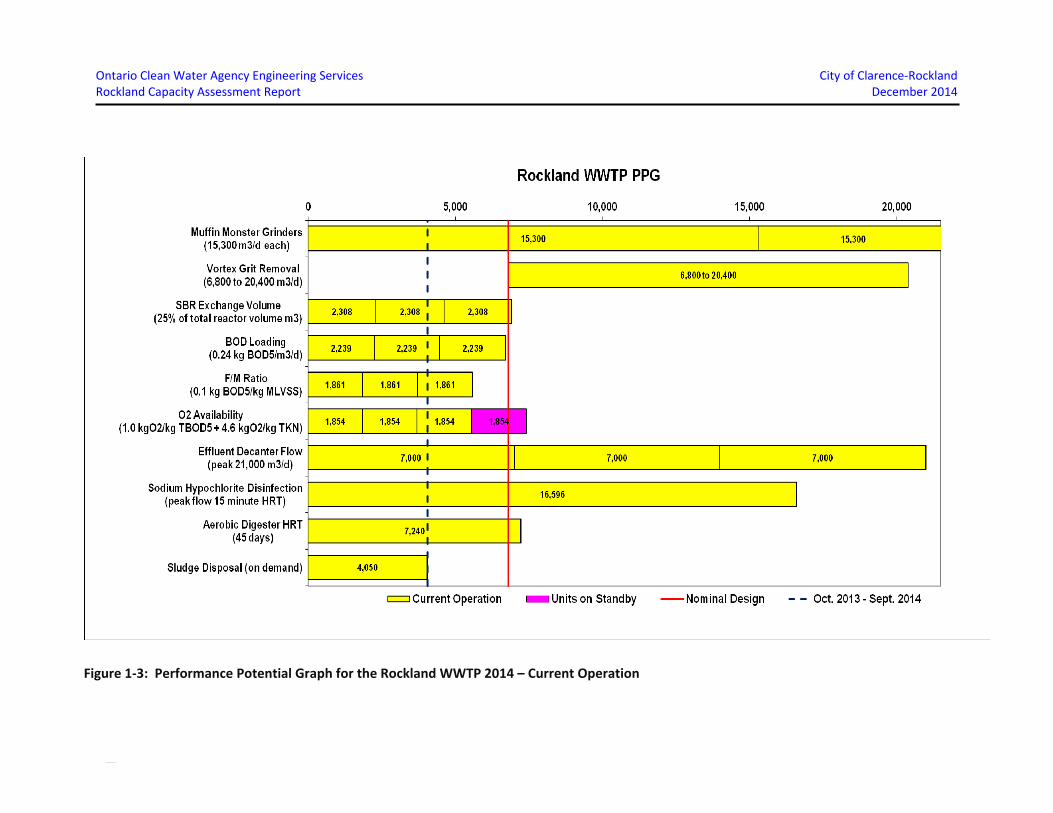
Ontario Clean Water Agency Engineering Services City of Clarence‐Rockland Rockland Capacity Assessment Report December 2014
Page 13
Figure 1‐3: Performance Potential Graph for the Rockland WWTP 2014 – Current Operation
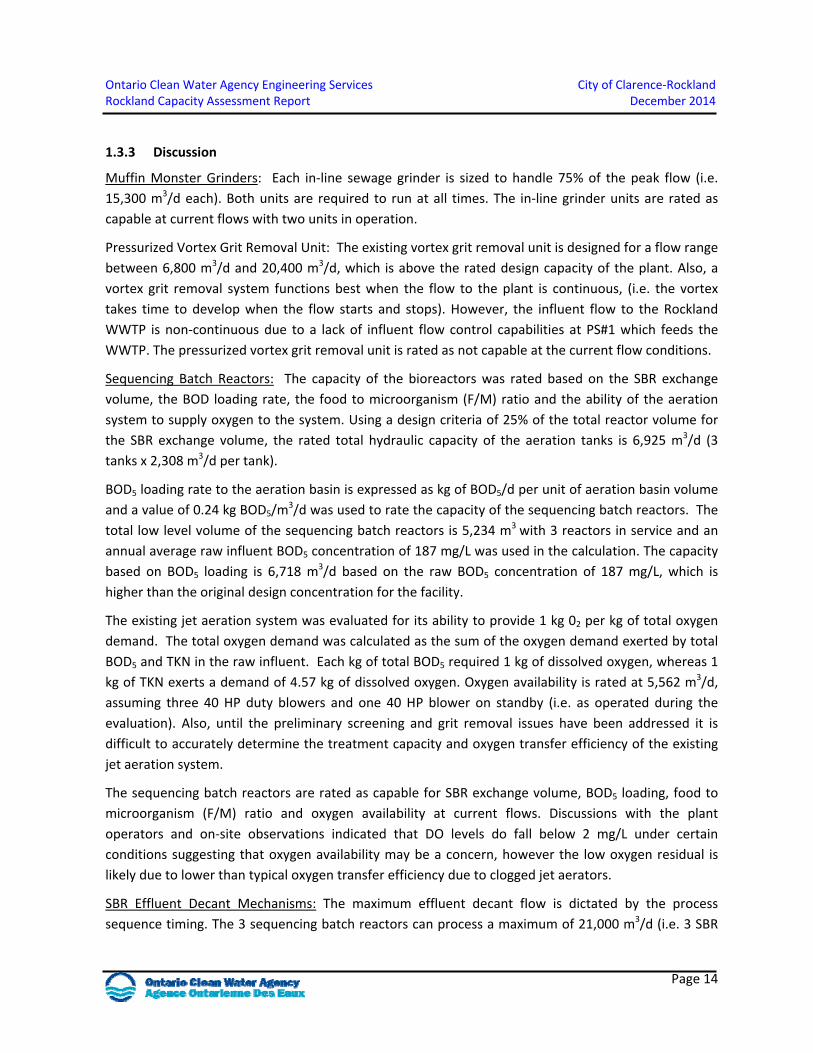
Ontario Clean Water Agency Engineering Services City of Clarence‐Rockland Rockland Capacity Assessment Report December 2014
Page 14
1.3.3 Discussion
Muffin Monster Grinders: Each in‐line sewage grinder is sized to handle 75% of the peak flow (i.e.
15,300 m3/d each). Both units are required to run at all times. The in‐line grinder units are rated as
capable at current flows with two units in operation.
Pressurized Vortex Grit Removal Unit: The existing vortex grit removal unit is designed for a flow range
between 6,800 m3/d and 20,400 m3/d, which is above the rated design capacity of the plant. Also, a
vortex grit removal system functions best when the flow to the plant is continuous, (i.e. the vortex
takes time to develop when the flow starts and stops). However, the influent flow to the Rockland
WWTP is non‐continuous due to a lack of influent flow control capabilities at PS#1 which feeds the
WWTP. The pressurized vortex grit removal unit is rated as not capable at the current flow conditions.
Sequencing Batch Reactors: The capacity of the bioreactors was rated based on the SBR exchange
volume, the BOD loading rate, the food to microorganism (F/M) ratio and the ability of the aeration
system to supply oxygen to the system. Using a design criteria of 25% of the total reactor volume for
the SBR exchange volume, the rated total hydraulic capacity of the aeration tanks is 6,925 m3/d (3
tanks x 2,308 m3/d per tank).
BOD5 loading rate to the aeration basin is expressed as kg of BOD5/d per unit of aeration basin volume
and a value of 0.24 kg BOD5/m3/d was used to rate the capacity of the sequencing batch reactors. The
total low level volume of the sequencing batch reactors is 5,234 m3 with 3 reactors in service and an
annual average raw influent BOD5 concentration of 187 mg/L was used in the calculation. The capacity
based on BOD5 loading is 6,718 m3/d based on the raw BOD5 concentration of 187 mg/L, which is
higher than the original design concentration for the facility.
The existing jet aeration system was evaluated for its ability to provide 1 kg 02 per kg of total oxygen
demand. The total oxygen demand was calculated as the sum of the oxygen demand exerted by total
BOD5 and TKN in the raw influent. Each kg of total BOD5 required 1 kg of dissolved oxygen, whereas 1
kg of TKN exerts a demand of 4.57 kg of dissolved oxygen. Oxygen availability is rated at 5,562 m3/d,
assuming three 40 HP duty blowers and one 40 HP blower on standby (i.e. as operated during the
evaluation). Also, until the preliminary screening and grit removal issues have been addressed it is
difficult to accurately determine the treatment capacity and oxygen transfer efficiency of the existing
jet aeration system.
The sequencing batch reactors are rated as capable for SBR exchange volume, BOD5 loading, food to
microorganism (F/M) ratio and oxygen availability at current flows. Discussions with the plant
operators and on‐site observations indicated that DO levels do fall below 2 mg/L under certain
conditions suggesting that oxygen availability may be a concern, however the low oxygen residual is
likely due to lower than typical oxygen transfer efficiency due to clogged jet aerators.
SBR Effluent Decant Mechanisms: The maximum effluent decant flow is dictated by the process
sequence timing. The 3 sequencing batch reactors can process a maximum of 21,000 m3/d (i.e. 3 SBR
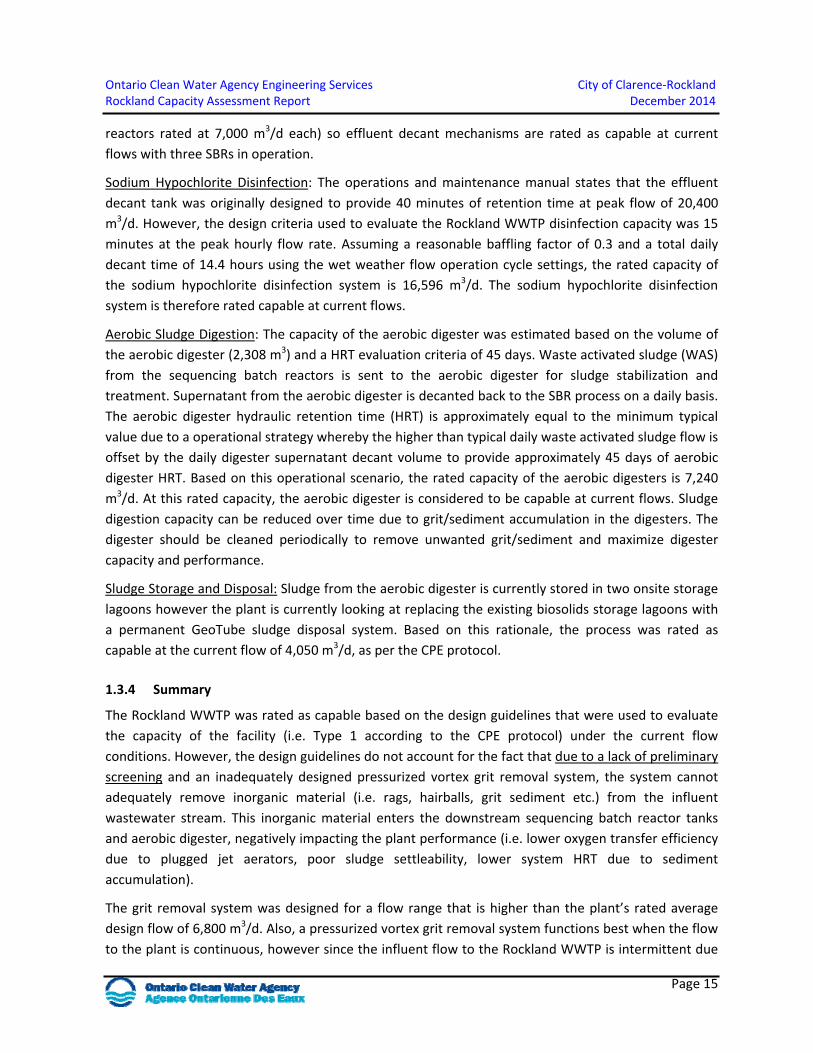
Ontario Clean Water Agency Engineering Services City of Clarence‐Rockland Rockland Capacity Assessment Report December 2014
Page 15
reactors rated at 7,000 m3/d each) so effluent decant mechanisms are rated as capable at current
flows with three SBRs in operation.
Sodium Hypochlorite Disinfection: The operations and maintenance manual states that the effluent
decant tank was originally designed to provide 40 minutes of retention time at peak flow of 20,400
m3/d. However, the design criteria used to evaluate the Rockland WWTP disinfection capacity was 15
minutes at the peak hourly flow rate. Assuming a reasonable baffling factor of 0.3 and a total daily
decant time of 14.4 hours using the wet weather flow operation cycle settings, the rated capacity of
the sodium hypochlorite disinfection system is 16,596 m3/d. The sodium hypochlorite disinfection
system is therefore rated capable at current flows.
Aerobic Sludge Digestion: The capacity of the aerobic digester was estimated based on the volume of
the aerobic digester (2,308 m3) and a HRT evaluation criteria of 45 days. Waste activated sludge (WAS)
from the sequencing batch reactors is sent to the aerobic digester for sludge stabilization and
treatment. Supernatant from the aerobic digester is decanted back to the SBR process on a daily basis.
The aerobic digester hydraulic retention time (HRT) is approximately equal to the minimum typical
value due to a operational strategy whereby the higher than typical daily waste activated sludge flow is
offset by the daily digester supernatant decant volume to provide approximately 45 days of aerobic
digester HRT. Based on this operational scenario, the rated capacity of the aerobic digesters is 7,240
m3/d. At this rated capacity, the aerobic digester is considered to be capable at current flows. Sludge
digestion capacity can be reduced over time due to grit/sediment accumulation in the digesters. The
digester should be cleaned periodically to remove unwanted grit/sediment and maximize digester
capacity and performance.
Sludge Storage and Disposal: Sludge from the aerobic digester is currently stored in two onsite storage
lagoons however the plant is currently looking at replacing the existing biosolids storage lagoons with
a permanent GeoTube sludge disposal system. Based on this rationale, the process was rated as
capable at the current flow of 4,050 m3/d, as per the CPE protocol.
1.3.4 Summary
The Rockland WWTP was rated as capable based on the design guidelines that were used to evaluate
the capacity of the facility (i.e. Type 1 according to the CPE protocol) under the current flow
conditions. However, the design guidelines do not account for the fact that due to a lack of preliminary
screening and an inadequately designed pressurized vortex grit removal system, the system cannot
adequately remove inorganic material (i.e. rags, hairballs, grit sediment etc.) from the influent
wastewater stream. This inorganic material enters the downstream sequencing batch reactor tanks
and aerobic digester, negatively impacting the plant performance (i.e. lower oxygen transfer efficiency
due to plugged jet aerators, poor sludge settleability, lower system HRT due to sediment
accumulation).
The grit removal system was designed for a flow range that is higher than the plant’s rated average
design flow of 6,800 m3/d. Also, a pressurized vortex grit removal system functions best when the flow
to the plant is continuous, however since the influent flow to the Rockland WWTP is intermittent due
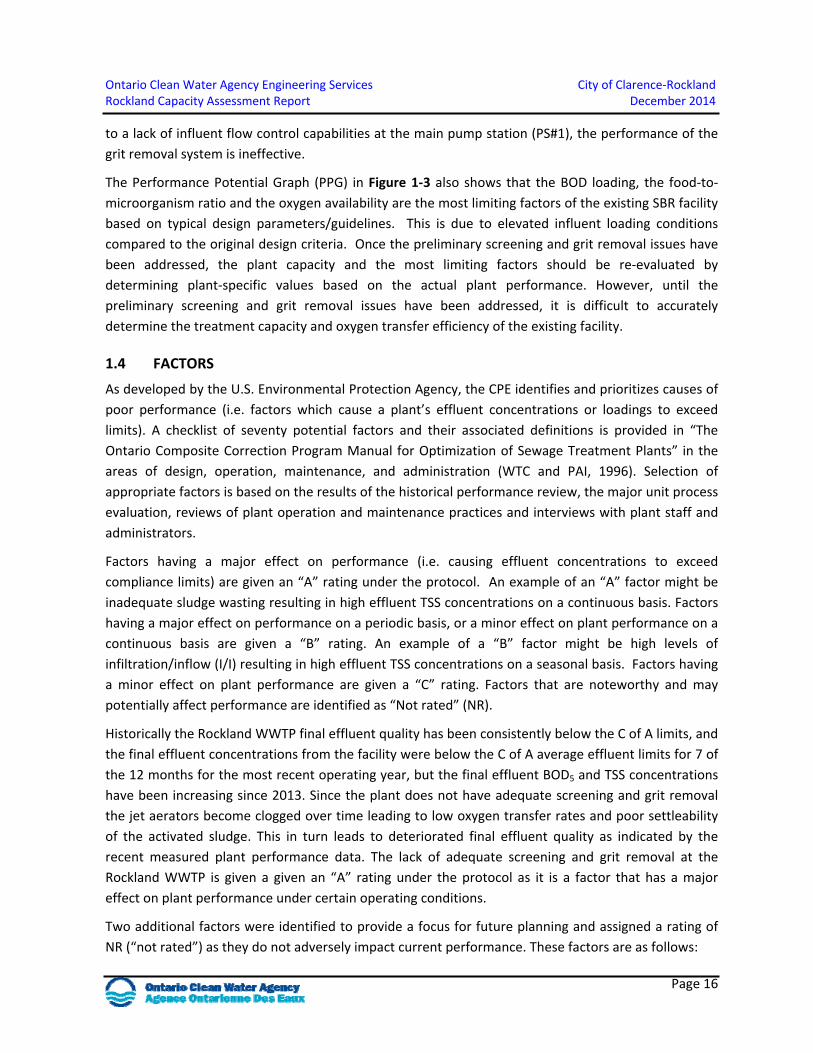
Ontario Clean Water Agency Engineering Services City of Clarence‐Rockland Rockland Capacity Assessment Report December 2014
Page 16
to a lack of influent flow control capabilities at the main pump station (PS#1), the performance of the
grit removal system is ineffective.
The Performance Potential Graph (PPG) in Figure 1‐3 also shows that the BOD loading, the food‐to‐
microorganism ratio and the oxygen availability are the most limiting factors of the existing SBR facility
based on typical design parameters/guidelines. This is due to elevated influent loading conditions
compared to the original design criteria. Once the preliminary screening and grit removal issues have
been addressed, the plant capacity and the most limiting factors should be re‐evaluated by
determining plant‐specific values based on the actual plant performance. However, until the
preliminary screening and grit removal issues have been addressed, it is difficult to accurately
determine the treatment capacity and oxygen transfer efficiency of the existing facility.
1.4 FACTORS
As developed by the U.S. Environmental Protection Agency, the CPE identifies and prioritizes causes of
poor performance (i.e. factors which cause a plant’s effluent concentrations or loadings to exceed
limits). A checklist of seventy potential factors and their associated definitions is provided in “The
Ontario Composite Correction Program Manual for Optimization of Sewage Treatment Plants” in the
areas of design, operation, maintenance, and administration (WTC and PAI, 1996). Selection of
appropriate factors is based on the results of the historical performance review, the major unit process
evaluation, reviews of plant operation and maintenance practices and interviews with plant staff and
administrators.
Factors having a major effect on performance (i.e. causing effluent concentrations to exceed
compliance limits) are given an “A” rating under the protocol. An example of an “A” factor might be
inadequate sludge wasting resulting in high effluent TSS concentrations on a continuous basis. Factors
having a major effect on performance on a periodic basis, or a minor effect on plant performance on a
continuous basis are given a “B” rating. An example of a “B” factor might be high levels of
infiltration/inflow (I/I) resulting in high effluent TSS concentrations on a seasonal basis. Factors having
a minor effect on plant performance are given a “C” rating. Factors that are noteworthy and may
potentially affect performance are identified as “Not rated” (NR).
Historically the Rockland WWTP final effluent quality has been consistently below the C of A limits, and
the final effluent concentrations from the facility were below the C of A average effluent limits for 7 of
the 12 months for the most recent operating year, but the final effluent BOD5 and TSS concentrations
have been increasing since 2013. Since the plant does not have adequate screening and grit removal
the jet aerators become clogged over time leading to low oxygen transfer rates and poor settleability
of the activated sludge. This in turn leads to deteriorated final effluent quality as indicated by the
recent measured plant performance data. The lack of adequate screening and grit removal at the
Rockland WWTP is given a given an “A” rating under the protocol as it is a factor that has a major
effect on plant performance under certain operating conditions.
Two additional factors were identified to provide a focus for future planning and assigned a rating of
NR (“not rated”) as they do not adversely impact current performance. These factors are as follows:
Ontario Clean Water Agency Engineering Services City of Clarence‐Rockland Rockland Capacity Assessment Report December 2014
Page 17
Plant Loading/Inflow and Infiltration (Design) NR: Results from the Rockland WWTP CPE found that
influent flow and concentrations were highly variable due to inflow/infiltration (I/I) as evidenced by
the higher than typical per capita flows and a high ratio of peak day to annual average flow ratio. This
has the potential to impact plant performance as it leads to a more dilute influent and higher flows
through the process during wet weather conditions. Due to the variable nature of the influent loading,
process flexibility and controllability is essential to maintaining satisfactory plant performance under a
wide range of operating conditions.
Process Control Testing and Interpretation (Operation) NR: In the future, as the plant becomes more
heavily loaded, trending and interpretation of key process variables by the operators will become
more important to support informed process control decisions in the proactive manner. During the
CPE, the impact of return streams on plant performance (i.e. supernatant from the aerobic digester)
on plant performance could not be quantified. There may be an opportunity to improve process
control by characterizing these streams and their impact on plant performance. Improved information
on these return streams will also enable the oxygen transfer capacity to be more accurately estimated.
1.5 EVALUATION FOLLOW‐UP
Comprehensive Technical Assistance (CTA) is the follow‐up step to a CPE. Based on the results of this
CPE, the Rockland WWTP is a candidate for a CTA under the CCP Optimization Program once the
preliminary screening and grit removal issues have been addressed. Implementation of technical
assistance at the Rockland WWTP under the CCP program will most likely demonstrate improved
effluent quality and/or re‐rated plant capacity. Additional benefits of a CTA may include optimized
chemical usage and/or energy management procedures.
With respect to upgrading the grit removal system, a modular‐based grit removal system would most
likely be the preferred alternative and has been used successfully in many other wastewater systems
across Canada and North America. The flow at the Rockland WWTP is currently at 60% of the plant’s
rated capacity. As the loading to the plant increases, a number of improvements will help to utilize
available capacity while ensuring that excellent performance is maintained. To address the factors
previously discussed, the following suggestions are provided for consideration:
Plant Loading/Inflow and Infiltration (Design factor)
Continue ongoing efforts to reduce inflow and infiltration (I/I) into the collection system to
reduce the flows to the wastewater treatment plant.
Process Control Testing and Interpretation (Operation)
Continue efforts by the City of Clarence‐Rockland and OCWA to jointly trend and interpret key
process/performance data and utilize these trend graphs to improve operational decision
making.
OCWA’s new Process Data Management (PDM) system will enhance the utilization of collected
data. Enhanced graphics and trending capabilities will provide operations with a new tool to
Ontario Clean Water Agency Engineering Services City of Clarence‐Rockland Rockland Capacity Assessment Report December 2014
Page 18
assist in data interpretation and allow operators to respond to environmental changes and/or
process upsets more efficiently.
2.0 ReferenceMaterial
Metcalf & Eddy, Wastewater Engineering: Treatment, Disposal, and Reuse, 4th edition, McGraw‐Hill
Inc., New York, 2013.
MOEE, 1994, “Assessment of the Comprehensive Performance Evaluation Technique for Ontario
Sewage Treatment Plants”, Ontario Ministry of Environment and Energy, Jan. 1994
MOEE and WTC, 1995, “Assessment of the Comprehensive Technical Assistance Technique for
Ontario Sewage Treatment Plants”, Ontario Ministry of Environment and Energy and Wastewater
Technology centre, Jul. 1995.
MOE, 2008, “Guidelines for the Design of Sewage Works”, Ontario Ministry of the Environment,
2008.
MOE, “Amended Environmental Compliance Approval Number 4926‐8C5QZL”, Jan. 14, 2011.
U.S. EPA, Handbook: Retrofitting POTWs, U.S. Environmental Protection Agency. Office of Research
and Development, EPA/625/6‐89/020, July 1989.
U.S. EPA, Design Manual: Phosphorus Removal, U.S. Environmental Protection Agency, Office of
Research and Development, EPA/625/1‐87/001, September, 1987.
Wheeler, G.P., “Optimizing Your Wastewater Treatment Facility: Can You Afford to Ignore It?”,
Engineers Journal, Vo. 63, Issue 7, Sept. 2009
WEAO, Ministry of the Environment and Environment Canada, “Optimization Guidance Manual for
Sewage Works”, 2010
Water Environment Federation (WEF), Design of Municipal Wastewater Treatment Plants, WEF
Manual of Practice No. 8, 5th edition, WEF Press, 2010.
WTC and PAI, “The Ontario Composite Correction Program Manual for Optimization of Sewage
Treatment Plants”, prepared for Ontario Ministry of Environment and Energy, Environment Canada
and the Municipal Engineers Association, last revised October 1996.
XCG 1992, “Assessment of Factors Affecting the Performance of Ontario Sewage Treatment
Facilities”, report prepared for Ontario Ministry of Environment, Environment Canada, and the
Municipal Engineers Association, Nov. 1992.
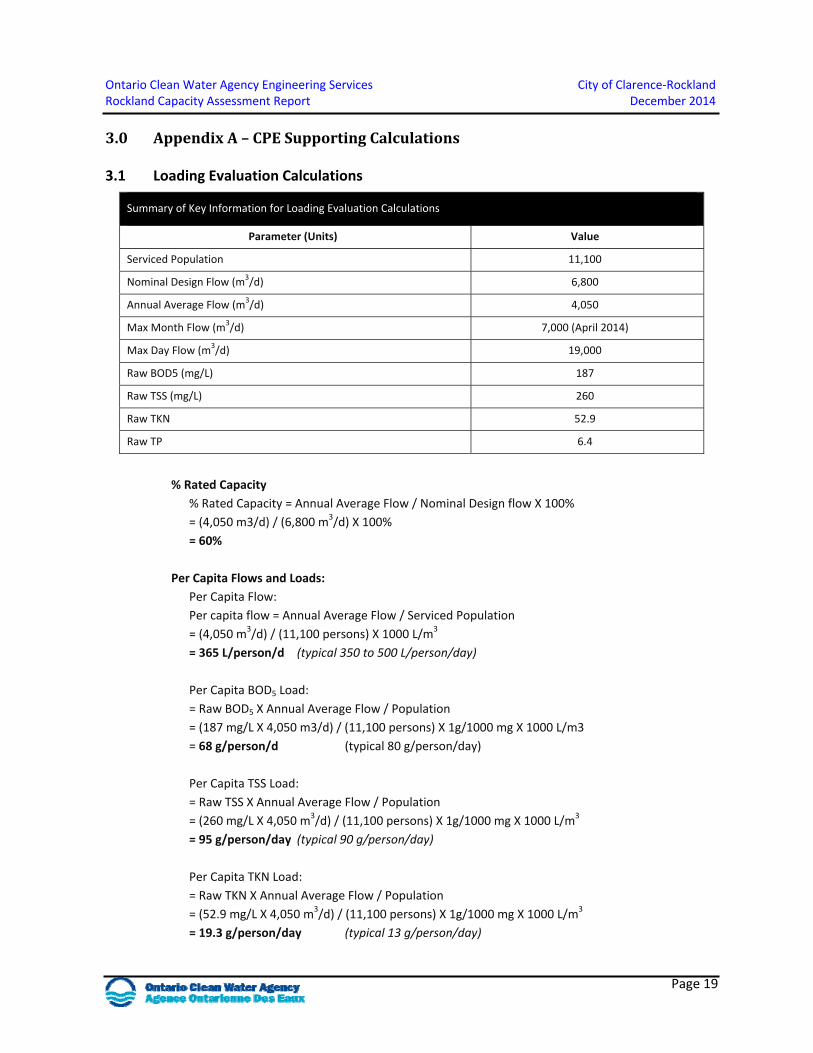
Ontario Clean Water Agency Engineering Services City of Clarence‐Rockland Rockland Capacity Assessment Report December 2014
Page 19
3.0 AppendixA–CPESupportingCalculations
3.1 Loading Evaluation Calculations
Summary of Key Information for Loading Evaluation Calculations
Parameter (Units) Value
Serviced Population 11,100
Nominal Design Flow (m3/d) 6,800
Annual Average Flow (m3/d) 4,050
Max Month Flow (m3/d) 7,000 (April 2014)
Max Day Flow (m3/d) 19,000
Raw BOD5 (mg/L) 187
Raw TSS (mg/L) 260
Raw TKN 52.9
Raw TP 6.4
% Rated Capacity
% Rated Capacity = Annual Average Flow / Nominal Design flow X 100%
= (4,050 m3/d) / (6,800 m3/d) X 100%
= 60%
Per Capita Flows and Loads:
Per Capita Flow:
Per capita flow = Annual Average Flow / Serviced Population
= (4,050 m3/d) / (11,100 persons) X 1000 L/m3
= 365 L/person/d (typical 350 to 500 L/person/day)
Per Capita BOD5 Load:
= Raw BOD5 X Annual Average Flow / Population
= (187 mg/L X 4,050 m3/d) / (11,100 persons) X 1g/1000 mg X 1000 L/m3
= 68 g/person/d (typical 80 g/person/day)
Per Capita TSS Load:
= Raw TSS X Annual Average Flow / Population
= (260 mg/L X 4,050 m3/d) / (11,100 persons) X 1g/1000 mg X 1000 L/m3
= 95 g/person/day (typical 90 g/person/day)
Per Capita TKN Load:
= Raw TKN X Annual Average Flow / Population
= (52.9 mg/L X 4,050 m3/d) / (11,100 persons) X 1g/1000 mg X 1000 L/m3
= 19.3 g/person/day (typical 13 g/person/day)
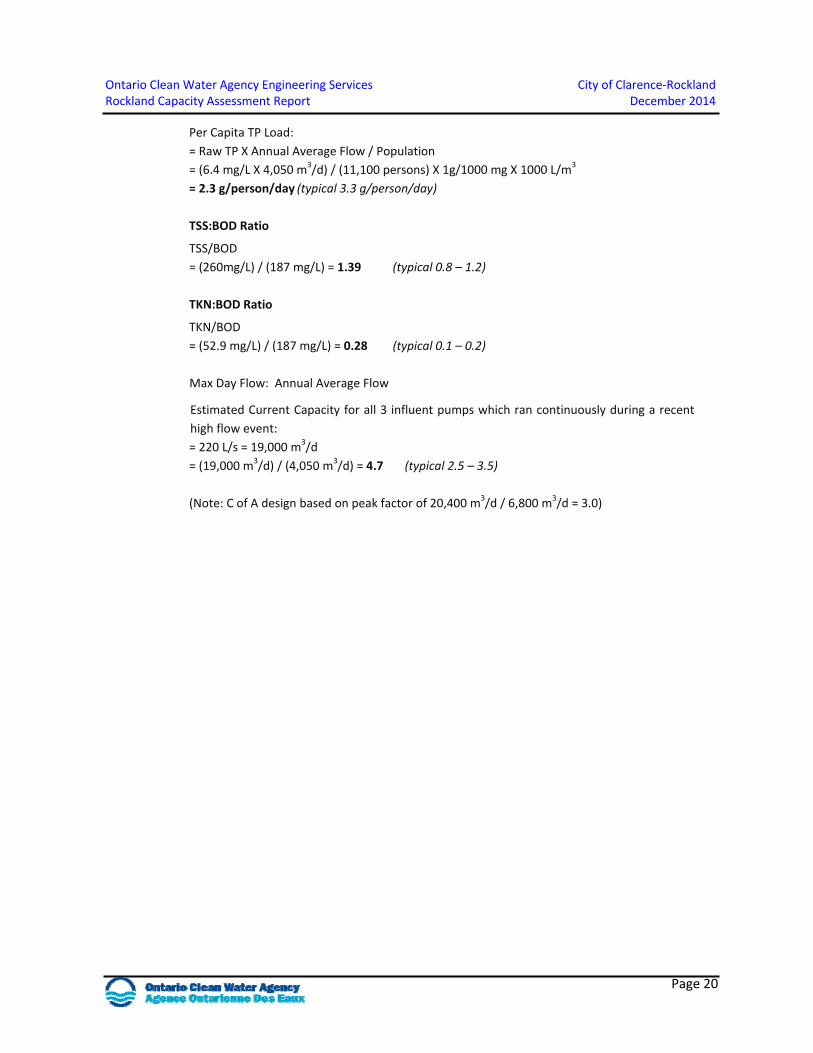
Ontario Clean Water Agency Engineering Services City of Clarence‐Rockland Rockland Capacity Assessment Report December 2014
Page 20
Per Capita TP Load:
= Raw TP X Annual Average Flow / Population
= (6.4 mg/L X 4,050 m3/d) / (11,100 persons) X 1g/1000 mg X 1000 L/m3
= 2.3 g/person/day (typical 3.3 g/person/day)
TSS:BOD Ratio
TSS/BOD
= (260mg/L) / (187 mg/L) = 1.39 (typical 0.8 – 1.2)
TKN:BOD Ratio
TKN/BOD
= (52.9 mg/L) / (187 mg/L) = 0.28 (typical 0.1 – 0.2)
Max Day Flow: Annual Average Flow
Estimated Current Capacity for all 3 influent pumps which ran continuously during a recent
high flow event:
= 220 L/s = 19,000 m3/d
= (19,000 m3/d) / (4,050 m3/d) = 4.7 (typical 2.5 – 3.5)
(Note: C of A design based on peak factor of 20,400 m3/d / 6,800 m3/d = 3.0)
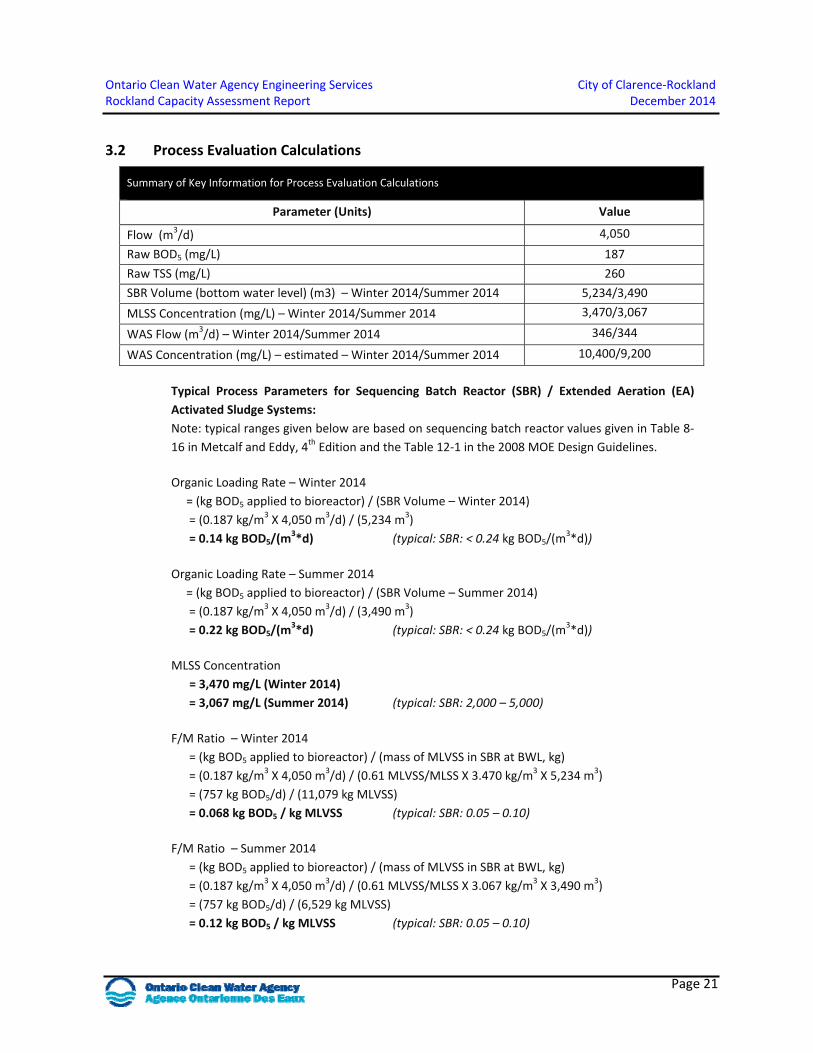
Ontario Clean Water Agency Engineering Services City of Clarence‐Rockland Rockland Capacity Assessment Report December 2014
Page 21
3.2 Process Evaluation Calculations
Summary of Key Information for Process Evaluation Calculations
Parameter (Units) Value
Flow (m3/d) 4,050
Raw BOD5 (mg/L) 187
Raw TSS (mg/L) 260
SBR Volume (bottom water level) (m3) – Winter 2014/Summer 2014 5,234/3,490
MLSS Concentration (mg/L) – Winter 2014/Summer 2014 3,470/3,067
WAS Flow (m3/d) – Winter 2014/Summer 2014 346/344
WAS Concentration (mg/L) – estimated – Winter 2014/Summer 2014 10,400/9,200
Typical Process Parameters for Sequencing Batch Reactor (SBR) / Extended Aeration (EA)
Activated Sludge Systems:
Note: typical ranges given below are based on sequencing batch reactor values given in Table 8‐
16 in Metcalf and Eddy, 4th Edition and the Table 12‐1 in the 2008 MOE Design Guidelines.
Organic Loading Rate – Winter 2014
= (kg BOD5 applied to bioreactor) / (SBR Volume – Winter 2014)
= (0.187 kg/m3 X 4,050 m3/d) / (5,234 m3)
= 0.14 kg BOD5/(m3*d) (typical: SBR: < 0.24 kg BOD5/(m
3*d))
Organic Loading Rate – Summer 2014
= (kg BOD5 applied to bioreactor) / (SBR Volume – Summer 2014)
= (0.187 kg/m3 X 4,050 m3/d) / (3,490 m3)
= 0.22 kg BOD5/(m3*d) (typical: SBR: < 0.24 kg BOD5/(m
3*d))
MLSS Concentration
= 3,470 mg/L (Winter 2014)
= 3,067 mg/L (Summer 2014) (typical: SBR: 2,000 – 5,000)
F/M Ratio – Winter 2014
= (kg BOD5 applied to bioreactor) / (mass of MLVSS in SBR at BWL, kg)
= (0.187 kg/m3 X 4,050 m3/d) / (0.61 MLVSS/MLSS X 3.470 kg/m3 X 5,234 m3)
= (757 kg BOD5/d) / (11,079 kg MLVSS)
= 0.068 kg BOD5 / kg MLVSS (typical: SBR: 0.05 – 0.10)
F/M Ratio – Summer 2014
= (kg BOD5 applied to bioreactor) / (mass of MLVSS in SBR at BWL, kg)
= (0.187 kg/m3 X 4,050 m3/d) / (0.61 MLVSS/MLSS X 3.067 kg/m3 X 3,490 m3)
= (757 kg BOD5/d) / (6,529 kg MLVSS)
= 0.12 kg BOD5 / kg MLVSS (typical: SBR: 0.05 – 0.10)
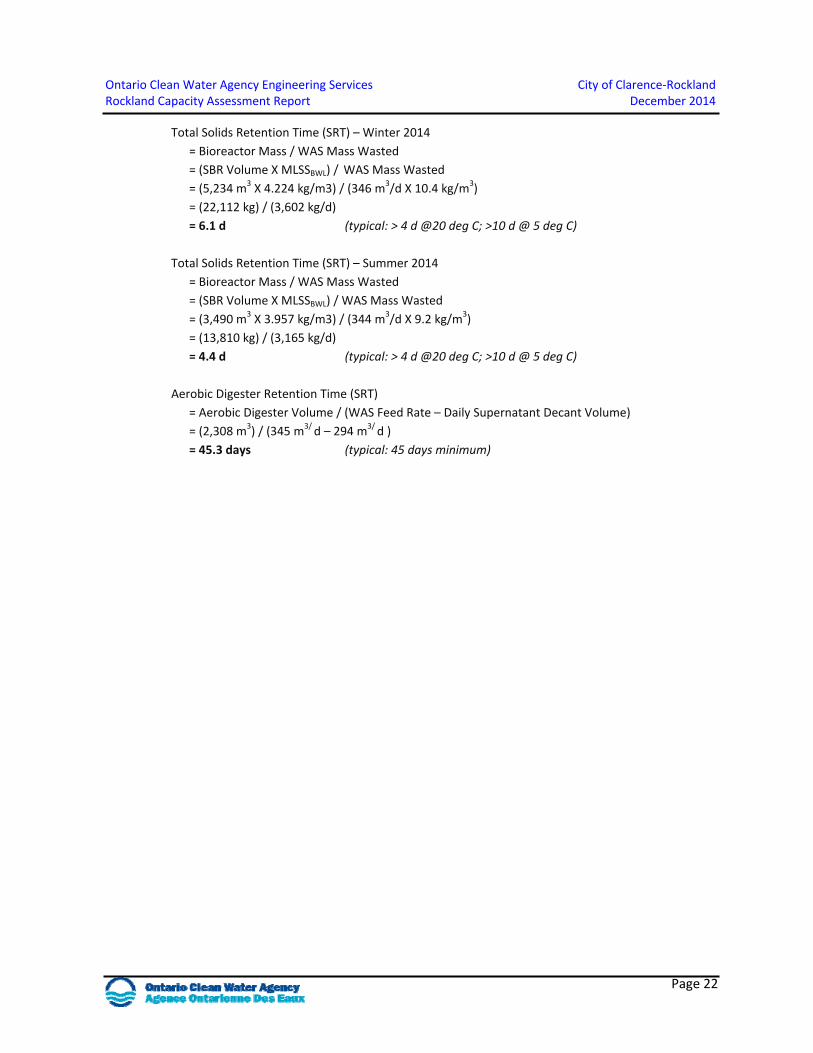
Ontario Clean Water Agency Engineering Services City of Clarence‐Rockland Rockland Capacity Assessment Report December 2014
Page 22
Total Solids Retention Time (SRT) – Winter 2014
= Bioreactor Mass / WAS Mass Wasted
= (SBR Volume X MLSSBWL) / WAS Mass Wasted
= (5,234 m3 X 4.224 kg/m3) / (346 m3/d X 10.4 kg/m3)
= (22,112 kg) / (3,602 kg/d)
= 6.1 d (typical: > 4 d @20 deg C; >10 d @ 5 deg C)
Total Solids Retention Time (SRT) – Summer 2014
= Bioreactor Mass / WAS Mass Wasted
= (SBR Volume X MLSSBWL) / WAS Mass Wasted
= (3,490 m3 X 3.957 kg/m3) / (344 m3/d X 9.2 kg/m3)
= (13,810 kg) / (3,165 kg/d)
= 4.4 d (typical: > 4 d @20 deg C; >10 d @ 5 deg C)
Aerobic Digester Retention Time (SRT)
= Aerobic Digester Volume / (WAS Feed Rate – Daily Supernatant Decant Volume)
= (2,308 m3) / (345 m3/ d – 294 m3/ d )
= 45.3 days (typical: 45 days minimum)
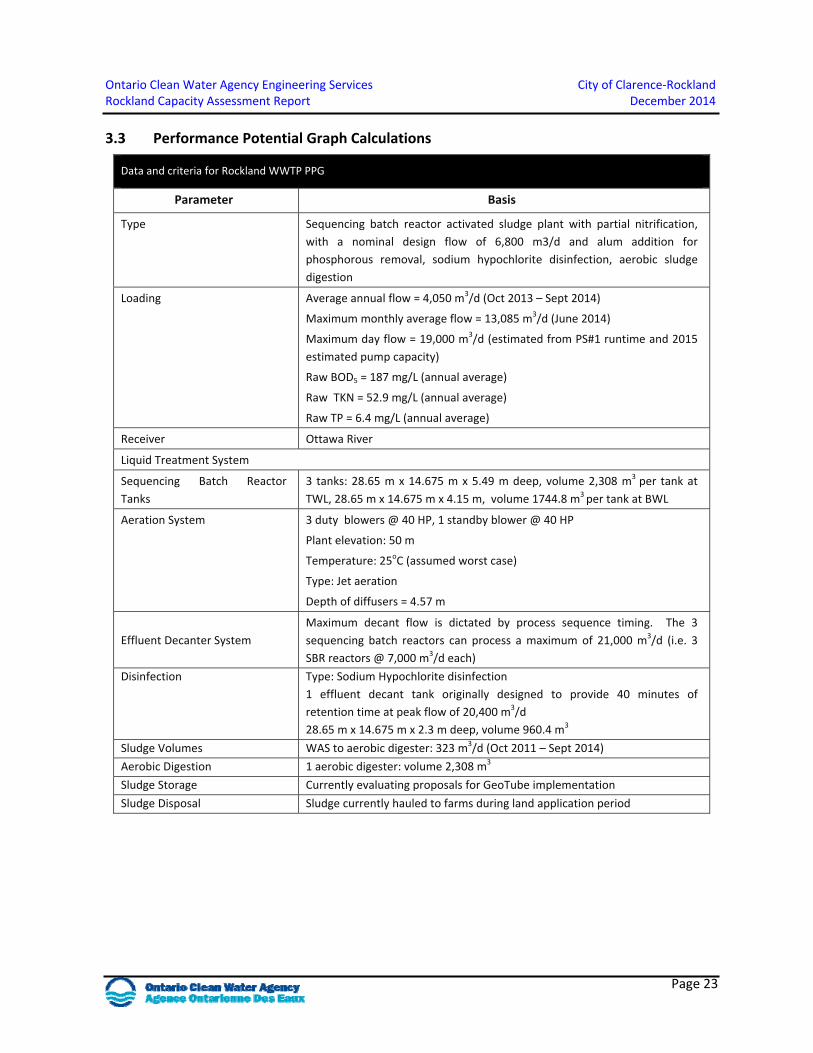
Ontario Clean Water Agency Engineering Services City of Clarence‐Rockland Rockland Capacity Assessment Report December 2014
Page 23
3.3 Performance Potential Graph Calculations
Data and criteria for Rockland WWTP PPG
Parameter Basis
Type Sequencing batch reactor activated sludge plant with partial nitrification,
with a nominal design flow of 6,800 m3/d and alum addition for
phosphorous removal, sodium hypochlorite disinfection, aerobic sludge
digestion
Loading Average annual flow = 4,050 m3/d (Oct 2013 – Sept 2014)
Maximum monthly average flow = 13,085 m3/d (June 2014)
Maximum day flow = 19,000 m3/d (estimated from PS#1 runtime and 2015
estimated pump capacity)
Raw BOD5 = 187 mg/L (annual average)
Raw TKN = 52.9 mg/L (annual average)
Raw TP = 6.4 mg/L (annual average)
Receiver Ottawa River
Liquid Treatment System
Sequencing Batch Reactor
Tanks
3 tanks: 28.65 m x 14.675 m x 5.49 m deep, volume 2,308 m3 per tank at
TWL, 28.65 m x 14.675 m x 4.15 m, volume 1744.8 m3 per tank at BWL
Aeration System 3 duty blowers @ 40 HP, 1 standby blower @ 40 HP
Plant elevation: 50 m
Temperature: 25oC (assumed worst case)
Type: Jet aeration
Depth of diffusers = 4.57 m
Effluent Decanter System
Maximum decant flow is dictated by process sequence timing. The 3
sequencing batch reactors can process a maximum of 21,000 m3/d (i.e. 3
SBR reactors @ 7,000 m3/d each)
Disinfection Type: Sodium Hypochlorite disinfection
1 effluent decant tank originally designed to provide 40 minutes of
retention time at peak flow of 20,400 m3/d
28.65 m x 14.675 m x 2.3 m deep, volume 960.4 m3
Sludge Volumes WAS to aerobic digester: 323 m3/d (Oct 2011 – Sept 2014)
Aerobic Digestion 1 aerobic digester: volume 2,308 m3
Sludge Storage Currently evaluating proposals for GeoTube implementation
Sludge Disposal Sludge currently hauled to farms during land application period
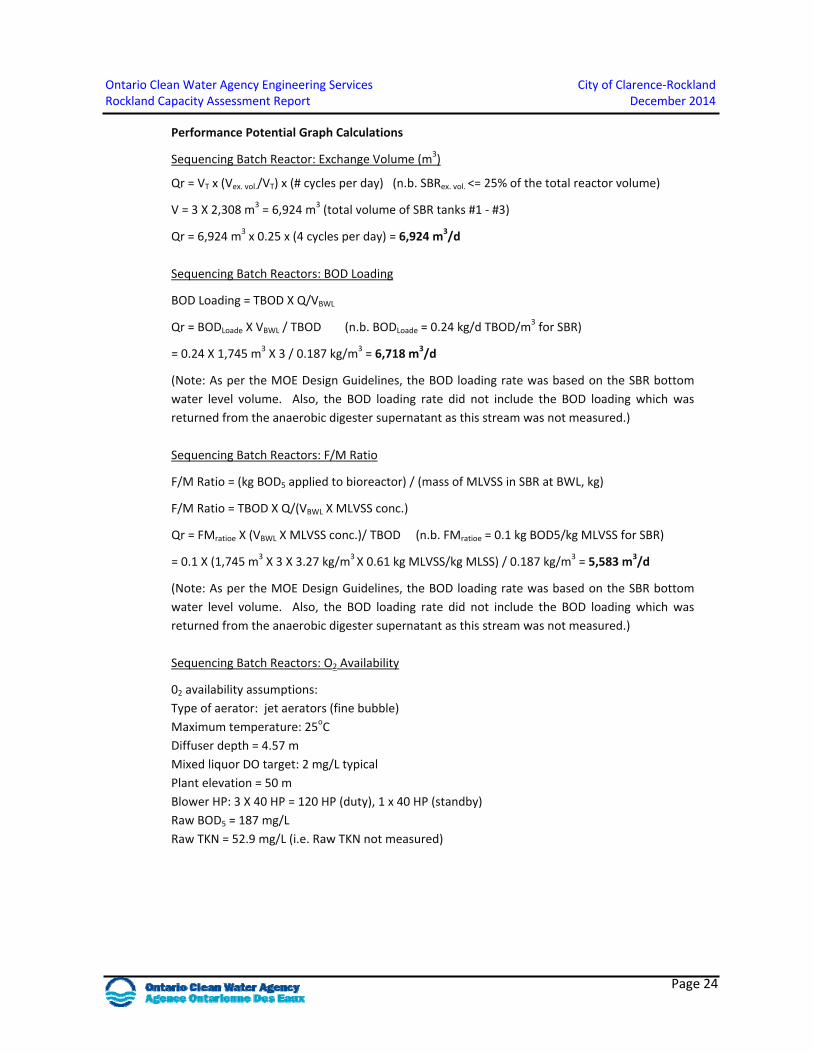
Ontario Clean Water Agency Engineering Services City of Clarence‐Rockland Rockland Capacity Assessment Report December 2014
Page 24
Performance Potential Graph Calculations
Sequencing Batch Reactor: Exchange Volume (m3)
Qr = VT x (Vex. vol./VT) x (# cycles per day) (n.b. SBRex. vol. <= 25% of the total reactor volume)
V = 3 X 2,308 m3 = 6,924 m3 (total volume of SBR tanks #1 ‐ #3)
Qr = 6,924 m3 x 0.25 x (4 cycles per day) = 6,924 m3/d
Sequencing Batch Reactors: BOD Loading
BOD Loading = TBOD X Q/VBWL
Qr = BODLoade X VBWL / TBOD (n.b. BODLoade = 0.24 kg/d TBOD/m3 for SBR)
= 0.24 X 1,745 m3 X 3 / 0.187 kg/m3 = 6,718 m3/d
(Note: As per the MOE Design Guidelines, the BOD loading rate was based on the SBR bottom
water level volume. Also, the BOD loading rate did not include the BOD loading which was
returned from the anaerobic digester supernatant as this stream was not measured.)
Sequencing Batch Reactors: F/M Ratio
F/M Ratio = (kg BOD5 applied to bioreactor) / (mass of MLVSS in SBR at BWL, kg)
F/M Ratio = TBOD X Q/(VBWL X MLVSS conc.)
Qr = FMratioe X (VBWL X MLVSS conc.)/ TBOD (n.b. FMratioe = 0.1 kg BOD5/kg MLVSS for SBR)
= 0.1 X (1,745 m3 X 3 X 3.27 kg/m3 X 0.61 kg MLVSS/kg MLSS) / 0.187 kg/m3 = 5,583 m3/d
(Note: As per the MOE Design Guidelines, the BOD loading rate was based on the SBR bottom
water level volume. Also, the BOD loading rate did not include the BOD loading which was
returned from the anaerobic digester supernatant as this stream was not measured.)
Sequencing Batch Reactors: O2 Availability
02 availability assumptions:
Type of aerator: jet aerators (fine bubble)
Maximum temperature: 25oC
Diffuser depth = 4.57 m
Mixed liquor DO target: 2 mg/L typical
Plant elevation = 50 m
Blower HP: 3 X 40 HP = 120 HP (duty), 1 x 40 HP (standby)
Raw BOD5 = 187 mg/L
Raw TKN = 52.9 mg/L (i.e. Raw TKN not measured)
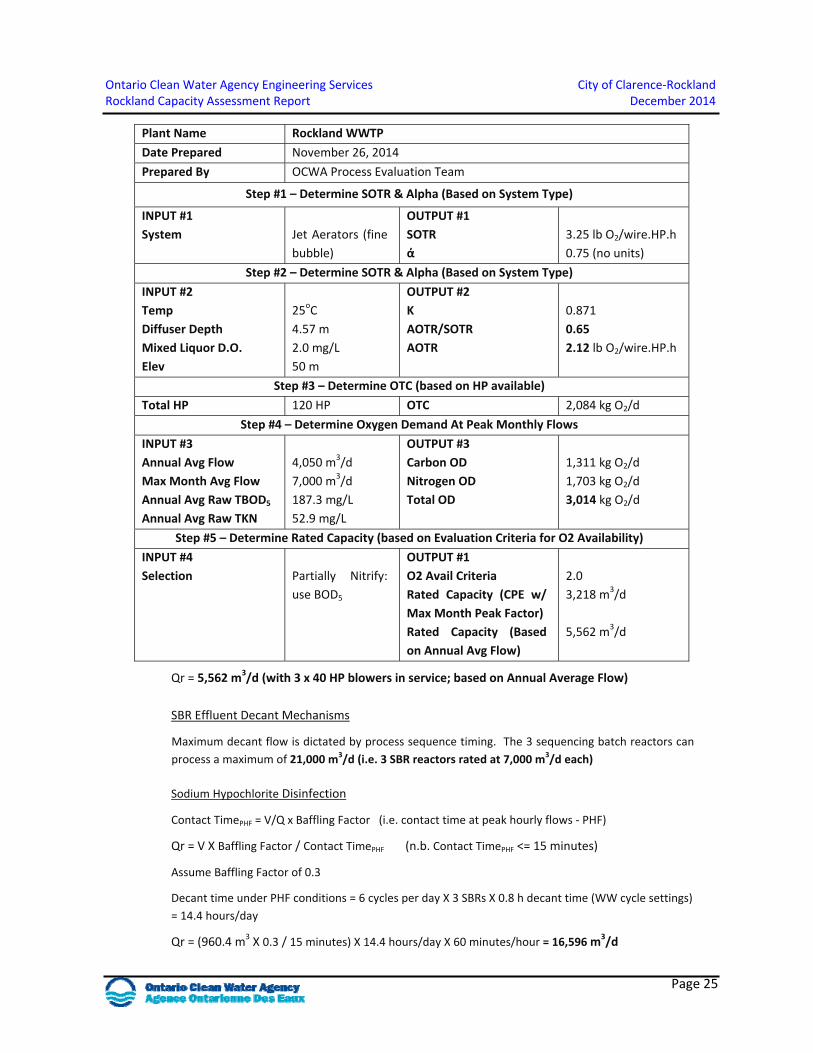
Ontario Clean Water Agency Engineering Services City of Clarence‐Rockland Rockland Capacity Assessment Report December 2014
Page 25
Plant Name Rockland WWTP
Date Prepared November 26, 2014
Prepared By OCWA Process Evaluation Team
Step #1 – Determine SOTR & Alpha (Based on System Type)
INPUT #1
System Jet Aerators (fine
bubble)
OUTPUT #1
SOTR
ά
3.25 lb O2/wire.HP.h
0.75 (no units)
Step #2 – Determine SOTR & Alpha (Based on System Type)
INPUT #2
Temp
Diffuser Depth
Mixed Liquor D.O.
Elev
25oC
4.57 m
2.0 mg/L
50 m
OUTPUT #2
K
AOTR/SOTR
AOTR
0.871
0.65
2.12 lb O2/wire.HP.h
Step #3 – Determine OTC (based on HP available)
Total HP 120 HP OTC 2,084 kg O2/d
Step #4 – Determine Oxygen Demand At Peak Monthly Flows
INPUT #3
Annual Avg Flow
Max Month Avg Flow
Annual Avg Raw TBOD5
Annual Avg Raw TKN
4,050 m3/d
7,000 m3/d
187.3 mg/L
52.9 mg/L
OUTPUT #3
Carbon OD
Nitrogen OD
Total OD
1,311 kg O2/d
1,703 kg O2/d
3,014 kg O2/d
Step #5 – Determine Rated Capacity (based on Evaluation Criteria for O2 Availability)
INPUT #4
Selection Partially Nitrify:
use BOD5
OUTPUT #1
O2 Avail Criteria
Rated Capacity (CPE w/
Max Month Peak Factor)
Rated Capacity (Based
on Annual Avg Flow)
2.0
3,218 m3/d
5,562 m3/d
Qr = 5,562 m3/d (with 3 x 40 HP blowers in service; based on Annual Average Flow)
SBR Effluent Decant Mechanisms
Maximum decant flow is dictated by process sequence timing. The 3 sequencing batch reactors can
process a maximum of 21,000 m3/d (i.e. 3 SBR reactors rated at 7,000 m3/d each)
Sodium Hypochlorite Disinfection
Contact TimePHF = V/Q x Baffling Factor (i.e. contact time at peak hourly flows ‐ PHF)
Qr = V X Baffling Factor / Contact TimePHF (n.b. Contact TimePHF <= 15 minutes)
Assume Baffling Factor of 0.3
Decant time under PHF conditions = 6 cycles per day X 3 SBRs X 0.8 h decant time (WW cycle settings)
= 14.4 hours/day
Qr = (960.4 m3 X 0.3 / 15 minutes) X 14.4 hours/day X 60 minutes/hour = 16,596 m3/d
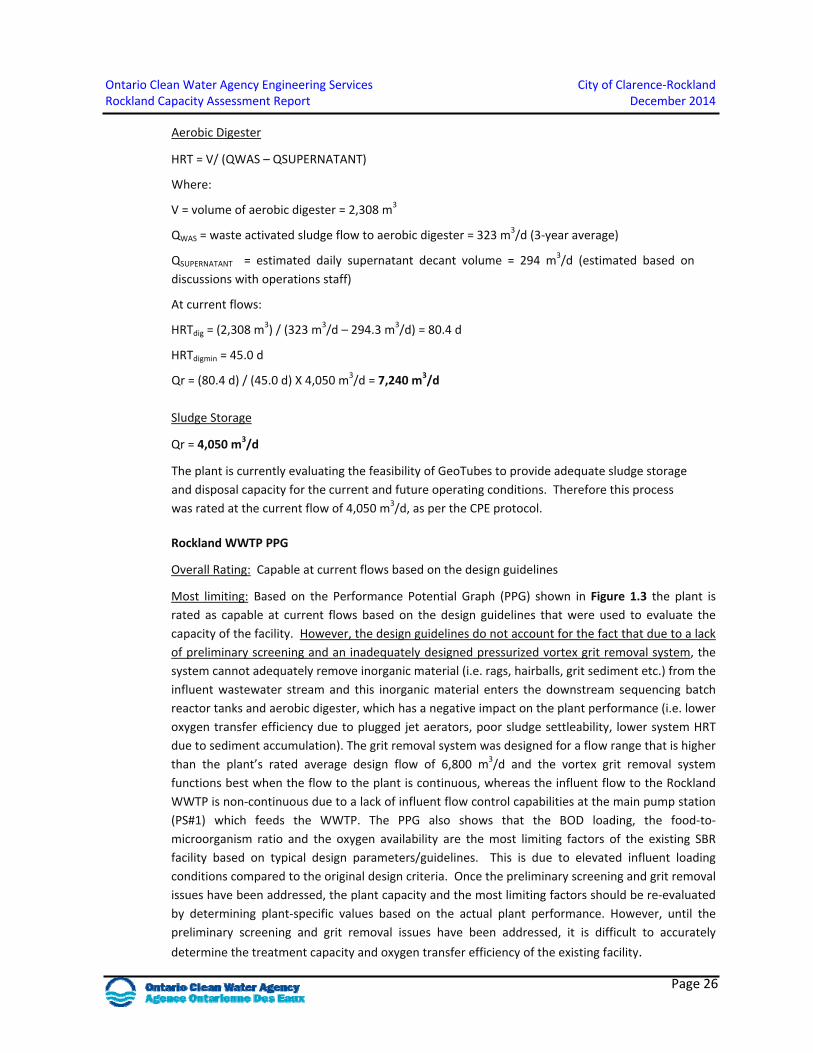
Ontario Clean Water Agency Engineering Services City of Clarence‐Rockland Rockland Capacity Assessment Report December 2014
Page 26
Aerobic Digester
HRT = V/ (QWAS – QSUPERNATANT)
Where:
V = volume of aerobic digester = 2,308 m3
QWAS = waste activated sludge flow to aerobic digester = 323 m3/d (3‐year average)
QSUPERNATANT = estimated daily supernatant decant volume = 294 m3/d (estimated based on
discussions with operations staff)
At current flows:
HRTdig = (2,308 m3) / (323 m3/d – 294.3 m3/d) = 80.4 d
HRTdigmin = 45.0 d
Qr = (80.4 d) / (45.0 d) X 4,050 m3/d = 7,240 m3/d
Sludge Storage
Qr = 4,050 m3/d
The plant is currently evaluating the feasibility of GeoTubes to provide adequate sludge storage
and disposal capacity for the current and future operating conditions. Therefore this process
was rated at the current flow of 4,050 m3/d, as per the CPE protocol.
Rockland WWTP PPG
Overall Rating: Capable at current flows based on the design guidelines
Most limiting: Based on the Performance Potential Graph (PPG) shown in Figure 1.3 the plant is
rated as capable at current flows based on the design guidelines that were used to evaluate the
capacity of the facility. However, the design guidelines do not account for the fact that due to a lack
of preliminary screening and an inadequately designed pressurized vortex grit removal system, the
system cannot adequately remove inorganic material (i.e. rags, hairballs, grit sediment etc.) from the
influent wastewater stream and this inorganic material enters the downstream sequencing batch
reactor tanks and aerobic digester, which has a negative impact on the plant performance (i.e. lower
oxygen transfer efficiency due to plugged jet aerators, poor sludge settleability, lower system HRT
due to sediment accumulation). The grit removal system was designed for a flow range that is higher
than the plant’s rated average design flow of 6,800 m3/d and the vortex grit removal system
functions best when the flow to the plant is continuous, whereas the influent flow to the Rockland
WWTP is non‐continuous due to a lack of influent flow control capabilities at the main pump station
(PS#1) which feeds the WWTP. The PPG also shows that the BOD loading, the food‐to‐
microorganism ratio and the oxygen availability are the most limiting factors of the existing SBR
facility based on typical design parameters/guidelines. This is due to elevated influent loading
conditions compared to the original design criteria. Once the preliminary screening and grit removal
issues have been addressed, the plant capacity and the most limiting factors should be re‐evaluated
by determining plant‐specific values based on the actual plant performance. However, until the
preliminary screening and grit removal issues have been addressed, it is difficult to accurately
determine the treatment capacity and oxygen transfer efficiency of the existing facility.
Ontario Clean Water Agency Engineering Services City of Clarence-Rockland Rockland Wastewater Treatment Plant Review February 2015
Page 35
Appendix D Capital Plan
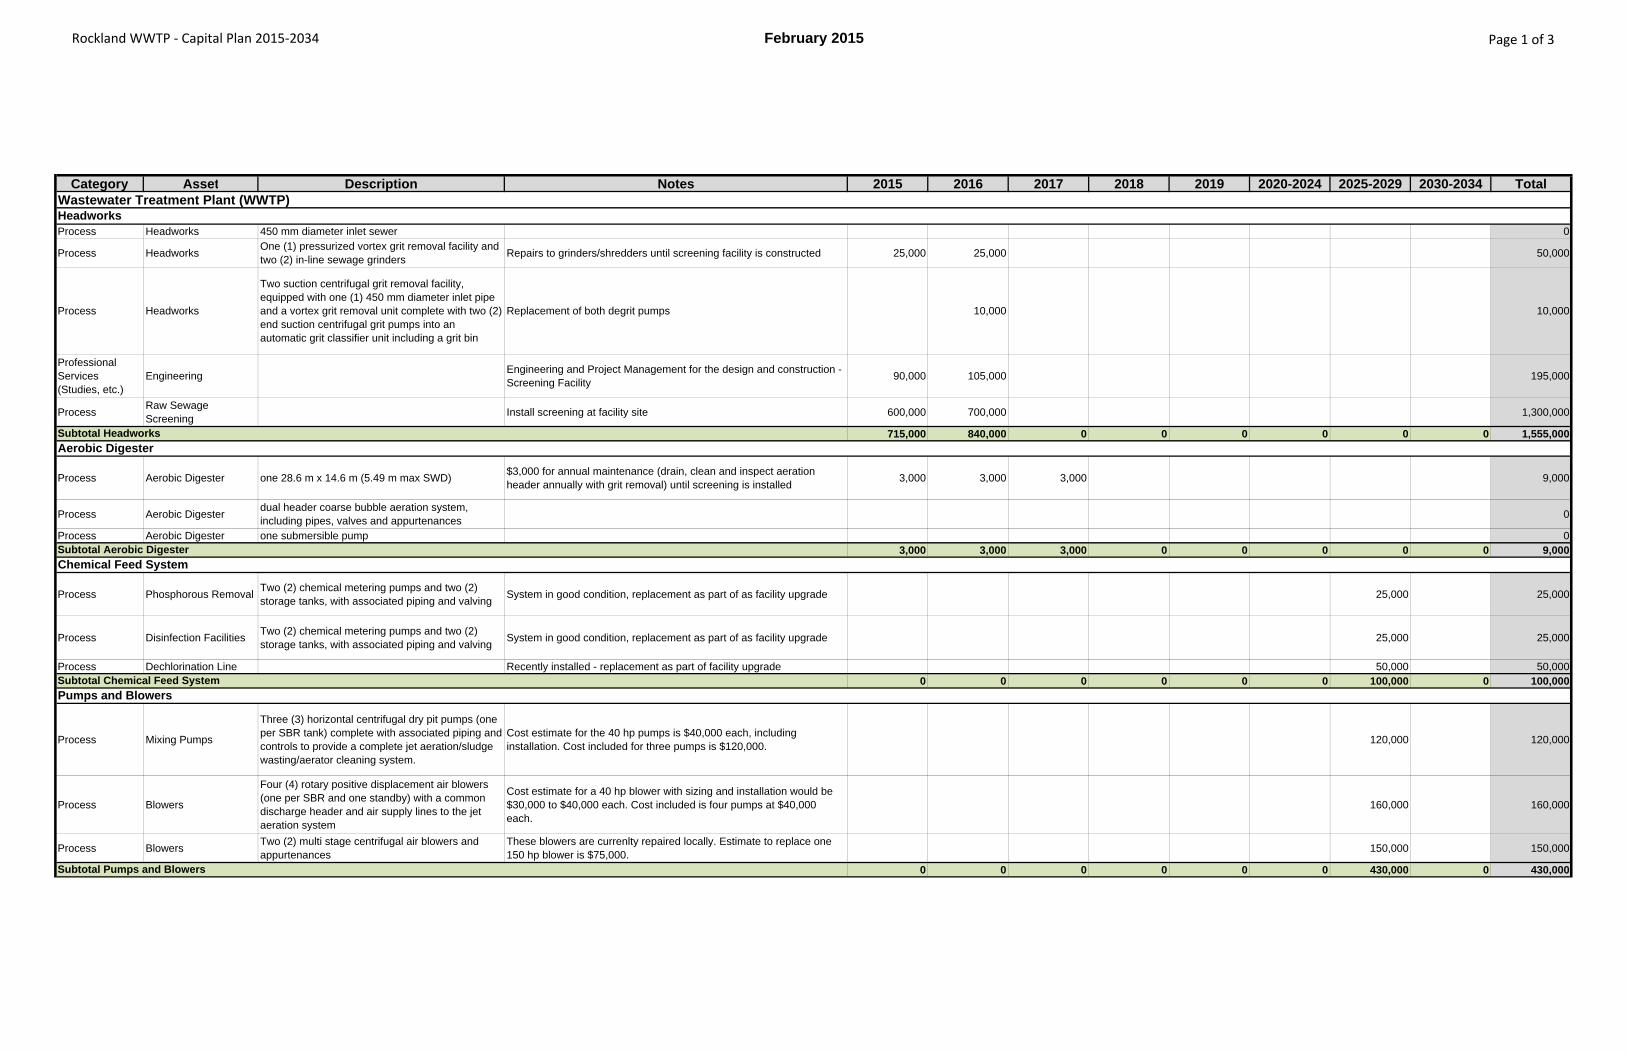
Rockland WWTP ‐ Capital Plan 2015‐2034 February 2015 Page 1 of 3
Category Asset Description Notes 2015 2016 2017 2018 2019 2020-2024 2025-2029 2030-2034 TotalWastewater Treatment Plant (WWTP)
Process Headworks 450 mm diameter inlet sewer 0
Process HeadworksOne (1) pressurized vortex grit removal facility and two (2) in-line sewage grinders
Repairs to grinders/shredders until screening facility is constructed 25,000 25,000 50,000
Process Headworks
Two suction centrifugal grit removal facility, equipped with one (1) 450 mm diameter inlet pipe and a vortex grit removal unit complete with two (2) end suction centrifugal grit pumps into an automatic grit classifier unit including a grit bin
Replacement of both degrit pumps 10,000 10,000
Professional Services (Studies, etc.)
EngineeringEngineering and Project Management for the design and construction - Screening Facility
90,000 105,000 195,000
ProcessRaw Sewage Screening
Install screening at facility site 600,000 700,000 1,300,000
715,000 840,000 0 0 0 0 0 0 1,555,000
Process Aerobic Digester one 28.6 m x 14.6 m (5.49 m max SWD)$3,000 for annual maintenance (drain, clean and inspect aeration header annually with grit removal) until screening is installed
3,000 3,000 3,000 9,000
Process Aerobic Digesterdual header coarse bubble aeration system, including pipes, valves and appurtenances
0
Process Aerobic Digester one submersible pump 03,000 3,000 3,000 0 0 0 0 0 9,000
Process Phosphorous RemovalTwo (2) chemical metering pumps and two (2) storage tanks, with associated piping and valving
System in good condition, replacement as part of as facility upgrade 25,000 25,000
Process Disinfection FacilitiesTwo (2) chemical metering pumps and two (2) storage tanks, with associated piping and valving
System in good condition, replacement as part of as facility upgrade 25,000 25,000
Process Dechlorination Line Recently installed - replacement as part of facility upgrade 50,000 50,0000 0 0 0 0 0 100,000 0 100,000
Process Mixing Pumps
Three (3) horizontal centrifugal dry pit pumps (one per SBR tank) complete with associated piping and controls to provide a complete jet aeration/sludge wasting/aerator cleaning system.
Cost estimate for the 40 hp pumps is $40,000 each, including installation. Cost included for three pumps is $120,000.
120,000 120,000
Process Blowers
Four (4) rotary positive displacement air blowers (one per SBR and one standby) with a common discharge header and air supply lines to the jet aeration system
Cost estimate for a 40 hp blower with sizing and installation would be $30,000 to $40,000 each. Cost included is four pumps at $40,000 each.
160,000 160,000
Process BlowersTwo (2) multi stage centrifugal air blowers and appurtenances
These blowers are currenlty repaired locally. Estimate to replace one 150 hp blower is $75,000.
150,000 150,000
0 0 0 0 0 0 430,000 0 430,000
Pumps and Blowers
Subtotal Pumps and Blowers
Headworks
Subtotal Headworks
Aerobic Digester
Subtotal Aerobic Digester
Chemical Feed System
Subtotal Chemical Feed System
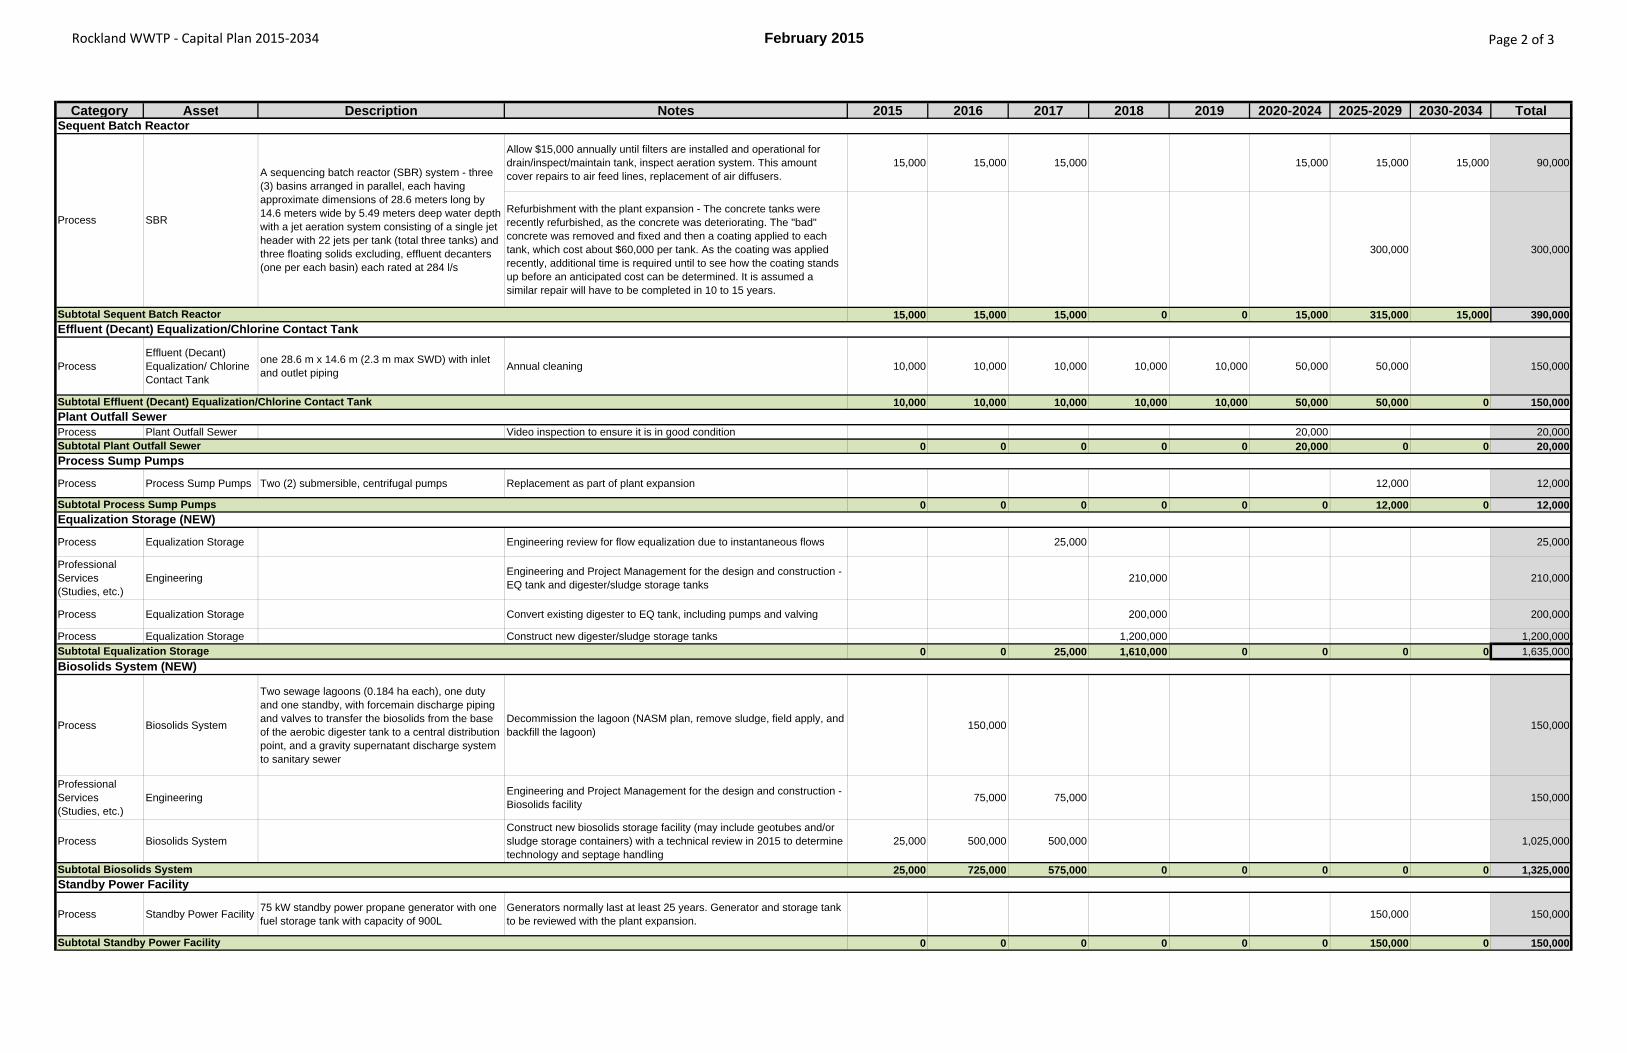
Rockland WWTP ‐ Capital Plan 2015‐2034 February 2015 Page 2 of 3
Category Asset Description Notes 2015 2016 2017 2018 2019 2020-2024 2025-2029 2030-2034 Total
Allow $15,000 annually until filters are installed and operational for drain/inspect/maintain tank, inspect aeration system. This amount cover repairs to air feed lines, replacement of air diffusers.
15,000 15,000 15,000 15,000 15,000 15,000 90,000
Refurbishment with the plant expansion - The concrete tanks were recently refurbished, as the concrete was deteriorating. The "bad" concrete was removed and fixed and then a coating applied to each tank, which cost about $60,000 per tank. As the coating was applied recently, additional time is required until to see how the coating stands up before an anticipated cost can be determined. It is assumed a similar repair will have to be completed in 10 to 15 years.
300,000 300,000
15,000 15,000 15,000 0 0 15,000 315,000 15,000 390,000
ProcessEffluent (Decant) Equalization/ Chlorine Contact Tank
one 28.6 m x 14.6 m (2.3 m max SWD) with inlet and outlet piping
Annual cleaning 10,000 10,000 10,000 10,000 10,000 50,000 50,000 150,000
10,000 10,000 10,000 10,000 10,000 50,000 50,000 0 150,000
Process Plant Outfall Sewer Video inspection to ensure it is in good condition 20,000 20,0000 0 0 0 0 20,000 0 0 20,000
Process Process Sump Pumps Two (2) submersible, centrifugal pumps Replacement as part of plant expansion 12,000 12,000
0 0 0 0 0 0 12,000 0 12,000
Process Equalization Storage Engineering review for flow equalization due to instantaneous flows 25,000 25,000
Professional Services (Studies, etc.)
EngineeringEngineering and Project Management for the design and construction - EQ tank and digester/sludge storage tanks
210,000 210,000
Process Equalization Storage Convert existing digester to EQ tank, including pumps and valving 200,000 200,000
Process Equalization Storage Construct new digester/sludge storage tanks 1,200,000 1,200,000
0 0 25,000 1,610,000 0 0 0 0 1,635,000
Process Biosolids System
Two sewage lagoons (0.184 ha each), one duty and one standby, with forcemain discharge piping and valves to transfer the biosolids from the base of the aerobic digester tank to a central distribution point, and a gravity supernatant discharge system to sanitary sewer
Decommission the lagoon (NASM plan, remove sludge, field apply, and backfill the lagoon)
150,000 150,000
Professional Services (Studies, etc.)
EngineeringEngineering and Project Management for the design and construction - Biosolids facility
75,000 75,000 150,000
Process Biosolids SystemConstruct new biosolids storage facility (may include geotubes and/or sludge storage containers) with a technical review in 2015 to determine technology and septage handling
25,000 500,000 500,000 1,025,000
25,000 725,000 575,000 0 0 0 0 0 1,325,000
Process Standby Power Facility75 kW standby power propane generator with one fuel storage tank with capacity of 900L
Generators normally last at least 25 years. Generator and storage tank to be reviewed with the plant expansion.
150,000 150,000
0 0 0 0 0 0 150,000 0 150,000
Biosolids System (NEW)
Subtotal Biosolids System
Standby Power Facility
Subtotal Standby Power Facility
Plant Outfall Sewer
Subtotal Plant Outfall Sewer
Process Sump Pumps
Subtotal Process Sump Pumps
Equalization Storage (NEW)
Subtotal Equalization Storage
Process SBR
A sequencing batch reactor (SBR) system - three (3) basins arranged in parallel, each having approximate dimensions of 28.6 meters long by 14.6 meters wide by 5.49 meters deep water depth with a jet aeration system consisting of a single jet header with 22 jets per tank (total three tanks) and three floating solids excluding, effluent decanters (one per each basin) each rated at 284 l/s
Subtotal Sequent Batch Reactor
Effluent (Decant) Equalization/Chlorine Contact Tank
Subtotal Effluent (Decant) Equalization/Chlorine Contact Tank
Sequent Batch Reactor
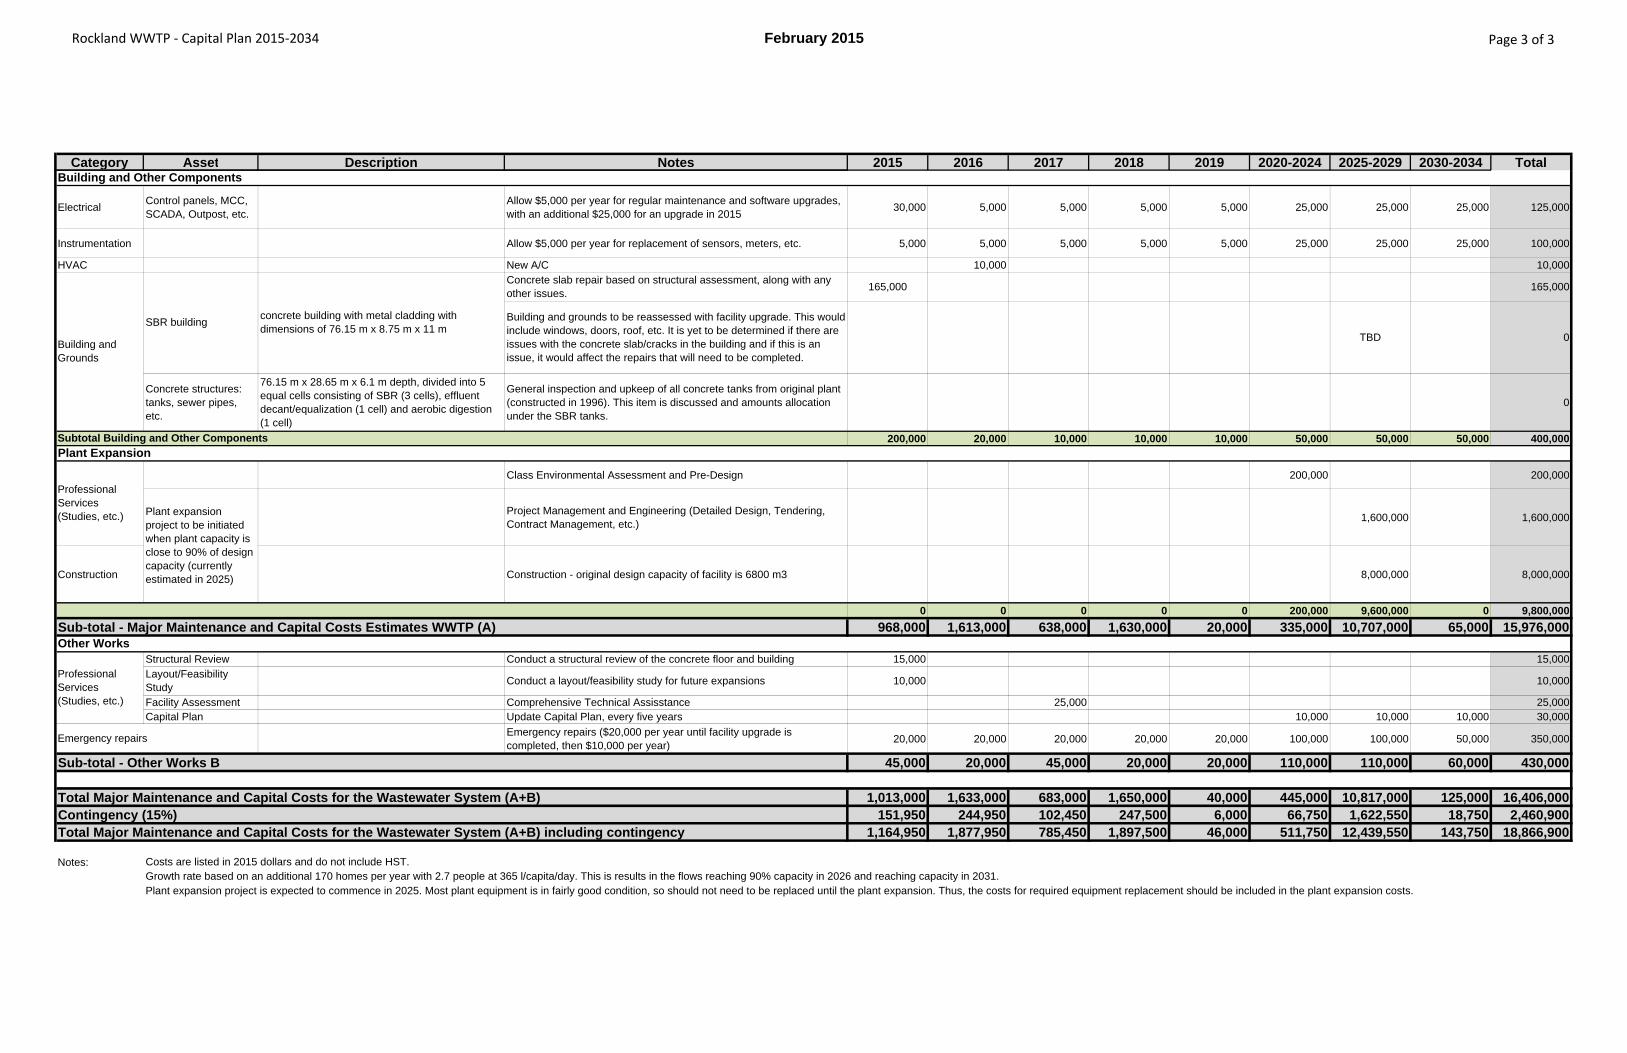
Rockland WWTP ‐ Capital Plan 2015‐2034 February 2015 Page 3 of 3
Category Asset Description Notes 2015 2016 2017 2018 2019 2020-2024 2025-2029 2030-2034 Total
ElectricalControl panels, MCC, SCADA, Outpost, etc.
Allow $5,000 per year for regular maintenance and software upgrades, with an additional $25,000 for an upgrade in 2015
30,000 5,000 5,000 5,000 5,000 25,000 25,000 25,000 125,000
Instrumentation Allow $5,000 per year for replacement of sensors, meters, etc. 5,000 5,000 5,000 5,000 5,000 25,000 25,000 25,000 100,000
HVAC New A/C 10,000 10,000Concrete slab repair based on structural assessment, along with any other issues.
165,000 165,000
Building and grounds to be reassessed with facility upgrade. This would include windows, doors, roof, etc. It is yet to be determined if there are issues with the concrete slab/cracks in the building and if this is an issue, it would affect the repairs that will need to be completed.
TBD 0
Concrete structures: tanks, sewer pipes, etc.
76.15 m x 28.65 m x 6.1 m depth, divided into 5 equal cells consisting of SBR (3 cells), effluent decant/equalization (1 cell) and aerobic digestion (1 cell)
General inspection and upkeep of all concrete tanks from original plant (constructed in 1996). This item is discussed and amounts allocation under the SBR tanks.
0
200,000 20,000 10,000 10,000 10,000 50,000 50,000 50,000 400,000
Class Environmental Assessment and Pre-Design 200,000 200,000
Project Management and Engineering (Detailed Design, Tendering, Contract Management, etc.)
1,600,000 1,600,000
Construction Construction - original design capacity of facility is 6800 m3 8,000,000 8,000,000
0 0 0 0 0 200,000 9,600,000 0 9,800,000
Sub-total - Major Maintenance and Capital Costs Estimates WWTP (A) 968,000 1,613,000 638,000 1,630,000 20,000 335,000 10,707,000 65,000 15,976,000
Structural Review Conduct a structural review of the concrete floor and building 15,000 15,000Layout/Feasibility Study
Conduct a layout/feasibility study for future expansions 10,000 10,000
Facility Assessment Comprehensive Technical Assisstance 25,000 25,000Capital Plan Update Capital Plan, every five years 10,000 10,000 10,000 30,000
Emergency repairs ($20,000 per year until facility upgrade is completed, then $10,000 per year)
20,000 20,000 20,000 20,000 20,000 100,000 100,000 50,000 350,000
Sub-total - Other Works B 45,000 20,000 45,000 20,000 20,000 110,000 110,000 60,000 430,000
Total Major Maintenance and Capital Costs for the Wastewater System (A+B) 1,013,000 1,633,000 683,000 1,650,000 40,000 445,000 10,817,000 125,000 16,406,000Contingency (15%) 151,950 244,950 102,450 247,500 6,000 66,750 1,622,550 18,750 2,460,900Total Major Maintenance and Capital Costs for the Wastewater System (A+B) including contingency 1,164,950 1,877,950 785,450 1,897,500 46,000 511,750 12,439,550 143,750 18,866,900
Notes:
Emergency repairs
Costs are listed in 2015 dollars and do not include HST.Growth rate based on an additional 170 homes per year with 2.7 people at 365 l/capita/day. This is results in the flows reaching 90% capacity in 2026 and reaching capacity in 2031.Plant expansion project is expected to commence in 2025. Most plant equipment is in fairly good condition, so should not need to be replaced until the plant expansion. Thus, the costs for required equipment replacement should be included in the plant expansion costs.
Subtotal Building and Other Components
Plant Expansion
Professional Services (Studies, etc.)
Other Works
Professional Services (Studies, etc.)
Plant expansion project to be initiated when plant capacity is close to 90% of design capacity (currently estimated in 2025)
Building and Other Components
Building and Grounds
SBR buildingconcrete building with metal cladding with dimensions of 76.15 m x 8.75 m x 11 m