rock mass characterisation using lidar and automated point
TRANSCRIPT

~ ~ ~ I ~ ~ ~
Jl' ~~ 8 I ~
2oc ~ mass c charac-.erisa-.ionusing 3AR anc au:orna:ecgroin-. c ouc processing
by John Kemeny, Split Engineering and University of Arizona, Tucson, USA
and James Donovan, University of Utah, Salt Lake City, Utah, USA.
IntroductionAt the heart of designing struc-tures in rocks is a thorough charac-terisation of the rock mass prior toexcavation (eg Priest, 1983). Theresults of rock mass characterisa-tion go on to be used in blast andexcavation design, determina-tion of support requirements, costanalyses, numerical modelling, andmany other aspects of the designprocess.
At a minimum, rock mass charac-terisation usually involves boreholelogging and sampling, laboratorytesting, and field mapping and datacollection. Due to access problems,safety and time and cost concerns,there are many uncertainties andhazards associated with the field
mapping and data collection aspectsof rock characterisation projects.
New geotechnical/surveyingtechnologies are becoming increas-ing important. These include GPS,digital methods for field surveyingand data collection, still and videodigital cameras, and GIS and asso-ciated software for data processingand visualisation.
Ground based 3D imaging is anew and emerging technology forrock mass characteris ation. Thisarticle defines 3D imaging to includeground based LIDAR surveys (alsocalled 3D laser scanning), high reso-lution digital cameras, and a host ofsoftware for data processing, inter-pretation and visualisation.
Laser scanners work by collecting
an array of high resolution laser-based position measurements. Laserscanners are capable of collectingdata at rates over 20,000 points persecond, with a position accuracyof less than Smm at distances upto 800m. The output from a laserscanner survey is a "point cloud"consisting of millions of reflectionpoints that represent the 3D surfacethat was scanned.
After some data cleaning, atriangulated surface can be renderedfrom the point cloud data, and manysubsequent calculations and visuali-sations can be made using the 3Dsurface. In addition, a techniquecalled texture mapping or photodraping can be used to overlay high-resolution colour information from
digital images on to the 3D surface.The techniques are being used in a
number of engineering applications,including civil and architecturaldesign, modelling, scene reconstruc-tion, damage and condition assess-ment. An example of a point cloudof a rock face is shown in Figure1 (taken along a highway south ofOuray, Colorado). This point cloudhas about 1.5M points and the scan-ning took about 15 minutes.
Overview of the Split FXSplit Engineering LLC is developinga sofiware package, Split FX, thatuses data from 3D laser scanners tohelp field mapping, data collectionand data processing associated withrock mass characterisation.
si'IP't
i'cKx ~
,.'4 i:'I It„;
hm Lc
Figure 1:Point cloud from aroad cut south of Ouray,Colorado.
Figure 2: Triangulated mesh ofpart of the point cloud shown inFigure 1.
Figure 3:Automatic delineationof fracture patches from thetriangulated mesh in Figure 2.
26 GROUND ENGINEERING NOVEMBER 2005
As well as being a point cloudviewer and editor, Split FX is capa-ble of automatically extractingvaluable information about discon-tinuities, including 3D orientation,spacing, size, roughness and blocksize. It can use information fromdigital images as well as from pointclouds and can plot information onstereonets and histograms as wellas export data in various formats.Some key features of the programfollow.
Point cloud registrationThe first step in point cloud process-ing is to orient the point cloud intothe real world coordinate systembased on field data. Split FX includesseveral methods for point cloud reg-istration, the most common is toregister the point cloud based onthree targets of known position.
However, for some applications(such as slope stability), only theorientation registration is required.In these instances, simpler methodsare possible, such as only measuringthe orientation of the scanner with-out any position surveying.
Triangulated mesh generationThe second step in the Split FXpointcloud processing is to create a sur-face mesh from the point cloud data.The mesh generation algorithm inSplit FX allows the user to controlthe amount of data smoothing. It
also includes algorithms for filter-
ing erroneous data points. Figure 2shows a triangulated mesh of part ofthe point cloud in Figure l.
Patch finderThe most important processing stepin Split FX is the delineation of frac-ture "patches" from the triangulatedsurface mesh. The term patch is usedrather than fracture, because a singlelarge fracture may be delineated intoseveral smaller patches, dependingon the flatness and roughness of thefracture.
Fractures are detected by usingthe basic property that they areflat. Flat surfaces are automaticallyfound in the triangulated mesh byfirst calculating the normal to eachtriangle, and then finding groupsof adjacent triangles that satisfy aflatness criterion. This criterion hasparameters that can be adjusted bythe user.
Figure 3 shows the patches thatwere found in the point cloud inFigure I, using the criterion that apatch must be at least five triangles,and neighboring triangles in a patchmust not deviate in orientation bymore than 10'. The patches are out-lined in yellow and holes in patchesare outlined in red. Overall thissimple criterion results in a gooddelineation of the major fractures atthe site. Patches can also be manu-ally added, deleted and edited.
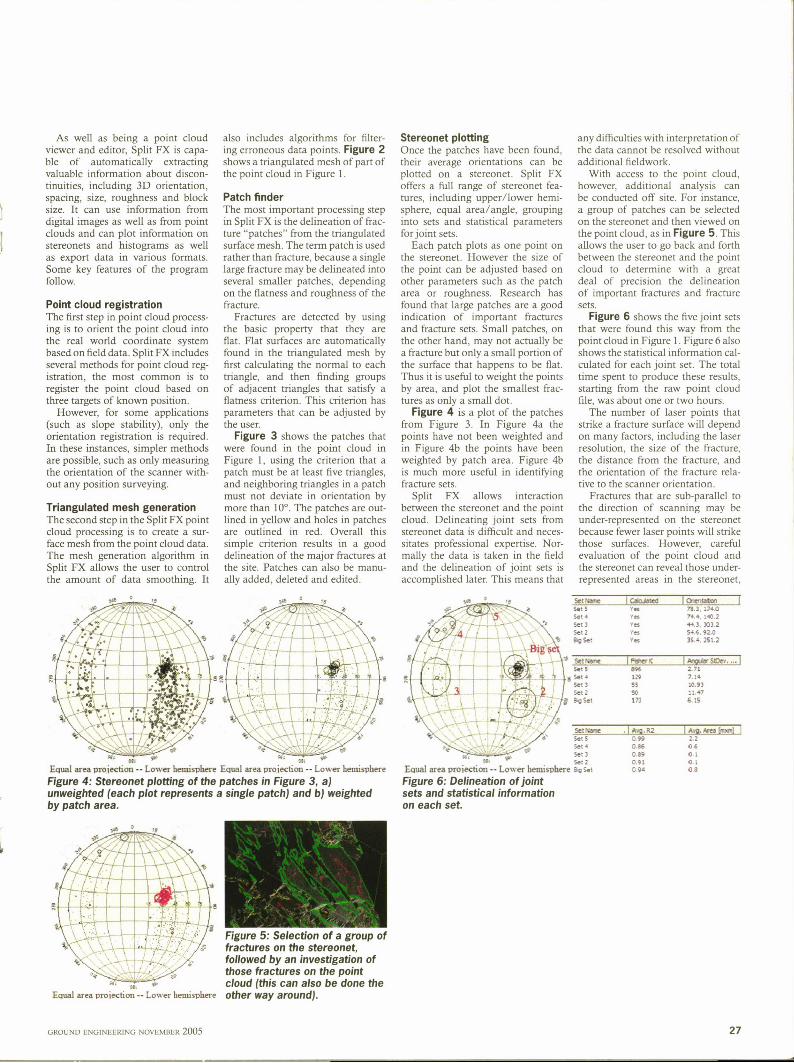
Stereonet plottingOnce the patches have been found,their average orientations can beplotted on a stereonet. Split FXoffers a full range of stereonet fea-tures, including upper/lower hemi-sphere, equal area/angle, groupinginto sets and statistical parametersfor joint sets.
Each patch plots as one point onthe stereonet. However the size ofthe point can be adjusted based onother parameters such as the patcharea or roughness. Research hasfound that large patches are a goodindication of important fracturesand fracture sets. Small patches, onthe other hand, may not actually bea fracture but only a small portion ofthe surface that happens to be flat.Thus it is useful to weight the pointsby area, and plot the smallest frac-tures as only a small dot.
Figure 4 is a plot of the patchesfrom Figure 3. In Figure 4a thepoints have not been weighted andin Figure 4b the points have beenweighted by patch area. Figure 4bis much more useful in identifyingfracture sets.
Split FX allows interactionbetween the stereonet and the pointcloud. Delineating joint sets fromstereonet data is difficult and neces-sitates professional expertise. Nor-mally the data is taken in the fieldand the delineation of joint sets isaccomplished later. This means that
any difficulties with interpretation ofthe data cannot be resolved withoutadditional fieldwork.
With access to the point cloud,however, additional analysis canbe conducted off site. For instance,a group of patches can be selectedon the stereonet and then viewed onthe point cloud, as in Figure 5. Thisallows the user to go back and forthbetween the stereonet and the pointcloud to determine with a greatdeal of precision the delineationof important fractures and fracturesets.
Figure 6 shows the five joint setsthat were found this way from thepoint cloud in Figure 1. Figure 6 alsoshows the statistical information cal-culated for each joint set. The totaltime spent to produce these results,starting from the raw point cloudfile, was about one or two hours.
The number of laser points thatstrike a fracture surface will dependon many factors, including the laserresolution, the size of the fracture,the distance from the fracture, andthe orientation of the fracture rela-tive to the scanner orientation.
Fractures that are sub-parallel tothe direction of scanning may beunder-represented on the stereonetbecause fewer laser points will strikethose surfaces. However, carefulevaluation of the point cloud andthe stereonet can reveal those under-represented areas in the stereonet,
rn Set Nnme
Set 5Set 4Set 3Snt 2
SC Snt
Ymt
'tnt
Ytv
tntYnn
I nnttnnSmn I
75.3, '74.074.4,,"C.244.3. 303.254.6.92635.4, 251.2
6
Set NuncSnt 5Snt 4
Set 3Snt 2
ScSnt
I Yttster X
1295556173
I artetas seer. „.I
2 717 1416.9311 476.15
Equal area p3oiection —Lowe hemisphere Equal area proiection —Lowe hemisphere
Figure 4: Stereonet plotting of the patches in Figure 3, ajunweighted (each plot represents a single patchj and bj weightedby patch area.
Equal area proiection —Lotver hemisphere
Figure 6:Delineation ofjointsets and statistical informationon each set.
Set Name
Snt 5Snt 4Set 3Snt 2
Sc 541
~ I nrvu. R20 990.660.690.910 94
I ava. 6566 tnnnnl I
2.2060. 1
0.108
5ln rn
8IFigure 5: Selection of a group offractures on the stereonet,followed by an investigation ofthose fractures on the pointcloud (this can also be done the
Equal area proiection —Lo»er hemisphere Other Way araund J.
GROUND ENGINEERING NOVEMBER 2005 27
TKIINIIMI. MT[and patches can be added accord-ingly using hand-editing tools in theFX program.
The scanner can only detect sur-faces in its line of sight, and theportion of the surface not "seen" isreferred to as the scanner "shadowzone". In some circumstances, anentire joint set may be in the shadowzone, and so several scans need to betaken at different angles to the faceto adequately represent structuralconditions at the site (Donovan etal, 2005b).
Processing digital imagesDiscontinuities appear in two formsin rock outcrops, as two-dimen-sional fracture traces and as three-dimensional fracture surfaces.
LIDAR does an excellent job ofcapturing Iracture surfaces, and asdemonstrated above, LIDAR alongwith point cloud processing soft-ware can be used to reliably extractfracture orientation information.
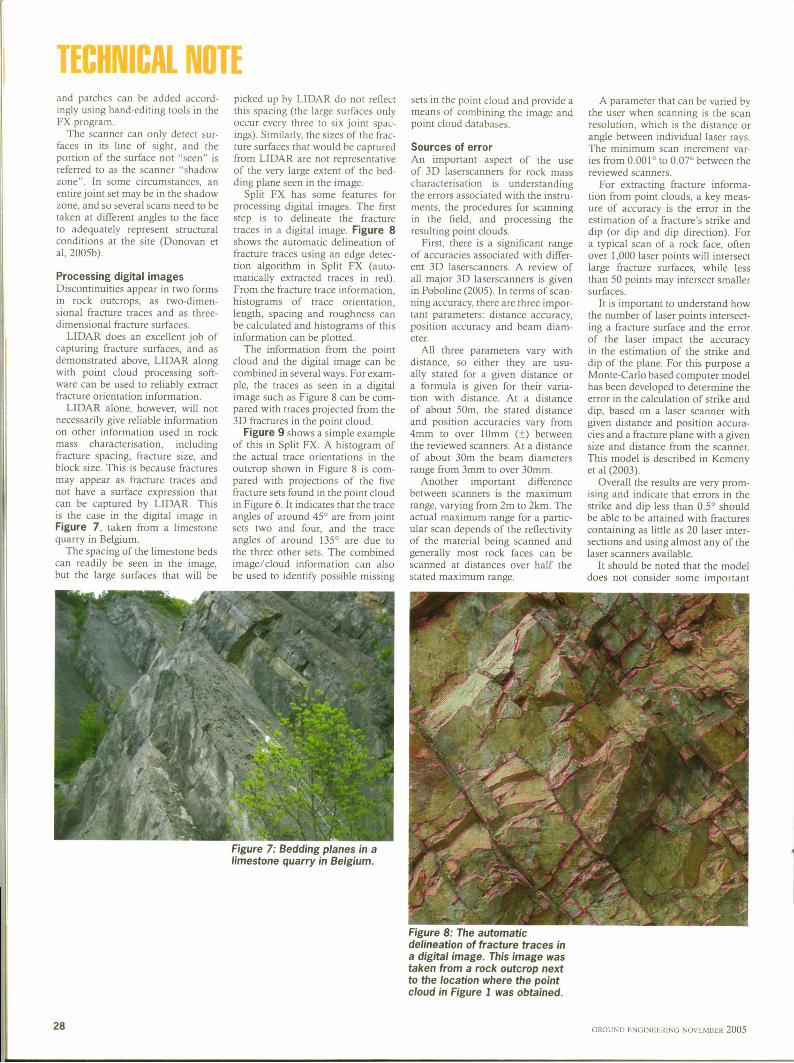
LIDAR alone, however, will notnecessarily give reliable informationon other information used in rockmass characterisation, includingfracture spacing, fracture size, andblock size. This is because fracturesmay appear as fracture traces andnot have a surface expression thatcan be captured by LIDAR. Thisis the case in the digital image inFigure 7, taken from a limestonequarry in Belgium.
The spacing of the limestone bedscan readily be seen in the image,but the large surfaces that will be
picked up by LIDAR do not reflectthis spacing (the large surfaces onlyoccur every three to six joint spac-ings). Similarly, the sizes of the frac-ture surfaces that would be capturedfrom LIDAR are not representativeof the very large extent of the bed-ding plane seen in the image.
Split FX has some features forprocessing digital images. The firststep is to delineate the fracturetraces in a digital image. Figure 8shows the automatic delineation offracture traces using an edge detec-tion algorithm in Split FX (auto-matically extracted traces in red).From the fracture trace information,histograms of trace orientation,length, spacing and roughness canbe calculated and histograms of thisinformation can be plotted.
The information from the pointcloud and the digital image can becombined in several ways. For exam-ple, the traces as seen in a digitalimage such as Figure 8 can be com-pared with traces projected from the3D fractures in the point cloud.
Figure 9 shows a simple exampleof this in Split FX. A histogram ofthe actual trace orientations in theoutcrop shown in Figure 8 is com-pared with projections of the livefracture sets found in the point cloudin Figure 6. It indicates that the traceangles of around 45're from jointsets two and four, and the traceangles of around 135're due tothe three other sets. The combinedimage/cloud information can alsobe used to identify possible missing
sets in the point cloud and provide ameans of combining the image andpoint cloud databases.
Sources of errorAn important aspect of the useof 3D laserscanners for rock masscharacterisation is understandingthe errors associated with the instru-ments, the procedures for scanningin the field, and processing theresulting point clouds.
First, there is a significant rangeof accuracies associated with differ-ent 3D laserscanners. A review ofall major 3D laserscanners is givenin Poboline (2005). In terms of scan-ning accuracy, there are three impor-tant parameters; distance accuracy,position accuracy and beam diam-eter.
All three parameters vary withdistance, so either they are usu-ally stated for a given distance ora formula is given for their varia-tion with distance. At a distanceof about 50m, the stated distanceand position accuracies vary from4mm to over 10mm (+) betweenthe reviewed scanners. At a distanceof about 30m the beam diametersrange from 3mm to over 30mm.
Another important differencebetween scanners is the maximumrange, varying from 2m to 2km. Theactual maximum range for a partic-ular scan depends of the reflectivityof the material being scanned andgenerally most rock faces can bescanned at distances over half thestated maximum range.
A parameter that can be varied bythe user when scanning is the scanresolution, which is the distance orangle between individual laser rays.The minimum scan increment var-ies from 0.001'o 0.07'etween thereviewed scanners.
For extracting fracture informa-tion from point clouds, a key meas-ure of accuracy is the error in theestimation of a fracture's strike anddip (or dip and dip direction). Fora typical scan of a rock face, oftenover 1,000 laser points will intersectlarge fracture surfaces, while lessthan 50 points may intersect smallersurfaces.
It is important to understand howthe number of laser points intersect-ing a fracture surface and the errorof the laser impact the accuracyin the estimation of the strike anddip of the plane. For this purpose aMonte-Carlo based computer modelhas been developed to determine theerror in the calculation of strike anddip, based on a laser scanner withgiven distance and position accura-cies and a fracture plane with a givensize and distance from the scanner.This model is described in Kemenyet al (2003).
Overall the results are very prom-ising and indicate that errors in thestrike and dip less than 0.5'houldbe able to be attained with fracturescontaining as little as 20 laser inter-sections and using almost any of thelaser scanners available.
It should be noted that the modeldoes not consider some important
Figure 7: Bedding planes in alimestone quarry in Belgium.
Figure 8: The automaticdelineation of fracture traces ina digital image. This image wastaken from a rock outcrop nextto the location where the pointcloud in Figure 1 was obtained.
28 GROUND ENGINEERING NOVEMBER 2005

sources of possible error, includ-
ing atmospheric and temperatureerrors. It also does not include theerror associated with registering thepoint cloud to the real world coor-dinate system. Depending on themethod of registration, errors in theestimation of fracture strike and dipof 2'o 4'ay occur (Kemeny etal, 2003).
One way to assess the error in theestimation of strike and dip is tocompare orientation measurementsextracted from the point cloud withmeasurements made using manualscanline or cell mapping. Figure 10shows one such comparison made ata field site in the mountains north-east of Tucson, Arizona. As shownin Figure ll, 50 manual measure-ments were made and 441 fractureswere extracted from the point cloud.The results shown in Figure 11 aretypical of the results of these kindsof comparisons.
Over&, there is a good cor-relation between the measuredand extracted orientations. Moreimportant however, the extractionof almost ten times as many jointorientations results in a much moreaccurate assessment of the structuralconditions at the site.
DiscussionLIDAR is an exciting new technol-
ogy for rock mass characterisation,with high quality data obtainablewith just a few hours of field time.The point cloud in Figure 1 wasobtained without any survey points
set 4,
set z
on the rock face (using the orient byscanner method), eliminating manyof the safety hazards associated withfield site characterisation.
Automated point cloud process-ing software such as Split FX allowa large amount or rock characteri-zation information to be obtainedaccurately and with only a few hoursof processing time. Overall, it is feltthat LIDAR surveys, along withautomated point cloud processing,is cost effective and can now be usedroutinely on engineering projects.
There are still many issues associ-ated with using LIDAR surveys forrock mass characterisation. Some ofthese are listed below and will formthe basis for future research anddevelopment.1 A number of different LIDARunits are manufactured and com-mercially available for purchase orhire. The different units have similar,but not identical, capabilities. Whilemanufacturers publish specifica-tions for their units, little guidancehas been developed concerning thespecifications required (range, reso-lution, other features) for a particu-lar field application.2 There are a number of softwarepackages available for processingLIDAR data. Many are created bythe scanner manufacturers. Littleguidance has been developed con-cerning suitable software choices fora given application.3 So far, little attention has beenpaid to the compatibility of datainputs and outputs between the dif-
Bia,iet
sei 3
set 5
ferent software packages.4 Guidance is needed on specificand appropriate procedures involvedto conduct ground-based LIDARsurveys, as well as the appropri-ate data validation, processing andmanagement procedures. In thefield, appropriate procedures mustbe specified concerning:e the suitability of a site for LIDARsurveying« the procedures for scanning(number of scans, point spacing,resolution, etc.)e establishing surveying controlpointse taking digital imagese collecting non-digital types ofinformation.5 After a survey is conducted, dataprocessing and management proce-dures include the specific steps thatshould be taken to process the datausing various software packages forspecific outcomes (ie calculate theslope hazard at a particular site)and the appropriate standards andformats for the various kinds of datafrom a LIDAR survey, including theraw scanner files, point cloud files,rendered surface files, and calcula-tions and interpretations made onthis data.6 Finally, technical improvementsare expected in the future in bothLIDAR hardware and point cloudprocessing software and guidanceis needed on the direction andtimeliness of these improve-ments as they pertain to specificfield applications.
ReferencesSome references on Split FX andon using LIDAR for rock masscharacterisation are given below. Abeta version of Split FX, along withtutorials, are available free at www.spliteng. corn.
Donovan J, Handy J, Kemeny J and O'rienG (2005a). Automatic acquisition and deter-
mination of rock discontinuity propernes usingthree-dimensional laser scanning. Proceedingsof applications of computers and operationsresearch in the mineral industry (APCOM 2005),S Dessureault Editor, Tucson, AZ.Donovan J, Kemeny J, and Handy J (2005b)The application of three-dimensional imagingto rock discontinuity characterization, AlaskaRocks 2005: The 40th US Symposium on RockMechanics Anchorage AL.Kemeny J, Monte J, Handy J and Thiam S(2003).The use of digital imaging and laser scanningtechnologies in rock engineenng. Internationalsymposium on the fusion technolgy of geosystemengineering, Rock engtneermg and geophysicalexploration, Seoul, Korea, Nov )8-)9, 2003Kemeny J, Handy J, Donovan J and Thiam S(2004) Automatic discontinuity charactenzation ofrock faces using 3D laser scanners and dqptal imag-
mg, Gulf Rocks 2004 (ARMA 2004 Rock mechan-
ics symposium and 6th NARMS), Houston, TX.Nasrallah J, Monte J and Kemeny J (2004). Rockmass characterization for slope/catch benchdesign using 3D laser and digital imaging, GulfRocks 2004 (ARMA 2004 Rock mechanics sym-
posium and the 6th NARMS), Houston, TXPoboline (2005). 2005 3D Laser ScannerHardware Zk Software Surveys, www.pobonline.corn/FILES/HTML/ProductSurveys/Priest SD (1993).Discontinuity analysis for rockengineering. London: Chapman and Hall.Slob S, Hack R, van Knapen B, Turner K and
Kemeny J (2004). Automated identification and
charactenzation of discontmuity sets in outcrop-
ping rock masses using 3D tenestrial laser scan sur-
vey techniques, Proceedings of Eumck 2004 and
53rd Geomechanics colloquy, Salzburg, AustriaSlob S, Hack R, van Knapen B and Kemeny J(2005). A method for automated discontinuityanalysis of rock slopes with 3D laser scanning,Procecdmgs of the Transportation Research Board(TRB) 84th annual meetmg, Washington, DC
I W'
ri'
0 15 30 45 60 75 90 105 120 135 150 165 180Degrees
Figure 9: Comparison of actual trace orientations in the outcrop inFigure 8 with the projection of the five fracture sets found from thepoint cloud in Figure 6.
)
4
/7
50 manual measurements
Figure 11:Comparison betweenfield and LIDAR-generatedresults at the site in Figure 7.
-generated results
Figure 10:Field site nearTucson, Arizona where bothmanual measurements andLIDAR surveys were conducted.
GROUND ENGINEERING NOVEMBER 2005 29