robust growth and the strong dollar set pattern for 1983
TRANSCRIPT

Robust growth and the strong dollar set pattern for 1983 import and export prices Declining energy costs, the slower pace of recovery abroad, and developing nations' efforts to service heavy international debt loads were also important factors in price developments; a new all-commodities export price index was published for the fourth quarter
MARK J . JOHNSON
U .S . import prices, as measured by the International Price Program of the Bureau of Labor Statistics, fell 2.4 percent in 1983 . (See table 1 .) Declining energy prices and the continued appreciation of the dollar against other currencies pulled prices downward, although the robust U .S . economic recovery placed some upward pressure on prices . The drop in U .S . import prices was an important factor in the slow-down of domestic inflation in 1983, as measured by the Consumer Price Index and the Producer Price Index . The U .S . all-commodities export price index, which was
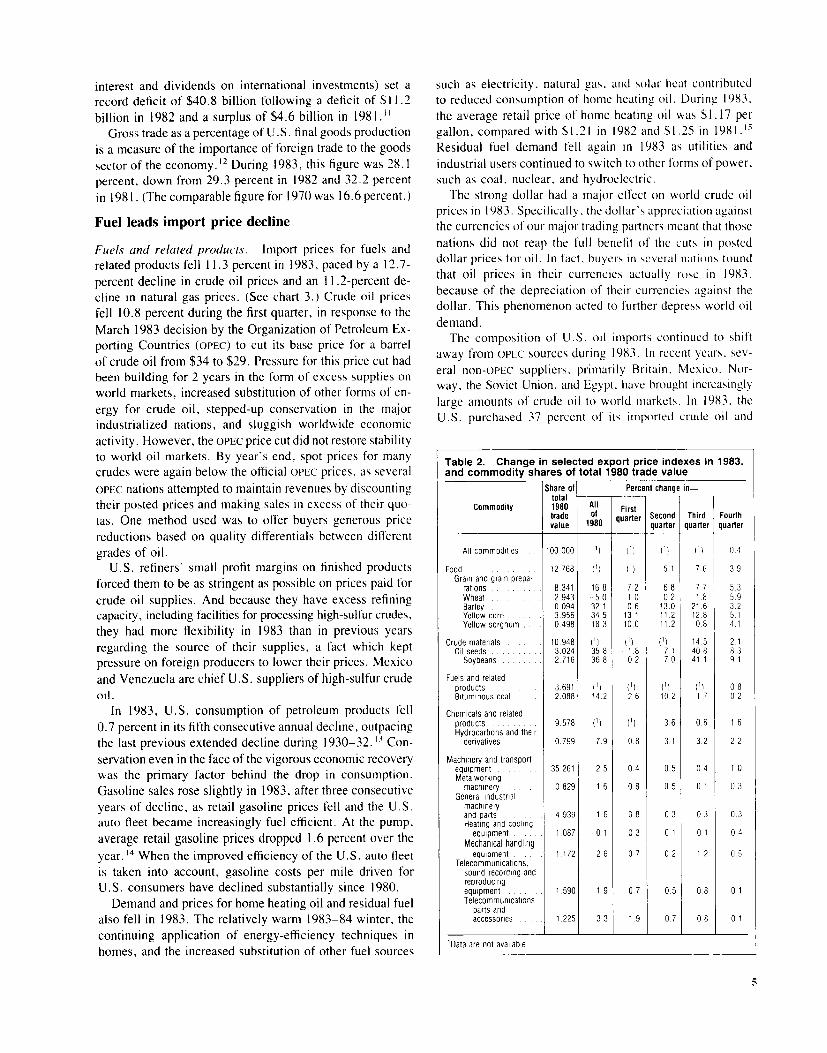
published for the first time with the release of fourth-quarter 1983 data, fell 0 .4 percent during the last 3 months of the year . (See table 2 .) The new all-export index provides full coverage of U .S . merchandise exports ; services and military goods are not included . Key individual export price indexes showing increases in 1983 were those for grain and for machinery and transport equipment . while the index for bituminous coal exports declined 14.2 percent . Export prices were greatly influenced by the strong U .S . dollar, the rel-atively slow pace of economic recovery abroad, and reduced
Mark J . Johnson is an economist in the Division of International Prices . Bureau of Labor Statistics .
demand for U .S . products by developing nations with heavy international debt loads . The price indexes discussed in this article are not sea-
sonally adjusted, and are based on transaction price infor-mation provided by a sample of U.S . importers and exporters . They represent 100 percent of the value of all imported and exported products . Indexes are published for detailed and aggregate categories of imports and exports .'
General import and export trends Because energy prices account for approximately one-
third of the weight of the all-import price index, their 11 .3-percent decline during 1983 was a major factor in the drop in this index . When energy products are excluded, U .S . import prices rose 2 .1 percent . This increase was led by the indexes for intermediate manufactures and for machinery and transport equipment, which rose 3.7 and 2 .5 percent, respectively .
The strong U .S . economic recovery in 1983 also had a major impact on import prices . The recovery was fueled by consumer spending, as personal consumption expenditures rose 8 .4 percent above 1982 levels .z Some of this increased spending was for imported goods . Of particular importance were sales of interest rate-sensitive items such as autos,

MONTHLY LABOR REVIEW April 1984 " /983 Import and Export Prices
Table 1 . Change in selected import price indexes in 1983, and commodity shares of total 1980 trade value Share of Percent change in- Share of Percent change in- total total
Commodity 1980 All of First Second Third Fourth Commodity 1980 All of First Second Third Fourth trade value
1983 quarter quarter quarter quarter trade 1983 quarter quarter quarter quarter value
All commodities . . . . . 100.000 -2 .4 -2 .8 0.2 -0 .3 0 .5 Intermediate man- ufactured products . . . 13 .520 3.7 1 .3 1 .6 0 .8 0.0 All commodities Nonmetallic min- except fuels eral manufactures . . . 1 .944 6.1 3.1 2 .8 0 .1 0.0 and related Precious and
products . . . . . . . . 67 .223 2.1 1 .0 1 .0 0 .4 0.5 semiprecious
food t
6.554 3.8 1 .1 0.1 1 .3 1 .2 stones, and pearls . . . . . . . . . 1 .127 (1) (1) (1) (') (') Mea . . . . . . . . . . . . . . 0 .977 -6 .5 -1 0 -2 .9 1 .1 3 .8 Diamonds cut
Meat of bovine ,
and polished . . 0 .937 11 .9 3 .9 6 .3 2 .6 -1 .2 animals . . . . . . . . . 0.652 -1 .1 2 .8 3.6 -0 .5 -6 .7 Iron and steel 3.127 1 .8 -2 .0 -0 .3 0 .2 3 9 Other prepared . . . . . . . Nonferrous metals . 3 .123 10 .2 6.9 5 .8 2 .2
. -4 .5 or preserved Silver, platinum, and
meat . . . . . . . . . . . 0 .234 -- 13 .0 -3 .2 11 .0 1 .7 0 .8 other metals of the Sugar, sugar platinum group . 1 .037 6.0 13 .6 3 .0 4 .4 -13.3
preparations, Copper . . . 0.581 6.3 7.6 8 .2 -1 .1 -7 .7 and honey . . . . . . . . . 0.925 4 .5 0.0 3.9 1 .5 -0 .8 Zinc . . . . . . . . . . . . 0.135 19 .4 -1 .2 0 .1 7 .2 12 .6
Coffee, tea, and Machinery and cocoa . . . . . . . . . . . . 2.241 17 .8 2.2 1 .7 4.0 9.0 transport equipment . . . 25 .442 2.5 1 .8 0 .8 -1 .2 1 .2 Coffee and coffee Office machines
substitutes . . . . . . . 1 .746 6.8 -2 .5 0.7 0.9 7.7 and automatic Coffee . . . . . . . . . . 1 .644 7.9 -2 .8 1 .3 0.7 8.7 data processing
Tea and mate . . . . . . . 0.054 42 .8 4.8 4.8 1 .8 27 .7 (ADP) equipment . . . . 1 .217 4 .1 2 .6 -0 .2 -1 .4 3.1 Tea . . . . . . . . . . . . 0.054 43 .0 4.8 4.7 1 .9 27 .8 Parts for ADP
equipment . . . . . 0.431 10 .7 5.9 0.0 -0 .3 4.8 Fuels and related Telecommunications
products . . . . . . . . . . . . 32 .776 -11 .3 -10 .2 1 .6 -0 .1 0 .5 equipment . . . . . . . . 2785 -1 .2 0 .6 0 .5 -0 .7 -1 .7 Crude Electrical ma-
petroleum . . . . . . . . . 25 .799 -12 .7 -10.8 -2 .3 -0 .5 0 .7 chineryand Gas, natural and equipment . . . . . . . . 3.396 -1 .2 -0 .5 1 .9 -2 .0 -0 .5
remanutactured . . . . . . 2.069 (') (1) (1) (t) (1) Road vehicles Natural gas and and parts . . . . . . . . . 10 .887 4 .1 1 .7 0.4 -0 .7 2.6
liquified natural Passenger auto- gas . . . . . . . . . . 1 .642 -11 .2 -0 .2 -10.2 8.4 8.2 mobiles . . . . . . . . 7.201 4.9 1 .3 0.6 -0 .4 3.3
t0ata are not available .
housing, and consumer durables, which showed substantial increases over 1982 levels : 1983 auto sales were 15 percent above 1982 levels, and housing starts, up 60.3 percent over 1982, reached their highest level since 1979.; This increased activity stimulated demand for a host of related commodi-ties, many of them imports . For example, auto production spurred demand for such imported items as steel, aluminum, rubber, and engines, while the increase in housing starts boosted sales for foreign suppliers of lumber, copper, and appliances .
Recent years have seen a substantial appreciation of the dollar against the currencies of our major trading partners . From its low in July 1980 to December 1983, the dollar's trade-weighted exchange rate rose 33 .5 percent.' (See chart 1 .) Over the same period, the dollar rose 617 .2 percent against the Mexican peso, 106.7 percent against the French franc, 57.4 percent against the German Deutschemark, and 6 .1 percent against the Japanese yen.' This appreciation made imports less expensive while driving up the price of U.S . exports in foreign markets. (See chart 2 .)
Worldwide economic recovery lagged that of the United States, further dampening demand for U.S . exports. U.S . merchandise exports were $200 .0 billion in 1983, down 5.3 percent from 1982.6 In particular, many developing nations
experienced debt problems that forced them to cut back on purchases of U.S . goods. For example, Mexico, our third largest trading partner, purchased only $9 .1 billion of U.S . goods in 1983, compared with $11 .8 billion in 1982 and $18 .2 billion in 1981 . Other important U .S . trading part-ners with debt problems were Brazil, Argentina, and Bo-livia. Several OPEC nations were forced to curb imports as oil revenues declined . Furthermore, many of our major trad-ing partners in Europe, especially West Germany, Britain, and France, experienced little economic growth in 1983 . The decline in U.S . merchandise exports was a key factor in the record $60.6 billion 1983 merchandise trade deficit, which far surpassed the previous high of $36 .4 billion in 1982 .8 Widening the merchandise trade gap was growth in de-
mand for imports by U.S . consumers and producers as the Nation led economic recovery from the worldwide reces-sion . U .S . 1983 merchandise imports were $260.6 billion, 5.2 percent more than in 1982 .9 Although crude oil imports fell to $36 .8 billion in 1983 (from $45.9 billion in 1982), demand for nonoil imports rose sharply, by 10.9 percent, to $206.8 billion." Moreover, the U.S . current account, which incorporates the balance on merchandise trade and the balance on services (including payments and receipts of
interest and dividends on international investments) set a record deficit of $40 .8 billion following a deficit of $11 .2 billion in 1982 and a surplus of $4.6 billion in 1981 .''
Gross trade as a percentage of U.S . final goods production is a measure of the importance of foreign trade to the goods sector of the economy. II During 1983, this figure was 28 .1 percent, down from 29 .3 percent in 1982 and 32 .2 percent in 1981 . (The comparable figure for 1970 was 16.6 percent.)
Fuel leads import price decline
Fuels and related products . Import prices for fuels and related products fell 11 .3 percent in 1983, paced by a 12 .7-
percent decline in crude oil prices and an 11 .2-percent de-cline in natural gas prices . (See chart 3 .) Crude oil prices fell 10.8 percent during the first quarter, in response to the
March 1983 decision by the Organization of Petroleum Ex-porting Countries (OPEC) to cut its base price for a barrel of crude oil from $34 to $29 . Pressure for this price cut had been building for 2 years in the form of excess supplies on world markets, increased substitution of other forms of en-
ergy for crude oil, stepped-up conservation in the major industrialized nations, and sluggish worldwide economic activity . However, the OPEC price cut did not restore stability to world oil markets . By year's end, spot prices for many crudes were again below the official OPEC prices, as several
OPEC nations attempted to maintain revenues by discounting their posted prices and making sales in excess of their quo-tas . One method used was to offer buyers generous price reductions based on quality differentials between different grades of oil . U .S . refiners' small profit margins on finished products
forced them to be as stringent as possible on prices paid for crude oil supplies . And because they have excess refining capacity, including facilities for processing high-sulfur crudes, they had more flexibility in 1983 than in previous years regarding the source of their supplies, a fact which kept pressure on foreign producers to lower their prices . Mexico
and Venezuela are chief U .S . suppliers of high-sulfur crude oil .
In 1983, U .S . consumption of petroleum products fell 0.7 percent in its fifth consecutive annual decline, outpacing the last previous extended decline during 1930-32 .13 Con-servation even in the face of the vigorous economic recovery was the primary factor behind the drop in consumption . Gasoline sales rose slightly in 1983, after three consecutive years of decline, as retail gasoline prices fell and the U.S . auto fleet became increasingly fuel efficient . At the pump, average retail gasoline prices dropped 1 .6 percent over the year . l4 When the improved efficiency of the U.S . auto fleet is taken into account, gasoline costs per mile driven for U.S . consumers have declined substantially since 1980 . Demand and prices for home heating oil and residual fuel
also fell in 1983 . The relatively warm 1983-84 winter, the continuing application of energy-efficiency techniques in homes, and the increased substitution of other fuel sources
such as electricity, natural gas . and solar heat contributed to reduced consumption of home heating oil . During 1983, the average retail price of home heating oil was $1 .17 per gallon, compared with $1 .21 in 1982 and $1 .25 in 1981 .'5 Residual fuel demand fell again in 1983 as utilities and industrial users continued to switch to other forms of power, such as coal, nuclear, and hydroelectric . The strong dollar had a major effect on world crude oil
prices in 1983 . Specifically, the dollar's appreciation against the currencies of our major trading partners meant that those nations did not reap the full benefit of the cuts in posted dollar prices for oil . In fact, buyers in several nations found that oil prices in their currencies actually rose in 1983, because of the depreciation of their currencies against the dollar . This phenomenon acted to further depress world oil demand . The composition of U .S . oil imports continued to shift
away from OPEC sources during 1983 . In recent years . sev-eral not suppliers, primarily Britain, Mexico, Nor-way, the Soviet Union, and Egypt, have brought increasingly
large amounts of crude oil to world markets . In 1983, the U .S . purchased 37 percent of its imported crude oil and
Table 2. Change in selected export price indexes in 1983, and commodity shares of total 1980 trade value
Share of Percent change in-
Commodity total 1980 All First trade quarter Second Third Fourth value 1980 quarter quarter quarter
All commodities . 100 000 (') (') (1) (') 0-4
Food . . . . . . . . 12 768 () (') 5 1 7 6 3-9 Grain and grain prepa-
rations . . . . . . . . . . 8 .341 16 8 7 2 6 8 7 7 5 3 Wheat . . . . . . 2 .943 5.0 1 0 0 2 1 .8 5 9 Barley . . . . . . . . 0 .094 32 1 0 6 13 .0 21 6 3 2 Yellow corn . 3 .956 34 .5 13 .1 11 .2 12 .8 5 .1 Yellow sorghum . . . . 0 498 18 3 10 0 11 2 0 8 4 .1
Crude materials . . . . 10 948 (1) (r) (') 14-5 2-1 Oil seeds . . . . . . . . 3 024 35 8 1 8 7 1 40 8 8 3 Soybeans 2 716 36 8 0 2 7 .0 41 1 9 1
Fuels and related products . . . . . . . 3.691 (') (1) (') (1) 0 8 Bituminous coal 2 088 14 2 2 6 10 2 1 7 0 2
Chemicals and related products . . . . . . . 9.578 (r) (1) 3.6 0.6 1 6 Hydrocarbons and their
derivatives . . . . . . . 0 .799 7 9 0 8 3 .1 3 2 2 2
Machinery and transport equipment 35 .261 2 5 0 4 0 .5 0 4 1 0 Metalworking
machinery 0 829 1 6 0 8 0 5 0 1 0 3 General industrial
machinery and parts 4 939 1 6 0 8 0 3 0 3 0 3 Heating and cooling equipment . . . 1 087 0.1 0 3 0 1 0 1 0 4
Mechanical handling equipment . . . 1 .172 2 6 0 7 0 2 1 2 0 5
Telecommunications, sound recording and reproducing equipment . . . . . . 1 .590 1 9 0.7 0 5 0 8 0 1 Telecommunications
parts and accessories 1 .225 3 3 1 .9 0 .7 0 8 0 1
1Data are not available .


Chart 2 . Quarterly U .S . dollar machinery and transportation
180
170 -
160-
150-
140-
130 -
120-
110 -
100
90 1979 1980
and foreign currency equipment, 1979-83
Foreign Currency Prices
1981
NOT f The U S dollar index reflects dollar prices received by U S exporers pubes paid for U S exports by foregn buyers
1982 1983
T7e foreign currency index is based on foreign currency
coupcF Bureau of Labor Statistics based on data from the Bureau and from the Morgan Guaranty Trust Co
sponse to drought-induced feed shortages . The index for other prepared or preserved meat, which includes canned hams and shoulders, fell 13 .0 percent for the year, as abun-dant supplies of pork continued to hold down prices world-wide . Pork prices also were affected by the scarcity of corn and feed grains, which precipitated greater domestic hog slaughters . In 1983, Denmark continued to increase its lead over Poland as the major supplier of pork products to the United States . In 1981, Denmark had exported 26 percent more ham and shoulders to the United States than Poland, but by 1983, Danish exports of such products were ap-proximately double the Polish volume . =' Demand for, and prices of, imported chickens increased late in the year, as a deadly form of avian influenza decimated U .S . flocks .
Rising demand and limited supplies resulted in higher prices for imported sugar . Due to adjustments in Federal quotas on sugar imports, 10 .5 percent less sugar was im-ported in 1983 than in 1982 ."- This development, combined with an increase in demand, boosted sugar prices . Further-more, imports of certain types of sugar-containing formu-lations, which had been entering the country through a loophole in the existing quotas, were banned in June, further cutting supplies . Moderating prices somewhat was the com-mercial introduction of the new low-calorie sweetener, as-partame, by several major soft-drink manufacturers . This
price indexes for U .S . exports of
Dollar Prices
tended to dampen speculative activity in sugar, as the use of aspartame, a close sugar substitute, decreases sugar con-sumption .
Intermediate manufactured products . Prices for interme-diate manufactures rose 3 .7 percent in 1983 . These products include nonferrous metals, wood, cork, textiles, iron and steel, glassware, paperboard, and many other basic inputs to manufacturing processes . The increase in the intermediate manufactures index was led by a 10 .2-percent advance in nonferrous metals prices and a 6.1-percent price rise for nonmetallic mineral manufactures . Tempering these in-creases was a 1 .8-percent increase in prices for imported iron and steel .
After rising 13 .0 percent in the first half of 1983, the nonferrous metals index fell in the second half as silver and copper prices dropped on world markets . Because nonfer-
rous metals, which also include aluminum, zinc, nickel, and
lead, are used extensively as basic inputs in many manu-
facturing processes, their prices are heavily affected by the level of general economic activity . During 1982, a year of worldwide recession, prices for several of these metals (most notably copper, lead, zinc, and nickel) had remained ex-tremely low . In 1983, the buoyant U .S . economic recovery had a large positive effect on prices of those metals which

MONTHLY LABOR REVIEW April 1984 . 1983 Import and Export Prices
are used heavily in the production of consumer goods, such as aluminum and zinc . However, metals for which demand is dependent on the level of capital spending (such as copper) or speculation (such as silver) did not fare as well ; in the case of several, most notably copper, lead, and nickel, world prices remained below production costs for some producers. The economic recovery's uneven effect on metals prices
is especially evident when contrasting copper and alumi-num . During 1983, import prices for copper rose 6 .3 per-cent, while aluminum prices rose 21 .2 percent. For most of the year, aluminum sold at a premium to copper, a marked reversal of the historical price relationship between the two metals . Copper prices had sunk to low levels in 1982, but rose
quickly on world markets in early 1983, as increased spec-ulative activity led many users of the metal to purchase hedge stocks in anticipation of a strong pickup in con-sumption. However, world copper consumption in 1983 was slightly less than in 1982, and there was no significant increase in purchases by the U.S . capital goods sector, a major copper user . In the meantime, several Third World nations, especially Chile, Mexico, and Zambia, stepped up output in order to acquire foreign exchange, and 1983 world copper production rose slightly above 1982 levels . Through-out the year, there was a growing copper surplus on world
markets, such that, in November, inventories in London Metals Exchange warehouses were at their highest level in 5 years.23 As a result of these factors, world copper prices fell to their 1982 levels by year's end.
In contrast, market prices for some aluminum products in late 1983 were double the discounted prices offered by aluminum firms during the preceding year . Demand for aluminum soared as consumers stepped up purchases of autos, homes, and appliances . As demand increased, U.S . imports of the metal also rose." Zinc prices rebounded during 1983, advancing 19 .4 percent for the year and 20.7 percent in the second half . U .S . zinc consumption was up strongly over the previous year's levels, reflecting increased use of galvanized steel by the auto industry . In addition, a tightening of supplies on world markets and a decrease in domestic primary zinc production capacity buoyed demand for imports. Slab zinc imports in 1983 were 33 .8 percent above 1982 levels .z5
The import price index for silver and metals of the plat-inum group, which carries one-third of the weight of the nonferrous metals index, rose 6 .0 percent in 1983, as silver prices fell 6 .1 percent and platinum group prices advanced 23 .2 percent . Early in the year, silver prices rose rapidly on world markets as the U.S . economy expanded and inves-tors speculated heavily in the metal. However, as interest
Chart 3 . Monthly OPEC and non-OPEC price indexes for U .S . imports of crude petroleum, 1979-83 (June 1977=100)
300
250 -
200-
150-
-300
- 250
-200
-150
100 100 1979 1980 1981 1982 1983

rates rose and oil prices fell, speculative activity in silver cooled, and industrial demand for silver did not increase appreciably over the year . As a result, world silver prices were lower at the end than at the beginning of the year . The 1983 price increase for the platinum metals group was led by sharply rising palladium prices, reflecting strong demand from manufacturers of computers, electronics, autos, and dental supplies . Furthermore, palladium supplies were tight as South Africa and the Soviet Union curbed exports . How-ever, declining silver prices helped pull down platinum prices in the second half, when the abatement of silver speculation led to falling prices for platinum futures. As with nonferrous metals, steel prices were heavily in-
fluenced by large supplies of imports . In 1983, the U .S . steel industry struggled to recover from its worst slump since the Great Depression, but production, while up from 1982 levels, remained depressed for the third straight year . De-mand for sheet steel was buoyed by increased sales of autos and appliances, but production of heavier items such as plate, structural, and bar steels continued at low levels pend-ing a revival of business capital spending . While imported steel (in tonnage) took 20.5 percent of the U .S . market in 1983, down slightly from 21 .8 percent in 1982 (chart 4), a larger percentage of steel imports than in previous years came from Third World nations .' (See chart 5 .) Supplies of steel from Japan and the European Economic Community (EEC) were limited by trade agreements negotiated in 1982 .
Fully integrated U.S . steel firms faced stiff competition both at home and abroad, as they found it difficult to match the prices offered by foreign firms and by domestic mini-mills . A factor in the competitive problems of U .S . firms was their pace in adopting continuous casting, a process which improves product yield, cuts energy use, and boosts labor productivity . One-fourth of the Nation's steel output is continuously cast, compared with 86 percent in Japan and 61 percent in Europe .2' Conventional U.S . firms have higher costs than producers in Europe, Japan, and the Third World, and many major integrated domestic firms also car-ried a surplus of high-cost, company-owned iron ore ca-pacity . Finally, the subsidization of some foreign steel producers by their governments added to the competitive difficulties of U .S . steelmakers . A major factor in the increased shipments of Third World
steel in 1983 was the debt situation of several nations which are steel producers . For example, Mexico, Argentina, and Brazil-all major U .S . steel suppliers in 1983-aggres-sively sought U .S . sales to obtain foreign exchange for servicing their international debts .
American steel firms continued to deal with their com-petitive difficulties vis-a-vis foreign producers by shedding excess capacity, cutting labor costs, and concentrating on profitable product lines . For example, U .S . Steel Corp . announced in December that it would close one-fifth of its steelmaking capacity . Domestic companies also continued to press the Federal Government for restrictions on low-
priced steel imports from Third World nations . No major restrictions were placed on imports from these nations dur-ing 1983, although in July, a 4-year system of quotas and tariffs was imposed on imports of certain specialty steels, most of which originate in European and other industrialized nations .
's
Many firms viewed mergers with other domestic firms or joint ventures with foreign firms as a way to remain com-petitive . In September, for example, LTV Corp . and Re-public Steel Corp . announced plans to merge, thereby creating the second-largest U .S . steel firm . Both firms planned to achieve production economies by consolidating the best parts of their firms and discarding less-efficient divisions . 29 Sev-eral U .S . firms were also actively involved in foreign joint ventures that provided for the importation of lower-cost semifinished steel for finishing in domestic mills." The rise in prices for nonmetallic mineral manufactures
was led by an 11 .9-percent increase in prices for cut and polished diamonds . During the 1981-82 recession, prices for large stones (those greater than one carat) fell more than those for small stones . With the recovery in 1983, shortages of several types of diamonds developed, and prices quickly rose for the larger stones . Price increases for larger stones were influenced by the market strategy of DeBeers (a South African firm that is the world's largest producer of dia-monds), which consists of advertising such stones aggres-sively while holding down their production and distribution .;
Machinery and transport equipment. This index, which accounts for 25 .4 percent of the weight of the all-import price index, rose 2.5 percent in 1983, after falling 1 .3 per-cent during the preceding year . Some $88 .9 billion of mer-chandise in this category was imported during the year, compared with $75 .7 billion in 1982, as the economic re-covery fueled demand . ;2 Much of the dollar value in this index consists of consumer end-use products such as autos, personal computers, and household appliances . As con-sumer spending increased, purchases of these types of items rose . The index also includes many important components of manufacturing processes, such as electric motors . air pumps, compressors, valves, and roller bearings, for which demand grew with U.S . manufacturing output . However, the continued appreciation of the dollar served to moderate price increases in the index .
Prices for imported autos rose 4.9 percent in 1983 . The Japanese Government's voluntary self-restraint quotas, which limited auto exports to the United States to 1 .68 million units per year, and the robust increase in U .S . retail auto sales in 1983 were factors which affected import car prices . Lower interest rates, higher levels of employment, the in-troduction of new models, stable gas prices, and the im-proving economy boosted 1983 U .S . retail auto sales to 9 .2 million from 8.0 million in 1982 . Import penetration of the U.S . market was 26 .0 percent, down from 27 .9 percent in 1982 ." Retail sales were held down by short supplies of

MONTHLY LABOR REVIEW April 1984 a 1983 Import and Export Prices
both imported and domestic autos, the result of overly con-servative production by the major U.S . automakers and the quotas on Japanese imports. Sales of larger cars were es-pecially brisk . Having lowered their break-even output sub-stantially since 1980, U.S . automakers posted record combined profits in 1983 .
Import quotas for Japanese autos put upward pressure on the prices of these cars . During 1983, Japanese cars ac-counted for 20 .9 percent of all U.S . new-car sales, down from 22 .6 percent in 1982 . Because of the quotas, Japanese automakers were unable to maintain or increase their market share by fully exploiting a cost advantage estimated at $1,500 to $2000 per car. Instead of competing on price, Japan's carmakers concentrated on selling higher-valued, option-laden cars in the United States, in effect providing a pricing floor for the domestic industry ." During 1983, the Japanese Government agreed to extend the quotas for another year, starting in April 1984. The new quota was set at 1 .9 million cars per year, with the bulk of the cars being supplied by the five Japanese carmakers with extensive dealer networks in this country . Three Japanese firms which are not well-established in the United States were assigned much smaller export quotas . The quotas provided an incentive for many of the joint
ventures undertaken by U.S . and foreign auto firms in recent years. The ventures were generally of two types. The first
is an agreement by which a domestic auto firm gains a license to sell a model built by its foreign venture partner in the United States . In the second case, an agreement is reached in which a U.S . firm and its overseas partner join forces to design, produce, and market a car.
Prices for imported electric equipment and machinery fell 1 .2 percent in 1983 . Prices for semiconductor materials and devices, such as silicon wafers and chips, led the decline in this index. Microcircuit prices dropped as competition among American, Japanese, and European producers inten-sified, and as technological advances and economies of scale lowered production costs. Additionally, weak expenditures for capital equipment and commercial construction in this country had a negative impact on the demand for many types of electric equipment. The recovery in the U .S . res-idential housing and appliance manufacturing industries helped to mitigate the downward movement of prices in this index, and growing sales of military equipment boosted demand for many types of electric and electronic components . In recent years, the U .S . trade balance for electrical machinery has steadily worsened : In 1980, the Nation posted a trade surplus of $2.2 billion for these items, but in 1983, it reg-istered an $892.4 million trade deficit.35 Import prices for office machines and automatic data pro-
cessing (ADP) equipment rose 4 .1 percent in 1983 . Leading this increase was a 10.7-percent advance in the index for
Chart 4.
Percent
Quarterly import share of U .S . stee l market, 1979-83
Percent
25 -1 r 25
20- 1-20
15 -I -15
10 r __1 +10 1979 1980 1981 1982 1983 1984
SOURCE American Iron and Steel Institute
10

Chart 5. U.S . imports of steel mill products by origin, 1980 and 1983
1980 1983
SouRcE : American Iron and Steel Institute.
parts for ADP equipment and office machines . This increase reflects the inelastic demand for many of these items. U .S . demand for computers, especially personal computers, re-mained at high levels throughout 1983 . U .S . consumers had a wide range of personal computers to choose from as do-mestic and overseas firms placed an array of new models on the market . Aided by the strong dollar, foreign firms continued to erode the U .S . trade surplus in ADP equipment in 1983 . To remain price competitive, many U.S . firms farmed out their manufacturing operations to overseas firms .
Import prices for telecommunications equipment fell 1 .2 percent in 1983 after a 6 .8-percent decline in 1982 . Sales of imported video-cassette recorders (V(-R's) boomed during the year as foreign firms cut prices . And although more than 98 percent of all U.S . households have at least one television set, increased sales of home computers gave a boost to sales of imported color sets, which may be used for video display of computer output .
Exports reflect strong dollar
Grain . Grain, which consists mainly of corn, wheat and sorghum, accounted for export sales of $15.2 billion in 1983 against $14.7 billion in 1982 .3' Export prices for grain rose 16.8 percent in 1983, after declining 7 .3 percent during the preceding year . Prices for corn increased 34.5 percent, while soybean prices rose 36.8 percent and barley prices were up
32 .1 percent . Wheat prices fell 5 .0 percent, moderating the increase in the grain index . These results were greatly in-fluenced by a blistering summer drought-the Nation's worst since the 1930's-in combination with the U .S . Payment in Kind (PIK) Program, which was implemented in January 1983 . Under PIK, the government provided surplus wheat, corn, rice, cotton, and sorghum to farmers who agreed to reduce their plantings of the same commodities. The purpose of the program was to draw down surplus grain stockpiles .
Farmers took advantage of the PIK program to idle 46 .6 million acres of cropland, more than twice the number an-ticipated. Together with other Federal programs, PIK brought about the retirement of about 82 million acres in 1983, the largest reduction ever .31
While PiK induced farmers to reduce production, the se-vere drought ravaged many of the crops that were planted. The 1983 corn crop was less than half of the year-earlier output and the smallest since 1965 ." The drought caught soybean plants at a crucial point in their growth cycle. As a result, the 1983 soybean harvest was 3 1 percent below 1982 levels, and 1983 soybean exports lagged those of the preceding year by 21 percent .39 (Although soybeans were not directly covered by PIK, the program indirectly affected soybean surplus and export supply levels by curtailing sup-plies of corn .) With corn and soybeans in short supply, their prices were quickly bid up on world commodities markets .
11

MONTHLY LABOR REVIEW April 1984 e 1983 Import and Export Prices
Livestock farmers turned to barley and sorghum as substitute feed grains, and prices for these commodities also rose sharply. Wheat yields and prices were not heavily influenced by the drought. Although the number of acres planted in wheat was reduced by PIK, the 1983 harvest was down just 6 .2 percent from the 1982 historical high because U.S . farmers produced record yields per acre . The huge wheat surplus in U.S . silos also held prices down .4° During 1983, U.S . grain exporters faced stiff competition
in foreign markets from producers in Canada, Australia, Argentina, and the EEC. However, U.S . exporters gained business through trade agreements reached during the sum-mer with the Soviet Union and the People's Republic of China. Under the new U.S .-Soviet grain pact, which lasts through late 1988, the Soviet Union may buy as much as 12 million tons of U .S . grain per year . For its part, China lifted the restrictions it had placed on U.S . grain imports earlier in 1983, when textile trade talks between the two nations broke down, and resumed imports under a long-term agreement calling for purchases of 6 million tons of U.S . grain annually through 1984.41
Coal . Export prices for coal fell 14 .2 percent in 1983, as world demand for coal continued to slacken. The drop in export prices and a 27 .0-percent decline in the quantity of coal exported represented a double blow to U .S . coal pro-ducers' revenues .42
Poland, South Africa, and Australia were major U.S . competitors in foreign coal markets . Because the mining industry in these nations is government-controlled, these nations were able to set their coal prices below U .S . "de-livered-cost basis" prices . As a result, many U.S . firms were operating at or below break-even levels by year's end. In addition, most domestic producers were burdened by inland freight costs accounting for one-fourth to one-third of their export prices .43 The failure of these freight costs to decline during the year further eroded the competitive po-sition of U.S . coal exports.
Prices for bituminous coal used in the production of steel showed the greatest decrease . In the spring of 1983, Jap-anese buyers, who constitute the largest market, negotiated new contracts with U.S . firms that lowered existing prices by 12 to 20 percent .44 Prices for metallurgical coal exported to other nations also fell, but by lesser amounts. Steam coal, used for generating electricity, also declined in price because of reduced worldwide demand for electricity and sharp com-petition from other coal-exporting nations.
Chemicals. The export price index for chemicals, which was first published in the second quarter of 1983, declined 1 .4 percent over the last nine months of the year . Prices fell 3 .6 percent in the second quarter, but rose during the third and fourth quarters . In 1983, U .S . firms exported $19.75 billion of chemicals, down slightly from $19.89 billion in 1982.45 From late 1981 to early 1983, chemicals
prices dropped worldwide as the international economy en-tered a recession . U .S . firms responded with agressive cost-cutting measures, shutting many of their marginal opera-tions . Such strategies lowered the industry's break-even point from 75 percent of capacity utilization in early 1982 to 65 percent by the end of 1983 . As a result, demand for chem-icals rose quickly, and by year's end, U.S . chemicals firms were operating at 75 percent of capacity and posting healthy profits .46
The world market for chemicals has become increasingly competitive in recent years . Several Third World nations, especially those that are major oil exporters, have invested heavily in chemical production capacity . Oil producing na-tions have a comparative advantage in production resulting from the ready availability of low-cost petroleum feed-stocks . In particular, Saudi Arabia, Kuwait, and Mexico have greatly expanded capacity in recent years, and are competing strongly with U.S . firms in world chemicals mar-kets .47 Canada and several European nations have also added chemical production capacity in recent years .
Machinery and transport equipment . Machinery and transport equipment is the largest U.S . export group, ac-counting for 35.3 percent of the value in the all-commodities export price index . Many of the products in this group, such as computers, electronic components, and telecommuni-cations equipment, require a high degree of technical so-phistication, and U.S . firms have a comparative advantage in their manufacture.
Prices for machinery and transport equipment advanced 2.5 percent for the year, after rising 3.9 percent in 1982 . Most aggregate indexes in this category showed only mod-erate 1983 price increases, as the strength of the dollar and continued slack demand abroad constrained both prices and sales volumes. Exports of machinery and transport equip-ment were $82.58 billion, compared with $87.15 billion in 1982 .4s
An important component of the machinery and transport equipment category is general industrial machinery and parts . This subgroup includes heating and cooling equipment, air pumps and compressors, and pumps and valves for liquids . The index for this group registered a 1 .6-percent increase in 1983, led by a 3.6-percent gain for pumps and com-pressors and a 2 .7-percent rise for nonelectric parts and accessories of machinery. U .S . manufacturers of general industrial machinery and
parts export large portions of their output, and were hurt during the year by the strength of the dollar, the low rate of capital spending in major export markets, and the con-tinued slump in the Third World economies. Export ship-ments in dollar value were off 19 percent from 1982 levels, and the rate of price increase in the export index between mid-1982 and December 1983 was considerably below that recorded for March 1979 to mid-1982 .49 The poor market reflected the implementation of austerity programs by France,
12

Brazil, Venezuela, and Mexico-all major importers of U .S . general industrial machinery and parts-and reduced pur-chases of heating and cooling equipment by several major
oil-producing nations as oil revenues fell . Under these con-
ditions, U .S . exporters were forced to compete aggressively
on nonprice factors such as quality, service, and delivery
time . Export prices for telecommunications equipment rose 1 .9
percent in 1983, paced by a 3 .3-percent increase in the index
for telecommunications parts and accessories . Overseas pro-
ducers have a significant cost advantage in the manufacture
of many consumer end-use items in the category, such as
radios, VCR's, televisions, and tape recorders . Conversely,
U .S . firms have a technological advantage in the production
of many types of equipment for commercial use, including PBX's, large radio and television broadcasting equipment,
and navigational equipment . The divestiture by The Amer-
ican Telephone and Telegraph Co . led several of its inter-
national competitors to market new types of telecom-
munications equipment in 1983, placing downward pressure on export prices . The export price index for metalworking machinery rose
1 .6 percent in 1983 . The bulk of the value in this index consists of machine tools-power-driven devices used to
cut, shape, or form metal in the production of durable goods . Because demand for machine tools is directly related to capital investment, price increases were moderated by weak
levels of capital spending in foreign markets, coupled with strong competition from overseas suppliers . Capital spend-ing in most major industrialized nations remained depressed
throughout 1983, although such spending in the United States began to rise in the fourth quarter.
In recent years, U .S . machine tool makers have had an increasingly difficult time matching the prices offered by competitors in Japan, West Germany, Taiwan, the United Kingdom, and Switzerland . Through October 1983, U .S . exports of machine tools totaled $330.5 million, 39 percent below the level reported for the first 10 months of 1982.5° Domestic producers led in the production of specialized machines, such as sophisticated numerically controlled ma-chine tools and machining centers, but were at a disadvan-
tage in the manufacture of standard machine tools, for which price is a more significant competitive factor . U .S . firms have also been hampered by an inability to generate enough capital from profits to invest in new plant and equipment . (Borrowing for capital improvement has not generally been a primary option for the U .S . machine tool industry because of its highly cyclical nature .)
Intense foreign competition continues to force major changes in the structure of the U .S . machine tool industry . These ch ;inges are desi,_ncd not only I() bolster the com-petitive position of exports, but also to stein the influx of imports into the domestic market . Imported machine tools captured an estimated 36 percent of the U .S . market in 1983, up from 28 percent during the preceding year and 3 .1 percent in 1958 .5t Throughout 1983, the domestic industry contin-ued to become more highly concentrated as companies with-drew, merged, entered joint ventures with foreign producers, and moved operations offshore to cut costs .
FOOTNOTES
At'KNOWEEt)CEMENT : The following economists in the Bureau's Division
of International Prices assisted in the analysis of the various indexes dis-
cussed in this article : Brian Costello, Todd Darr, David Friedman, Hans
Jorgensen, Mike Moore, Nicholas Peters, Mildred Tweedy, Paul Wash-
burn . David Wawro, Loren Yager, and Peter Zaleski . David Johnson .
Mark McEnearney, and Peter Zaleski of the Division prepared the graphics .
' Import price indexes are weighted by 1980 import values and are published on an f .o .b . (free-on-board) foreign port or c .i .f . (cost . insur-ance, and freight) U .S . port basis . Export price indexes are weighted by 1980 U .S . merchandise trade values and are published on an f .o .b . factory or f .a .s . (free-alongside-ship) U .S . port basis . See "International Price
Program" (Bureau of Labor Statistics) .
2 National Income and Product Account Tables (U .S . Department of
Commerce . Bureau of Economic Analysis, January 1983), table I . I .
"See U .S . Department o/Conunercc Ncir ., iw,s 84 I )o (U .S . Department of Commerce . Bureau of Economic Analysis), I-ch . 7, 1984, p. 2.
"Ibid .
"'Ibid, p . 3 .
"Summary of U.S . International Transactions (U .S . Department of Commerce . Bureau of Economic Analysis), March 19 . 1983, p. 2.
'=The share of final goods production that is accounted for by gross
trade (merchandise imports pl,i, merchandise exports) 1, calculated as :
Merchandise Imports + Merchandise export,
Sales of final goods + Merchandise imports x 100
It is computed using data from Surrey n/ Current Busine .c .s, various issues . 'U .S . Department of Commerce News, C20-8312 (U.S . Department of
Commerce, Bureau of the Census) . Jan . 8, 1984 .
4 World Financial Markets (New York, Morgan Guaranty Trust Com-
pany, International Economics Department) . January 1984, pp . 12-13 .
`For details of the value of the dollar against individual currencies, sec
federal Reserve Bulletin, January 1984, p . A66.
'For information on imports, exports, and trade deficits, see U .S . De-
partment of Commerce Netrs, BEA 84-06 (U .S . Department of Commerce, Bureau of Economic Analysis), Feb . 7. 1984, pp . 1-6.
'For 1981 and 1982 data, see Survev qt Current Business, June 1983, p. 44 . For 1983 data, see Highlights ol U.S . E.cport and Import Mer-
chandise Trade. FT 990 (U .S . Department of Commerce . Bureau of the
Census), December 1983, p. 32, table E-3 .
"See Robert J. Beck . "U.S . Demand . Imports to Edge Down : Pro-duction Rising," Oil and Gas Journal. July 25, 1983, p. 114: and Beck, "Demand and Imports to Rise in '84, Production to Slip," Oil and Gas Journal, Jan. 30, 1984, p. 95 .
"See Consumer Price Index far Gasoline, Consumer Price Inde.c far All Urban Consumers, usfx. 84-25 (Bureau of Labor Statistics) . Jan . 24,
1984 .
"Beck, "Demand and Imports." p 102 . "Monthly Energy Review (U .S . Department of I .ncrgy . Information
Administration) . December 1983, pp . 38-39. 17 [bid .
" Ibid .
13

MONTHLY LABOR REVIEW April 1984 . 1983 Import and Export Prices
"Highlights of U.S . Export and Import Merchandise Trade, p. 15, table 4.
2"Kathleen H . Hughes, "U .S . Crackdown on Coffee Smuggling Helps Boost Bean Prices to High for 1983," The Wall Street Journal, Nov . 14, 1983, p. 46 .
2' Data are from the U.S . Department of Agriculture . Foreign Agricul-tural Service .
==Outlook and Situation Report-Sugar and Sweetener (U .S . Depart-ment of Agriculture, Economic Research Service), December 1983, p. 6.
3" Ibid ., p . 26 table E-2 . "Jeffrey H . Birnbaum, "Some Farmers Like It, But Critics Call PIK a
Major Miscalculation," The Wall Street Journal, July 19, 1983, p. I . 31 Outlook and Situation Report-Feed (U .S . Department of Agriculture,
Economic Research Service), November 1983, p. I .
"Figures are preliminary ; comparisons are based on 1982-83 and 1983-84 marketing years . See Foreign Agriculture Circular-Oilseeds and Products, Fop 12-83 (U.S . Department of Agriculture, Foreign Agricul-tural Service), December 1983, p. 5.
=' "Copper Hits 1983 Low on Reports of Rises in Inventories. Output," The Wall Street Journal, Nov. 8, 1983, p . 46 .
21 Mineral Commoditc Summaries 1984 (U .S . Department of the Interior, Bureau of Mines, 1984), p. 6.
25 Ibid ., p. 176 . (Comparisons are based on preliminary estimates.)
2"Apparent Supply Report (Washington, American Iron and Steel In-stitute), Feb. 6, 1984 .
=' "Time Runs Out For Steel," Business Week, June 13, 1983, p. 84 . 2" "Metalworking Newsfront," Iron Age, July 22, 1983, pp . 13,16. ='Thomas F. O'Boyle, "Other Steel Firms Consider Merging in Wake
of LTV Offer for Republic," The Wall Street Journal, Nov. 9, 1983, p . 33 .
a"Thomas F. O'Boyle, "Forging a Link : American Steelmakers Bring in Foreign Metal to Hold Down Costs," The Wall Street Journal, Dec. 20, 1983, pp . 1, 16 .
"See D. Chase, "DeBeers Change Ad Track," Advertising Age. July 18, 1983, p. 42 ; and Rappaport Diamond Report, Aug. 26, 1983, p. 7.
'=Highlights of U.S . Export and Import Merchandise Trade, pp . 14-15, table 5 .
"For domestic auto sales figures, see S- I Report (Detroit, Mich . . Motor Vehicle Manufacturers' Association), Jan. 9, 1984 . For imported auto sales figures, see Ward's Automotive Reports, Jan. 9, 1984 .
"Amal Nag, "High New Car Prices Keep Many Lookers Looking, Not Buying," The Wall Street Journal, Aug. 3 . 1983, p. 8.
"Highlights of U.S . Export and Import Merchandise Trade, pp . 26-27, table E-2, and pp . 62-63, table 1-3 .
`Outlook and Situation-Wheat (U.S . Department of Agriculture, Eco-nomic Research Service), November 1983, p. 3.
""U.S . Offers Soviets 10 Million More Tons of Grain This Year," The Wall Street Journal, Jan. 26, 1984, p. 48 .
42 International Coal Review (Washington, National Coal Association and Coal Exporters' Association of the U.S .), December 1983 .
"Rosemary Brady, "Up in Smoke," Forbes, June 20, 1983, p . 88 . 44 Ibid .
''Highlights of U.S . Export and Import Merchandise Trade, pp . 10-11 .
'Austerity Will Pay Off For Chemical Makers," Business Week, Jan. 9, 1984, p. 53 .
"Ibid ., pp . 53-54 .
"Highlights of U.S . Export and Import Merchandise Trade, pp . 10- 11, table 2.
41 Ibid ., pp . 28-29, table E-2 .
"'Statistical Report: U.S . Foreign Trade in Machine Tools (McLean, Va ., National Machine Tool Builders' Association), October 1983 .
5" For 1958 data, see Foreign Industrial Targeting and Its Effects on U .S . Industries ; Phase 1: Japan, Publication 1437 (U .S . International Trade Commission), October 1983, p. 203. For 1982 and 1983 data, see "Tool Orders Down In Month, Up In'83," The New York Times, Jan. 30, 1984, p. D4 .