robust geotechnical design of shield tunnelshsein/wp-content/uploads/2017/01/robust... · robust...
TRANSCRIPT
Hsein Juang
Glenn Professor, Clemson University
Tongji University
August 4, 2015
Robust Geotechnical Design of
Shield Tunnels

Acknowledgments Robust design research at Clemson
Sponsors: National Science Foundation and Glenn Department of Civil Engineering, Clemson University
Investigators: Hsein Juang, Sez Atamturktur
Ph.D. students: Jerry Luo, Zhifeng Liu, Lei Wang, Wenping Gong, Sara Khoshnevisan, Andrew Brownlow
Collaborators: Hongwei Huang & Jason Zhang (Tongji Univ., Shanghai); Hsii-Sheng Hsieh (TFEC, Taipei), Gordon Denby (GeoEngineers, Seattle), 2
Outline of Presentation
1. Introduction
2. Robust Geotechnical Design (RGD)
Methodology - A New Design Perspective
3. Application of Robust Geotechnical
Design (RGD) Methodology - Shield Tunnels
4. Summary and Concluding Remarks
3

1. Introduction –
What is Robust Design?
4

What is Robust Design? Robust design aims to make a product insensitive to “hard-to-
control” input parameters (called “noise factors”) by carefully
adjusting “easy-to-control” input parameters (called “design
parameters”). -- Taguchi (1986)
5
Wayne Taylor
http://www.va
riation.com/te
chlib/val-
1.html

Transforming Robust Design
Concept into a Novel Geotechnical
Design Tool
6

Geotechnical Design Methodologies
Factor of Safety (FS)-Based Approach (Coping with uncertainties by means of experience and
engineering judgment)
Reliability-Based Design (RBD) (Incorporating uncertainties explicitly in the analysis;
however, difficult to characterize uncertainties of soil
parameters, model errors & construction variation)
Load and Resistance Factor Design (LRFD) (Current trend; however, uniform risk unattainable with
single resistance factors for each analysis model with
wide ranges of COVs in the input soil parameters)
7
Robust Geotechnical Design
Offers a new design perspective in the field
of geotechnical engineering
Is not to replace existing design methods
(FS-based design, RBD or LRFD approach)
Complements traditional design approaches
(FS-based approach, RBD, or LRFD)
8

2. Robust Geotechnical Design
(RGD) Methodology
9
Robust Geotechnical Design
Seeks an optimal design that is insensitive to, or robust against, variation in noise factors such as uncertain soil parameters, model errors, and construction variation.
Considers simultaneously safety, robustness, and cost by means of optimization.
10
Key Concepts in RGD
A) Design parameters (easy to control) versus noise factors (hard to control)
B) Measure of design robustness
C) Optimization and Pareto front
11

A) Design parameters & Noise factors (Using the design of shield tunnels as an example)
Design parameters: Segment thickness (t)
Segment reinforcement ratio ()
Steel bolt diameter (Dj)
12
Noise factors: Soil parameters (Ks, c, )
Ground water table (HGWT)
Ground surcharge (q0)
R
1°
y
x
p1
p3 + p4
ph
p6
p2
p5
p3
q0
H
HG
WT
Groundwater table

B) Measures of design robustness
Variation of system response (in terms of
factor of safety, failure probability,
deformation)
Signal-to-Noise Ratio (SNR)
Feasibility Robustness
13

Find d to optimize: [C(d), R(d,)]
Subject to: gi(d,) ≤ 0, i = 1,..,n
d - design parameters;
- noise factors;
C - cost;
R - robustness measure;
g – safety constraint.
C) Robust design optimization
14
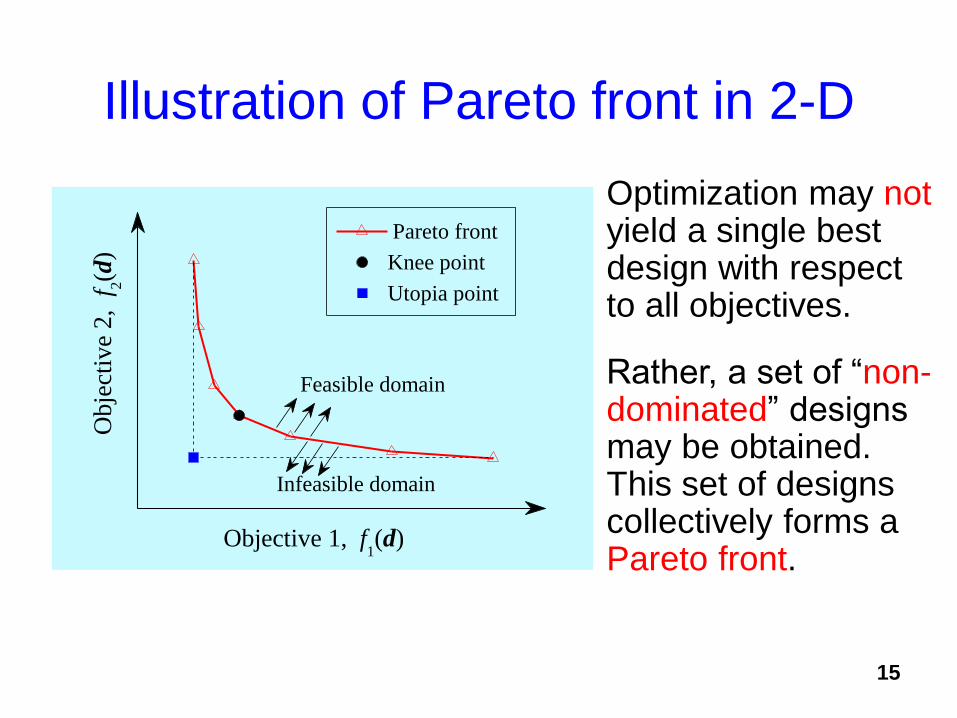
Illustration of Pareto front in 2-D
15
Optimization may not yield a single best design with respect to all objectives.
Rather, a set of “non-dominated” designs may be obtained. This set of designs collectively forms a Pareto front.
Infeasible domain
Pareto front
Ob
ject
ive
2,
f2(d
)
Objective 1, f1(d)
Feasible domain
Knee point
Utopia point
3. Application of
Robust Geotechnical Design
(RGD) Methodology
16

Summary of RGD Examples
Example
No.
System System
response
Noise factors Robustness
measure
#1 Braced
Excavation
Deformation Soil parameters
(su, kh)
Variation of
deformation
#2 Soil Slope Factor of
Safety
Soil parameters
(c, , ru)
Signal to noise ratio
(SNR) of factor of
safety
#3 Drilled
Shaft
Failure
Probability
Statistics of soil
parameters (, K0)
Variation of failure
probability and
feasibility robustness
#4 Shallow
Foundation
Failure
Probability
Statistics of soil
parameter and model
parameters
Variation of failure
probability and
feasibility robustness
#5 Shield
Tunnel
Factor of
Safety
Soil parameters (Ks,
c’, ’), water table
(HGWT), and
surcharge (q0)
Signal to noise ratio
(SNR) of factor of
safety
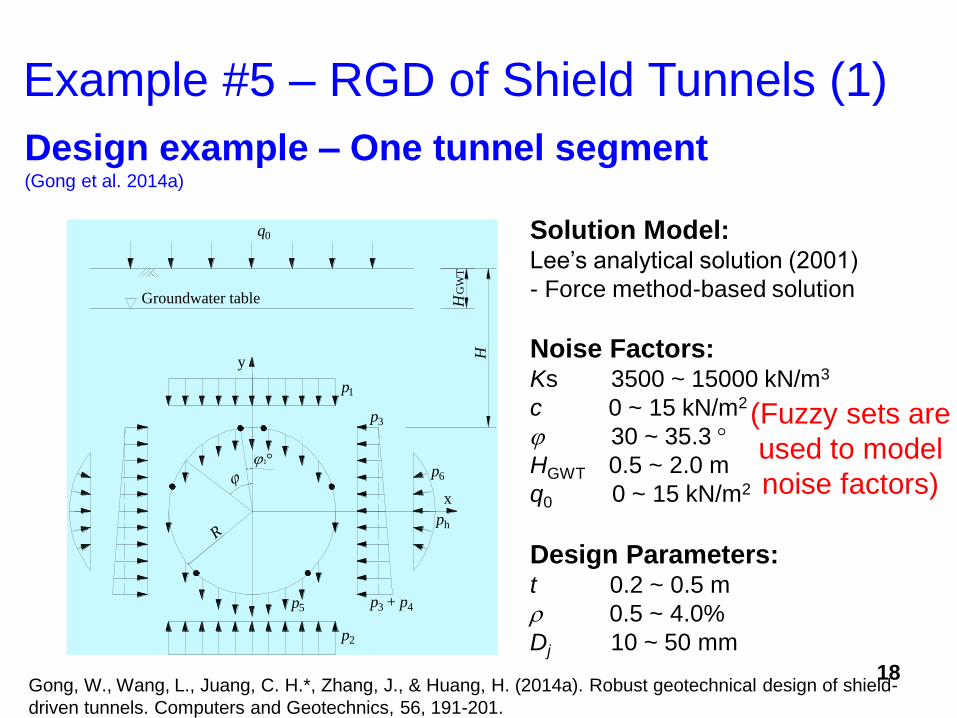
Example #5 – RGD of Shield Tunnels (1)
Noise Factors: Ks 3500 ~ 15000 kN/m3
c 0 ~ 15 kN/m2
30 ~ 35.3
HGWT 0.5 ~ 2.0 m
q0 0 ~ 15 kN/m2
Design Parameters: t 0.2 ~ 0.5 m
0.5 ~ 4.0%
Dj 10 ~ 50 mm
Solution Model: Lee’s analytical solution (2001)
- Force method-based solution
18
R
1°
y
x
p1
p3 + p4
ph
p6
p2
p5
p3
q0
H
HG
WT
Groundwater table
(Fuzzy sets are
used to model
noise factors)
Design example – One tunnel segment (Gong et al. 2014a)
Gong, W., Wang, L., Juang, C. H.*, Zhang, J., & Huang, H. (2014a). Robust geotechnical design of shield-
driven tunnels. Computers and Geotechnics, 56, 191-201.

A few words on the selection of analysis model
– higher sophistication equals better model?
“Everything should be made as simple as possible
but no simpler” (Einstein)
When selecting a numerical model for a geotechnical
problem, robustness of the model may be as
important as fidelity of the model. This is especially
critical when the model is to be used in a robust
design framework.
19
(x)
x
1.0
0.0a bm
i
ix
ix
i-cut interval
(Fs)
Fs
1.0
0.0A B
Ci-level
Fsia
Fsia
i
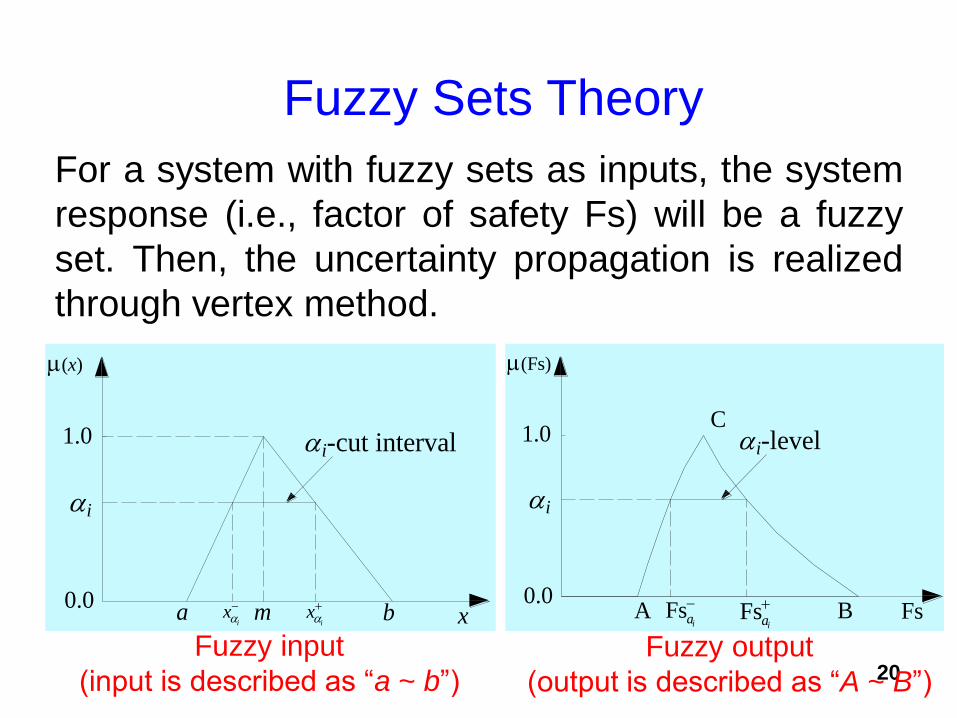
Fuzzy Sets Theory
20
For a system with fuzzy sets as inputs, the system
response (i.e., factor of safety Fs) will be a fuzzy
set. Then, the uncertainty propagation is realized
through vertex method.
Fuzzy input
(input is described as “a ~ b”)
Fuzzy output
(output is described as “A ~ B”)

Find: (t, , Dj) Subjected to: tl t tu; l u; Djl Dj Dju;
Objective: Maximizing the robustness index of ULS, SNR1
Maximizing the robustness index of SLS, SNR2
Minimizing the cost, C (t, , Dj)
21
Multi-objective Optimization Formulation
(design parameters)
(safety)
(robustness)
(cost)
(local practice)
Note: the reliability index and signal-to-noise ratio of
tunnel performance is computed with the fuzzy outputs
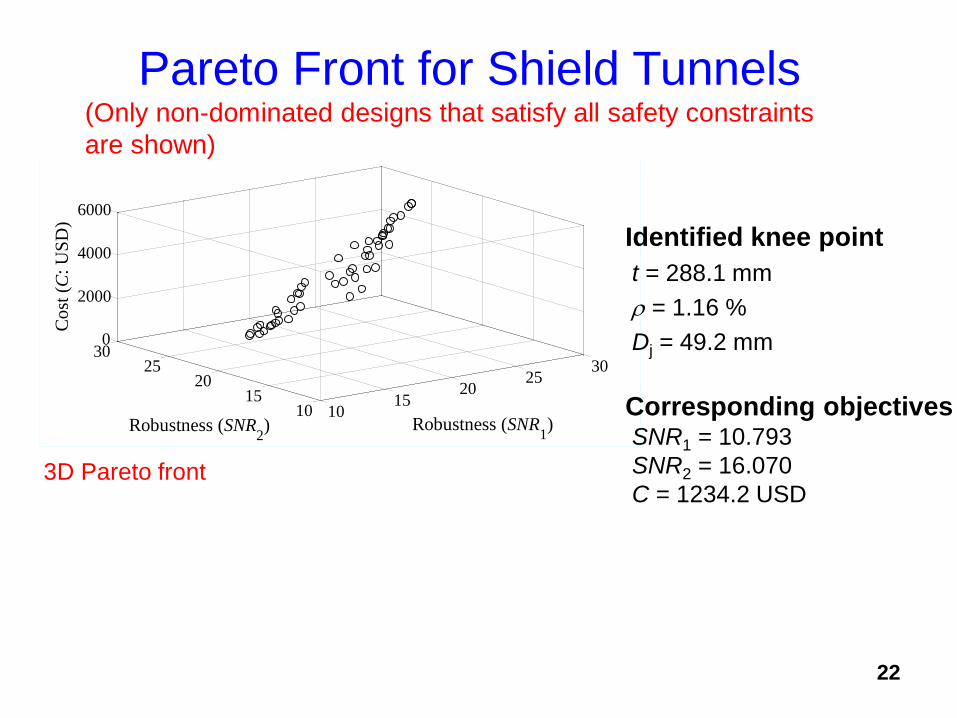
Pareto Front for Shield Tunnels (Only non-dominated designs that satisfy all safety constraints
are shown)
22
3D Pareto front
1015
2025
30
1015
2025
300
2000
4000
6000
Robustness (SNR1)Robustness (SNR
2)
Co
st (
C:
US
D)
Identified knee point
t = 288.1 mm
= 1.16 %
Dj = 49.2 mm
Corresponding objectives SNR1 = 10.793
SNR2 = 16.070
C = 1234.2 USD

Pareto Front for Shield Tunnels (Only non-dominated designs that satisfy all safety constraints
are shown)
23
3D Pareto front
1015
2025
30
1015
2025
300
2000
4000
6000
Robustness (SNR1)Robustness (SNR
2)
Co
st (
C:
US
D)
0 1000 2000 3000 4000 5000 600010
15
20
25
30
SNR1
SNR2
Ro
bu
stn
ess
(SN
R1,
SN
R2)
Cost (C: USD)
2D Pareto front
Identified knee point
t = 288.1 mm
= 1.16 %
Dj = 49.2 mm
Corresponding objectives SNR1 = 10.793
SNR2 = 16.070
C = 1234.2 USD
24
Summary of RGD of Shield Tunnels
(one tunnel segment)
A fuzzy sets-based RGD method is advanced
and shown effective in producing a robust
design of shield tunnel segment design.
The Pareto front obtained from RGD shows the
tradeoff between design robustness and cost
efficiency.
The knee point on the Pareto front can be
selected as the best compromised design.

Example #5 – RGD of Shield Tunnels (2) Design example – Tunnel longitudinal structure (Gong et al. 2015)
25 Gong, W., Huang, H., Juang, C.H*, Atamturktur, S., and Brownlow, A. (2015). “Improved shield tunnel design
methodology incorporating design robustness.” Canadian Geotechnical Journal.
Seattle Tunnel
Longitudinal length: 2.8 km
Diameter: 17.45 m Shanghai Yangtze River Tunnel
Longitudinal length: 6.8 km
Diameter: 15.43 m

0 50 100 150 200 250 3000
4
8
12
16
20
Eff
ecti
ve
coh
esio
n (
c, k
N/m
2)
Longitudinal coordinate (x, m)
Example #5 – RGD of Shield Tunnels (2) Design example – Tunnel longitudinal structure
26
0 50 100 150 200 250 3000
20
40
60
80
100
Gro
un
d s
tiff
nes
s (k
v,
10
3k
N/m
3)
Longitudinal coordinate (x, m)
0 50 100 150 200 250 3000
3
6
9
12
15
Gro
un
d s
tiff
nes
s (k
h,
10
3k
N/m
3)
Longitudinal coordinate (x, m)
0 50 100 150 200 250 30030
31
32
33
34
35
Eff
ecti
ve
fric
tio
n a
ng
le (, )
Longitudinal coordinate (x, m)
0 50 100 150 200 250 3000.0
0.5
1.0
1.5
2.0
2.5
Gro
un
d w
ater
tab
le (
Hw,
m)
Longitudinal coordinate (x, m)
0 50 100 150 200 250 3000
5
10
15
20
25
Gro
un
d s
urc
har
ge
(q0,
kN
/m2)
Longitudinal coordinate (x, m)
Effective friction angle Ground water table Ground surcharge
Vertical ground stiffness Horizontal ground stiffness Effective cohesion

Characterization of the Longitudinal
Variation of Input Parameters
Noise factors Mean Coefficient
of variation
Scale of
fluctuation Distribution
Vertical ground stiffness of the
ground under the tunnel
(kv, kN/m3)
33000 0.500 50 Lognormal
Effective cohesion of soil
(c, kN/m2) 7.5 0.333 50 Lognormal
Effective friction angle of soil
(, ) 32.65 0.027 50 Lognormal
Horizontal ground stiffness of
soil (kh, kN/m3) 9250 0.207 50 Lognormal
Ground water table (HW, m) 1.25 0.200 50 Lognormal
Ground surcharge (q0, kN/m2) 10 0.333 50 Lognormal 27

Huang, H., Gong, W., Khoshnevisan, S., Juang, C.H.*, Zhang, D., & Wang, L. (2015). “Simplified procedure for
finite element analysis of the longitudinal performance of shield tunnels considering spatial soil variability in
longitudinal direction.” Computers and Geotechnics, 64, 132-145
Improved Model for Shield Tunnel
Performance Analysis
Generate tunnel design parameters
with MCS that considers the longitudinal variation
Start
Winkler elastic foundation theory-based
FEM analysis of tunnel longitudinal performance
(i.e., settlement, rotation, moment, and shear force)
Force method-based analytical analysis
of the performance of tunnel segmental ring
(i.e., structure safety and serviceability)
All segment
rings are completed?
Required MCS
runs are completed?
End
Yes
Yes
No
(Inner loop)
No
(Outer loop)
Step 1: generate input parameters
in the longitudinal domain with MCS
Step 2: 1-D FEM analysis of tunnel
longitudinal behavior (Huang et al. 2015)
Step 3: 2-D analytical solution of the
performance of one segment ring (Gong et al. 2015)
Step 4: repeat Step 3 for each and
every segment ring (inner loop)
Step 5: repeat Step 1, Step 2, Step
3 and Step 4 until a converged
solution is achieved (outer loop)
Gong, W., Juang, C. H.*, Huang, H., Zhang, J., & Luo, Z. (2015). Improved analytical model for circumferential
behavior of jointed shield tunnels considering the longitudinal differential settlement. Tunnelling and
Underground Space Technology, 45, 153-165.
28

1 1.5 2 2.5 30
2000
4000
6000
8000
Factor of safety with respect to structure safety (Fs1)
Fre
qu
ency
co
un
ts
Histogram
Normal fitting
1 1.5 2 2.5 30
2000
4000
6000
8000
Factor of safety with respect to serviceability (Fs2)
Fre
qu
ency
co
un
ts
Histogram
Normal fitting
Effectiveness of the Improved Model of
Shield Tunnels (1)
Existing method (not consider the longitudinal variation of input parameters)
Failure probability with respect to structure safety: 4.010-5
Failure probability with respect to serviceability: 0
Not consistent with long term structure health
monitoring data (in Shanghai)
29
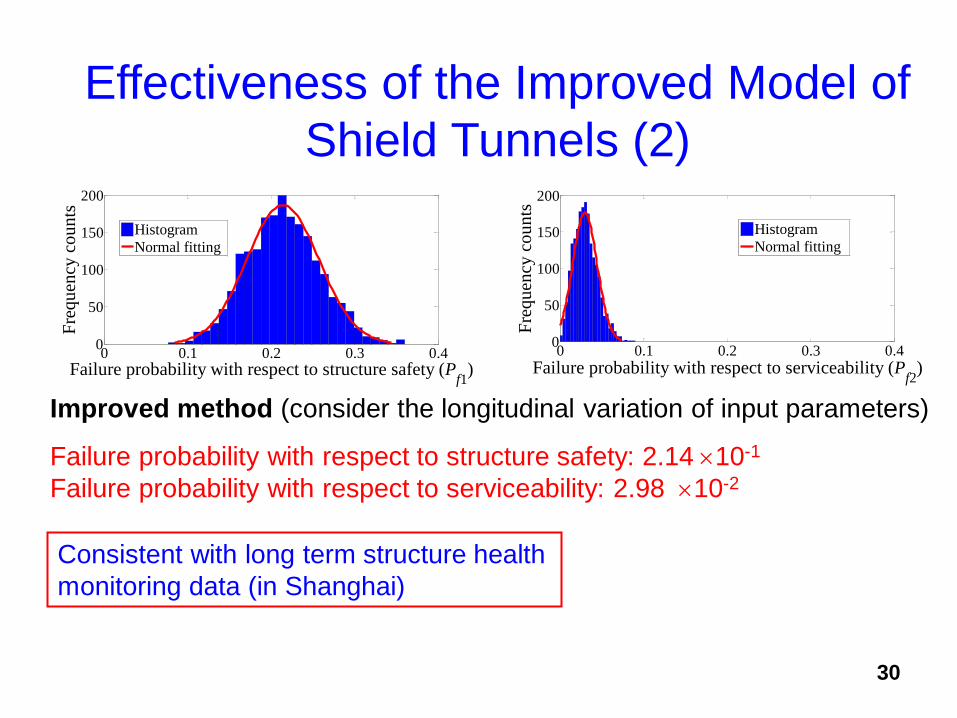
Effectiveness of the Improved Model of
Shield Tunnels (2)
Improved method (consider the longitudinal variation of input parameters)
Failure probability with respect to structure safety: 2.1410-1
Failure probability with respect to serviceability: 2.98 10-2
Consistent with long term structure health
monitoring data (in Shanghai)
0 0.1 0.2 0.3 0.40
50
100
150
200
Failure probability with respect to structure safety (Pf1
)
Fre
qu
ency
co
un
ts
Histogram
Normal fitting
0 0.1 0.2 0.3 0.40
50
100
150
200
Fre
qu
ency
co
un
ts
Failure probability with respect to serviceability (Pf2
)
Histogram
Normal fitting
30
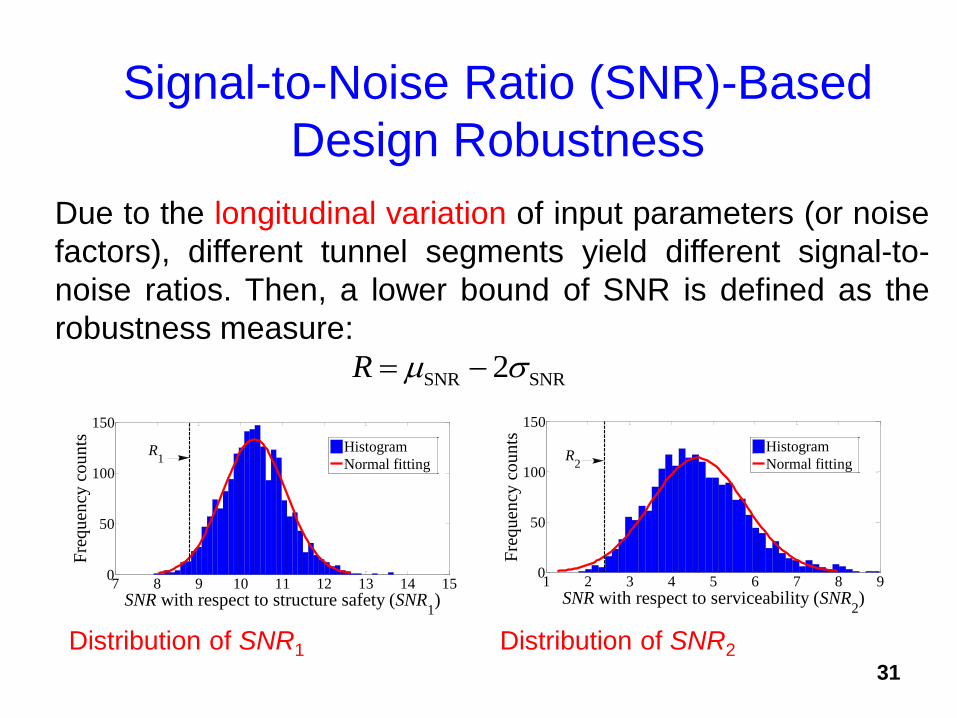
Signal-to-Noise Ratio (SNR)-Based
Design Robustness
7 8 9 10 11 12 13 14 150
50
100
150
SNR with respect to structure safety (SNR1)
Fre
qu
ency
co
un
ts
Histogram
Normal fittingR
1
Distribution of SNR1
1 2 3 4 5 6 7 8 90
50
100
150
SNR with respect to serviceability (SNR2)
Fre
qu
ency
co
un
ts
Histogram
Normal fittingR
2
Distribution of SNR2
SNR SNR2R
Due to the longitudinal variation of input parameters (or noise
factors), different tunnel segments yield different signal-to-
noise ratios. Then, a lower bound of SNR is defined as the
robustness measure:
31

Optimization Setting of the Design Space
Easy-to-control design
parameter Possible value
Segment thickness (t: m) {0.25, 0.30, 0.35, 0.40, 0.45}
Steel reinforcement ratio of
tunnel segment (: %) {0.5, 1.0, 1.5, 2.0}
Bolt diameter of the
circumferential joints (Dc: mm) {20, 25, 30, 35, 40}
Bolt diameter of the longitudinal
joints (Dl: mm) {20, 25, 30, 35, 40}
Note: 1) Bolt diameter of the longitudinal joints cannot be optimized
in the robust design of one tunnel segment.
2) While the discrete design space is used is this example, the
continuous design space can also be used. 32

Pareto Front for Shield Tunnels (Only non-dominated designs that satisfy all safety constraints
are shown)
3D Pareto front: 3D surface
05
1015
24
68
10200
400
600
800
Design robustness (R1)Design robustness (R
2)
Co
st (
C,
10
00
US
D)
Non-dominated designs
Knee point
Real-world design Identified knee point
t = 350 mm
= 0.5 %
Dc = 20 mm
Dl = 30 mm
33

Effectiveness of the Robust Design
Optimization Results
Designs
Easy-to-control design
parameters (d)
Design
feasibility
Tunnel
performance Design objectives
t
(m)
(%)
Dc
(mm)
Dl
(mm) f1 f2 Fs1 Fs1
C
(1000
USD)
R1 R2
Knee
point 0.35 0.5 20 30 0.9607 0.9033 1.90 1.80 309.57 9.59 4.89
Real-
world
design
0.35 0.5 30 30 0.7846 0.9695 1.39 2.50 316.67 8.78 2.31
1 1
2 2
Pr Fs 1.0
Pr Fs 1.0
f
f
1 SNR1 SNR1
2 SNR2 SNR2
2
2
R
R
34
35
Summary of RGD of Shield Tunnels
(one tunnel longitudinal structure)
An improved model of shield tunnel performance
was advanced, in which the longitudinal variation
of input parameters can be explicitly considered.
The robust design methodology of shield tunnels
was developed, in which the robustness of the
shield tunnel performance against the longitudinal
variation of input parameters was enhanced.

4. Concluding Remarks
36
Concluding Remarks
Robust Geotechnical Design, a new design
paradigm, has been demonstrated as an effective
tool to obtain optimal designs that are robust
against variation in noise factors (e.g., uncertain
geotechnical parameters).
RGD with multi-objective optimization can consider
safety, cost, and robustness simultaneously and
effectively.
RGD has been shown as an effective design tool
for multiple geotechnical problems.
37

38 4th ISGSR, December 2013
Thank You!