robust fault diagnosis and load torque estimation in ... fault diagnosis and load torque estimation...
TRANSCRIPT

International Journal on Electrical Engineering and Informatics - Volume 10, Number 1, March 2018
Robust Fault Diagnosis and Load Torque Estimation in Electrical Drives
Using Analytical Redundancy Relations and Sliding Mode Observer
Slimane Medjmadj1, Demba Diallo2, and Mohammed Mostefai3
1Laboratoire d’Automatique de Setif (LAS), Univ. Bordj BouArreridj 34000, Algeria
2Laboratoire Génie Electrique et Électronique de Paris (GeePs), CNRS, CentraleSupélec, Univ.
Paris-Sud, Univ. Pierre et Marie Curie, 91192 Gif Sur Yvette, France. 3Laboratoire d’Automatique de Setif (LAS), Univ. Setif 19000, Algeria
Abstract: Electrical drives are more and more used in transportation applications and
industrial process because of their effective cost and high efficiency. They have become
critical components and therefore any fault or failure affecting them may seriously endanger
the users and/or induce huge financial costs. As a consequence, early detection and isolation
of these faults is recommended if not mandatory to enhance the safety, the availability, the
reliability and improve the maintenance and the operational efficiency. Analytical
Redundancy Relations (ARR) are used to compute to structured residuals on which the
diagnosis is based. To smooth the residuals and enhance the fault detection capability, a
sliding mode observer is developed to compute the derivatives. The analysis of the residuals
reveals that they are Gaussian signals with a change in the mean. The comparison between
the two-sigma and the two-sided CUSUM methods has shown that the latter is more efficient
to compute the thresholds. Therefore with the two-sided CUSUM, the rotor resistance fault
is detected with no false alarm. Moreover it is proved that the fault diagnosis is robust to the
load torque variations. Beside, thanks to the residual, a load torque estimator is also
developed. Extensive simulation results prove the validity of our approach.
Index Terms: Electrical drives, Redundancy Relations, Sliding mode, Gaussian distribution,
Fault detection and isolation (FDI).
1. Introduction
The induction machine has ever been the horsepower of electrical machines in the industry,
because of its low cost and structural robustness. However, its intrinsic nonlinearity has slowed
down the penetration of induction drive in the industry or transportation applications.
Fortunately, vector control has now become a reliable and widespread method to drive induction
machine. Therefore, induction motor drive is a serious candidate in electric or hybrid vehicle
powertrain, in electric aircraft, wind turbine, etc. Unfortunately this electrical component can be
affected with different faults [1]. These different faults may yield drastic consequences. The
main problems are related to increasing costs, safety degradation and final product quality
degradation. The detection of the faults allows avoiding unexpected factory stops and saving a
great deal of money [2, 3].
There are mainly three families of methods to diagnose and isolate faults in electrical drives [4]:
• Process-history data-based methods [5] such as signal processing based on chemical analysis,
temperature [6], partial discharge [7] or vibration signal measurement.
• Knowledge based methods such as Artificial Neural Networks, genetic algorithms [8], fuzzy
logic [9].
• Model-based methods such as observers [10, 11], Parity space [12].
When a model of the actuator is available, even if non-linear, model-based methods are very
effective. Figure 1 displays the corresponding flowchart.
Received: February 17th, 2017. Accepted: March 18th, 2018
DOI: 10.15676/ijeei.2018.10.1.13
186

Figure 1. Model-based fault diagnosis
The fault detection and isolation (FDI) [13, 14] block, as it can be seen in Figure 2, is the
main component of the diagnosis procedure. It is based on the computation of the residuals and
the thresholds and also the signature analysis to make a decision.
Figure 2. Schematic diagram of the IM drive and the FDI
The aim of this paper is to investigate the design of a FDI for an induction motor drive with
a faulty rotor yielding an abrupt modification of the rotor resistance. As the model is known and
accurate enough, a Parity space approach is used to determine analytical redundancy relations
(ARR), which are robust against parameters uncertainties. The analytical redundancy approach
requires that the residual generator performs some kind of validation of the nominal relationships
of the system, using the actual input and measured output. If a fault occurs, significant
modifications of the residuals are expected. The key issue is to measure those modifications to
make a decision on the process condition.
FDI
Inputs
Residuals
Comparison to thresholds
Signature analysis
Model Process
Ω
Inverter
VDC
Defaults
Failure Decision
I.M
Control
FDI
Slimane Medjmadj, et al.
187

The analysis of the residuals (namely comparison to constant or varying thresholds and fault
signature analysis) is usually based on the statistics of the residuals, and a decision rule is then
applied to determine fault occurrence [15] as displayed in Figure 3.
Figure 3. Diagram of the FDI
ARRs are computed with the system inputs, outputs and their derivatives. Differentiation of
output signals is an old and well-known problem. The calculation of successive derivatives of
the output signals with the classical derivative or polynomial approximation [16, 17] produces
the amplification of the noises. Because of this approximation, the computed residuals are highly
noisy, which makes the diagnosis more difficult with the risk of false alarms or non- detection.
In this work, we propose to improve the computation of the successive derivatives with a sliding
mode observer.
Beside the fault detection and diagnosis, the residuals are used to estimate the load torque.
This is a non-measured variable but its knowledge can be useful in the monitoring but also in the
improvement of position or speed estimation [18-19]
This paper is organized as follows: section II is devoted to the description of the principle of
ARRs computation to form the residuals. In section III, two methods of threshold computation
dedicated to Gaussian signals are presented. In section IV the ARRs are computed for the
induction motor drive and the structured residuals are extracted. In the same section, the sliding
mode observer is introduced to calculate the successive derivatives. Section V presents the
simulation results for the load torque estimator and the rotor fault diagnosis. Finally a conclusion
closes the paper.
2. Robust residual Generation for FDI
A. Analytical Redundancy
The fundamental problem of robust fault detection consists in designing a residual generator
which yields residuals or fault indicators that allow a reliable decision between the two
hypotheses: non-faulty or faulty system, despite the disturbances and model uncertainties.
Consider the following system:
,,
,,
zxhy
zxfx (1)
Where n
x is the state vector, m
z is the input vector, y is the measurement vector
and l
is some constant parameter vector. f and h are assumed to be polynomial functions
in their arguments and ttttv
tuz ,,, Where u represents control inputs, v the unknown
inputs, the faults and the noise. Considering Dj successive time derivatives of the jth output:
,,jD
zxjD
jGjD
jy (2)
System Outputs: y
System Inputs: u
Failure
Decision Residuals
Ri
⋮ ⋮
Decision Control
Unit
Estimation of the
Load Torque
Rotor Resistance
Fault Detection
and Isolation
𝑢ሷ , 𝑦ሷ
𝑢ሶ , 𝑦ሶ Differential
Sliding Mode
Observers
Analytical
Redundancy
Relations
Techniques
Robust Fault Diagnosis and Load Torque Estimation in Electrical Drives
188

Where jDzresp
jDjy . stands for zrespiy . and its time derivatives up to order js .
The concatenation of (2) for pJj ,. . .,1 gives a system of j jD 1 equations:
,, zxSGy (3)
Where JjjDD , and for simplicity y stands for
pDy
Dy
Dy ...,
2,
1 . ARR are
input/output relations obtained by eliminating the unknown state x in (3). ARR existence
conditions depend on the rank of the Jacobian matrix [20]
x
zxS
G
,,.
Using symbolic computation algorithms a set of polynomial ARR is found:
0,,,, zywzxDGy (4)
B. ARR Decomposition
Since each component of ,, zyw is polynomial in its arguments, the following
decomposition holds [16, 21]:
,,,,,,,,,),,,,,( vuyswvuyd
wvuyw
(5)
Where : ,,,, vuyd
w , is the deterministic component of w and ,,,,, vuysw the
stochastic one are at least of one degree in some components of ,v and . Thus the residual
is equal to zero in the absence of unknown inputs, the faults and the noise. Each of these terms
can also be decomposed as follows:
,,,,,,,,,,,,, vuydnr
wuydr
wuycwvuyd
w (6)
,,,,,,,,,,,, vuysnrwuysrwvuysw (7)
Where the lower scripts c, r and nr stand respectively for the computational, robust and non-
robust to perturbations components. They verify the following properties:
0,0,,,,
0,0,0,,
0,0,,
vuysw
uydnr
w
uydr
w
(8)
The robust ARR exist if all the terms indexed nr are null. Their decomposition gives:
- the computation form is: uycwcomp
,
- the evaluation form is: ,,,,, uysrwuydr
weval
The faults are not detectable if 0,, uydr
w despite that 0 .
3. Decision-Making System
The role of the decision-making system is to process the residuals and to make a decision
concerning the condition of the system; the group of residuals allows isolating certain faults. The
residuals are null when there is no fault but are different if a fault appears. However, due to
noises and model uncertainties, it is mandatory to include thresholds, judiciously computed so
as to avoid false alarms and non- detection.
Slimane Medjmadj, et al.
189

A. Constant Threshold (The 2σ rule)
One robust solution is to compute the thresholds from the mean value and the standard deviation
of the residuals as stated in (9) [22, 23].
mi1
n. R
i(k)
k1
n
i1
n. R
ik mi
2
k1
n
12
Approximately 95% of the values of the residual Ri are in the 2σ interval:
iSimiRiSim .2.2 (10)
The fault can be detected by comparing the residual to the thresholds.
B. Two-sided CUSUM Algorithm
Let us now investigate further the situation discussed in [24, 25] where the signal is Gaussian
with a mean value change. The cumulative sum (CUSUM) algorithm is one of the most used
methods to detect the abrupt change of residuals. This method is founded on the comparison at
every moment of the difference between the value of the report/ratio of probability and its current
minimal value of a residue.
Let us consider a residue r(t), where the mean value after change is either 1 or 1
. It is
relevant to use two CUSUM algorithms together; the first to compute the parameters 0 and v
in healthy case, and the second for detecting the moment of the fault with the computation of
two thresholds named
kg and
kg . The expressions are given in (11) through (15).
The following algorithm makes it possible to determine the breakdown instant of appearance
[26]:
v
01 (11)
v
01 (12)
201
vkrgg kk
(13)
201
vkrgg kk
(14)
kk ggh max,maxmax
(15)
Where h represents the threshold of the residual r(t). The time at which the change is detected
ta is as follows:
hghgkt kka :min (16)
4. Application
A. System Modelling
The system considered in this paper is an induction motor drive, with the state vector defined
as:
tsqi
sdirqrd
txxxxxx ,,,,5,
4,
3,
2,
1
(17)
Robust Fault Diagnosis and Load Torque Estimation in Electrical Drives
190

and the output vector txxx
tyyyy )5,
4,
1()
3,
2,
1( . With the rotor angular speed Ω, the
stator currents in the (d,q) reference frame isd , isq and finally the rotor fluxes rd ,rq . The control
inputs are represented by the stator voltage vsd and vsq. The outputs are Ω, isd and isq. Under usual
hypotheses the equations are [16, 17]:
sL
sqvxxpxxx
sL
sdv
xxpxxx
xxpxxMx
xxpxxMx
J
lT
xJ
Bxxxx
JrL
pMx
2135
1
5
3124
1
4
21353
31242
143521
(18)
Rs , Ls are the stator resistance and inductance, Rr , Lr are the rotor resistance and inductance,
M is the mutual inductance between stator and rotor, p is the number of pole pairs, B is the
damping coefficient, J is the moment of inertia and Tl is the load torque (an unknown input).
rL
rR
sL
sR
sL
rL
M
sL
rL
M
rL
rR
sL
sR
1
1,,
²1,,
B. ARR Design
Deriving the speed and currents at 1st order, the rank of the Jacobian matrix
31
21
11
GxJ
GxJ
GxJ is equal
to 5.
There exists one ARR that is not robust against the load torque variations [20, 27]:
0112
12
23122
32112
1 l
TpypBypJypyyypAsLpyyypAsLpR
(19)
This residual can be used to estimate the load torque.
1121
2
31222131ˆ yByJ
yp
yypyAsLpyypyAsLp
lT
(20)
Deriving the speed at 1st order and the currents at 2nd order, the rank of the Jacobian matrix
22
22
32
22
11
11
Gl
TJ
Gl
TJ
GxJ
GxJ
Gl
TJGxJ is equal to 6. There exist two ARRs that are robust against Tl [20, 27].
Slimane Medjmadj, et al.
191
022
112111211231221
1
2
12
2
pypyAAyppypyAAyypyApyR
(21)
022
111211212121321
2
2
12
3
pypyAAypypypAAyypyApyR
(22)
With:
sL
sqvyyA
sL
sdv
yyA.
3.32;.
2.21
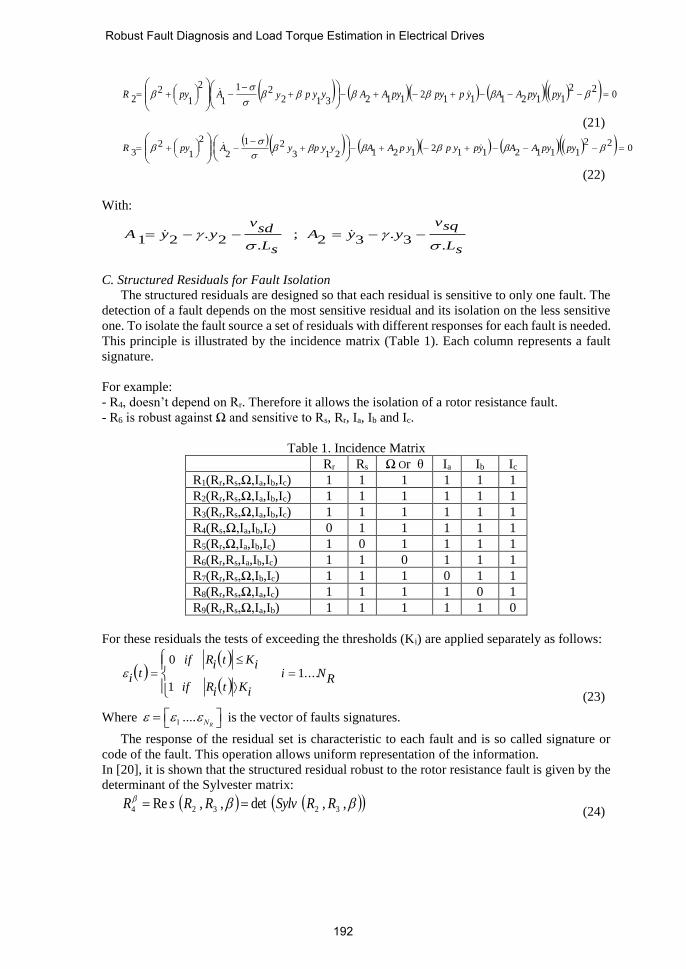
C. Structured Residuals for Fault Isolation
The structured residuals are designed so that each residual is sensitive to only one fault. The
detection of a fault depends on the most sensitive residual and its isolation on the less sensitive
one. To isolate the fault source a set of residuals with different responses for each fault is needed.
This principle is illustrated by the incidence matrix (Table 1). Each column represents a fault
signature.
For example:
- R4, doesn’t depend on Rr. Therefore it allows the isolation of a rotor resistance fault.
- R6 is robust against Ω and sensitive to Rs, Rr, Ia, Ib and Ic.
Table 1. Incidence Matrix
Rr Rs Ω Or θ Ia Ib Ic
R1(Rr,Rs,Ω,Ia,Ib,Ic) 1 1 1 1 1 1
R2(Rr,Rs,Ω,Ia,Ib,Ic) 1 1 1 1 1 1
R3(Rr,Rs,Ω,Ia,Ib,Ic) 1 1 1 1 1 1
R4(Rs,Ω,Ia,Ib,Ic) 0 1 1 1 1 1
R5(Rr,Ω,Ia,Ib,Ic) 1 0 1 1 1 1
R6(Rr,Rs,Ia,Ib,Ic) 1 1 0 1 1 1
R7(Rr,Rs,Ω,Ib,Ic) 1 1 1 0 1 1
R8(Rr,Rs,Ω,Ia,Ic) 1 1 1 1 0 1
R9(Rr,Rs,Ω,Ia,Ib) 1 1 1 1 1 0
For these residuals the tests of exceeding the thresholds (Ki) are applied separately as follows:
RNi
iKtiRif
iKtiRifti ....1
1
0
(23)
Where 1 ....NR
is the vector of faults signatures.
The response of the residual set is characteristic to each fault and is so called signature or
code of the fault. This operation allows uniform representation of the information.
In [20], it is shown that the structured residual robust to the rotor resistance fault is given by the
determinant of the Sylvester matrix:
,,det,,Re 32324 RRSylvRRsR
(24)
Robust Fault Diagnosis and Load Torque Estimation in Electrical Drives
192

0.30.2
1.30.31.20.2
2.31.30.32.21.20.2
3.32.31.33.22.21.2
3.32.33.22.2
3.33.2
32
0000
00
00
0000
,,
SS
SSSS
SSSSSS
SSSSSS
SSSS
SS
RRSylv
Where
1
2
11112
3
10.2
21121211
2
11.2
312112.2
223.2
²
11²
11
1
SpySyypSpyS
yyyyypSypSpyS
yypSpySS
L
VyyS
s
sd
2
2
12111
3
10.3
31131112
2
11.3
211122.3
333.3
²
11²
11
1
SpySyypSpyS
yyyyypSypSpyS
yypSpySS
L
VyyS
s
sq
D. Estimation of the Derivatives Via Sliding Mode Technique
The sliding mode technique is used at first in control theory, but in the recent years sliding
mode is used to design observers for many applications [28, 29].
For this system, we notice that the three analytical redundancy relations found previously
((19), (21) and (22)) are linked to the control inputs, unknown inputs, parameters, outputs and
their derivatives. Let the output signal g(t), considered as the input of the observer, be a
measurable locally bounded function defined on [0, ∞] and let it consist of a base signal having
a derivative with the Lipschitz’s constant (c >0) and a noise. In order to differentiate the unknown
base signal, consider the following auxiliary equation.
(25)
Applying the second order sliding mode algorithm to keep 0)( tg , we obtain:
)(1
)(2/1
)(1
tgSign
tgSigntg
(26)
)(tgS is the sliding surface. Where and λ are >0 and )(t is the output of the
differentiator (observer) which is the estimator of the derivative of g(t). According to [28, 30,
31], the following are the sufficient conditions for the convergence of )(t to ).(tg
c
cc
c
42
(27)
Slimane Medjmadj, et al.
193

The main drawback of this observer is the well-known chattering phenomenon due to the
sign function. To reduce the effects of this phenomenon, we can replace the sign(x) function by 2
.arctan qx
; the coefficient q is a parameter to adjust the slope of the arc tangent function.
5. Simulation results and Discussions
A field oriented voltage vector control is used to drive the induction motor. The parameters
of the induction motor are listed in Table 2.
Table 2. Induction Machine Characteristics Parameter Value
Nominal Power Pn 4 kW
Nominal Torque 25 N.m
Number of Pole Pairs p 2
Stator Resistance Rs 1.2 Ω
Stator Inductance Ls 0.1554 H
Rotor Resistance Rr 1.8 Ω
Rotor Inductance Lr 0.1568 H
Mutual Inductance M 0.15 H
Rotor Inertia J 0.07 kg/m²
The sampling period is equal to 1ms and the simulation is performed during 4s. With no loss
of generality, the reference speed of the machine is fixed in all this study at 1200 rev/min that is
equivalent to 125.6rd/s. The inverter is driven with a SPWM technique.
A. Load Torque Estimation
Figure 4.a displays the real and estimated load torque. The estimation error (Figure 4.b) is
almost zero except during the start-up. Except during the initial state, the dynamic performances
of the estimator are very good.
a. Real and estimated load torque
b. Estimation error
Figure 4. The load torque estimator
Robust Fault Diagnosis and Load Torque Estimation in Electrical Drives
194

B. Fault Diagnosis
One of the most important purposes of fault diagnosis is to detect unexpected changes (faults)
in a monitored process as early as possible, before they lead to a complete breakdown. For the
diagnosis, the following load torque profile (Figure. 5) is assumed as an example.
Figure 5. Load torque applied
The residuals generated by this method contain successive derivatives of the outputs, which
are sensitive to noise and then can be amplified by using classical derivative. To reduce this
phenomenon, we have used a differential sliding mode observer to estimate those successive
derivatives and the results are better. Figure.6 shows the time evolution of residuals R1, R2 and
R3 in the healthy case with classical derivative.
a. R1
b. R2
c. R3
Figure 6. Residuals in healthy case with classical derivatives
We observe in Figure.6, that residuals R1, R2 and R3 generate false alarms due to peaks that
are caused by derivatives. If we increase the thresholds, we will increase the delay of detection,
and moreover some faults would not be detected.
Figure 7 shows the residuals computed with the sliding mode observer. We can observe
clearly that the residuals are smoother and for the same thresholds, no false alarm is generated.
Slimane Medjmadj, et al.
195

a. R1
b. R2
c. R3
Figure 7. Residuals in healthy case with sliding mode observer
These results confirm that the use of a second order sliding mode observer to estimate the
successive derivatives of each output reduces the occurrence of false alarms.
Many motor faults have an electrical reason. Rotor bar faults are usually associated with high
temperatures, high mechanical loading particularly during the starting time, or any defective
casting or poor jointing during the manufacturing process. Initially, they started as high resistance
causing high temperature and then progress as cracking or small holes in the rotor bars.
In healthy state, rotor resistance varies slowly due to operating conditions. We can assume
therefore that an abrupt variation can be considered as a fault.
However in a closed-loop speed drive, despite the fault, the operation points remain in close
domains as it can be seen in Figure.8. that displays the trajectory in the (d,q) reference frame of
currents for different rotor resistance values (Rr.n and ±25% Rr.n).
Figure 8. (d, q) current pattern in case for different rotor resistance values
Robust Fault Diagnosis and Load Torque Estimation in Electrical Drives
196

We can also observe in Figure.9 that the speed regulation is also still effective despite the
variations of the rotor resistance.
Figure 9. Speed regulation
These results show that the drive is still under control but with a faulty rotor. A monitoring
system is therefore necessary to detect the fault as it may lead to efficiency reduction, accelerated
ageing or failure.
The role of the decision-making system is to process the residuals and to make a decision
concerning the condition of the drive. Figure.10 shows the probability density function (pdf) of
the two residuals R2 and R3 under different values of resistance rotor.
a. R2
b. R3
Figure 10. Pdf of the two residuals under different rotor resistance values.
We can notice that the pdf is the sum of three Gaussian distribution with mean value µ and
variance σ². In this case, the probability density function is given by:
2
3
3
2
2
2
2
1
1
2
1
3
2
1
2
2
1
1
111
2
1
yyy
eeeyp
Where : 2
3
2
2
2
1 , 31
, 0321 ,
02 and
31
We can observe from Table 3 a change in the means and variances parameters for the
different rotor resistance faults (±25% Rr.n). Theoretically, µ=0 but the actual value cannot be
zero because of the imbalances due to the SPWM and derivatives computation.
Slimane Medjmadj, et al.
197

Table 3. Characteristics of The Residuals
Residual R2 Residual R3
Rr (Ω) Rr (Ω)
1.35 1.8 2.25 1.35 1.8 2.25
μ -0.014 -0.009 -0.016 0.018 0.01 0.012
σ 2.828 3.336 2.713 3.746 4.432 3.590
max 4.988 5.677 4.760 6.708 7.783 6.274
min -5.051 -5.707 -4.872 -6.434 -7.67 -6.32
To evaluate the method, we suppose that at t = 2s, a rotor resistance fault (25% is added to
the value of Rr,n) appears. This failure has an influence on all variables of the system because of
the control loop that propagates the fault effect.
Figure 11 shows the results of fault diagnosis by using the 2σ method on R2 and R3. Clearly,
the fault is not detected because the residuals remain under the thresholds computed with the 2σ
method.
a. R2
b. R3
Figure 11. 2σ algorithm results
Let us now analyse the results of the two-sided CUSUM algorithm. The evolution of
kg and
kg for the two residuals R2 and R3 are presented on Figure 12.
Thresholds computed from R2
Robust Fault Diagnosis and Load Torque Estimation in Electrical Drives
198

Thresholds computed from R3
Figure 12. Two-sided CUSUM algorithm results
As it can be seen in Figureure.12, on the contrary of the 2σ method, the fault is detected with
no false alarm in 215 ms. The rate of no-detection corresponds to the number of samples during
the detection time.
Table 4. Results of The Two-Sided Cusum Algorithm Parameter R2 R3
0.1364 0.1976
µo -0.0056 0.0119
Max kg 697.201 924.326
Max kg 698.517 923.851
h 698.517 924.326
Alarm time 2.215 2.220
Rate of no detection 0.107 0.110
Rate of false alarm 0 0
Therefore, if a fault induces in change in the mean, the two-sided CUSUM algorithm is more
efficient than the 2σ one. In order to enhance the fault diagnosis, it is necessary to check the
robustness to load torque variations. Figure.13 represents the load torque variations, from the
nominal torque (25 N.m) to an overload of 40% (Tl=35N.m).
Figure 13. Load torque (real and estimated)
Residual R1 (Figure.14 (a)) can be used to detect an overload (Figure.13), while residuals R2
and R3 are clearly robust against the load torque variations.
v
Slimane Medjmadj, et al.
199

a. R1
b. R2
c. R3
Figure 14. Residuals robustness evaluation
6. Conclusion
This work has presented the application of the analytical redundancy relations to derive
structured residuals for the rotor fault detection in an induction motor drive. To smooth the
residuals, the derivatives are successfully computed with a sliding mode observer. Comparison
with the classical derivative shows the superiority of the method.
Within the Fault Detection and Isolation scheme, the residuals have been analysed and
because they are Gaussian, thresholds are determined with the two-sided CUSUM algorithm.
The results have shown that the rotor resistance abrupt variation is detected with no false alarm.
The robustness of the detection against the load torque variation has also been proved.
Beside, the residuals have also been used to estimate accurately the load torque. The results
are very encouraging and further investigations on the use of residuals for parameter estimation
and other fault detection and diagnosis are being conducted. Experimental validations should
also emphasize the effectiveness of the approach.
7. References
[1]. M.E.H. Benbouzid, “Bibliography on induction motors faults detection and diagnosis,”
IEEE Trans. Energy Conversion, vol. 14, n°4, pp.1065-1074, December 1999.
[2]. D.J. Siyambalapitiya, P.G. MClaren, “Reliability improvement and economic benefits of
on-line monitoring system for large induction machines,” IEEE Transactions on Industry
Applications 26 (1990) 1018–1025.
[3]. O.V. Thorsen, M. Dalva, “A survey of faults on induction motors in offshore oil industry,
petrochemical industry, gas terminals, and oil refineries,” IEEE Transactions on Industry
Applications 31 (1995) 1186–1196.
[4]. R. Isermann “Fault diagnosis systems: An introduction from fault detection to fault
tolerance,” ISBN-10 3-540-24112-4 Springer, 2005.
Robust Fault Diagnosis and Load Torque Estimation in Electrical Drives
200
[5]. Delpha, D. Diallo, M.E.H.Benbouzid and C.Marchand “Application of classification
methods in fault detection and diagnosis of inverter fed induction machine drive: a trend
towards reliability,” The European Physical Journal Applied Physics -Vol. 44, Issue 02,
Nov 2008, pp 215 – 222.
[6]. Filho, E. R., Riehl, R. R, & Avolio, E. “Automatic three-phase squirrel-cage induction
motor test assembly for motor thermal behavior studies,” In Proceedings of the IEEE
international symposium on industrial electronics; 1994, (ISIE’94) (pp. 204–209).
[7]. Stone, G. C., Sedding, H. G., & Costello, M. J. “Application of partial discharge testing to
motor and generator stator winding maintenance,” IEEE Transactions on Industry
Applications, (1996); 32(2), 459–464.
[8]. J. Holland, “Adaptation in Natural and Artificial Systems”, MIT Press, 1975.
[9]. F. Zidani, D. Diallo, and M. E. H. Benbouzid, “A fuzzy-based approach for the diagnosis
of fault modes in a voltage-fed PWM inverter induction motor drive,” IEEE Trans. Ind.
Electron., Vol. 55, n° 2, pp. 586–593, Feb. 2008.
[10]. Hammouri, H., Kinnaert, M. and E.H. El Yaagoubi, “Observer-based approach to fault
detection and isolation for non linear systems”, IEEE Tran. Autom. Control, VOL. 44, NO.
10, OCTOBER 1999.
[11]. Seliger, R. and P.M. Frank. “Fault diagnosis by disturbance decoupled non-linear
observers”, In Proc. 30th IEEE Conf. on Decision and Control, Brighton, 1991, pp 2248-
2253.
[12]. Guernez, C., Cassar, J. Ph. And M. Staroswiecki. “Extension of the parity space to non-
linear polynomial dynamic systems”. In Proc. IFAC Safeprocess ’97, Hull, 1997.
[13]. M. Krysander, M. Nyberg, “Structural analysis for fault diagnosis of DAE systems utilizing
graph theory and MSS sets”, Technical Report, Tech. Rep. Lith-ISY-R-2410 Dept of
Electrical Engineering, Link¨oping-Sweeden, 2002.
[14]. J. Lunze, M. Staroswiecki, M. Blanke, M. Kinneart, “Diagnosis A Fault Tolerant Control”,
Springer-Verlag ISBN, 2003, 3-540-010556-4.
[15]. A.S. Willsky, “A survey of design methods for failure detection in dynamic systems”,
Automatica, Vol. 12, pp. 601-611, 1976.
[16]. M. Staroswiecki, G. Comtet-Varga, “Analytical redundancy relations for fault detection
and isolation in algebraic dynamic systems”, Automatica, Vol. 37 (2001) 687-699.
[17]. David P.J. “Interpolation and approximation”, New York: Dover publications, 1975.
[18]. S. Medjmadj, D. Diallo and M. Mostefai, "Active Mechanical Sensor Fault Tolerant
Control of PMSM drive", 9th international conference on electrical engineering and first
workshop on robotics and controls, University of Batna, Algeria, Oct. 2016.
[19]. S. Medjmadj, D. Diallo, M. Mostefai, C. Delpha and A. Arias, "PMSM drive position
estimation: Contribution to the high-frequency injection voltage selection issue", IEEE
Transactions on energy conversion, Vol. 30, NO.1, pp. 349- 358, March 2015.
[20]. S. Medjmadj , M. Mostefai, K.E. Hemsas, "Robust analytical redundancy relations and
artificial neural networks for fault detection and isolation in electric drives", The
International conference on electronics & Oil ICEO’11 university Ouargla, Algeria, 1-2
Mars 2011.
[21]. M. Staroswiecki, “Surveillance: le cadre linéaire et quelques extensions”, LAIL-CNRS
UPRESA 8021 EUDIL, Université Lille I 59655 Villeneuve d’Ascq cedex, 2001.
[22]. M.A. Djeziri, “Diagnostic des systèmes incertains par l’approche bond graph”, PhD Thesis,
Ecole Centrale de Lille, December 2007.
[23]. M.R. Spiegel. “Statistique”, The Mc Graw-Hill Companies, Inc. ISBN. 2-10-0006515-7,
2002.
[24]. J. Marzat, E. Walter and H. Piet-Lahanier, “Worst-case global optimization of black-box
functions through Kriging and relaxation”, Journal of Global Optimization, hal-00682475,
version 1 - 6 Apr 2012.
[25]. F. Gustafsson, “Adaptive Filtering and Change Detection”, Wiley London, 2001.
Slimane Medjmadj, et al.
201

[26]. M. Basseville and I.V.Nikiforov, “Detection of Abrupt changes: Theory and application”.
Prentice Hall Englewood Cliffs, NJ, 1993.
[27]. G. Comtet-Varga, “Surveillance des systèmes non linéaires”, PhD Thesis, Université des
Sciences et Technologie de Lille, France, December 1997.
[28]. A. Levant, “Robust exact differentiation via sliding mode technique”. Automatica, Vol. 34,
No. 3, pp. 379-384, 1998.
[29]. T. Floquet and J.P. Barbot, “Super twisting algorithm-based step-by-step sliding mode
observers for nonlinear systems with unknown inputs”. International Journal of Systems
Science 38, 10 (2007) 803-815.
[30]. S. Solvar, V. LE, M. Ghanes, J.P. Barbot and G. Santomenna , “Sensorless second order
sliding mode observer for induction motor”, IEEE Control Conference Application,
Yokohama : Japan, 2010.
[31]. N. Djeghali, M. Ghanes, S. Djennoune and J.P. Barbot, “Backstepping Fault Tolerant
Control Based on Second Order Sliding Mode Observer: Application to Induction Motors”,
50th IEEE CDC-ECC Orlando, FL, USA, December 12-15, 2011.
Slimane MEDJMADJ received his engineering, magister and PhD degrees in
electrotechnique from the University of Setif 1, Setif, Algeria in 1996, 2005
and 2015, respectively. He is currently an Assistant Professor in the
Department of Electromechanical, Bordj Bou Arréridj University, Bordj Bou
Arréridj, Algeria. He is a Member of the Laboratory of Control (LAS),
University of Setif. His main research interests include diagnosis and fault
tolerant control of electric drives.
Demba DIALLO Senior Member IEEE SM05, received the M.Sc. and Ph.D.
degrees both in Electrical and Computer Engineering, from the National
Polytechnic Institute of Grenoble, France, in 1990 and 1993.
He’s currently Professor at the University Paris Sud and is with the Group of
Electrical Engineering Paris. His current area of research includes fault
diagnosis, fault tolerant control and energy management. The applications are
related to more electrified transportation sytems (EV and HEV) and
microgrids.
Mohammed MOSTEFAI was born in B.B.A., Algeria, on April 16, 1965. He
received the Engineering Diploma degree in electronics from the University of
Setif, Sétif, Algeria, in 1988, and the Ph.D. degree in automatic and software
engineering from the University of Lille, Lille, France, in 1994. Currently, he
is a Full Professor with the University of Setif. Since February 2006, he has
held several scientific and administrative responsibilities, first as President of
the scientific committee, then as Director of the Automatic Control Laboratory,
and finally as Vice President for Research with the University of Setif. His
research interests include study, modeling, analysis, and control of industrial systems. These are
mainly production systems, ranging from electro-energy systems (electric machines and
networks) up to large automated manufacturing systems.
Robust Fault Diagnosis and Load Torque Estimation in Electrical Drives
202