robin edwards h ampshire county council population and household forecasts for output areas methods...
Post on 22-Dec-2015
214 views
TRANSCRIPT

Robin EdwardsHampshire County Council
Population and Household Forecasts for Output Areas
Methods and Uses
Contents
• Land Availability Monitoring System (LAMS)
• Use of LAMS data in Population Forecasting Model
• Outline of Complete Small Area Population Forecasting Model (SAPF)
• Outputs from Model and Uses

Main Features of Land Availability Monitoring System (LAMS)
• Planning decision and planning monitoring system• All planning consents granted in the county• All sites allocated in local and structure plans• Record created for each site and mapped on to GIS• Development progress – starts, completions• Estimated phasing of outstanding development
Sites with Full Planning Permission
Dwellings by– Number– Type– Tenure– Number of bedrooms– Completion year(s), actual or
estimated

Remaining Sites
• Sites with Outline Planning Permission– Dwellings by number (estimated),
type, tenure and estimated completion year
• Allocated Sites– Dwellings by number and completion
year (both estimated)
LAMS Information into SAPF Model
For each record• Output area code via link with GIS• Number of completions by type,
tenure, number of bedrooms and year• Number of losses by year• Estimated phasing of outstanding
development on large sites by year (with details where known)

Output from LAMS; Input to SAPF
Year
OA TT11-73
TT11
TT21
TT31
TT41 TT51
TT61
TT71 TT12
2002
24UNGA0009
24 0 0 0 0 0 0 24
2002
24UNGA0010
27 2 15 6 4 0 0 0
2002
24UNGA0011
12 1 11 0 0 0 0 0
Estimating Future Completions on Small Sites
Sites not phased so estimates based on:
• Past completion trends• Past geographical distribution
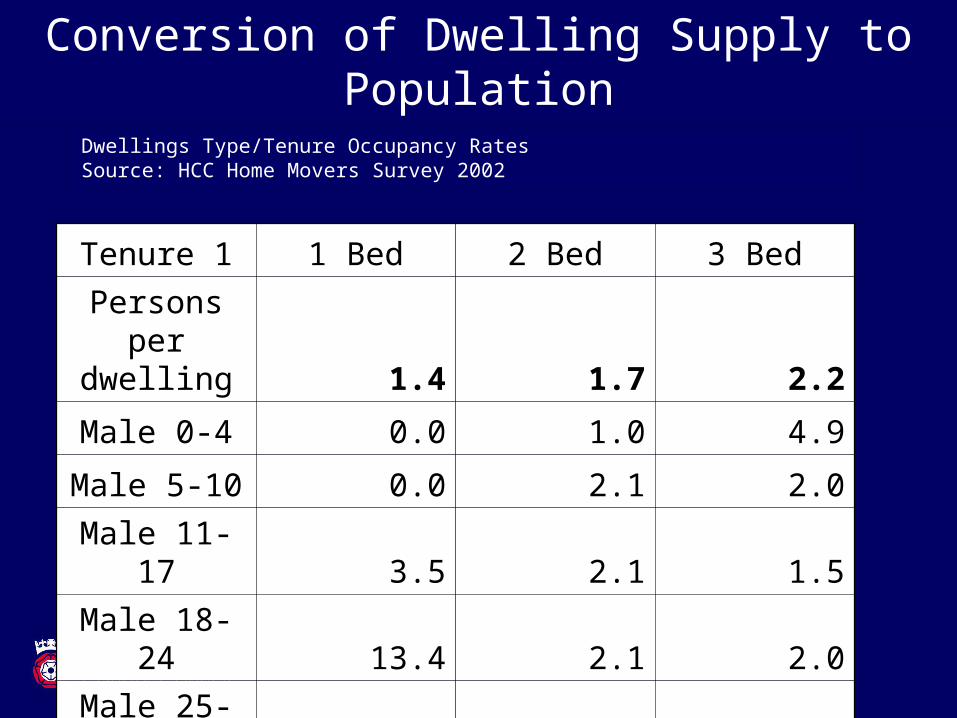
Conversion of Dwelling Supply to Population
Dwellings Type/Tenure Occupancy Rates Source: HCC Home Movers Survey 2002
Tenure 1 1 Bed 2 Bed 3 Bed
Persons per
dwelling 1.4 1.7 2.2
Male 0-4 0.0 1.0 4.9
Male 5-10 0.0 2.1 2.0
Male 11-17 3.5 2.1 1.5
Male 18-24 13.4 2.1 2.0
Male 25-34 4.5 8.3 13.1
Basic Model Structure
• Demolitions Module • Natural Change Module• Out Migration Module• Dwelling Stock Gains Module• Other In Migration Module
Geographical Levels Recognised by Model
• Output Areas• Wards• Districts• National (County)

Age Ranges Recognised by Model
• Single year of age and gender• Quinary age groups by gender• Aggregated age groups by
gender
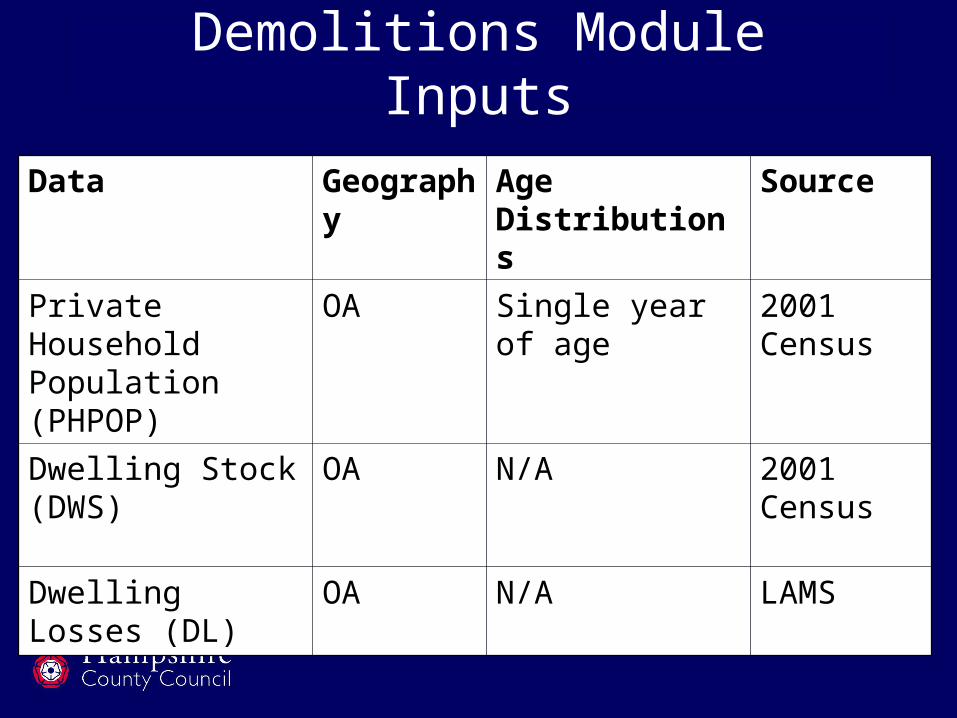
Demolitions Module Inputs
Data Geography
Age Distributions
Source
Private Household Population (PHPOP)
OA Single year of age
2001 Census
Dwelling Stock (DWS)
OA N/A 2001 Census
Dwelling Losses (DL)
OA N/A LAMS

Natural Change Module Inputs
Data Geography
Age Distribution
Source
Private Household Population
OA Single year of age
Demolitions Module
Fertility Rates (FR)
National Single year of age
GAD
Mortality Rates (MR)
National Single year of age
GAD
Actual Births Ward All ages of mother
Vital Statistics
Actual Deaths Ward 0-64, then quinary age groups
Vital Statistics

Out Migration Module Inputs
Data Geography
Age Distribution
Source
Private Household Population
OA Single year of age
Natural Change Module
Out Migration Propensities
Ward 5 year age groups
2001 Census
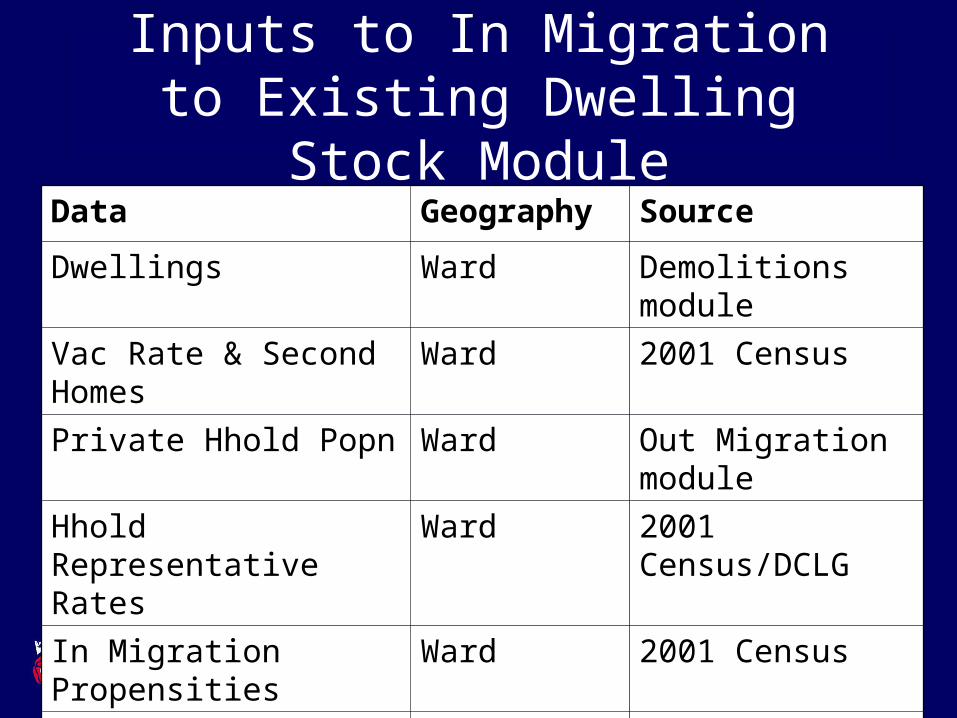
Inputs to In Migration to Existing Dwelling Stock
ModuleData Geography Source
Dwellings Ward Demolitions module
Vac Rate & Second Homes
Ward 2001 Census
Private Hhold Popn Ward Out Migration module
Hhold Representative Rates
Ward 2001 Census/DCLG
In Migration Propensities
Ward 2001 Census
England & Wales pop
National GAD

Constrained Final Population Forecast
• Basic assumption: in each district, rate of decline in average hhold size equals the average annual rate of decline between the two most recent censuses

Inputs Required to Calculate Constraints for Final Population
Data Age Distn
Geography
Source
Private Hhold Pop
District All ages In Migration Module
Hholds District All ages In Migration Module
Av Hhold Size
District N/A 1991/2001 Censuses
HHold Rep Rates
Ward Quinary age groups
In Migration Module
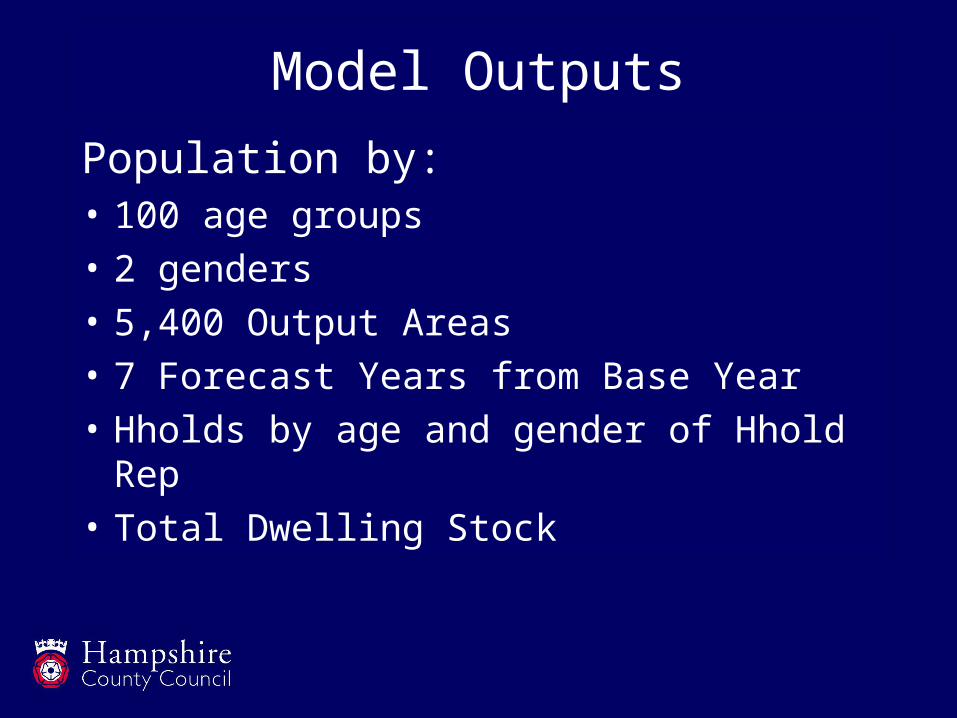
Model Outputs
Population by:• 100 age groups• 2 genders• 5,400 Output Areas• 7 Forecast Years from Base Year• Hholds by age and gender of Hhold
Rep• Total Dwelling Stock

Components of Forecast Population Change
• Births• Deaths• Out Migration due to Dwelling Stock
Loss• Out Migration from Existing Dwelling
Stock• In Migration to New Dwellings• In Migration to Existing Dwelling Stock
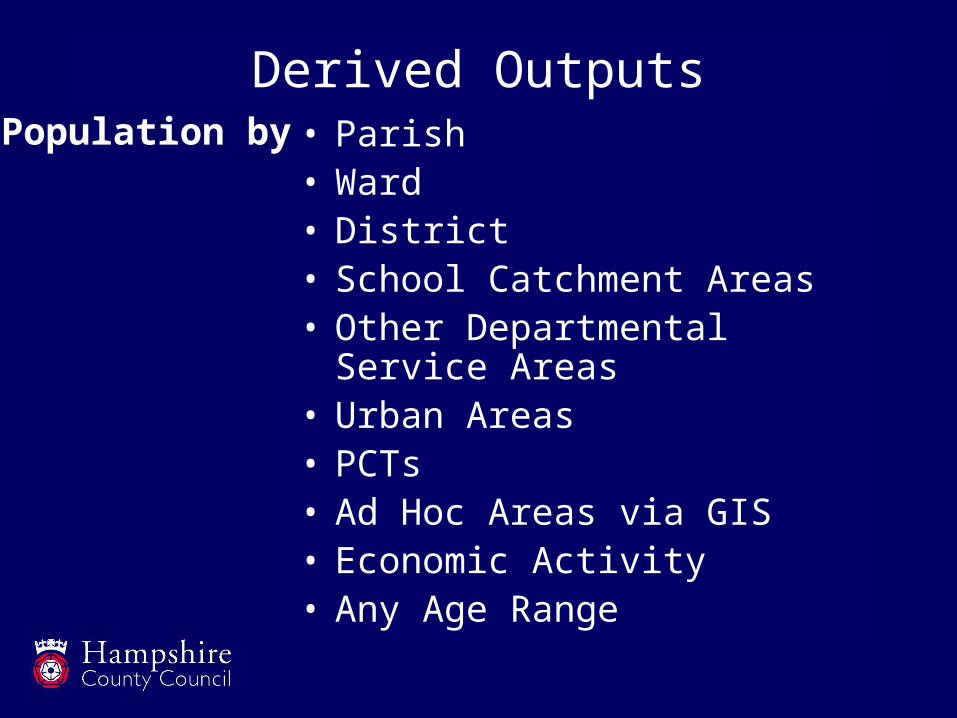
Derived Outputs• Parish• Ward• District• School Catchment Areas• Other Departmental
Service Areas• Urban Areas• PCTs• Ad Hoc Areas via GIS• Economic Activity• Any Age Range
Population by