roberts, jean- note 129 - ed
TRANSCRIPT

DOCUMENT RESUME
ED 085 980 EC 060 971
AUTHOR ) Roberts, Jean-TITLE Examination and Health History Findings Among
Children and Youth, 6-17 Years. United States.INSTITUTION National. Center for Health Statistics (DHEW),
Rockville, Md.REPORT NO DHEW-HRA-74-1611PUB DATE Nov 73NOTE 78p.; Vital and Health Statistics, Series 11, No.
129AVAILABLE FROM Superintendent of Documents, U.S. Government Printing
Office, Washington, DC 20402 ($1.00)
EDRS PRICE MF-$0.65 HC-$3.29DESCRIPTORS Adolescents; Age Differences; Childhood; Demography;
*Exceptional Child Research; *Health; Incidence;Medical Evaluation; Parent Role; Public Health;Racial Differences; *Special Health Problems;*Statistical Data; *Surveys
ABSTRACTNational estimates on physical health status, health
problems, or abnormal conditions of approximately 13,887noninstitutionalized American children, 6 to 11 years of age in 1963through 1965, and adolescents, 12 to 17 years of age in 1966 through1970, were derived from pediatric examinations in the National HealthExamination survey and from parent ratings of children's present andpast medical history. The two surveys involved samples. of childrenand adolescents representative of the population with respect to suchcharacteristics as age, sex, race, region, and size of place ofresidence. Major findings showed that parents considered 52% of thechildren (earlier survey) and 67% of the adolescents (later survey)to be in very good health; that pediatricians found only one of eightchildren to have one or more significant problems (such ascardiovascular or physical abnormality) compared with one youth infive for the older group; that serious accidents increased withconsistent significance with increased age; that approximately 4% ofboth groups had hearing problems; and that 7% of the youths (slightlyhigt,':r in the younger groups) had vision problems. Additional majorfindings indicated that Negro children and youths more frequentlywere found to be in the abncrmal range than their white counterparts;that children in the West were less and children in the South weremore frequently abnormal than children elsewhere; and that theproportion of abnormal conditions in children decreased consistentlyas family income level increased. (Appendixes contain tabularmatErial such as statistical notes, history forms, and socioeconomicterms.) (MC)

)
D A A
'I
.1
c,
4),0,
NCHSI e
if 4S'T A:C'
U. S. DEPARTMENT_ OFHEALTH; EDUCATION. AND WELFARE.
& F'ublicoHeal,th §eryice1
`Health Resources AdminiSt`ration-;
Series Il reports present findings from the National Health ExaminationSurvey, which obtains data through direct examinatioroests, and meas-urements of samples of the U.S. population. Reports 1 through 38 relateto the adult program, Cycle I of the Health Examination Survey. Thepresent report is one of a number of reports of findings from the chil-dren and youth programs, Cycles II and III of the Health ExaminationSurvey. These reports are being published in Series 11 but are num-bered consecutively beginning with 101, It is hoped this will guideusers to the data in which. they are interested.
Vital and Health Statistics-Series 11-No. 129
For sale by the Superintendent of Documents, U.S. Uovernment Printing Office, Washington, D.C. 20402 - Price Si

Data from theNATIONAL HEALTH SURVEY
Series 11Number 129
Examination and Health History
Findings Among Children and
Youths, 6-17 Years
United States
Diagnostic impression findings from the examination and medical historyof the Health Examination Survey as rated by the parent among children
. in 1963-65 and youths in 1966-70 by age, sex, race, geographic region,and family income.
DHEW Publication No. (HRA) 74-1611
U.S. DEPARTMENT OF HEALTH, EDUCATION, AND WELFAREPublic Health Service
Health Resources AdministrationNational Center for Health StatisticsRockville, Md. November 1973

NATIONAL CENTER FOR HEALTH STATISTICS
EDWARD B. PERRIN. Ph.D., Acting Director
PHILIP S. LAWRENCE, Sc.D., Deputy DirectorGAIL F. FISHER, Assistant Director for Health Statistics Development
WALT R. SIMMONS, M.A., Assistant Director for Research and Scientific DevelopmentJOHN J. HANLON, M.D., Medical AdvisorJAMES E. KELLY, D.D.S., Dental Advisor
EDWARD E. MINTY, Executive Officer
ALICE HAYWOOD, Information Officer.
DIVISION OF HEALTH EXAMINATION STATISTICS
ARTHUR J. McDOWELL, DirectorGARRIE J. LOSEE, Deputy Director
PETER V. V. HAMILL, M.D., Medical Advisor, Children and Youth ProgramsHENRY W. MILLER, Chief, Operations and Quality Contio: Branch
JEAN ROBERTS, Chief, Medical Statistics Branch
COOPERATION OF THE BUREAU OF THE CENSUS
In accordance with specifications established by the NationalHealth Survey, the Bureau of the Census, under a contractualagreement, participated in the design and selection of the sample,and carried out the first stage of the field interviewing and certainparts of the statistical processing.
Vital and Health Statistics-Series 11-No. 129
DHEW Publication No. (HRA) 74-1611Library of Congress Catalog Card Number 74-600042

Introduction
CONTENTS
Page
1
Data Sources 2
Medical History 2
Physical Examination 3
Findings 5
Health Status 5
Medical History 11
Examination-History 18
Health Status - -Race, Region, and Income Differentials 22Medical History-- Race, Region, and Income Differentials 25
Summary 26
References
List of Detailed Tables
28
29
Appendix I; Statistical Notes 54The Survey Design 54Reliability 55Sampling and Measurement Errors 56Small Numbers 56,
Appendix II. Recording and History Forms 57Child's Medical History--Parent 57Medical History of Youth -- Parent's Questionnaire 61Diagnostic Impressions (Examination of Child) 66Summary of Diagnostic Impressions (Examination of Youth) 68
Appendix III. Demographic and Socioeconomic Terms 70
iii

Data not available
Category not applicable
Quantity zero
Quantity more than 0 but less than 0.05 0.0
Figure does not meet standards ofreliability or precision
iv
EXAMINATION AND HEALTH HISTORY FINDINGSAMONG CHILDREN AND YOUTHS
Jean Roberts, Division of Health Examination Statistics
INTRODUCTION
This report contains information on healthstatus and health history in relation to the sig-nificant examination findings among children 6-11 years and youths 12-17 years in the UnitedStates, as estimated from the Health Examina-tion Survey programs of 1963-65 and 1966-70,respectively.
The Health Examination Survey, throughwhich these data were obtained, is one of the ma-jor programs of the National Center for HealthStatistics, authorized under the National HealthSurvey Act of 1956 by the 84th Congress as acontinuing Public Health Service activity to deter-mine the health status of the population.
In carrying out the intent of the NationalHealth Survey,1 three different programs areused. The Health Interview Survey, collectinghealth information from samples of people byhousehold interview, is focused primarily on theimpact of illness and disability within variouspopulation groups. The Health Resources Sta-tistics Division obtains health data as well ashealth resource and utilization informationthrough surveys of hospitals, nursing homes, andother resident institutions and the entire rangeof personnel in the health occupations. The HealthExamination Survey, from which the data in thisreport derive, collects health data by directphysical examination, tests, and measurement'sperformed on samples of the population. Thelatter program provides the best way of obtain-ing actual diagnostic data on the prevalence of
medically defined illnesses. This is the only oneof the National Center for Health Statistics pro-grams to secure information on unrecognizedor undiagnosed conditions as well as on a varietyof physical, physiological, and psychologicalmeasures within the population. Medical history,demographic, and socioeconomic data are alsocollected on the sample population under studywith which the examination findings for thosepersons may be interrelated.
The Health Examination Survey is conductedas a series of separate programs, or cycles,each of which is limited' to some specific seg-ment of the United States population and to spe-cific aspects of health. During the first cycle,-the prevalence of certain chronic diseases andthe distribution of various physical and physio-logical measures were, determined among a de-fined adult population.'"
This report is based on findings from thetwo programs of the Health Examination Surveywhich followed the first cycle. For the secondcycle, a probability sample of the noninstitution-alized children 6-11 years of age in the UnitedStates was selected and examined. In the thirdcycle, a similarly designed probability sample ofthe noninstitutionalized youths 12-17 years of agein the United States was selected and examined.The two programs were developed to obtain basicmeasures of growth and development as well asdata on other health characteristics for the entirecontinuum of childhood through adolescence. Thequestionnaire and examination content and pro-cedures were specially adapted for each of the

two age groups, taking into account the differencesin the health, mental, and behavioral character-istics of children and youths. The examinationsincluded those given by a pediatrician who wasassisted by a nurse, those given by a dentist,tests administered by a psychologist, and a va-riety of tests and measurements by laboratoryX-ray technicians. The survey plan, sample de-sign, examination content, and operation of thesesurveys have been described in previous re-ports. l.'
Field collection operations for the children'scycle started in July 1963 and were completedin December 1965. Of the 7,417 selected in thesample, 7,119 children, or 96 percent, were ex-amined. This national sample is closely repre-sentative of the roughly 24 million noninstitu-tionalized children aged 6-11 years in the UnitedStates with respect to age, sex, race, geographicregion, population size of place of residence, andrate of population change in size of place of res-idence from 1_930 to 1960.
Data collection in the youths' cycle began inMarch 1966 and was completed in March 1970.For this program 7,514 youths were selected inthe sample of whom 6,768, or 90 percent, wereexamined. This national sample is closely rep-resentative of the 22.7 million noninstitution-alizeci youths 12-17 years of age in the UnitedStates with respect to the same characteristicsas those indicated for the children's survey. Thesample design for the youths' survey providedfor use of the same sampling areas and housingunits as the preceding survey among children.As a result nearly one-third of the youths-in thelater study had also been examined in the chil-dren's survey. The time lapse between the twoexaminations ranged from 28 months to 5 years,with a median time lapse of about 4 years.
In each of these survey programs, exami-nations were conducted consecutively in 40 dif-ferent locations throughout the United States.During his single visit, each child or youth wasgiven a standardized examination by the exam-ining team in the mobile units specially designedfor use in the survey. (During the thid cycleonly, girls whose urine specimens were foundpositive for bacteriuria were brought back forrepeat urine tests.) Prior to the examination,demographic and socioeconomic data on house-
2
hold members as well as medical history, be-havioral, and related data on the. child or youthto be examined were obtained from his parents.An additional Health Habits and History form wasalso completed by the youth before he arrivedfor the examination and a Health Behavior formwas completed by him while in the examinationcenter. Ancillary data were requested from theschool attended by the child or youth; these in-cluded his grade placement, teacher's ratings ofhis behavior and adjustment, and health problemsknown to his teicher. A birth certificate was ob-tained for each child and youth ,for verificationof his age and information related to his con-dition at birth. Statistical notes on the survey de-sign, reliability of the data, and sampling andmeasurement error are shown in appendix I.
DATA SOURCES
Medical History
Children. At the time of the initial visit tothe sample household, an interviewer from theU.S. Bureau of the Census left a self-adminis-tered Medical History form (appendix II) with theparents for each eligible child. These were pickedup about a week later by the Health ExaminationSurvey representative, who reviewed them andassisted the parents in completing any incom-plete or inconsistent entries.
The questions from' the medical history ofthe child considered in this report include anyaccidental injuries or infective childhood dis-eases, allergies, chronic conditions, or opera-tions the child may have or have had; whetheror not the child has ever been hospitalized atleast overnight; whether his exercise is or hasever been restricted because of his health; theparer...Ts impression of the child's present healthstatus, anything about his health that is presentlya worry; and whether the child is bothered byrecurrent upper respiratory infections.
Y ouths. The Medical History for youthsobtained from the parent during the 1966-70 sur-vey was generally similar in content with respectto health history and health status to that obtainedfor children in the 1963-65 survey, and the ques-tionnaires were self-administered in a similarmanner in both surveys. Excluded from the ques-
tionnaire for youths were the specific questionswith respect to recurrent upper respiratory in-fections and certain other diseases where theprevalence was known to be substantially loweramong youths than children.
Physical Examination
Children.The examining physician with thesurvey team was either a senior resident or fel-low in pediatrics who had been given specialtraining in the standardized physical examinationused in the survey. The medical history filledout at home by the parent or guardian for eachchild was available for review on the night be-fore the examination. The examination was doneaccording to predetermined standardized pro-cedures with no subseluent examination to clar-ify the initial diagnostic impression.
The purposes of die physical examinationwere to (1) identify examinees considered nor-mal within the limitations of this examination;(2) detect acute conditions (particularly of theeyes, nose, throat, and ears) which might affectother parts of the examination; (3) identify in-sofar as possible examinees with heart diseaseand neurological, muscular, and joint conditions,the" major results of accidents or injuries, andobservable conga- ;vital malformations; and (4) todetect fevei:, asthma, epilepsy, and any othercondition the examining pediatrician considereda contraindication to exercise.
The physician recorded his findings basedon his own best judgment and medical skill, with-out attempting to "compensate" for lack of fol-lowup. As a result the cases that were "over-diagnosed" (relative to what might be revealedby more followup evaluation) may have been tosome extent offset by cases that are, in the sameterms, "underdiagnosed."
Included in the pediatrician's examinationwas an assessment of the general appearance ofthe child with respect to tics, mannerisms, andphysical deformities; tests of the general func-tioning and other abnormalities of the joints andmuscles; a limited neurological and cardiovas-cular examination; and an exr Mination of the eyes,ears, nose, and throat. In the neurological ex-amination when an'y abnormality indicating thepresence of cerebral dysfunction (cerebral palsy,
mental retardation) or other neurological con-dition was noted, additional procedures to con-firm the impression were done.
The general inspection included an observa-tion of the gait, general appearance, and obser-vable physical deformities, observation for ticsor mannerisms and for evidence of finger suck-ing or nail biting, and notation as to evidence ofbreast development, abnormalities, and presenceof axillary hair.
In the examination of joints and muscles, theexaminee performed various specified movementswhich the physician observed for evidence of ab-normality. Additional procedures were intro-duced by the examining physician to confirm orrule out suspected abn( rmal conditions.
eye examination included a careful in-spection for evidence of styes, conjunctivitis,blepharitis, nystagmus, ptosis, and strabismus.In testing for strabismus, the pediatrician usedthe Hirschberg method (corneal light reflex), themoving light test, and the cover test. When stra-bismus was found, the location, type, and con-firming tests were recorded.
For the examination of the ear, nose, andthroat, the pediatrician used a Welch-Allyn pneu-matic otoscope in addition to a Siegle's otoscopeand head light. This part of the examination in-cluded an evaluation of the condition of the drum,auditory canal, and external ear, as well as aninspection of the oral pharynx, tonsils, and nose.
The cardiovascular examinatbn included thepediatrician's listening for and recooding a de-tailed description of the heart sounds, innocentas well as significant murmurs, recording of aphonocardiogram and a 10-lead electrocardio-gram. Two blood pressure .,eadings were takenby the nurse in a standardized specified manner.
On the basis of the findings from his exami-nation, data from other tests, and procedures inthe total examination and the history, the pedia-trician recorded his diagnostic impressions foreach child of either normal or, if not, of thespecific conditions found. For those children hedid not rate as normal, the examining physicianfurther differentiated between those whose phys-ical condition he definitely considered abnormaland those with findings that were not significant.
In recording his impressions he was re-quested not to consider ear conditions when as-
3

sessing the child as "normal" unless the exam-inee had a congenital malformation of the ears.The specific findings from the ENT examinationwere recorded separately.
Prior to the examination, any child whosetemperature was 1000 or over and whom thestaff pediatrician considered either too sick toexamine further or to possibly have a contagiousdisease was taken home and rescheduled for ex-amination later.
The pediatrician also completed a summaryof findings for the child's physician (when paren-tal consent was obtained for this) limited to theresults of procedures not ordinarily done in theusual pediatric examination such as electrocar-diogram and audiometric examination and anymedical findings not already reported as knownin the parent's medical history for the child. When-ever he tentatively diagnosed a previously un-suspected condition which he felt required special
,followup (e.g., heart disease with X-ray or elec-trocardiogram findings), the staff pediatricianwould also telephone the child's own physician toapprise him of the findings.
For those children whose parents had notgiven a signed consent for such contact with theirown physician, the parents were notified by tele-phone whenever an acute condition requiring med-ical care was found in the examination.
Youths.As in the children's survey, theexamining physician with the youth survey teamwas either a senior resident or fellow in pe-diatrics from a selected medical center, school,or hospital who had been given special trainingin the standardized physical examination used inthe survey, including a brief training in specialareas of adolescent medicine particularly withrespect to maturation grading, otolaryngology,and dermatology. On the day before the scheduledexamination, the Medical History of Youth andthe Health Habits and History-Youth forms werereviewed by the examining physician, who paidspecial attention to any entries suggesting a lim-itation on the youth's ability to perform any of thetests or procedures and to items which might re-quire further followup in the course of the ex-amination.
The physician's examination included an eye,ear, nose, and throat examination, check for goi-
4
ter, musculoskeletal and neurological evaluation,cardiovascular examination, grading of facial acne,assessment of sexual maturation, and an appraisalof nutrition. During the examination, the nursedrew a sample of blood (later used to determinehematocrit and hemoglobin, levels of cholesterol,uric acid, serological tests for syphilis, testos-terone levels in boys, protein-bound iodine, andfor genotype determinations of blood groups),ob-rained the three blood pressures (supine beforethe examination and in both supine and sittingpositions after the examination) and for the femalr::examinees completed the menstrual history riues-tionnaire and collected a urine specimen, for cul-ture of bacteriuria.
The eye examination included a careful in-spection for evidence of ,normal conditions ofthe lids, conjunctivae sclerae, pupils, andirides;a cover test for' we presence of any tropia; aninspection of the conjugate gaze; and determina-tion of tl-,; focusing or dominant eye.
IA the limited neurological examination, thephysician, after reviewing the total history andtesting a minimal number of reflexes, performedthe neurological tests necessary to satisfy him-self that no significant neurological abnormalityexisted or when one apparently did to delineateclearly the nature and extent of the abnormality,much as he would do in a clinical setting. He useda number of simple procedures to obtain cluesabout possible musculoskeletal problems, suchas loss of range of motion in a joint or muscleweakness. On the basis of these minimal screen-ing techniques, coupled with the physician's judg-ment and skill in undertaking and interpreting anyfurther tests, he rated the child as normal in theserespects or if abnormal, he described the neu-rological problem. Mental retardation with orwithout abnormal neurological findings was re-corded even though the physician's appraisal atthat point could be only tentative.
The musculoskeletal examination consistedof having the examinee put his wrists, elbows,shoulders, hips, knees, and ankles through a fullrange of motions by a series of actions includingbending forward, abducting legs and arms, squat-ting, and touching toes. If unable to squat or fullyabduct his legs, the hip was investigated by per-forming the Thomas test. Both tibial tuberosities
were palpated for tenderness and swelling as def-inite evidence of past or present Osgood-Schlatterdisease.
For the ear, nose, and throat examinationthere was a general inspection of the external earroutine otoscopic examination of the external au-ditory canals and tympanic membranes, pneu-matic otoscopy, and examination of anterior nares ,
tonsils, and oral pharynx.The breast examination on males was per-
formed by inspection of both areolae and palpa-tion of breast tissue for gynecomastia and ten-derness. For females, maturation was graded andthe breasts and axillae palpated for masses.
For both sexes, the genital examination con-sisted of evaluation of the stage of maturationbased on the presence and distribution of the pu-bic hair. Further examination of males involvedan inspection of the genitalia for circumcision andgrade of maturation, the usual check for hernia,and palpation of the testicles for masses.
The cardiovascular examination was a routineauscultation of the heart. When the physician con-sidered findings from this part of the examinationto be significant or even possibly significant, hemade a tentative diagnosis.
The examining physician then made a sum-mary of his findings based on his training andclinical judgment, the youth's medical history,hip; own examination, the hearing and vision tests,and other data available to him from the otherexamination procedures. From these he decidedwhether or not the adolescent was basicallyhealthy, developing satisfactorily, and growingnormally, excluding from consideration mild,transient problems such as minor cuts or bruises,fractured bones that healed without complications,and colds. Criteria regarding findings affectingnormal growth were interpreted broadly to in-clude all but the minimal and questionable findingswhich did not appear to offset normal growth,development, or function.
As in the children's examination when theparent gave consent for this, the youth's ownphysician was sent a summary of the youth's ex-amination findings and related test results aswell as a photographic copy of the chest X-ray.The survey examining physician noted on the sum-mary any condition of serious intercurrent ill-
ness or new complication of known diseasewhich may not be known to his own physician. Inaddition where warranted for an acutely ill youth,the examining physician called the youth's own_physician to apprise him of his findings and ar-ranged for the immediate referral of the youth tohis own physician for indicated care.
FINDINGS
Health Status
Information on the physical health and healthproblems or abnormal conditions of children 6-11 years of age in 1963-65 and of youths 12-17years of age in 1966-70 was determined in a stand-ardized examination given by specially trainedpediatricians in both studies. In addition, the par-ent was _asked prior to the examination to com-plete a self-administered'medical history in whichthey rated the present health of the child on a4-point scale (very good, good, fair, or poor);that of the youth on a 5-point scale (poor, fair,good, very good, or excellent); and for both groupsto indicate whether or not there was anything aboutthe prospective examinee's health that worriedthe parent.
Children.Over half of the American chil-dren 6-11 years of .age (52 percent) were con-sidered by their parents to be in very good healthwhile 5 percent were rated as in fair or poorhealth (table 1). These findings which indicatethat an estimated 12.4 million children were ratedas in very good health and 1.3 million in fair orpoor health are based on data from the medicalhistory completed by the parent in the Health Ex-amination Survey of 1963-65 among a nationalprobability sample of the 24 million noninstitu-tionalized children in the United States.
Boys were about as likely as girls to be con-sidered in very good health (51.6 percent com-pared with 51.8 percent) and nearly as likely tobe rated in fair or poor health (5.2 percent, boys;5.5 percent, girls), the differences in rates forboys and girls being negligible.
No consistent trend by age in either extremeof this health status rating was found over the 6-11 year range among either boys or girls or forthe total group (table 1 and figure 1).
5

25 r
s
Significantlyabnormal findingson surveyexamination
:
15i.; ss'''' ... .2-
u ,,,, ... ,Vcc ,,,,,, Health a worry
tj.
1 0 ...
.....Nraftwimmion44.4.40°. 'N. Health rated
fair 0 r O0.0.100"so op
0 1 I I I I I I I 1 I I
6 8 10 12 14 16
AGE IN YEARS
Figure 1. Percent of U.S. children in 1963.65 and youths in1966-70 with significantly abnormal findings on survey exam-ination and parent ratings of fair or poor health or health aworry, by age.
Parents of nearly one-fifth of these children(19 percent) were concerned or worried aboutsome aspect of the health of their children at thetime of this study (table 1 and figure 1). The healthof the older children 9-11 years was more likelyto be considered a worry than that of the children8 years of age or younger (20-21 percent com-pared with 17-18 percent), the difference exceed-ing the 95-percent confidence limit for such anestimate or being significant at the 5-percentlevel. Greatest concern was evident for 9- and10- year -old girls and for 9- and 11 -year -old boys.The health of boys was as likely to be a worryto their parents as that of girls (19 percent), andwhile some differences between the two groupsat individual years of age were found across theage range, they were neither consistent nor sig-nificant.
A strong, positive relationship, though notcomplete agreement, may be seen in table 2 andfigure 2 between parent ratings of their children'shealth on these two questions (x23 = 975, p< .00001).The health of nearly all those children whosehealth was rated as poor and of a substantialmajority rated as fair was a worry to their pa-rents (93 and 70 percent, respectively). The pro-
6
portion of children whose health was a worry de-creased significantly with each successiveimproved rating of health status to lesp than 9percent among the group whose health was con-sidered very good. This pattern was similar amongboys and girls and across the entire age range.
On direct examination, the survey pediatri-cians found one child in eight or an estimated 3.1million in the population 6-11 years of age to havesome significant physical abnormality-11 per-cent with some cardiovascular, neurological mus-culoskeletal or other condition (not including se-rious ear infections) and an additional 2 percentwith an acute condition classed as severe otitismedia (table 1 and figure 3). This did not includeabout 1 percent of the children (1.1 percent) whohad findings rated as "not significant."
Boys were slightly more likely than girls tohave such abnormal findings (14 percent comparedwith 12 percent) as were the oldest and the young-est children in the study, the 11-year-olds andthose aged 6-8, though the differences are gen-erally not statistically significant at the 5-per-cent probability level (table 1 and figure 1).
The extent of agreement between parentratings of the health of their children and theirphysical examination survey findings may be seen
th.
§tZa
OS1.1.1 1.1.1
Z30
is, ccu
90
60
I Children 641 years
C.ta: Youths 12.17 Years
Very goodGood Fairor exceent
PRESENT HEALTH RATING BY PARENT
Poor
Figure 2. Percent of U.S. children in 1963-65 and youths in1966.70 with health a worry to parents, by parent ratings ofpresent health status.

40
30
20
10
0
.-,,..4.ronvsnce41
Children 6.11 years
Otitis media
Other significantabnormality
Youths 12.17 years
Figure 3. Percent of U.S. children in 1963-65 and youths in1966-70 with significantly abnormal findings on survey exam-ination.
in table 2 and figures 4 and 5. While a strongpositive association will be notedthe childrenrated as in poor or fair health and those aboutwhose health their parents were concerned weresignificantly more likely than the others to havea significant physical abnormality found on ex-am;nationit is the lack of better agreement be-tween parent ratings and examination findingsthat is of primary interest here in assessing thetrue health status of the child population. Amongthose children whose health was considered to beof concern or to be fair or poor, only 17 percent,20 percent, and 40 percent, respectively, had sig-nificant physical findings on examination. It shouldbe kept in mind here that the parent ratings ofhealth would probably be influenced by whetheror not the child was receiving care or treatmentand would have taken into consideration both phys-ical and mental health while the examination wasgenerally limited to the identification of pri-marily physical abnormalities (although apparentmental retardation would have been noted); thismay account for part of the lack of agreement.
HOwever, among those children about whosehealth parents were not worried or who ratedtheir child's health as good or very good, 10 per-cent, 12 percent, and 9 percent, respectively,
80
60
40
20
Children 6-11 years
Youths 1217 years
Very good Good Fair Pooror excellent
PRESENT HEALTH RATING BY PARENT
Figure 4. Percent of U.S. children in 1963-65 and youths in1966-70 with significantly abnormal findings on survey exam-ination, bi. parent ratings of present health status.
60
40
20
Parent considerspresent health:
A worry
Not a worry
Children 6.11 years Youths 12. 7 years
Figure 5. Percent of U.S. children in 1963-65 and youths in1966-70 with significantly abnormal findings on survey exam-ination among those whose parents were and were not wor-ried about their health.
7

were found to have some significant abnormalcondition on examination.
Information was not available regardingwhether the abnormal conditions found on exam-ination were known or under treatment (unlessthe history indicated this for chronic conditionssuch as asthma or heart trouble).
Youths.About two-thirds (67 percent) ofAmerican youths 12-17 years of age were ratedby their parents as being in very good or excel-lent health, while 4 percent were considered asbeing in fair or poor health, on the basis of find-ings from the Health Examination Survey of 1966-70 among a national probability sample of the22.7 million noninstitutionalized youth in theUnited States (table 1). Thus there were an es-timated 15.2 million youths rated as in at leastvery good health and 0.8 million in fair or poorhealth at the time of this survey.
Boys of this age were more likely to havetheir parents rate their health as excellent or verygood (69 percent) than were girls (65 percent),the difference being statistically significant at the5-percent probability level; while at the otherextreme proportionately nearly as many boys(3.4 percent) as girls (3.8 percent) were con-sidered to be in fair or poor health.
No consistent age-related trend for the en-tire group is evident in the proportion with atleast very good or fair to poor health. However,boys under the age of 16 were more likely thangirls of the corresponding age to be consideredin at least very good health. Some aspect of theirhealth was a worry to the parents of about oneyouth out of seven of thi =. age(15 percent). A slightbut insignificant increase in this rate with in-crease in age up to 15 years may be seen in table1 and figure 1. The trend among boys is gener-ally similar to that among girls except at age 17,where the health of proportionately more boysthan girls is a concern (19 percent compared with15 percent).
Lack of complete agreement but a strong as-sociation between these two ratings of health ofyouths similar to that for children may be seen intable 2 and figure 2 ( x42= 1064, p<.00001). Theproportion of youths whose parents were worriedabout their health decreased steadily from 78 per-cent among those whose health had been rated aspoor to 3 percent among those considered in ex-
cellent health, though unlike the findings for chil-dren, there was a negligible difference betweenthe proportions of those youths in fair and poorhealth.
On examination, the survey pediatrician foundmore than one youth out of five, or an estimated4.9 million in this country, to have some illness,deformity, or handicap (primarily physical) af-fecting normal growth, development, or functioncardiovascular, neurological, musculoskeletal, orother, including the nearly 2 percent with symp-toms of acute otitis media (table 1). This rate ofabnormality is nearly double that found amongchildren primarily because of conditions asso-ciated with the onset of puberty in adolescence,including acne and other maturation problems.
As in the earlier children's examination, boyswere slightly more likely than girls to have suchfindings (23 percent compared with 21 percent),though the difference in rates is not statisticallysignificant. Younger youths, 12 years of age, werealso slightly less likely than the older youths,particularly the 17-year-olds to have abnormalfindings, but again the differences are not largeenough to be statistically significant (table 1 andfigure 1).
, While proportionately more youths than chil-dren were abnormal on examination, the extentof agreement or lack of agreement between pa-rent ratings of health and examination findings ofphysical abnormality are similar (table 2 andfigures 4 and 5). Among those youths whose healthwas of concern to their parents and those whosehealth was rated fair or poor, 37 percent, 46 per-cent, and 64 percent were considered abnormalon examination. Again, as with the children, partof the lack of better agreement here may be dueto the limitation of the examination to primarilyphysical findings (including apparent mental re-tardation) 'while the parent rating undoubtedlytook into consideration both the physical and men-tal or emotional condition of the youth. This, ofcourse, will not explain the fact that among youthswhose parents were not concerned about theirhealth or whose health was rated as good, verygood, or excellent, the proportion of youths withsignificant abnormal findings on the primarilyphysical examination was 19 percent, 27 percent,20 percent, and 17 percent, respectively. As inthe children's study, data were not available re-
garding whether the abnormal conditions found onexamination were known previously or undertreatment (except as noted for such chronic con-ditions as asthma or heart trouble).
Childr in-youths. The disparity between thechildren and youths both with respect to parentratings of health and physical examination find-ings is readily apparent here. As has been indi-cated previously, none of the three assessmentsshow the consistent age-related trend that mighthave been expected if this represented a gradualtrend in health status or parent's attitude towardit with age of the child. There was no evidencein the present study of any increase with age inthe proportion of children found abnormal on ex-amination similar to that reported by Yankauer,Lawrence, and Ballow in their Rochester, NewYork, study of 1952-55, where increment of newadverse conditions between first and fourthgraders exceeded the number corrected so thatrelatively more adverse conditions were presentat the end of the period (fourth grade) than at thebeginning (first grade). Indeed in the present
study any such excess did not start to appear un-til a year or two later.
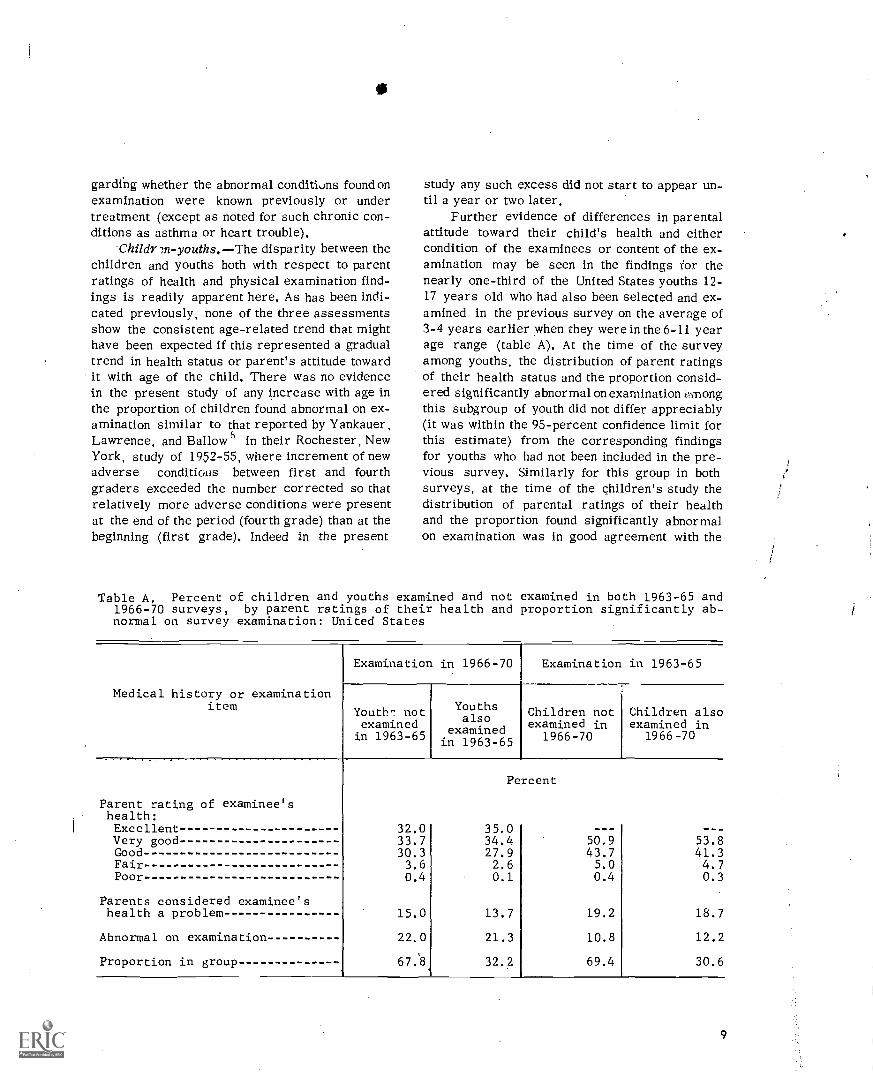
Further evidence of differences in parentalattitude toward their child's health and eithercondition of the examinees or content of the ex-amination may be seen in the findings for thenearly one-third of the United States youths 12-17 years old who had also been selected and ex-amined in the previous survey on the average of3-4 years earlier when they were in the 6-11 yearage range (table A). At the time of the surveyamong youths, the distribution of parent ratingsof their health status and the proportion consid-ered significantly abnormal on examination oinongthis subgroup of youth did not differ appreciably(it was within the 95-percent confidence limit forthis estimate) from the corresponding findingsfor youths who had not been included in the pre-vious survey. Similarly for this group in bothsurveys, at the time of the children's study thedistribution of parental ratings of their healthand the proportion found significantly abnormalon examination was in good agreement with the
Table A. Percent of children and youths examined and not examined in both 1963-65 and1966-70 surveys, by parent ratings of their health and proportion significantly ab-normal on survey examination: United States
Medical history or examinationitem
Examination in 1966-70 Examination in 1963-65
Youth^ notexaminedin 1963-65
Youthsalso
examinedin 1963-65
Children notexamined in
1966-70
Children alsoexamined in
1966-70
Percent
Parent rating of examinee'shealth:Excellent 32.0 35.0Very good 33.7 34.4 50.9 53.8Good 30.3 27.9 43.7 41.3Fair 3.6 2.6 5.0 4.7Poor 0.4 0.1 0.4 0.3
Parents considered examinee'shealth a problem 15.0 13.7 19.2 18.7
Abnormal on examination 22.0 21.3 10.8 12.2
Proportion in group 67:8. 32.2 69.4 30.6
9

corresponding findings among children who werenot reexamined in the later study.
Parents tended to rate the health of youthsin their families significantly better than thehealth of children both when giving a categoricalstatement of health status and when indicatingwhether or not aspects of the examinee's healthwere a concern or worry. Aside from the timelag between the two studies-1963-65 and 1966-70 during which there might have been someattitude or informational changes on the part ofthe parents, there was a slight difference in theorder and context in which these questions werepresented in the self-administered medical his-tory forms of the two surveys (appendix II) thatmay have influenced response to some slight ex-tent. It seems more probable that this reflectsa change in attitude or concern by parents atabout the time children have completed gradeschool and have gone on to junior high school,whether because of increased maturity of thechild or because more of the abnormal conditionswere under care.
With respect to the examination findings, thesurvey pediatricians rated substantially moreyouths than children as having some significantabnormality, even when compensation is made inthe children's examination because of the factthat severe ear pathology was recorded separatelyand not included in the physician's overall diag-nostic impression of the condition of the child,Much of the difference is to be found in the con-ditions associated with the onset of puberty orother aspects of maturation.
Some assessment of the reliability of the ex-amination findings among youths, but not children,was possible, During the survey of youths, rep-licate examinations were performed on 4.5 per-cent of the examinees. Comparison of the diag-nostic impressions from these two examinationsby the same or different examiners showed a highlevel of agreement for such assessments-69percent considered essentially normal on bothexaminations, 15 percent abnormal (significantly)on both, 7 percent abnormal only on the originalexamination, and 9 percent only on the reexam-ination. (Since the questionnaires were not re-administered, no similar measure of reliabilityof the health ratings by parents was obtained.)Whether the differences in the abnormal rate be-
10
80
Z0il 60<Z
X
ZZ0...1<2o
40Zas<u,N0H
'6-iZiti 20ccu.a.
0
All otherconditions
1 ,,,,,,.'' ''.S., :: . ,,,,,
1..
Neuromuscular.joint
1. r"..,,,,Z.
'." I.....ses....%
..i.
\,,_ /6\ C'\....... *OP
Cardiovascular
I I I I I I I 1 1 I I
6 8 10 12 14 16
AGE IN YEARS
Figure 6. Percent of J.S. children in 1963-65 and youths in1966-70 with significantly abnormal findings on survey exam-ination, by type of condition.
tween the two examinations reflects differencesin training, expertise, or attitudes of the exam-iners, chance differences because of the imper-fect reliability of the examination or real differ-ences in the condition of the two study groups, ora combination is not readily evident from the dataavailable,
When comparison is made on the basis of thebroad groups of conditions for which diagnosticimpressions were given, the prevalence of cardio-vascular conditions was significantly greateramong youths than children, consistent with med-ical history data on these conditions though theproportion of the abnormal group in both exam-inations with such conditions was similar (tables1 and 3 and figure 6). The prevalence of signifi-cant neuromuscuizr-joint conditions as well as theactual proportion of such conditions found amongabnormal examinees were both significantlygreater among youths than among children.
Comparison with previous studies are dif-ficult because of differences in examination con-

tent or methods. Yankauer and Lawrence's found21 percent abnormal on examination among thesample of 1,056 Rochester, New York, first grad-ers examined in 1952-53--substantially more thanthe II percent rate among 6-year-olds in thepresent study. In the Rochester study a child wasclassed as abnormal if he or she had any condi-tion affecting health and justifying medical careor observation. Excluded, as in the present study,were acute infections, dental caries, defectivevision or hearing that would be evident throughtesting, or abnormal laboratory findings.
From the Head Start program in California.Gilbert et al" reported 17 percent of the pre-school children, who would have been primarilybut not exclusively the underprivileged, to havebeen considered significantly abnormal on ex-amination. Since these include both medical anddental findings, the rate among the Californiachildren is more nearly comparable with findingsfrom the present study.
The Commission on Chronic Illness studies inBaltimorell and in Hunterdon Countyl- indicatethat from the clinical evaluations of the childrenunder 15 years, 17 percent in the Baltimore studyhad substantial chronic conditions and 15 percentin Hunterdon County were at least somewhat lim-ited in school attendance or participation by theirconditions.
Despite these unexplained differences inoverall findings between children and youths, therelationship between parent ratings of health andthe examination findings of physical abnormalityare of the same order of magnitude in both sur-veys,
Medical History
The medical history completed by the par-ent prior to the examination in both surveys ob-tained information on the history of the child oryouth concerning the more prevalent childhoodinfectious diseases, serious accidental injuries,allergies and related conditions, chronic kidneyor heart conditions, respiratory conditions, andsensory-neurological conditions. Information wasalso obtained on the extent of medical and relatedcare required as determined by hospitalizationfor more than 1 day, any operation undergone,
exercise restriction, .-Ind the regular use of med-icine.
Childhood infectious diseases.The mostprevalent of the childhood infe.:tious diseases wasmeasles. Among children the proportion reportedto have had measles (type not differentiated onhistory) increased from 73 percent among 6-year-olds to over 90 percent by 10 and 11 years of age(table 4 and figure 7). While the disease was re-ported to have occurred at any. age from under1 year to 11 years, about half the examinees werereported to have had measles between 4 and 6years of age. Information obta1ned on the se-riousness of the illness indicated that nearly 5
8ccu,o.
tU7,jI
CC
1/1.zu.,
4,1E'
0.
100
80
60
40
20
0
-..
P
i
Measles
or/ ,Mumps olooftr.,,,4...............ii
pier49,
0 ." ..I,e,,
I
....on.=Whooping cough _...........--
roam 4.100/00"--
eme....... Scarlet feverv :
1
i I 1 I I I i I I i 1
_
1
6 8 10 12 14 16
AGE IN YEARS
18
Figure 7. Prevalence rates for history of selected childhood in-fectious diseases among U.S. children in 1963-65 and youthsin 1966-70, by age.
11

percent were reported to have been sick longerthan usual, 4 percent had a fever longer than 1week, over 2 percent were unusually drowsyafterward, and 1 percent required hospital care.
In the later survey among adolescents, theproportion reported to have had measles in-creased slightly, from 90 percent at age 12 to94 percent at 16 years of age. The prevalenceamong boys and girls was generally similarthroughout the age range 6-17 years.
Chickenpox history was nearly as frequentlyreported as measles among the youths (no datawere obtained on this disease among children).About 84 percent of youths were reported to havehad chickenpox. No trend by age was evident, in-dicating that few, if any, contracted this diseaseafter the age of 11 years. Boys were about aslikely as girls to have had the disease.
The proportion having had mumps increasedconsistently throughout childhood from 38 per-cent among the 6-year-olds to over 55 percentby 10 and 11 years. The increasing trend with agewas less consistent among youths, ranging froma low of 62 percent by 13 years to 67 percent atage 16 years. Except at ages 6 and 14 years, boyswere more likely to have had this disease thangirls. The sex differences in the rates werelarger and more consistently significant amongthe youths than among the children.
Children with a history of mumps most fre-quently had it at 5 or 6 years of age, with two-thirds having the disease 1.1ween 4 and 7 years.Serious complications wer reported less fre-quently for mumps than fo. measles. Nearly 2percent were reported tohrve had mumps longerthan usual and/or had a fever for more than 1week, about 1 percent were unusually drowsyafterward, and less than 1 percent (0.4 percent)were hospitalized during this illness.
Whooping cough history was reported among9 percent of the children and 14 percent of theyouths. Except for the slight inconsistency or dipat ages 12 and 13 years which is negligible,the proportion reported to have had this diseaseincreased steadily from 7 percent among 6-year-olds to 18 percent among 17-year-olds. Boyswere as likely as girls to have had this condition.
Scarlet fever history was reported amongnearly 4 percent of the children, the rate rangingfrom a low of 3 percent at age 6 to 5 percent at
12
27
0
1
Broken bones
Other (including ssssssssssssssssss
burn scars) ssssss
unconscious ose":".".**/".. sssssss ###"4"
\O'Knocked
1
1 I I 1 1 I 1 I
6 8 10 12 14 16 18
ssssssss
AGE 114 YEARS
Figure 8. Prevalence rates for history of major types of seriousaccidental injuries among U.S. children in 1963-65 and youthsin 1966.70, by age.
age 10. In the youth study,.the proportion withsuch a history was 5 percent and ranged fromnearly 4 percent among the 12-year-olds to over6 percent at 17 years. No consistent, significant,age-related trend was evident here, and boyswere as likely as girls to have had the disease.
Accidents.In the children's survey threetypes of serious accidents were differentiated onthe history4-those in which bones were broken,those in which the child was knocked unconsciou,-.,and those in which the child was scarred fromburns. In the youth survey only the first two ofthese types of accidents were identified separa-tely.
The proportion of examinees who had everbroken any bones increased fairly consistentlywithage from 6 percent among the 6- and 7-year-olds to about 19 percent by the age of 15-17 years.Relatively fewer children had ever been knockedunconscious, but the proportion with such an in-jury increased even more significantly from 2percent at age 6 to 12 percent by 17 years of age.Some gradual increase with age may be seen alsoin the proportion of youths, but not children,having a history of other types of serious acci-dents or injuries (table 4 and figure 8).
Boys were more likely than girls to have hadbroken bones or been knocked unconscious, thedifferential being greater among yo. las than chil-dren. The difference in rates was statistically

significant at the 5-percent probability levelamong children 6-11 years and at the 1-percentlevel among youths 12-17 years. From the age of12 years on, relatively more boys than girls werereported to have had other types of serious acci-dents or injuries; this was not consistently soamong younger children.
In the survey among youths but not children,two further indications of the severity of the ac-cidents were obtained in the medical historythenumber of serious accidents the youth had had andif knocked unconscious, how long he or she re-mained in this condition, Of the 9 percent whomthe parents indicated had experienced some se-rious accident, 82 percent had only one, 15 per-cent had two serious accidents, and 4 percent hadthree or more, The majority of those knocked un-conscious remained in this condition for i houror less. Among the 9 percent to whom this hadhappened, 84 percent recovered consciousnesswithin 1 hour, 12 percent were reported to havebeen unconscious for more than 1 hour but lessthan 24 hours, while 4 percent remained uncon-scious for I day or more.
Allergies and related conditions.The pro-portion reported as ever having had hay fever in-creased substantially with age from less than 4percent among children 6-8 years old to over 10percent among 16- and 17-year-old youths, thedifference between the extremes being statisti-cally significant (figure 9), Boys were more likelythan girls to have or have had hay fever, the dif-ference being statistically significant among chil-dren 6-11 years but not among youths 12-17 years.The rate for boys consistently exceeded that forgirls at each year of age from 6-13 and 15-17years, though the individual differences at eachyear of age were not consistently large enoughto be significant at the 5-percent level.
Asthmatic conditions were reported nearlyas frequently among children as youths (5 percentcompared with 6 percent) and showed no trendwith age. The proportion of children with a his-tory of asthma ranged from 4 percent at age 6 to7 percent at age 7, while among youths the rangewas between 5 percent at age 12 and 7 percent at16 years. Boys were more likely than girls to havesuch a condition, the pattern being consistentacross the 12-year age span. The differences inrates for boys and girls are statistically signif-
15
O'Hay fever 000
Asthma ,,,
somoss01".
0 1 1 I I I I 1 I 1 I I 1 1
6 8 10 12 14 16 18
AGE IN YEARS
Figure 9. Prevalence rates for history of hay fever, asthma, orother allergies among U.S. children in 1963-65 and youths in1966-70, by age.
icant for children 6-11 years and youths 12-17years but not at each individual year of age.
All other allergic conditions were reportedsignificantly more frequently among youths thanchildren (14 percent compared with 11 percent).However, the pattern is not 'consistent across the12-year age span. Boys under the age of '12 weremore likely than girls to have had such conditionsbut from 12-17 years the reverse was consis-tently found.
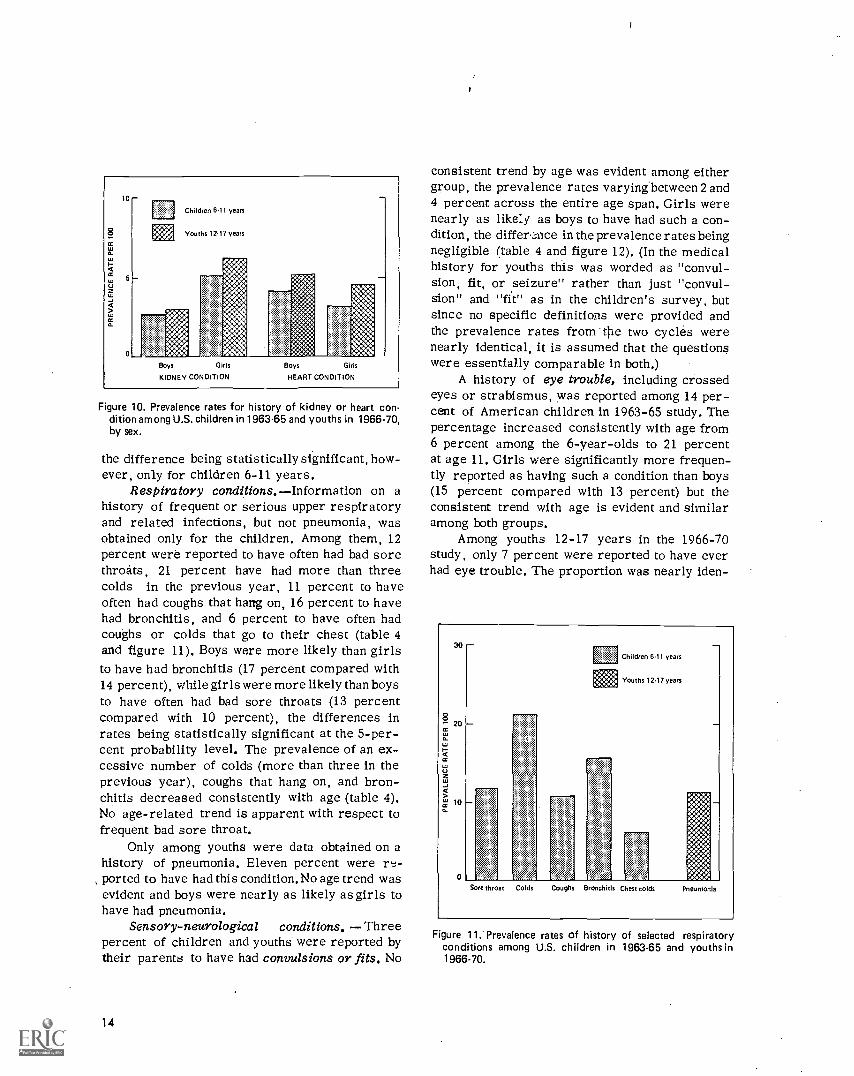
Chronic conditions.A history of kidneytrouble was reported among nearly 4 percent ofchildren 6-11 years of age and 5 percent of youths12-17 years of age. The difference in rates be-tween the two age groups is negligible, and noconsistent trend with age is evident. With few ex-ceptions girls were about twice as likely as boysto have a history of this condition across the en-tire age span of 6 through 17 years (table 4 andfigure 10).
Heart murmurs or other heart conditionswere reported more frequently among youthsthan children-4.9 percent for youths comparedwith 3,7 percent for children 6-11 years olda difference that is statistically significant atthe 5-percent level. Boys were more likelythan girls to have a heart condition (figure 10),
13
Children 6.11 years
Youths 1217 years
Boys G'rls
KIDNEY CONDITION
Boys Girls
HEART CONDITION
Figure 10. Prevalence rates for history of kidney or heart con-dition among U.S. children in 1963-65 and youths in 1966-70,by sex.
the difference being statistically significant, how-ever, only for children 6-11 years.
Respiratory conditions. Information on ahistory of frequent or serious upper respiratoryand related infections, but not pneumonia, wasobtained only for the children. Among them, 12percent were reported to have often had bad sorethroats, 21 percent have had more than threecolds in the previous year, 11 percent to haveoften had coughs that harrg on, 16 percent to havehad bronchitis, and 6 percent to have often hadcoughs or colds that go to their chest (table 4and figure 11). Boys were more likely than girlsto have had bronchitis (17 percent compared with14 percent), while girls were more likely than boysto have often had bad sore throats (13 percentcompared with 10 percent), the differences inrates being statistically significant at the 5-per-cent probability level. The prevalence of an ex-cessive number of colds (more than three in theprevious year), coughs that hang on, and bron-chitis decreased consistently with age (table 4).No age-related trend is apparent with respect tofrequent bad sore throat.
Only among youths were data obtained on ahistory of pneumonia. Eleven percent were re-
, ported to have had this condition.No age trend wasevident and boys were nearly as likely as girls tohave had pneumonia.
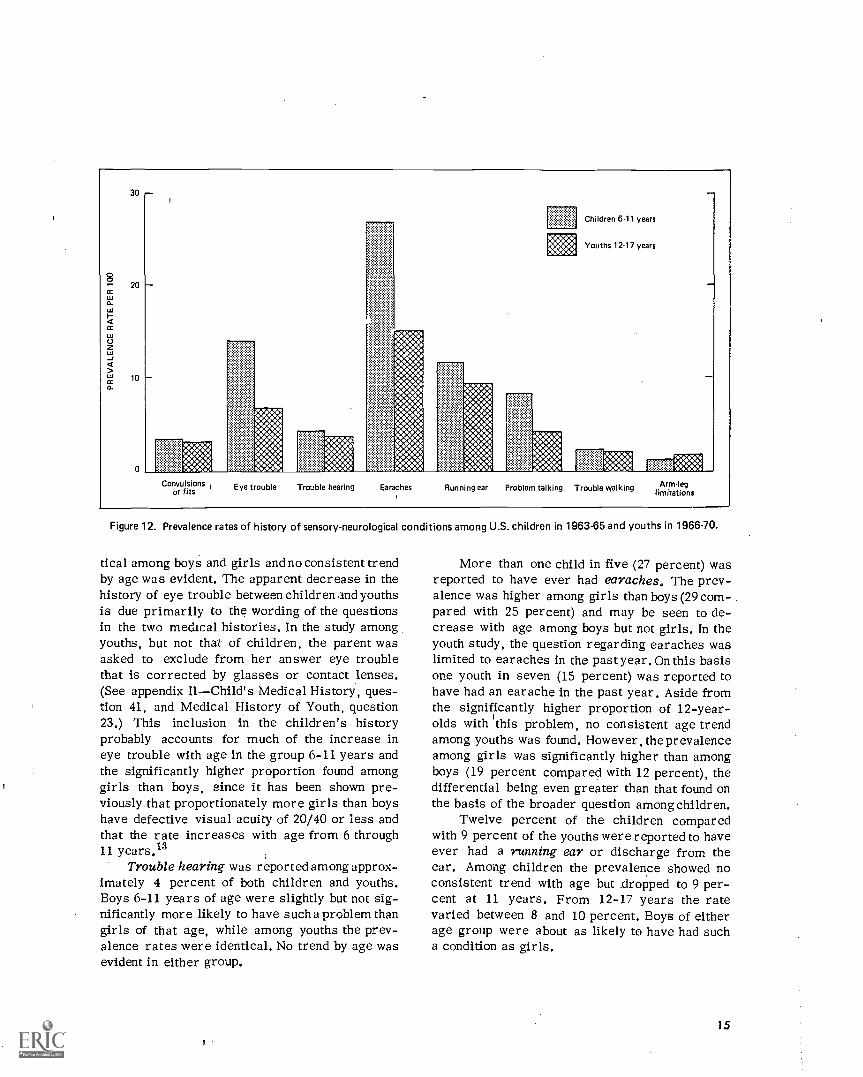
Sensory-neurological conditions. Threepercent of children and youths were reported bytheir parents to have had convulsions or fits. No
14
consistent trend by age was evident among eithergroup, the prevalence rates varying between 2 and4 percent across the entire age span. Girls werenearly as like:y as boys to have had such a con-dition, the differ,::nce in the prevalence rates beingnegligible (table 4 and figure 12). (In the medicalhistory for youths this was worded as "convul-sion, fit, or seizure" rather than just "convul-sion" and "fit" as in the children's survey, butsince no specific definitions were provided andthe prevalence rates from the two cycles werenearly identical, it is assumed that the questionswere essentially comparable in both.)
A history of eye trouble, including crossedeyes or strabismus, was reported among 14 per-cent of American children in 1963-65 study. Thepercentage increased consistently with age from6 percent among the 6-year-olds to 21 percentat age 11. Girls were significantly more frequen-tly reported as having such a condition than boys(15 percent compared with 13 percent) but theconsistent trend with age is evident and similaramong both groups.
Among youths 12-17 years in the 1966-70study, only 7 percent were reported to have everhad eye trouble. The proportion was nearly iden-
30
8" 20
cc
U
cc
'21
101
0
Children 6.11 years
Youths 12.17 years
Sore throat Colds Coughs Bronchit s Chest colds Pneumonia
Figure 11; Prevalence rates of history of selected respiratoryconditions among U.S. children in 1963-65 and youths in1966-70.
30
20
10
WO.Egg
Children 6-11 years
Youths 12.17 years
Ammo*M4g1* ":40A:C44 "X.:441 kla
Convulsionsor fits Eye trouble Trouble hearing Earaches Running ear Problem talking Trouble walking Armleg
limitations
Figure 12. Prevalence rates of history of sensory-neurological conditions among U.S. children in 1963-65 and youths in 1966-70.
tical among boys and girls and no consistent trendby age was evident. The apparent decrease in thehistory of eye trouble between children and youthsis due primarily to the wording of the questionsin the two medical histories. In the study amongyouths, but not that of children, the parent wasasked to exclude from her answer eye troublethat is corrected by glasses or contact lenses.(See appendix IIChild's Medical History, ques-tion 41, and Medical History of Youth, question23.) This inclusion in the children's historyprobably accounts for much of the increase ineye trouble with age in the group 6-11 years andthe significantly higher proportion found amonggirls than boys, since it has been shown pre-viously that proportionately more girls than boyshave defective visual acuity of 20/40 or less andthat the rate increases with age from 6 through11 years.13
Trouble hearing was reported among approx-imately 4 percent of both children and youths.Boys 6-11 years of age were slightly but not sig-nificantly more likely to have such a problem thangirls of that age, while among youths the prev-alence rates were identical. No trend by age wasevident in either group.
More than one child in five (27 percent) wasreported to have ever had earaches. The prev-alence was higher among girls than boys (29 com-pared with 25 percent) and may be seen to de-crease with age among boys but not girls. In theyouth study, the question regarding earaches waslimited to earaches in the past year. On this basisone youth in seven (15 percent) was reported tohave had an earache in the past year. Aside fromthe significantly higher proportion of 12-year-olds with 'this problem, no consistent age trendamong youths was found. However, the prevalenceamong girls was significantly higher than amongboys (19 percent compared with 12 percent), thedifferential being even greater than that found onthe basis of the broader question among children.
Twelve percent of the children comparedwith 9 percent of the youths were reported to haveever had a running ear or discharge from theear. Among children the prevalence showed noconsistent trend with age but .dropped to 9 per-cent at 11 years. From 12-17 years the ratevaried between 8 and 10 percent. Boys of eitherage group were about as likely to have had sucha condition as girls.
15
Problems with the way they talk were re-ported for one of each 12 children (8 percent).The rate decreased with age from 13 percent at6 years to 6 percent at 11 years. The problemsincluded stuttering, stammering, lisping, beingotherwise hard to understand; or other speechproblems. Boys of this age were significantlymore likely than girls to have such a problem(10 percent for boys, 7 percent for girls) and theage-related trend is evident among both groups.
Among youths in the later study, 4 percentwere found to still have such problems. Here theproportion was highest among the 12- and 13-year -olds and levelled off at 4 percent or lessfrom 14-17 years. Boys 12-17 years of age con-tinued to have such problems more frequentlythan girls (5 percent compared with 3 percent).
Trouble with walking or a limp was reportedamong approximately 2 percent of both childrenand youths. Boys were about as likely as girls tohave such a condition and no trend with age wasevident among both groups.
Arm or leg limitation in use was reportedamong about 1 percent of the children and 2 per-cent of the youths. No consistent trend by age wasevident and boys were about as likely to be af-fected as girls.
Other disease conditions.In the study ofchildren, but not of youths, data were obtainedregarding a history of other more serious dis-eases or conditions for which the incidence wasknown to be low, but some estimation of magni-tude was attempted. These include rheumaticfever, poliomyelitis, diphtheria, meningitis, tu-berculosis, diabetes, epilepsy, chorea, and cer-ebral palsy. Less than 1 percent of the childrenwere reported to have had any one of these con-diticms (table 5).
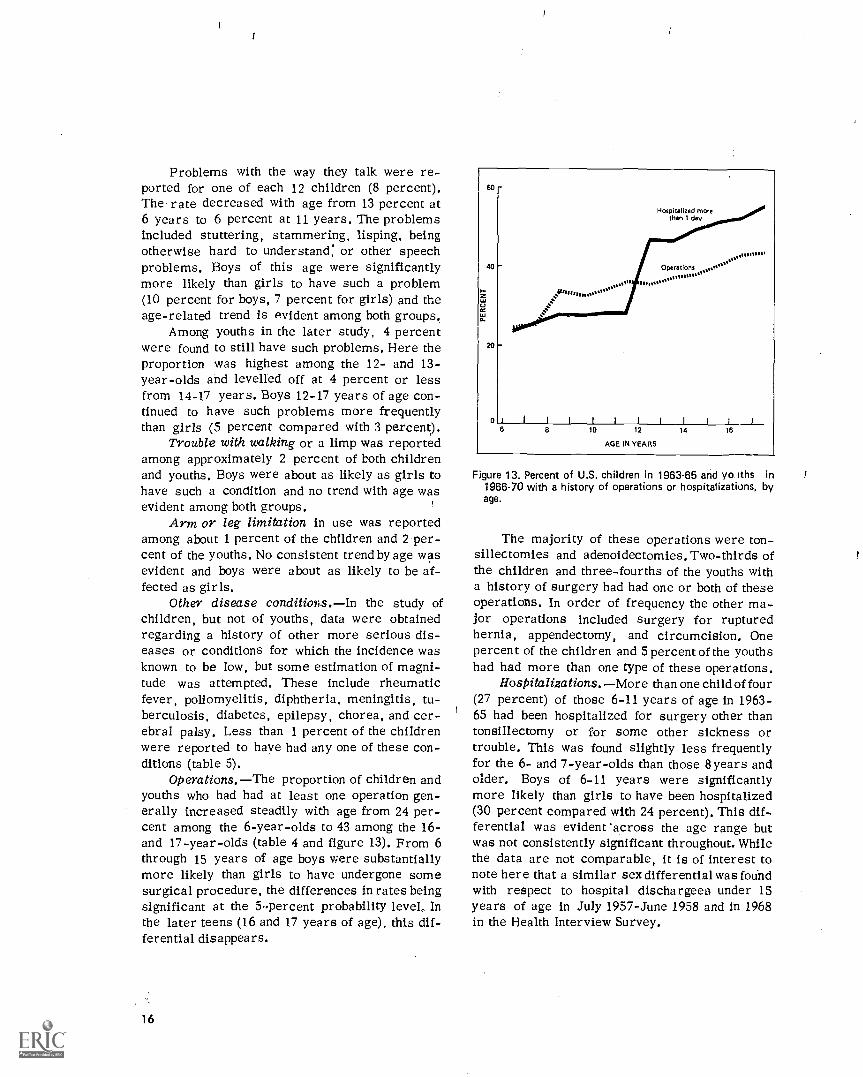
Operations. The proportion of children andyouths who had had at least one operation gen-erally increased steadily with age from 24 per-cent among the 6-year-olds to 43 among the 16-and 17-year-olds (table 4 and figure 13). From 6through 15 years of age boys were substantiallymore likely than girls to have undergone somesurgical procedure, the differences in rates beingsignificant at the 5-percent probability level, Inthe later teens (16 and 17 years of age), this dif-ferential disappears.
16
I I I I
6 8 10 12
AGE IN YEARS
Figure 13. Percent of U.S. children in 1963-65 and yo iths in1966-70 with a history of operations or hospitalizations, byage.
The majority of these operations were ton-sillectomies and adenoidectomies. Two-thirds ofthe children and three-fourths of the youths witha history of surgery had had one or both of theseoperations. In order of frequency the other ma-jor operations included surgery for rupturedhernia, appendectomy, and circumcision. Onepercent of the children and 5percent of the youthshad had more than one type of these operations.
Hospitalizations. More than one child of four(27 percent) of those 6-11 years of age in 1963-65 had been hospitalized for surgery other thantonsillectomy or for some other sickness ortrouble. This was found slightly less frequentlyfor the 6- and 7-year-olds than those 8 years andolder. Boys of 6-11 years were significantlymore likely than girls to have been hospitalized(30 percent compared with 24 percent). This dif-ferential was evident across the age range butwas not consistently significant throughout. Whilethe data are not comparable, it is of interest tonote here that a similar sex differential was foundwith respect to hospital dischargees under 15years of age in July 1957-June 1958 and in 1968in the Health Interview Survey.
From the study of youths in 1966-70, 50per-cent were reported to have been hospitalized over-night or longer. There was a slight increase withage in the proportion, from 47 percent among the12- and 13-year-olds to 55 percent at age 17 years.Boys were significantly more likely to have beenhospitalized than girls throughout the age range12-17. Over three-fourths of these youths (78percent) were in the hospital for 1 week or less,while 1 percent had been confined for over 6months.
The sharp contrast between the findings forchildren and youths in the percent ever hospi-talized is probably clue to differences in the word-ing of the questions used in the two studies. Thedata for children were based on the answers totwo questions (questions 30 and 31, appendix II)whether the child had had any kind of operationother than removal of tonsils and whether or nothe hard ever been in the hospital for any othersickness or trouble. The 20 percent for whom thelatter question was answered in the affirmativewere added to the approximately 5 percent whohad no such history but had had some other op-eration. In the youth study the question was askedregarding whether or not he or she had ever beenin a hospital overnight or longer with no impliedexclusion of surgery as was done inkhe children'sstudy. Data were not obtained in either study onthe extent to which tonsillectomies and other sur-gery was performed in a hospital. Consequently,the data from the two studies here are probablynot completely comparable.
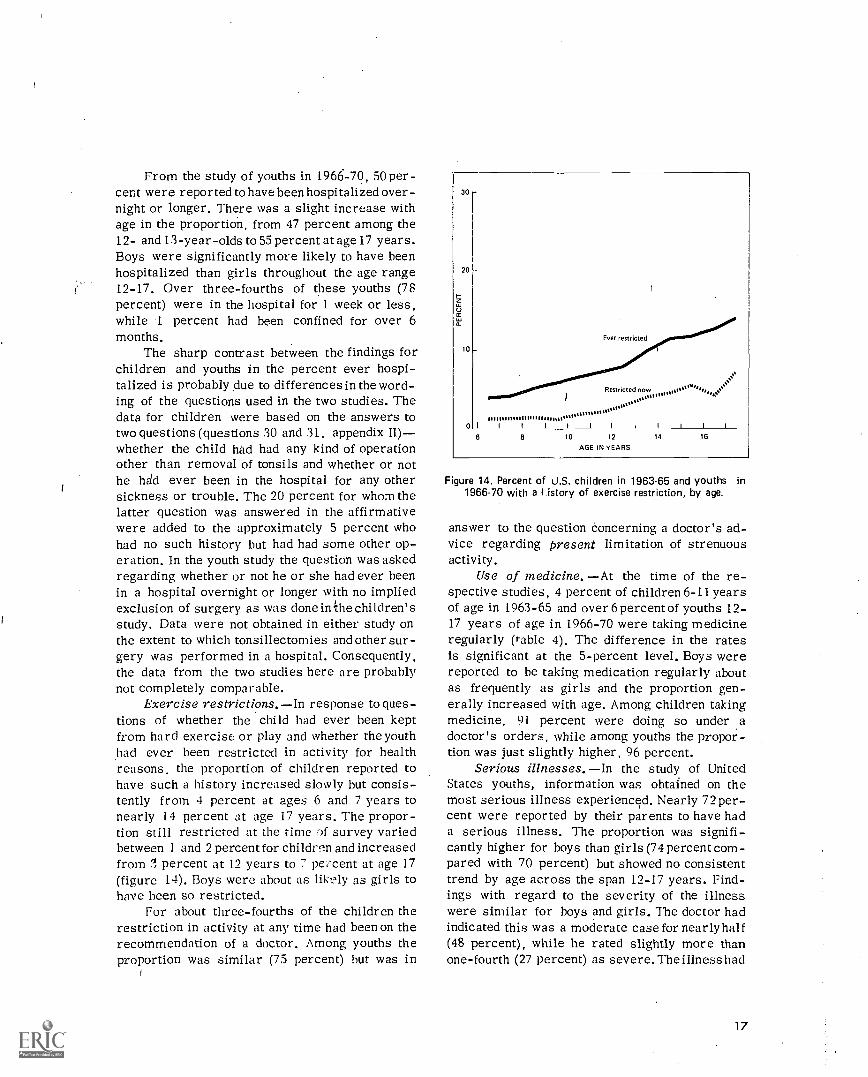
Exercise restrictions. In response to ques-tions of whether the child had ever been keptfrom hard exercise or play and whether the youthhad ever been restricted in activity for healthreasons, the proportion of children reported tohave such a history increased slowly but consis-tently from 4 percent at ages 6 and 7 years tonearly 14 percent at age 17 years. The propor-tion still restricted at the time of survey variedbetween 1 and 2 percent for children and increasedfrom percent at 12 years to 7 pe:'eent at age 17(figure 14). Boys were about as likely as girls tohave been so restricted.
For about three-fourths of the children therestriction in activity at any time had been on therecommendation of a doctor. Among youths theproportion was similar (75 percent) but was in
30 -
20
ta,
10
0
Ever restricted
now
''''''''''''''''''''''''''''''''''''''''''''''''''''''I I I 1_1_ I I I _I_ I
6 8 10 12 14 16
AGE IN YEARS
Figure 14. Percent of U.S. children in 1963.65 and youths in1966-70 with a history of exercise restriction, by age.
answer to the question concerning a doctor's ad-vice regarding present limitation of strenuousactivity.
Use of medicine. At the time of the re-spective studies, 4 percent of children 6-11 yearsof age in 1963-65 and over 6percent of youths 1.2-17 years of age in 1966-70 were taking medicineregularly (table 4). The difference in the ratesis significant at the 5-percent level. Boys werereported to he taking medication regularly aboutas frequently as girls and the proportion gen-erally increased with age. Among children takingmedicine, 91 percent were doing so under adoctor's orders, while among youths the propor-tion was just slightly higher, 96 percent.
Serious illnesses. In the study of UnitedStates youths, information was obtained on themost serious illness experienced. Nearly 72 per-cent were reported by their parents to have hada serious illness. The proportion was signifi-cantly higher for boys than girls (74 percent com-pared with 70 percent) but showed no consistenttrend by age across the span 12-17 years. Find-ings with regard to the severity of the illnesswere similar for boys and girls. The doctor hadindicated this was a moderate case for nearly half(48 percent), while he rated slightly more thanone-fourth (27 percent) as severe. The illness had
17

left some lasting effect on 11 percent of the youthswho were reported to have had a serious illness,i.e., 8 percent of all youths. The median age ofthe youths at the time of the onset of this seri-ous illness ranged betwleen 5 and 7 years, thoughit was nearly as likely to have occurred at anyage from infancy on (table 6).
Infectious childhood diseasesmeasles,chickenpox, mumps, scarlet fever, or whoopingcoughwere most frequently reported as serious(table 7). For nearly two-fifths (39 percent) theillness was of this type and was most likely tohave been measles (24 percent of those with ahistory of serious illness).
Respiratory conditionspneumonia, colds,influenza, and streptococcal sore throatwerethe next most frequently cited type of seriousillness (22 percent). Asthma accounted for about4 percent, while ear conditions, accidental in-juries, appendicitis attacks, hypertrophied ton-sils, rheumatic fever, and specific genitourinaryconditions were each reported as serious amongless than 2 percent of the youths with this ill-ness history.
Examination-HistoryThe question of the degree of agreement
between health information obtained by question-ing the individual and that from medical exam-ination of the same person is of interest frommany points of view. There have been carefullydesigned studies of this problem of agreementbetween interview and medical record data on thesame persons such as those carried out for theHealth Interview Statistics Division of NCHS.15'"The relationships presented in the following par-agraphs, in table 6, and in the related figures need
.to be recognized as a more gross overall kind ofcomparison.
A principal reason for the inclusion of a med-ical history in the Health Examination Survey isto aid the physician in his examination. Thus, thetwo sources are far from independent; in fact, insome instances as for example, with asthma orheart disease, the statements Tinade on the historymay contribute heavily to the findings recordedby the examining physician. Perhaps even moreimportant is the fact that the medical history in-formation utilized here is limited tothat provided
Youths Children Youths
CHICKEN PDX MEASLES
Children Youths
MUMPS
Children Youths Children Youths
SCARLET FEVER WHOOPING COUGH
Figure 15. Percent of U.S. children (6-11 years) in 1963-65 and youths (12-17 years) in 1966-70 with significantly abnormal findingson survey examination among those with or without a history of selected infectious childhood diseases.
18
by the respondent (parent of the child or youth)and many of the responses can be expected to begreatly affected by the period of recall whichextends over many years. In addition, the infor-mation obtained on the medical history and thediagnostic impression are not sufficiently spe-cific or comparable to make an assumption aboutwhat the relationships should be. For all of theabove reasons only a gross comparison has beenmade, with the one axis being the answers (yesor no) to a particular medical history questionand the other xis being the overall judgment ofthe physician flS to whether the child or youthwas "abnormal" regardless of whether the ab-normality might be assumed to be related to thespecific question. Thus, while it is reasonableto assume that the higher proportion of childrenwith medical findings of "abnormal" among thosewith a "yes" answer to the question concerningheart trouble reflects in part an abnormal heartfinding, it must be kept in mind th. t the percent-age shown will include children found to be ab-normal for other reasons as well.
Infectious diseases. No statistically signif-icant differences for either children or youthswere found in the proportion abnormal between
50
cs 40
30z0
2Kz2020co
10
With a history
Without a history
Children Youths
BROKEN BONES
Children Youths
KNOCKEOUNCONSCIOUS
Children Youths
OTHER ACCIDENTS
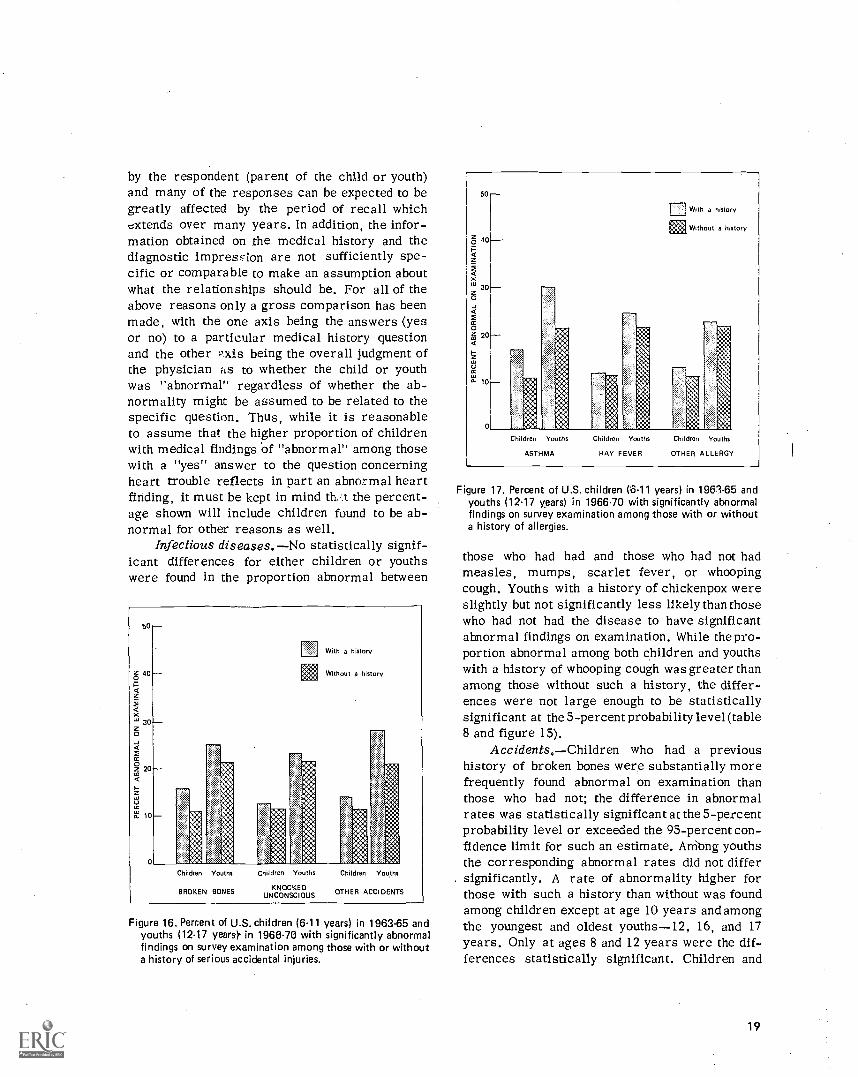
Figure 16. Percent of U.S. children (6.11 years) in 1963.65 andyouths (12.17 years). in 1966 -70 with significantly abnormalfindings on survey examination among those with or withouta history of serious accidental injuries.
50
g 40 .
XZ 300
0g 20
cc
10
Children Youths
ASTHMA
Children Youths
HAY FEVER
Without a history
Children Youths
OTHER ALLERGY
Figure 17. Percent of U.S. children (6.11 years) in 1963-65 andyouths (12.17 years) in 1966.70 with significantly abnormalfindings on survey examination among those with or withouta history of allergies.
those who had had and those who had not hadmeasles, mumps, scarlet fever, or whoopingcough. Youths with a history of chickenpox wereslightly but not significantly less likely than thosewho had not had the disease to have significantabnormal findings on examination. While the pro-portion abnormal among both children and youthswith a history of whooping cough was greater thanamong those without such a history, the differ-ences were not large enough to be statisticallysignificant at the 5-percent probability level (table8 and figure 15).
Accidents.Children who had a previoushistory of broken bones were substantially morefrequently found abnormal on examination thanthose who had not; the difference in abnormalrates was statistically significant at the 5-percentprobability level or exceeded the 95-percent con-fidence limit for such an estimate. Attiong youthsthe corresponding abnormal rates did not differsignificantly. A rate of abnormality higher forthose with such a history than without was foundamong children except at age 10 years and amongthe youngest and oldest youths-12, 16, and 17years. Only at ages 8 and 12 years were the dif-ferences statistically significant. Children and
19

youths who had had other types of accidents wereonly slightly more likely than those who had notto be considered abnormal on examination (table8 and figure 16).
Allergies.Persons with a history of asthmawere more frequently rated as abnormal on ex-amination than those without such a history (17percent compared with 11 percent for childrenand 30 percent compared with 21 percent foryouths), but only among children was the differencesignificant at the 5-percent level. This pattern
100
90
80
iU
60
of a rate of abnormality higher among those witha history of asthma than without was found acrossthe age range in both studies but was statisticallysignificant only at 6, 9, 10,12, and 14 years (table8 and figure 17).
Children and youths with a history of hayfever or other allergies were only slightly morefrequently found abnormal on examination thanthose without such a history and the differentialin the two sets of abnormal rates was not main-tained across the age range in both studies.
With a history
Without a history
40
30
20
10
Children Youths
CONVULSIONS OR FITS
Children Youths Children Youths
EYE TROUBLE HEARING TROUBLE
Children Yo iths
PROBLEM TALKING
Chil iron Youths
TROUBLE WALKING
Children Youths
ARM OR LEG LIMITATION
Figure 18. Percent of U.S. children (6-11 years) in 1963-65 and youths (12-17 years) in 1966-70 with significantly abnormal findingson survey examination among those with and without a history of sensoryneurological conditions.
20

Chronic conditions. Youths with a historyof kidney trouble were substantially more'likelythan those without to have been considered ab-normal on examination (36 percent compared with21 percent, the difference being statistically sig-nificant at the 5-percent level). Among childrenthe proportion of those abnormal with such a his-tory was only slightly greater than among theothers. By age the abnormal rates for the twogroups (with and without kidney trouble) differedsignificantly at 10 years and 12-16 years.
Children with a heart condition history weresubstantially more frequently rated as abnormalon examination than those without (26 percentcompared with 11 percent) while among youthsthe difference in abnormal rates was negligible(26 percent compared with 22 percent). Acrossthe age range in both studies statistically sig-nificant differences in these two sets of abnormalrates were found at 7-11 and 13 years.
Respiratory conditions.The proportion ab-normal on examination was only slightly but notsignificantly higher among those children withthan those without a history of frequent or severe
30
2 20
0:611
With a history
Without a history
a.
0
Children Youths
OPERATIONS
Children Youths
HOSPITALIZED MORE THAN 1 DAY
Figure 19. Percent of U.S. children (6.11 years) in 1963-65 andyouths (12-17 years) in 1966-70 with significantly abnormalfindings on survey examination among those with and with-out previous operations or hospitalization history.
6C
40
20
Nuw restricted
Previously restricted
IIII Total
restriction7x erciseTotal
CHILDREN
Exercise Totalrestriction
YOUTHS
Figure 20. Percent of U.S. children (6-11 years) in 1963-65 andyouths (12-17 years) in 1966-70 with significantly abnormalfindings on survey examination among total and those with ahistory of exercise restriction.
sore throats, colds, or coughs and among youthswith than without a history of pneumonia.
Sensory-neurological conditions. Childrenand youths with a history of eye trouble, troublehearing, problem with talking or speech, troublewalking, or with arm or leg limitation were foundto have been abnormal on examination substan-tially more frequently than those without such ahistory, the differences in rates all being sta-tistically significant at the 5-percent level (table8 ani figure 18). The proportion abnormal on ex-amination was only slightly higher for those witha history of convulsions or fits, earaches, andrunning ears than for those without this history.
Operations, hospitalizations, exercise re-strictions.Children who had had an operationwere significantly more likely than those whohad not had one to have been rated as abnormalon examination (15 percent compared with 10percent), while among youths only a negligible2 percent difference was found between the twoabnormal rates (table 8 and figure 19).
The children who had been hospitalized morethan i day were also significantly more likelyto have abnormal findings on the examination thanthose without such history (16 percent compared
21
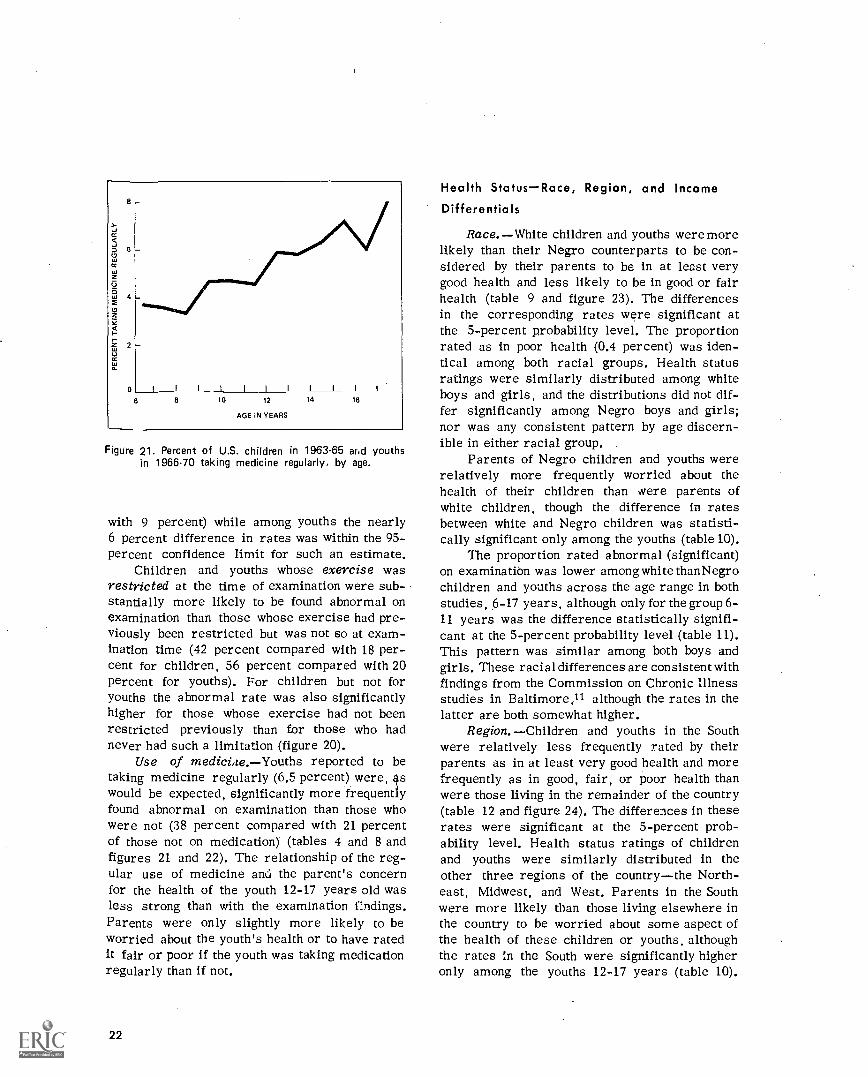
6 8
I
10 12 14 16
AGE IN YEARS
Figure 21. Percent of U.S. children in 1963-65 ar.c1 youthsin 1966-70 taking medicine regularly, by age.
with 9 percent) while among youths the nearly6 percent difference in rates was within the 95-percent confidence limit for such an estimate.
Children and youths whose exercise wasrestricted at the time of examination were sub-stantially more likely to be found abnormal onexamination than those whose exercise had pre-viously been restricted but was not so at exam-ination time (42 percent compared with 18 per-cent for children, 56 percent compared with 20percent for youths). For children but not foryouths the abnormal rate was also significantlyhigher for those whose exercise had not beenrestricted previously than for those who hadnever had such a limitation (figure 20).
Use of medicine. Youths reported to betaking medicine regularly (6.5 percent) were, 4swould be expected, significantly more frequentlyfound abnormal on examination than those whowere not (38 percent compared with 21 percentof those not on medication) (tables 4 and 8 andfigures 21 and 22). The relationship of the reg-ular use of medicine and the parent's concernfor the health of the youth 12-17 years old wasless strong than with the examination findings.Parents were only slightly more likely to beworried about the youth's health or to have ratedit fair or poor if the youth was taking medicationregularly than if not.
22
Health StatusRace, Region, and IncomeDifferentials
Race.White children and youths were morelikely than their Negro counterparts to be con-sidered by their parents to be in at least verygood health and less likely to be in good or fairhealth (table 9 and figure 23). The differencesin the corresponding rates were significant atthe 5-percent probability level. The proportionrated as in poor health (0.4 percent) was iden-tical among both racial groups. Health statusratings were similarly distributed among whiteboys and girls, and the distributions did not dif-fer significantly among Negro boys and girls;nor was any consistent pattern by age discern-ible in either racial group.
Parents of Negro children and youths wererelatively more frequently worried about thehealth of their children than were parents ofwhite children, though the difference in ratesbetween white and Negro children was statisti-cally significant only among the youths (table 10).
The proportion rated abnormal (significant)on examination was lower among white thanNegrochildren and youths across the age range in bothstudies, 6-17 years, although only for the group 6-11 years was the difference statistically signifi-cant at the 5-percent probability level (table 11).This pattern was similar among both boys andgirls. These racial differences are consistent withfindings from the Commission on Chronic Illnessstudies in Baltimore,11 although the rates in thelatter are both somewhat higher.
Region. Children and youths in the Southwere relatively less frequently rated by theirparents as in at least very good health and morefrequently as in good, fair, or poor health thanwere those living in the remainder of the country(table 12 and figure 24). The differences in theserates were significant at the 5-percent prob-ability level. Health status ratings of childrenand youths were similarly distributed in theother three regions of the countrythe North-east, Midwest, and West. Parents in the Southwere more likely than those living elsewhere inthe country to be worried about some aspect ofthe health of these children or youths, althoughthe rates in the South were significantly higheronly among the youths 12-17 years (table 10).
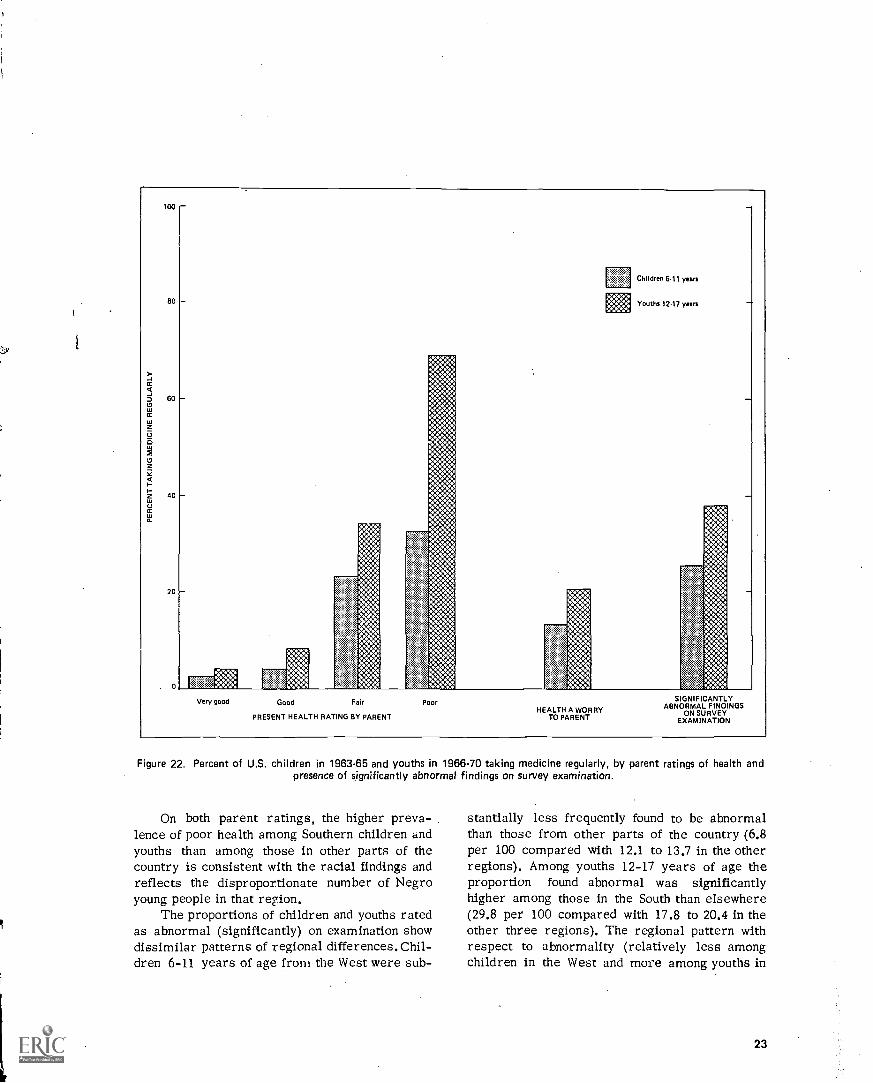
100
80
60
40
20
0
E Children 6.11 years
Youths 12.17 years
Very good Good Fair
PRESENT HEALTH RATING BY PARENT
PoorHEALTH A WORRY
TO PARENT
S GNIFICANTLYABNORMAL FINDINGS
ON SURVEYEXAMINATION
Figure 22. Percent of U.S. children in 1963-65 and youths in 1966-70 taking medicine regularly, by parent ratings of health andpresence of significantly abnormal findings on survey examination.
On both parent ratings, the higher preva-lence of poor health among Southern children andyouths than among those in other parts of thecountry is consistent with the racial findings andreflects the disproportionate number of Negroyoung people in that region.
The proportions of children and youths ratedas abnormal (significantly) on examination showdissimilar patterns of regional differences. Chil-dren 6-11 years of age from the West were sub-
stantially less frequently found to be abnormalthan those from other parts of the country (6.8per 100 compared with 12.1 to 13.7 in the otherregions). Among youths 12-17 years of age theproportion found abnormal was significantlyhigher among those in the South than elsewhere(29.8 per 100 compared with 17.8 to 20.4 in theother three regions). The regional pattern withrespect to abnormality (relatively less amongchildren in the West and more among youths in
23
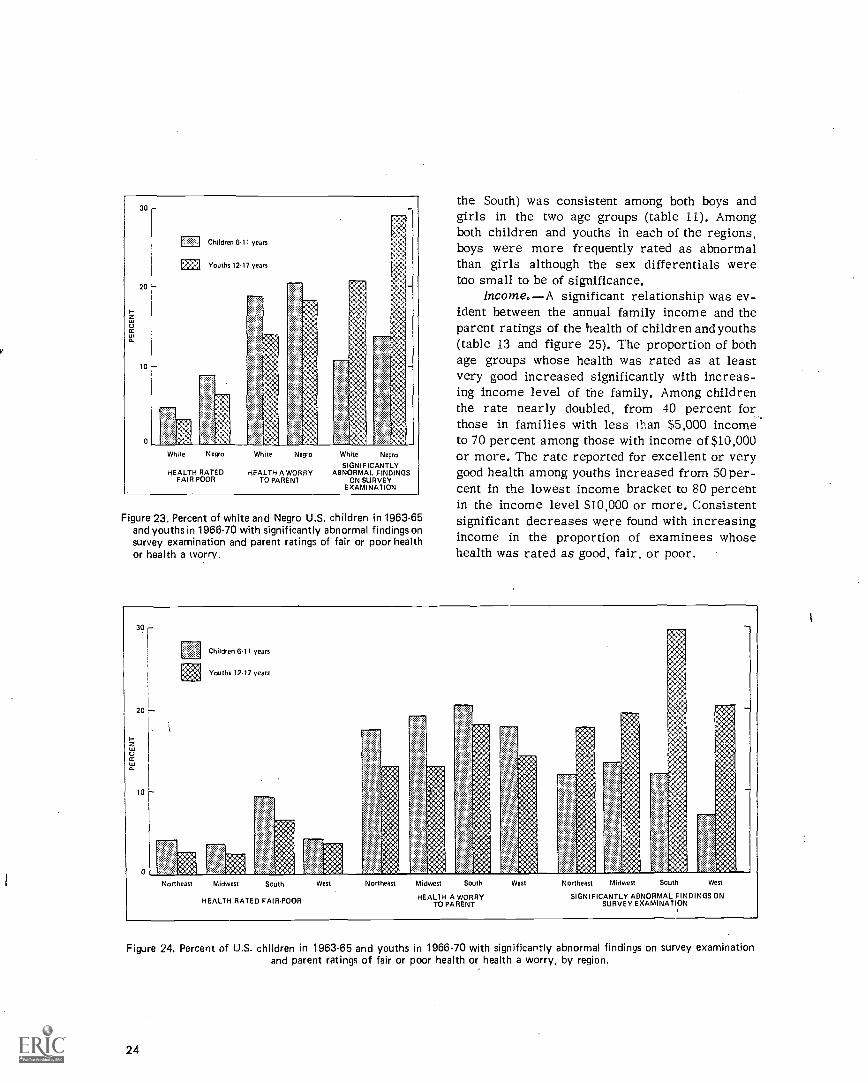
1zCC
30
20
10
0
Children 6.11 years
Efa Youths 1217 years
White Negro White Negro White Negro
SIGNIFICANTLYHEALTH RATED HEALTH A WORRY ABNORMAL FINDINGS
ON SURVEYEXAMINATION
FAIR-POOR TO PARENT
Figure 23. Percent of white and Negro U.S. children in 1963-65and youths in 1966-70 with significantly abnormal findings onsurvey examination and parent ratings of fair or poor healthor health a worry.
the South) was consistent among both boys andgirls in the two age groups (table 11). Amongboth children and youths in each of the regions,boys were more frequently rated as abnormalthan girls although the sex differentials weretoo small to be of significance.
Income. A significant relationship was ev-ident between the annual family income and theparent ratings of the health of children and youths(table 13 and figure 25). The proportion of bothage groups whose health was rated as at leastvery good increased significantly with increas-ing income level of the family. Among childrenthe rate nearly doubled, from 40 percent for_those in families with less than $5,000 incometo 70 percent among those with income of $10,000or more. The rate reported for excellent or verygood health among youths increased from 50 per-cent in the lowest income bracket to 80 percentin the income level $10,000 or more. Consistentsignificant decreases were found with increasingincome in the proportion of examinees whosehealth was rated as good, fair, or poor.
Children 6.11 years
Youths 12.17 years
Northeast Midwest South W st Northeast Midwest South West Northeast Midwest South West
HEALTH A WORRY SIGNIFICANTLY ABNORMAL FINDINGS ONHEALTH RATED FAIR.POOR TO PARENT SURVEY EXAMINATION
i
Figure 24, Percent of U.S. children in 1963-65 and youths in 1966-70 with significantly abnormal findings on survey examinationand parent ratings of fair or poor health or health a worry, by region.
24

On the parent rating with respect to concernover the health of children (or youths), the pat-tern of relationship with income was similar butthe decrease in the rate with income was sig-nificant only among youths (table 10). Exam-ination findings of a significantly abnormal phys-ical condition among children and youths alsoshowed a consistent relationship to the incomelevel of the family. The proportion of childrenor youths found to be abnor nal decreased stead-ily with successively higher income levels, butonly the difference in rates between the highestand lowest income brackets was statistically sig-nificant at the 5-percent probability level (table11).
Medical HistoryRace, Region, and IncomeDifferentials
Race.Significant differences were foundbetween white and Negro children in their his-tories of some of the infectious childhood dis-eases. White children were significantly morelikely than Negro children to have had mumps;white youths were significantly more likely thanNegro youths to have had chickenpox; while both
white children and youths were significantly morelikely than their Negro counterparts to have hadscarlet fever (table 14). In sharp contrast, Negrochildren and youths were more than twice aslikely as white children and youths to have hadwhooping cough. The difference in rates was sig-nificant at the 5-percent probability level.
Broken bones were twice as frequently re-ported among white as Negro children and youths,a difference which.is statistically significant atthe 5-percent level.
Other allergies excluding asthma and hayfever were reported significantly more frequently(relatively) among white than Negro children andyouths. The proportion of those having frequentcolds was significantly less among white thanNegro children, while the reverse was found withrespect to bronchitis history.
Among the sensory-neurological conditions,the proportion with a history of eye trouble wassignificantly greater among Negro than whiteyouths, while white children had had earachesand running ears substantially more often (pro-portionately) than Negro children. The lattercondition was also more likely to be reported inthe history of white than Negro youths. Relatively
30
20
10
0
Children 6.11 years
Youths 12.17 years
Under55,000
55,000. 510,00059,999 and over
HEALTH RATED FAIR.POOR
Under55,000
55,000.59,999
HEALTH A WORRYTO PARENT
510,000and over
Under 55,000. S10 00055,000 59,999 and over
SIGNIFICANTLY ABNORMAL FINDINGS ONSURVEY EXAMINATION
Figure 25. Percent of U.S. children in 1963.65 and youths in 1966-70 with significantly abnormal findings on survey examinationand parent ratings of fair or poor health or health a worry, by annual family income.
25

fewer white than Negro children and youths wereconsidered by their parents to have problemstalking or with speech.
With respect to the two questions relatingto medical care, white children and youths weresubstantially more likely to have had an oper-ation than their Negro counterparts.
Only among youths was there a significantracial difference in the proportion who had beenhospitalized overnight or longer. White youthswere substantially more likely than Negro youthsto have been hospitalized.
Region.Regional differences among chil-dren and youths with respect to their medicalhistories of illness and medical care are lessconsistent than those found between the whiteand Negro groups.
Whooping cough was relatively more fre-quently reported among children and youths inthe South, reflecting the greater proportion ofNegro persons in that part of the country.
Asthma history rates were significantlyhigher among Southern children, though the white-Negro difference in these rates was negligible.Hay fever was significantly more frequently re-ported among children and youths in the West.
Streptococcal sore throat and frequent coldhistories were more prevalent among Southernchildren, although only for the latter conditionwas a corresponding racial difference in ratesfound.
The proportion of children and youths in theSouth who had had an operation was significantlylower than in the other regions, while the pro-portion of youths who had been hospitalized wasalso substantially lower, due at least in part 'tothe disproportionately larger Negro population intliat region.
Income. Significant relationships of incomelevel of the family to the medical history of thesechildren and youths may be seen with respect tochickenpox for youth, mumps for children, whoop-ing cough for both age groups, allergies otherthan asthma and hay fever for both age groups,colds and bronchitis among children, and oper-ations and hospitalization among youths. Only forwhooping cough and colds is the relationshipnegative, that is the prevalence for these twodecreases consistently with an increase in theincome level of the family. In each of the other
26
items in the history of illness or medical carewhere significant relationship with family incomewas found, the respective rates increase directlywith the income levels.
SUMMARYThis report contains national estimates on
physical health status and health problems or ab-normal conditions of noninstitutionalized Amer-ican children 6-11 years of age in 1963-65 andyouths 12-17 years of age in 1966-70 as deter-mined in a standardized examination given byspecially trained pediatricians in the Health Ex-amination Survey. In addition, national estimatesbased on parent ratings of present health andhealth history together with their interrelation-ship with the examination findings for thesechildren and youths are included.
In the first of these surveys, a probabilitysample of 7,417 children was selected to rep-resent the roughly 24 million noninstitutionalizedchildren 6-11 years of age in the United Statesat that time. Of these 7,119, or 96 percent, wereexamined. For the second survey, a probabilitysample of 7,514 youths was selected to representthe nearly 23 million noninstitutionalized youths12-17 years of age in this country at midsurveypoint. Of them, 6,768 or 90 percent were exam-ined. Both examined groups were closely rep-resentative with respect to age, sex, race, re-gion, size of place of residence, and rate ofpopulation change in size of place of residencefrom 1950 to 1960 of the population from whichthe respective samples were drawn.
These examination and medical history find-ings show that:
1. Parents indicated somewhat less concernabout the health of the youths than the childrenin their families possibly because more had re-ceived care. Over half of the American children6-11 years of age, in 1963-65 were considered tobe in very good health compared with two-thirdsof the youths 12-17 years of age in 1966-70, whowere rated as in very good or excellent health.Five percent or .1.3 million children and 4 per-cent or 0.8 million youths were rated by theirparents as in fair or poor health, while parentswere worried about some aspects of health forsubstantially more of the children than youths

(19 percent compared with 15 percent, a differ-ence which exceeds the 95-percent confidencelimit for the estimates).
2. In contrast, on direct examination, surveypediatricians found only one child in eight, or3.1 million children, to have one or more sig-nificant cardiovascular, neurological, musculo-skeletal, or other physical abnormality comparedwith the one youth in five, or an estimated 4.9million youths, with such abnormalities. The dif-ference in these rates between children and youthsappears to be due primarily to conditions, suchas acne, associated with puberty and other as-pects of maturation.
3. From the medical history, consistent sig-nificant increases with age were found with re-spect to those who had ever had a serious acci-dent, the rate nearly tripling between 6 and 17years; the proportion who had hay fever wastwice as 'great among the older youths as amongthe younger children; the proportion with heartconditions nearly doubled, increasing from 3.5percent among 6-year-olds to 5.9 percent among17-year-old youths. The proportion who had hadfits or convulsions remained fairly constantacross the age. range in both studies at about 3percent, while approximately 4 percent of bothchildren and youths were reported to have troublehearing. The proportion of youths with eye trou-ble remained at 7 percent, somewhat below that
for children, where the question had included theneed for glasses.
4. The proportion of those who had had at leastone operation increased steadily with age from24 percent at 6 years to 43 percent among 16-and 17-year-old youths. The majority of thesesurgical procedures were tonsillectomies oradenoidectomies.
More than one of four children had beenhospitalized overnight or longer for surgery(other than tonsillectomy) or for some othercondition compared with one-half of the youths.
The proportion taking medicine, the major-ity (over 90 percent) under doctor's orders,regularly increased with age from 3-5 percentamong children and 6-8 percent among youths.
5. Negro children and youths were found on ex-amination to have some significant abnormalitymore frequently than their white counterparts,though only among children are the differencesin rates statistically significant. Children in theWest were less frequently found to be abnormalthan those in other parts of the country, whilefor youths the abnormal rate was higher amongthose in the South than elsewhere.
6. A significant relationship was evident betweenfamily income and the health of these childrenand youths. The proportion found abnormal onexamination decreased consistently as familyincome level increased.
27

REFERENCES
I National Center for Health Statistics: Origin, program,and operation of the U.S. National Health Survey. Vita/ andHealth Statistics. PHS Pub. No. 1000-Series 1-No. 1. PublicHealth Service. Washington. U.S. Government Printing Office,Aug. 1963.
2National Center for Health Statistics: Plan and initialprogram of the Health Examination Survey. Vital and HealthStatistics. PHS Pub. No. 1000-Series 1-No. 4. Public Health Serv-ice. Washington. U.S. Government Printing Office, July 1965.
3National Center for Health Statistics: Cycle I of theHealth Examination Survey. sample and response, UnitedStates, 1960-1962. Vital and Health Statistics. PHS Pub. No.1000-Series 11-No. 1. Public Health Service. Washington. U.S.Government Printing Office, Apr. 1964.
4 National Center for Health Statistics: Plan, operation,and response results of a program of children's examinations.Vita/ and Health Statistics. PHS Pub. No. 1000-Series 1-No. 5.Public Health Service. Washington. U.S. Government PrintingOffice, Oct. 1967.
5National Center for Health Statistics: Plan and operationof a Health Examination Sunvev of U.S. youth 12.17 years ofage. Vital and Health Statistics. PHS Pub. No. 1000-Series1-No. 8. Public Health Service. Washington. U.S. GovernmentPrinting Office, Sept. 1969.
6 National Center for Health Statistics: Sample design andestimation procedures for a National Health Examination Sur-vey of children. Vital and I- health Statistics. PHS Pub. No.1000-Series 2-No. 43. Public Health Service. Washington. U.S:Government Printing Office, Aug. 1971.
7National Center for Health Statistics: Quality control ina National Health Examination Survey. r'ital and 1-health Sta-tistics. PHS Pub, No. 1000-Series 2-No, 44. Public Health Serv-ice. Washington. U.S. Government Printing Office, Feb. 1972.
8 Yankauer. A.; Lawrence, R.: and Ballow, L.; A Study ofPeriodic School Medical Examinations. III. The Remediabilityof Certain Categories of "Defects." A m.J.Public Health47:1421-1433, Nov. 1957.
28
9Yankauer, A. and Lawrence, R.: A Study of PeriodicSchool Medical Examinations. I. Methods and Initial Findings.Atn.J.Public Health. 45:71-83, Jan. 1955.
I °Gilbert, A.: Lewis, A.: and Day, R. W.: Project HeadStart. An Evaluation of the Medical Components in California.Calif. Med. 106:382-387, May 1957.
I I Commission on Chronic Illness: Chronic Illness in aLarge City. The Baltimore Study. Chronic Illness in the UnitedStates. Vol. IV. Cambridge, Mass. Harvard University Press,1957.
I 2Trussell. R. E. and Elinson, J.: Chronic Illness in aRural Arca. The Hunterdon Study. Chronic Illness in theUnited States. Vol. III. Cambridge, Mass. Harvard UniversityPress, 1959.
13National Center for Health Statistics: Visual acuity ofyouth. Vital and Health Statistics. PHS Pub. No. 1000-Series11-No. 127. Public Health Service. Washington. U.S. Govern-ment Printing Office, May 1973.
i4 National Center for Health Statistics: Children andyouth, selected health characteristics, United States, 1958 and1968. Vital and Health Statistics. PHS Pub. No. 1000-Series10-No. 62. Public Health Service. Washington. U.S. Govern-ment Printing Office, Feb. 1971.
15National Center for Health Statistics: Health interviewresponses compared with medical records. Vital and Health Sta-tistics. PHS Pub. No. 1000-Series 2-No. 7. Public Health Serv-ice. Washington. U.S. Government Printing Office, July 1965.
16 National Center for Health Statistics: Interview data onchronic conditions compared with information derived frommedical records. Vital and Health Statistics, PHS Pub. No.1000-Series 2-No. 23. Public Hea;th Service. Washington. U.S.Government Printing Office, May 1967.
000

Table 1.
2.
3.
LIST OF DETAILED TABLES
Percent of children in 1963-65 and youths in 1966-70 with specified parent rat-ings of present health, health a worry to parents, and significant abnormal find-ings on survey examination, by age and sex, with standard errors for totals:United States
Page
31
Proportion of children in 1963-65 and youths in 1966-70 with health a worry toparents by parent's rating of present health; and significant abnormal findingson survey examination by parent's assessment of health, by age and sex, withstandard errors for totals: United States 32
Percent of children in 1963-65 and youths in 1966-70 with specific abnormalityamong those with abnormal findings on survey examination by age and sex, withstandard errors for totals: United States 33
4. Percent of children in 1963-65 and youths in 1966-70 with a medical history ofselected illnesses or other physical conditions, operations, hospitalization, orexercise restriction, by age and sex, with standard errors for totals: UnitedStates 34
5. Percent of children in 1963-65 with a medical history of other selected seriousillnesses, by age and sex, with standard errors for totals: United States 39
6. Median age at onset and prevalence rates for degree of severity of most seriousillness among youths 12-17 years, by age and sex, with standard errors for to-tals: United States, 1966-70 40
7. Percent of youths 12-17 years, by type of their most serious illness: UnitedStates, 1966-70 41
8. Percent of children in 1963-65 and youths in 1966-70 with significant abnormalfindings on survey examination among those with or without selected medical his-tory conditions, by age, with standard errdrs for totals: United States 42
9. Percent of white and Negro children in 1963-65 and youths in 1966-70 with spec-ified parent ratings of present health, by age and sex, with standard errors fortotals: United States 44
10. Percent of children in 1963-65 and youths in 1966-70 with health a worry to par-ents, by race, geographic region, annual family income, age, and sex, with stand-ard errors for totals: United States 45
11. Percent of children in 1963-65 and youths in 1966-70 with significant abnormalfindings on survey examination, by race, geographic region, annual family income,age, and sex, with standard errors for totals: United States 46
12. Percent of children in 1963-65 and youths in 1966-70 with specified parent rat-ings of present health, by geographic region, age, and sex, with standard errorsfor totals: United States 47
13. Percent of children in 1963-65 and youths in 1966-70 with specified parent rat-ings of present health, by annual family income, age, and sex, with standard er-rors for totals: United States 49
14. Prevalence rates of children 6-11 years in 1963-65 and youths 12-17 years in1966-70 with a medical history of selected illnesses or other physical condi-tions, operations, hospitalization, or exercise restriction, by race, geographicregion, and annual family income, with standard errors for totals: UnitedStates 50
29

Table 1. Percent of children in 1963-65 and youths in 1966-70 with specified parent ratings of present health,health a worry to parents, and significant abnormal findings on survey examination, by age and sex, with stand-ard errors for totals: United States
Age, sex, and survey
Parent's. rating of presenthealth
Ex-cel-lent
Verygood
Good Fair Poor
Parentconsiderspresent
health aproblem
Physician'sfinding ofsignificantabnormalityon surveyexamination
Finding ofotitismedialon surveyexamination
Children
Both sexes 6-11 years
6 years7 years8 years-9 years-10 years11 years
Boys 6 -11 years
6 years7 years8 years- -9 years10 years11 years
Girls 6-11 years
6 years7 years8 years9 years- -10 years11 years
Youths
Both sexes 12-17 years
12 years13 years14 years15 years16 years-17 years-
Boys 12-17 years
12 years13 years14 years15 years--- -16 years17 years
Girls 12-17 years -
12 years13 years14 years15 years--- -16 years- -17 years
Children 6-11 years
Boys 6-11 yearsGirls 6-11 years
Youths 12-17 years
Boys 12-17 years--- ----- --------- -----------Girls 12-17 years
51.8 42.9 4.9
Percent
0.4 19.0 11.2 1.6
51.850.954.950.250.751.7
51.6
43.144.140.343.643.742.8
43.2
4.84.64.45.65.25.0
4.8
0.30.40,40.60.40.5
0.4
17.917.817.321.420.319.6
19.0
10.912.011.39.910.213.2
12.2
2.62.11.21.60.81.2
1.8
50.450.554.950.152.551.2
51.8
45.544.039.643.842.643.8
42.7
3.55.25.15.64.54.7
5.1
0.60.30.40.50.40.3
0.4
19.617.716.221.618.720.5
19.0
13.513.210.311.110.914.4
10.2
2.52.81.21.90.61.4
1.4
53.351.454.950.248.952.4
40.744.241.043.544.841.8
6.04.03.75.65.85.2
0.40.40.70.50.6
33.0 33.9 29.5 3.3 0.3
16.217.818.521.222.018.7
14.6
8.210.912.38.79.511.9
21.8
2.81.41.21.31.00.8
1.8
36.7 31.4 29.3 2.3 0.330.7 37.8 28.1 3.0 0.434.9 31.2 30.6 3.0 0.330.8 33.1 31.0 4.8 0.334.3 35.7 27.1 2.6 0.330.1 34.8 30.8 4.2 0.1
34.4 34.5 27.7 3.2 0.2
12.413.815.616.412.716.8
14.6
19.020.923.122.322.024.0
23.0
1.72.12.11.01.82.0
1.8
38.5 32.330.6 41.639.5 29.333.0 32.735.1 35.628.9 35.3
31.5 33.4
26.724.627.830.626.430.5
31.3
2.12.82.93.52.95.3
3.4
0.40.40.50.2
0.4
11.013.915.716.312.418.9
14.5
21.621.925.420.621.826.8
20.6
1.72.21.40.72.72.0
1.8
34.9 30.430.8 34.030.1 33.128.5 33.533.4 35.731.3 34.3
1.15
31.931.733.431.427.831.1
0.97
2.5,3.23.26.12.43.2
0.31
0.30.30.20.50.70.1
Stan
0.07
13.813.715.516.613.014.8
dard error
0.62
16.219.920.624.022.221.1
0.87
1.62.12.81.30.82.0
0.94
1.401.13
0.81
1.161.03
1.17
0.310.43
0.22
0.170.08
0.06
0.770.84
0.55
0.950.94
2.07
1.021.18
0.951.09
1.321.34
0,310.30
0.050.11
0.720.66
2.272.06
Included as significant abnormality in youths' but not children's examination.
31

Table 2. Proportion of children in 1963-65 and youths in 1966-70 with health a worry to parents by parent's ratingof present health; and significant abnormal findings on survey examination by parent's assessment of health, byage and sex, with standard errors for totals: United States
Age, sex, and survey
Prevalence of a healthproblem - present health
rated
Prevalence of significant examinationfinding
Ex-cel-lent
Verygood Good Fair Poor
Present health rated- Presenthealth--
Ex-cel-lent
Verygood Good Fair Poor
Aworry
Nota
worry
Children Rate per 100
Both sexes 6-11 years 8.8 24.8 69.5 92.7 9.4 12.2 20.4 39.6 17 0 9.9
6 years 9.4 22.5 61.9 100.0 10.5 11.2 13.3 0.0 11.6 10.77 years 7.4 24.1 67.0 79.9 8.4 14.4 28.5 39.9 22.4 9.88 years 7.6 23.9 71.9 83.3 8.8 13.4 19.8 45.0 18.2 9.79 years 10.8 26.4 66.9 91.6 9.3 9.6 15.9 34.8 14.8 8.610 years 7.8 27.6 74.8 100.0 7.8 10.4 26.8 74.0 15.8 8.811 years 9.9 24.2 75.1 100.0 11.5 14.2 18.8 37.0 19.8 11.6
Boys 6-11 years 8.4 24.9 73.8 94.6 9.7 13.8 23.5 35.8 18.2 10.8
6 years 11.4 24.1 62.4 100.0 12.8 13.8 22.2 0.0 15.0 13.17 years 6.1 24.0 74.9 55.3 9.7 15.3 26.5 55.3 19.6 11.68 years 6.6 21.2 74.0 100.0 8.5 11.9 14.2 37.4 15.2 9.19 years 10.0 27.8 69.3 100.0 8.7 11.8 21.0 79.0 19.1 9.010 years. 5.4 27.7 80.6 100.0 8.4 11.6 29.3 48.1 18.0 9.311 years 11.2 24.4 80.2 100.0 10.1 18.0 29.2 0.0 21.7 12.4
Girls 6-11 years 9.2 24.6 65.3 90,6 9.1 10.5 17.3 43 7 15.8 9.0
6 years 7.4 20.6 61.5 - 8.3 8.1 7.8 - 7.4 8.47 years 8.7 24.2 56.5 100.0 7.0 13.4 31.3 27.4 25.3 7.88 years 8.7 26.6 69.0 69.3 9.0 14.8 27.7 51.5 21.0 10.49 years 11.5 25.0 64.4 84.9 9.9 7.2 10.7 0.0 10.2 8.310 years 10.6 27.4 70.1 100.0 7.2 9.2 24.7 100.0 13.6 8.311 years 8.7 23.9 70.2 100.0 13.0 10.2 9.4 59.3 17.6 10.7
Youths
Both sexes 12-17 years 3.2 11.6 23.7 71.7 77.8 16.9 19.6 26.8 45.6 64.0 36.8 19.3
12 years 2.9 9.0 22.2 76.6 74.9 15.1 16.6 25.0 39.7 14.4 35.3 16.713 years 3.7 11.0 21.1 75.3 78.4 15.6 19.4 23.8 55.8 100.0 29.2 19.614 years 4.1 12.3 26.1 68.8 82.7 18.0 21.0 27.4 57.6 38.9 42.4 19.415 years- 2.4 13.4 24.8 71.9 47.1 15.8 20.7 26.8 44.6 78.0 42.6 18.416 years 2.4 10.6 22.4 62.0 100.0 18.4 17.6 30.1 37.1 100.0 30.9 20.817 years 3.6 13.7 25.1 74.0 100.0 19.0 22.6 28.3 38.2 0.0 37.7 21.1
Boys 12-17 years 3.7 12.2 24.1 71.2 81.4 19.0 23.0 25.0 46.1 65.1 35.1 20.9
12 years 2.3 7.0 22.6 73.8 100.0 19.7 19.2 25.4 44.5 27.2 35.0 20.013 years 5.2 10.8 21.7 76.6 64.4 19.2 21.8 20.4 52.5 100.0 25.9 21.214 years 3.5 15.1 26.5 75.6 77.4 20,7 26.6 26.9 64.3 50.9 46.6 21.515 years 3.4 15.6 24.6 69.7 100.0 14.6 21.0 25.6 32.9 100.0 38.2 17.416 years 2.6 11.2 22.2 57.6 0.0 18.4 21.8 24.8 35.0 21.9 21.817 years 6.3 14.5 26.6 72.8 0.0 21.2 28.6 26.5 47.5 38.4 24.1
Girls 12-17 years 2.6 11.0 23.3 72.2 75.1 14.6 16.0 28.5 45.2 63.1 38.5 17.6
12 years 3.7 11.2 21.8 79.1 46.7 9.7 13.8 24.6 35.6 0.0 35.6 13.213 years 2.1 11.3 20.6 74.1 100.0 11.9 16.4 26.6 58.9 100.0 32.6 17.814 years 5.0 9.8 25.8 62.7 100.0 14.4 15.9 27.9 51.6 0.0 38.1 17.415 years 1.2 11.2 25.1 73.2 29.4 17.2 20.4 28.0 51.4 70.6 47.1 19.416 years 2.3 10.0 22.7 67.3 100.0 18.4 13.2 35.2 39.6 100.0 39.7 19.717 years 1.0 12.8 23.6 76.1 100.0 17.0 16.4 30.1 22.6 0.0 36.8 18.3
Standard error
Children 6-11 years 0.45 1.00 2.90 4.97 --- 0.96 1.13 2.90 6.29 1.35 0.83
Boys 6-11 years 0.77 1.10 4.38 7.69 1.10 1.30 4.04 12.33 1.87 0.89Girls 6-11 years 0.69 1.48 3.71 7.17 1.04 1.29 3.58 8.74 1.55 0.93
Youths 12-17 years 0.32 0.72 1.35 3.26 11.65 1.77 2.39 2.59 3.83 15.99 2.47 2.09
Boys 12-17 years 0.57 1.16 1.47 4.29 14.22 2.35 2.75 2.52 4.36 19.46 2.94 2.31Girls 12-17 years 0.53 0.82 1.83 4.78 18.44 1.48 2.28 3.25 4.85 19.72 2.71 2.06
32
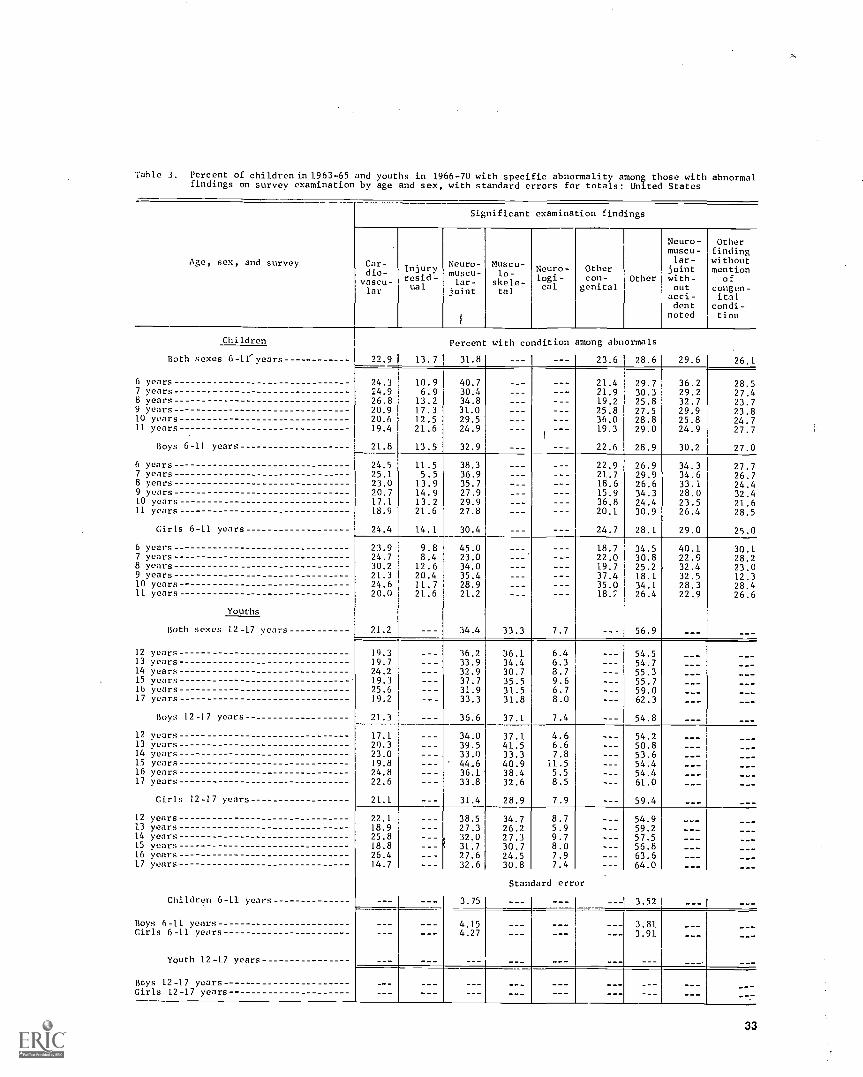
Table 3. Percent of children in 1963-65 and youths in 1966-70 with specific abnormality among those with abnormalfindings on survey examination by age and sex, with standard errors for totals: United States
Age, sex, and survey
Significant examination findings
Car-dio-vascu-lar
Injuryresid-ual
Neuro-muscu-lar-
joint
Moscu-lo-
skele-tal
Neuro-logi-cal
Othercon-
genitalOther
Neuro- Othermuscu- findinglar- without
joint mentionwith- ofout congen-acci- italdent condi-
noted tion
Children
Both sexes 6-11' years
6 years7 years8 years9 years10 years11 years
Boys 6-11 years,
6 years7 years8 years9 years10 years11 years
Girls 6-11
6 years7 years8 years9 years10 years11 years
years
Youths
Both sexes 12-17 years
12 years13 years14 years15 years16 years17 years
Boys 12-17 years
12 years13 years14 years15 years16 years17 years
Girls 12-17 years
12 years13 years14 years15 years16 years17 years
Children 6-11 years
Boys 6-11 yearsGirls 6-11 years
Youth 12-17 years
Boys 12-17 yearsGirls 12-17 years
22.9 1 13.7
Percent with coldition among abnormals
31.8
24.3 10.924.9 6.926.8 13.220.9 17.320.6 12.519.4 21.6
21.8 13.5
40.730.434.831.029.524.9
32.9
24.5 11.525.1 5.523.0 13.920.7 14.917.1 13.218.9 21.6
24.4 14.1
38.336.935.727.929.927.8
30.4
23.9 9.824.7 8.430.2 12.621.3 20.424.6 11.720.0 21.6
21.2
45.023.034.035.428.921.2
34.4
19.319.724.219.325.619.2
21.3
36.233.932.937.731.933.3
36.6
17.120,323.019.824.822.6
21.1
34.039.533.044.636.133.8
31.4
22.118.925.818.826.414.7
38.527.332.031.727.632.6
3.75
4.154.27
23.6 28.6 29.6 26.1
21.4 29.7 36.2 28.521.9 30.3 29.2 27.419.2 25.8 32.7 23.725.8 27.5 29.9 23.836.0 28.8 25.8 24.719.3 29.0 24.9 27.7
22.6 28.9 30.2 27.0
22.9 26.9 34.3 27.721.7 29.9 34.6 26.718.6 26.6 33.1 24.415.9 34.3 28.0 32.436.8 24.4 23.5 21.620.1 30.9 26.4 28.5
24.7 28.1 29.0 25.0
18.7 34.5 40.1 30.122.0 30.8 22.9 28.219.7 25.2 32.4 23.037.4 18.1 32.5 12.335.0 34.1 28.3 28.4
26.4 22.9 26.6
33.3 7.7 56.9
36.1 6.4 54.534.4 6.3 54.730.7 8.7 55.335.5 9.6 55.731.5 6.7 59.031.8 8.0 62.3
37.1 7.4 54.8
37.1 4.6 54.241.5 6.6 50.833.3 7.8 53.640.9 11.5 54.438.4 5.5 54.432.6 8.5 61.0
28.9 7.9 59.4
34.7 8.7 54.926.2 5.9 59.227.3 9.7 57.530.7 8.0 56.824.5 7.9 63.630.8 7.4 64.0
Standard error
3.52
3.813.91
_ - -
33

Table 4. Percent: of children in 1963-65 and youths in 1966-70 with a medical history of selected ill-nesses or other physical conditions, operations, hospitalization, or exercise restriction, by age andsex, with standard errors for totals: United States
Medical history item
Both sexes
6-11years
6
years7
years8
years9
years10
years11
years
Infective diseases Percent
ChickenpoxMeasles 85.8 72.8 80.9 87.7 89.9 92.8 92.0Mumps 48.8 37.5 43.9 50.6 51.1 55.1 55.4Scarlet fever , 3.8 3.0 3.4 3.7 3.4 5.3 4.3Whooping cough- I 9.4 6.8 7.2 8.1 10.4 11.2 12.7
Accidents
Broken bones 7.8 5.5 5.5 8.3 7.3 8.3 12.3Knocked unconscious 3.4 2.2 3.2 3.3 2.9 3.9 5.2Scars from burns 4.5 5.8 4.6 3.4 5.1 4.1 4.2Other accidents 4.2 3.3 3.8 5.2 3.7 5.7 3.6
Allergies and related conditions
Asthma 5.3 4.2 6.6 4.0 5.5 5.5 5.8Hay fever 4.6 3.5 3.5 3.8 5.8 5.4 5.6Other allergies- 11.4 11.3 10.2 13.2 12.4 11.0 10.5
Kidney condition 3.9 3.9 3.5 3.3 4.2 4.0 4.3
Heart condition 3.7 3.5 3.4 4.0 3.1 3.9 4.2
Respiratory conditions
Sore throat 11.7 11.7 11.4 11.4 11.8 11.8 12.0Colds 21.0 26.4 25.0 20.3 17.5 19.5 16.7Coughs 10.7 13.9 11.9 11.5 10.5 9.1 7.1Bronchitis- 15.7 17.4 16.7 16.4 15.4 15.0 13.2Chest colds 6.2 7.4 7.1 6.1 6.3 6.2 4.3Pneumonia
Sensory-neurological conditions
Convulsions or fits- 3.3 2.7 3.3 3.4 3.8 4.3 2.4Eye trouble 14.0 6.4 9.8 13.2 16.1 18.3 20.8Trouble hearing 4.3 3.7 4.6 3.3 4,8 4.6 4.8Earaches- 26.8 28.3 30.6 25.4 25.7 26.3 23.9Running ears 11.9 12.3 14.7 11.2 11.6 12.5 8.9Problem talking 8.4 12.9 9.6 7.5 7.1 6.8 6.2Trouble walking 2.3 1.6 3.0 2.0 1.7 2.7 2.8Arm or leg limitation 1.3 1.0 1.0 1.0 0.9 2.0 1.7
Operations 30.8 23.8 25.8 33.4 32.3 34.0 36.0
Hospitalized more than 1 day 26.8 23.4 25.9 28.0 27.5 28.3 28.2
Exercise restricted:Ever 5.4 3.9 4.0 5.0 5.8 6.7 7.1Now 1.5 1.2 1.2 1.4 1.2 1.9 2.0
Taking medicine regularly - 4.1 3.7 3.6 3.3 4.7 4.7 4.6
34
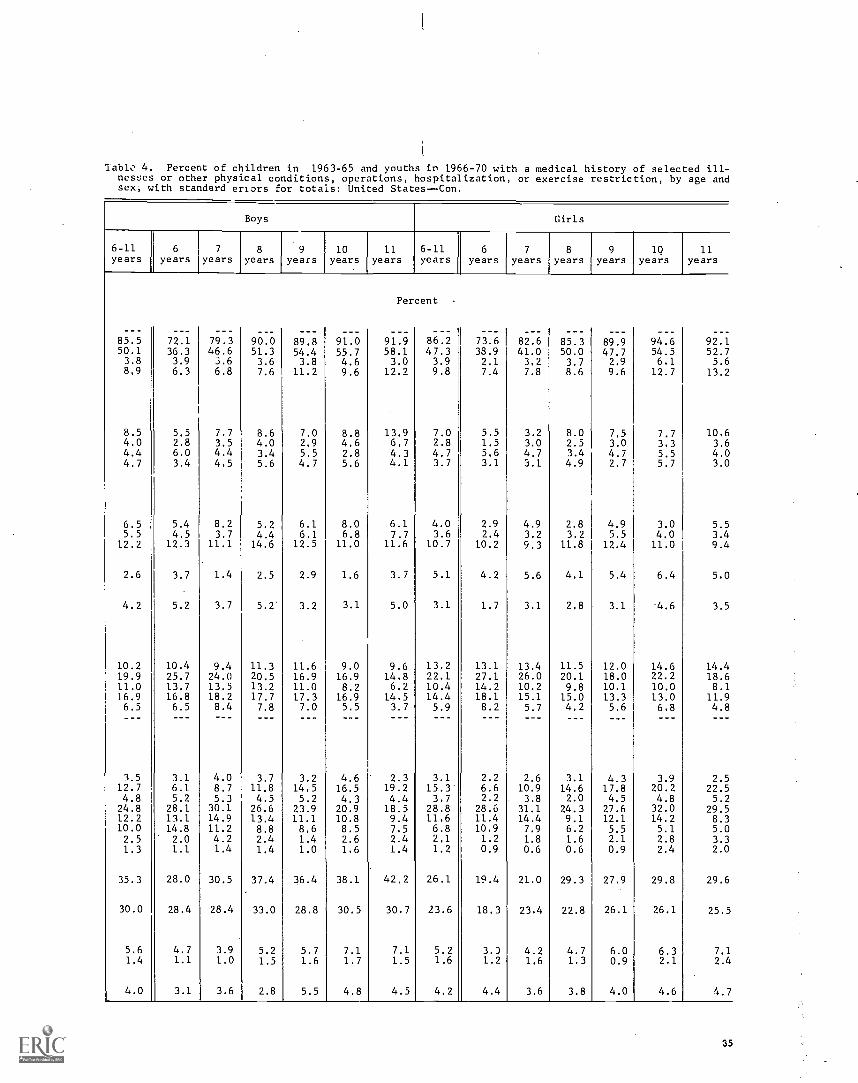
lablo 4. Percent of children in 1963-65 and youths in 1966-70 with a medical history of selected ill -nesJes or other physical conditions, operations, hospitalization, or exercise restriction, by age andsex, with standard errors for totals: United States -Con.
Boys Girls
6-11 6 7 8 9 10 11 6-11 6 7 8 9 1Q 11years years years years years years years years years years years years years years
Percent
85.5 72.1 79.3 90.0 89.8 91.0 91.9 86.2 73.6 82.6 85.3 89.9 94.6 92.150.1 36.3 46.6 51.3 54.4 55.7 58.1 47.3 33.9 41.0 50.0 47.7 54.5 52.73.8 3.9 3.6 3.6 3.8 4.6 3.0 3.9 2.1 3.2 3.7 2.9 6.1 5.68.9 6.3 6.8 7.6 11.2 9.6 12.2 9.8 7.4 7.8 8.6 9.6 12.7 13.2
8.5 5.5 7.7 8.6 7.0 8.8 13.9 7.0 5.5 3.2 8.0 7.5 7.7 10.64.0 2.8 3.5 4.0 2.9 4.6 6.7 2.8 1.5 3.0 2.5 3.0 3.3 3.64.4 6.0 4.4 3.4 5.5 2.8 4.3 4.7 5.6 4.7 3.4 4.7 5.5 4.04.7 3.4 4.5 5.6 4.7 5.6 4.1 3.7 3.1 3.1 4.9 2.7 5.7 3.0
6.5 5.4 8.2 5.2 6.1 8.0 6.1 4.0 2.9 4.9 2.8 4.9 3.0 5.55.5 4.5 3.7 4.4 6.1 6.8 7.7 3.6 2.4 3.2 3.2 5.5 4.0 3.412.2 12.3 11.1 14.6 12.5 11.0 11.6 10.7 10.2 9.3 11.8 12.4 11.0 9.4
2.6 3.7 1.4 2.5 2.9 1.6 3.7 5.1 4.2 5.6 4.1 5.4 6.4 5.0
4.2 5.2 3.7 5.2 3.2 3.1 5.0 3.1 1.7 3.1 2.8 3.1 4.6 3.5
10.2 10.4 9.4 11.3 11.6 9.0 9.6 13.2 13.1 13.4 11.5 12.0 14.6 14.419.9 25.7 24.0 20.5 16.9 16.9 14.8 22.1 27.1 26.0 20.1 18.0 22.2 18.611.0 13.7 13.5 13.2 11.0 8.2 6.2 10.4 14.2 10.2 9.8 10.1 10.0 8.116.9 16.8 18.2 17.7 17.3 16.9 14.5 14.4 18.1 15.1 15.0 13.3 13.0 11.96.5 6.5 8.4 7.8 7.0 5.5 3.7 5.9 8.2 5.7 4.2 5.6 6.8 4.8
3.5 3.1 4.0 3.7 3.2 4.6 2.3 3.1 2.2 2.6 3.1 4.3 3.9 2.512.7 6.1 8.7 11.8 14.5 16.5 19.2 15.3' 6.6 10.9 14.6 17.8 20.2 22.54.8 5.2 5.3 4.5 5.2 4.3 4.4 3.7 2.2 3.8 2.0 4.5 4.8 5.224.8 28.1 30.1 26.6 23.9 20.9 18.5 28.8 28.6 31.1 24.3 27.6 32.0 29.512.2 13.1 14.9 13.4 11.1 10.8 9.4 11.6 11.4 14.4 9.1 12.1 14.2 8.310.0 14.8 11.2 8.8 8.6 8.5 7.5 6.8 10.9 7.9 6.2 5.5 5.1 5.02.5 2.0 4.2 2.4 1.4 2.6 2.4 2.1 1.2 1.8 1.6 2.1 2.8 3.31.3 1.1 1.4 1.4 1.0 1.6 1.4 1.2 0.9 0.6 0.6 0.9 2.4 2.0
35.3 28.0 30.5 37.4 36.4 38.1 42.2 26.1 19.4 21.0 29.3 27.9 29.8 29.6
30.0 28.4 28.4 33.0 28.8 30.5 30.7 23.6 18.3 23.4 22.8 26.1 26.1 25.5
5.6 4.7 3.9 5.2 5.7 7.1 7.1 5.2 3.) 4.2 4.7 6.0 6.3 7.11.4 1.1 1.0 1.5 1.6 1.7 1.5 1.6 1.2 1.6 1.3 0.9 2.1 2.4
4.0 3.1 3.6 2.8 5.5 4.8 4.5 4.2 4.4 3.6 3.8 4.0 4.6 4.7
35
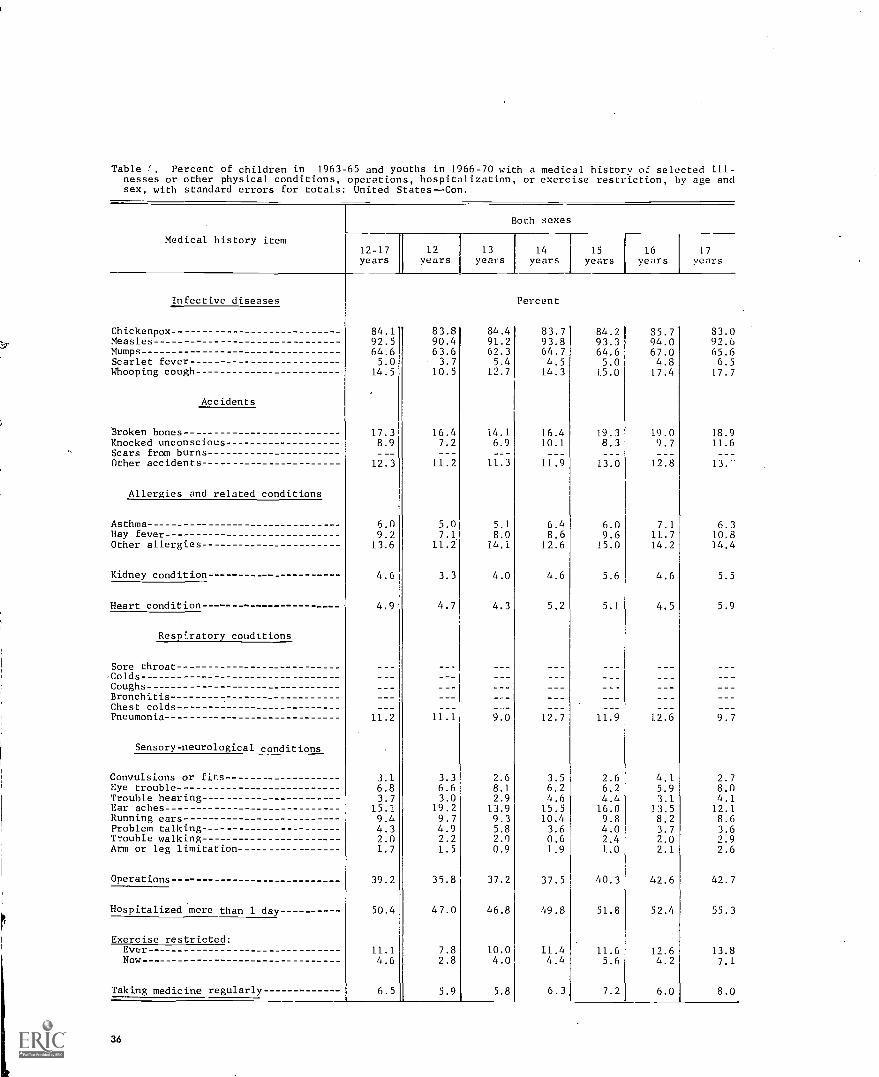
Table Percent of children in 1963-65 and youths in 1966-70 with a medical history of selected ill-nesses or other physical conditions, operations, hospitalization, or exercise restriction, by age andsex, with standard errors for totals: United States-Con.
Medical history item
Both sexes
12-17 1
years12
years1 13
years14
years15 16
years 1 years17
years
Infective diseases Percent
Chickenpox 84.1 83.8 84.4 83.7 84.2 35.7 83.0Measles 92.5 90.4 91.2 93.8 93.3 94.0 92.6Mumps 64.6 63.6 62.3 64.7 64.6 67.0 65.6Scarlet fever 5.0 3.7 5.4 4.5 5.0 4.S 6.5Whooping cough 14.5 10.5 12.7 14.3 15.0 17.4 17.7
Accidents
Broken bones 17.3 16.4 14.1 16.4 19.3 19.0 18.9Knocked unconscious 8.9 7.2 6.9 10.1 8.3 9.7 11.6Scars from burnsOther accidents 12.3 11.2 11.3 11.9 13.0 12.8 13.-
Allergies and related conditions
Asthma - 6.0 5.0 5.1 6.4 6.0 7.1 6.3Hay fever 9.2 7.1 8.0 8.6 9.6 11.7 10.8Other allergies 13.6 11.2 14.1 12.6 1.5.0 14.2 14.4
Kidney condition-- - 4.6 3.3 4.0 4.6 5.6 4.6 5.5
Heart condition 4.9 4.7 4.3 5.2 5.1 4.5 5.9
Respiratory conditions
Sore throatColdsCoughsBronchitisChest coldsPneumonia 11.2 11.1 9.0 12.7 1.1.9 12.6 9.7
Sensory-neurological conditions
Convulsions or fits 3.1 3.3 2.6 3.5 2.6 4.1 2.7Eye trouble 6.8 6.6 8.1 6.2 6.2 5.9 8.0Trouble hearing 3.7 3.0 2.9 4.6 4.4 3.1 4.1Ear aches 15.1. 19.2 13.9 15.5 16.0 13.5 12.1Running ears 9.4 9.7 9.3 10.4 9.8 8.2 8.6Problem talking 4.3 4.9 5.8 3.6 4.0 3.7 3.6------Trouble walking ------- ----- 2.0 2.2 2.0 0.6 2.4 2.0 2.9Arm or leg limitation 1.7 1.5 0.9 1.9 1.0 2.1 2.6
Operations 39.2 35.8 37.2 37.5 40.3 42.6 42.7
Hospitalized mere than 1 day 50.4 47.0 46.8 49.8 51.8 52.4 55.3
Exercise restricted:Ever 11.1 7.8 10.0 11.4 11.6 12.6 13.8Now 4.6 2.8 4.0 4.4 5.6 4.2 7.1
Taking medicine regularly 6.5 5.9 5.8 6.3, 7.2 6.0 8.0
36
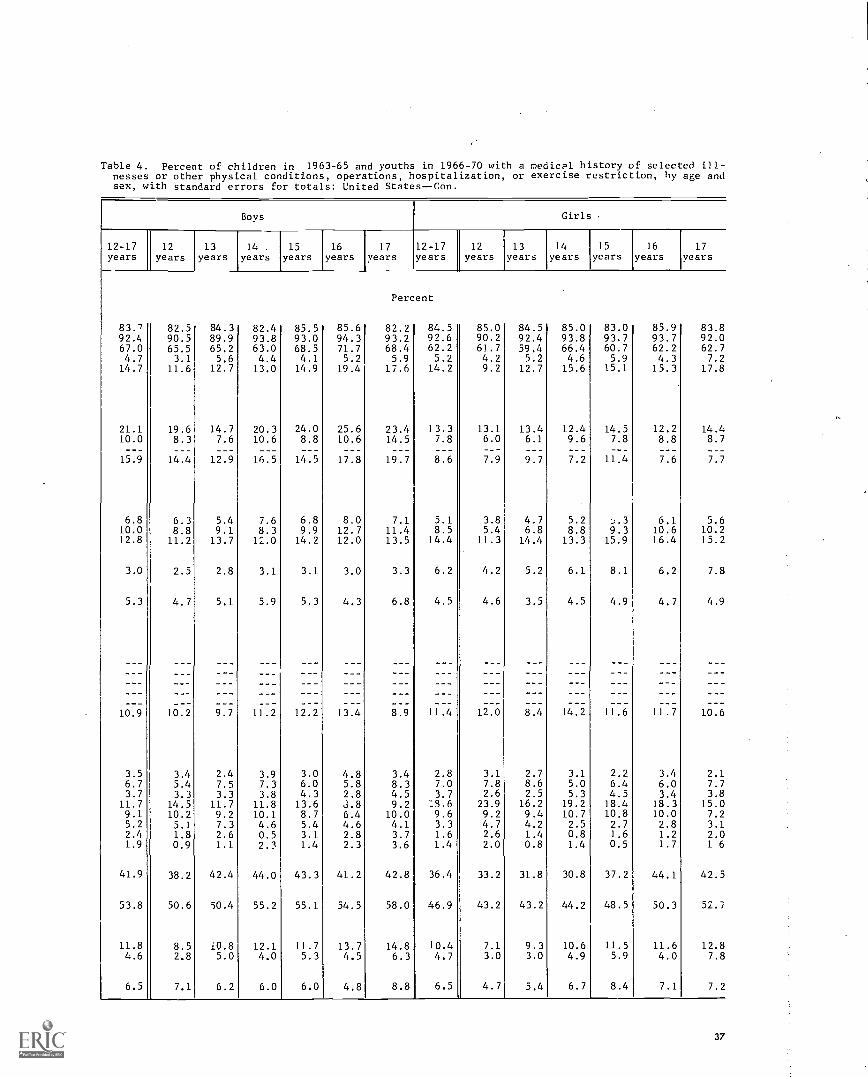
Table 4. Percent of children in 1963-65 and youths in 1966-70 with a medical history of selected ill-nesses or other physical conditions, operations, hospitalization, or exercise restriction, by age andsex, with standard errors for totals: United States--Con.
Boys Girls
12-17years
12years
13years
14 .
years15
years16
years17
years12-17years
12years
13years
14years
15years
16
years17
years
Percent
83.7 82.5 84.3 82.4 85.5 85.6 82.2 84.5 85.0 84.5 85.0 83.0 85.9 83.892.4 90.5 89.9 93.8 93.0 94.3 93.2 92.6 90.2 92.4 93.8 93,7 93.7 92.067.0 65.5 65.2 63.0 68.5 71.7 68.4 62.2 61.7 59.4 66.4 60.7 62.2 62.74.7 3.1 5.6 4.4 4.1 5.2 5.9 5.2 4.2 5.2 4.6 5.9 4.3 7.214.7 11.6 12.7 13.0 14.9 19.4 17.6 14.2 9.2 12.7 15.6 15,1 15.3 17.8
21.1 19.6 14.7 20.3 24.0 25.6 23.4 13.3 13.1 13.4 12.4 14.5 12.2 14.410.0 8.3 7.6 10.6 8.8 10.6 14.5 7.8 6.0 6.1 9.6 7.8 8.8 8.7
15.9 14.4 12.9 16.5 14.5 17.8 19.7 8.6 7.9 9.7 7.2 11 4 7.6 7.7
6.8 6.3 5.4 7.6 6.8 8.0 7.1 5.1 3.8 4.7 5.2 6.1 5.610.0 8.8 9.1 8.3 9.9 12.7 11.4 8.5 5.4 6.8 8.8 9.3 10.6 10.212.8 11.2 13.7 12.0 14.2 12.0 13.5 14.4 11.3 14.4 13.3 15.9 16.4 15.2
3.0 2.5 2.8 3.1 3.1 3.0 3.3 6.2 4.2 5.2 6.1 8.1 6.2 7.8
5.3 4.7 5.1 5.9 5.3 4.3 6.8 4.5 4.6 3.5 4.5 4.9 4.7 4.9
10.9 10.2 9.7 11.2 12.2 13.4 8.9 11.4 12.0 8.4 14.2 11.6 11.7 10.6
3.5 3.4 2.4 3.9 3.0 4.8 3.4 2.8 3.1 2.7 3.1 2.2 3.4 2.16.7 5.4 7.5 7.3 6.0 5.8 8.3 7.0 7.8 8.6 5.0 6.4 6.0 7.73.7 3.3 3.3 3.8 4.3 2.8 4.5 3.7 2.6 2.5 5.3 4.5 3.4 3.8
11.7 14.5 11.7 11.8 13.6 3.8 9.2 :5.6 23.9 16.2 19.2 18.4 18.3 15.09.1 10.2 9.2 10.1 8.7 6.4 10.0 9.6 9.2 9.4 10.7 10.8 10.0 7.25.2 5.1 7.3 4.6 5.4 4.6 4.1 3.3 4.7 4.2 2.5 2.7 2.8 3.12.4 1.8 2.6 0.5 3.1 2.8 3.7 1.6 2.6 1.4 0.8 1.6 1.2 2.01.9 0.9 1.1 2.3 1.4 2.3 3.6 1.4 2.0 0.8 1.4 0.5 1.7 1 6
41.9 38.2 42.4 44.0 43.3 41.2 42.8 36.4 33.2 31.8 30.8 37.2 44.1 42.5
53.8 50.6 50.4 55.2 55.1 54.5 58.0 46.9 43.2 43.2 44.2 48.5 50.3 52.7
11.8 8.5 i0.8 12.1 11.7 13.7 14.8 10.4 7.1 9.3 10.6 11.5 11.6 12.84.6 2.8 5.0 4.0 5.3 4.5 6.3 4.7 3.0 3.0 4.9 5.9 4.0 7.8
6.5 7.1 6.2 6.0 6.0 4.8 8.8 6.5 4.7 5.4 6.7 8.4 7.1 7.2
37

Table 4. Percent of children in 1963-65 and youths in 1966-70 with a medical history of selected ill-nesses or other physical conditions, operations, hospitalization, or exercise restriction, by age andsex, with standard errors for totals: United States--Con.
Medical history item
Children 6-11 years Youth s 12-17 years
Bothsexes Boys Girls Both
sexes Boys Girls
ChickenpoxMeaslesMumpsScarlet feverWhooping cough
Infective diseases
Broken bonesKnocked unconsciousScars from burnsOther accidents
Accidents
Allergies and related conditions
Asthma-Hay fever--- -Other allergies
Kidney condition
Heart condition
Respiratory conditions
Sore throatColdsCoughsBronchitisChest colds-Pneumonia
Sensory-neurological conditions
Convulsions or fitsEye troubleTrouble hearingEarachesRunning earsProblem talkingTrouble walkingArm ce leg limitation
Operation-
Hospitalized more than 1 day
Exercise restricted:EverNow
Taking medicine regularly
0.871.340.421.02
ti
0.370.250.260.26
0.350.350.54
0.32
0.25
0.570.740.400.730.37
0.180.540.380.840.500.470.150.12
0.47
0.95
0.311.87
0.32
0.781.690.420.94
0.450.320.340.39
0.530.440.69
0.29
0.31
0.720.780.670.880.50
0.320.720.431.010.560.470.250.23
0.77
0.98
0.443.41
0.33
Standard error
1.03 41.16 0.661.35 0.870.59 0.471.17 0.70
0.52 0.480.32 0.370.350.35 0.66
0.40 0.370.38 0.610.71 0.75
0.50 I 0.45
0.421 0.36
0.670.900.540.840.49
0.53
0.38 0.230.68 0.510.49 0.281.00 0.800.62 0.530.63 0.210.24 0.190.14 0.22
0.43 I 0.93
1.25 I 1.14
0.38 I 0.493.29 0.24
0.49 I 0.35
1.210.831.070.500.80
0.760.43
0.76
0.610.700.70
0.36
0.44
0.56
0.330.520.310.770.950.300.250.34
1.18
1.33
0.720.39
0.43
1.230.641.090.650.85
0.750.65
0.87
0.440.820.99
0.63
0.51
0.69
0.320.600.421.050.640.320.240.26
1.14
1.20
0.510.37
0.54
38

Table 5. Percent of children in 1963-65 with a medical history of other selected serious ill-nesses, by age and sex, with standard errors for totals: United States
Age, sex, and surveyRheu-maticfever
Polio-myeli-tis
Diph-theria
Menin-gitis
Tuber-culosis
Diabe-tes
Epi-lepsy Chorea
Cere-bralpalsy
Children Percent
Botn sexes 6-11years 0.6 0 2 0 1 0 2 0.1 0.1 0.3 0.1 0.1
6 years 0.2 0.0 0.1 0.2 0.2 0.0 0.3 0.0 0.0
7 years 0.2 0.1 0.0 0.4 0.1 0.0 0.2 0.1 0.2
8 years 0.5 0.2 0.3 0.3 0.0 0.0 0.2 0.0 0.1
9 years 0.5 0.0 0.2 0.2 0.1 0.0 0.4 0.2 0.2
10 years 1.1 0.3 0.0 0.2 0.0 0.2 0.3 0.0 0.2
11 years 0.8 0.7 0.0 0.1 0.1 0.3 0.4 0.1 0.1
Boys 6-11 years 0.5 0.2 0.1 0.3 0.1 0,1 0.2 0.1 0.1
6 years 0.2 0.0 0.1 0.4 0.0 0.0 0.0 0.0 0.0
7 years 0.0 0.0 0.0 0.5 0.0 0.0 0.2 0.0 0.2
8 years 0.8 0.2 0.2 0.3 0.0 0.0 0.0 0.0 0.0
9 years 0.6 0.0 0.2 0.4 0.2 0.0 0.6 0.3 0.2
10 years - 0.8 0.2 0.0 0.0 0.0 0.0 0.4 0,0 0.2
11 years 0.7 0.8 0.0 0.0 0.1 0.6 0.3 0.1 0.1
Girls 6-11 years 0.6 0.2 0.1 0.2 0.1 0.1 0.4 0.1 0.1
6 years - 0.3 0.0 0.0 0.0 0.3 0.0 0.6 0.0 0.0
7 years 0.4 0.2 0.0 0.4 0.1 0.0 0.2 0.2 0.1
8 years 0.3 0.2 0.3 0.3 0.0 0.0 0.4 0.0 0.1
9 years 0.3 0.0 0.2 0.1 0.0 0.0 0.3 0.1 0.2
10 years 1.4 0.5 0.0 0.3 0.0 0.4 0.2 0.0 0.2
11 years 0.9 0.6 0.0 0.3 0.0 0.0 0.4 0.0 0.2
Standard error
Both sexes 6-11years 0.11 0.05 I 0.02 0.08 0.03 0.04 0.07 0.03 0.04
Boys 6-11 years 0.12 0.09 0.02 0.11. 0.03 0.07 0.07 0.04 0.06
Girls 6-11 years 0.18 0.10 0.05 0.08 0.04 0.04 0.13 0.04 0.06
.39
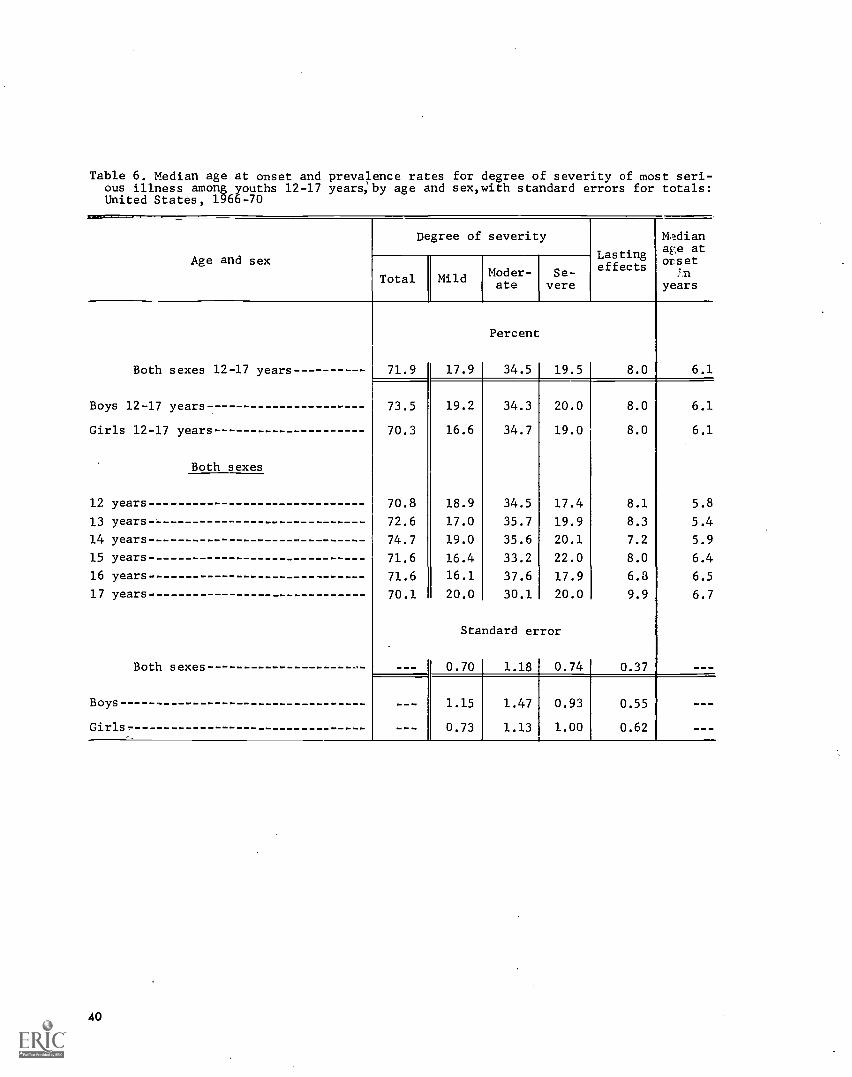
Table 6. Median age at onset and prevalence rates for degree of severity of most seri-ous illness among youths 12-17 years:by age and sex,with standard errors for totals:United States, 1966-70
Age and sex
Degree of severity
Lastingeffects
Mediana-,e ators et
yearsTotal Mild Moder-
ateSe-
vere
Both sexes 12-17 years 71.9 17.9
Percent
34.5 19.5 8.0 6.1
Boys 12-17 years 73.5 19.2 34.3 20.0 8.0 6.1
Girls 12-17 years 70.3 16.6 34.7 19.0 8.0 6.1
Both sexes
12 years 70.8 18.9 34.5 17.4 8.1 5.8
13 years 72.6 17.0 35.7 19.9 8.3 5.4
14 years 74.7 19.0 35.6 20.1 7.2 5.9
15 years 71.6 16.4 33.2 22.0 8.0 6.4
16 years 71.6 16.1 37.6 17.9 6.3 6.5
17 years 70.1 20.0 30.1 20.0 9.9 6.7
Standard error
Both sexes - - _ 0.70 1.18 0.74 0.37
Boys 1.15 1.47 0.93 0.55
Girls. 0.73 1.13 1.00 0.62
40

Table 7. Percent of youths 12-17 years, by type of their most serious illness: UnitedStates, 1966-70
Most serious illness Bothsexes
Boys Girls
Total 12-17 years 100.0
Percent
100.0 100.0
Chickenpox 3.7 3.3 4.3
Measles 14.3 14.0 14.6
Mumps 2.2 2.5 1.7
Scarlet fever 1.5 1.5 1.5
Whooping cough 1.4 1.1 1.8
Accidental injuries 1.1 1.6 0.7
Asthma with or without hay fever 2.2 2.5 1.9
Rheumatic fever 0.9 1.0 0.9
Streptococcal sore throat 1.2 0.8 1.7
Colds 3.9 3.6 4.1
Influenza 1.8 1.6 2.0
Pneumonia 6.3 6.4 6.2
Ear conditions 1.3 1.3 1.3
Hypertrophied tonsils 1.0 0.9 1.1
Appendicitis 1.1 1.3 0.8
Genito- urinary conditions 1.8 1.2 2.5
All others 13.0 13.8 12.1
None reported 41.3 41.6 40.8
41
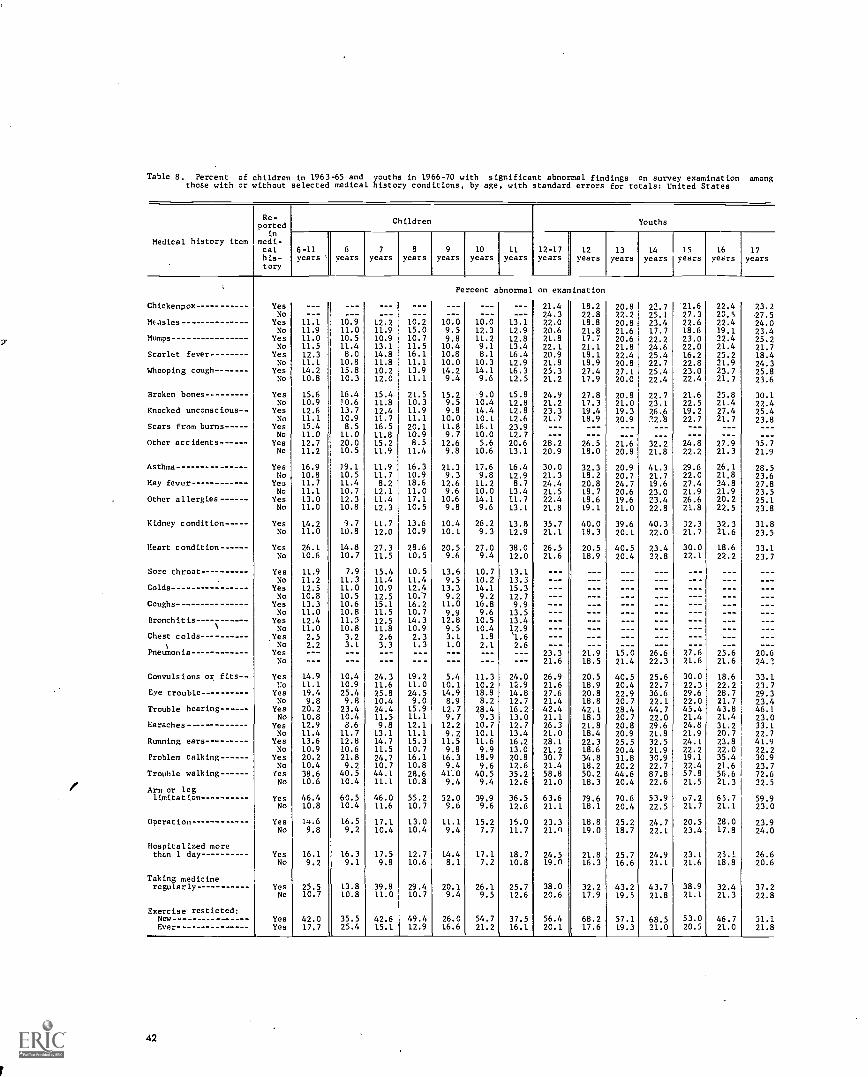
Table 8. Percent of children in 1963-65 and youths in 1966-70 with significant abnormal findings on survey examination amongthose with or without selected medical history conditions, by age, with standard errors for totals: United States
Medical history item
Re-ported
inmedi-calhis-tory
Children
6-11years
6years
7
years8
years9
years10
years11
years12-17years
12years
13years
Chickenpox YesNo
------
Percent abnormal
------
on examination
21.424.3
18.222.8
20.822.2
Measles Yes 11.1 10.9 12.2 10.2 10.0 10.0 13.1 22.0 18.8 20.8No 11.9 11.0 11.9 15.0 9.5 12.3 12.9 20.6 21.8 21.6
Mumps Yes 11.0 10.5 10.9 10.7 9.8 11.2 12.8 21.8 17.7 20.6No 11.5 11.4 13.1 11.5 10.4 9.1 13.4 22.1 21.1 21.8
Scarlet fever Yes 12.3 8.0 14.8 16.1 10.8 8.1 16.4 20.9 18.1 22.4No 11.1 10.8 11.8 11.1 10.0 10.3 12.9 21.8 18.9 20.8
Whooping cough Yes 14.2 15.8 10.2 13.9 14.2 14.1 16.3 25.3 27.4 27.1No 10.8 10.3 12.0 11.1 9.4 9.6 12.5 21.2 17.9 20.0
Broken bones Yes 15.6 16.4 15.4 21.5 15.2 9.0 15.8 24.9 27.8 20.8No 10.9 /0.6 11.8 10.3 9.5 10.4 12.8 21.2 17.3 21.0
Knocked unconscious Yes 12.6 13.7 12.4 11.9 9.8 14.4 12.8 23.3 19.4 19.3No 11.1 10.9 11.7 11.1 10.0 10.1 12.6 21.7 18.9 20.9
Scars from burns Yes 15.4 8.5 16.5 20.1 11.8 16.1 23.9 ---No 11.0 11.0 11.8 10.9 9.7 10.0 12.7 ---
Other accidents Yes 12.7 20.0 15.2 8.5 12.6 5.6 20.6 28.2 26.5 21.6No 11.2 10.5 11.9 11.4 9.8 10.6 13.1 20.9 18.0 20.8
Asthma Yes 16.9 39.1 11.9 16.3 21.3 17.6 16.4 30.0 32.3 20.9No 10.8 10.5 11.7 10.9 9.3 9.8 12.9 21.3 18.2 20.7
Hay fever Yes 11.7 11.4 8.2 18.6 12.6 11.2 8.7 24.4 20.8 24.7No 11.1 10.7 12.1 11.0 9.6 10.0 13.4 21.5 18.7 20.6
Other allergies Yes 13.0 12.3 11.4 17.1 10.6 14.1 11.7 22.4 18.6 19.6No 11.0 10.8 12.3 10.5 9.8 9.6 13.1 21.8 19.1 21.0
Kidney condition Yes 14.2 3.7 11.7 13.6 10.4 26.2 13.8 35.7 40.0 39.6No 11.0 10.8 12.0 10.9 10.1 9.3 12.9 21.1 18.3 20.1
Heart condition Yes 26.1 14.8 27.3 28.6 20.5 27.0 38.0 26.5 20.5 40.5No 10.6 10.7 11.5 10.5 9.6 9.4 12.0 21.6 18.9 20.4
Sore throat Yes 11.9 7.9 15.4 10.5 13.6 10.7 13.1No 11.2 11.3 11.4 11.4 9.5 10.2 13.3
Colds Yes 12.5 11.0 10.9 12.4 13.3 14.1 15.3No 10.8 10.5 12.5 10.7 9.2 9.2 12.7
Coughs - Yes 13.3 10.6 15.1 16.2 11.0 16.8 9.9No 11.0 10.8 11.5 10.7 9.9 9.6 13.5
Bronch it is Yes 12.4 11.5 12.5 14.3 12.8 10.5 13.4 ---No 11.0 10.8 11.8 10.9 9.5 10.4 1,2.9 --- ---
Chest colds- Yes 2.5 3.2 2.6 2.3 3.1 1.8 1.6 --- --- ---
)No 2.2 3.1 3.3 1.3 1.0 2.1 2.6 --- --- ---
Pneumonia Yes --- --- --- --- --- --- --- 23.3 21.9 15.0No --- --- --- --- --- --- --- 21.6 18.5 21.4
Convulsions or fits Yes 14.9 10.4 24.3 19.2 5.4 11.3 24.0 26.9 20.5 40.51:o 11.1 10.9 11.6 11.0 10.1 10.2 12.9 21.6 18.9 20.4
Eve trouble Yes 19.4 25.4 25.8 24.5 14.9 18.8 14.8 27.6 20.8 22.9No 9.8 9.8 10.4 9.0 8.9 8.2 12.7 21.4 18.8 20.7
Trouble hearing Yes 20.2 23.4 24.4 15.9 12.7 28.4 16.2 42.4 42.1 28.4No 10.8 10.4 11.5 11.1 9.7 9.3 13.0 21.1 18.3 20.7
Earaches---- - Yes 12.9 8.6 9.8 12.1 12.2 10.7 12.7 26.3 21.8 20.8No 11.4 11.7 13.1 11.1 9.2 10.1 13.4 21.0 18.4 20.9
Running ears--- Yes 13.6 12.8 14.7 15.3 11.5 11.6 16.2 28.1 22.3 25.5No 10.9 10.6 11.5 10.7 9.8 9.9 13.0 21.2 18.6 20.4
Problem talking Yes 20.2 21.8 24.7 16.1 16.3 18.9 20.8 30.7 34.8 31.8No 10.4 9.2 10.7 10.8 9.4 9.6 12.6 21.4 18.2 20.2
Trouble walking Yes 38.6 40.5 44.1 28.6 41.0 40.5 35.2 58.8 50.2 44.6No 10.6 10.4 11.1 10.8 9.4 9.4 12.6 21.0 18.3 20.4
Arm or leglimitation Yes 46.4 60.5 46.0 55.2 52.0 39.9 36.5 63.6 79.6 70.6
No 10.8 10.4 11.6 10.7 9.6 9.6 12.6 21.1 18.1 20.4
Operation Yes 14.6 16.5 17.1 13.0 11.1 15.2 15.0 23.3 18.8 25.2No 9.8 9.2 10.4 10.4 9.4 7.7 11.7 21.0 19.0 18.7
Hospitalized morethEn 1 day Yes 16.1 16.3 17.5 12.7 14.4 17.1 18.7 24.5 21.8 25.7
No 9.2 9.1 9.8 10.6 8.1 7.2 10.8 19.0 16.3 16.6
Taking medicineregularly Yes 25.5 13.8 39.8 29.4 20.1 26.1 25.7 38.0 32.2 43.2
No 10.7 10.8 11.0 10.7 9.4 9.5 12.6 20.6 17.9 19.5
Exercise resticted:Now--------- ------- Yes 42.0 35.5 42.6 49.4 26.0 54.7 37.5 56.4 68.2 57.1Ever- Yes 17.7 25.4 15.1 12.9 16.6 21.2 16.1 20.1 17.6 19.3
42
Youths
14 15years years
16years
17years
22.7 21.625.1 27.323.4 22.617.7 18.622.2 23.024.6 22.025.4 16.222.7 22.825.4 23.022.4 22.4
22.7 21.623.1 22.526.6 19.2:"2:8 22.7
32.2 24.821.8 22.2
41.3 29.621.7 22.019.6 27.423.0 21.923.4 26.622.8 21.8
40.3 32.322.0 21.7
23.4 30.022.8 22.1
------ ---
--- ---26.6 27.622.3 21.6
25.6 30.022.7 22.336.6 29.622.1 22.044.7 45.422.0 21.429.6 24.821.8 21.932.5 24.121.9 22.230.9 19.122.7 22.487.8 57.822.6 21.5
53.9 u7.222.5 21.7
24.7B:i5.22_
24.9 23.121.1 21.6
43.7 38.921.8 21.1
68.5 53.021.0 20.5
22.4 23.220,5 27,522.4 24.019.1 23.422.4 25.221.4 21.725.2 18.421.9 24.323.7 25.821.7 23.6
25.8 30.121.4 22.427.4 25.421.7 23.8
- --
---27.9 35.721.3 21.9
26.1 28.521.8 23.624.8 27.821.9 23.520.2 25.122.5 23.8
32.3 31.821.6 23.5
18.6 33.122.2 23.7
- -- - --
--- - --..__ - --
--- - --
25.6 20.621.6 24.3
18.6 33.122.2 23.728.7 29.321.7 23.443.8 46.121.4 23.031.2 33.120.7 22.723.8 41.922.0 22.235.4 30.921.6 23.756.6 72.621.3 22.5
65.7 59.921.1 23.0
28.0 23.917.8 24.0
25.1 26.618.8 20.6
32.4 37.221.3 22.8
46.7 51.121.0 21.8
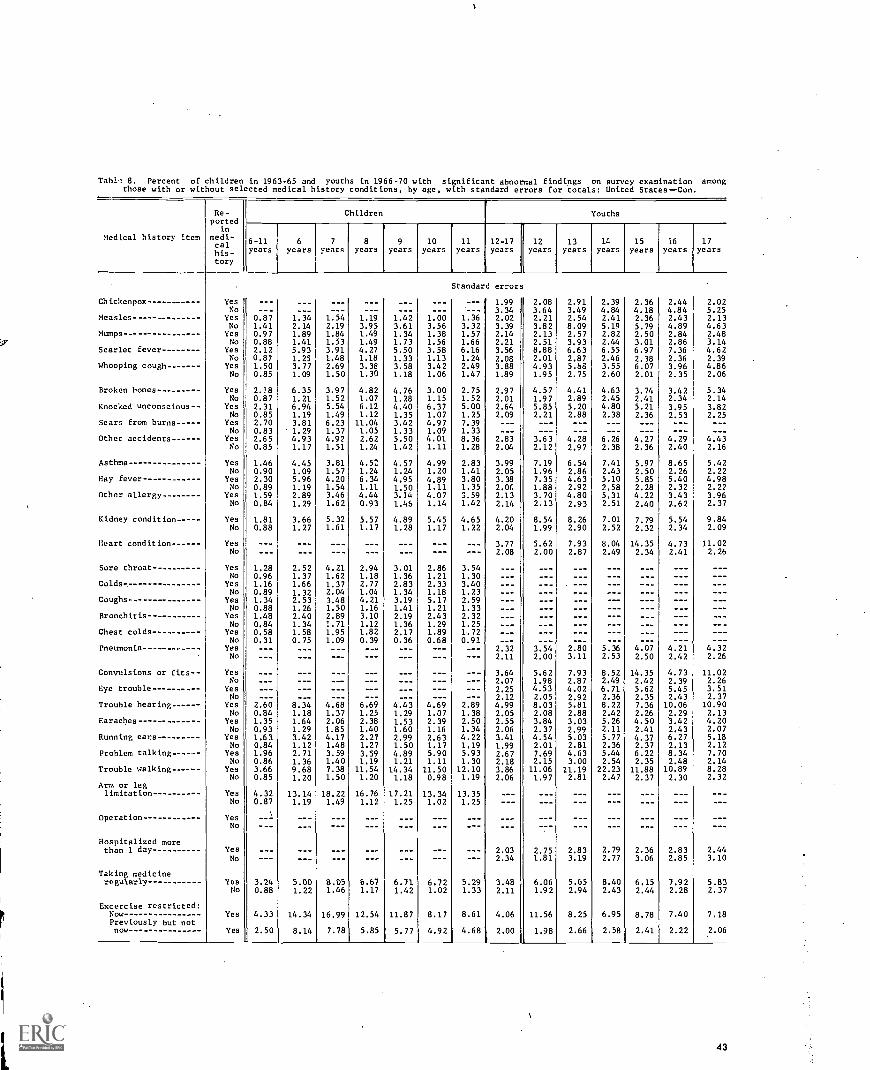
Tab1.1 8. Percent of children in 1963-65 and youths in 1966-70 with significant abnormal findings on survey examination amongthose with or without selected medical history conditions, by age, with standard errors for totals: United States--Con.
Medtcal history item
Re-ported
inmedi-calhis-tory
Children Youths
6-11years
6years
7
years8
years9
years10
years11
years12-17years
12years
13years
14
years15
years16
years17
years
Standard errors
Chickenpox Yes --- --- 1.99 2.08 2.91 2.39 2.36 2.44 2.02No --- 3.34 3.64 3.49 4.84 4.18 4.84 5.25
Measles - Yes 0.87 1.34 1.54 1.19 1.42 1.00 1.36 2.02 2.21 2.54 2.41 2.36 2.43 2.13No 1.41 2.14 2.19 3.95 3.61 3.56 3.32 3.39 3.82 8.09 5.19 5.79 4.89 4.63
Mumps--- Yes 0.97 1.89 1.84 1.49 1.34 1.38 1.57 2.14 2.13 2.57 2.82 2.50 2.84 2.48No 0.88 1.41 1.53 1.49 1.73 1.56 1.66 2.21 2.51 3.93 2.44 3.01 2.86 3.14
Scarlet fever Yes 2.12 5.93 3.91 4.27 5.50 3.58 6.16 3.56 8.88 6.63 6.55 6.97 7.36 4.62No 0.87 1.25 1.48 1.18 1.33 1.13 1.24 2.08 2.01 2.87 2.46 2.38 2.36 2.39
Whooping cough Yes 1.50 3.77 2.69 3.38 3.58 3.42 2.49 3.88 4.93 5.68 3.55 6.07 3.96 4.86No 0.85 1.09 1.50 1.30 1.18 1.06 1.47 1.89 1.95 2.75 2.60 2.01 2.35 2.06
Broken bones Yes 2.18 6.35 3.97 4.82 4.76 3.00 2.75 2.97 4.57 4.41 4.63 3.74 3.42 5.34No 0.87 1.21 1.52 1.07 1.28 1.15 1.52 2.01 1.97 2.89 2.45 2.41 2.34 2.14
Knocked unconscious- - Yes 2.31 6.94 5.54 6.12 4.40 6.37 5.00 2.64 5.85 5.20 4.80 5.21 3.95 3.82No 0.85 1.19 1.49 1.12 1.35 1.07 1.25 2.09 2.21 2.88 2.38 2.36 2.53 2.25
Scars from burns Yes 2.70 3.81 6.23 11.04 3.42 4.97 7.39 - --
No 0.83 1.29 1.37 1.05 1.33 1.09 1.33 - --
Other accidents Yes 2.65 4.93 4.92 2.62 5.50 4.01 8.36 2.83 3.63 4.28 6.26 4.27 4.29 4.43No 0.85 1.17 1.51 1.24 1.42 1.11 1.28 2.04 2.12 2.97 2.38 2.36 2.40 2.16
Asthma Yes 1.46 4.45 3.81 4.52 4.57 4.99 2.83 3.99 7.19 6.54 7.41 5.97 8.65 5.42No 0.90 1.09 1.57 1.24 1.24 1.20 1.41 2.05 1.96 2.86 2.43 2.50 2.26 2.22
Hay fever Yes 2.30 5.96 4.20 6.34 4.95 4.89 3.80 3.38 7.35 4.63 5.10 5.85 5.40 4.98No 0.89 1.19 1.54 1.11 1.50 1.11 1.35 2.06 1.88 2.92 2.58 2.28 2.32 2.22
Other allergy Yes 1.59 2.89 3.46 4.44 3.14 4.07 3.59 2.13 3.70 4.80 5.31 4.22 3.43 3.96No 0.84 1.29 1.62 0.93 1.45 1.14 1.42 2.14 2.13 2.93 2.51 2.40 2.62 2.37
Kidney condition Yes 1.81 3.66 5.32 5.57 4.89 5.45 4.65 4.20 8.54 8.26 7.01 7.79 5.54 9.84No 0.88 1.27 1.61 1.17 1.28 1.17 1.22 2.04 1.99 2.90 2.52 2.32 2.34 2.09
Heart condition Yes 3.77 5.62 7.93 8.04 14.35 4.73 11.02No 2.08 2.00 2.87 2.49 2.34 2.41 2.26
Sore throat Yes 1.28 2.52 4.21 2.94 3.01 2.86 3.54No 0.96 1.37 1.62 1.18 1.36 1.21 1.30
Colds- Yes 1.16 1.66 1.37 2.77 2.83 2.33 3.40No 0.89 1.32 2.04 1.04 1.34 1.18 1.23
Coughs- Yes 1.34 2.53 3.48 4.21 3.19 5.17 2.59 --- --- - --
No 0.88 1.26 1.50 1.16 1.41 1.21 1.33 --- --- --- --- - --
Bronchitis YesNo
1.480.84
2.401.34
2.891.71
3.101.12
2.191.36
2.431.29
2.321.25
------
------
------
------
------
- --
------- --
Chest colds- Yes 0.58 1.58 1.95 1.82 2.17 1.89 1.72 --- _-- -... -_- ___ ___ ---No 0.31 0.75 1.09 0.39 0.36 0.68 0.91 --- --- --_ _-- ___ ___ - --
Yes --- --- --- --- --- --- --- 2.32 3.54 2.80 5.36 4.07 4.21 4.32No --- --- --- --- --- --- --- 2.11 2.00 3.11 2.53 2.50 2.42 2.26
Convulsions or fits Yes --- 3.64 5.62 7.93 8.52 14.35 4.73 11.02No --- 2.07 1.98 2.87 2.49 2.42 2.39 2.26
Eye trouble Yes 2.25 4.53 4.02 6.71 5.62 5.45 3.51No --- 2.12 2.05 2.92 2.36 2.35 2.43 2.37
Trouble hearing Yes 2.60 8.34 4.68 6.69 4.43 4.69 2.89 4.99 8.03 5.81 8.22 7.36 10.06 10.90No 0.84 1.18 1.37 1.25 1.29 1.07 1.38 2.05 2.08 2.88 2.42 2.26 2.29 2.13
Earaches Yes 1.35 1.64 2.06 2.38 1.53 2.39 2.50 2.55 3.84 3.03 5.26 4.50 3.42 4.20No 0.93 1.29 1.85 1.40 1.60 1.16 1.34 2.06 2.37 2.99 2.11 2.41 2.43 2.07
Running ears Yes 1.63 3.42 4.17 2.27 2.99 2.63 4.22 3.41 4.54 5.03 5.77 4.37 6.27 5.18No 0.84 1.12 1.48 1.27 1.50 1.17 1.19 1.99 2.01 2.81 2.36 2.37 2.13 2.12
Problem talking Yes 1.96 2.71 3.59 3.59 4.89 5.90 5.93 2.67 7.69 4.63 5.44 6.22 8.34 7.70No 0.86 1.36 1.40 1.19 1.21 1.11 1.30 2.18 2.15 3.00 2.54 2.35 2.48 2.14
Trouble walking Yes 3.66 9.68 7.38 11.54 14.34 11.50 12.10 3.86 11.06 11.19 22.23 11.88 10.89 8.28No 0.85 1.20 1.50 1.20 1.18 0.98 1.19 2.06 1.97 2.81 2.47 2.37 2.30 2.32
Arm or leglimitation- Yes 4.32 13.14 18.22 16.76 17.21 13.34 13.35
No 0.87 1.19 1.49 1.12 1.25 1.02 1.25
Operation Yes --INo ---
Hospitalized morethan 1 day Yes 2.03 2.75 2.83 2.79 2.36 2.83 2.44
No 2.34 1.81 3.19 2.77 3.06 2.85 3.10
Taking medicineregularly- Yes 3.24 5.00 8.05 6.67 6.71 6.72 5.29 3.48 6.06 5.65 8.40 6.15 7.92 5.83
No 0.88 1.22 1.46 1.17 1.42 1.02 1.33 2.11 1.92 2.94 2.43 2.44 2.28 2.37
Excercise restricted:Now Yes 4.33 14.34 16.99 12.54 11.87 8.17 8.61 4.06 11.56 8.25 6.95 8.78 7.40 7.18Previously but notnow Yes 2.50 8.14 7.78 5.85 5.77 4.92 4.68 2.00 1.98 2.66 2.58 2.41 2.22 2.06
43

'Table 9. Percent of white and Negro children in 1963-65 and youths in 1966-70 withspecified parent ratings of present health, by age and sex, with standard errors fortotals: United States
Age, sex, and survey
White Negro
Parent's rating of presenthealth
Parent's rating of presenthealth
Ex-cel-lent
Verygood Good Fair Poor
Ex-cel-lent
Verygood Good Fair Poor
Children Percent
Both sexes 6-11years 53.8 41.5 I 4.3 0.4 --- 38.9 52.3 8.4 0.4
Boys 6-11 years --- 53.8 41.4 4.4 0.4 --- 38.0 54.8 6.7 0.5Girls 6-11 years --- 53.8 41.5 4.2 0.5 --- 39.9 49.8 10.1 0.2
Both sexes
6 years --- 53.9 42.2 3.5 0.4 --- 39.2 49.0 11.8 0.07 years --- 53.8 41.6 4.3 0.3 --- 34.3 59.5 5.8 0.48 years --- 56.9 38.8 4.0 0.3 --- 41.6 50.3 7.0 1.19 years --- 52.2 42.6 4.6 0.6 --- 36.8 50.8 11.6 0.810 years --- 52.3 42.3 4.9 0.5 --- 41.6 51.7 6.711 years --- 53.6 41.4 4.5 0.5 --- 40.4 52.4 7.2
Youths
Both sexes 12-17years 35.2 34.7 26.9 2.9 0.3 19.1 28.6 46.0 6.0 0.3
Boys 12-17 years 36.7 34.8 25.4 2.9 0.2 20,2 31.3 42.9 5.3 0.3Girls 12-17 years 33.7 34.6 28.5 2.9 0.3 18.0 26.1 48.8 6.7 0.4
Both sexes
12 years 38.8 31.8 26.9 2.2 0.3 24.3 28.1 44.5 2.7 0.413 years 32.8 39.6 24.9 2.4 0.3 18.6 26.4 47.0 6.9 1.114 years 37.3 32.1 28.0 2.3 0.3 19.4 25.8 46.7 7.7 0.415 years 33.0 33.6 28.6 4.4 0.4 15.8 29.3 48.0 6.916 years 36.6 36.5 24.3 2.2 0.4 19.2 29.1 46.2 5.517 years 32.3 34.7 29.0 3.9 0.1 16.2 34.0 43.2 6.6
Standard error
Children 6-11years --- 1.23 1.06 1 0.31 0.06 --- 2.38 2.48 1.05 0.33
Boys 6-11 years 1.59 1.39 0.34 0.16 2.87 2.72 1.18 0.60Girls 6-11 years 1.12 1.01 0.42 0.10 2.96 3.01 1.51 0.19
Youths 12-17 years- 1.06 0.87 1.33 0.21 0.07 1.65 2.11 2.48 0.84 0.17
Boys 12-17 years 1.08 1.01 1.44 0.31 0.06 2.01 2.42 2.46 0.89 0.18Girls 12-17 years 1.38 1.19 1.51 0.29 0.12 1.79 2.56 3.38 1.16 0.25
44

Table 10. Percent of children in 1963-65 and youths in 1966-70 with health a worry to parents,by race,geographic region, annual family income, age, and sex, with standard errors for totals:United States
Age, sex, and survey
Race Geographic region Annual family income
White Negro North-east
Mid-west South West Under
$5,000$5,000-$9,999
$10,000or more
Children Percent whose parent considers present health a problem
Both sexes 6-11years 18.8 20.6 17.8 19.4 20.7 18.1 21.4 18.2 16.0
Boys 6-11 years 19.2 18.0 18.5 18.2 20.4 19.1 19.7 18.6 18.9Girls 6-11 years 18.4 23.3 17.2 20.5 21.0 17.1 22.9 17.9 12.6
Both sexes
6 years 17.1 22.8 21.0 16.0 19.0 16.0 19.2 17.0 17.47 years - 18.0 16.4 15.5 18.0 16.6 20.9 21.G 16.9 13.48 years 17.5 16.8 14.9 19.0 17.1 18.0 19.7 15.4 17.19 years 21.4 22.6 20.8 20.4 25.0 19.5 21.3 22.5 17.510 years 19.9 23.2 16.2 21.6 24.8 17.7 25.3 17.5 15.811 years 19.2 22.3 18.3 21.0 21.6 17.0 21.2 20.4 14.4
Youths
Both sexes 12-17years 14.0 18.3 13.2 12.8 18.2 14.4 19.3 14.4 10.8
Boys 12-17 years 14.4 16.2 13.0 13.3 17.0 15.2 18.3 14.7 11.0Girls 12-17 years 13.7 20.3 13.3 12.3 19.5 13.6 20.0 14.0 10.6
Both sexes
12 years 11.9 14.8 9.3 11.0 17.7 12.1 18.7 13.9 6.313 years 13.2 17.8 10.7 12.3 19.1 13.6 16.5 11.6 13.014 years 14.6 22.7 15.3 13.4 19.7 14.4 20.6 17.2 10.715 years 16.4 18.0 16.1 14.8 19.6 15.5 20.1 16.0 13.416 years 12.5 14.2 12.2 12.3 13.2 13.0 16.1 12.1 9.017 years 15.9 22.5 16.2 13.5 19.9 18.3 23.6 15.7 12.7
Standard error
Children 6-11 years 0.70 2.14 0.83 1.35 1.19 1.04
Boys 6-11 years 0.89 2.34 1.39 1.17 1.19 2.00Girls 6-11 years 0.70 2.32 1.58 1.67 1.31 1.50
Youths 12-17 years 0.59 1.32 0.75 0.65 1.17 1.70 1.27 1.18 0.99
Boys 12-17 years 0.70 2.59 1.18 1.01 1.06 2.51 2.02 1.53 1.18Girls 12-17 years 0.90 2.04 0.85 1.56 1.59 1.23 1.35 1.42 1.16
45

Table 11. Percent of children in 1963-65 and youths in 1966-70 with significant abnormal findingson survey examination, by race, geographic region, annual family income, age, and sex, withstandard errors for totals: United States
Age, sex, and survey
Race Geographic region Annual family income
White Negro North-east
Mid-west South West Under
$5,000$5,000-$9,999
$0.0,000or more
Children Percent abnormal on examination
,
Both sexes 6-11years 10.81 13.8 12.1 13.7 12.2 6.8 12.6 10.8 9 1
Boys 6-11 years 12.0 13.8 14.1 14.0 13.2; 7.7 13.8 11.6 9.9Girls 6-11 years 9.7 13.8 10.1 13.3 11.1 5.7 11.5 9.9 8.2
Both sexes
6 years 10.5 12.9 10.3 11.6 14.6 7.2 10.6 10.9 10.67 years 11.2 17.3 14.8 13.3 13.4 6.3 13.3 11.9 9.48 years 11.2 11.9 10.8 12.5 13.6 8.4 11.6 11.3 8.89 years 9.2 15.0 12.4 11.8 9.1 6.1 12,1 8.9 8.010 years 10.1 10.9 10.1 15.1 8.0 6.5 12.3 9.4 8.511 years 21.9 14.7 14.2 17.6 14.2 5.9 16.4 12.3 9.3
Youths
Both sexes 12-17years 20.8 29.1 17.8 19.6 29.8 20.4 28.3 21.5 16.5
Boys 12-17 years 22.0 30.0 18.5 20.3 32.3 21.2 28.6 23.3 17.2Girls 12-17 years 19.5 28.3 17.1 18.9 27.1 19.6 28.3 19.6 15.9
Both sexes
12 years 18.2 23.7 12.8 15.2 30.2 19.2 25.7 17.9 15.413 years 19.7 29.3 17.5 20.1 29.3 17.5 27.2 21.0 14.214 years 21.9 30.7 17.8 21.0 33.8 19.8 30.6 24.4 15.0i5 years 20.9 32.0 18.7 20.7 28.8 20.5 30.6 20.3 16.416 years 21.2 28.0 20.2 20.2 29.1 19.0 25.3 23.7 18.617 years 22.9 31.8 21.3 20.8 27.0 26.8 30.9 22.4 20.0
Standard error
Children 6-11 years 0.95 1.12 1.23 2.09 0.82 2.04 1.55 1.54 1.49
Boys 6-11 years 1.05 1.96 1.23 2.44 1.06 2.14 2.02 1,47 2.30Girls 6-11 years 1.02 1.78 1.33 1.96 1.49 2.17 1.66 1.99 2.12
Youths 12-17 years 2.03 5.06 1.85 4.99 5.65 2.83 5.60 2.76 2.78
Boys 12-17 years 2.21 6.34 1.99 5.34 5.94 3.98 5.95 3.12 2.92Girls 12-17 years 2.03 4.47 2.01 4.85 5.70 2.51 6.07 2.93 3.48
46
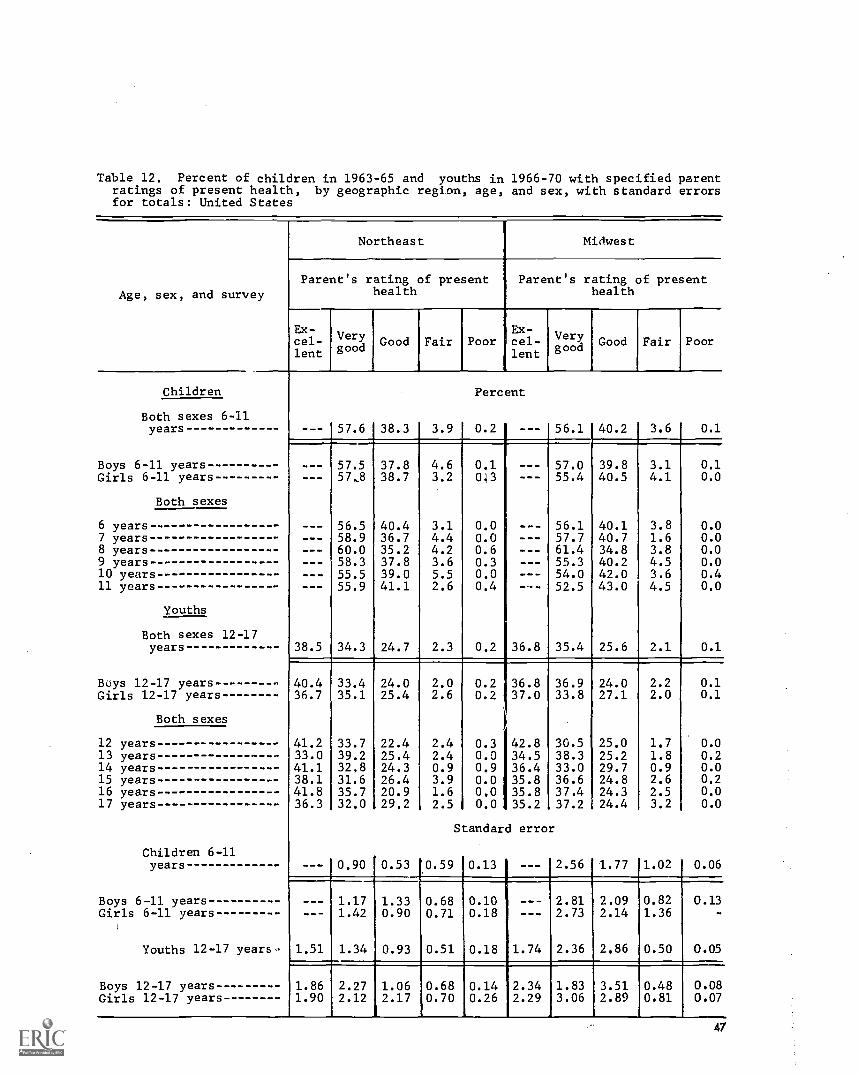
Table 12. Percent of children in 1963-65 and youths in 1966-70 with specified parentratings of present health, by geographic region, age, and sex, with standard errorsfor totals: United States
Age, sex, and survey
Northeast Midwest
Parent's rating of presenthealth
Parent's rating of presenthealth
Ex-cel-lent
Verygood Good Fair Poor
Ex-cel-lent
Verygood Good Fair Poor
Children
Both sexes 6-11years
Boys 6-11 yearsGirls 6-11 years
Both sexes
6 years7 years8 years9 years10 years11 years
Youths
Both sexes 12-17years
Buys 12-17 yearsGirls 12-17 years
Both sexes
12 years13 years14 years15 years16 years17 years
Children 6-11years
Boys 6 -13. yearsGirls 6-11 years
Youths 12-17 years-
Boys 12-17 yearsGirls 12-17 years
--- 57.6 38.3 3.9
--- 57.5 37.8 4.657,8 38.7 3.2
--- 56.5 40.4 3.158.9 36.7 4.460.0 35.2 4.258.3 37.8 3.6
--- 55.5 39.0 5.5--- 55.9 41.1 2.6
38.5 34.3 24.7 2.3
40.4 33.4 24.0 2.036.7 35.1 25.4 2.6
41.2 33.7 22.4 2.433.0 39.2 25.4 2.441.1 32.8 24.3 0.938.1 31.6 26.4 3.941.8 35.7 20.9 1.636.3 32.0 29.2 2.5
--- 0.90 0.53 0.59
1.17 1.33 0.681.42 0.90 0.71
1.51 1.34 0.93 0.51
1.86 2.27 1.06 0.681.90 2.12 2.17 0.70
Percent
0.2 1 --- 56.1 40.2 3.6 0.1
0.1 --- 57.0043 --- 55.4
0.0 --- 56.10.0 --- 57.70.6 --- 61.40.3 --- 55.30.0 --- 54.00.4 --- 52.5
0.2 36.8 35.4
39.840.5
40.140.734.840.242.043.0
3.14.1
3.81.63.84.53.64.5
25.6 2.1
0.10.0
0.00.00.00.00.40.0
0.1
0.2 36.80.2 37.0
i
0.3 42.80.0 34.50.9 36.40.0 35.80.0 35.80.0 35.2
Standard error
36.9 24.0 2.233.8 27.1 2.0
0.10.1
30.5 25.0 1.7 0.038.3 25.2 1.8 0.233.0 29.7 0.9 0.036.6 24.8 2.6 0.237.4 24.3 2.5 0.037.2 ;24.4 3.2 0.0
0.13 I --- 2.56 1.77 1.02
0.100.18
0.06
--- 2.81 2.09 0.82--- 2.73 2.14 1.36
0.18 1.74 2.36 2.86 0.50
0.13
0.05
0.140.26
2.342.29
1.83 3.51 0.48 0.083.06 2.89 0.81 0.07
47

Table 12. Percent of children in 1963-65 and youths in 1966-70 with specified parentratings of present health, by geographic region, age, and sex, with standard errorsfor totals: United States--Con.
Age, sex, and survey
South West
Parent's rating of presenthealth
Parent's rating of presenthealth
Ex-cel-lent
Verygood Good Fair Poor
Ex-cel-lent
Children
Both sexes 6-11years
Boys 6-11 yearsGirls 6-11 years
Both sexes
6 years7 years8 years9 years10 years11 years
Youths
Both sexes 12-17years
Boys 12-17 yearsGirls 12-17 years
12 years13 years14 years15 years16 years17 years
Both sexes
Children 6-11years
Boys 6-11 yearsGirls 6-11 years
Youths 12-17 years-
Boys 12-17 yearsGirls 12-17 years
40.7 49.8 8.2
38.9 52.2 7.542.6 47.2 9.0
40.6 49.8 8.637.9 53.3 7.842.6 51.1 5.636.0 50.6 11.440.7 50.6 7.347.0 42.9 8.5
24.4 31.7 37.4 5.8
27.0 30.9 35.9 5.621.8 32.4 39.0 6.0
25.6 28.7 41.2 3.726.9 32.5 33.3 6.324.4 32.3 35.1 7.721.0 33.1 39.2 6.725.8 31.8 37.0 3.922.9 31.6 39.1 6.2
- 2.11 1.63 0.63
2.19 1.66 0.632.44 1.95 0.79
1.06 1.67 1.92 0.73
0.89 1.92 1.65 0.861.77 1.80 2.65 0.75
Perc
1.3
ent
1.41.2
1.01.00.72.01.41.6
0.7 31.8
0.6 33.60.8 30.0
0.8 35.51.0 27.50.5 37.8
- 29.01.5 34.40.2 26.2
Standard error
10.27 ---
0.690.31
0.14 2.97
0.10 3.450.27 2.83
48
Verygood Good Fair Poor
52.0 43.7 4.1 0.2
52.4 43.2 4.2 0.251.4 44.3 4.0 0.3
53.6 42.3 3.7 0.448.3 46.0 5.2 0.553.5 41.7 4.4 0.450.7 46.4 2.7 0.252.6 42.7 4.752.2 43.9 3.9
34.0 30.6 3.3 0.3
35.7 27.3 3.2 0.232.4 33.9 3.4 0.3
32.4 30.2 1.6 0.340.8 29.4 2.0 0.326.7 32.7 2.8 -
30.4 33.6 6.0 1.037.2 26.0 2.437.3 31.6 4.9
3.17 2.87 0.54 0.10
3.96 3.42 0.72 0.082.47 2.74 0.94 0.22
1.74 3.51 0.33 0.16
2.46 4.27 0.49 0.141.70 3.04 0.55 0.26
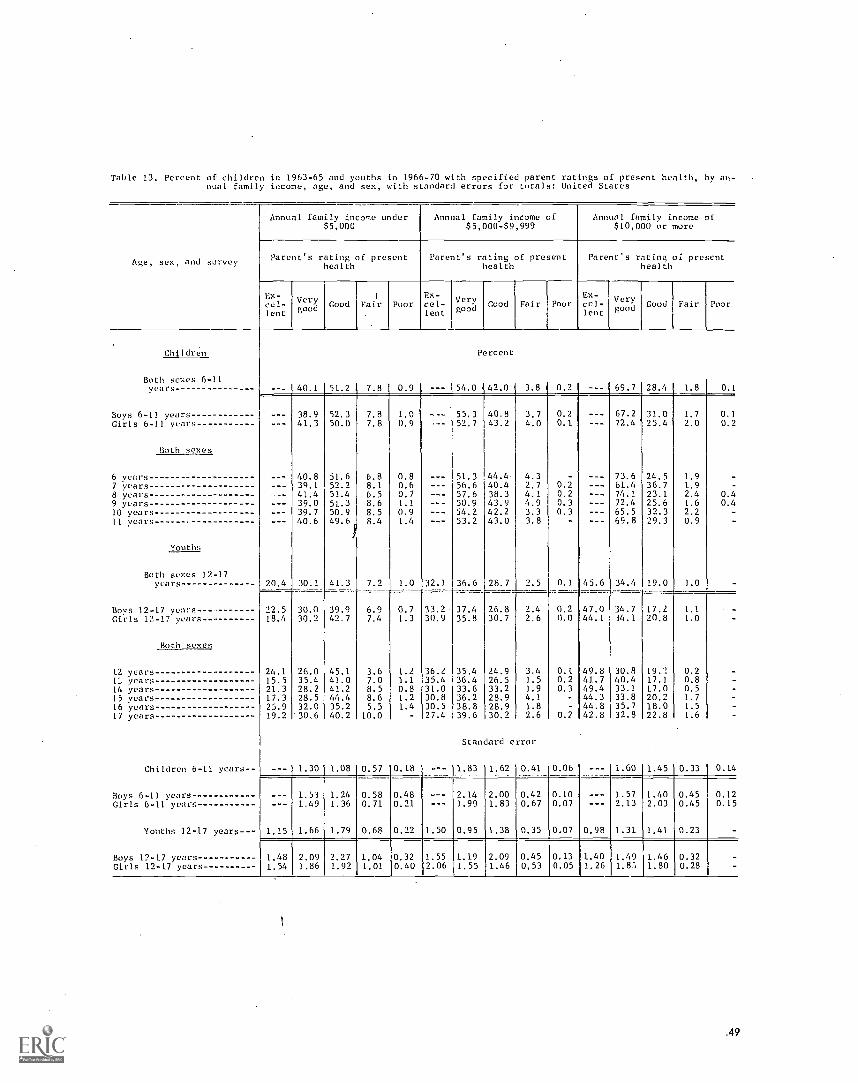
Table 13. Percent of children in 1963-65 and youths in 1966-70 with specified parent ratings of present health, by an-nual. family income, age, and sex, with standard errors for totals: United States
Annual family income under
Age, sex, and survey
$5,000
Parent's rating of presenthealth
Ex-cel-lent
Verygood Good Fair Poor
Children
Both sexes 6-11years 40.1 51.2 7 8 0.9
Boys 6-1] years 38.9 52.3 7.8 1.0Girls 6-11 years 41.3 50.0 7.8 0.9
Both sexes
6 years 40.8 51.6 6.8 0.87 years 39.1 52.2 8.1 0.68 years 41.4 51.4 6.5 0.79 years 39.0 51.3 8.6 1.110 years 39.7 50.9 8.5 0.9II years 40.6 8.4 1.4
Iouths
Both sexes 12-17years 20.4 30.1 41.3 7.2 1.0
Boys 12-17 years- 22.5 30.0 39.9 6.9 0.7Girls 12-17 years 18.4 30.2 42.7 7.4 1.3
Both sexes
12 years 24.1 26.0 45.1 3.6 1.2years 15.5 35.4 41.0 7.0 1.1
14 years 21.3 28.2 41.2 8.5 0.815 years 17.3 28.5 44.4 8.6 1.216 years 25.9 32.0 35.2 5.5 1.417 year's 19.2 30,6 40.2 10.0 -
Children 6-11 years --- 1.30 1.08 0.57 0.18
Boys 6-11 years 1.53 1.24 0.58 0.48Girls 6-11 years 1.49 1.36 0.71 0.21
Youths 12-17 years 1.15 1.66 1.79 0.68 0.22
Boys 12-17 years 1.48 2.09 2.27 1.04 0.32Girls 12-17 years 1.54 1.86 1.92 1.01 0.40
Annual family income of$5,000-$9,999
Annual family income of$10,000 or more
Parent's rating of presenthealth
Parent's rating or presenthealth
Ex-cel-lent
Verygood Good Fair Poor
Ex-cel-lent
Verygood Good Fair Poor
Percent
--- 54.0 42.0 3.8 0,2 69.7 28,4 1.8 0.1
55.3 40.8 3.752.7 43.2 4.0
51.3 44.4 4.356.6 40.4 2.757.6 38.3 4.150.9 43.9 4.954.2 42.2 3.353.2 43.0 3.8
0.20.1
0.20.20.30.3
67.2 31.0 1.772.4 1 25.4 2.0
73.6 24.5 1.961.4 36.7 1.974.1 23.1 2.472.4 25.6 1.665.5 32.3 2.269.8 29.3 0.9
32.1 36.6 28.7 2.5 0.1 45.6 34.4 19.0 1.0
0.10.2
0.40.4
33.2 37.4 26.8 2.4 0.2 47.0 34.7 17.2 1.130.9 35.8 30.7 2.6 0.0 44.1 34.1 20.8 1.0
36.2 35.4 24.9 3.4 0.1 49.8 30.8 19.1 0.235.4 36.4 26.5 1.5 0.2 41.7 40.4 17.1 0.831.0 33.6 33.2 1.9 0.3 49.4 33.1 17.0 0.530.8 36.2 28.9 4.1 - 44.3 33.8 20.2 1.730.5 38.8 28.9 1.8 - 44.8 35.7 18.0 1.527.4 39.6 30.2 2.6 0.2 42.8 32.8 22.8 1.6
Standard error
1.83 1.62 0.41 0.06 1.60 1.45 0.33 0.14
2.14 2.00 0.42 0.10 1.57 1.40 0.451.99 1.83 0.67 0.07 2.13 2.03 0.45
1.50 0.95 1.38 0.35 0.07 0.98 1.31 1.41 0.23
1.552.06
1.1.9
1.552.09 1'0.45
1.46 0.53
0.120.15
0.130.05
1.401.26
1.49 1.461.87, 1.80
0.320.28
.49

Table 14. Prevalence rates of children 6-11 years in 1963-65 and youths 12-17 years in 1966-70 with a medi-cal history of selected illnesses or other physical conditions, operations, hospitalization, or exerciserestriction, by race, geographic region, and annual family income, with standard errors for totals: UnitedStates
Medical history item
White Negro
Children Youths Children Youths
Chickenpox ---
Prevalence of condition
86.4
per 100
--- 70.2Measles 85.9 92.8 85.9 91.1
Mumps 49.9 64.8 41.5 63.8
Scarlet fever 4.3 5.5 0.9 1.3
Whooping cough 7.7 12.2 20.0 29.4
Bro en bones 8.4 18.5 3.8 9.4Knocked unconscious 3.5 9.2 3.2 6.5
Scars from burns 3.7 --- 9.7 - --
Other accidents 4.2 11.9 4.4 14.4
Asthma 5.2 5.8 5.5 7.0Hay fever 4.8 9.4 2.9 7.6Other allergies 12.2 14.6 6.4 6.6
Kidney condition 4.1 4.8 2.8 3.0
Heart condition 3.9 5.0 2.6 4.1
Sore throat 11.9 10.3
Colds 20.5 24.0
Coughs -- 11.0 9.3
Bronchitis 15.7 9.5
Chest colds 6.4 5.1
Pneumonia- 11.4 9.8
Convulsions or fits 3.4 3.3 2.6 2.2
Eye trouble 13.6 6.0 16.0 11.8
Trouble hearing 4.1 3.5 5.1 4.7Earaches 28.1 15.3 18.4 13.8Running ear 12.6 10.0 7.5 5.3
Problem talking 7.6 3.5 13.8 9.4Trouble walking 2.3 1.8 2.4 3.2
Arm or leg limitation 1.2 1.8 1.8 1.6
Operations 33.8 42.5 12.4 17.9
Hospitalized more than 1 day 20.2 53.1 15.9 33.3
Exercise restrict,A:Ever 24.7 11.6 44.7 8.0Now 5.4 4.6 5.0 5.4
50
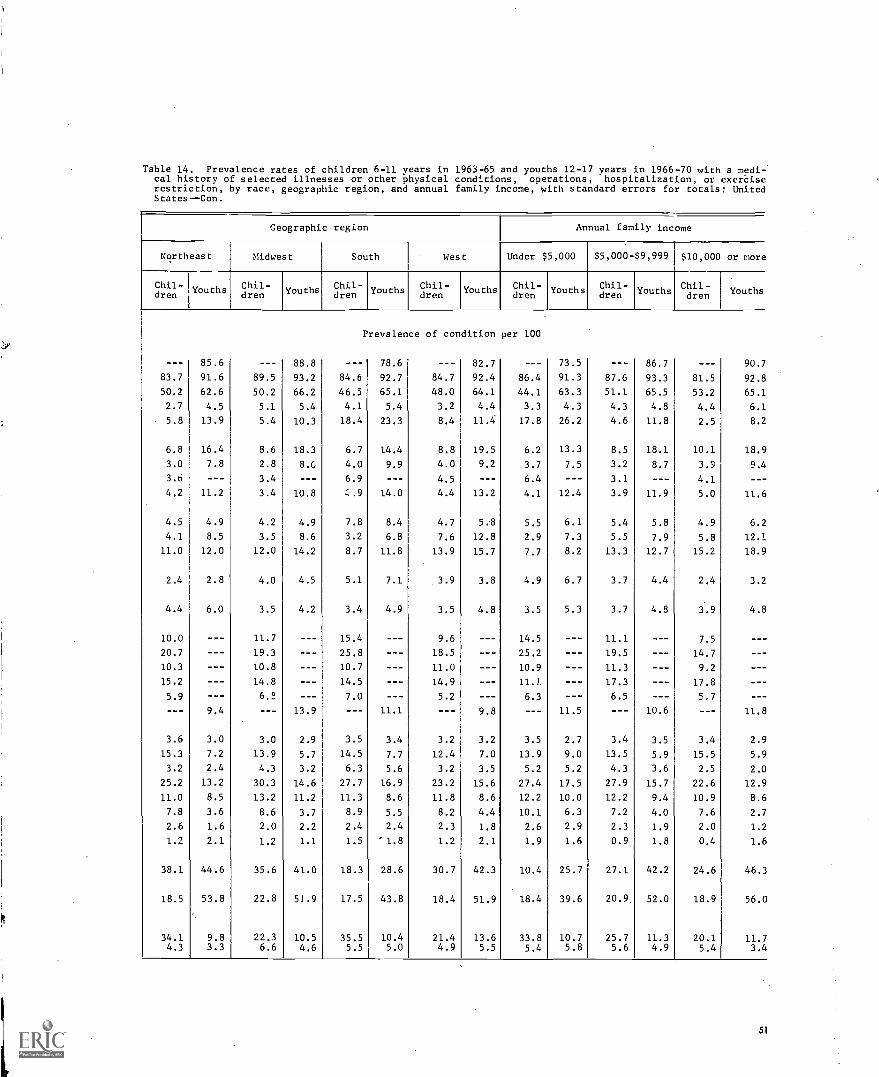
Geographic region Annual family income
Northeast Midwest South West Under $5,000 $5,000-$9,999 $10,000 or more
Chil-Chil- Youths Chil-Youths Chil- Youths Chil- Youths Chil- Youths Chil- Youths Youths
I
dren dren dren dren then dren dren
Prevalence of condition per 100
--- 85.6 --- 88.8 --- 78.6 --- 82.7 --- 73.5 86.7 --- 90.7
83.7 91.6 89.5 93.2 84.6 92.7 84.7 92.4 86.4 91.3 87.6 93.3 81.5 92.8
50.2 62.6 50.2 66.2 46.5 65.1 48.0 64.1 44.1 63.3 51.1 65.5 53.2 65.1
2.7 4.5 5.1 5.4 4.1 5.4 3.2 4.4 3.3 4.3 4.3 4.8 4.4 6.1
5.8 13.9 5.4 10.3 18.4 23.3 8.4 11.4 17.8 26.2 4.6 11.8 2.5 8.2
6.8 16.4 8.6 18.3 6.7 14.4 8.8 19.5 6.2 13.3 8.5 18.1 10.1 18.9
3.0 7.8 2.8 8.G 4.0 9.9 4.0 9.2 3.7 7.5 3.2 8.7 3.9 9.4
3.6 --- 3.4 --- 6.9 --- 4.5 --- 6.4 --- 3.1 --- 4.1 - --
4.2 11.2 3.4 10.8 ,.9 14.0 4.4 13.2 4.1 12.4 3.9 11.9 5.0 11.6
4.5 4.9 4.2 4.9 7.8 8.4 4.7 5.8 5.5 6.1 5.4 5.8 4.9 6.2
4.1 8.5 3.5 8.6 3.2 6.8 7.6 12.8 2.9 7.3 5.5 7.9 5.8 12.1
11.0 12.0 12.0 14.2 8.7 11.8 13.9 15.7 7.7 8.2 13.3 12.7 15.2 18.9
2.4 2.8 4.0 4.5 5.1 7.1 3.9 3.8 4.9 6.7 3.7 4.4 2.4 3.2
4.4 6.0 3.5 4.2 3.4 4.9 3.5 4.8 3.5 5.3 3.7 4.8 3.9 4.8
10.0 --- 11.7 --- 15.4 --- 9.6 --- 14.5 --- 11.1 --- 7.5 - --
20.7 --- 19.3 --- 25.8 --- 18.5 --- 25.2 --- 19.5 --- 14.7 - --
10.3 --- 10.8 --- 10.7 --- 11.0 --- 10.9 --- 11.3 --- 9.2 - --
15.2 --- 14.8 --- 14.5 --- 14.9 --- 11.J --- 17.3 --- 17.8 - --
5.9 --- 6.2 --- 7.0 --- 5.2 --- 6.3 --- 6.5 --- 5.7 - --
--- 9.4 --- 13.9 --- 11.1 --- 9.8 --- 11.5 --- 10.6 --- 11.8
3.6 3.0 3.0 2.9 3.5 3.4 3.2 3.2 3.5 2.7 3.4 3.5 3.4 2.9
15.3 7.2 13.9 5.7 14.5 7.7 12.4 7.0 13.9 9.0 13.5 5.9 15.5 5.9
3.2 2.4 4.3 3.2 6.3 5.6 3.2 3.5 5.2 5.2 4.3 3.6 2.5 2.0
25.2 13.2 30.3 14.6 27.7 16.9 23.2 15.6 27.4 17.5 27.9 15.7 22.6 12.9
11.0 8.5 13.2 11.2 11.3 8.6 11.8 8.6 12.2 10.0 12.2 9.4 10.9 8.6
7.8 3.6 8.6 3.7 8.9 5.5 8.2 4.4 10.1 6.3 7.2 4.0 7.6 2.7
2.6 1.6 2.0 2.2 2.4 2.4 2.3 1.8 2.6 2.9 2.3 1.9 2.0 1.2
1.2 2.1 1.2 1.1 1.5 '1.8 1.2 2.1 1.9 1.6 0.9 1.8 0.4 1.E
38.1 44.6 35.6 41.0 18.3 28.6 30.7 42.3 10.4 25.7 27.1 42.2 24.6 46.2
18.5 53.8 22.8 51.9 17.5 43.8 18.4 51.9 18.4 39.6 20.9 52.0 18.9 56.
34.1 9.8 22.3 10.5 35.5 10.4 21.4 13.6 33.8 10.7 25.7 11.3 20.1 11.i4.3 3.3 6.6 4.6 5.5 5.0 4.9 5.5 5.4 5.8 5.6 4.9 5.4 3.4
Table 14. Prevalence rates of children 6-11 years in 1963-65 and youths 12-17 years in 1966-70 with a medi-:cal history of selected illnesses or other physical conditions, operations, hospitalization, or exerciserestriction, by race, geographic region, and annual family income, with standard errors for totals: UnitedStates--Con.
(
51

Table 14. Prevalence rates of child:en 6-11 years in 1963-65 and youths 12-17 years in 1966-70 with a medi-cal history of selected illnesses or other physical conditions, operations, hospitalization, or exerciserestriction, by race, geographic region, and annual family income. with standard errors for totals: UnitedStates--Con.
Medical history item
Lhite Negro
Children Youths Children Youths
Chickenpox
Standard
0.99
error
4.16
Measles 0.95 0.78 1.40 0.87
Mumps 1.58 0.97 2.43 1.45
Scarlet fever 0.48 0.53 0.33 0.44
Whooping cough 0.92 0.70 3.18 2.16
Broken bones 0.39 0.49 0.53 0.74
Knocked unconscious 0.26 0.46 0.54 0.64
Scars from burns 0.20 1.10
Other accidents 0.27 0.66 0.63 2.04
Asthma 0.40 0.40 0.62 0.70
Hay fever 0.41 0.70 0.64 1.10
Other allergies 0.59 0.87 0.79 1.23
Kidney condition 0.36 0.51 0.70 0.37
Heart condition 0.26 0.39 0.70 0.77
Sore throat 0.58 1.19
Colds 0.71 1.69
Coughs 0.40 1.05
Bronchitis 0.78 1.54
Chest colds 0.47 0.77
Pneumonia 0.61 0.97
Convulsions or fits 0.17 0.25 0.53 0.65
Eye trouble 0.58 0.51 1.16 1.50
Trouble hearing 0.36 0.32 0.83 0.47
Earaches 0.95 0.84 1.36 1.99
Running ear 0.53 0.62 0.87 0.71
Problem talking 0.39 0.24 1.49 0.59
Trouble walking 0.16 0.20 0.52 0.46
Arm or leg limitation 0.12 0.25 0.27 0.37
Operations 0.52 1.16 1.13 1.57
Hospitalized more than 1 day 1.05 1.36 2.07 1.04
Exercise restricted:Ever 0.36 0.58 0.56 1.04Now 1.85 0.27 13.31 1.08
52
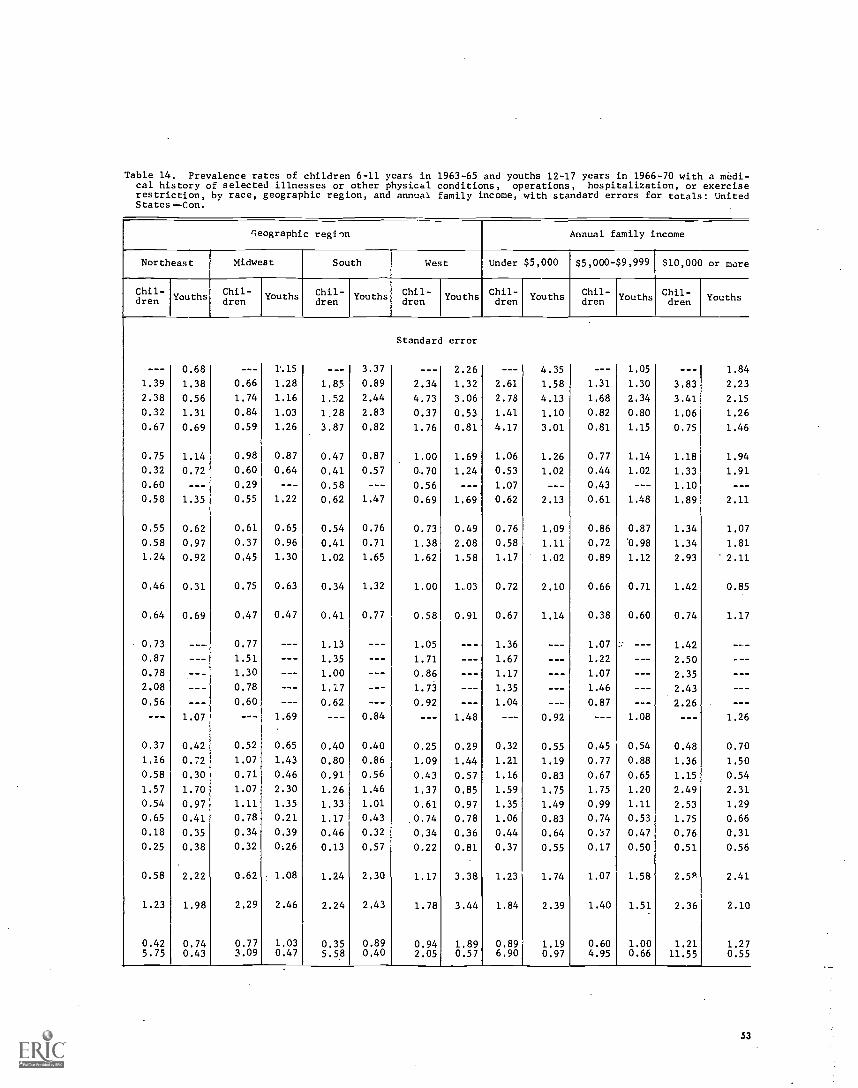
Table 14. Prevalence rates of children 6-11 years in 1963-65 and youths 12-17 years in 1966-70 with a medi-cal history of selected illnesses or other physical conditions, operations, hospitalization, or exerciserestriction, by race, geographic region, and annual family income, with standard errors for totals: UnitedStates -Con.
geographic region Annual family income
Northeast Midwest South West Under $5,000 $5,000-$9,999 $10,000 or more
Chil-dren Youths
Chil-dren
Youths Chil-dren
Youths Chil-dren Youths Chil-
drenyouthsYouth s
Chil-dren Youth Chil-
dren Youths
Standard error
--- 0.68 --- 115 --- 3.37 --- 2.26 ---I 4.35 --- 1.05 --- 1.84
1.39 1.38 0.66 1.28 1.85 0.89 2.34 1.32 2.61 1.58 1.31 1.30 3.83 2.23
2.38 0.56 1.74 1.16 1.52 2.44 4.73 3.06 2.78 4.13 1.68 2.34 3.41 2.15
0.32 1.31 0.84 1.03 1,28 2.83 0.37 0.53 1.41 1.10 0.82 0.80 1.06 1.26
0.67 0.69 0.59 1.26 3.87 0.82 1.76 0.81 4.17 3.01 0.81 1.15 0.75 1.46
0.75 1.14 0.98 0.87 0.47 0.87 1.00 1.69 1.06 1.26 0.77 1.14 1.18 1.94
0.32 0.72 0.60 0.64 0.41 0.57 0.70 1.24 0.53 1.02 0.44 1.02 1.33 1.91
0.60 --- 0.29 --- 0.58 --- 0.56 --- 1.07 --- 0.43 --- 1.10 - --
0.58 1.35 0.55 1.22 0.62 1.47 0.69 1.69 0.62 2.13 0.61 1.48 1.89 2.11
0.55 0.62 0.61 0.65 0.54 0.76 0.73 0.49 0.76 1.09 0.86 0.87 1.34 1.07
0.58 0.97 0.37 0.96 0.41 0.71 1.38 2.08 0.58 1.11 0.72 '0.98 1.34 1.81
1.24 0.92 0.45 1.30 1.02 1.65 1.62 1.58 1.17 1.02 0.89 1.12 2.93 2.11
0.46 0.31 0.75 0.63 0.34 1.32 1.00 1,03 0.72 2.10 0.66 0.71 1.42 0.85
0.64 0.69 0.47 0.47 0.41 0.77 0.58 0.91 0.67 1.14 0.38 0.60 0.74 1.17
0.73 --- 0.77 --- 1.13 --- 1.05 --- 1.36 --- 1.07 --- 1.42 - --
0.87 --- 1.51 --- 1.35 --- 1.71 --- 1.67 --- 1.22 --- 2.50 - --
0.78 --- 1.30 --- 1.00 --- 0.86 --- 1.17 --- 1.07 --- 2.35 - --
2.08 --- 0.78 --- 1.17 --- 1.73 --- 1.35 --- 1.46 --- 2.43 - --
0.56 --- 0.60 --- 0.62 --- 0.92 --- 1.04 --- 0.87 --- 2.26 - --
--- 1.07 --- 1.69 --- 0.84 --- 1.48 --- 0.92 --- 1.08 --- 1.26
0.37 0.42 0.52 0.65 0.40 0.40 0.25 0.29 0.32 0.55 0.45 0.54 0.48 0.70
1.16 0.72 1.07 1.43 0.80 0.86 1.09 1.44 1.21 1.19 0.77 0.88 1.36 1.50
0.58 0.30 0.71 0.46 0.91 0.56 0.43 0.57 1.16 0.83 0.67 0.65 1.15 0.54
1.57 1.70 1.07 2.30 1.26 1.46 1.37 0.85 1.59 1.75 1.75 1.20 2.49 2.31
0.54 0.97 1.11 1.35 1.33 1.01 0.61 0.97 1.35 1.49 0.99 1.11 2.53 1.29
0.65 0.41 0.78 0.21 1.17 0.43 .0.74 0.78 1.06 0.83 0.74 0.53 1.75 0.66
0.18 0.35 0.34 0.39 0.46 0.32 0.34 0.36 0.44 0.64 0.:17 0.47 0.76 0.31
0.25 0.38 0.32 0.26 0.13 0.57 0.22 0.81 0.37 0.55 0.17 0.50 0.51 0.56
0.58 2.22 0.62 1.08 1.24 2.30 1.17 3.38 1.23 1.74 1.07 1.58 2.59 2.41
1.23 1.98 2.29 2.46 2.24 2.43 1.78 3.44 1.84 2.39 1.40 1.51 2.36 2.10
0.42 0.74 0.77 1.03 0.35 0.89 0.94 1.89 0.89 1.19 0.60 1.00 1.21 1.275.75 0.43 3.09 0.47 5.58 0.40 2.05 0.57 6.90 0.97 4.95 0.66 11.55 0.55
53

APPENDIX I
STATISTICAL NOTES
The Survey Desigp
The sample designs for the first three programs(Cycles I-III) of the Health Examination Survey havebeen essentially similar in that each has been a multi-stage, stratified probability sample of clusters ofhouseholds in land-based segments. The successiveelements for this sample design are primary sam-pling unit, census enumeration district, segment (acluster of households), eligible person, and finallythe sample person.
The same 40 sample areas and the same seg-ments were utilized in the design of both Cycles IIand III. Previous reports describe in detail the sam-ple design used for Cycle II and in addition discuss theproblems of and considerations given to other typesof sampling frames, cluster versus random sampling,and whether or not to control the selection of sib-
Requirements and limitations placed on the designfor both Cycles II and III were that:
The target population be defined as the civiliannoninstitutional population of the United States,including Alaska and Hawaii, of ages 6-11 yearsfor Cycle II and 12-17 years for Cycle III, withthe special exclusion of children residing on res-ervation lands of the American Indians. The latterexclusion was due to operational problems en-countered on these lands in Cycle I.The time period of data collection be limited toabout 3 years for each cycle and the length of theindividual examination within the specially con-structed mobile examination center be between 2and 3 hours.Ancillary data be collected on specially designedhousehold, medical history, and school question-naires and from birth certificate copies.Examination objectives be primarily related tofactors of physical and intellectual growth anddevelopment.The sample be sufficiently large to yield reliablefindings within broad geographic regions and pop-ulation density groups as well as age, sex, andlimited socioeconomic groups for the total sample.
54
The sample was drawn jointly with the U.S. Bu-reau of the Qensus, starting with the 1960 decennialcensus list of addresses and the nearly 1,900 primarysampling units (PSUrs) into which the entire UnitedStates was divided. Each PSU is either a standardmetropolitan statistical area, a county, or a group oftwo or three contiguous counties. These PSU's weregrouped into 40 strata, each stratum having an aver-age size of about 4.5 million persons, in such a manneras to maximize the degree of homogeneity within stratawith regard to the population size of the PSU's, de-gree of urbanization, geographic proximity, and de-gree of industrialization. The 40 strata were than clas-sified into four broad geographic regions of 10 strataeach and then within each region cross-classified byfour population density classes and classes of rate ofpopulation change from 1950 to 1960. Using a modi-fied Goodman-Kish controlled-selection technique,one PSU was drawn from each of the 40 strata.
Further stages of sampling within PSU's requiredfirst the selection of census enumeration districts(ED's). The ED's are small, well-defined areas of about250 housing units into which the entire Nation was di-vided for the 1960 population census. Each ED was as-signed a "measure of size" equal to the rounded wholenumber resulting from a "division by nine" of the num-ber of children aged 5-9 in the ED at the time of the1960 census. A sample of 20 ED's in the sample PSUwere selected by systematic sampling with each EDhaving a probability of selection proportional to thepopulation of children 5-9 years at the time of the 1960census date. A further random selection by size of seg-ments (smaller clusters of housing units) within eachED was then made.
Because of the 3-year time interval between CycleII and Cycle III, the Cycle III frame had to be supple-mented for new construction and to compensate forsegments where housing was partially or totally de-molished to make room for highway construction orurban redevelopment.
Advanced planning for the examinations at the var-ious locations or stands provided for about 17 days ofexaminations, which limited the number o examineesper location to approximately 200. When the number ofeligible persons (children or youths) in the sample

drawn for a particular location exceeded this number,subsampling was done by deleting from the masterlist of eligible persons (ordered by segment, house-hold order within segment, and age within household)every nth name on the list starting with the yth name,y being a number between I and ti selected randomlyand n being the extent of oversampling in the originaldraw.
In both Cycles II and III twins who were deleted inthe sample selection were also scheduled for examina-tion if time permitted, as were youths deleted fromthe Cycle III sample who had been examined in CycleII.
In both Cycle II and Cycle 111 the sample was se-lected to contain the correct proportion of childrenfrom families having only one eligible child, two eli-gible children, and so on to be representative of thetotal target population. However since households wereone of the elements in the sample frame, the numberof related children or youths in the resultant sampleis greater than would come from a design which sam-pled children 6-11 or 12-17 years without regard tohousehold. The resultant estimated mean measure-ments or rates should be unbiased, but their samplingvariability will be somewhat greater than those froma more costly, time-consuming systematic sampledesign in which every kth child would be selected.
The total probability sample for Cycle 11 con-tained 7,417 children representative of the approxi-mately 24 million children 6-11 years of age in theUnited States target population at the time of the sur-vey; Cycle III included 7,514. youths similarly rep-resentative of the approximately 22.7 million nonin-stitutionalized youths of 12-17 years in the UnitedStates. Each of these two samples contained approx-imately 1,000 children (or youths) in each single yearof age and from 25 different States.
The response rates in Cycles H and III were 96and 90 percent, respectively, with 7,119 children and6,768 youths examined out of the total sample. Bothgroups of examinees were closely representative oftheir respective samples as well as of the populationfrom which the samples were drawn with respect toage, sex, race, geographic region, population density,and population growth in the area of residence. Henceit appears unlikely that nonresponse could bias thefindings appreciably.
Measures used to control the quality of the datafrom these surveys have been cited previously; 4.'17those additional measures specifically related to theparticular examinations, tests, or measurements areoutlined in the analytic reports describing and present-ing the respective initial findings,
Reliability
While measurement processes in the surveys werecarefully standardized and closely controlled, thecorrespondence between the real world and survey re-
sults cannot be expected to be exact. Survey data areimperfect for three major reasons: Results are sub-ject to sampling error, the actual conduct of a surveynever agrees perfectly with the design, and the meas-urement processes themselves are inexact even thoughstandardized and controlled.
The first reports on Cycles 114 and 1115 describein detail the faithfulness with which the sampling de-sign was carried out,
Data recorded for each sample child and youth areinflated in the estimation process to characterize thelarger universe of which the sample child or youth isrepresentative. The weights used in this inflation pro-cess are a product of the reciprocal of the probabilityof selecting the child or youth, an adjustment for non-response cases, and a poststratified ratio adjustmentwhich increases precision by bringing survey resultsinto closer alignment with known United States popu-lation figures by color and sex within single years ofage 6-11 for the children's survey and age 12-17 forthe youths' survey.
In Cycles II and III of the Health Examination Sur-vey the samples were the result of three principalstages of selectionthe single PSU from each stratum,the 20 segments from each sample PSU, and the samplechildren and youths from the eligible persons. Theprobability of selecting an individual child or youth isthe product of the probability of selection at each stage.
Since the strata are roughly equal in populationsize and a nearly equal number of sample children oryouths were examined in each of the sample PSU's,the sample design is essentially self-weighting withrespect to the target population; that is, each child 6-11years old and youth 12-17 years had about the sameprobability of being drawn into the respective sam-ples.
The adjustment upward for nonresponse is in-tended to minimize the impact of nonresponse on finalestimates by imputing to nonrespondents the charac-teristics of "similar" respondents. Here "similar"respondents were judged to be examined children oryouths in a sample PSU having the same age in yearsand sex as children or youths not examined in thatsample PSU.
The poststratified ratio adjustment used in thesecond and third cycles achieved most of the gains inprecision which would have been attained if the sam-ple had been drawn from a population stratified by
%age, color, and sex and made the final sample esti-mates of population agree exactly with independentcontrols prepared by the Bureau of the Census for theU.S. noninstitutionalized population as of August 1,
1964 (approximate midsurvey point for Cycle II) bycolor and sex for each single year. of age 6-11 andsimilarly as of March 9, 1968 (approximate midsur-vey point for Cycle III) for each single year of age 12-17. The weights of every responding sample child andfor each sample youth in each of the 24 age, color,
55
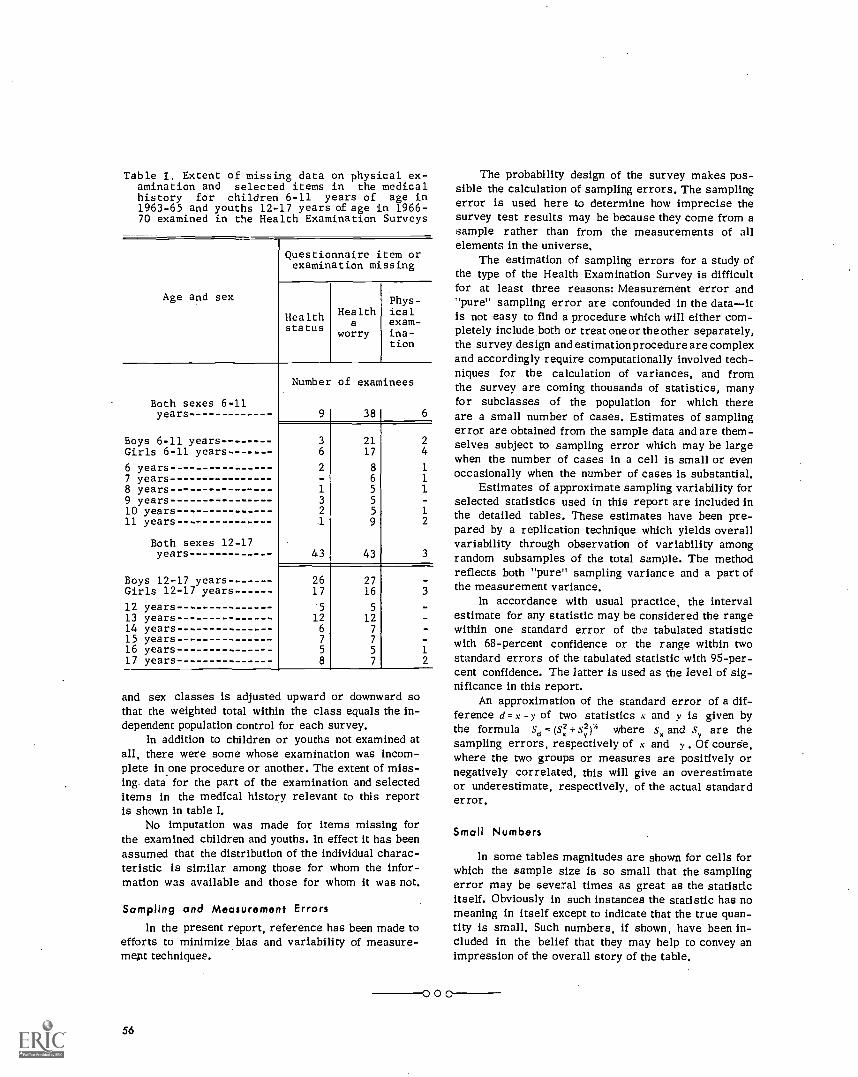
Table I. Extent of missing data on physical ex-amination and selected items in the medicalhistory for children 6-11 years of age in1963-65 and youths 12-17 years of age in 1966-70 examined in the Health Examination Surveys
Age and sex
Questionnaire item orexamination missing
Healthstatus
Healtha
worry
Phys-icalexam-ina-tion
Both sexes 6-11years
Boys 6-11 yearsGirls 6-11 years
Number
9
of examinees
38 6
3
6
2117
24
6 years 2 8 17 years - 6 18 years 1 5 19 years 3 5
10 years 2 5 111 years 1 9 2
Both sexes 12-17years 43 43 3
Boys 12-17 years 26 27Girls 12-17 years 17 16 3
12 years 5 5
13 years 12 1214 years 6 7
15 years 7 7
16 years 5 5 117 years 8 7 2
and sex classes is adjusted upward or downward sothat the weighted total within the class equals the in-dependent population control for each survey.
In addition to children or youths not examined atall, there were some whose examination was incom-plete in one procedure or another. The extent of miss-ing data for the part of the examination and selecteditems in the medical history relevant to this reportis shown in table I.
No imputation was made for items missing forthe examined children and youths. In effect it has beenassumed that the distribution of the individual charac-teristic is similar among those for whom the infor-mation was available and those for whom it was not.
Sampling and Measurement Errorsln the present report, reference has been made to
efforts to minimize bias and variability of measure-ment techniques.
56
000
The probability design of the survey makes pos-sible the calculation of sampling errors. The samplingerror is used here to determine how imprecise thesurvey test results may be because they come from asample rather than from the measurements of allelements in the universe,
The estimation of sampling errors for a study ofthe type of the Health Examination Survey is difficultfor at least three reasons: Measurement error and"pure" sampling error are confounded in the dataitis not easy to find a procedure which will either com-pletely include both or treat one or the other separately,the survey design and estimation procedure are complexand accordingly require computationally involved tech-niques for the calculation of variances, and fromthe survey are coming thousands of statistics, manyfor subclasses of the population for which thereare a small number of cases. Estimates of samplingerror are obtained from the sample data and are them-selves subject to sampling error which may be largewhen the number of cases in a cell is small or evenoccasionally when the number of cases is substantial.
Estimates of approximate sampling variability forselected statistics used in this report are included inthe detailed tables. These estimates have been pre-pared by a replication technique which yields overallvariability through observation of variability amongrandom subsamples of the total sample. The methodreflects both "pure" sampling variance and a part ofthe measurement variance.
ln accordance with usual practice, the intervalestimate for any statistic may be considered the rangewithin one standard error of the tabulated statisticwith 68-percent confidence or the range within twostandard errors of the tabulated statistic with 95-per-cent confidence. The latter Is used as the level of sig-nificance in this report.
An approximation of the standard error of a dif-ference d = x -y of two statistics x and y is given bythe formula sd = + sy2)' where s, and sy are thesampling errors, respectively of t and y . Of course,where the two groups or measures are positively ornegatively correlated, this will give an overestimateor underestimate, respectively, of the actual standarderror.
Small Numbers
ln some tables magnitudes are shown for cells forwhich the sample size is so small that the samplingerror may be several times as great as the statisticitself. Obviously in such instances the statistic has nomeaning in itself except to indicate that the true quan-tity is small. Such numbers, if shown, have been in-cluded in the belief that they may help to convey animpression of the overall story of the table.

APPENDIX II
RECORDING AND HISTORY FORMS
Child's Medical HistoryParent
CONFIDENTIAL The National Health Survey is authorized by Public Law 652 of FORM APPROVED
the 84th Congress (70 Stat. 489; 42 U.S.C. 305). All information which would BUDGET BUREAU NO. 011R02054.0
permit identification of the individual will be held strictly confidential, will be used only by persons engaged in andfor the purposes of the survey and will not be disclosed or released to others for any other purposes (22 FR 1687).
DEPARTMENT OFHEALTH, EDUCATION, AND WELFARE
PUBLIC HEALTH SERVICENATIONAL HEALTH SURVEY
CHILD'S MEDICAL HISTORY - Parent
HES- 2 5 6
NAME OF CHILD (Last, First, Middle)10.111
NOTE: Please complete this form by checking the correct boxes and/or filling in the blanks where applicable.When you have completed it, keep it until the representative of the Health Examination Survey calls on you
within a few days. If there are some questions you do not understand, please complete the others and the person whocomes for the form will help you with the ones that were unclear.
SEGMENT SERIAL COL. NO.
1. SEXEl Male(12-14) I:=1 Female
2. AGE 3. DATE OF BIRTH (Month, Day, Year)
20. NOW TURNING TO THE PRESENT TIME. HOW WOULD YOU DESCRIBE THE CHILD'S HEALTH NOW?El Very good 2 Q Good 3 O Fair E) Poor
IF FAIR or POOR, what is the trouble?
21. IS THERE ANYTHING ABOUT HIS(HER) HEALTH THAT BOTHERS YOU OR WORRIES YOU NOW?
Q Yes 2 O NoIF YES, what is the trouble)
22. DOES THE CHILD AT PRESENT EVER SUCK HIS(HER) THUMB OR FINGERS, EITHER DURING THE DAY OR AT
(401 NIGHT? t CD Yes 2 0 No , = Don't knowIF YES, about how often?I CD Almost every day or night 2 El Just once in a while 3 0 Don't know
23. DOES THE CHILD TAKE ANY MEDICINE REGULARLY, NOT COUNTING VITAMINS?
(42) I 1= Yes 2 j No 3 Q Don't knowIF YES:A. What is the medicine for?
B.. What is the name of the medicine?
C. Did a doctor say for him (her) to take it?(43) El Yes 2 O No 3 Q Don't know
57
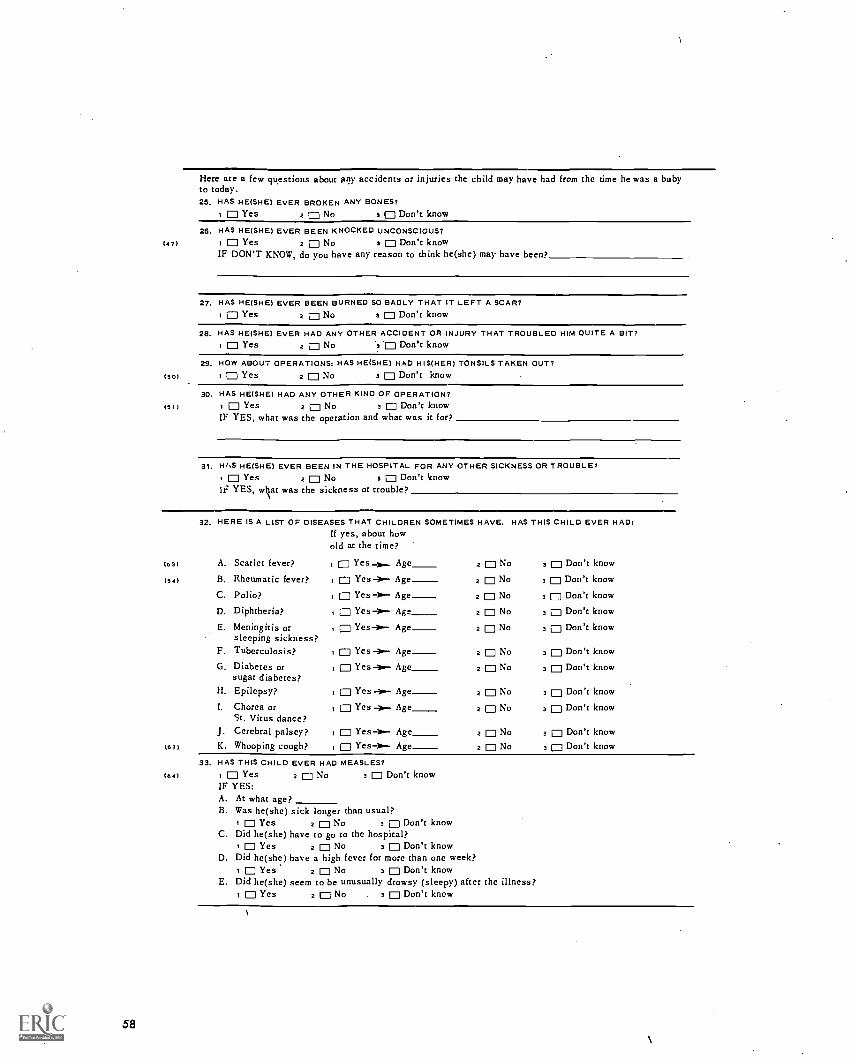
1
Here are a few questions about any accidents or injuries the child may have had from the time he was a babyto today.25. HAS HE(SHE) EVER BROKEN ANY BONES?
= Yes 2 p No 3 p Don't know
26. HAS HE(SHE) EVER BEEN KNOCKED UNCONSCIOUS?(47) t P Yes 2 p No 3 p Don't know
IF DON'T KNOW, do you have any reason to think he(she) may have been?
27. HAS HEISHE) EVER BEEN BURNED SO BADLY THAT IT LEFT A SCAR?P Yes 2 p No 3 p Don't know
28. HAS HE(SHE) EVER HAD ANY OTHER ACCIDENT OR INJURY THAT TROUBLED HIM QUITE A BIT?CD Yes 2 101 No p Don't know
29. HOW ABOUT OPERATIONS: HAS HE(SHE) HAD HIS(HER) TONSILS TAKEN OUT?
15O1 10) Yes 2 p No 3 p Don't know
30. HAS HE(SHE) HAD ANY OTHER KIND OF OPERATION?1511 = Yes 2 0 No 3 10I Don't know
IF YES, what was the operation and what was it for?
31. HAS HE(SHE) EVER BEEN IN THE HOSPITAL FOR ANY OTHER SICKNESS OR TROUBLE?p Yes 2 0 No 3 p Don't know
IF YES, vtt was the sickness or trouble?
(63)
(54)
(63)
58
32. HERE IS A LIST OF DISEASES THAT CHILDREN SOMETIMES HAVE. HAS THIS CHILD EVER HAD:If yes, about howold at the time?
A.
B.
C.
D.
E.
F.
G.
H.
I.
K.
Scarlet fever?
Rheumatic fever?
Polio?
Diphtheria?
Meningitis orsleeping sickness?Tuberculosis?
Diabetes orsugar diabetes?Epilepsy?
Chorea orSt. Vitus dance?Cerebral palsey?Whooping cough?
ED Yes Age__0 Yes- Age0 Yes- Age
YesN.-- Age
ED Yes- Age_
0 Yes Age_0 YesIN Age
0 Yes Age_0 Yes Age
El Yes)- Age0 YesN. Age
2 p No 3 p Don't know2 p No 3 0 Don't know
2 p No 3 n Don't know2 El No 3 p Don't know
2 p No 3 0 Don't know
2 p No 3 0 Don't know2 p No 3 0 Don't know
2 C=I No 3 0 Don't know2 El No 3 0 Don't know
2 p No 3 0 Don't know2 I:3 No 3 p Don't know
33. HAS THIS CHILD EVER HAD MEASLES?0 Yes 2 p No 3 E] Don't know
IF YES:A. At what age>B. Was he(she) sick longer than usual?
0 Yes 2 0 No 3 p Don't knowC. Did he(she) have to go to the hospital?
0 Yes 2 p No 3 =Don't knowD. Did he(she) have a high fever for more than one week?
0 Yes 2 0 No 3 p Don't knowE. Did he(she) seem to be unusually drowsy (sleepy) after the illness?
0 Yes 2 0 No 3 p Don't know
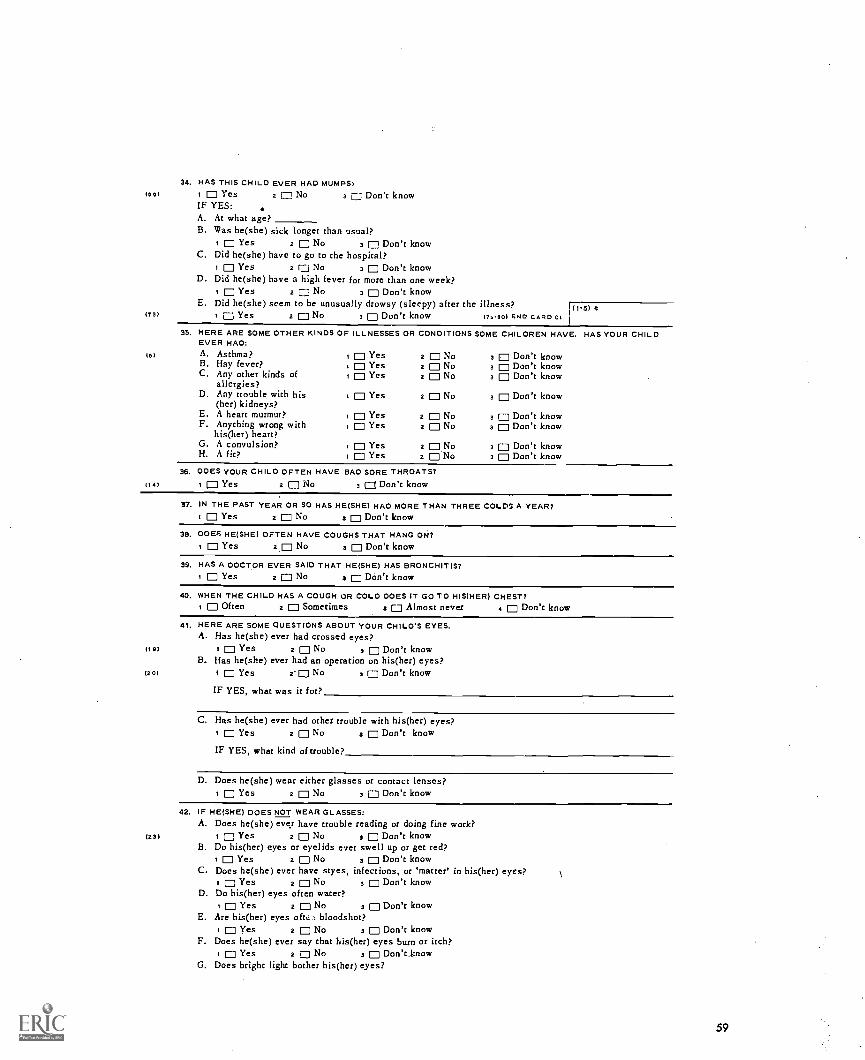
34. HAS THIS CHILD EVER HAD MUMPS.,IerlI 1 0 Yes 2 = No 3 [7:; Don't know
IF YES:A. At what age?B. Was he(she) sick longer than usual?
I 0 Yes 2 ED No 3 = Don't knowC. Did he(she) have to go to the hospital?
10 Yes 2 El No 3 = Don't knowD. Did he(she) have a high fever for more than one week?
10 Yes 2 = No 3 El Don't knowE. Did he(she) seem to be unusually drowsy (sleepy) after the illness? 1(1-5) A
173) 1 D Yes 2 ED No 3 = Don't know trBot END CARD 011
35. HERE ARE SOME OTHER KINDS OF ILLNESSES OR CONDITIONS SOME CHILDREN HAVE. HAS YOUR CHILDEVER HAD:
(0) A. Asthma? 1 0 Yes 2 El No 3 = Don't knowB. Hay fever? 1 ED Yes 2 1:3 No 3 p Don't knowC. Any other kinds of 101 Yes 2 El No 3 p Don't know
allergies?D. Any trouble with his t 0 Yes 2 El No 3 El Don't know
(her) kidneys?E. A heart murmur? 1 0 Yes 2 El No 3 = Don't knowF. Anything wrong with t 0 Yes 2 El No 3 = Don't know
his(her) heart?G. A convulsion? 1 0 Yes 2 El No 3 = Don't knowH. A fit? 1 0 Yes 2 0 No 3 El Don't know
36. DOES YOUR CHILD OFTEN HAVE BAD SORE THROATS?
1141 1 0 Yes 2 0 No 3 El Don't know
37. IN THE PAST YEAR OR SO HAS HE(SHE) HAD MORE THAN THREE COLDS A YEAR?Yes 2 El No 3 El Don't know
38. DOES HE(SHE) OFTEN HAVE COUGHS THAT HANG ON?El Yes 2 El No 3 El Don't know
39. HAS A DOCTOR EVER SAID THAT HE(SHE) HAS BRONCHITIS?[3 Yes 2 El No 3 0 Don't know
40. WHEN THE CHILD HAS A COUGH OR COLO DOES IT GO TO HIS(HER) CHEST?Often 2 0 Sometimes 3 0 Almost never 4 El Don't know
41. HERE ARE SOME QUESTIONS ABOUT YOUR CHILD'S EYES.A. Has he(she) ever had crossed eyes?
(10) 1 El Yes 2 El No 3 El Don't knowB. Has he(she) ever had an operation on his(her) eyes?
(20) i El Yes 2'0 No 3 = Don't know
IF YES, what was it for?
(23)
C. Has he(she) ever had other trouble with his(her) eyes?El Yes 2 El No 3 El Don't knoW
IF YES, what kind of trouble?
D. Does he(she) wear either glasses or contact lenses?El Yes 2 El No 3 0 Don't know
42. IF HE(SHE) DOES NOT WEAR GLASSES:A. Does he(she) ever have trouble reading or doing fine work?
El Yes 2 El No 101 Don't knowB. Do his(her) eyes or eyelids ever swell up or get red?
0 Yes 2 El No 3 El Don't knowC. Does he(she) ever have styes, infections, or 'matter' in his(her) eyes?
El Yes 2 No No 3 El Don't knowD. Do his(her) eyes often water?
2 E) No0 YesE. Are his(her) eyes ofttt t bloodshot?
Don't know
El Yes 2 0 No 0 Don't knowF. Does he(she) ever say that his(her) eyes burn or itch?
t 0 Yes 2 El No 3 El Don't knowG. Does bright light bother his(her) eyes?
59

(20)
1391
i p Yes 2 = No 3 = Don't knowH. Does he(she) ever see double or see things blurred?
Yes 2 = No s = Don't knowI. Have you seen him(her) often rub his(her) eyes or blink when he(she) is reading?
= Yes 2 = No 3 = Don't knowJ. Does he(she) sometimes close or cover one eye or hold his head on one side when hi(she) reads or
watches T.V.?l=3 Yes 2 = No 3 0 Don't know
43. 00E5 YOUR CHILD HAVE ANY TROUBLE HEARING,0 Yes 2 = Nn 3 = Don't know
44. 00E5 HE(SHE) EVER HAVE EARACHES,Yes 2 0 No 3 = Don't know
45. HAS YOUR CHILO EVER HAO ANY INJURY OR OAMAGE TO HISIHER) EARS?
tas) ES] Yes 2 p No 3 = Don't knowIF YES, in what way was his(her) ear injured,
46. HAS HEISHE) EVER HAD HISIHER) EAR ORUMS OPENED OR LANCED,Yes 2 C] NO 3 = Don't know
IF YES, how many times?I 0 Once only 2 = Twice only 3 El Three times or more
47. HAS HE(SHE) EVER HAD ANY OTHER KIND OF OPERATION ON THE EARS?(301 I n Yes 2 = No 3 p Don't know
IF YES, what was it for,
40. HAS THIS CHILD EVER HAO A RUNNING EAR OR ANY DISCHARGE FROM HIS EARS (Not counting wax in the(30 ears)? = Yes 2 = No 3 0 Don't know
IF YES:A. How ofren has he(she) had this?
= Once only 2 0 Twice only 3 p Three or more timesB. Was this his(her) left ear, right ear, or both ears?
Left 2 = Right 3 = Both At p Don't know
143)
Don't 'mow
49. HAS HEISHE) EVER HAD ANY OTHER KINO OF TROUBLE WITH HIS(HER) EARS,0 Yes 2 = No 3 = Don't know
IF YES, what kind of trouble?
so. IS THERE ANY PROBLEM WITH THE WAY HE(SHE) TALKS?0 Yes 2 = No a C] Don't know
IF YES, what is the problem?= Stammering or stuttering? 2 p Lisping? 3 = Hard ro understand?
4 E] Something else? What is that,
51. 00E5 THIS CHILO HAVE A LIMP OR ANY TROUBLE WHEN HEISHE) WALKS,0 Yes 2 = No 3 C] Don't know
IF YES, how much trouble and what kind is it?
52. 00E5 HEISHE) HAVE ANY PARALYSIS OR ANY WEAKNESS OR TROUBLE IN USING EITHER ARM OR LEG?1941 C] Yes 2 = No 3 El. Don't know
IF YES, what kind of trouble?
(49/
60
53. HAS THE CHILD'S I-CIALTH EVER KEPT HIM(HER1 FROM HARO EXERCISE OR PLAY?[7] Yes 2 El No 3 El Don't know
IF YES:A. Did a doctor say he should be kepr from doing this?
E1 Yes 2 ri No 3 fl Don't knowB. What was the condition that restricted the child,
C. Is he(she) restricted this way at presenr?= Yes 2 E] No 3 = Don't know

Medical History of YouthParent's Questionnaire
CONFIDENTIAL. All information which would permit identification of the individual will be held strictlyconfidential, will be used only by persons engaged in and for the purposes of the survey and will notbe disclosed or released to others for any other purposes (22 FR 1687).
DEPARTMENT OFHEALTH, EDUCATION, AND WELFARE
PUBLIC HEALTH SERVICE.NATIONAL HEALTH SURVEY
MEDICAL HISTORY OF YOUTHParent's Questionnaire
Sample number
NAME OF CHILD (Last, First, Middle) SEGMENT SERIAL COL. No.
NOTE: Please answer the questions by checking the correct boxes or by filling in the blanks,as required. If a question is unclear leave the answer blank and draw a line around the ques-tion. A representative of the Public Health Service will collect your filled in questionnairein a few days and she will help you answer the unclear questions. Thank you for yourcooperation.
1. SEX
1D Male 2 [:3 Female
2. AGE 3. DATE OF BIRTH (Month, bay, Year)
9. Has there been any serious health problem since he or she was one year old?
yYes 2 No 3 Don't know
IF YES: What and when''
10. Is there anything about his or her health that worries you now?
Y
yus 2 No
IF YES: What is it?
11. How would you clescri he his or her present health?
i El Poor 2 y Fair 3 [1] Good 4 Very Good 5 Excellent
IF POOR OR FAIR: What is the matter9
12. Does he or she now use any medicine regularly (not counting vitamins)?
yYes 2 No 3 Don't know
IF YES:
a. What is the name of the medicifie9 2 Don't know
h. What is it for' 2 Don't know
c. Did a doctor say he or she should use it?
Yes 2 No 3 Don't know
d. How long has he or she been using it9
13. Has he or she ever broken any bones?
Yes 2 No 3 Don't know
61

14. Has he or she ever had any other flerious injuries or accident?
1 71 Yes x No (IF NQ, SKIP TO QUESTION 15)
IF YES:
a. How many? One Two Three Four or more
b. As a result of any accident did he or she have to stay in a hospital (overnight or longer)?Yes 2 No
c. What lasting handicaps or damages, if any, did the accident(s) produce?
15. Has he or she ever been unconscious?
ci Yes 2 01tIo 3 Don't know
IF YES: For how long?
One hour or less 3 A day or more
2 More than an hour 4 Don't knowbut less than a day
18. Which of the following operations or surgery has he or she had? (Check all that apply.)
Tonsils and/or adenoids taken out
2 Appsndix taken out
3 Hernia (Rupture)
4 Other; what?
9 0None
17. Has he or she ever been in a hospital (overnight or longer)?
y Yes 2 0No(IF NO, SKIP TO QUESTION 18)
IF YES:
a. What was the longest time he or she ever spent in a hospital?
0 A night to a week
2 Over one week but less than six months
3 Six months or longer
b. How old was he or she at that time years
c. Why was he or she there?
d. Did an adult family member spend the night with him (her) in the hospital most cf the time?
t Yes 2 No
62

18. Has he or she ever had (CHECK YES OR NO IN EVERY LINE).
a. Measles 1 yes 2 No
b. Mumps 1 Yes 2 No
c. Chickenpox 11=1 Yes 2 No
d. Whooping cough 1 Yes 2 No
e. Scarlet fever 1 Yes 2 No
f. Asthma 1 1=1 Yes 2 No
g. Hay fever 1 Yes 2 No
h. Other allergies i Yes 2 No
i. Kidney trouble 1 les 2 No
j. Heart murmur or anything else wrongwith the heart i Yes 2 No
k. Fit, convulsion, or seizure 1 Yes 2 No
1. Pneumonia 1 Yes 2 No
19. Below is a list of other diseases. Please read through it carefully and check the YESbox if he or she ever had any of the following:
(a) Diabetes or sugar diabetes(b) Rheumatic fever(c) Polio (Infantile Paralysis)(d) Epilepsy(e) Chorea or St. Vitus dance
(f) Diphtheria(g) Tuberculosis (T.B.)(h) Cerebral palsy(1) Meningitis or sleeping sickness
1 Yes 2 None of these
IF YES: Which9
20. What is the most serious illness or disease he or she has ever had?
a. How old was he or she when it started9 years
b. What did the doctor say about it?
The doctor said it was:
i a mild case 4 I don't remember what he said
2 a moderate case 5 No doctor saw the child
3 a severe (critical) case
c. Did the illness (disease) leave any lasting effects?
I Yes 2 No 3 Hard to say
IF YES: What were or are they9
63
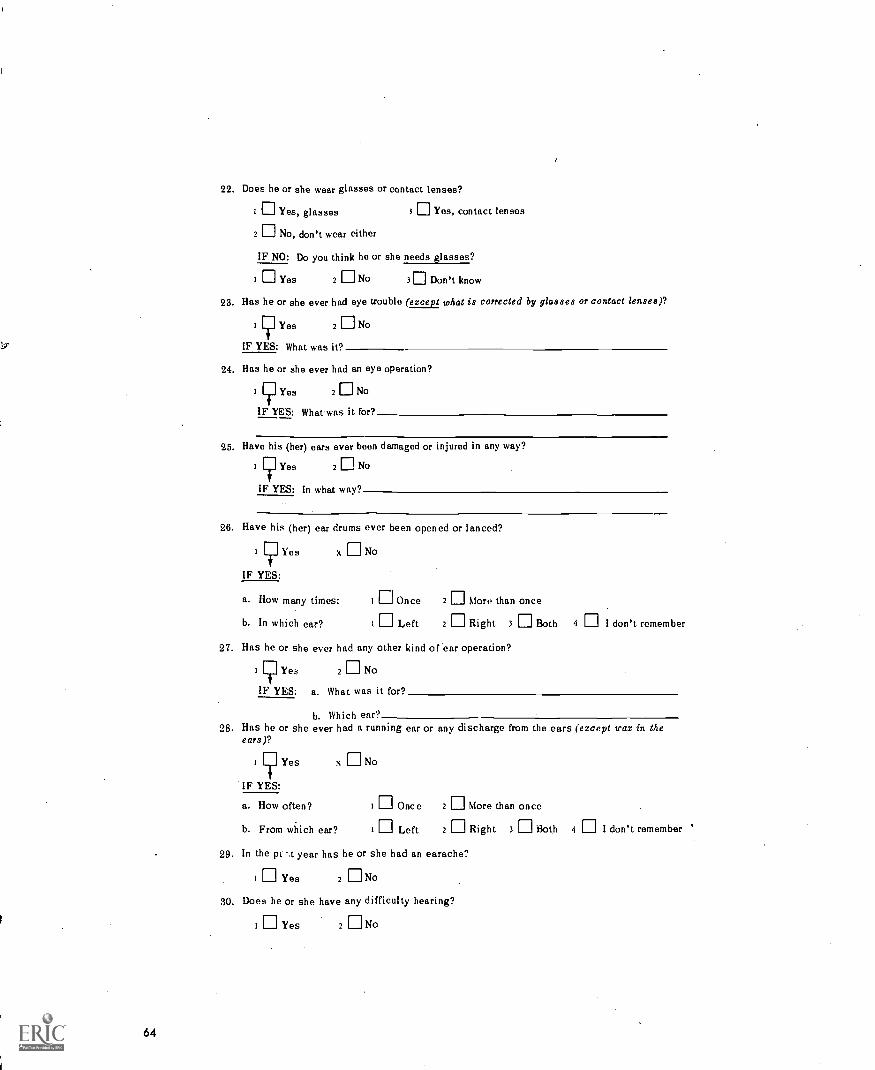
22. Does he or she wear glasses or contact lenses?
Yes, glasses 3 Yes, contact lensos
2 No, don't wear either
IF NO: Do you think he or she needs glasses?
1 Yes 2 No 3 Don't know
23. Has he or she ever had eye trouble (except what is corrected by glasses or contact lenses)?
EYes
E]
No
IF YES: What was it?
24. Has he or she ever had an eye operation?
yyes 2 No
IF YES: What was it for')
25. Have his (her) ears ever been damaged or injured in any way?
yYes 2 No
IF YES: In what way9
26. Have his (her) ear drums ever been opened or lanced?
1 y Yes
IF YES:
x No
a. How many times:
b. In which ear?
Once 2 More than once
1 Left 2 Right 3 Both 4 I don't remember
27. Has he or she ever had any other kind of ear operation?
yYes 2 No
IF YES: a. What was it for')
b. Which ear?28. Has he or she ever had a running ear or any discharge from the ears (except wax in the
ears)?
yYes x No
IF YES:
a. How often? Once 2 More than once
b. From which ear? Left 2 Right 3 Both 4 I don't remember "
29. In the pz year has he or she had an earache?
I Yes 2 No
30. Does he or she have any difficulty hearing?
z Yes 2 No
64

31. Has he or she had any other ear trouble?
yYes 2 No
IF YES: What?
32. Does he or she have any speech defect (like stuttering, stammering, lisping, etc.)?
Yes 2 [1] No
33. Does he or she have a liMp or other trouble walking?
Yes No
34. Is there anything that prevents complete use of his (her) legs?
yYes 2 ED No
IF YES: What is it
35. Is there anything that prevents complete use of his (her) arms?
Yes 2 ENo
IF YES: What is it
36. Is he or she now prevented for reasons of health from taking part in hard exercise or play?
yYes x No (IF NO, GO ON TO QUESTION 37)
IF YES:
a. What are the reasons?
b. Did the doctor advise this?
Yes 2 No
37. Was he or she ever prevented for reasons of health from taking part in hard exercise or play?
Yes 2 No 3 Don't know
65

Diagnostic Impressions (Examination of Child)
CARDCOL.
HEALTH EXAMINATION SURVEYII
DIAGNOSTIC IMPRESSIONS CARD 09-3
(52) Apparently normal child with none of the findings below.
1 2
(53) ACCIDENT OR INJURIES Yes NoPhysical Findings Cause Result
1 2
(54) HEART DISEASE Yes No
Diagnostic Impression
1 2
(55) Congenital Acquired
FINDINGS: History
ECG
ihrill
X-ray
Murmur
Other
(56) NEUROLOGICAL, MUSCULAR AND JOINT CONDITIONS1 2
Yes No
Diagnostic Impression
1 2
(57) Congenital Acquired
FINDINGS (Describe)
1 2
(58) OTHER CONGENITAL ABNORMALITIES Yes No
Diagnostic Impression
FINDINGS (Describe)
1 2
(59) OTHER MAJOR DISEASES Yes No
Diagnostic Impression
FINDINGS (Describe)
SUMMARY FOR MEDICAL REPORT TO PARENT OR PRIVATE PHYSICIAN:
A. None found
B. ACUTE CONDITION (Reported to parent)
C. CONDITION (To be reported to private physician)
(79-80) END CARD 09 SIGNATURE
66
DIAG.IMPRESS.

HEALTH EXAMINATION SURVEYII
ENT EXAMINATION CARD 09 -I
EXTERNAL EAR
R L
1 No findings
2 Findings(6) (7)
PINNA R L
1 Congenital
2 Acquired (Describe)(8) (9)
AURICULAR REGION
R L R L R L
1 Posterior AdenopathyL
E] 0 Operative scarR
2 Anterior FistulaU0) (11)
AdDITORY CANAL
R L
1 No findings
2 Findings(12) (13)
OCCLUDED OCCLUDED BY:
R L R L
15L
E] 0 1 Partially CI rerun,. Bony exostosis
2 Completely Foreign body Anomalous canal(14) (15)
Tumor Inflammation
Polyp Other (Describe)
DRUM
R L
1 No findings
2 Findings
3 Not visible(16) (17)
DRUM MOBILE?
R L
1 Yes
2 No
3 Pneumatic otoscopy(18) (19) unsatisfactory
R L
1 Dull(20) (21)
R L
1
0 2(22) (23)
Transparent
Opaque
1 Bulging 1 Red
2 Retracted 2 Other discolorations(24) (25) (26) (27)
PERFORATED:1 With discharge
2 Without discharge(28) (29)
1 Scars(30) (31)
R L
Cholesteatomata
Tumor (Middle ear)
Other
E.N.T.
67
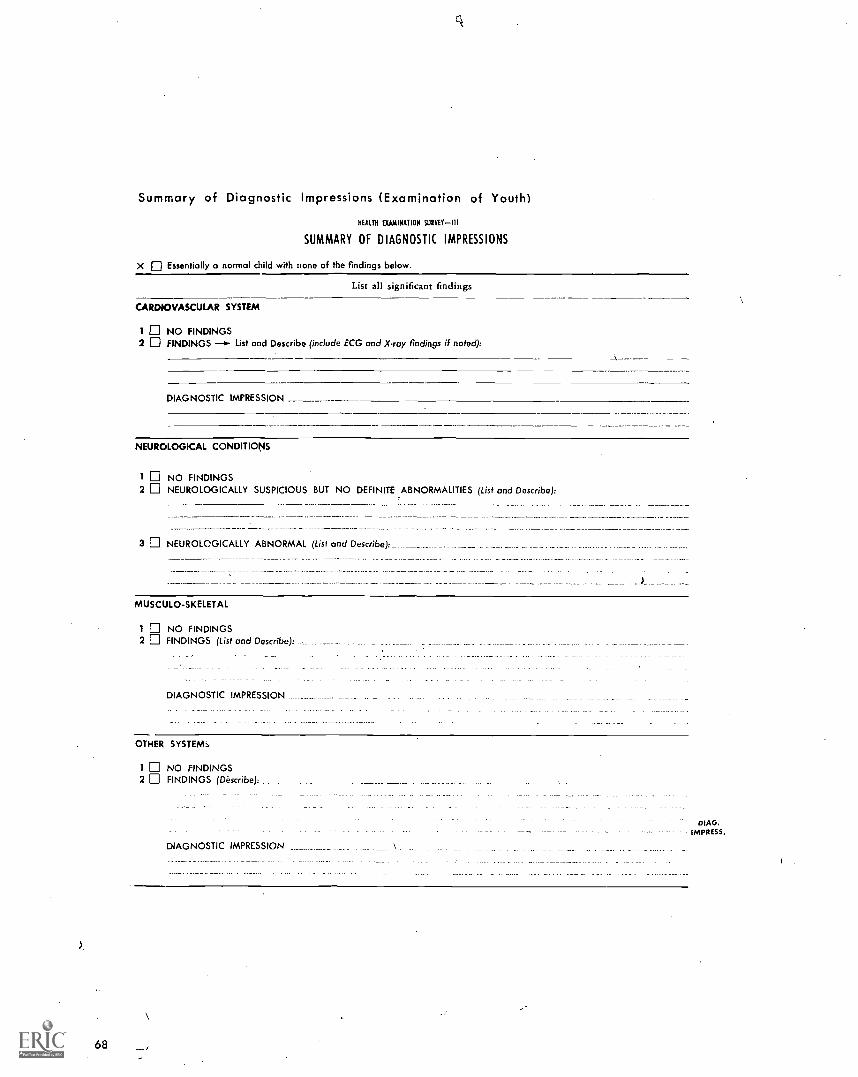
Summary of Diagnostic Impressions (Examination of Youth)
HEALTH EXAMINATION SURVEYIII
SUMMARY OF DIAGNOSTIC IMPRESSIONS
X fl Essentially a normal child with none of the findings below.
List all significant findings
CARDIOVASCULAR SYSTEM
1 El NO FINDINGS2 C) FINDINGS - List and Describe (include ECG and X-ray findings if noted):
DIAGNOSTIC IMPRESSION
NEUROLOGICAL CONDITIONS
1 E NO FINDINGS2 CI NEUROLOGICALLY SUSPICIOUS BUT NO DEFINITE ABNORMALITIES (List and Describe):
3 El NEUROLOGICALLY ABNORMAL (List and Describe):
MUSCULO-SKELETAL
1 E NO FINDINGS2 C) FINDINGS (List and Describe):
DIAGNOSTIC IMPRESSION
OTHER SYSTEMS
I Li NO FINDINGS2 El FINDINGS (Describe):
DIAGNOSTIC IMPRESSION
68
DIAG.IMPRESS.

HEALTH EXAMINATION SURVEYIll
ENT EXAMINATION
R L
EXTERNAL EAR (Except Canal) 1 0 1 NO FINDINGS
2 111 2 FINDINGS
R L
1 0 1 OPERATIVE SCAR\2 0 2 0 OTHER (Descrbe)
R L
AUDITORY 1 0 1 0 NO FINDINGS
CANAL 2 0 2 FINDINGS,
Occluded:R I.
1 0 1 0 PARTIALLY
2 0 2 0 COMPLETELY
Occluded By:
R L
1 0 1 CERUMEN
2 0 2 OTHER (Describe):
DRUM
R L
1 0 1 NO FINDINGS
2 E 2 0 INDING
R L R L
1 0 1 El (V1101.1E) 1 0 1 0 RED
2 j 2 0 TRANSPARENT 2 0 2 0 STMORATIONS
1 0 1 0 BULGINGI I 0 FLUID
2 II 2 Ej RETRACTED
III )1=1 iinI.YEI
Perforated:R L
1 0 1 WITH DISCHARGE
2 0 2 0 'CTSIMURTG E
1 0 1 0 SCARS
3 0 3 0 NOT VISIBLE
, 0 1 0 OTHER FINDINGS (Descnbei
DRUM MOBILER I.10 10YEs
2 2 NO0 .PNEUMATIC IACC
UNSATISFACTORYCOPY
TONSILS:
1 0 NOT VISIBLE
2 D TONSILLAR TAGS PRESENT
3 0 TONSILS PRESENTGRADE I(Withm Tonsillar PAloss)
4 TONSILS PRESENTGRADE II(Outside Tonsillar Moss but not Mt.eting In MmIline)
5 TONSILS PRESENTGRADE III(Meeting in MicIhne)
ORAL PHARYNX
1 Lj NO FINDINGS
2 0 FINDINGS (Describe):
NARES
R L
1 1 0 NO FINDINGS
2 0 2 0 FINDINGS,
OBSTRUCTION:
R L
1 0 1 0 ACUTE
2 0 2 0 CHRONIC
OTHER SIGNIFICANT FINDINGS:
0 NO
2 0 2 Li YES (Describe)
000
E.N.T.
69

APPENDIX III
DEMOGRAPHIC AND SOCIOECONOMIC TERMS
Age.The age recorded for each youth was theage at last birthday before the date of examination. Theage criterion for inclusion in the sample used in thissurvey was defined in terms of age at the time of in-terview. Since the examination usually took place 2-4weeks after the interview, some of those who were 17years old at the time of interview became 18 years oldby Cie time of examination. There were 23 such cases.In the adjustment and weighting procedures used toproduce national estimates, these 23 were included inthe 17-year group.
Race.RAce was recorded as "white," "Negro,"or "other." "Other" races included American Indians,Chinese, Japanese, and all races other than white orNegro. Mexican persons were included with "white" un-less definitely known to be American Indian or of arace other than white. Negroes and persons of mixedNegro and other parentage were t.ecorded as "Negro."
Geographic region. For purposes of stratificationthe United States was divided into four geographic re-gions of approximately equal population. These regions,which correspond closely to those used by the U.S.Bureau of the Census, were as fellows:
Region States InclUded
Northeast Maine, Vermont, New Hampshire,Massachusetts, Connecticut, RhodeIsland, New York, New Jersey, andPennsylvania
Midwest
South
West
Ohio, Illinois, Indiana, Michigan,Wisconsin, Minnesota, Iowa, andMissouri
Delaware, Maryland, District ofColumbia, West Virginia, Virginia,Kentucky, Tennessee, NorthCarolina, South Carolina. Georgia,Florida, Alabama, Mississippi,Louisiana, and Arkansas
Washington, Oregon, California,Nevada, New Mexico, Arizona,Texas, Oklahoma, Kansas,Nebraska, North Dakota, SouthDakota, Idaho, Utah, Colorado,Montana, Wyoming, Alaska, andHawaii
Family income.The income recorded was thetotal income received during the past 12 months by thehead of the household and all other household membersrelated to the head by blood, marriage, or adoption.This income was the gross cash income (exciLding payin kind) except in the case of a family with its own farmor business, in which case net income was recorded.
000
71
er U. S. GOVERNMENT PFUNTINC., OFFICE : 1913 543-979/34

VITAL AND HEALTH STATISTICS PUBLICATION SERIES
Origivally Public Health Service Publication .\'o. 1000
Series 1. Programs and collection procedures.Reports which describe the. general programs of the NationalCenter for Health Statistics and its offices and divisions, data collection methods used, definitions,and other material necessary for understanding the data.
Series 2. Data evaluation and methods research.Studies of new statistical methodology including: experi-mental tests of new survey methods, studies of vital statistics collection methods, new analyticaltechniques, objective evaluations of reliability of collected data,contributions to statistical theory.
Series 3. Analytical studies. Reports presenting analytical or interpretive studies basedon vital and healthstatistics, carrying the analysis further than the expository types of reports in the other series.
Series 4. Documents and committee reports.Final reports of major committees concerned with vital andhealth statistics, and documents such as recommended model vital registration laws and revisedbirth and death certificates.
Series 10. Data from the Health Interview Survev.Statistics on illness, accidental injuries, disability, useof hospital, medical, dental, and other services, and other health-related topicb, based on datacollected in a continuing national household interview survey.
Series 11. Data from the Health Examination Survey.Data from direct examination, testing, and measure-ment of national samples of the civilian, noninstitutional population provide the basis for iwo typesof reports: (1) estimates. of the medically defined prevalence of specific diseases in the UnitedStates and the distributions of the population with respect to physical, physiological, and psycho-logical characteristics; and (2) analysis of relationships among the various measurements withoutreference to an explicit finite universe of persons.
Series 12. Data from the Institutional Population Surveys.Statistics relating to the health characteristics ofpersons in institutions, and their medical, nursing, and personal care received, based on nationalsamples of establishments providing these services and samples of the residents or patients.
Series 13. Data from the Hospital Discharge Survey.Statistics relating to clisch:Irgecl patients in short-stayhospitals, based on a sample of patient records in a national sample of hospitals.
Series 14. Data on health resources: manpower and facilities.Statistics on the numbers, geographic distri-bution, and characteristics of health resources including physicians, dentists, nurses, other healthoccupations, hospitals, nursing homes, and outpatient facilities.
Series 20. Data on mortality.Various statistics on mortality other than as included in regular annual ormonthly reportsspecial analyses by cause of death, age, and other demographic variables, alsogeographic and time series analyses.
Series 21. Data on natality, marriage, and divorce.Various statistics on natality, marriage, and divorceother than as included in regular annual or monthly reportsspecial analyses by demographicvariables, also geographic and time series analyses, studies of fertility.
Series 22. Data from the National Natality and Mortality Surveys.Statistics 'on characteristics of birthsand deaths not available from the vital recor;ls, based on sample surveys stemming from theserecords, including such topics as mortality by socioeconomic class, hospital experience in thelast year of life, medical care during pregnancy, health insurance coverage, etc.
For a list of titles of reports published in these series, write to: Office of InformationNational Center for Health StatisticsPublic Health Service, H RARockville, Md. 20852