robert otis and paul haryott - calibration of uncertainty (p10/p90) in exploration prospects
TRANSCRIPT

7/21/2019 Robert Otis and Paul Haryott - Calibration of Uncertainty (P10/P90) in Exploration Prospects
http://slidepdf.com/reader/full/robert-otis-and-paul-haryott-calibration-of-uncertainty-p10p90-in-exploration 1/23
Calibration of Uncertainty (P10/P90) in Exploration Prospects*
Robert Otis1 and Paul Haryott
2
Search and Discovery Article #40609 (2010)Posted October 29, 2010
*Adapted from oral presentation at AAPG Annual Convention and Exhibition, April 11-14, 2010
1 Rose & Associates, LLC, Houston, TX ( [email protected])2Chevron Corporation, Houston, TX
Abstract
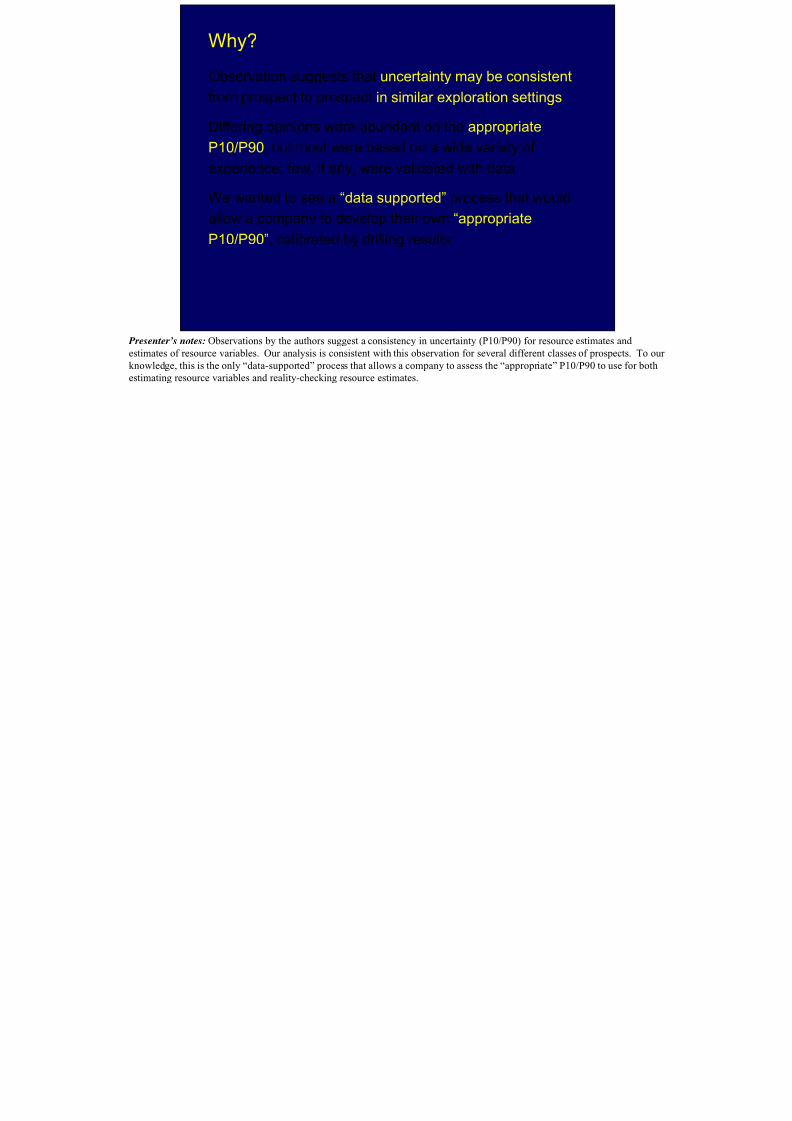
Otis and Haryott (2006) and Haryott and Otis (2009) described a methodology to determine an appropriate P10/P90
EUR (Estimated Ultimate Recovery) and EUR parameter distributions as a guideline in quantifying uncertainty. Th post-drill data to calibrate a “target” range of P10/P90 that can be used along with an estimate of the high side of th
the uncertainty of EUR or EUR parameters. The data used in the 2006 analysis were from the Chevron 1989‐94 inte
program and were largely non‐amplitude prospects defined by dense 2D seismic data. The 2009 analysis included a
included prospects that were constrained by amplitudes and step‐out opportunities that were covered by 3D seismic
extended the data set with additional wells and conducted additional analyses. Results, some non‐intuitive, are show
samplings and suggest a potential classification, based on structural definition, for a “target” range of P10/P90.
Selected References
Otis, R. and P. Haryott, 2006, How low should you go; a method to calibrate estimates of P99 prospect reserves: AA

7/21/2019 Robert Otis and Paul Haryott - Calibration of Uncertainty (P10/P90) in Exploration Prospects
http://slidepdf.com/reader/full/robert-otis-and-paul-haryott-calibration-of-uncertainty-p10p90-in-exploration 2/23
Calibration of
Uncertainty (P10/P90)
in ExplorationProspects
Robert OtisRose & Associates, LLP
Paul HaryottChevron Corporation
April 14, 2010

7/21/2019 Robert Otis and Paul Haryott - Calibration of Uncertainty (P10/P90) in Exploration Prospects
http://slidepdf.com/reader/full/robert-otis-and-paul-haryott-calibration-of-uncertainty-p10p90-in-exploration 3/23
Acknowledgement
Thanks to Chevron Corporation for use ofdata in the development of this presentation

7/21/2019 Robert Otis and Paul Haryott - Calibration of Uncertainty (P10/P90) in Exploration Prospects
http://slidepdf.com/reader/full/robert-otis-and-paul-haryott-calibration-of-uncertainty-p10p90-in-exploration 4/23
Uncertainty
The Uncertainty in a distribution is typically characterized
by the variance or standard deviation
For estimation of EUR in Exploration, distributions are
typically lognormal (especially those that dictate the
uncertainty in EUR, e.g., area or average net pay)
For lognormal distributions, Uncertainty is best expressed
as P10/P90, where P10 is exceeded only 10% of the time
The Uncertainty is dependent on available data and the
accuracy or quality of those data
Presenter’s notes: Uncertainty is present throughout our business. Estimates of exploration prospect resources and many of the
variables used to estimate those resources are lognormal (e.g., area, net pay) and the uncertainty is best expressed with the ratio of the
P10 (high) of the distribution divided by the P90 (low). This ratio uniquely determines the more traditional standard deviation or
variance, but is more easily understood when describing uncertainty in exploration resource estimation.
7/21/2019 Robert Otis and Paul Haryott - Calibration of Uncertainty (P10/P90) in Exploration Prospects
http://slidepdf.com/reader/full/robert-otis-and-paul-haryott-calibration-of-uncertainty-p10p90-in-exploration 5/23

7/21/2019 Robert Otis and Paul Haryott - Calibration of Uncertainty (P10/P90) in Exploration Prospects
http://slidepdf.com/reader/full/robert-otis-and-paul-haryott-calibration-of-uncertainty-p10p90-in-exploration 6/23
Assumptions
Estimates of EUR, Area and Average Net Pay can be
characterized by lognormal distributions
Lognormal distributions can be defined by two pieces of
independent information (e.g., two points or Pvalues, one
Pvalue and a slope)
Industry standard is P10 (reasonable upside) and P90
(reasonable downside)
Use the extreme upside and downside of P01 and P99
Estimate a Pvalue (P01) and the uncertainty (P10/P90)
Presenter’s notes: Assumptions for our approach are listed in this slide. Note that because lognormal distributions are linear on log
probability plots, they can be determined either by two points (e.g., P90 and P10) or a point and a slope (e.g., P01 and P10/P90).

7/21/2019 Robert Otis and Paul Haryott - Calibration of Uncertainty (P10/P90) in Exploration Prospects
http://slidepdf.com/reader/full/robert-otis-and-paul-haryott-calibration-of-uncertainty-p10p90-in-exploration 7/23
Observations
The P01 (extreme high side) of most distributions is
probably the best constrained Pvalue
Field size distributions can use the largest field in the
trend
Area distributions can use the closing contour on
structures and reservoir extent on stratigraphic traps
Average Net Pay distributions can use a high N/G and
the thickest reservoir with appropriate averaging
P10/P90 appears to be fairly consistent for different
prospect categories
Presenter’s notes: If only one point on the distribution can be easily constrained, the point and slope approach may provide better
estimates of distributions.

7/21/2019 Robert Otis and Paul Haryott - Calibration of Uncertainty (P10/P90) in Exploration Prospects
http://slidepdf.com/reader/full/robert-otis-and-paul-haryott-calibration-of-uncertainty-p10p90-in-exploration 8/23
Finding An “Appropriate” P10/P90
The Process
Compile your “history” – zones require two independent
values to define the predrill distribution and the post drill
mean
Estimate the P01 from each predrill distribution
Assign a common P10/P90 to all zones and see where the
post drill mean result falls on the resulting pre drill distribution
Evaluate results using the percentile histogram method from
Otis and Schneidermann (1997)
Do this for several P10/90s and see which one is “most
appropriate”
Otis & Haryott, 2006
Presenter’s notes: The process was originally documented by Otis & Haryott, 2006.

7/21/2019 Robert Otis and Paul Haryott - Calibration of Uncertainty (P10/P90) in Exploration Prospects
http://slidepdf.com/reader/full/robert-otis-and-paul-haryott-calibration-of-uncertainty-p10p90-in-exploration 9/23
Percentile Histograms
Each percentile interval has a 10% probability
If the post-drill result from each predrill distribution is
random, the result is a uniform distribution
P05
P20
P30
P40
P60P70
P80
P95
P01
P10
P50
P90
P99
1 10 100 1000
P05
P20
P30
P40
P60P70
P80
P95
P01
P10
P50
P90
P99
1 10 100 1000
P05
P20
P30
P40
P60P70
P80
P95
P01
P10
P50
P90
P99
1 10 100 1000
P05
P20
P30
P40
P60P70
P80
P95
P01
P10
P50
P90
P99
1 10 100 1000
0
1
2
3
90-100 80-90 70-80 60-70 50-60 40-50 30-40 20-30 10-20 0-10
52 MMBOE in50-60 Interval
193 MMBOE in0-10 Interval
76 MMBOE in10-20 Interval
25 MMBOE in90-100 Interval
Presenter’s notes: This slide illustrates the process for compiling percentile histograms

7/21/2019 Robert Otis and Paul Haryott - Calibration of Uncertainty (P10/P90) in Exploration Prospects
http://slidepdf.com/reader/full/robert-otis-and-paul-haryott-calibration-of-uncertainty-p10p90-in-exploration 10/23
0%
10%20%
30%
40%
50%
90-
100
80-
90
70-
80
60-
70
50-
60
40-
50
30-
40
20-
30
10-
20
0-10
0%
10%20%
30%
40%
50%
90-
100
80-
90
70-
80
60-
70
50-
60
40-
50
30-
40
20-
30
10-
20
0-10
0%
10%
20%
30%40%
50%
90-
100
80-
90
70-
80
60-
70
50-
60
40-
50
30-
40
20-
30
10-
20
0-10
0%
10%
20%
30%40%
50%
90-
100
80-
90
70-
80
60-
70
50-
60
40-
50
30-
40
20-
30
10-
20
0-10
Heavy on the DownsideToo Optimistic
Heavy on the UpsideToo Pessimistic
Heavy on both Up - and DownsidesNeed To Widen Ranges
Uniform DistributionAcceptable
Diagnostics
Presenter’s notes: Diagnostics for problems related to P01 and P10/P90 as parameters.

7/21/2019 Robert Otis and Paul Haryott - Calibration of Uncertainty (P10/P90) in Exploration Prospects
http://slidepdf.com/reader/full/robert-otis-and-paul-haryott-calibration-of-uncertainty-p10p90-in-exploration 11/23
0%
10%20%
30%
40%
50%
90-
100
80-
90
70-
80
60-
70
50-
60
40-
50
30-
40
20-
30
10-
20
0-10
0%
10%20%
30%
40%
50%
90-
100
80-
90
70-
80
60-
70
50-
60
40-
50
30-
40
20-
30
10-
20
0-10
0%
10%
20%
30%40%
50%
90-
100
80-
90
70-
80
60-
70
50-
60
40-
50
30-
40
20-
30
10-
20
0-10
0%
10%
20%
30%40%
50%
90-
100
80-
90
70-
80
60-
70
50-
60
40-
50
30-
40
20-
30
10-
20
0-10
Remedies
Heavy on the DownsideToo Optimistic
Heavy on the UpsideToo Pessimistic
Heavy on both Up - and DownsidesNeed To Widen Ranges
Uniform DistributionAcceptable
Hold P01
Increase P10/P90
Hold P99
Increase P10/P90
Hold P50Increase P10/P90
No ChangeNeeded
Presenter’s notes: Ways to correct problems related to P01, P50 and P10/P90 as parameters used to estimate lognormal
distributions.

7/21/2019 Robert Otis and Paul Haryott - Calibration of Uncertainty (P10/P90) in Exploration Prospects
http://slidepdf.com/reader/full/robert-otis-and-paul-haryott-calibration-of-uncertainty-p10p90-in-exploration 12/23
Otis and Haryott - 2006
Based on early 90s pre and post drill reviews of prospects
generally defined by moderate to dense 2D seismic
Results:
EUR P10/P90 averaged about 8 and ranged from 5 to
10
Area P10/P90 ranged from 3 to 4
Average gross pay ranged from 6 to 8
Otis & Haryott, 2006
Presenter’s notes: Summary of results from AAPG presentation by Otis & Haryott, 2006.

7/21/2019 Robert Otis and Paul Haryott - Calibration of Uncertainty (P10/P90) in Exploration Prospects
http://slidepdf.com/reader/full/robert-otis-and-paul-haryott-calibration-of-uncertainty-p10p90-in-exploration 13/23
Objectives of this Project
Continue investigation reported by Otis & Haryott (2006),
where most zones were covered by 2D seismic (early 90s)
Extend data set to include:
DHI (Direct Hydrocarbon Indicator) zones
Delineation or step-out zones
Other Exploration zones (non-amplitude zones, mostcovered by 3D seismic)
Establish “appropriate” P10/P90 for these different
categories and revisit the early 90s data
Presenter’s notes: The objective of this effort is to extend the results from 2006 to include different classes of prospects that were
not included in the original analysis.

7/21/2019 Robert Otis and Paul Haryott - Calibration of Uncertainty (P10/P90) in Exploration Prospects
http://slidepdf.com/reader/full/robert-otis-and-paul-haryott-calibration-of-uncertainty-p10p90-in-exploration 14/23
Let’s Look at Some Data
A sample from Chevron exploration wells drilled between
2002 and 2008 (82 discovery zones utilized)
DHI zones with good structural conformance (26 zones)
Delineation or step-out zones (25 zones)
Other exploration zones (31 zones)
Examined P10/P90 for EUR, Area and Average Net Pay

7/21/2019 Robert Otis and Paul Haryott - Calibration of Uncertainty (P10/P90) in Exploration Prospects
http://slidepdf.com/reader/full/robert-otis-and-paul-haryott-calibration-of-uncertainty-p10p90-in-exploration 15/23
DHIs w/ Structural Conformance
EUR and Average Net Pay
• Pre-drill estimates of EUR and Average Net Pay are
acceptable• EUR P10/P90 ranges from 3 to 5
• Average Net Pay P10/P90 ranges from 2 to 3
0%
10%
20%
30%
EUR Actual Post Drill w/3.3 Avg P10/P90
0%
10%
20%
30%
Avg Net Pay Actu al Post Dril l w/2.4 AvgP10/P90
Avg Net Pay
Actual P10/P90 = 3.3 Actual P10/P90 = 2.4
EUR
Presenter’s notes: When DHIs were examined, estimates of EUR and average net pay seemed to reflect the correct amount of
uncertainty. Appropriate ranges for Chevron were determined.

7/21/2019 Robert Otis and Paul Haryott - Calibration of Uncertainty (P10/P90) in Exploration Prospects
http://slidepdf.com/reader/full/robert-otis-and-paul-haryott-calibration-of-uncertainty-p10p90-in-exploration 16/23
DHIs w/ Structural Conformance
Area
• Both P01 and P10/P90 need to be increased
• Increasing P10/P90 from 1.4 to 2.8 while keepingthe low side about the same balances histogram
• Results seem counter intuitive because ofexpected area resolution from good structuralconformance – however, actuals indicate manyoptimistic outcomes
15% 50%0%
10%
20%
30%
Actu al Po st Dril l w/1.4 Avg P10/P90
12% 8%0%
10%
20%
30%
Post Drills w/2.8 P10/P90Area
Actual P10/P90 = 1.4 Bal. P10/P90 = 2.8
Area
Presenter’s notes: Estimation of Area uncertainty appeared to be too narrow and a larger P10/P90 was needed, despite excellent
structural conformance. This result seemed counter-intuitive; so additional analysis was needed.

7/21/2019 Robert Otis and Paul Haryott - Calibration of Uncertainty (P10/P90) in Exploration Prospects
http://slidepdf.com/reader/full/robert-otis-and-paul-haryott-calibration-of-uncertainty-p10p90-in-exploration 17/23
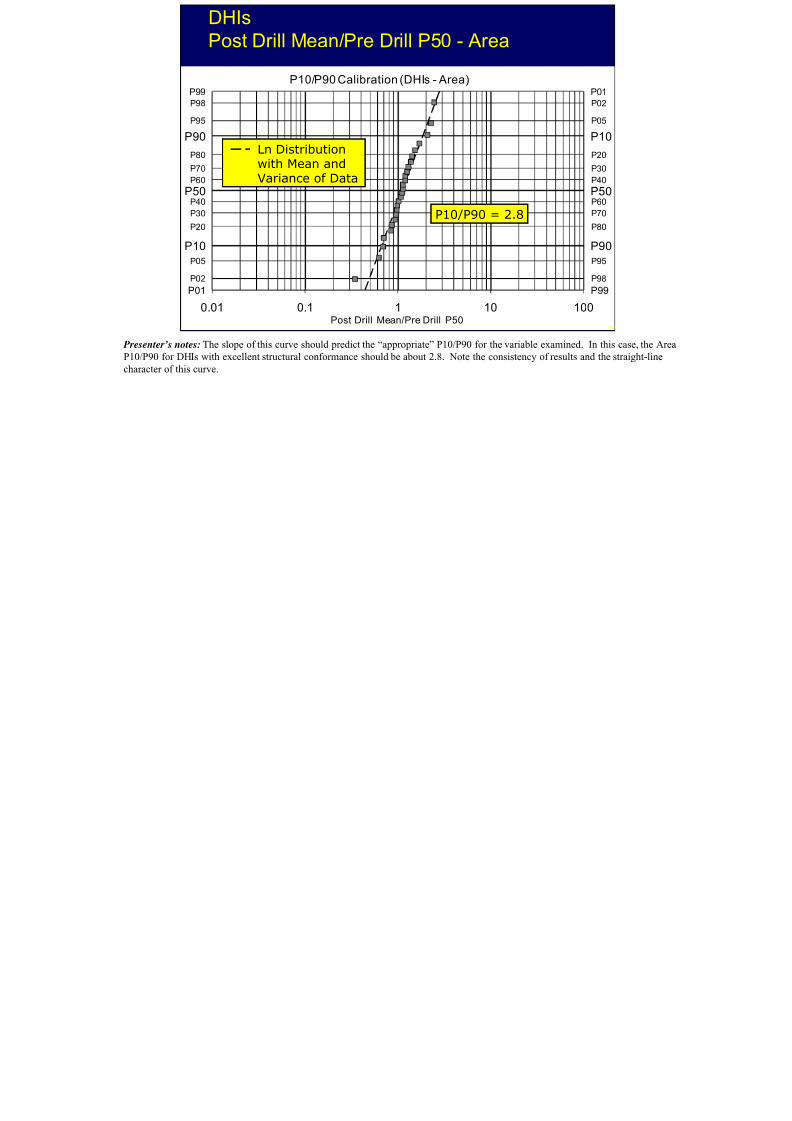
New Tool (?)
Calculate: Post Drill Mean/Pre Drill P50
Gives the percentage increase (or decrease) in the PreDrill P50 to achieve the actual Mean Outcome
Plot results as a log-probability plot to see the variability of
actual outcomes relative to the Pre Drill P50
Results should plot as a straight line with about half of
the values above P50 (1.0 on the plot) and half below
The slope of a best-fit line should give a first pass
approximation of the sample’s P10/P90
Presenter’s notes: A second tool was used to assess this result for Area. This tool is a log probability plot of the ratio of the post-
drill mean and the pre-drill P50. This approach allows the distribution of results (expressed by the mean) to be compared to the
pre-drill P50. Thus, we would expect half the results to fall above the P50 (ratio greater than 1.0) and half below (ratio less than
1.0). The slope of this curve should express the post-drill uncertainty, or P10/P90, of actual results compared to the pre-drill
forecasts.
7/21/2019 Robert Otis and Paul Haryott - Calibration of Uncertainty (P10/P90) in Exploration Prospects
http://slidepdf.com/reader/full/robert-otis-and-paul-haryott-calibration-of-uncertainty-p10p90-in-exploration 18/23
P99 P01
P98 P02
P95 P05
P90 P10
P80 P20
P70 P30
P60 P40
P50 P50P40 P60
P30 P70
P20 P80
P10 P90
P05 P95
P02 P98
P01 P99
0.01 0.1 1 10 100
Post Drill Mean/Pre Drill P50
P10/P90 Calibration (DHIs - Area)
DHIs
Post Drill Mean/Pre Drill P50 - Area
17
Ln Distributionwith Mean andVariance of Data
P10/P90 = 2.8
Presenter’s notes: The slope of this curve should predict the “appropriate” P10/P90 for the variable examined. In this case, the Area
P10/P90 for DHIs with excellent structural conformance should be about 2.8. Note the consistency of results and the straight-line
character of this curve.

7/21/2019 Robert Otis and Paul Haryott - Calibration of Uncertainty (P10/P90) in Exploration Prospects
http://slidepdf.com/reader/full/robert-otis-and-paul-haryott-calibration-of-uncertainty-p10p90-in-exploration 19/23
Observations - DHIs
DHIs with good structural conformance are well defined
and technology is available to accurately predict EUR while
reducing uncertainty – P10/P90 ~ 4 balances histogram
Although DHIs conceptually define a clear Area,
considerable uncertainty remains, especially on the upside,
(P10/P90 between 2 and 3)
Note: A P10/P90 of 2 yields a P90-P10 range about the P50
of ± 40%; P10/P90 of 3 yields ± 75%
Average Net Pay is well defined with P10/P90 between 2
and 3
7/21/2019 Robert Otis and Paul Haryott - Calibration of Uncertainty (P10/P90) in Exploration Prospects
http://slidepdf.com/reader/full/robert-otis-and-paul-haryott-calibration-of-uncertainty-p10p90-in-exploration 20/23
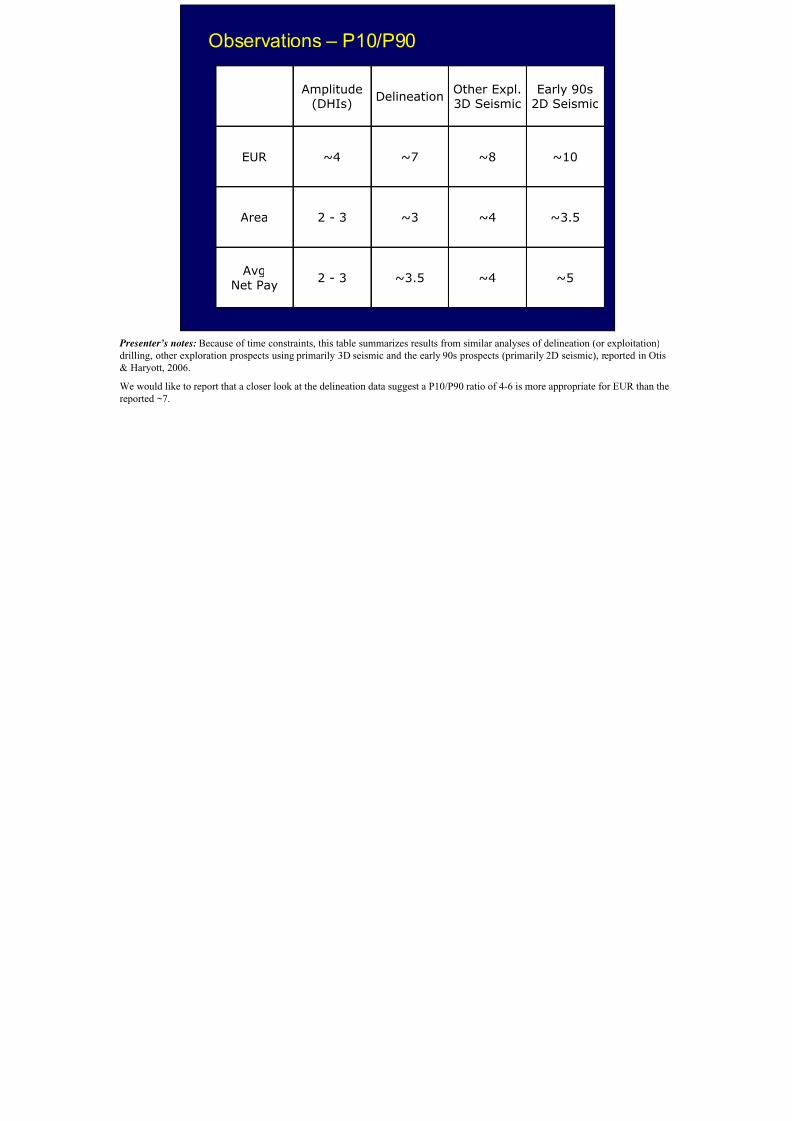
Observations – P10/P90
Amplitude
(DHIs)
DelineationOther Expl.
3D Seismic
Early 90s
2D Seismic
EUR ~4 ~7 ~8 ~10
Area 2 - 3 ~3 ~4 ~3.5
AvgNet Pay
2 - 3 ~3.5 ~4 ~5
Presenter’s notes: Because of time constraints, this table summarizes results from similar analyses of delineation (or exploitation)
drilling, other exploration prospects using primarily 3D seismic and the early 90s prospects (primarily 2D seismic), reported in Otis
& Haryott, 2006.
We would like to report that a closer look at the delineation data suggest a P10/P90 ratio of 4-6 is more appropriate for EUR than the
reported ~7.

7/21/2019 Robert Otis and Paul Haryott - Calibration of Uncertainty (P10/P90) in Exploration Prospects
http://slidepdf.com/reader/full/robert-otis-and-paul-haryott-calibration-of-uncertainty-p10p90-in-exploration 21/23
Summary – P10/P90
Very little difference is observed among Delineation, Other
Exploration zones (3D seismic) and the Early 90s zones
(2D seismic) for Area and Net Pay – there are basically two
categories of uncertainty: DHIs with good conformance to
structure and all other prospects (including marginal DHIs)
Uncertainty in DHIs is clearly reduced for both Area and
Average Net Pay with P10/P90 ranging between 2 and 3resulting in an EUR P10/P90 of ~4
In all other prospects, both Area and Average Net Pay
P10/P90 ranged between 3 and 5 resulting in an EUR
P10/P90 between 7 and 10

7/21/2019 Robert Otis and Paul Haryott - Calibration of Uncertainty (P10/P90) in Exploration Prospects
http://slidepdf.com/reader/full/robert-otis-and-paul-haryott-calibration-of-uncertainty-p10p90-in-exploration 22/23
Finding An “Appropriate” P10/P90
Because each company has a different portfolio, there are
no hard rules – each company will need to determine it
independently
To do this, each company needs a “ history” of
consistent estimates of predrill distribut ions and post-
drill actual results to use for calibration and the
disc ipl ine to make learning a part of the assessment
Otis & Haryott, 2006
Presenter’s notes: Finally, we wish to point out that the process and tools presented here should be used by companies to develop
their own guidelines for the “appropriate” P10/P90. The numbers reported here are valid only for the data used. Other companies
use different strategies, different tools and different decision-making processes, all of which render the numbers reported here as
inappropriate for most companies.

7/21/2019 Robert Otis and Paul Haryott - Calibration of Uncertainty (P10/P90) in Exploration Prospects
http://slidepdf.com/reader/full/robert-otis-and-paul-haryott-calibration-of-uncertainty-p10p90-in-exploration 23/23
22
Thank YouFor Your Attention