robert a. barton inspector general office of the inspector ... · pdf fileoffice of the...
TRANSCRIPT

Office of the Inspector General Robert A. Barton
Inspector General
Fifth Report on the California
Department of Corrections and
Rehabilitation’s Progress
Implementing its
Future of California Corrections
Blueprint
March 2015

Office of the Inspector General
Fifth Report on CDCR’s Progress Implementing
its Future of California Corrections Blueprint
Robert A. Barton
Inspector General
Roy W. Wesley
Chief Deputy Inspector General
Shaun R. Spillane
Public Information Officer
March 2015

TABLE OF CONTENTS
REHABILITATIVE PROGRAMS .................................................................................... 1
In-Prison Target Population ......................................................................................... 1
In-Prison Rehabilitation Goal—Current Status ........................................................... 2
In-Prison Program Placement—Reentry Hubs ............................................................ 4
In-Prison Program Placement—Case Management .................................................... 4
In-Prison Programs—Miscellaneous Benchmarks ...................................................... 5
Community Programs for Parolees ............................................................................ 10
STANDARDIZED STAFFING........................................................................................ 13
Background ................................................................................................................ 13
Goals and Benchmarks .............................................................................................. 13
INMATE CLASSIFICATION SCORE SYSTEM ........................................................... 14
Modification of the Inmate Classification Score System .......................................... 14
ICSS—Miscellaneous Data Benchmarks .................................................................. 15
GANG MANAGEMENT ................................................................................................. 18
Security Threat Group—Pilot Program Completed .................................................. 18
Security Threat Group—Gang Management Program .............................................. 18
Security Threat Group—Status Report of SDP Inmates (Steps 1 Through 4) .......... 22
COMPREHENSIVE HOUSING PLAN........................................................................... 25
Institution Housing Plans ........................................................................................... 25
Housing Plan—Miscellaneous Benchmarks .............................................................. 26
Housing Plan—Global Benchmarks .......................................................................... 30
CONCLUSION ................................................................................................................. 31
APPENDICES .................................................................................................................. 33
Appendix A—Programming Plans ............................................................................ 34
Appendix B—Core COMPAS Assessments ............................................................. 72
Appendix C—Housing Plans ..................................................................................... 73

Fifth Report on CDCR’s Progress Implementing the Blueprint Foreword
Office of the Inspector General State of California
FOREWORD
In July 2012, the oversight role of the Office of the Inspector General (OIG) was
expanded when the Legislature tasked the OIG with monitoring the California
Department of Corrections and Rehabilitation’s adherence to The Future of California
Corrections: A Blueprint to Save Billions of Dollars, End Federal Court Oversight, and
Improve the Prison System (the Blueprint).
To monitor implementation of the Blueprint, the Legislature passed and the Governor
signed legislation adding language to California Penal Code, Section 6126, mandating
that the OIG periodically review delivery of the reforms identified in the Blueprint,
including, but not limited to, the following specific goals and reforms described in the
Blueprint:
Whether the department has increased the percentage of inmates served in
rehabilitative programs to 70 percent of the department’s target population prior
to the inmates’ release;
The establishment of and adherence to the standardized staffing model at each
institution;
The establishment of and adherence to the new inmate classification score system;
The establishment of and adherence to the new prison gang management system,
including changes to the department’s current policies for identifying
prison-based gang members and associates and the use and conditions associated
with the department’s security housing units; and
The implementation of and adherence to the comprehensive housing plan
described in the Blueprint.
To assess and monitor the reforms published in the Blueprint, the OIG identified
measurable benchmarks in the Blueprint, researched the various aspects of the
benchmarks, collected and assessed documents and electronic databases, interviewed
numerous staff from the California Department of Corrections and Rehabilitation (CDCR
or the department) and the Department of Finance (DOF), developed a monitoring tool,
and compared the assessment results with goals identified in the Blueprint. The OIG also
performed on-site reviews at each of the adult institutions that included the review and
reconciliation of documents, interviews of staff, and observations.
This report represents the results of the OIG’s fifth review of CDCR’s implementation of
the Blueprint. It is important to note that many of the reforms contained in the Blueprint
have implementation dates well into 2015 and beyond, while the standardized staffing
goal has already been completed. As noted in the OIG’s previous reports, the published
version of the Blueprint issued in 2012 was not final. The staffing standards at some of the
prisons had yet to be assessed, so conceptual staffing standards were published.

Fifth Report on CDCR’s Progress Implementing the Blueprint Foreword
Office of the Inspector General State of California
According to CDCR management, the department was authorized to amend the detail of
the staffing numbers after completing an overall assessment, but those numbers could not
exceed the total departmental staffing numbers identified in the published version of the
Blueprint, as those are the staffing numbers ultimately approved by the Legislature during
the budget process. This fifth report is based on information from December 1, 2014,
through February 10, 2015, and subsequent reports will assess progress meeting future
benchmarks and goals of the Blueprint.

Fifth Report on CDCR’s Progress Implementing the Blueprint 1 of 76
Office of the Inspector General State of California
REHABILITATIVE PROGRAMS
The department provides in-prison programming to adult offenders, including academic
education, career technical (formerly “vocational”) education (CTE), substance abuse
treatment, cognitive behavioral treatment programs, transitional services, and
employment programs. In the Blueprint, the department indicated its goal is to increase
the percentage of inmates served in rehabilitative programs to 70 percent of the
department’s target population prior to the inmates’ release. The Blueprint does not
identify a milestone for when the goal is to be met; however, CDCR identifies June 30,
2015, as the projected completion date.1
The department also makes use of community programming to inmates released from
prison. The department indicated its goal, as stated in the Blueprint, is to build program
capacity by fiscal year 2013–14 to accommodate 70 percent of parolees who have a need
for substance abuse treatment, employment services, or education within their first year
of being released from prison.
In-Prison Target Population
The department uses concepts identified in the California Logic Model to determine its
target population for rehabilitative programs. That model requires the calculation of an
inmate’s risk to reoffend coupled with an assessment of the inmate’s criminogenic needs
to determine whether the inmate is included in the target population.
The department uses the results of the California Static Risk Assessment (CSRA) tool to
identify an inmate’s risk to reoffend. The level of an inmate’s criminogenic need is
assessed based on the results of the Correctional Offender Management Profiling for
Alternative Sanctions (COMPAS) tool. If the CSRA results show a high or moderate risk
to reoffend, and the results of COMPAS show a high or medium need in any of the
criminogenic categories, the inmate becomes part of CDCR’s target population for
rehabilitation.2,3
Data summarized in the following table indicates that as of January 27, 2015, 97 percent
of the 129,380-inmate population had received a CSRA risk assessment, and 63 percent
had received a COMPAS assessment. Of those inmates with a CSRA assessment, 67,162
(54 percent) had a high or moderate risk to reoffend. Of those, 54,025 inmates
1 CDCR’s revised Strategic Plan (draft) identifies June 30, 2015, as the date to reach the 70 percent
rehabilitation goal.
2 The criminogenic need categories can include any of the following: substance abuse, anger, employment
problems (incorporated academic and career technical needs), criminal personality (formerly “criminal
thinking”), and support from family of origin (formerly “family criminality”).
3 Being included in the target population does not necessarily trigger the placement of inmates into specific
programs. The results of COMPAS assessments are used for placement into cognitive behavioral treatment
and employment programs, but CDCR uses individual case factors for placement into other programs, such
as the Test of Adult Basic Education (TABE) results for placement into academic programs.

Fifth Report on CDCR’s Progress Implementing the Blueprint 2 of 76
Office of the Inspector General State of California
(42 percent) were identified as having a high or medium criminogenic need, thus
representing the target population on that day.
Risk and Needs Assessment by Target Population4
Total inmate population 129,380 Data as of 1/27/15
Inmates with CSRA risk assessment 125,428 97% Percent in relation to inmate population
Inmates with high/moderate CSRA score 67,162 54% Percent in relation to inmates with CSRA
Inmates with core COMPAS assessment 81,986 63% Percent in relation to inmate population
Target population (at least one need) 54,025 42% Percent in relation to inmate population
% of inmates who receive core COMPAS assessment who
become target
66% Target population divided by COMPAS
count
In-Prison Rehabilitation Goal—Current Status
While the department has made progress in implementing some measures to reach some
benchmarks identified in the Blueprint, it still needs marked improvement to attain its
goal of reaching 70 percent of the target population. As seen on the following page, the
department has demonstrated a 54 percent rate of accomplishment (for all and some
needs met) during the first two quarters of fiscal year 2014–15. That represents a
9 percent increase from the 45 percent rate identified in the OIG’s last report and a
19 percent increase from the OIG’s March 2014 report.
The following table identifies inmates who were released during fiscal year 2013–14, and
the next page shows the two most recent quarters of fiscal year 2014–15 and whether the
inmates received, prior to release, evidence-based rehabilitative programming in
substance abuse, academic, or career technical education consistent with their
criminogenic needs.5 The numbers in the category of “one need met” indicate that
offenders had criminogenic needs in multiple categories and participated in a
rehabilitative program that was consistent with at least one, but not all, identified needs.
The department considers “all needs met” for inmates who have participated in
rehabilitative services in each of their criminogenic needs. It should also be noted that
whether the inmate attended only one day of class or completed the entire program, the
department counts that attendance as participation. The OIG recommends a more
meaningful measure of participation, such as a reasonable program completion
percentage or an average number of days in a program, to count as successful
participation.
Percent of Offenders Assigned to a Rehabilitative Program Consistent with an Identified
Need Released During Fiscal Year 2013–14
4 See Appendix B for a breakdown of the percentages of inmates with core COMPAS assessments.
5 The data was provided by the Division of Rehabilitative Programs (DRP) of CDCR.
1st Qtr 2nd Qtr 3rd Qtr 4th Qtr Totals
Count Percent Count Percent Count Percent Count Percent Count Percent
All Needs Met 789 16% 351 9% 967 22% 1,103 20% 3,210
One Need Met 1,225 26% 703 18% 1,528 34% 1,611 30% 5,067
No Needs Met 2,775 58% 2,793 73% 1,935 44% 2,740 50% 10,243 55%
Total 4,789 100% 3,847 100% 4,430 100% 5,454 100% 18,520 100%
45%

Fifth Report on CDCR’s Progress Implementing the Blueprint 3 of 76
Office of the Inspector General State of California
Percent of Offenders Assigned to a Rehabilitative Program Consistent with an Identified
Need Released During First Two Quarters of Fiscal Year 2014–15
Although the Blueprint does not set forth a date for achieving the 70 percent
rehabilitation goal, the department’s draft strategic plan identifies June 30, 2015, as the
goal completion date. At the current rate of 54 percent, the department continues to show
progress during the first half of fiscal year 2014–15, but will need an appreciable
improvement during the remaining six months to achieve its goal. It is even more
unlikely that the goal will be attained if the measurement of participation becomes more
stringent, as the OIG recommends, than its current standard.
Additionally, the Blueprint calls for an increase in academic and CTE instructors over a
two-year period to increase the number of programs available for inmates. While the
academic education and CTE programs are available at the adult institutions statewide,
the other programs are primarily available at 13 institutions designated as reentry hubs,
geared toward inmates within 48 months of their release. As illustrated in the chart
below, 66 percent of the department’s target population is within 48 months of release.
The department has established each of its 13 reentry hubs to provide rehabilitative
services prior to an inmate’s release, and is currently negotiating to add reentry hub
services at the following in-state contracted facilities: Central Valley, Desert View, and
Golden State.
1st Qtr 2nd Qtr Totals
Count Percent Count Percent Count Percent
All Needs Met 1,328 24% 1,644 26% 2,972
One Need Met 1,491 26% 1,906 31% 3,397
No Needs Met 2,802 50% 2,722 43% 5,524 46%
Total 5,621 100% 6,272 100% 11,893 100%
54%
Projected Release Timeframe Inmates Percent
0 - 6 Months 10,163 18.8%
7-12 Months 7,526 13.9%
13-24 Months 9,069 16.8%
25-36 Months 5,200 9.6%
37-48 Months 3,504 6.5%
49-60 Months 2,640 4.9%
60-120 Months 7,356 13.6%
Over 120 Months 8,301 15.4%
Unusable Data Regarding Release Date 266 0.5%
Total Target Population 54,025 100.0%
Target Population by Projected Release Date

Fifth Report on CDCR’s Progress Implementing the Blueprint 4 of 76
Office of the Inspector General State of California
In-Prison Program Placement—Reentry Hubs
Reentry hubs are established to provide relevant rehabilitation services to inmates who
are within 48 months of being released and who have demonstrated a willingness to take
advantage of such services. The Blueprint identified 13 institutions to be designated as
reentry hubs by providing education, employment, cognitive behavioral treatment, and
substance abuse programs. However, the department’s implementation of certain
programs at these reentry hubs was delayed, due in part to the contract protest process
and no viable bids for some selected sites during the first bid release. Subsequent to the
Blueprint, in December 2012, the department changed the designation of two reentry hub
sites to standard sites (California Correctional Institution and California State Prison,
Solano) and two standard sites to reentry hubs (Ironwood State Prison and California
State Prison, Los Angeles County). Additionally, in September 2013, California
Rehabilitation Center switched from a reentry hub to standard site, and High Desert State
Prison became the 13th reentry hub site. According to the department, these changes
were made primarily due to a need for programming for level III and level IV inmates
who had a high or moderate risk to reoffend and were to parole from these security
levels.
In determining operational status for each of the 13 reentry hubs, the OIG determined that
a course needed to have a corresponding instructor, an assigned classroom, and data
showing monthly inmate attendance. Based on OIG fieldwork in December 2014 and
January 2015, the department fully implemented all types of programming at 11 of its 13
designated reentry hubs. Two reentry hubs had not implemented the transitions programs
(pre-release program and job readiness) during the OIG’s fieldwork visits. The
department implemented the transitions program at the Correctional Training Facility on
February 17, 2015, while High Desert State Prison has been unable to secure staffing for its
transitions program but was proceeding with interviews during February 2015.
In-Prison Program Placement—Case Management
According to the Blueprint, a component critical to successful implementation of the
rehabilitation plan is an effective case management system. A case management plan (or
behavior management plan) is an integral part of effective rehabilitation programming.
Case management plans ensure that offenders are assigned to the appropriate programs
based on their overall risk potential identified on their criminogenic needs assessments.
Case management plans help staff determine the type, frequency, and timing of
programming an inmate should receive to most effectively reduce the likelihood of his or
her reoffending. This case plan should also transfer with the inmate upon release to
parole or to county supervision; it assists with identifying the most effective follow-up
programming based on programming received at the institution, individual goals met, or
other vital information collected during the course of incarceration.
The department is currently managing cases by assessing inmates’ needs at reception
centers and using an assignment process based on priority placements, Test of Adult
Basic Education (TABE) scores, and the inmates’ classification levels to make program

Fifth Report on CDCR’s Progress Implementing the Blueprint 5 of 76
Office of the Inspector General State of California
placements through its standard classification process. Meanwhile, the department has
been increasing the use of COMPAS assessments as part of the inmate program
assignment process.
In June 2014, the department purchased the Strategic Offender Management System
(SOMS) case plan module. The SOMS classifications and program modules began
production in August 2014. The department’s Division of Rehabilitative Programs (DRP)
Rehabilitative Case Plan project team has been developing the business and functional
requirements for the program. Although an implementation date has not been set, the
project build is estimated to be completed in autumn 2015.
In-Prison Programs—Miscellaneous Benchmarks
The Blueprint identified miscellaneous benchmarks in its narrative and Appendix B
(through fiscal year 2013–14). Thus, the OIG obtained rehabilitative programming
figures for fiscal year 2014–15 from the department’s Division of Rehabilitative
Programs (DRP) and Office of Correctional Education (OCE) to continue monitoring its
benchmarks of measurable figures.
The OIG performed fieldwork to determine the operational status of the various programs
at each institution. In order to determine the operational status of programs, the OIG
acquired the final rehabilitation authorized position counts and the detail of the
authorized positions per institution from CDCR. The OIG then reviewed payroll reports
of rehabilitation employees, reconciled the budgeted positions and discussed any
discrepancies with the education managers at the institutions, reviewed monthly
attendance reports, and conducted spot checks of classrooms. As noted with reentry hub
status, in order to be deemed fully operational, a course needed to have a corresponding
instructor, an assigned classroom, and data showing monthly inmate attendance.
Appendix A provides a detailed comparison of the rehabilitation programs provided at
each institution, identifying the programs as planned for by the department and their
operational status as of visits occurring in December 2014 and January 2015. In addition
to Appendix A, the following summary discusses the current status of various programs
identified in the Blueprint and DRP’s fiscal year 2014–15 data. In short, the OIG’s
fieldwork at all prisons found that 89 percent of the academic education programs are
operational, 76 percent of the career technical education (CTE) programs are operational,
and 88 percent of the substance abuse treatment slots are filled. From the last OIG report
issued in October 2014, this represents no percentage change in academic education
programs, a 4 percent decrease in CTE programs, and a 16 percent increase in substance
abuse treatment participation. However, overall participation has increased with
continued capacity growth.
Although education figures remained constant and a small decrease occurred in career
technical education programming, overall, since the Blueprint began, the number of
program opportunities and participation has risen significantly. In total, the department
has increased positions as of the Blueprint report; its academic positions expanded by 51

Fifth Report on CDCR’s Progress Implementing the Blueprint 6 of 76
Office of the Inspector General State of California
to 469 from the department’s staffing of 418 positions, while the number of CTE
positions has increased by 33 to 215 from the department’s staffing of 182 positions.
Academic Education: The department identified a total of 523 academic positions
(general population, alternative programming, and voluntary education program) to
become operational during fiscal year 2014–15. Previously, the department held 24 of
these positions in abeyance pending the activation of its infill construction projects at
Mule Creek State Prison and Richard J. Donovan Correctional Facility. The department
subsequently activated these 24 positions and separately requested additional staff for the
infill projects.
From December 2014 through January 2015, OIG staff reviewed the institutions’
documents and performed 34 site visits to determine whether 523 academic positions, as
provided by DRP, were fully operational, as shown in Appendix A. At the conclusion of
the fieldwork, the OIG found 467 of the 523 positions were fully operational, which
represents an 89 percent rate of compliance. This represents no percentage change from
that identified in the OIG’s last report.
Career Technical Education: The department identified a total of 283 CTE positions to
become operational during fiscal year 2014–15. Similar to the academic positions above,
the department held 21 CTE positions in abeyance pending the activation of its infill
construction projects. The department subsequently activated the 21 positions and
separately requested additional staff for the infill projects.
From December 2014 through January 2015, OIG staff reviewed the institutions’
documents and performed site visits to determine whether 283 CTE positions were fully
operational. At the conclusion of the fieldwork, the OIG found 215 of the 283 positions
were fully operational, which represents a 76 percent rate of compliance. This represents
a 4 percent decrease from that identified in the OIG’s last report.
Substance Abuse Treatment: The Blueprint stated that the substance abuse treatment
programs would be located at reentry hubs; however, the department has since added
substance abuse programs as part of its Long Term Offender Program and single or
multi-level programs at 11 non-reentry-hub institutions. To remain consistent with prior
OIG reports, the summary provided below will include substance abuse treatment
programs at only the reentry hubs, while the other substance abuse programs are
discussed later in the Long Term Offender Model section. The DRP planned to provide
1,536 treatment slots for fiscal year 2014–15.
From December 2014 through January 2015, OIG staff reviewed the institutions’
documents and performed site visits to determine whether 1,536 substance abuse
treatment slots were fully operational. At the conclusion of the OIG’s fieldwork, 1,359
inmates occupied the 1,536 operational slots, which represent an 88 percent rate of
compliance. This is an increase of 16 percent from the last report. The 1,359 inmates
participating in the substance abuse program are from each of the 13 reentry hubs.

Fifth Report on CDCR’s Progress Implementing the Blueprint 7 of 76
Office of the Inspector General State of California
Cognitive Behavioral Treatment (CBT), formerly Cognitive Behavioral Therapy: The
Blueprint identified these programs to be implemented during fiscal year 2013–14, while
the DRP continued these programs during fiscal year 2014–15. The programs include
courses in Criminal Thinking, Anger Management, and Family Relationships. From
December 2014 through January 2015, OIG staff reviewed the institutions’ documents
and performed site visits to determine whether CBT programs were implemented. The
OIG found that 2,044 of the planned 2,328 slots were fully operational, which represents
an 88 percent rate of compliance. This is an increase of 44 percent from the last report, as
the OIG found CBT programs operational in each of the 13 reentry hubs.
Pre-Employment Transition (PET): The Blueprint identified that the pre-employment
transitions program would be expanded to all reentry hubs. These services were to
include job readiness skills prior to an inmate’s release, primarily during the last six
months of incarceration. From December 2014 through January 2015, OIG staff reviewed
the institutions’ documents and performed site visits to determine whether transitions
programs were implemented at the reentry hubs. The OIG found that 408 of the planned
750 slots were fully operational, which represents a 54 percent rate of compliance. This is
an increase of 29 percent increase from the last report, as the PET programs are
operational at 12 of the 13 reentry hubs. High Desert State Prison, as of February 2015,
was conducting interview of training providers for its PET program.
Additionally, the Blueprint stated the California Identification Card program (CAL-ID)
would be implemented to assist eligible inmates in obtaining State-issued identification
cards to satisfy federal requirements for employment documentation. According to the
department, in November 2013 the Division of Rehabilitative Programs (DRP) entered
into a contract with the California Department of Motor Vehicles (DMV) through June
30, 2015, to process CAL-IDs for inmates who are being released from custody. The
interagency agreement allows up to 12,000 identification cards annually with a maximum
of 1,000 cards per month. The identification cards are being offered to inmates at a
reduced fee, and senior ID cards are offered at no cost. In September 2014, the Governor
signed legislation expanding the CAL-ID program to mandate that all eligible inmates
released from custody have valid identification cards.
From December 2014 through January 2015, OIG staff reviewed the institutions’
documents and performed site visits to determine whether the CAL-ID program was
implemented at the reentry hubs. The OIG found that the CAL-ID program was
implemented at each of the 13 reentry hubs. According to the department, as of January
31, 2015, more than 6,104 applications have been sent to the DMV for processing. The
DMV has approved 5,199 applications and sent these cards to the institutions for
issuance. The average eligibility rate is 86 percent.

Fifth Report on CDCR’s Progress Implementing the Blueprint 8 of 76
Office of the Inspector General State of California
Designated Enhanced Programming Yards: On January 1, 2014, the department
designated enhanced programming facilities (EPF) or yards to incentivize positive
behavior at seven institutions.6 The designated EPFs are located at the following
institutions and security levels:
California State Prison, Corcoran, level IV
California Substance Abuse Treatment Facility, level III
High Desert State Prison, level IV
Kern Valley State Prison, level IV
Pleasant Valley State Prison, level III
Salinas Valley State Prison, level IV
Valley State Prison, level II
From December 2014 through January 2015, the OIG performed site visits at the seven
institutions and interviewed CDCR management responsible for the designated EPFs,
which, in most cases, have been in place for a full year.
It was encouraging that at several of the EPFs, there was a positive change in those
inmates actively participating in the increased rehabilitative programs available (Arts in
Corrections, additional inmate leisure time activity groups (ILTAGs), self-help
programs). However, the continuing challenge raised by most institutions is that inmates
residing at those facilities prior to the designation were allowed to remain. According to
institution management at EPFs, allowing participation of high security level IV inmates
(through “grandfathering”), regardless of their past behavior, has resulted in a portion of
the inmate population who continue to demonstrate negative behavior.7 Inmates who do
not wish to participate or who become ineligible for the program are placed on a waiting
list for transfer. However, the inmate’s actual movement from an EPF is dependent on a
classification staff representative’s endorsement for transfer and available bed space at
the new location.
Additionally, some inmates have arrived at EPFs, pending transfer to another institution,
even though they did not meet the criteria for EPF placement. For instance, two
institutions cited receiving inmates directly from a security housing unit (SHU), which is
one of the exclusionary items (having a SHU term within the past 12 months). To verify
this concern, OIG reviewed five inmates with SHU terms in the past year, who, in fact,
were transferred to an EPF until level IV bed space was available at another institution. It
appears that without adequate bed space, the classification committee and classification
staff representative are compelled to utilize level IV EPFs for temporary housing despite
the requirement that EPFs only be used for inmates with a willingness to meet
programming expectations. Since the intent of the EPFs is to incentivize and reinforce
positive life choices, allowing other non-eligible inmates defeats the purpose of the
6 The department designated one facility (or yard) at six of the seven institutions, while Valley State
Prison’s entire institution of approximately 3,200 inmates was included as an enhanced programming
facility. 7 As of January 1, 2015, 42 percent (3,340 out of 7,892 inmates) of inmates at enhanced programming
yards were level IV inmates.

Fifth Report on CDCR’s Progress Implementing the Blueprint 9 of 76
Office of the Inspector General State of California
program. The department should examine this issue with input from the affected facilities
and find solutions to the housing problem that will not adversely impact the success of
the EPF program.
Long-Term Offender Model: The Blueprint identified the development of a reentry
model designed for long-term offenders to be piloted at three institutions projected to
have a substantial population of long-term offenders. On February 11, 2014, the Office of
Administrative Law authorized the Long-Term Offender Pilot Program (LTOPP). The
LTOPP has been implemented at the California Men’s Colony (CMC), California State
Prison, Solano (SOL), and the Central California Women’s Facility (CCWF). From
December 2014 through January 2015, OIG staff confirmed that the substance abuse
treatment programs were implemented at each of these three LTOPP institutions, serving
180 of the 288 inmates planned (63 percent). Additionally, DRP expanded its substance
abuse treatment programs to 11 non-reentry-hub institutions through single or multi-level
modalities, e.g. outpatient, intensive outpatient, or modified therapeutic community
treatment. During site visits, the OIG found 1,024 out of 1,152 inmates planned
(89 percent) were participating.
Additionally, the Offender Mentor Certification Program continues to provide an
opportunity for long-term inmates to complete a certification program in alcohol and
other drug counseling. Inmates are recruited from various institutions and transferred for
training at one of three sites: the Central California Women’s Facility (CCWF), Valley
State Prison (VSP), or California State Prison, Solano (SOL). Once the candidates pass
the written California Association for Alcohol/Drug Educators (CAADE) examination,
the inmate-mentors are transferred back to their original institutions and are paid to
obtain their 4,000 hours of work experience by co-facilitating substance abuse treatment.
The department plans to have up to 36 candidates per training session or 108 candidates
annually.
Sex Offender Treatment: The Blueprint called for the development of services for sex
offenders and the piloting of the model at one institution in fiscal year 2013–14. The
treatment program will place a heavy emphasis on skill-building activities to assist with
cognitive behavioral treatment and social, emotional, and coping skills development.
There were 80 slots planned for participants, and the program length was to be 18
months. The department selected the Substance Abuse Treatment Facility (SATF) as the
location for the sex offender treatment pilot and began the bid process in
September 2013. However, the department did not receive any bids for the contract. The
department began working on an interagency agreement with the Department of State
Hospitals for the delivery of the programs. In June 2014, the Department of State
Hospitals discontinued those discussions. The department is currently in the hiring
process for civil service classifications for the program and is currently working with the
University of Cincinnati’s Corrections Institute on curriculum, training, and coaching. To
date, the program is still pending implementation.

Fifth Report on CDCR’s Progress Implementing the Blueprint 10 of 76
Office of the Inspector General State of California
Gang Prevention: The department’s step-down program (SDP) provides inmates placed
in the security housing unit (SHU), due to security threat group (STG) validation or
documented STG behaviors, a program that includes increased incentives for positive
behavior, including discontinuing participation in STG activities, with the ultimate goal
of release from the SHU. The SDP has been implemented at each SHU institution:
California Correctional Institution (CCI), California State Prison, Sacramento (SAC),
Corcoran State Prison (COR), and Pelican Bay State Prison (PBSP). The department
reports that the SDP is currently not being implemented in female institutions because no
female STG members or affiliates are in the SHU based on an STG validation.
The program components include pro-social videos, voluntary education program,
self-journaling workbooks, interactive journaling workbooks, “thinking for change,” and
conflict resolution. The journaling workbooks cover violence prevention, criminal
lifestyle, rational thinking, living with others, substance abuse, and social values. In order
to implement the SDP, the Division of Rehabilitative Programs (DRP) hired five retired
annuitants, described as having broad administrative or supervisory experience in
correctional administration, at the SHU institutions to facilitate the journaling workbooks
and group activities. The DRP also hired five staff as Correctional Counselors II
(Specialist) who are currently receiving training on the curriculum.
Community Programs for Parolees
Similar to the in-prison rehabilitation program goals, the department’s goal as stated in
the Blueprint is to build program capacity by fiscal year 2013–14 to accommodate
70 percent of parolees who have a need for substance abuse treatment, employment
services, or education within their first year of being released from prison. The Blueprint
identified capacity benchmarks by type that the department intended to meet in order to
accommodate the parolee needs. The table below identifies the number of parolees
identified for each program type shown in the Blueprint and the number of parolees
served as reported by the department. During December 2014, the department exceeded
the total annual program capacity (parolees who can be served in each program area in a
year) identified in the Blueprint for fiscal year 2013–14.8 Many of the programs available
offer multiple types of services at a single site.
Community Programs for Parolees Available During December 2014
8 Note the Blueprint did not include parolee figures for fiscal year 2014–15.
Post-Release:
Adult Rehabilitative Programs
Blueprint Slots
(FY2013-14)
Planned Annual Capacity
December 2014
(FY2014-15)
Annual Capacity
Education Programs 6,219 6,879
Employment Programs 5,915 5,939
Substance Abuse Treatment 5,172 8,764
Total Annual Capacity 17,306 21,582

Fifth Report on CDCR’s Progress Implementing the Blueprint 11 of 76
Office of the Inspector General State of California
According to the department, the community and reentry programs expanded
pre-employment services to parolees via the increase in day reporting centers (DRCs)
across the State, thereby increasing employment and job development services. There are
currently 23 DRCs and community-based coalitions operating statewide. Along with day
reporting centers, the department has also increased the number of computer literacy
learning centers from 21 in 2012 to 25 centers currently, helping to improve literacy
skills and focusing on training skills, life skills, and employment competencies. The
department explained that its decrease in annual capacity for post-release substance abuse
treatment was due to a decline in the number of Board of Parole Hearings referrals to the
community portion of the in-custody drug treatment program.
Additionally, the department is in the process of developing a tracking mechanism to
identify the percentages of first-year parolees who have participated in community-based
programming based on their assessed needs. In the interim, the department has provided
data identifying the number of parolees released during December 2014 who were in the
target population and participated in a rehabilitative program consistent with their
employment, education, or substance abuse needs. This data can be used to track the
department’s progress in meeting its goal as stated in the Blueprint, which is to build
program capacity by fiscal year 2013–14 to accommodate 70 percent of parolees who
have a need for substance abuse treatment, employment services, or education within
their first year of being released from prison. Again, the Blueprint does not identify a
milestone for when the goal is to be met; however, CDCR identifies June 30, 2015, as its
projected completion date. 9
The following table represents a snapshot of data provided
by CDCR, during January 2015, to show how the department identified its target parolee
population.
Total Number of Offenders Paroled or Discharged with a
High/Moderate CSRA Score During January 2015
Parolees—Type of Criminogenic Risk and Need
Total Number of
Offenders
Released
Parolees released with a moderate-to-high CSRA Score 816
And Parolees released with a moderate-to-high CSRA
Score and a Re-entry COMPAS
693
And Parolees released with moderate-to-high CSRA Score
and at least 1 medium-to-high COMPAS Re-entry Need
590
Similar to how it calculates its target population for inmates, the department uses the
results of parolees who have shown a moderate-to-high risk to reoffend (816) according
to the California Static Risk Assessment (CSRA), and at least one medium-to-high need,
as identified by the Correctional Offender Management Profiling for Alternative
9 CDCR’s revised Strategic Plan (draft) identifies June 30, 2015, as the date to reach the 70 percent
rehabilitation goal for parolees. The Strategic Plan further defines the target population as “70 percent of
parolees identified with moderate-to-high risks [CSRA] and needs [COMPAS] will participate during their
first year on parole in appropriate and effective community programming to meet their criminogenic
needs.”

Fifth Report on CDCR’s Progress Implementing the Blueprint 12 of 76
Office of the Inspector General State of California
Sanctions (COMPAS) Reentry assessment tool. In the table above, there were 103
parolees (693 minus 590) who did not have at least one medium-to-high COMPAS
reentry need. Thus, the target population for parolees during January 2015 was 590.
The following table provided by CDCR identifies parolees who were released during
January 2015 and whether they participated in a rehabilitative program consistent with
their employment, education, or substance abuse needs. The department calculated that
45 percent of parolees had participated in programs for parolees that addressed at least
one, but not all, of the categories, well below its goal of accommodating 70 percent of
parolees. The department showed that 35 percent of parolees had participated in parolee
programming in each of their criminogenic needs.
Percent of Parolees Receiving Services Consistent with Their Needs
During January 2015
Individual Need
(Inmates may be in
multiple categories)
Total Number of
Offenders By Need
Parolees with a Risk and
Need who Participated in
Programming Consistent
with Their Needs
Parolees with a Need who
Did Not Participate in
Programming Consistent
with Their Needs
Employment Need 412 153 259
Education Need 297 109 188
Substance Abuse Need 291 123 168
Total Percentage of Offenders with at Least One Need who Participated in at
Least One Program Consistent with their Risk and Need
45%
Total Percentage of Offenders with a Need who Participated in All
Programming Consistent with their Risk and Need
35%

Fifth Report on CDCR’s Progress Implementing the Blueprint 13 of 76
Office of the Inspector General State of California
STANDARDIZED STAFFING
The department developed a standardized staffing component for its adult institutions,
and in the Blueprint it identified the planned staffing patterns for each site. To address
issues of population growth and overcrowding, a standardized budget methodology
primarily for custody-type services had been established to provide ratio-driven staffing
adjustments as the inmate population fluctuated. When the Blueprint was approved and
incorporated in the 2012–13 Budget Act, the new staffing model was approved, replacing
the old model. Also, legislation was passed in 2012 mandating that the Department of
Finance assess and report on the fiscal benchmarks of the Blueprint, and codified that
requirement in Penal Code, Section 5032. Therefore, the OIG did not assess that aspect of
the Blueprint.
Background
The new standardized staffing model identified in the Blueprint includes a baseline level
of staffing for most institution functions to be attained by July 2013. While the
non-custody staffing components for each prison as identified in the Blueprint were not
expected to fluctuate with inmate population changes, the custody staffing levels may
change. The previous staffing model required biannual budget and staffing augmentations
in conjunction with the spring and autumn population adjustments, triggering numerous
activations and deactivations in housing units throughout the State every year. As stated
in the Blueprint, the new custody staffing model allows for the safe operation of housing
units with an inmate population between 100 percent and 160 percent of the unit’s design
level. It is expected, therefore, that the inmate population fluctuations will require fewer
budget and staffing adjustments than the old model required.
Goals and Benchmarks
The OIG reviewed budget and payroll reports to assess the department’s status in terms
of overall positions, as shown in the Blueprint. As identified in the OIG’s previous report,
the department complied with its budgeted staffing levels at the institutions by July 2013.
In each of the past four reports, the OIG performed fieldwork to assess whether the
custody staffing patterns matched the budgeted levels of staffing based on review of
actual staff sign-in/out sheets to compare with the standardized staffing reports and
determine whether the institutions were consistently staffing the units in accordance with
their budgeted levels.10
The results of past fieldwork had indicated a 100 percent
adherence rate at which the daily staffing patterns matched the standardized staffing plan
at each institution. Thus, the OIG does not plan to continue monitoring standardized
staffing levels unless significant changes are made in the future or if requested by the
Legislature. 10
The sign-in/out sheets are daily reports used at the prisons to track employee time. The reports contain
pre-printed information, including the position description, shift, and name of the scheduled employee. The
standardized staffing reports are detailed reports of each prison’s major facilities, and the information
supports the summaries in the Blueprint. They also tie to the post assignment schedules that identify
authorized position detail.

Fifth Report on CDCR’s Progress Implementing the Blueprint 14 of 76
Office of the Inspector General State of California
INMATE CLASSIFICATION SCORE
SYSTEM
The department uses an inmate classification score system (ICSS) to ensure its inmates
are properly housed and supervised. After review of the inmate classification score
system, an expert panel concluded in 2011 that the point thresholds used by CDCR to
assign housing could be changed without increasing the risk of serious misconduct.11
As
a result, the Blueprint stated the department would adjust the point thresholds and file
emergency regulations to adopt the recommendations set forth in the ICSS study with the
Office of Administrative Law by June 2012.
Modification of the Inmate Classification Score System
According to the department, the ICSS is the primary objective factor used to determine
the most appropriate housing and supervision for each inmate. The department’s goal is to
modify the ICSS by changing the point thresholds between the four levels used for
housing purposes. The department anticipates the changes affecting male inmates will
bring about better access to rehabilitative programs and avoid unnecessary
over-classification, thereby increasing success upon release.12
It also anticipates reduced
costs since higher levels of housing correspond to higher costs to house inmates.
The department’s emergency regulations to implement the expert panel’s
recommendations became effective July 1, 2012. As stated in the Blueprint, the
department expects that by 2015 the new regulations will be fully implemented, and over
9,500 male inmates will have moved from level IV to level III, and over 7,000 from level
III to level II. Based on a recent snapshot of data as of January 31, 2015, it appears the
projection of movement is succeeding in reaching its overall target. The data shows the
ICSS score range changes currently affect 17,064 inmates, with the most impact on
inmates moving from level III to level II. This does not necessarily mean that those
inmates moved to a lower security level, but only that their placement score now
indicates a lower security housing level than before.
Selected Inmates with classification reviews from 7/1/12 through 1/31/15
11
CDCR commissioned researchers from the University of California system to evaluate the department’s
ICSS and, in collaboration with key CDCR staff, completed a statistical analysis of the current
classification process. The report was issued in December 2011.
12 Female offenders are generally housed together without regard to level (level I to IV) because their
propensity for violence is much lower than that of male offenders.
Placement Score Range Inmate Count
28 - 35 (Formerly Level III - Now Level II) 10,959
52 - 59 (Formerly Level IV - Now Level III) 6,105
Total 17,064

Fifth Report on CDCR’s Progress Implementing the Blueprint 15 of 76
Office of the Inspector General State of California
The institutions and their housing facilities have four designated security levels, level I
through level IV, with level I for minimum and level IV for maximum security inmates.
The following table displays the changes to the inmate classification score system, which
increased the maximum point threshold for levels II and III and the minimum point
threshold for level IV. An inmate’s classification score (placement score) determines
which level the inmate will be housed in, unless other overriding case factors exist.
ICSS—Miscellaneous Data Benchmarks
Neither CDCR nor the OIG has a method (other than a manual assessment) to efficiently
identify the number of inmates who moved from one security level to another solely
because of the change in classification score thresholds. This is because an inmate’s
placement score can change for a variety of reasons other than ICSS changes. There are
also administrative determinants, such as camp, medical, mental health program, and
time to serve, which can override scores and show, for example, an inmate with a level II
security score being housed in a level I facility due to a “camp override.” Therefore, it is
difficult to determine whether inmates are moving from one security level to another
solely because of the ICSS score threshold changes.
The OIG reviewed a statewide sample of inmates affected by the score range change. The
OIG selected 10 inmates at each male prison who had final placement scores in the 28–35
range or the 52–59 range (those ranges are the ones most affected by the threshold
changes in security levels). The OIG’s fieldwork focused on whether inmates were in
housing units that matched their placement score. If not, the OIG considered whether the
inmate was awaiting an endorsement or transfer, or if the inmate’s placement score
increased. As shown on the next page, the review found that 290 of the 320 inmates the
OIG reviewed were housed in traditional housing (security levels I to IV). The other 30
inmates were housed in units not designated a security level, such as an administrative
segregation unit, a reception center, or a correctional treatment center. Of those 290
inmates in traditional housing, 205 inmates (71 percent) were housed in a security level
consistent with their placement score, 72 inmates (25 percent) were waiting to be
endorsed to a lower security level, and 13 inmates (4 percent) were waiting to be
transferred to a lower security housing level.13
13
Out of the 205 inmates who were shown to be housed in a security level consistent with their placement
score, 14 inmates had an administrative determinant (camp, medical, time to serve, etc.) identified by the
Pre-July 1, 2012 Post-July 1, 2012
Security Level Final Classification Score Final Classification Score
I 0-18 0-18
II 19-27 19-35
III 28-51 36-59
IV 52+ 60+
Inmate Classification Score System Changes

Fifth Report on CDCR’s Progress Implementing the Blueprint 16 of 76
Office of the Inspector General State of California
Housing Impact Based on ICSS Score Changes
The percentage of inmates housed in a security level consistent with their placement
score and endorsed to a lower level decreased by 5 percent, from 80 percent to
75 percent, since the OIG’s last report. Inmates awaiting a classification staff
representative (CSR) endorsement increased by 5 percent, from 20 percent to 25 percent.
To be able to house and endorse 75 percent of inmates consistently with their placement
score in this targeted group most susceptible to movement (scores in the 28 to 35 or the
52 to 59 range) is positive. Although this figure is based on only 290 inmates, it is
indicative of the department’s effort to reduce costs by moving inmates from higher level
housing to lower level housing consistent with their placement score.
To emphasize this, simply because an inmate’s placement score changes after a
classification review and causes the change in security level designation, it does not mean
that the inmate is immediately moved to a housing unit or institution consistent with the
inmate’s placement score. A CSR can endorse the inmate to be moved to a different
institution or facility; however, that is essentially only the “bus ticket” to be moved. If a
“bus” is not available, the inmate is not moved. Bed space at the appropriate facility must
also be available for the movement to occur. If an inmate is not moved after a certain
amount of time, the endorsement expires after four months and requires CSR
reauthorization.14
The table on the next page provides a snapshot of inmates housed in levels consistent
with their placement score. Inmates can be housed in levels that are not consistent with
their placement scores for a variety of reasons, including bed availability as previously
described. Monthly counts from September 2014 through January 2015 show that
97 percent of inmates with placement scores in the level II range were housed at a level
consistent with their score (3 percent were housed in a level III setting). This represents a
1 percent decrease from the last report. The percentage of inmates housed in levels III
classification staff representative that acted as an “override” to the housing level based on their placement
score. 14
The endorsements by the CSR have expiration dates because the information becomes outdated. For example, an inmate can be endorsed to be transferred to another prison after an evaluation of enemy concerns at the prospective prison. If four months elapse before the transfer, the endorsement needs to be reauthorized because another inmate with an enemy concern may have arrived at that prospective prison.

Fifth Report on CDCR’s Progress Implementing the Blueprint 17 of 76
Office of the Inspector General State of California
and IV consistent with their score also decreased slightly by 2 percent and 1 percent,
respectively, since the last report. The OIG does not deem these slight changes significant
as the vast majority of inmates are correctly housed based on their placement score. As
stated previously, the placement score is one of many factors determining in what
security level the inmates are housed.
Inmates Housed at a Level Consistent With Their Placement Score
Actual
Housing
Level
4th OIG Report
August 2014 Data
5th OIG Report
September 2014
through January
2015 Data
Change From Last
Report
II 98% 97% -1%
III 90% 88% -2%
IV 97% 96% -1%

Fifth Report on CDCR’s Progress Implementing the Blueprint 18 of 76
Office of the Inspector General State of California
GANG MANAGEMENT
The Blueprint identified several measures recommended as a result of 2007 study entitled
Security Threat Group Identification and Management performed by California State
University, Sacramento. The Blueprint stated the department could now begin a careful
implementation of the recommendations, including offering graduated housing, a
step-down program for inmates, support and education for disengaging from gangs, a
weighted point system for gang validation, specific use of segregated housing, and social
value programs in preparation for the inmates’ return to the community. Since the
Blueprint was launched prior to the department establishing its pilot program for gang
management, it did not include any target dates or specific benchmarks to be achieved.
Security Threat Group—Pilot Program Completed
The department’s 24-month pilot program, October 18, 2012, through October 17, 2014,
is now complete and was entitled “Security Threat Group Identification, Prevention, and
Management Instructional Memorandum.” On September 5, 2014, the department
submitted its final rulemaking package for approval by the Office of Administrative Law,
which determines whether regulations can be made permanent. The revised regulations
were approved by the Office of Administrative Law on October 17, 2014. The OIG
continues to monitor the department’s gang management policy and key areas included in
its new policy.
Security Threat Group—Gang Management Program
To combat gangs, the department has historically identified gangs with the greatest
propensity for violence and has separated the offenders from the general inmate
population by placement into security housing units.15
The department’s policy for
identifying prison-based gang members and associates and isolating them from the
general population has been replaced with a new model that identifies, targets, and
manages security threat groups (STGs) and utilizes a behavior-based step-down program
(SDP) for validated affiliates.16,17
The new policy allows gang affiliates an opportunity to
work their way from a restricted program back to the general population by
demonstrating a willingness and commitment to discontinue gang activity during their
15
Title 15, California Code of Regulations, Section 3341.5(c), provides for “…an inmate whose conduct
endangers the safety of others or the security of the institution…” to be housed in a security housing unit
(SHU). Inmates may be placed in a SHU for either a determinate or an indeterminate term. Inmates
sentenced to determinate terms in SHUs are those who have been found guilty through a formal
disciplinary process of having committed one or more specified serious offenses ranging from murder to
threatening institution security. Title 15, California Code of Regulations, Section 3341.5(c)(2)(A)(2), in
contrast, specifies an indeterminate SHU term for validated prison gang members and associates, who are
deemed “a severe threat to the safety of others or the security of the institution.”
16 The term “security threat group” has generally replaced the term “prison gang,” “disruptive group,” or
“street gang” within CDCR.
17 Affiliates are individual offenders (inmates), identified as “members,” “associates,” or “monitored,” who
are connected or interact with a certified security threat group.

Fifth Report on CDCR’s Progress Implementing the Blueprint 19 of 76
Office of the Inspector General State of California
incarceration. This new policy addresses validated affiliates with indeterminate SHU
terms. It does not address inmates with determinate SHU terms (inmates in SHUs for
non-gang-related behavior).
The department conducts case-by-case reviews for currently validated affiliates housed in
SHU facilities. As part of the review, the Departmental Review Board (DRB) determines
an inmate’s appropriate placement or retention within the SHU, placement within the
SDP, or release to a general population facility (step 5 of the SDP). The department also
conducts institution case-by-case reviews of validated inmates housed within
administrative segregation units (ASU) who are endorsed for transfer to SHU facilities.
The department noted the case-by-case reviews were to be provided to all existing
validated STG members and associates. These reviews provide an opportunity for
potential release to general population (step 5) or further retention in the SHU within one
of four programming steps of the SDP (steps 1 through 4). The department intends to
continue this process until all inmates validated prior to March 1, 2013, have received an
individual case review. The table below identifies the validated affiliate inmate
populations at each institution within CDCR.
Validated Affiliate Inmate Populations
Prison
STG
Members
STG
Associates
Total STG
Inmates
California Correctional Institution 45 395 440
California Institution for Women 0 4 4
California State Prison, Corcoran 77 358 435
California State Prison, Sacramento 28 68 96
Pelican Bay State Prison 314 840 1,154
Others (Statewide) in
Administrative, Segregation Units
(ASU), California Out-of-State
Correctional Facilities (COCF),
General Population (GP), and
Reception Centers (RC).
103 460 563
Statewide Totals 567 2,125 2,692
Source: CDCR - Data as of 11/26/14
One of the key components to its revised regulations is that validated STG associates will
no longer be automatically placed into the SHU (or an SDP) based solely upon their
validation as an STG associate. The new gang management policy incorporates a
requirement that in addition to formal validation, an associate must also demonstrate STG
disciplinary behavior as part of or subsequent to his or her initial validation in order to be
considered for placement in the SHU or the SDP. If documented STG behavior occurred
within the past four years and is determined credible by the DRB, the board will then
determine the appropriate step for placement consideration based on when the behavior
occurred. However, if no documented STG behavior was found to have occurred within
the past four years, an inmate will be released to general population (step 5), typically to
a level IV institution for a period of one year. The step 5 inmate is identified as being on

Fifth Report on CDCR’s Progress Implementing the Blueprint 20 of 76
Office of the Inspector General State of California
“inactive monitored” status and would be eligible for transfer to an alternate institution
consistent with his or her placement score after 12 months of STG discipline-free
behavior.18
The table below shows the time frames of documented STG behavior that the
DRB considers when determining the appropriate SDP placement.
As shown in the following table, documents from the department display that through
January 30, 2015, the DRB had reviewed a total of 824 cases at the five SHU facilities.
This was an increase of 131 cases since the last OIG report issued in October 2014. Of
the 824 cases reviewed, the department approved 577 inmates (70 percent) for release to
general population (step 5) and placed 238 inmates (29 percent) in step 1, 2, 3, or 4 of the
SDP. The remaining nine inmates were released to a transitional housing unit or general
population setting as part of the debriefing process.
SHU-Summary of Outcomes from Case-by-Case Reviews
The department has been conducting institution case-by-case reviews for inmates
validated prior to March 1, 2013, who are retained in the ASU until bed space is available
in the SHU. These inmates are housed in the ASU at various institutions throughout the
18
Inactive monitored inmates will be allowed to remain in general population unless the inmates
demonstrate additional STG-related behavior (shown in the STG Disciplinary Matrix). If the inmate is
issued a Rules Violation Report (RVR) and found guilty of one Serious Rules Violation with an STG nexus
or two Administrative Rules Violations with a STG nexus within a 12-month time frame, the affiliate will
be processed for placement into the SDP.
Outcome of DRB Hearing Number of Inmates
SDP – Step 1 68
SDP – Step 2 78
SDP – Step 3 51
SDP – Step 4 41
Release to GP - Step 5 577
Debriefed - Release to Transitional
Housing Unit (THU)/General Population
(GP)
9
Totals 824
Source: CDCR – Data as of January 30, 2015
Occurrence of Documented STG
Behavior Prior to the DRB Hearing
Step Down Program (SDP)
Placement
1 to 12 months Step 1
13 to 24 months Step 2
25 to 36 months Step 3
37 to 48 months Step 4
49 months and beyondStep 5
(General Population)

Fifth Report on CDCR’s Progress Implementing the Blueprint 21 of 76
Office of the Inspector General State of California
State and will have their case-by-case reviews conducted once they arrive in the SHU. As
shown in the table below, documents from the department display that through January
30, 2015, the Institution Classification Committee (ICC) had reviewed a total of 246
cases. Of the 246 cases reviewed, the department approved 156 inmates (63 percent) for
release to general population and placed 56 inmates (23 percent) in step 1, 2, 3, or 4 of
the SDP. The remaining 34 inmates were retained in the ASU due to safety concerns,
debriefing, or disciplinary reasons. The total number of ICC case reviews increased by
one case since the last OIG report.
ASU—Summary of Outcomes from Case-by-Case Reviews
The department has conducted 1,070 case-by-case reviews in 27 months since its gang
management pilot began in October 2012. This represents 40 percent of its total STG
population (2,692 inmates) who were validated prior to March 1, 2013, an increase of
132 case-by-case reviews identified in the OIG’s prior report. The OIG estimates at its
current rate, the department will take until February 2019 to complete all reviews.
The department’s Special Project Team (SPT), during the past few years, was tasked with
developing the new security threat group (STG) management policy, implementing a
24-month pilot program, creating new procedures and regulations, providing staff
training, addressing legal and legislative issues, and conducting active/inactive reviews
(six-year inactive reviews).19
Each of these items impacted the DRB’s ability to
accelerate its case-by-case reviews. According to the SPT, it has initiated training of two
current wardens to provide options to expand the inactive or case-by-case review process.
The SPT is hopeful that the DRB will be able to conclude all reviews within the next 12
to 18 months, but that is dependent on no additional responsibilities arising during this
time frame.
19
With the adoption of security threat group (STG) regulations into law, the previous six-year inactive
review language was officially removed from regulations. However, the department is continuing to
provide the six-year inactive review process, in conjunction with the ongoing case-by-case review process,
to those inmates assigned a six-year inactive review date. Thus, inmates currently housed in the SHU due to
validation as an STG-I (term used to identify and prioritize the level of threat the group presents) affiliate
prior to March 1, 2013, will be retained pending appearance before the DRB.
Outcome of ICC Hearing Number of Inmates
SDP – Step 1 48
SDP – Step 2 3
SDP – Step 3 4
SDP – Step 4 1
Release to General Population (GP) 156
Retain in AdSeg (Safety, Debriefing or
Disciplinary)34
Totals 246
Source: CDCR – Data as of January 30, 2015

Fifth Report on CDCR’s Progress Implementing the Blueprint 22 of 76
Office of the Inspector General State of California
Although there were no benchmarks in the Blueprint to complete a certain number
or percentage of case-by-case reviews, the department should endeavor to timely
complete these reviews. The department intends to continue this process until all inmates
validated prior to March 1, 2013, have received an individual case review. The OIG will
continue to monitor and report on the case-by-case reviews completed.
Security Threat Group—Status Report of SDP Inmates
(Steps 1 Through 4)
The new gang management policy requires an offender in step 1 through 4 to participate
in inmate programming or journaling before progressing to the next step. Inmates placed
in steps 1 and 2 are to have program assessments initiated, such as TABE (Test of Adult
Basic Education) and COMPAS assessments. Inmates placed in step 3 can participate in
self-directed journals that are intended to develop a system of values and strategies
leading to responsible thinking and behavior. Step 4 inmates may have programming that
includes education, violence prevention programs, and gang diversion programs. If an
inmate refuses to participate in the SDP, including inmate programming or journaling, the
inmate will return to a previous step or regress further.
The OIG’s fieldwork reviewed the current status of 65 inmates who were assigned to the
SDP (steps 1 through 4) for at least 12 months to identify the result of the ICC
review.20,21
As summarized on the next page, the OIG found that 31 of the 65 inmates
(48 percent) successfully progressed to the next step; 27 inmates (41 percent) were
retained in their current step; and 7 inmates (11 percent) had regressed to a prior step.
Status of Inmates Placed in Steps 1 through 4 of the Step-Down Program (SDP)
20
Based on the review of department data, the OIG identified 68 SDP inmates, as of November 1, 2014,
assigned to steps 1 through 4. From the 68 inmates, the OIG found three inmates paroled during the
12-month period in their assigned step. Thus, the review consisted of 65 inmates who were in the SDP and
underwent an ICC review.
21 As part of its gang management policy, the department conducts institutional classification committee
(ICC) program reviews to monitor the progress and behavior of inmates within the SDP. Each step is
designed to be completed in 12 months but may be accelerated at the 180-day review. The ICC typically
discusses an inmate’s retention in its current step, regression to beginning of the current step, regression to
a prior step, or reduction in privilege levels.

Fifth Report on CDCR’s Progress Implementing the Blueprint 23 of 76
Office of the Inspector General State of California
The percentage of inmates who progressed (48 percent) based on active participation in
the SDP remained stable; it decreased by only 1 percent since the last OIG report. The
inmates retained in their current step increased by 14 percent, while the inmates who
regressed decreased by 11 percent from the last OIG report. As shown in the preceding
diagram, the OIG found that 27 of the 34 inmates (79 percent) from the “retain” and
“regress” categories refused to participate in the SDP. For the inmates who were unable
to progress, it was due to “refusing to participate” (27 inmates), “other reasons” (four
inmates), and “will not participate in journaling” (three inmates, one each from steps 1, 2,
and 3). The “other reasons” typically involved inmates who were indecisive on choosing
to participate, which caused more assessment time before an ICC decision was made.
As shown in the table below, the OIG reviewed the Test of Adult Basic Education
(TABE) achievements for each of the 65 inmates reviewed. The TABE includes a reading
portion as an assessment to determine which ABE class the inmate-student will be
assigned to. The OIG found seven of the ten inmates (in steps 1 through 4) had a reading
score of 0.0 to 3.9 and were retained in their current step for refusing to participate, while
the other three inmates progressed to the next step. The OIG found that one of the latter
inmates was placed in step 4 by the DRB in October 2013 and had a TABE score of 3.8.
The inmate had been assigned a rating of “Unsatisfactory” for the quantity of completed
SDP assignments; however, according to the SDP facilitator, the inmate “is having great
difficulty in completing the journals as required” and was thus referred to the education
department for placement into an ABE I class to gain the ability to actively participate in
the SDP. The SDP facilitator stated, “As the program is not set to provide staff assistant
type aid to the inmates, inmate [redacted] has not completed any journals. Even so, I
recommend that he be progressed to step 5.” In fact, the inmate progressed to step 5 by
the ICC’s decision in October 2014.
This recommendation by the SDP facilitator and ICC decision is contrary to the SDP
guidelines, which do not identify any exceptions, such as learning difficulties, for
participation in any program components, including journaling. As inmates refusing to
participate in journaling are unfailingly retained or regressed to a prior step, it is not clear
whether all institutions are considering the inmate’s TABE score in their decision
making. Consideration of an inmate’s TABE score in relation to journal completion
appears valid, but the department should be consistent in its application to all inmates.
TABE Scores of Inmates Placed in Steps 1 Through 4 of the Step-Down Program
(SDP)
TABE Scores
(by grade point level) Course Name
Total SDP Inmates
Reviewed
0.0 (non-reader) to 3.9 ABE I 10
4.0 to 6.9 ABE II 17
7.0 to 8.9 ABE III 8
9.0 to 12.9 GED/High School 25
No score noted 5
65

Fifth Report on CDCR’s Progress Implementing the Blueprint 24 of 76
Office of the Inspector General State of California
Also, as summarized below, the OIG’s fieldwork noted an increasing percentage of
inmates progressing (or transitioning) to the next step as they move closer to being
released to general population (step 5). The OIG found seven of the eight inmates
reviewed were initially assigned to step 4 at California Correctional Institution and all
progressed to the next step.22
Also, over half (54 percent) of the inmates assigned to step
3 were able to progress to step 4. Each inmate in the SDP is assigned ratings in various
categories during the annual program review or ICC reviews (at 90 or 180 days). Most
inmates who progressed received the highest rating of “exceptional” in the following
categories: “attitude toward staff,” “attitude toward fellow inmates and workers,” and
“teamwork and participation.” This confirms that inmates demonstrating a willingness
and commitment to discontinue gang activity may progress through the SDP to their
eventual release from the SHU.
Status of Inmates Placed in Steps 1 Through 4 of the Step-Down Program (SDP)
22
The remaining inmate was initially assigned to step 4 by the Departmental Review Board but
subsequently regressed to step 1 on May 7, 2013. However, the inmate progressed from step 1 to step 2
while at Pelican Bay State Prison during an annual review monitoring the inmate’s behavior. Thus, the OIG
identified this inmate as progressing based on the most recent annual review.
1 16 5 31% 11 69% 0
2 28 11 39% 12 43% 5
3 13 7 54% 4 31% 2
4 8 8 100% 0 0% 0
Sub-totals 65 31 48% 27 42% 7
Regress to a
Lower Step
Step Assigned by the
Departmental Review
Board (DRB)
Total
Inmates
Reviewed
Progress/
Transition to
Next Step
Progress/
Transition to
Next Step (%)
Retain in
Existing
Step
Retain in
Existing
Step (%)

Fifth Report on CDCR’s Progress Implementing the Blueprint 25 of 76
Office of the Inspector General State of California
COMPREHENSIVE HOUSING PLAN
The department updated its comprehensive housing plan and incorporated the
components identified in the Blueprint. Those components include changes to the inmate
classification score system, creating anticipated changes in housing and population
density levels, construction, renovations, conversions, activations, closures, and changes
to contract beds and the fire camp population. The results of the comprehensive housing
plan are primarily summarized in Appendix B of the Blueprint at the institution level.
Institution Housing Plans
The institution housing plans identify design and staff capacity as well as the custody
level and program assignment for each housing unit at each institution. Since neither the
housing plans nor the narrative identifies an implementation date, for the purposes of
review the OIG assumed that the institution housing plans became effective when the
Blueprint was approved, which was when the 2012–13 Budget Act was signed.
The Blueprint does not provide the detail regarding the housing plans prior to the
Blueprint changes. Therefore, the OIG does not have a starting point for the level of
detail the new housing plans provide. This is critical because although the OIG is
attempting to monitor monthly activation and deactivation plans, some of the plans the
OIG has reviewed call for an activation of a housing unit to the custody level and
program assignment consistent with what is already in the housing plan in the Blueprint.
Because of a lack of “before-Blueprint” data, the OIG relied primarily on the institutions’
shift count reports and departmental population data to determine whether housing units
were being used in accordance with the Blueprint housing plans. The OIG did not attempt
to reconcile the housing plans to the program assignment level but rather to the custody
levels.
The OIG obtained “positive shift count” reports at each institution.23
Although those
reports do not identify custody level and program assignment, they do provide inmate
population counts for each housing unit. The OIG was then able to determine whether
inmates are being housed at each housing unit within a level reasonably consistent with
the level identified in the housing plan. The OIG found that the inmate housing is
consistent with the housing plan in most instances. In fact, of the 935 housing units
identified in the Blueprint, the OIG found 901 housing units (96 percent) to be
operational.24
There was one institution, California Rehabilitation Center, where a few of
23
Positive shift count reports are reports generated at each prison at standard intervals throughout each day
and accessible via the Strategic Offender Management System (SOMS). The reports contain data of the
number of inmate counts in each housing unit within each facility or major yard and at each prison. The
reports also identify the number of inmates either off grounds or at special areas of the prison, such as
being out to court, out to a medical appointment, at education, or in the administration building.
24 The 935 housing units identified in the Blueprint include 29 housing units of the California Health Care
Facility, which includes five units occupied by inmates in the DeWitt Nelson Correctional Annex that
became operational in April 2014.

Fifth Report on CDCR’s Progress Implementing the Blueprint 26 of 76
Office of the Inspector General State of California
the housing units are uninhabitable and have remained closed since the OIG’s initial
report.
The OIG used a download of electronic population data to compare the current
population by security level at each institution with the security level capacities identified
in the Blueprint housing plans. The data also contained detailed information regarding
program types. This approach provided validation that the housing of inmates is
consistent with the housing plans identified in the Blueprint as the plan relates to the
inmate population levels by both housing levels and program types.
The results of the OIG’s fieldwork review during December 2014 and January 2015 are
displayed in Appendix D of this report as a statewide summary of the housing capacities
identified in the Blueprint for each institution and a statewide summary for the housing
units.
Housing Plan—Miscellaneous Benchmarks
There were several specific components identified in the Blueprint related to the
comprehensive housing plan. The following table shows those components and includes
their status resulting from the OIG’s review.
Comprehensive Housing Plan – Completion Status
Conversion of Valley State Prison for Women (VSPW)
to a male facility by the summer of 2013.
January 2013 - the conversion was completed and
the name changed to Valley State Prison (VSP).
Conversion of the former Folsom Transitional
Treatment Facility into dorms used for housing female
inmates (to be named Folsom Women’s Facility).
January 2013 - the conversion was completed for
activation of Folsom Women's Facility (FWF).
Planned closure of the California Rehabilitation Center
(CRC). The plan identified its closure to be completed
by June 2016.
Senate Bill 105 passed in September 2013
suspended the requirement to close CRC pending a
review that determines if it can be closed. This
project will continue to be monitored.
A decline in inmates eligible for the department's fire
camp population. The projected inmate population
decline was from 4,480 inmates (6/27/12) to 2,500
inmates (6/27/13). No schedule of fire camp closures
was identified.
This benchmark was changed with legislative
support. The department has been funded to restore
its previous level of fire camps and associated
inmates. The FY 2013/14 Budget Act restored its
funding to the original level, which eliminated the
need to close fire camps and reduce its inmate
population. There were 3,740 inmates housed in fire
camps as of January 31, 2015.
Blueprint Recommendation/Prison Completion Date/Current Status

Fifth Report on CDCR’s Progress Implementing the Blueprint 27 of 76
Office of the Inspector General State of California
New Construction: Two specific construction projects were underway at the department
when the Blueprint was released: the California Health Care Facility (CHCF) in Stockton
was to be activated by summer 2013, and an annex to the CHCF was being constructed.
The annex will be built over the former DeWitt Nelson Youth Correctional Facility
(DeWitt) and was planned to be completed by June 2014.
The OIG’s review found each of these construction projects were completed on schedule:
August 2013 for CHCF and March 2014 for the CHCF annex. The first inmate was
received at the CHCF annex on April 1, 2014. As of February 5, 2015, CHCF had 1,946
inmates (68 percent of design capacity) out of its 2,855 design capacity; these figures
include DeWitt’s annex, which had 548 inmates (48 percent of design capacity) out of its
1,133 design capacity. The department reports that the activation schedule will be
gradual, with full occupancy anticipated in 2015.
Health Care Facility Improvement Program (HCFIP): The Blueprint noted the health care
facility improvement program was to perform facility assessments and provide upgrades
in existing prisons to ensure adequate clinical and support service spaces were available
to meet the treatment needs of inmate-patients. These improvements were planned to
address the facility needs of outpatient medical care throughout the entire adult prison
system. The HCFIP planned to first target the intermediate care prisons where inmates
require more intensive medical care rather than general outpatient medical care.
Improvements were to focus on addressing infection control issues, such as hand-washing
facilities and the separation of clean and soiled supplies. They were also to provide the
physical separation necessary to provide inmate-patient privacy with nursing and
physician staff, as mandated by the federal Health Insurance Portability and
Accountability Act. Also, the Statewide Medication Distribution Project is part of the
HCFIP and is to remedy deficiencies in medication distribution at State prison facilities.
Based on the assessments, the department determined that HCFIP projects were needed at
31 institutions. Each of the specific HCFIP projects has been established by the State
Public Works Board and is in varying stages of design, with the estimated construction
completion dates to occur in 2016 and 2017. Also, in August 2014, the Statewide
Medication Distribution Project received approval to commence construction from the
State Fire Marshal (SFM) and the Department of Finance (DOF); pre-construction
procurement activities have begun. According to the department, as of February 2015,
approval to commence construction from the SFM and the DOF has been received for an
additional 11 sites: Avenal State Prison; California Institution for Men; California
Institution for Women; California Medical Facility; California State Prison, Los Angeles
County; California State Prison, Sacramento; California State Prison, Solano; Folsom
State Prison; Mule Creek State Prison; R.J. Donovan Correctional Facility; and Valley
State Prison. All remaining sites are progressing in the design process.
During on-site reviews, the OIG requested information on the status of two projects at
California Medical Facility (CMF) and California State Prison, Solano (SOL), since the
projected starts of construction were initially planned for July 2014. The OIG found that
SOL had begun on-site construction activities in November 2014, while CMF had not yet

Fifth Report on CDCR’s Progress Implementing the Blueprint 28 of 76
Office of the Inspector General State of California
begun construction work. The department stated the project at CMF received approvals to
commence construction from the SFM and the DOF on January 30, 2015, and is currently
in the pre-construction and bidding process. The OIG will continue to monitor the
progress of the HCFIP projects.
Infill Construction: The Blueprint identified some infill construction projects due to a
higher need for level II housing. The projects identified include the DeWitt Nelson
Correctional Annex and the construction of three new facilities to house approximately
800 inmates, each to be built at existing facilities. The status of the DeWitt Nelson
Correctional Annex is discussed above. The following provides the status of the three
other infill projects.
Senate Bill 1022 (Chapter 42, Statutes of 2012) authorized the design and construction of
three level II facilities adjacent to one or more of the following seven facilities: California
Institution for Men; California Medical Facility; California State Prison, Sacramento;
California State Prison, Solano; Folsom State Prison; Mule Creek State Prison; and the
Richard J. Donovan Correctional Facility.
The Public Works Board took action on September 11, 2012, to authorize the 800-bed
infill projects, with two slated to be built at Mule Creek State Prison (MCSP) for 1,600
beds, and one at the Richard J. Donovan Correctional Facility (RJD) for 800 beds.
However, in December 2012, the Notice of Preparation of an Environmental Impact
Report (EIR) regarding the proposed projects included proposals for evaluations at all
seven institutions. Scoping hearings took place in January 2013, and formal written
comments were due in early February 2013. The department submitted the EIR document
for public comment, and that process was completed. A Notice of Determination was
filed with the State Clearinghouse in November 2013 identifying the department’s
intention to construct two projects at MCSP and one at RJD. The design build contract
for MCSP was executed in March 2014, and the contract for RJD was executed in April
2014. According to the department, construction activities have commenced at both
locations, and inmate occupancy for both projects is anticipated for early 2016.
Contract Capacity: The Blueprint articulates the department’s plan to eliminate
out-of-state contracted inmate beds by June 30, 2016. The plan is also to reestablish up to
1,225 additional community correctional facility (CCF) beds once the out-of-state
inmates return. The Blueprint projected an out-of-state inmate population drop from
9,588 inmates on June 27, 2012, to 4,596 inmates by December 27, 2013. Population
reports show this benchmark was not met, as over 8,800 inmates were housed outside
California during this benchmark date.
In September 2013, the passage of Senate Bill 105 authorized the department to increase
its level of contracted beds both in and out of state. The bill provides an immediate
measure to avoid early release of inmates and allow the State to comply with the
three-judge court order. The bill authorized the activation of California City Correctional
Facility (CAC), a private prison located in Kern County. CAC is the first leased facility
to be operated by the department. The facility is to house 2,400 level II general

Fifth Report on CDCR’s Progress Implementing the Blueprint 29 of 76
Office of the Inspector General State of California
population inmates in celled housing. Inmates began transferring to CAC on
December 16, 2013, and as of January 31, 2015, a total of 2,024 inmates were housed
there, which is a decrease of 216 from the last OIG report, published in October 2014.
Housing inmates in public Modified Community Correctional Facilities (MCCFs) within
California, as shown in the table below, is to assist with the reduction of in-state prison
overcrowding. In December 2013, the department requested activation of 578 and 640
contracted beds with the Cities of Delano and Shafter, respectively. In March 2014, the
department activated the Taft facility with plans for up to 600 inmates. The department
also activated and increased capacity at other private MCCFs, including Central Valley,
Desert View, and Golden State. As of February 2, 2015, the department had a total of
3,679 inmates housed in its public and private MCCFs. This was a total decrease of 191
inmates from the OIG’s last report, issued in October 2014, when 3,870 inmates were
housed in MCCFs.
Modified Community Correctional Facilities (MCCF) – Bed Space25
Population Density Levels: Appendix F of the Blueprint identified some projections
regarding male inmate population density levels. Other than the projections themselves,
there are no goals or benchmarks to monitor. Based on inmate population as of
February 2, 2015, the table below compares the actual density (overcrowding) rates to the
goals for six security level bed types. Most of the rates fall within the established goal,
with the exception of the level II beds, which significantly exceed the goal by 31 percent.
This supports the department’s need to increase the number of level II beds planned at the
infill construction at MCSP and RJD. Also, the activation of CAC will assist the
department in lowering its overcrowding rate. Per the following chart, the overcrowding
rate for level II housing will also be aided by the additional 2,400 beds from the infill
projects.
25
The figures for the MCCFs do not include the other in-state contract beds, which include the Female
Community Reentry Facility (260-bed facility), Female Rehabilitative Community Correctional Center
(75-bed facility), and Community Prisoner Mother Program (24-bed facility).
Modified Community
Correctional Facility Type Bed Capacity
Population as
of 2/2/15
Delano Public 578 531
Shafter Public 640 573
Taft Public 600 587
Central Valley Private 700 674
Desert View Private 700 647
Golden State Private 700 667
3,918 3,679 Totals

Fifth Report on CDCR’s Progress Implementing the Blueprint 30 of 76
Office of the Inspector General State of California
Actual Density (Overcrowding) Rates in Comparison to Blueprint Design Beds
Housing Plan—Global Benchmarks
The Blueprint noted the department was under federal court order to reduce overall
prison overcrowding to 137.5 percent of design-bed capacity by June 2013.
Subsequently, the department was granted an extension to April 18, 2014, to reach that
goal. After appeals of the order by the department, the three-judge court granted a
two-year extension to February 28, 2016. Additionally, on July 3, 2014, the three-judge
court extended the 143 percent benchmark deadline from June 30, 2014, to
August 31, 2014. The order required the department to reduce its prison population in
three stages; the two remaining benchmarks are as follows:
1) 141.5 percent of design capacity by February 28, 2015; and
2) 137.5 percent of design capacity by February 28, 2016.
In September 2014, the department submitted its status and benchmark report to the
three-judge court supporting that it had met the 143 percent benchmark. The OIG
reviewed the department’s monthly population report as of February 28, 2015, the date of
the current benchmark. The department had an in-state prison population of 112,531
housed in the State’s 34 adult institutions with a design bed capacity of 82,707, which
amounts to 136.1 percent of design bed capacity. This figure is below the 141.5 percent
court-ordered reduction required by February 28, 2015 (and the February 28, 2016,
benchmark of 137.5 percent). Future OIG reports will continue indicating whether the
department has met the remaining benchmarks.
Bed Type
Blueprint Design
Beds
Population as
of 2/2/15
Actual
Overcrowding
Rate
Blueprint
Overcrowding
Rate Goal
Level I Dorm 8,283 6,916 83% 150%
Level II Dorm & Cell 22,908 41,375 181% 150%
Level III Cell 16,584 18,478 111% 150%
Level IV Cell 13,124 21,489 164% 150%
Administrative Segregation Unit 5,601 5,288 94% 125%
Security Housing Unit 2,934 3,455 118% 120%

Fifth Report on CDCR’s Progress Implementing the Blueprint 31 of 76
Office of the Inspector General State of California
CONCLUSION
On a positive note, the department has met its Blueprint goals in standardized staffing,
and is progressing to meet its goal in its application of the new inmate classification score
system, which presumably will continue to translate into cost savings for the State. The
department is also adhering to the comprehensive housing plan and construction goals set
in the Blueprint, though the OIG will continue to monitor a few large-scale construction
projects remaining to be completed. Recently, the department met its benchmark to
reduce prison overcrowding to 141.5 percent by February 28, 2015. The department has
been addressing its in-state prison overcrowding with the activation of a California City
Correctional Facility and increased capacity at public and private Modified Community
Correctional Facilities as well as ongoing in-fill projects. These contracts will presumably
offset savings gained elsewhere.
The department has shown progress within certain areas in meeting its rehabilitative
benchmarks and improving results in its new security threat group (STG) step-down
program policy. The department implemented all programs at its reentry hubs, excluding
High Desert State Prison’s pre-employment transitions programs by February 2015. The
biggest challenge remains increasing the percentage of inmates served in rehabilitative
programs to 70 percent of its target population by June 30, 2015. The department is
showing gradual progress with a 9 percent increase to 54 percent during the first two
quarters of fiscal year 2014–15, but at its current pace, the target likely will not be met
during the current fiscal year. This figure represents the department’s target population
that is having either all its rehabilitative needs met or at least one identified need met.
However, the OIG still recommends that if the department uses “the presence of an
inmate in one program for one day” as the definition for successfully meeting a
rehabilitative need, then the department should provide statistics showing the actual
amount of time spent in programs for the inmates being counted.
The OIG found that 89 percent of the academic education programs are operational,
which represents no percentage change from the last report. The OIG found that
76 percent of the career technical education programs are operational, which represents a
4 percent decrease from the last report. The OIG also found that 88 percent of the
substance abuse treatment slots are filled, which represents a 16 percent increase from the
last report. An even more significant increase was found in the cognitive behavioral
treatment slots, which increased by 44 percent to 88 percent compliance from the last
report. Additionally, even though this report shows no percentage change in education
and a small decrease in career technical education programming, overall, since the
Blueprint began, the overall number of program opportunities and participation has risen
significantly. In total, the department has increased its academic positions by 49 to 467
from the department’s staffing of 418 positions as of the Blueprint report. The number of
CTE positions has increased by 33 to 215 from the department’s staffing of 182 positions
as of the Blueprint report. So while full utilization is not yet at 100 percent, capacity in all
areas continues to grow.

Fifth Report on CDCR’s Progress Implementing the Blueprint 32 of 76
Office of the Inspector General State of California
Also, regarding enhanced programming facilities (EPFs), the OIG found some inmates,
i.e., SHU “kick-outs,” are being transferred to EPFs, until adequate level IV bed space
becomes available. These inmates do not meet the criteria for EPF placement, but without
adequate bed space, the classification committee and classification staff representative
are compelled to utilize EPFs for temporary housing despite the requirement that EPFs
only be used for inmates with a willingness to meet programming expectations. Since the
intent of the EPFs is to incentivize and reinforce positive life choices, allowing other
non-eligible inmates defeats the purpose of the program. The department has pledged to
examine this issue with input from the affected facilities and find solutions to the housing
problem that will not adversely impact the success of the EPF program.
The department has conducted 1,070 case-by-case reviews after 27 months since its gang
management pilot began in October 2012. This represents 40 percent of its total STG
population (2,692 inmates) who were validated prior to March 1, 2013. This represents an
increase of 132 case-by-case reviews identified in the OIG’s prior report. The OIG
estimates at its current rate, the department will take until February 2019 to complete all
reviews. Although there were no benchmarks identified in the Blueprint or STG pilot
program to complete a specific number or percentage of case-by-case reviews, a more
rapid pace of reviews may have been expected by the Legislature and stakeholders.
The department’s Special Project Team (SPT) was tasked with developing the new
Security Threat Group (STG) management policy, implementing a 24-month pilot
program, creating new procedures and regulations, providing staff training, addressing
legal and legislative issues, and conducting active/inactive reviews (six-year inactive
reviews). According to the SPT, each of these items impacted the DRB’s ability to
accelerate its case-by-case reviews. The SPT has initiated training of two current wardens
to provide options to expand the inactive or case-by-case review process. The SPT is
hopeful that the DRB will be able to conclude all reviews within the next 12 to 18
months, but that is dependent on no additional responsibilities arising during this time
frame.
Additionally, although almost half (48 percent) of STG inmates showed progress once
they were placed within the step-down program, almost the same percentage of inmates
(42 percent) may remain in the program beyond the four-year period (by plateauing in
step 1 or 2) before earning their release to general population due to refusal to participate.
The OIG found that refusing, or having an inability to participate in journaling, was
considered an exception for at least one inmate. In this example, the department
considered the inmate’s low Test of Adult Basic Education (TABE) score in its decision
to progress an inmate to step 5 who did not complete required journaling while in step 4.
As mentioned in its prior report, the OIG supports the department in obtaining and
evaluating reasons for an inmate’s refusal and considering allowance of other
modifications to achieve full success with this program; however, the department should
be consistent in its application to all inmates. The OIG will continue to consult with the
department in these areas with a shared interest in achieving the goals set out in the
Blueprint.

Fifth Report on CDCR’s Progress Implementing the Blueprint 33 of 76
Office of the Inspector General State of California
APPENDICES
Appendix A — Programming Plans
Appendix B — Core COMPAS Assessments
Appendix C — Standardized Staffing
Appendix D — Housing Plans

Fifth Report on CDCR’s Progress Implementing the Blueprint 34 of 76
Office of the Inspector General State of California
Appendix A—Programming Plans
The following pages display the information the OIG summarized after assessing whether
the department has implemented the rehabilitation programs scheduled to be underway in
fiscal year 2014–15 as identified by the department. The OIG performed the fieldwork to
assess the operational status of each program at each institution.
The information displayed in the following page identifies the statewide operational
status of the rehabilitation programs in summary format for each type of program. An
individual page for each prison is provided after the summary page. The first columns
identify the numbers in terms of teacher positions and the numbers in terms of
student-inmates as they were identified by the department. As described earlier, the
numbers were allowed to be changed as long as they met the total departmental numbers.
The next set of columns displays the results of the OIG fieldwork identifying the number
of programs that were actually fully operational when the fieldwork was performed. The
last set of columns identifies the differences between the number of courses that were
supposed to be operational (and related available inmates served) and the number of
courses that the OIG actually found to be operational during the site visits.
The fieldwork performed in this exercise was conducted from December 2014 through
January 2015. Therefore, the numbers may have changed since the time of the report.
Additionally, some of the detail of the specific courses may have changed from
institution to institution, but the departmental totals in terms of scheduled courses still
match the original Blueprint numbers.

Fifth Report on CDCR’s Progress Implementing the Blueprint 35 of 76
Office of the Inspector General State of California
APPENDIX A — PROGRAMMING PLANS
STATEWIDE SUMMARY TOTALS - REHABILITATION PROGRAMS
CDCR Figures Actuals Differences
Academic Education
Proposed
Staff
Budgeted
Capacity
Actual Staff
(Programs)
Actual
Student
Capacity Differences Differences
General Population 310 16,740 284 14,854 -26 -1,886
Alternative Programming 10 540 10 540 0 0
Voluntary Educ. Program 203 24,360 173 20,729 -30 -3,631
TOTALS 523 41,640 467 36,123 -56 -5,517
Career Technical
Education
Proposed
Staff
Budgeted
Capacity
Actual Staff
(Programs)
Actual
Student
Capacity Differences Differences
Auto Mechanics 18 486 14 324 -4 -162
Auto Repair 15 405 13 324 -2 -81
Building Maintenance 26 702 19 486 -7 -216
Carpentry 16 432 12 324 -4 -108
Computer Literacy * 31 1,620 26 1,363 -5 -257
Cosmetology 3 81 3 81 0 0
Electric Work 19 513 13 378 -6 -135
Electronics 34 918 25 702 -9 -216
HVAC 15 405 9 243 -6 -162
Machine Shop 4 108 2 54 -2 -54
Masonry 15 405 13 351 -2 -54
Office Technologies 43 1,161 35 945 -8 -216
Painting 3 81 0 0 -3 -81
Plumbing 10 270 8 216 -2 -54
Roofing 1 27 0 0 -1 -27
Sheet Metal 1 27 1 27 0 0
Small Engine Repair 10 270 7 175 -3 -95
Welding 19 513 15 405 -4 -108
TBD 0 0 0 0 0 0
TOTALS 283 8,424 215 6,398 -68 -2,026
Contract Treatment
Programs
Student
Capacity
(/Program)
Student
Capacity
(Annual)
Actual
Students in
Program
Annual
Student
Capacity
(Projected) Differences Differences
Substance Abuse 1,536 3,072 1,359 2,737 -177 -335
Cognitive-Behavioral 2,328 7,728 2,044 6,753 -284 -975
TOTALS 3,864 10,800 3,403 9,490 -461 -1,310
Employment Programs
Program
Slots
Annual
Served
Inmates
Served
(Actual)
Annual
Served
(Projected) Differences Differences
Transitions Program 750 6,750 389 3,537 -361 -3,213
TOTALS 750 6,750 389 3,537 -361 -3,213
* The computer literacy slots were adjusted to account for a morning and afternoon session. The slots were reported in the Blueprint as
only available once per day for most classes so the adjustment doubled the slot amount for numerous classes.
(Actuals - Final)FY 14-15
December 2014 -
January 2015
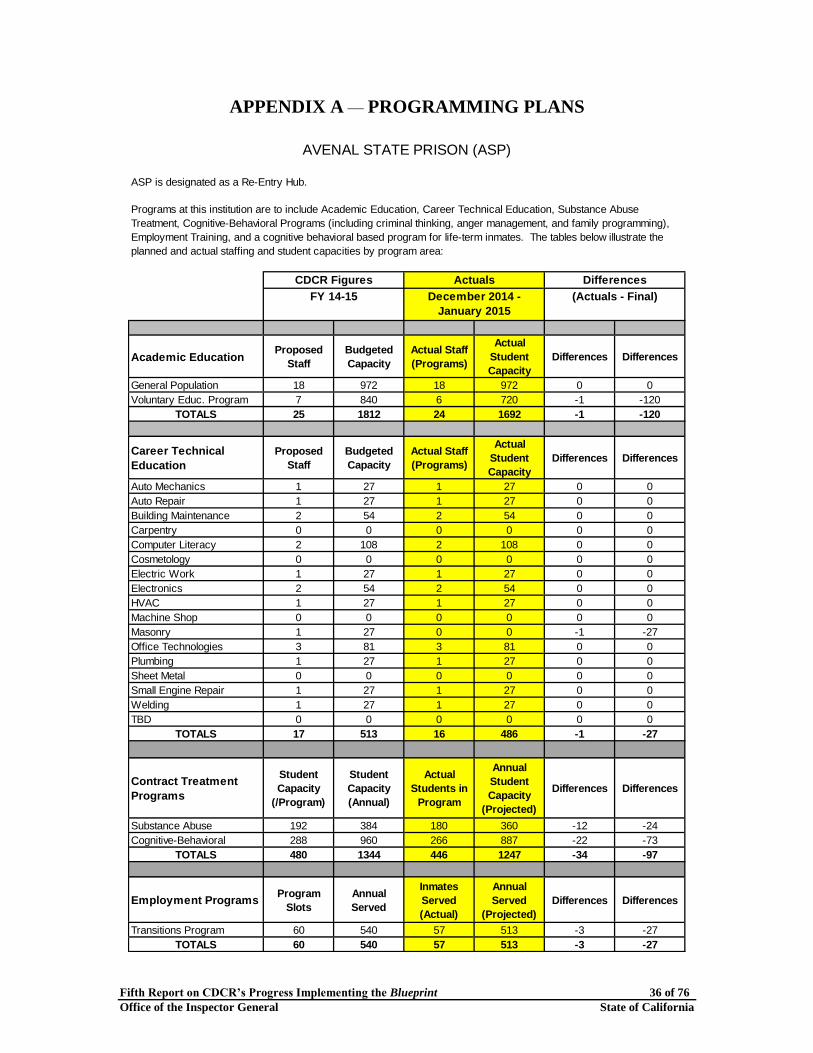
Fifth Report on CDCR’s Progress Implementing the Blueprint 36 of 76
Office of the Inspector General State of California
APPENDIX A — PROGRAMMING PLANS
CDCR Figures Actuals Differences
Academic EducationProposed
Staff
Budgeted
Capacity
Actual Staff
(Programs)
Actual
Student
Capacity
Differences Differences
General Population 18 972 18 972 0 0
Voluntary Educ. Program 7 840 6 720 -1 -120
TOTALS 25 1812 24 1692 -1 -120
Career Technical
Education
Proposed
Staff
Budgeted
Capacity
Actual Staff
(Programs)
Actual
Student
Capacity
Differences Differences
Auto Mechanics 1 27 1 27 0 0
Auto Repair 1 27 1 27 0 0
Building Maintenance 2 54 2 54 0 0
Carpentry 0 0 0 0 0 0
Computer Literacy 2 108 2 108 0 0
Cosmetology 0 0 0 0 0 0
Electric Work 1 27 1 27 0 0
Electronics 2 54 2 54 0 0
HVAC 1 27 1 27 0 0
Machine Shop 0 0 0 0 0 0
Masonry 1 27 0 0 -1 -27
Office Technologies 3 81 3 81 0 0
Plumbing 1 27 1 27 0 0
Sheet Metal 0 0 0 0 0 0
Small Engine Repair 1 27 1 27 0 0
Welding 1 27 1 27 0 0
TBD 0 0 0 0 0 0
TOTALS 17 513 16 486 -1 -27
Contract Treatment
Programs
Student
Capacity
(/Program)
Student
Capacity
(Annual)
Actual
Students in
Program
Annual
Student
Capacity
(Projected)
Differences Differences
Substance Abuse 192 384 180 360 -12 -24
Cognitive-Behavioral 288 960 266 887 -22 -73
TOTALS 480 1344 446 1247 -34 -97
Employment ProgramsProgram
Slots
Annual
Served
Inmates
Served
(Actual)
Annual
Served
(Projected)
Differences Differences
Transitions Program 60 540 57 513 -3 -27
TOTALS 60 540 57 513 -3 -27
AVENAL STATE PRISON (ASP)
ASP is designated as a Re-Entry Hub.
FY 14-15
Programs at this institution are to include Academic Education, Career Technical Education, Substance Abuse
Treatment, Cognitive-Behavioral Programs (including criminal thinking, anger management, and family programming),
Employment Training, and a cognitive behavioral based program for life-term inmates. The tables below illustrate the
planned and actual staffing and student capacities by program area:
December 2014 -
January 2015
(Actuals - Final)

Fifth Report on CDCR’s Progress Implementing the Blueprint 37 of 76
Office of the Inspector General State of California
APPENDIX A — PROGRAMMING PLANS
CDCR Figures Actuals Differences
Academic EducationProposed
Staff
Budgeted
Capacity
Actual Staff
(Programs)
Actual
Student
Capacity
Differences Differences
General Population 2 108 2 108 0 0
Alternative Programming 1 54 0 0 -1 -54
Voluntary Educ. Program 4 480 3 360 -1 -120
TOTALS 7 642 5 468 -2 -174
Career Technical
Education
Proposed
Staff
Budgeted
Capacity
Actual Staff
(Programs)
Actual
Student
Capacity
Differences Differences
Auto Mechanics 0 0 0 0 0 0
Auto Repair 0 0 0 0 0 0
Building Maintenance 0 0 0 0 0 0
Carpentry 0 0 0 0 0 0
Computer Literacy 1 54 1 54 0 0
Cosmetology 0 0 0 0 0 0
Electric Work 0 0 0 0 0 0
Electronics 1 27 1 27 0 0
HVAC 0 0 0 0 0 0
Machine Shop 0 0 0 0 0 0
Masonry 0 0 0 0 0 0
Office Services and Related
Technology
0 0 0 0 0 0
Plumbing 0 0 0 0 0 0
Sheet Metal 0 0 0 0 0 0
Small Engine Repair 0 0 0 0 0 0
Welding 0 0 0 0 0 0
TBD 0 0 0 0 0 0
TOTALS 2 81 2 81 0 0
CALIFORNIA CITY CORRECTIONAL CENTER (CAC)
CAC was activated as a Standard Program Site in December 2013.
Programs at this institution are to include Academic Education and Career Technical Education. The tables below
illustrate the planned and actual staffing and student capacities by program area:
FY 14-15 December 2014 -
January 2015
(Actuals - Final)

Fifth Report on CDCR’s Progress Implementing the Blueprint 38 of 76
Office of the Inspector General State of California
APPENDIX A — PROGRAMMING PLANS
CDCR Figures Actuals Differences
Academic EducationProposed
Staff
Budgeted
Capacity
Actual Staff
(Programs)
Actual
Student
Capacity
Differences Differences
General Population 10 540 9 396 -1 -144
Voluntary Educ. Program 3 360 4 480 1 120
TOTALS 13 900 13 876 0 -24
Career Technical
Education
Proposed
Staff
Budgeted
Capacity
Actual Staff
(Programs)
Actual
Student
Capacity
Differences Differences
Auto Mechanics 1 27 1 27 0 0
Auto Repair 1 27 1 27 0 0
Building Maintenance 1 27 1 27 0 0
Carpentry 0 0 0 0 0 0
Computer Literacy 0 0 0 0 0 0
Cosmetology 0 0 0 0 0 0
Electric Work 1 27 1 27 0 0
Electronics 1 27 1 27 0 0
HVAC 1 27 1 27 0 0
Machine Shop 0 0 0 0 0 0
Masonry 0 0 0 0 0 0
Office Technologies 1 27 1 27 0 0
Plumbing 0 0 0 0 0 0
Sheet Metal 0 0 0 0 0 0
Small Engine Repair 0 0 0 0 0 0
Welding 1 27 1 27 0 0
TBD 0 0 0 0 0 0
TOTALS 8 216 8 216 0 0
CCC is designated as a Standard Program Site.
CALIFORNIA CORRECTIONAL CENTER (CCC)
Programs at this institution are to include Academic Education and Career Technical Education. The tables below
illustrate the planned and actual staffing and student capacities by program area:
(Actuals - Final)FY 14-15 December 2014 -
January 2015

Fifth Report on CDCR’s Progress Implementing the Blueprint 39 of 76
Office of the Inspector General State of California
APPENDIX A — PROGRAMMING PLANS
CDCR Figures Actuals Differences
Academic EducationProposed
Staff
Budgeted
Capacity
Actual Staff
(Programs)
Actual
Student
Capacity
Differences Differences
General Population 10 540 8 432 -2 -108
Voluntary Educ. Program 9 1080 8 960 -1 -120
TOTALS 19 1620 16 1392 -3 -228
Career Technical
Education
Proposed
Staff
Budgeted
Capacity
Actual Staff
(Programs)
Actual
Student
Capacity
Differences Differences
Auto Mechanics 2 54 2 0 0 -54
Auto Repair 1 27 1 0 0 -27
Building Maintenance 1 27 1 0 0 -27
Carpentry 1 27 1 27 0 0
Computer Literacy 0 0 0 0 0 0
Cosmetology 0 0 0 0 0 0
Electric Work 0 0 0 0 0 0
Electronics 2 54 2 54 0 0
HVAC 1 27 0 0 -1 -27
Machine Shop 0 0 0 0 0 0
Masonry 0 0 0 0 0 0
Office Technologies 2 54 2 54 0 0
Plumbing 0 0 0 0 0 0
Sheet Metal 0 0 0 0 0 0
Small Engine Repair 0 0 0 0 0 0
Welding 1 27 1 27 0 0
TBD 0 0 0 0 0 0
TOTALS 11 297 10 162 -1 -135
CALIFORNIA CORRECTIONAL INSTITUTION (CCI)
Programs at this institution are to include Academic Education and Career Technical Education. The tables below
illustrate the planned and actual staffing and student capacities by program area (programs have been minimally
updated since the change in designation):
CCI was designated as a Standard Program Site on 12/4/12 although it was originally designated as a Re-Entry Hub.
FY 14-15 December 2014 -
January 2015
(Actuals - Final)

Fifth Report on CDCR’s Progress Implementing the Blueprint 40 of 76
Office of the Inspector General State of California
APPENDIX A — PROGRAMMING PLANS
CDCR Figures Actuals Differences
Academic EducationProposed
Staff
Budgeted
Capacity
Actual Staff
(Programs)
Actual
Student
Capacity
Differences Differences
General Population 6 324 2 108 -4 -216
Voluntary Educ. Program 3 360 2 240 -1 -120
TOTALS 9 684 4 348 -5 -336
Career Technical
Education
Proposed
Staff
Budgeted
Capacity
Actual Staff
(Programs)
Actual
Student
Capacity
Differences Differences
Auto Mechanics 0 0 0 0 0 0
Auto Repair 0 0 0 0 0 0
Building Maintenance 0 0 0 0 0 0
Carpentry 0 0 0 0 0 0
Computer Literacy 2 108 2 54 0 -54
Cosmetology 0 0 0 0 0 0
Electric Work 0 0 0 0 0 0
Electronics 0 0 0 0 0 0
HVAC 0 0 0 0 0 0
Machine Shop 0 0 0 0 0 0
Masonry 0 0 0 0 0 0
Office Technologies 0 0 0 0 0 0
Plumbing 0 0 0 0 0 0
Sheet Metal 0 0 0 0 0 0
Small Engine Repair 0 0 0 0 0 0
Welding 0 0 0 0 0 0
TBD 0 0 0 0 0 0
TOTALS 2 108 2 54 0 -54
CALIFORNIA HEALTH CARE FACILITY (CHCF)
Programs at this institution are to include Academic Education and Career Technical Education. The tables below
illustrate the planned and actual staffing and student capacities by program area:
(Actuals - Final)
CHCF is designated as a Standard Program Site. It was recently activated in July
FY 14-15 December 2014 -
January 2015
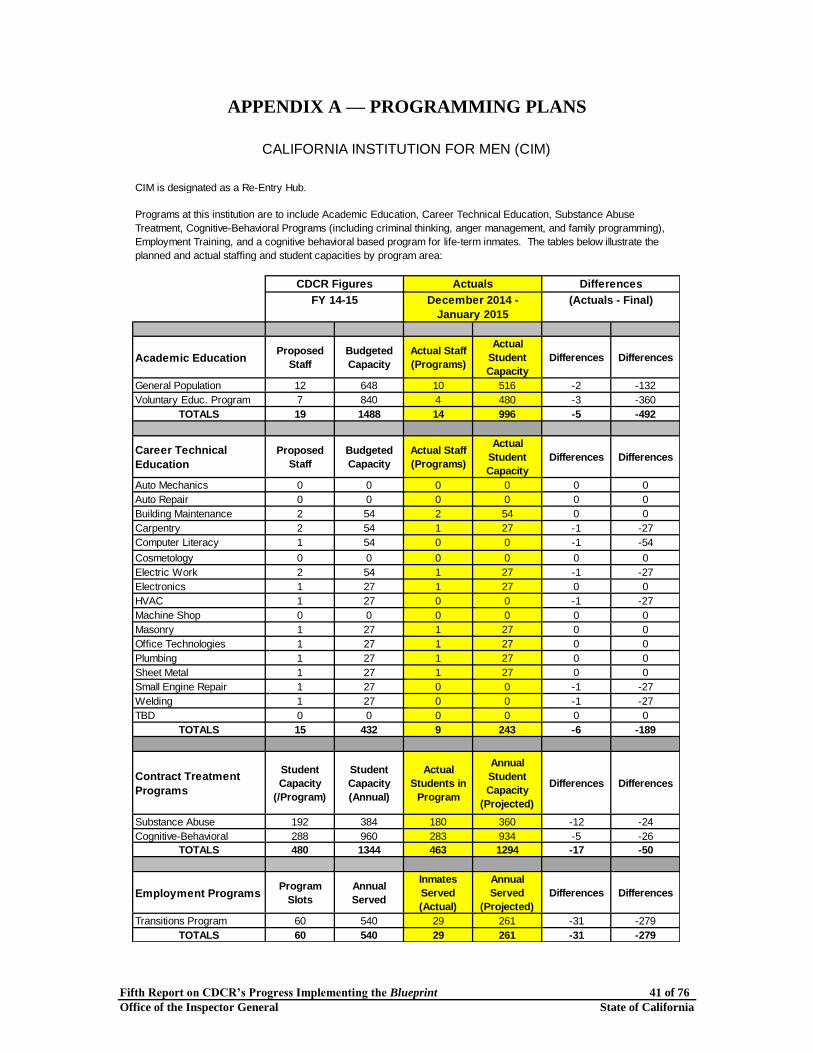
Fifth Report on CDCR’s Progress Implementing the Blueprint 41 of 76
Office of the Inspector General State of California
APPENDIX A — PROGRAMMING PLANS
CDCR Figures Actuals Differences
Academic EducationProposed
Staff
Budgeted
Capacity
Actual Staff
(Programs)
Actual
Student
Capacity
Differences Differences
General Population 12 648 10 516 -2 -132
Voluntary Educ. Program 7 840 4 480 -3 -360
TOTALS 19 1488 14 996 -5 -492
Career Technical
Education
Proposed
Staff
Budgeted
Capacity
Actual Staff
(Programs)
Actual
Student
Capacity
Differences Differences
Auto Mechanics 0 0 0 0 0 0
Auto Repair 0 0 0 0 0 0
Building Maintenance 2 54 2 54 0 0
Carpentry 2 54 1 27 -1 -27
Computer Literacy 1 54 0 0 -1 -54
Cosmetology 0 0 0 0 0 0
Electric Work 2 54 1 27 -1 -27
Electronics 1 27 1 27 0 0
HVAC 1 27 0 0 -1 -27
Machine Shop 0 0 0 0 0 0
Masonry 1 27 1 27 0 0
Office Technologies 1 27 1 27 0 0
Plumbing 1 27 1 27 0 0
Sheet Metal 1 27 1 27 0 0
Small Engine Repair 1 27 0 0 -1 -27
Welding 1 27 0 0 -1 -27
TBD 0 0 0 0 0 0
TOTALS 15 432 9 243 -6 -189
Contract Treatment
Programs
Student
Capacity
(/Program)
Student
Capacity
(Annual)
Actual
Students in
Program
Annual
Student
Capacity
(Projected)
Differences Differences
Substance Abuse 192 384 180 360 -12 -24
Cognitive-Behavioral 288 960 283 934 -5 -26
TOTALS 480 1344 463 1294 -17 -50
Employment ProgramsProgram
Slots
Annual
Served
Inmates
Served
(Actual)
Annual
Served
(Projected)
Differences Differences
Transitions Program 60 540 29 261 -31 -279
TOTALS 60 540 29 261 -31 -279
CIM is designated as a Re-Entry Hub.
CALIFORNIA INSTITUTION FOR MEN (CIM)
Programs at this institution are to include Academic Education, Career Technical Education, Substance Abuse
Treatment, Cognitive-Behavioral Programs (including criminal thinking, anger management, and family programming),
Employment Training, and a cognitive behavioral based program for life-term inmates. The tables below illustrate the
planned and actual staffing and student capacities by program area:
(Actuals - Final)FY 14-15 December 2014 -
January 2015

Fifth Report on CDCR’s Progress Implementing the Blueprint 42 of 76
Office of the Inspector General State of California
APPENDIX A — PROGRAMMING PLANS
CDCR Figures Actuals Differences
Academic EducationProposed
Staff
Budgeted
Capacity
Actual Staff
(Programs)
Actual
Student
Capacity
Differences Differences
General Population 8 432 6 324 -2 -108
Voluntary Educ. Program 2 240 4 480 2 240
TOTALS 10 672 10 804 0 132
Career Technical
Education
Proposed
Staff
Budgeted
Capacity
Actual Staff
(Programs)
Actual
Student
Capacity
Differences Differences
Auto Mechanics 0 0 0 0 0 0
Auto Repair 0 0 0 0 0 0
Building Maintenance 1 27 1 27 0 0
Carpentry 0 0 0 0 0 0
Computer Literacy 0 0 1 54 1 54
Cosmetology 1 27 1 27 0 0
Electric Work 0 0 0 0 0 0
Electronics 1 27 1 27 0 0
HVAC 0 0 0 0 0 0
Machine Shop 0 0 0 0 0 0
Masonry 0 0 0 0 0 0
Office Technologies 2 54 1 27 -1 -27
Plumbing 0 0 0 0 0 0
Sheet Metal 0 0 0 0 0 0
Small Engine Repair 0 0 0 0 0 0
Welding 0 0 0 0 0 0
TBD 0 0 0 0 0 0
TOTALS 5 135 5 162 0 27
Contract Treatment
Programs
Student
Capacity
(/Program)
Student
Capacity
(Annual)
Actual
Students in
Program
Annual
Student
Capacity
(Projected)
Differences Differences
Substance Abuse 96 192 96 192 0 0
Cognitive-Behavioral 120 384 120 384 0 0
TOTALS 216 576 216 576 0 0
Employment ProgramsProgram
Slots
Annual
Served
Inmates
Served
(Actual)
Annual
Served
(Projected)
Differences Differences
Transitions Program 60 540 30 270 -30 -270
TOTALS 60 540 30 270 -30 -270
CALIFORNIA INSTITUTION FOR WOMEN (CIW)
Programs at this institution are to include Academic Education, Career Technical Education, Substance
Abuse Treatment, Cognitive-Behavioral Programs (including criminal thinking, anger management, and family
programming), Employment Training, and a cognitive behavioral based program for life-term inmates. The
tables below illustrate the planned and actual staffing and student capacities by program area:
FY 14-15 December 2014 -
January 2015
CIW is designated as a Re-Entry Hub.
(Actuals - Final)

Fifth Report on CDCR’s Progress Implementing the Blueprint 43 of 76
Office of the Inspector General State of California
APPENDIX A — PROGRAMMING PLANS
CDCR Figures Actuals Differences
Academic EducationProposed
Staff
Budgeted
Capacity
Actual Staff
(Programs)
Actual
Student
Capacity
Differences Differences
General Population 3 162 3 162 0 0
Voluntary Educ. Program 4 480 4 480 0 0
TOTALS 7 642 7 642 0 0
Career Technical
Education
Proposed
Staff
Budgeted
Capacity
Actual Staff
(Programs)
Actual
Student
Capacity
Differences Differences
Auto Mechanics 0 0 0 0 0 0
Auto Repair 0 0 0 0 0 0
Building Maintenance 0 0 0 0 0 0
Carpentry 0 0 0 0 0 0
Computer Literacy 0 0 1 27 1 27
Cosmetology 0 0 0 0 0 0
Electric Work 0 0 0 0 0 0
Electronics 1 27 0 0 -1 -27
HVAC 0 0 0 0 0 0
Machine Shop 0 0 0 0 0 0
Masonry 0 0 0 0 0 0
Office Technologies 1 27 1 27 0 0
Plumbing 0 0 0 0 0 0
Sheet Metal 0 0 0 0 0 0
Small Engine Repair 0 0 0 0 0 0
Welding 0 0 0 0 0 0
TBD 0 0 0 0 0 0
TOTALS 2 54 2 54 0 0
CMF is designated as a Standard Program Site.
CALIFORNIA MEDICAL FACILITY (CMF)
Programs at this institution are to include Academic Education and Career Technical Education. The tables below
illustrate the planned and actual staffing and student capacities by program area:
(Actuals - Final)FY 14-15 December 2014 -
January 2015

Fifth Report on CDCR’s Progress Implementing the Blueprint 44 of 76
Office of the Inspector General State of California
APPENDIX A — PROGRAMMING PLANS
CDCR Figures Actuals Differences
Academic EducationProposed
Staff
Budgeted
Capacity
Actual Staff
(Programs)
Actual
Student
Capacity
Differences Differences
General Population 9 486 13 712 4 226
Alternative Programming 0 0 1 54 1 54
Voluntary Educ. Program 9 1080 8 960 -1 -120
TOTALS 18 1566 22 1726 4 160
Career Technical
Education
Proposed
Staff
Budgeted
Capacity
Actual Staff
(Programs)
Actual
Student
Capacity
Differences Differences
Auto Mechanics 1 27 1 27 0 0
Auto Repair 1 27 1 27 0 0
Building Maintenance 1 27 0 0 -1 -27
Carpentry 0 0 0 0 0 0
Computer Literacy 1 27 1 54 0 27
Cosmetology 0 0 0 0 0 0
Electric Work 1 27 1 27 0 0
Electronics 1 27 1 27 0 0
HVAC 1 27 0 0 -1 -27
Machine Shop 1 27 0 0 -1 -27
Masonry 1 27 1 27 0 0
Office Technologies 2 54 2 54 0 0
Plumbing 0 0 0 0 0 0
Sheet Metal 0 0 0 0 0 0
Small Engine Repair 0 0 0 0 0 0
Welding 1 27 0 0 -1 -27
TBD 0 0 0 0 0 0
TOTALS 12 324 8 243 -4 -81
Contract Treatment
Programs
Student
Capacity
(/Program)
Student
Capacity
(Annual)
Actual
Students in
Program
Annual
Student
Capacity
(Projected)
Differences Differences
Substance Abuse 72 144 72 144 0 0
Cognitive-Behavioral 144 480 144 480 0 0
TOTALS 216 624 216 624 0 0
Employment ProgramsProgram
Slots
Annual
Served
Inmates
Served
(Actual)
Annual
Served
(Projected)
Differences Differences
Transitions Program 60 540 30 270 -30 -270
TOTALS 60 540 30 270 -30 -270
CMC is designated as a Re-Entry Hub.
CALIFORNIA MEN'S COLONY (CMC)
Programs at this institution are to include Academic Education, Career Technical Education, Substance Abuse
Treatment, Cognitive-Behavioral Programs (including criminal thinking, anger management, and family programming),
Employment Training, and a cognitive behavioral based program for life-term inmates. The tables below illustrate the
planned and actual staffing and student capacities by program area:
(Actuals - Final)FY 14-15 December 2014 -
January 2015

Fifth Report on CDCR’s Progress Implementing the Blueprint 45 of 76
Office of the Inspector General State of California
APPENDIX A — PROGRAMMING PLANS
CDCR Figures Actuals Differences
Academic EducationProposed
Staff
Budgeted
Capacity
Actual Staff
(Programs)
Actual
Student
Capacity
Differences Differences
General Population 11 594 9 486 -2 -108
Voluntary Educ. Program 4 480 3 360 -1 -120
TOTALS 15 1074 12 846 -3 -228
Career Technical
Education
Proposed
Staff
Budgeted
Capacity
Actual Staff
(Programs)
Actual
Student
Capacity
Differences Differences
Auto Mechanics 1 27 1 27 0 0
Auto Repair 0 0 0 0 0 0
Building Maintenance 0 0 0 0 0 0
Carpentry 1 27 1 27 0 0
Computer Literacy 1 54 1 54 0 0
Cosmetology 0 0 0 0 0 0
Electric Work 1 27 0 27 -1 0
Electronics 1 27 0 27 -1 0
HVAC 1 27 1 27 0 0
Machine Shop 0 0 0 0 0 0
Masonry 0 0 0 0 0 0
Office Technologies 2 54 2 54 0 0
Plumbing 1 27 1 27 0 0
Sheet Metal 0 0 0 0 0 0
Small Engine Repair 0 0 0 0 0 0
Welding 0 0 0 0 0 0
TBD 0 0 0 0 0 0
TOTALS 9 270 7 270 -2 0
CALIFORNIA REHABILITATION CENTER (CRC)
Programs at this institution are to include Academic Education, Career Technical Education, Substance Abuse
Treatment, Cognitive-Behavioral Programs (including criminal thinking, anger management, and family programming),
Employment Training, and a cognitive behavioral based program for life-term inmates. The tables below illustrate the
planned and actual staffing and student capacities by program area:
(Actuals - Final)
CRC was designated as a Standard Program Site on 9/20/13 although it was originally designated as a Re-Entry Hub.
FY 14-15 December 2014 -
January 2015

Fifth Report on CDCR’s Progress Implementing the Blueprint 46 of 76
Office of the Inspector General State of California
APPENDIX A — PROGRAMMING PLANS
CDCR Figures Actuals Differences
Academic EducationProposed
Staff
Budgeted
Capacity
Actual Staff
(Programs)
Actual
Student
Capacity
Differences Differences
General Population 9 486 10 540 1 54
Alternative Programming 3 162 3 162 0 0
Voluntary Educ. Program 5 600 5 600 0 0
TOTALS 17 1248 18 1302 1 54
Career Technical
Education
Proposed
Staff
Budgeted
Capacity
Actual Staff
(Programs)
Actual
Student
Capacity
Differences Differences
Auto Mechanics 0 0 0 0 0 0
Auto Repair 0 0 0 0 0 0
Building Maintenance 1 27 0 0 -1 -27
Carpentry 0 0 0 0 0 0
Computer Literacy 0 0 0 0 0 0
Cosmetology 0 0 0 0 0 0
Electric Work 0 0 0 0 0 0
Electronics 1 27 0 0 -1 -27
HVAC 0 0 0 0 0 0
Machine Shop 1 27 1 27 0 0
Masonry 0 0 0 0 0 0
Office Technologies 2 54 2 54 0 0
Plumbing 0 0 0 0 0 0
Sheet Metal 0 0 0 0 0 0
Small Engine Repair 1 27 0 0 -1 -27
Welding 0 0 1 27 1 27
TBD 0 0 0 0 0 0
TOTALS 6 162 4 108 -2 -54
CALIFORNIA STATE PRISON, CORCORAN (COR)
Programs at this institution are to include Academic Education and Career Technical Education. The tables below
illustrate the planned and actual staffing and student capacities by program area:
(Actuals - Final)FY 14-15 December 2014 -
January 2015
COR is designated as a Standard Program Site.

Fifth Report on CDCR’s Progress Implementing the Blueprint 47 of 76
Office of the Inspector General State of California
APPENDIX A — PROGRAMMING PLANS
CDCR Figures Actuals Differences
Academic EducationProposed
Staff
Budgeted
Capacity
Actual Staff
(Programs)
Actual
Student
Capacity
Differences Differences
General Population 7 378 7 378 0 0
Voluntary Educ. Program 5 600 5 600 0 0
TOTALS 12 978 12 978 0 0
Career Technical
Education
Proposed
Staff
Budgeted
Capacity
Actual Staff
(Programs)
Actual
Student
Capacity
Differences Differences
Auto Mechanics 0 0 0 0 0 0
Auto Repair 0 0 0 0 0 0
Building Maintenance 0 0 0 0 0 0
Carpentry 0 0 0 0 0 0
Computer Literacy 1 54 1 54 0 0
Cosmetology 0 0 0 0 0 0
Electric Work 1 27 0 0 -1 -27
Electronics 1 27 1 27 0 0
HVAC 0 0 0 0 0 0
Machine Shop 0 0 0 0 0 0
Masonry 1 27 1 27 0 0
Office Technologies 1 27 1 27 0 0
Painting 1 27 0 0 -1 -27
Plumbing 1 27 1 27 0 0
Sheet Metal 0 0 0 0 0 0
Small Engine Repair 0 0 0 0 0 0
Welding 0 0 0 0 0 0
TBD 0 0 0 0 0 0
TOTALS 7 216 5 162 -2 -54
Contract Treatment
Programs
Student
Capacity
(/Program)
Student
Capacity
(Annual)
Actual
Students in
Program
Annual
Student
Capacity
(Projected)
Differences Differences
Substance Abuse 72 144 30 60 -42 -84
Cognitive-Behavioral 120 384 88 282 -32 -102
TOTALS 192 528 118 342 -74 -186
Employment ProgramsProgram
Slots
Annual
Served
Inmates
Served
(Actual)
Annual
Served
(Projected)
Differences Differences
Transitions Program 60 540 23 207 -37 -333
TOTALS 60 540 23 207 -37 -333
(Actuals - Final)FY 14-15 December 2014 -
January 2015
CALIFORNIA STATE PRISON, LOS ANGELES COUNTY (LAC)
Programs at this institution are to include Academic Education, Career Technical Education, Substance Abuse
Treatment, Cognitive-Behavioral Programs (including criminal thinking, anger management, and family programming),
Employment Training, and a cognitive behavioral based program for life-term inmates. The tables below illustrate the
planned and actual staffing and student capacities by program area (programs have been minimally updated since the
change in designation):
LAC was designated as a Re-Entry Hub on 12/4/12 although it was originally designated as a Standard Program Site.

Fifth Report on CDCR’s Progress Implementing the Blueprint 48 of 76
Office of the Inspector General State of California
APPENDIX A — PROGRAMMING PLANS
CDCR Figures Actuals Differences
Academic EducationProposed
Staff
Budgeted
Capacity
Actual Staff
(Programs)
Actual
Student
Capacity
Differences Differences
General Population 6 324 5 270 -1 -54
Voluntary Educ. Program 5 600 6 720 1 120
TOTALS 11 924 11 990 0 66
Career Technical
Education
Proposed
Staff
Budgeted
Capacity
Actual Staff
(Programs)
Actual
Student
Capacity
Differences Differences
Auto Mechanics 0 0 0 0 0 0
Auto Repair 0 0 0 0 0 0
Building Maintenance 1 27 0 0 -1 -27
Carpentry 0 0 0 0 0 0
Computer Literacy 1 27 1 54 0 27
Cosmetology 0 0 0 0 0 0
Electric Work 0 0 0 0 0 0
Electronics 0 0 0 0 0 0
HVAC 0 0 0 0 0 0
Machine Shop 0 0 0 0 0 0
Masonry 0 0 0 0 0 0
Office Technologies 2 54 2 54 0 0
Plumbing 0 0 0 0 0 0
Sheet Metal 0 0 0 0 0 0
Small Engine Repair 0 0 0 0 0 0
Welding 0 0 0 0 0 0
TBD 0 0 0 0 0 0
TOTALS 4 108 3 108 -1 0
SAC is designated as a Standard Program Site.
CALIFORNIA STATE PRISON, SACRAMENTO (SAC)
Programs at this institution are to include Academic Education and Career Technical Education. The tables below
illustrate the planned and actual staffing and student capacities by program area:
(Actuals - Final)FY 14-15 December 2014 -
January 2015

Fifth Report on CDCR’s Progress Implementing the Blueprint 49 of 76
Office of the Inspector General State of California
APPENDIX A — PROGRAMMING PLANS
CDCR Figures Actuals Differences
Academic EducationProposed
Staff
Budgeted
Capacity
Actual Staff
(Programs)
Actual
Student
Capacity
Differences Differences
General Population 7 378 7 378 0 0
Voluntary Educ. Program 6 720 5 600 -1 -120
TOTALS 13 1098 12 978 -1 -120
Career Technical
Education
Proposed
Staff
Budgeted
Capacity
Actual Staff
(Programs)
Actual
Student
Capacity
Differences Differences
Auto Mechanics 0 0 0 0 0 0
Auto Repair 0 0 0 0 0 0
Building Maintenance 1 27 1 27 0 0
Carpentry 0 0 0 0 0 0
Computer Literacy 1 54 0 0 -1 -54
Cosmetology 0 0 0 0 0 0
Electric Work 0 0 0 0 0 0
Electronics 1 27 1 27 0 0
HVAC 0 0 0 0 0 0
Machine Shop 1 27 0 0 -1 -27
Masonry 0 0 0 0 0 0
Office Technologies 0 0 0 0 0 0
Plumbing 1 27 0 0 -1 -27
Sheet Metal 0 0 0 0 0 0
Small Engine Repair 0 0 0 0 0 0
Welding 0 0 0 0 0 0
TBD 0 0 0 0 0 0
TOTALS 5 162 2 54 -3 -108
CALIFORNIA STATE PRISON, SAN QUENTIN (SQ)
Programs at this institution are to include Academic Education and Career Technical Education. The tables below
illustrate the planned and actual staffing and student capacities by program area:
(Actuals - Final)FY 14-15 December 2014 -
January 2015
SQ is designated as a Standard Program Site.

Fifth Report on CDCR’s Progress Implementing the Blueprint 50 of 76
Office of the Inspector General State of California
APPENDIX A — PROGRAMMING PLANS
CDCR Figures Actuals Differences
Academic EducationProposed
Staff
Budgeted
Capacity
Actual Staff
(Programs)
Actual
Student
Capacity
Differences Differences
General Population 13 702 11 466 -2 -236
Voluntary Educ. Program 5 600 3 360 -2 -240
TOTALS 18 1302 14 826 -4 -476
Career Technical
Education
Proposed
Staff
Budgeted
Capacity
Actual Staff
(Programs)
Actual
Student
Capacity
Differences Differences
Auto Mechanics 0 0 0 0 0 0
Auto Repair 0 0 0 0 0 0
Building Maintenance 1 27 1 27 0 0
Carpentry 1 27 1 27 0 0
Computer Literacy 1 54 1 54 0 0
Cosmetology 0 0 0 0 0 0
Electric Work 1 27 1 27 0 0
Electronics 1 27 1 27 0 0
HVAC 0 0 0 0 0 0
Machine Shop 0 0 0 0 0 0
Masonry 1 27 1 27 0 0
Office Technologies 1 27 1 27 0 0
Plumbing 0 0 0 0 0 0
Sheet Metal 0 0 0 0 0 0
Small Engine Repair 0 0 0 0 0 0
Welding 1 27 1 27 0 0
TBD 0 0 0 0 0 0
TOTALS 8 243 8 243 0 0
CALIFORNIA STATE PRISON, SOLANO (SOL)
Programs at this institution are to include Academic Education and Career Technical Education. The tables below
illustrate the planned and actual staffing and student capacities by program area (programs have been minimally
updated since the change in designation):
SOL was designated as a Standard Program Site on 12/4/12 although it was originally designated as a Re-Entry
Hub.
(Actuals - Final)FY 14-15 December 2014 -
January 2015

Fifth Report on CDCR’s Progress Implementing the Blueprint 51 of 76
Office of the Inspector General State of California
APPENDIX A — PROGRAMMING PLANS
CDCR Figures Actuals Differences
Academic EducationProposed
Staff
Budgeted
Capacity
Actual Staff
(Programs)
Actual
Student
Capacity
Differences Differences
General Population 18 972 18 972 0 0
Voluntary Educ. Program 11 1320 11 1320 0 0
TOTALS 29 2292 29 2292 0 0
Career Technical
Education
Proposed
Staff
Budgeted
Capacity
Actual Staff
(Programs)
Actual
Student
Capacity
Differences Differences
Auto Mechanics 1 27 1 27 0 0
Auto Repair 1 27 1 27 0 0
Building Maintenance 1 27 1 27 0 0
Carpentry 1 27 1 27 0 0
Computer Literacy 2 108 1 54 -1 -54
Cosmetology 0 0 0 0 0 0
Electric Work 2 54 2 54 0 0
Electronics 1 27 1 27 0 0
HVAC 1 27 1 27 0 0
Machine Shop 0 0 0 0 0 0
Masonry 1 27 1 27 0 0
Office Technologies 2 54 2 54 0 0
Painting 1 27 0 0 -1 -27
Plumbing 1 27 1 27 0 0
Sheet Metal 0 0 0 0 0 0
Small Engine Repair 1 27 1 27 0 0
Welding 1 27 1 27 0 0
TBD 0 0 0 0 0 0
TOTALS 17 513 15 432 -2 -81
Contract Treatment
Programs
Student
Capacity
(/Program)
Student
Capacity
(Annual)
Actual
Students in
Program
Annual
Student
Capacity
(Projected)
Differences Differences
Substance Abuse 144 288 144 288 0 0
Cognitive-Behavioral 288 960 108 356 -180 -604
TOTALS 432 1248 252 644 -180 -604
Employment ProgramsProgram
Slots
Annual
Served
Inmates
Served
(Actual)
Annual
Served
(Projected)
Differences Differences
Transitions Program 60 540 0 0 -60 -540
TOTALS 60 540 0 0 -60 -540
SATF is designated as a Re-Entry Hub.
(Actuals - Final)
CALIFORNIA SUBSTANCE ABUSE TREATMENT FACILITY (SATF)
Programs at this institution are to include Academic Education, Career Technical Education, Substance Abuse
Treatment, Cognitive-Behavioral Programs (including criminal thinking, anger management, and family programming),
Employment Training, and a cognitive behavioral based program for life-term inmates. The tables below illustrate the
planned and actual staffing and student capacities by program area:
FY 14-15 December 2014 -
January 2015

Fifth Report on CDCR’s Progress Implementing the Blueprint 52 of 76
Office of the Inspector General State of California
APPENDIX A — PROGRAMMING PLANS
CDCR Figures Actuals Differences
Academic EducationProposed
Staff
Budgeted
Capacity
Actual Staff
(Programs)
Actual
Student
Capacity
Differences Differences
General Population 12 648 11 594 -1 -54
Voluntary Educ. Program 7 840 5 600 -2 -240
TOTALS 19 1488 16 1194 -3 -294
Career Technical
Education
Proposed
Staff
Budgeted
Capacity
Actual Staff
(Programs)
Actual
Student
Capacity
Differences Differences
Auto Mechanics 1 27 0 0 -1 -27
Auto Repair 1 27 0 0 -1 -27
Building Maintenance 0 0 0 0 0 0
Carpentry 1 27 1 27 0 0
Computer Literacy 2 108 2 108 0 0
Cosmetology 0 0 0 0 0 0
Electric Work 1 27 0 0 -1 -27
Electronics 1 27 1 27 0 0
HVAC 1 27 0 0 -1 -27
Machine Shop 0 0 0 0 0 0
Masonry 0 0 0 0 0 0
Office Technologies 0 0 0 0 0 0
Plumbing 0 0 0 0 0 0
Sheet Metal 0 0 0 0 0 0
Small Engine Repair 0 0 0 0 0 0
Welding 0 0 0 0 0 0
TBD 0 0 0 0 0 0
TOTALS 8 270 4 162 -4 -108
CALIPATRIA STATE PRISON (CAL)
CAL is designated as a Standard Program Site.
FY 14-15 December 2014 -
January 2015
(Actuals - Final)
Programs at this institution are to include Academic Education and Career Technical Education. The tables below
illustrate the planned and actual staffing and student capacities by program area:

Fifth Report on CDCR’s Progress Implementing the Blueprint 53 of 76
Office of the Inspector General State of California
APPENDIX A — PROGRAMMING PLANS
CDCR Figures Actuals Differences
Academic EducationProposed
Staff
Budgeted
Capacity
Actual Staff
(Programs)
Actual
Student
Capacity
Differences Differences
General Population 12 648 11 486 -1 -162
Voluntary Educ. Program 7 840 5 600 -2 -240
TOTALS 19 1488 16 1086 -3 -402
Career Technical
Education
Proposed
Staff
Budgeted
Capacity
Actual Staff
(Programs)
Actual
Student
Capacity
Differences Differences
Auto Mechanics 1 27 0 0 -1 -27
Auto Repair 1 27 1 27 0 0
Building Maintenance 1 27 1 27 0 0
Carpentry 0 0 0 0 0 0
Computer Literacy 0 0 0 0 0 0
Cosmetology 0 0 0 0 0 0
Electric Work 1 27 0 0 -1 -27
Electronics 1 27 0 0 -1 -27
HVAC 0 0 0 0 0 0
Machine Shop 0 0 0 0 0 0
Masonry 0 0 0 0 0 0
Office Technologies 3 81 2 54 -1 -27
Plumbing 0 0 0 0 0 0
Sheet Metal 0 0 0 0 0 0
Small Engine Repair 1 27 0 0 -1 -27
Welding 1 27 0 0 -1 -27
Roofing 1 27 0 0 -1 -27
TOTALS 11 297 4 108 -7 -189
CEN is designated as a Standard Program Site.
CENTINELA STATE PRISON (CEN)
Programs at this institution are to include Academic Education and Career Technical Education. The tables below
illustrate the planned and actual staffing and student capacities by program area:
(Actuals - Final)FY 14-15 December 2014 -
January 2015

Fifth Report on CDCR’s Progress Implementing the Blueprint 54 of 76
Office of the Inspector General State of California
APPENDIX A — PROGRAMMING PLANS
CDCR Figures Actuals Differences
Academic EducationProposed
Staff
Budgeted
Capacity
Actual Staff
(Programs)
Actual
Student
Capacity
Differences Differences
General Population 11 594 9 486 -2 -108
Voluntary Educ. Program 4 480 3 360 -1 -120
TOTALS 15 1074 12 846 -3 -228
Career Technical
Education
Proposed
Staff
Budgeted
Capacity
Actual Staff
(Programs)
Actual
Student
Capacity
Differences Differences
Auto Mechanics 0 0 0 0 0 0
Auto Repair 1 27 1 27 0 0
Building Maintenance 1 27 1 27 0 0
Carpentry 1 27 1 27 0 0
Computer Literacy 1 54 1 54 0 0
Cosmetology 1 27 1 27 0 0
Electric Work 1 27 1 27 0 0
Electronics 1 27 1 27 0 0
HVAC 1 27 1 27 0 0
Machine Shop 0 0 0 0 0 0
Masonry 0 0 0 0 0 0
Office Technologies 2 54 2 54 0 0
Plumbing 0 0 0 0 0 0
Sheet Metal 0 0 0 0 0 0
Small Engine Repair 0 0 0 0 0 0
Welding 0 0 0 0 0 0
TBD 0 0 0 0 0 0
TOTALS 10 297 10 297 0 0
Contract Treatment
Programs
Student
Capacity
(/Program)
Student
Capacity
(Annual)
Actual
Students in
Program
Annual
Student
Capacity
(Projected)
Differences Differences
Substance Abuse 96 192 96 192 0 0
Cognitive-Behavioral 144 480 143 472 -1 -8
TOTALS 240 672 239 664 -1 -8
Employment ProgramsProgram
Slots
Annual
Served
Inmates
Served
(Actual)
Annual
Served
(Projected)
Differences Differences
Transitions Program 60 540 46 414 -14 -126
TOTALS 60 540 46 414 -14 -126
CCWF is designated as a Re-Entry Hub.
CENTRAL CALIFORNIA WOMEN'S FACILITY (CCWF)
Programs at this institution are to include Academic Education, Career Technical Education, Substance Abuse
Treatment, Cognitive-Behavioral Programs (including criminal thinking, anger management, and family programming),
Employment Training, and a cognitive behavioral based program for life-term inmates. The tables below illustrate the
planned and actual staffing and student capacities by program area:
(Actuals - Final)FY 14-15 December 2014 -
January 2015
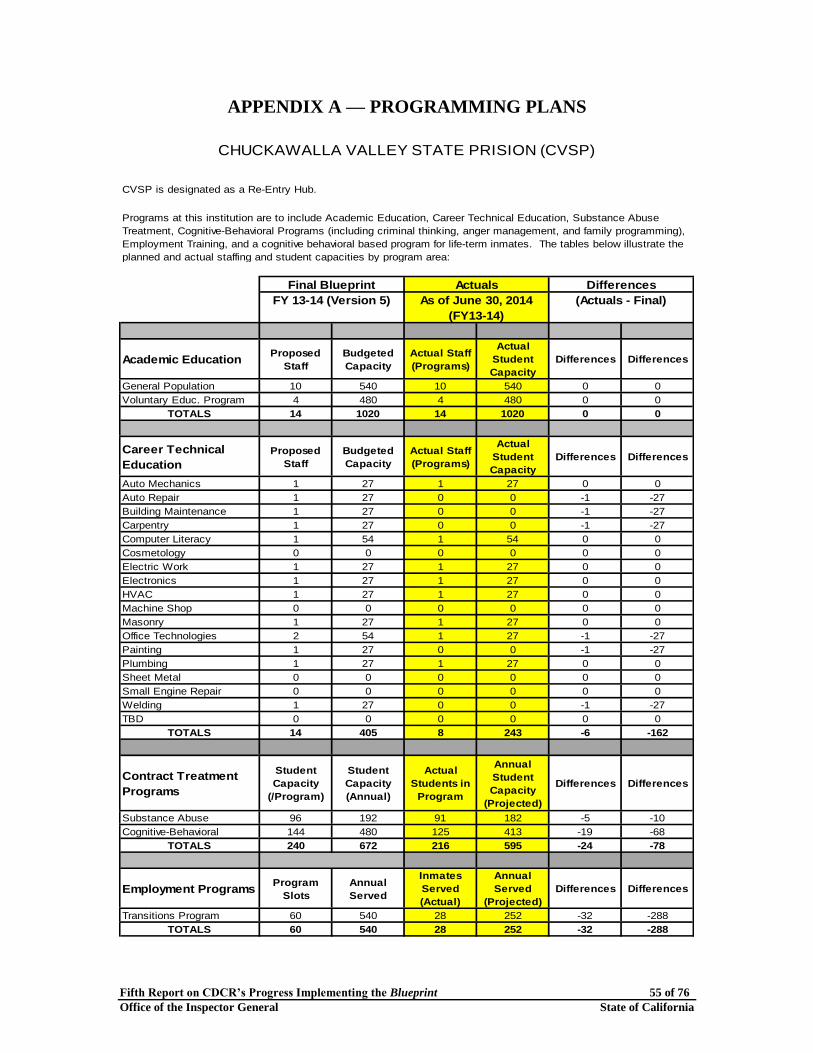
Fifth Report on CDCR’s Progress Implementing the Blueprint 55 of 76
Office of the Inspector General State of California
APPENDIX A — PROGRAMMING PLANS
Final Blueprint Actuals Differences
Academic EducationProposed
Staff
Budgeted
Capacity
Actual Staff
(Programs)
Actual
Student
Capacity
Differences Differences
General Population 10 540 10 540 0 0
Voluntary Educ. Program 4 480 4 480 0 0
TOTALS 14 1020 14 1020 0 0
Career Technical
Education
Proposed
Staff
Budgeted
Capacity
Actual Staff
(Programs)
Actual
Student
Capacity
Differences Differences
Auto Mechanics 1 27 1 27 0 0
Auto Repair 1 27 0 0 -1 -27
Building Maintenance 1 27 0 0 -1 -27
Carpentry 1 27 0 0 -1 -27
Computer Literacy 1 54 1 54 0 0
Cosmetology 0 0 0 0 0 0
Electric Work 1 27 1 27 0 0
Electronics 1 27 1 27 0 0
HVAC 1 27 1 27 0 0
Machine Shop 0 0 0 0 0 0
Masonry 1 27 1 27 0 0
Office Technologies 2 54 1 27 -1 -27
Painting 1 27 0 0 -1 -27
Plumbing 1 27 1 27 0 0
Sheet Metal 0 0 0 0 0 0
Small Engine Repair 0 0 0 0 0 0
Welding 1 27 0 0 -1 -27
TBD 0 0 0 0 0 0
TOTALS 14 405 8 243 -6 -162
Contract Treatment
Programs
Student
Capacity
(/Program)
Student
Capacity
(Annual)
Actual
Students in
Program
Annual
Student
Capacity
(Projected)
Differences Differences
Substance Abuse 96 192 91 182 -5 -10
Cognitive-Behavioral 144 480 125 413 -19 -68
TOTALS 240 672 216 595 -24 -78
Employment ProgramsProgram
Slots
Annual
Served
Inmates
Served
(Actual)
Annual
Served
(Projected)
Differences Differences
Transitions Program 60 540 28 252 -32 -288
TOTALS 60 540 28 252 -32 -288
CVSP is designated as a Re-Entry Hub.
(Actuals - Final)
CHUCKAWALLA VALLEY STATE PRISION (CVSP)
Programs at this institution are to include Academic Education, Career Technical Education, Substance Abuse
Treatment, Cognitive-Behavioral Programs (including criminal thinking, anger management, and family programming),
Employment Training, and a cognitive behavioral based program for life-term inmates. The tables below illustrate the
planned and actual staffing and student capacities by program area:
FY 13-14 (Version 5) As of June 30, 2014
(FY13-14)
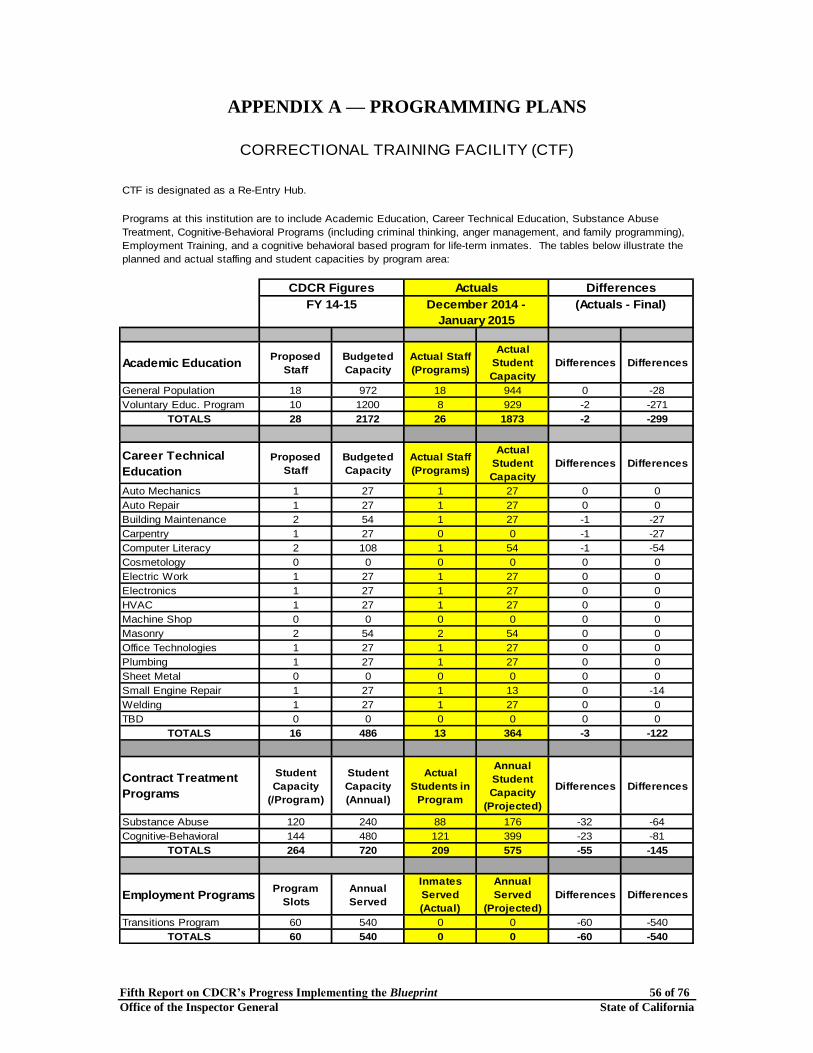
Fifth Report on CDCR’s Progress Implementing the Blueprint 56 of 76
Office of the Inspector General State of California
APPENDIX A — PROGRAMMING PLANS
CDCR Figures Actuals Differences
Academic EducationProposed
Staff
Budgeted
Capacity
Actual Staff
(Programs)
Actual
Student
Capacity
Differences Differences
General Population 18 972 18 944 0 -28
Voluntary Educ. Program 10 1200 8 929 -2 -271
TOTALS 28 2172 26 1873 -2 -299
Career Technical
Education
Proposed
Staff
Budgeted
Capacity
Actual Staff
(Programs)
Actual
Student
Capacity
Differences Differences
Auto Mechanics 1 27 1 27 0 0
Auto Repair 1 27 1 27 0 0
Building Maintenance 2 54 1 27 -1 -27
Carpentry 1 27 0 0 -1 -27
Computer Literacy 2 108 1 54 -1 -54
Cosmetology 0 0 0 0 0 0
Electric Work 1 27 1 27 0 0
Electronics 1 27 1 27 0 0
HVAC 1 27 1 27 0 0
Machine Shop 0 0 0 0 0 0
Masonry 2 54 2 54 0 0
Office Technologies 1 27 1 27 0 0
Plumbing 1 27 1 27 0 0
Sheet Metal 0 0 0 0 0 0
Small Engine Repair 1 27 1 13 0 -14
Welding 1 27 1 27 0 0
TBD 0 0 0 0 0 0
TOTALS 16 486 13 364 -3 -122
Contract Treatment
Programs
Student
Capacity
(/Program)
Student
Capacity
(Annual)
Actual
Students in
Program
Annual
Student
Capacity
(Projected)
Differences Differences
Substance Abuse 120 240 88 176 -32 -64
Cognitive-Behavioral 144 480 121 399 -23 -81
TOTALS 264 720 209 575 -55 -145
Employment ProgramsProgram
Slots
Annual
Served
Inmates
Served
(Actual)
Annual
Served
(Projected)
Differences Differences
Transitions Program 60 540 0 0 -60 -540
TOTALS 60 540 0 0 -60 -540
CORRECTIONAL TRAINING FACILITY (CTF)
Programs at this institution are to include Academic Education, Career Technical Education, Substance Abuse
Treatment, Cognitive-Behavioral Programs (including criminal thinking, anger management, and family programming),
Employment Training, and a cognitive behavioral based program for life-term inmates. The tables below illustrate the
planned and actual staffing and student capacities by program area:
CTF is designated as a Re-Entry Hub.
FY 14-15 December 2014 -
January 2015
(Actuals - Final)

Fifth Report on CDCR’s Progress Implementing the Blueprint 57 of 76
Office of the Inspector General State of California
APPENDIX A — PROGRAMMING PLANS
CDCR Figures Actuals Differences
Academic EducationProposed
Staff
Budgeted
Capacity
Actual Staff
(Programs)
Actual
Student
Capacity
Differences Differences
General Population 1 54 1 54 0 0
Voluntary Educ. Program 6 720 2 240 -4 -480
TOTALS 7 774 3 294 -4 -480
Career Technical
Education
Proposed
Staff
Budgeted
Capacity
Actual Staff
(Programs)
Actual
Student
Capacity
Differences Differences
Auto Mechanics 0 0 0 0 0 0
Auto Repair 1 27 1 27 0 0
Building Maintenance 1 27 1 27 0 0
Carpentry 0 0 0 0 0 0
Computer Literacy 1 54 1 54 0 0
Cosmetology 0 0 0 0 0 0
Electric Work 0 0 0 0 0 0
Electronics 0 0 0 0 0 0
HVAC 1 27 1 27 0 0
Machine Shop 0 0 0 0 0 0
Masonry 0 0 0 0 0 0
Office Technologies 0 0 0 0 0 0
Plumbing 0 0 0 0 0 0
Sheet Metal 0 0 0 0 0 0
Small Engine Repair 0 0 0 0 0 0
Welding 0 0 0 0 0 0
TBD 0 0 0 0 0 0
TOTALS 4 135 4 135 0 0
DVI is designated as a Standard Program Site.
DEUEL VOCATIONAL INSTITUTION (DVI)
Programs at this institution are to include Academic Education and Career Technical Education. The tables below
illustrate the planned and actual staffing and student capacities by program area:
(Actuals - Final)FY 14-15 December 2014 -
January 2015

Fifth Report on CDCR’s Progress Implementing the Blueprint 58 of 76
Office of the Inspector General State of California
APPENDIX A — PROGRAMMING PLANS
CDCR Figures Actuals Differences
Academic EducationProposed
Staff
Budgeted
Capacity
Actual Staff
(Programs)
Actual
Student
Capacity
Differences Differences
General Population 9 486 9 450 0 -36
Voluntary Educ. Program 7 840 7 840 0 0
TOTALS 16 1326 16 1290 0 -36
Career Technical
Education
Proposed
Staff
Budgeted
Capacity
Actual Staff
(Programs)
Actual
Student
Capacity
Differences Differences
Auto Mechanics 1 27 1 27 0 0
Auto Repair 0 0 0 0 0 0
Building Maintenance 1 27 1 27 0 0
Carpentry 1 27 1 27 0 0
Computer Literacy 1 54 1 54 0 0
Cosmetology 0 0 0 0 0 0
Electric Work 1 27 1 27 0 0
Electronics 1 27 1 27 0 0
HVAC 0 0 0 0 0 0
Machine Shop 0 0 0 0 0 0
Masonry 1 27 1 27 0 0
Office Technologies 1 27 1 27 0 0
Plumbing 1 27 1 27 0 0
Sheet Metal 0 0 0 0 0 0
Small Engine Repair 0 0 0 0 0 0
Welding 2 54 2 54 0 0
TBD 0 0 0 0 0 0
TOTALS 11 324 11 324 0 0
FSP is designated as a Standard Program Site.
FOLSOM STATE PRISON (FSP)
Programs at this institution are to include Academic Education and Career Technical Education. The tables below
illustrate the planned and actual staffing and student capacities by program area:
(Actuals - Final)FY 14-15 December 2014 -
January 2015

Fifth Report on CDCR’s Progress Implementing the Blueprint 59 of 76
Office of the Inspector General State of California
APPENDIX A — PROGRAMMING PLANS
CDCR Figures Actuals Differences
Academic EducationProposed
Staff
Budgeted
Capacity
Actual Staff
(Programs)
Actual
Student
Capacity
Differences Differences
General Population 1 54 1 54 0 0
Voluntary Educ. Program 1 120 1 120 0 0
TOTALS 2 174 2 174 0 0
Career Technical
Education
Proposed
Staff
Budgeted
Capacity
Actual Staff
(Programs)
Actual
Student
Capacity
Differences Differences
Auto Mechanics 0 0 0 0 0 0
Auto Repair 0 0 0 0 0 0
Building Maintenance 0 0 0 0 0 0
Carpentry 0 0 0 0 0 0
Computer Literacy 1 54 1 40 0 -14
Cosmetology 0 0 0 0 0 0
Electric Work 0 0 0 0 0 0
Electronics 0 0 0 0 0 0
HVAC 0 0 0 0 0 0
Machine Shop 0 0 0 0 0 0
Masonry 0 0 0 0 0 0
Office Technologies 0 0 0 0 0 0
Plumbing 0 0 0 0 0 0
Sheet Metal 0 0 0 0 0 0
Small Engine Repair 0 0 0 0 0 0
Welding 0 0 0 0 0 0
TBD 0 0 0 0 0 0
TOTALS 1 54 1 40 0 -14
Contract Treatment
Programs
Student
Capacity
(/Program)
Student
Capacity
(Annual)
Actual
Students in
Program
Annual
Student
Capacity
(Projected)
Differences Differences
Substance Abuse 48 96 40 80 -8 -16
Cognitive-Behavioral 72 240 71 234 -1 -6
TOTALS 120 336 111 314 -9 -22
Employment ProgramsProgram
Slots
Annual
Served
Inmates
Served
(Actual)
Annual
Served
(Projected)
Differences Differences
Transitions Program 30 270 30 270 0 0
TOTALS 30 270 30 270 0 0
FOLSOM WOMEN'S FACILITY (FWF)
Programs at this institution are to include Academic Education, Career Technical Education, Substance Abuse
Treatment, Cognitive-Behavioral Programs (including criminal thinking, anger management, and family programming),
Employment Training, and a cognitive behavioral based program for life-term inmates. The tables below illustrate the
planned and actual staffing and student capacities by program area:
(Actuals - Final)
FWF is designated as a Re-Entry Hub.
FY 14-15 December 2014 -
January 2015

Fifth Report on CDCR’s Progress Implementing the Blueprint 60 of 76
Office of the Inspector General State of California
APPENDIX A — PROGRAMMING PLANS
CDCR Figures Actuals Differences
Academic EducationProposed
Staff
Budgeted
Capacity
Actual Staff
(Programs)
Actual
Student
Capacity
Differences Differences
General Population 9 486 8 432 -1 -54
Alternative Programming 1 54 0 0 -1 -54
Voluntary Educ. Program 7 840 4 480 -3 -360
TOTALS 17 1380 12 912 -5 -468
Career Technical
Education
Proposed
Staff
Budgeted
Capacity
Actual Staff
(Programs)
Actual
Student
Capacity
Differences Differences
Auto Mechanics 0 0 0 0 0 0
Auto Repair 1 27 1 27 0 0
Building Maintenance 1 27 1 27 0 0
Carpentry 0 0 0 0 0 0
Computer Literacy 2 108 1 54 -1 -54
Cosmetology 0 0 0 0 0 0
Electric Work 0 0 0 0 0 0
Electronics 0 0 0 0 0 0
HVAC 0 0 0 0 0 0
Machine Shop 0 0 0 0 0 0
Masonry 0 0 0 0 0 0
Office Technologies 2 54 0 0 -2 -54
Plumbing 0 0 0 0 0 0
Sheet Metal 0 0 0 0 0 0
Small Engine Repair 0 0 0 0 0 0
Welding 0 0 0 0 0 0
TBD 0 0 0 0 0 0
TOTALS 6 216 3 108 -3 -108
Contract Treatment
Programs
Student
Capacity
(/Program)
Student
Capacity
(Annual) )
Actual
Students in
Program
Annual
Student
Capacity
(Projected)
Differences Differences
Substance Abuse 96 192 47 113 -49 -79
Cognitive-Behavioral 144 480 143 472 -1 -8
TOTALS 240 672 47 112.8 -49 -79
Employment
Programs
Program
Slots
Annual
Served
Inmates
Served
(Actual)
Annual
Served
(Projected)
Differences Differences
Transitions Program 60 540 0 0 -60 -540
TOTALS 60 540 0 0 -60 -540
HIGH DESERT STATE PRISON (HDSP)
Programs at this institution are to include Academic Education, Career Technical Education, Substance Abuse
Treatment, Cognitive-Behavioral Programs (including criminal thinking, anger management, and family programming),
Employment Training, and a cognitive behavioral based program for life-term inmates. The tables below illustrate the
planned and actual staffing and student capacities by program area:
HDSP was designated as a Re-Entry Hub on 9/20/13 although it was originally designated as a Standard Program Site.
(Actuals - Final)FY 14-15 December 2014 -
January 2015

Fifth Report on CDCR’s Progress Implementing the Blueprint 61 of 76
Office of the Inspector General State of California
APPENDIX A — PROGRAMMING PLANS
CDCR Figures Actuals Differences
Academic EducationProposed
Staff
Budgeted
Capacity
Actual Staff
(Programs)
Actual
Student
Capacity
Differences Differences
General Population 12 648 11 594 -1 -54
Voluntary Educ. Program 9 1080 7 840 -2 -240
TOTALS 21 1728 18 1434 -3 -294
Career Technical
Education
Proposed
Staff
Budgeted
Capacity
Actual Staff
(Programs)
Actual
Student
Capacity
Differences Differences
Auto Mechanics 2 54 1 27 -1 -27
Auto Repair 1 27 1 27 0 0
Building Maintenance 1 27 1 27 0 0
Carpentry 1 27 0 0 -1 -27
Computer Literacy 2 108 2 108 0 0
Cosmetology 0 0 0 0 0 0
Electric Work 0 0 0 0 0 0
Electronics 2 54 1 27 -1 -27
HVAC 0 0 0 0 0 0
Machine Shop 0 0 0 0 0 0
Masonry 2 54 2 54 0 0
Office Technologies 2 54 2 54 0 0
Plumbing 1 27 0 0 -1 -27
Sheet Metal 0 0 0 0 0 0
Small Engine Repair 0 0 0 0 0 0
Welding 1 27 0 0 -1 -27
TBD 0 0 0 0 0 0
TOTALS 15 459 10 324 -5 -135
Contract Treatment
Programs
Student
Capacity
(/Program)
Student
Capacity
(Annual)
Actual
Students in
Program
Annual
Student
Capacity
(Projected)
Differences Differences
Substance Abuse 96 192 79 158 -17 -34
Cognitive-Behavioral 144 480 144 480 0 0
TOTALS 240 672 223 638 -17 -34
Employment ProgramsProgram
Slots
Annual
Served
Inmates
Served
(Actual)
Annual
Served
(Projected)
Differences Differences
Transitions Program 60 540 60 540 0 0
TOTALS 60 540 60 540 0 0
IRONWOOD STATE PRISON (ISP)
Programs at this institution are to include Academic Education, Career Technical Education, Substance Abuse
Treatment, Cognitive-Behavioral Programs (including criminal thinking, anger management, and family programming),
Employment Training, and a cognitive behavioral based program for life-term inmates. The tables below illustrate the
planned and actual staffing and student capacities by program area (programs have been minimally updated since the
change in designation):
ISP was designated as a Re-Entry Hub on 12/4/12 although it was originally designated as a Standard Program Site.
(Actuals - Final)FY 14-15 December 2014 -
January 2015

Fifth Report on CDCR’s Progress Implementing the Blueprint 62 of 76
Office of the Inspector General State of California
APPENDIX A — PROGRAMMING PLANS
CDCR Figures Actuals Differences
Academic EducationProposed
Staff
Budgeted
Capacity
Actual Staff
(Programs)
Actual
Student
Capacity
Differences Differences
General Population 14 756 12 648 -2 -108
Voluntary Educ. Program 6 720 5 600 -1 -120
TOTALS 20 1476 17 1248 -3 -228
Career Technical
Education
Proposed
Staff
Budgeted
Capacity
Actual Staff
(Programs)
Actual
Student
Capacity
Differences Differences
Auto Mechanics 1 27 1 27 0 0
Auto Repair 0 0 0 0 0 0
Building Maintenance 0 0 0 0 0 0
Carpentry 0 0 0 0 0 0
Computer Literacy 0 0 0 0 0 0
Cosmetology 0 0 0 0 0 0
Electric Work 0 0 0 0 0 0
Electronics 2 54 1 27 -1 -27
HVAC 0 0 0 0 0 0
Machine Shop 0 0 0 0 0 0
Masonry 1 27 0 0 -1 -27
Office Technologies 2 54 1 27 -1 -27
Plumbing 0 0 0 0 0 0
Sheet Metal 0 0 0 0 0 0
Small Engine Repair 1 27 1 27 0 0
Welding 1 27 1 27 0 0
TBD 0 0 0 0 0 0
TOTALS 8 216 5 135 -3 -81
KVSP is designated as a Standard Program Site.
KERN VALLEY STATE PRISON (KVSP)
Programs at this institution are to include Academic Education and Career Technical Education. The tables below
illustrate the planned and actual staffing and student capacities by program area:
(Actuals - Final)FY 14-15 December 2014 -
January 2015

Fifth Report on CDCR’s Progress Implementing the Blueprint 63 of 76
Office of the Inspector General State of California
APPENDIX A — PROGRAMMING PLANS
CDCR Figures Actuals Differences
Academic EducationProposed
Staff
Budgeted
Capacity
Actual Staff
(Programs)
Actual
Student
Capacity
Differences Differences
General Population 8 432 7 378 -1 -54
Voluntary Educ. Program 4 480 4 480 0 0
TOTALS 12 912 11 858 -1 -54
Career Technical
Education
Proposed
Staff
Budgeted
Capacity
Actual Staff
(Programs)
Actual
Student
Capacity
Differences Differences
Auto Mechanics 0 0 0 0 0 0
Auto Repair 0 0 0 0 0 0
Building Maintenance 1 27 0 0 -1 -27
Carpentry 0 0 0 0 0 0
Computer Literacy 0 0 0 0 0 0
Cosmetology 0 0 0 0 0 0
Electric Work 0 0 0 0 0 0
Electronics 1 27 1 27 0 0
HVAC 1 27 0 0 -1 -27
Machine Shop 0 0 0 0 0 0
Masonry 0 0 0 0 0 0
Office Technologies 1 27 1 27 0 0
Plumbing 0 0 0 0 0 0
Sheet Metal 0 0 0 0 0 0
Small Engine Repair 0 0 0 0 0 0
Welding 1 27 1 27 0 0
TBD 0 0 0 0 0 0
TOTALS 5 135 3 81 -2 -54
MCSP is designated as a Standard Program Site.
MULE CREEK STATE PRISON (MCSP)
Programs at this institution are to include Academic Education and Career Technical Education. The tables below
illustrate the planned and actual staffing and student capacities by program area:
(Actuals - Final)FY 14-15 December 2014 -
January 2015

Fifth Report on CDCR’s Progress Implementing the Blueprint 64 of 76
Office of the Inspector General State of California
APPENDIX A — PROGRAMMING PLANS
CDCR Figures Actuals Differences
Academic EducationProposed
Staff
Budgeted
Capacity
Actual Staff
(Programs)
Actual
Student
Capacity
Differences Differences
General Population 3 162 2 108 -1 -54
Voluntary Educ. Program 3 360 3 360 0 0
TOTALS 6 522 5 468 -1 -54
Career Technical
Education
Proposed
Staff
Budgeted
Capacity
Actual Staff
(Programs)
Actual
Student
Capacity
Differences Differences
Auto Mechanics 0 0 0 0 0 0
Auto Repair 0 0 0 0 0 0
Building Maintenance 0 0 0 0 0 0
Carpentry 0 0 0 0 0 0
Computer Literacy 0 0 0 0 0 0
Cosmetology 0 0 0 0 0 0
Electric Work 1 27 1 27 0 0
Electronics 0 0 0 0 0 0
HVAC 0 0 0 0 0 0
Machine Shop 0 0 0 0 0 0
Masonry 0 0 0 0 0 0
Office Technologies 0 0 0 0 0 0
Plumbing 0 0 0 0 0 0
Sheet Metal 0 0 0 0 0 0
Small Engine Repair 1 27 1 27 0 0
Welding 0 0 0 0 0 0
TBD 0 0 0 0 0 0
TOTALS 2 54 2 54 0 0
NKSP is designated as a Standard Program Site.
NORTH KERN STATE PRISON (NKSP)
Programs at this institution are to include Academic Education and Career Technical Education. The tables below
illustrate the planned and actual staffing and student capacities by program area:
(Actuals - Final)FY 14-15 December 2014 -
January 2015

Fifth Report on CDCR’s Progress Implementing the Blueprint 65 of 76
Office of the Inspector General State of California
APPENDIX A — PROGRAMMING PLANS
CDCR Figures Actuals Differences
Academic EducationProposed
Staff
Budgeted
Capacity
Actual Staff
(Programs)
Actual
Student
Capacity
Differences Differences
General Population 0 0 0 0 0 0
Alternative Programming 4 216 4 216 0 0
Voluntary Educ. Program 6 720 6 720 0 0
TOTALS 10 936 10 936 0 0
Career Technical
Education
Proposed
Staff
Budgeted
Capacity
Actual Staff
(Programs)
Actual
Student
Capacity
Differences Differences
Auto Mechanics 0 0 0 0 0 0
Auto Repair 0 0 0 0 0 0
Building Maintenance 0 0 0 0 0 0
Carpentry 0 0 0 0 0 0
Computer Literacy 1 54 1 54 0 0
Cosmetology 0 0 0 0 0 0
Electric Work 0 0 0 0 0 0
Electronics 1 27 0 0 -1 -27
HVAC 0 0 0 0 0 0
Machine Shop 0 0 0 0 0 0
Masonry 0 0 0 0 0 0
Office Technologies 0 0 0 0 0 0
Plumbing 0 0 0 0 0 0
Sheet Metal 0 0 0 0 0 0
Small Engine Repair 0 0 0 0 0 0
Welding 0 0 0 0 0 0
TBD 0 0 0 0 0 0
TOTALS 2 81 1 54 -1 -27
PBSP is designated as a Standard Program Site.
PELICAN BAY STATE PRISON (PBSP)
Programs at this institution are to include Academic Education and Career Technical Education. The tables below
illustrate the planned and actual staffing and student capacities by program area:
(Actuals - Final)FY 14-15 December 2014 -
January 2015

Fifth Report on CDCR’s Progress Implementing the Blueprint 66 of 76
Office of the Inspector General State of California
APPENDIX A — PROGRAMMING PLANS
CDCR Figures Actuals Differences
Academic EducationProposed
Staff
Budgeted
Capacity
Actual Staff
(Programs)
Actual
Student
Capacity
Differences Differences
General Population 12 648 11 594 -1 -54
Voluntary Educ. Program 5 600 5 600 0 0
TOTALS 17 1248 16 1194 -1 -54
Career Technical
Education
Proposed
Staff
Budgeted
Capacity
Actual Staff
(Programs)
Actual
Student
Capacity
Differences Differences
Auto Mechanics 1 27 1 27 0 0
Auto Repair 1 27 1 27 0 0
Building Maintenance 1 27 1 27 0 0
Carpentry 1 27 1 27 0 0
Computer Literacy 0 0 0 0 0 0
Cosmetology 0 0 0 0 0 0
Electric Work 1 27 0 0 -1 -27
Electronics 1 27 1 27 0 0
HVAC 0 0 0 0 0 0
Machine Shop 0 0 0 0 0 0
Masonry 0 0 0 0 0 0
Office Technologies 1 27 1 27 0 0
Plumbing 0 0 0 0 0 0
Sheet Metal 0 0 0 0 0 0
Small Engine Repair 1 27 1 27 0 0
Welding 1 27 1 27 0 0
TBD 0 0 0 0 0 0
TOTALS 9 243 8 216 -1 -27
PLEASANT VALLEY STATE PRISON (PVSP)
Programs at this institution are to include Academic Education and Career Technical Education. The tables below
illustrate the planned and actual staffing and student capacities by program area:
(Actuals - Final)
PVSP is designated as a Standard Program Site.
FY 14-15 December 2014 -
January 2015

Fifth Report on CDCR’s Progress Implementing the Blueprint 67 of 76
Office of the Inspector General State of California
APPENDIX A — PROGRAMMING PLANS
CDCR Figures Actuals Differences
Academic EducationProposed
Staff
Budgeted
Capacity
Actual Staff
(Programs)
Actual
Student
Capacity
Differences Differences
General Population 4 216 4 216 0 0
Alternative Programming 1 54 2 108 1 54
Voluntary Educ. Program 7 840 5 600 -2 -240
TOTALS 12 1110 11 924 -1 -186
Career Technical
Education
Proposed
Staff
Budgeted
Capacity
Actual Staff
(Programs)
Actual
Student
Capacity
Differences Differences
Auto Mechanics 0 0 0 0 0 0
Auto Repair 0 0 0 0 0 0
Building Maintenance 0 0 0 0 0 0
Carpentry 1 27 1 27 0 0
Computer Literacy 1 54 1 54 0 0
Cosmetology 0 0 0 0 0 0
Electric Work 0 0 0 0 0 0
Electronics 1 27 0 0 -1 -27
HVAC 1 27 1 27 0 0
Machine Shop 1 27 1 27 0 0
Masonry 0 0 0 0 0 0
Office Technologies 0 0 0 0 0 0
Plumbing 0 0 0 0 0 0
Sheet Metal 0 0 0 0 0 0
Small Engine Repair 0 0 0 0 0 0
Welding 1 27 1 27 0 0
TBD 0 0 0 0 0 0
TOTALS 6 189 5 162 -1 -27
RJD is designated as a Standard Program Site.
RICHARD J. DONOVAN CORRECTIONAL FACILITY (RJD)
Programs at this institution are to include Academic Education and Career Technical Education. The tables below
illustrate the planned and actual staffing and student capacities by program area:
(Actuals - Final)FY 14-15 December 2014 -
January 2015

Fifth Report on CDCR’s Progress Implementing the Blueprint 68 of 76
Office of the Inspector General State of California
APPENDIX A — PROGRAMMING PLANS
CDCR Figures Actuals Differences
Academic EducationProposed
Staff
Budgeted
Capacity
Actual Staff
(Programs)
Actual
Student
Capacity
Differences Differences
General Population 6 324 6 324 0 0
Voluntary Educ. Program 5 600 5 600 0 0
TOTALS 11 924 11 924 0 0
Career Technical
Education
Proposed
Staff
Budgeted
Capacity
Actual Staff
(Programs)
Actual
Student
Capacity
Differences Differences
Auto Mechanics 0 0 0 0 0 0
Auto Repair 0 0 0 0 0 0
Building Maintenance 0 0 0 0 0 0
Carpentry 0 0 0 0 0 0
Computer Literacy 1 54 1 54 0 0
Cosmetology 0 0 0 0 0 0
Electric Work 0 0 0 0 0 0
Electronics 1 27 0 0 -1 -27
HVAC 1 27 0 0 -1 -27
Machine Shop 0 0 0 0 0 0
Masonry 0 0 0 0 0 0
Office Technologies 0 0 0 0 0 0
Plumbing 0 0 0 0 0 0
Sheet Metal 0 0 0 0 0 0
Small Engine Repair 0 0 0 0 0 0
Welding 1 27 0 0 -1 -27
TBD 0 0 0 0 0 0
TOTALS 4 135 1 54 -3 -81
SALINAS VALLEY STATE PRISON (SVSP)
Programs at this institution are to include Academic Education and Career Technical Education. The tables below
illustrate the planned and actual staffing and student capacities by program area:
(Actuals - Final)FY 14-15 December 2014 -
January 2015
SVSP is designated as a Standard Program Site.

Fifth Report on CDCR’s Progress Implementing the Blueprint 69 of 76
Office of the Inspector General State of California
APPENDIX A — PROGRAMMING PLANS
CDCR Figures Actuals Differences
Academic EducationProposed
Staff
Budgeted
Capacity
Actual Staff
(Programs)
Actual
Student
Capacity
Differences Differences
General Population 8 432 7 300 -1 -132
Voluntary Educ. Program 6 720 4 480 -2 -240
TOTALS 14 1152 11 780 -3 -372
Career Technical
Education
Proposed
Staff
Budgeted
Capacity
Actual Staff
(Programs)
Actual
Student
Capacity
Differences Differences
Auto Mechanics 1 27 0 0 -1 -27
Auto Repair 1 27 1 27 0 0
Building Maintenance 1 27 1 27 0 0
Carpentry 1 27 1 27 0 0
Computer Literacy 0 0 0 0 0 0
Cosmetology 0 0 0 0 0 0
Electric Work 0 0 0 0 0 0
Electronics 1 27 1 27 0 0
HVAC 0 0 0 0 0 0
Machine Shop 0 0 0 0 0 0
Masonry 1 27 1 27 0 0
Office Technologies 1 27 1 27 0 0
Plumbing 0 0 0 0 0 0
Sheet Metal 0 0 0 0 0 0
Small Engine Repair 0 0 0 0 0 0
Welding 1 27 1 27 0 0
TBD 0 0 0 0 0 0
TOTALS 8 216 7 189 -1 -27
SCC is designated as a Standard Program Site.
SIERRA CONSERVATION CENTER (SCC)
Programs at this institution are to include Academic Education and Career Technical Education. The tables below
illustrate the planned and actual staffing and student capacities by program area:
(Actuals - Final)FY 14-15 December 2014 -
January 2015

Fifth Report on CDCR’s Progress Implementing the Blueprint 70 of 76
Office of the Inspector General State of California
APPENDIX A — PROGRAMMING PLANS
CDCR Figures Actuals Differences
Academic EducationProposed
Staff
Budgeted
Capacity
Actual Staff
(Programs)
Actual
Student
Capacity
Differences Differences
General Population 10 540 8 432 -2 -108
Voluntary Educ. Program 6 720 5 600 -1 -120
TOTALS 16 1260 13 1032 -3 -228
Career Technical
Education
Proposed
Staff
Budgeted
Capacity
Actual Staff
(Programs)
Actual
Student
Capacity
Differences Differences
Auto Mechanics 1 27 1 27 0 0
Auto Repair 0 0 0 0 0 0
Building Maintenance 1 27 0 0 -1 -27
Carpentry 1 27 1 27 0 0
Computer Literacy 1 54 0 0 -1 -54
Cosmetology 1 27 1 27 0 0
Electric Work 1 27 1 27 0 0
Electronics 1 27 1 27 0 0
HVAC 0 0 0 0 0 0
Machine Shop 0 0 0 0 0 0
Masonry 1 27 1 27 0 0
Office Technologies 2 54 1 27 -1 -27
Plumbing 0 0 0 0 0 0
Sheet Metal 0 0 0 0 0 0
Small Engine Repair 1 27 1 27 0 0
Welding 1 27 1 27 0 0
TBD 0 0 0 0 0 0
TOTALS 12 351 9 243 -3 -108
Contract Treatment
Programs
Student
Capacity
(/Program)
Student
Capacity
(Annual)
Actual
Students in
Program
Annual
Student
Capacity
(Projected)
Differences Differences
Substance Abuse 216 432 216 432 0 0
Cognitive-Behavioral 288 960 288 960 0 0
TOTALS 504 1392 504 1392 0 0
Employment ProgramsProgram
Slots
Annual
Served
Inmates
Served
(Actual)
Annual
Served
(Projected)
Differences Differences
Transitions Program 60 540 56 540 -4 0
TOTALS 60 540 56 540 -4 0
VSP is designated as a Re-Entry Hub.
VALLEY STATE PRISON (VSP)
Programs at this institution are to include Academic Education, Career Technical Education, Substance Abuse
Treatment, Cognitive-Behavioral Programs (including criminal thinking, anger management, and family programming),
Employment Training, and a cognitive behavioral based program for life-term inmates. The tables below illustrate the
planned and actual staffing and student capacities by program area:
(Actuals - Final)FY 14-15 December 2014 -
January 2015

Fifth Report on CDCR’s Progress Implementing the Blueprint 71 of 76
Office of the Inspector General State of California
APPENDIX A — PROGRAMMING PLANS
CDCR Figures Actuals Differences
Academic EducationProposed
Staff
Budgeted
Capacity
Actual Staff
(Programs)
Actual
Student
Capacity
Differences Differences
General Population 1 54 0 0 -1 -54
Voluntary Educ. Program 4 480 4 480 0 0
TOTALS 5 534 4 480 -1 -54
Career Technical
Education
Proposed
Staff
Budgeted
Capacity
Actual Staff
(Programs)
Actual
Student
Capacity
Differences Differences
Auto Mechanics 0 0 0 0 0 0
Auto Repair 0 0 0 0 0 0
Building Maintenance 0 0 0 0 0 0
Carpentry 0 0 0 0 0 0
Computer Literacy 0 0 0 0 0 0
Cosmetology 0 0 0 0 0 0
Electric Work 0 0 0 0 0 0
Electronics 1 27 1 27 0 0
HVAC 0 0 0 0 0 0
Machine Shop 0 0 0 0 0 0
Masonry 0 0 0 0 0 0
Office Technologies 1 27 0 0 -1 -27
Plumbing 0 0 0 0 0 0
Sheet Metal 0 0 0 0 0 0
Small Engine Repair 0 0 0 0 0 0
Welding 0 0 0 0 0 0
TBD 0 0 0 0 0 0
TOTALS 2 54 1 27 -1 -27
WSP is designated as a Standard Program Site.
WASCO STATE PRISON (WSP)
Programs at this institution are to include Academic Education and Career Technical Education. The tables below
illustrate the planned and actual staffing and student capacities by program area:
(Actuals - Final)FY 14-15 December 2014 -
January 2015

Fifth Report on CDCR’s Progress Implementing the Blueprint 72 of 76
Office of the Inspector General State of California
Appendix B—Core COMPAS Assessments
The following displays the department’s status in completing core COMPAS assessments
for each inmate to assess his or her rehabilitative needs. The data is as of January 27,
2015.
Institution
Inmate
Population
Inmates with
Core
COMPAS
Inmates
Without
COMPAS
Percent with
Core
COMPAS
Avenal State Prison 4,085 3,421 664 83.7%
California City Correctional Facility 2,036 1,892 144 92.9%
California Correctional Center 4,521 4,324 197 95.6%
California Correctional Institution 4,222 2,789 1,433 66.1%
California Health Care Facility 1,965 672 1,293 34.2%
California Institution for Men 4,421 3,522 899 79.7%
California Institution for Women 1,869 1,429 440 76.5%
California Medical Facility 2,142 990 1,152 46.2%
California Men's Colony 4,068 2,617 1,451 64.3%
California Rehabilitation Center 2,498 2,422 76 97.0%
California State Prison, Los Angeles County 3,546 1,648 1,898 46.5%
California State Prison, Corcoran 4,110 2,356 1,754 57.3%
California State Prison, Sacramento 2,194 926 1,268 42.2%
California State Prison, San Quentin 4,177 1,082 3,095 25.9%
California State Prison, Solano 3,910 2,215 1,695 56.6%
California Substance Abuse Treatment
Facility and State Prison, Corcoran 5,403 3,626 1,777 67.1%
Calipatria State Prison 3,768 2,482 1,286 65.9%
Centinela State Prison 3,240 2,135 1,105 65.9%
Central California Women's Facility 3,390 1,899 1,491 56.0%
Chuckawalla Valley State Prison 2,227 1,808 419 81.2%
Correctional Training Facility 4,625 3,017 1,608 65.2%
Deuel Vocational Institution 2,445 1,161 1,284 47.5%
Folsom State Prison 2,518 1,524 994 60.5%
Folsom Women's Facility 506 503 3 99.4%
High Desert State Prison 3,508 2,616 892 74.6%
Ironwood State Prison 3,114 2,144 970 68.9%
Kern Valley State Prison 3,792 2,367 1,425 62.4%
Mule Creek State Prison 2,851 1,405 1,446 49.3%
North Kern State Prison 4,247 1,826 2,421 43.0%
Out of State Correctional Facilities-Various 8,844 6,199 2,645 70.1%
Pelican Bay State Prison 2,636 1,366 1,270 51.8%
Pleasant Valley State Prison 3,256 2,426 830 74.5%
Richard J. Donovan Correctional Facility 3,094 1,643 1,451 53.1%
Salinas Valley State Prison 3,622 1,770 1,852 48.9%
Sierra Conservation Center 4,432 3,602 830 81.3%
Valley State Prison 3,132 2,282 850 72.9%
Wasco State Prison 4,966 1,880 3,086 37.9%
TOTALS 129,380 81,986 47,394 63.4%
* Miscellanous pertains to special non-state prison housing such as community correctional facilities or special housing programs.
* Miscellanous-Special Housing / Non-State Prisons 4,726

Fifth Report on CDCR’s Progress Implementing the Blueprint 73 of 76
Office of the Inspector General State of California
Appendix C—Housing Plans
The following pages display the information the OIG summarized after reviewing data
and documents to assess whether the department is housing inmates consistent with the
housing plans identified in the Blueprint.
The first page of Appendix C displays a summary of a comparison of actual population
data against the design capacity beds identified for each prison in the Blueprint.26
The
data is summarized by different housing types. This comparison was performed to assess
whether the actual housing of inmates is consistent with the level and types of housing
identified in the Blueprint. The data show that in each of the major categories, the
department is consistently surpassing the inmate housing levels for each individual
housing type identified in the Blueprint, as the overcrowding rate is over 100 percent in
each major category. There are only a few housing categories that show a housing rate
less than 100 percent, and those categories are for special types of housing, such as beds
for condemned inmates, hospice beds, or mental health crisis beds.27
The subsequent pages of Appendix C display data in summary format by institution totals
and then unit total for each institution. The OIG compared the individual Blueprint
housing plans for each institution at the unit level against positive shift count reports
obtained at each institution. These reports allowed a snapshot view of the inmate
population for each housing unit in operation. The summary pages compare the design
capacity against the actual inmate population on February 2, 2015. Several institutions
had vacant housing units at the time of the review due to maintenance or conversion. The
department plans to have inmates housed in some of those units once maintenance and
conversion are completed. The capacity data that were identified in the Blueprint are
color coded in green, while the data from the positive shift count reports and the
calculations the OIG derived from the data are in yellow.
In summary, the OIG’s assessment found that the actual housing of inmates is
substantially consistent with the housing plans identified in the Blueprint.
26
The electronic population data is effective February 2, 2015, and was provided by CDCR.
27 Some of the beds identified in Appendix D are for very temporary housing. However, the OIG identified
them since they are identified in the Blueprint.

Fifth Report on CDCR’s Progress Implementing the Blueprint 74 of 76
Office of the Inspector General State of California
Appendix C—Housing Plans
CDCR Inmate Population Summary Per Housing Type
Male Prisons
General Population (GP) /A
GP Level
Blueprint
Design Beds Population /B Difference
Overcrowding
Rate
Level I 7,664 5,568 -2,096 73%
Level II 15,254 24,763 9,509 162%
Level III 10,934 9,939 -995 91%
Level IV 8,228 13,307 5,079 162%
GP, Level Unknown 380 380
Subtotal, General Population 42,080 53,957 11,877 128%
Special Needs Yards (SNY) /A
SNY Level
Blueprint
Design Beds Population /B Difference
Overcrowding
Rate
Level I 619 1,348 729 218%
Level II 7,654 16,612 8,958 217%
Level III 5,650 8,539 2,889 151%
Level IV 4,896 8,182 3,286 167%
SNY, Level Unknown 216 216
Subtotal, Special Needs Yards 18,819 34,897 16,078 185%
Miscellaneous Housing Types - Various Prison or Off-Site Locations
Housing Type
Blueprint
Design Beds Population /B Difference
Overcrowding
Rate
Administrative Segregation Unit 5,601 5,288 -313 94%
Fire Camps /C 3,924 3,537 -387 90%
Reception Center 4,972 10,716 5,744 216%
Segregated Housing Unit 2,934 3,455 521 118%
Subtotal, Various Housing Types 17,431 22,996 5,565 132%
Miscellaneous Housing Types-Limited Prison Locations
Housing Type
Blueprint
Design Beds Population /B Difference
Overcrowding
Rate
Acute Care 150 303 153 202%
CHCF CTC Medical High Acuity 420 323 -97 77%
CHCF OHU Medical Low Acuity 590 413 -177 70%
Condemned 684 679 -5 99%
General Acute Care Hospital 29 84 55 290%
Hospice 17 14 -3 82%
Integrated Housing Unit 200 219 19 110%
Intermediate Care Facility 879 720 -159 82%
Mental Health Crisis Beds 282 388 106 138%
Protective Housing Unit 20 11 -9 55%
Psychiatric Services Unit 512 386 -126 75%
Subtotal, Limited Housing Types 3,783 3,540 -243 94%
Subtotal, Male Prisons and Camps 82,113 115,390 33,277 141%
Female Prisons
Housing Types
Blueprint
Design Beds Population /B Difference
Overcrowding
Rate
Acute Care 45 46 1 102%
Administrative Segregation Unit 83 50 -33 60%
Condemned 17 16 -1 94%
Fire Camps /C 320 223 -97 70%
General Population 2,904 4,633 1,729 160%
Psychiatric Services Unit 23 10 -13 43%
Reception Center 356 621 265 174%
Segregated Housing Unit 60 63 3 105%
Subtotal, Female Prisons and Camps 3,808 5,662 1,854 149%
Blueprint
Design Beds Population /B Difference
Overcrowding
Rate
Totals, CDCR Prisons-Inmate Population 85,921 121,052 35,131 141%
/A - The data for the GP and SNY tables include Enhanced Outpatient Program (EOP) inmate design beds and population.
/B - The inmate population is based on Februray 2, 2015 data from the CDCR Office of Research; however, the inmate
population for female prisons in the segregated housing unit was obtained as of Februrary 6, 2015.
/C - The fire camp capacities are higher than Blueprint levels due to approved budget proposal.

Fifth Report on CDCR’s Progress Implementing the Blueprint 75 of 76
Office of the Inspector General State of California
Appendix C—Housing Plans
INSTITUTION * DESIGN CAPACITY
* STAFFED
CAPACITY
TOTAL INMATE
COUNTS
REVIEWED
BY OIG
(FEBRUARY 5,
2015)
OVERCROWDING RATE
ON REVIEW DATE
(BASED ON DESIGN
CAPACITY)
Avenal State Prison 2,920 4,702 4,053 139%
California Correctional Center 3,883 4,872 4,460 115%
California Correctional Institution 2,783 4,414 4,186 150%
California Health Care Facility 2,951 2,951 1,946 66%
California Institution for Men 2,976 4,728 4,226 142%
California Institution for Women 1,398 2,042 1,823 130%
California Medical Facility 2,361 2,756 2,131 90%
California Men's Colony 3,838 4,668 4,050 106%
California Rehabilitation Center 2,491 3,487 2,464 99%
California State Prison, Corcoran 3,116 4,445 4,111 132%
California State Prison, Los Angeles County 2,300 3,600 3,491 152%
California State Prison, Sacramento 1,828 2,312 2,173 119%
California State Prison, San Quentin 3,082 4,006 4,123 134%
California State Prison, Solano 2,610 3,890 3,879 149%
California Substance Abuse Treatment Facility 3,424 5,474 5,387 157%
Calipatria State Prison 2,308 3,883 3,723 161%
Centinela State Prison 2,308 3,433 3,217 139%
Central California Women's Facility 2,004 3,515 3,346 167%
Chuchawalla Valley State Prison 1,738 2,641 2,204 127%
Correctional Training Facility 3,312 5,231 4,616 139%
Deuel Vocational Institution 1,681 2,586 2,342 139%
Folsom State Prison 2,066 2,895 2,499 121%
Folsom Women's Facility 403 483 483 120%
High Desert State Prison 2,324 3,461 3,497 150%
Ironwood State Prison 2,200 3,175 3,116 142%
Kern Valley State Prison 2,448 3,910 3,783 155%
Mule Creek State Prison 1,700 2,807 2,835 167%
North Kern State Prison 2,694 4,529 4,140 154%
Pelican Bay State Prison 2,380 3,032 2,615 110%
Pleasant Valley State Prison 2,308 3,533 3,227 140%
Richard J. Donavon Correctional Facility 2,200 3,305 3,064 139%
Salinas Valley State Prison 2,452 3,657 3,578 146%
Sierra Conservation Center 3,736 4,784 4,352 116%
Valley State Prison 1,980 3,390 3,108 157%
Wasco State Prison 2,984 4,997 4,836 162%
87,187 127,594 117,084 134%
* Design and staffed capacity totals per institution were obtained from CDCR's Weekly Report of Population as of January 31, 2015.
HOUSING PLAN - STATEWIDE SUMMARY
GRAND TOTAL

Fifth Report on CDCR’s Progress Implementing the Blueprint 76 of 76
Office of the Inspector General State of California
Appendix C—Housing Plans
INSTITUTION INSTITUTION
Housing Unit
Count Per
Blueprint
Housing Units -
VACANT
Housing Units
In Use
Reviewed by
OIG
(February 10,
2015)
Percent Of
Housing
Units In
Use
Avenal State Prison ASP 25 0 25 100%
California Correctional Center CCC 31 0 31 100%
California Correctional Institution CCI 37 2 35 95%
California Health Care Facility * CHCF 29 2 27 93%
California Institution for Men CIM 30 1 29 97%
California Institution for Women CIW 21 2 19 91%
California Medical Facility CMF 41 2 39 95%
California Men's Colony CMC 19 1 18 95%
California Rehabilitation Center CRC 51 6 45 88%
California State Prison, Corcoran COR 41 4 37 90%
California State Prison, Los Angeles County LAC 23 0 23 100%
California State Prison, Sacramento SAC 27 0 27 100%
California State Prison, San Quentin SQ 29 0 29 100%
California State Prison, Solano SOL 24 0 24 100%
California Substance Abuse Treatment Facility SATF 31 0 31 100%
Calipatria State Prison CAL 24 0 24 100%
Centinela State Prison CEN 24 1 23 96%
Central California Women's Facility CCWF 20 0 20 100%
Chuchawalla Valley State Prison CVSP 15 0 15 100%
Correctional Training Facility CTF 23 0 23 100%
Deuel Vocational Institution DVI 17 1 16 94%
Folsom State Prison FSP 21 1 20 95%
Folsom Women's Facility FWF 2 0 2 100%
High Desert State Prison HDSP 29 1 28 97%
Ironwood State Prison ISP 22 0 22 100%
Kern Valley State Prison KVSP 36 0 36 100%
Mule Creek State Prison MCSP 19 0 19 100%
North Kern State Prison NKSP 26 0 26 100%
Pelican Bay State Prison PBSP 42 1 41 98%
Pleasant Valley State Prison PVSP 24 1 23 96%
Richard J. Donavon Correctional Facility RJD 24 0 24 100%
Salinas Valley State Prison SVSP 31 0 31 100%
Sierra Conservation Center SCC 31 0 31 100%
Valley State Prison VSP 16 0 16 100%
Wasco State Prison WSP 29 1 28 97%
GRAND TOTAL 934 27 907 97%
* At California Health Care Facility (CHCF), Yard E (previously known as the DeWitt Nelson Correctional Annex) became
operational in April 2014. Thus, the housing unit counts were increased by 5 units at CHCF.
HOUSING UNITS - STATEWIDE SUMMARY

2015 Blueprint
Monitoring Report
OFFICE OF THE INSPECTOR GENERAL
Robert A. Barton INSPECTOR GENERAL
Roy W. Wesley CHIEF DEPUTY INSPECTOR GENERAL
STATE OF CALIFORNIA
March 2015