roadmap2050_volume 3_version a.indd
TRANSCRIPT


roadmap 2050A Practical Guide to a Prosperous, Low-CarbonEurope

4 Roadmap 2050: A practical guide to a prosperous, low-carbon Europe
SOURCE: University of Heidelberg
5OMA/AMO
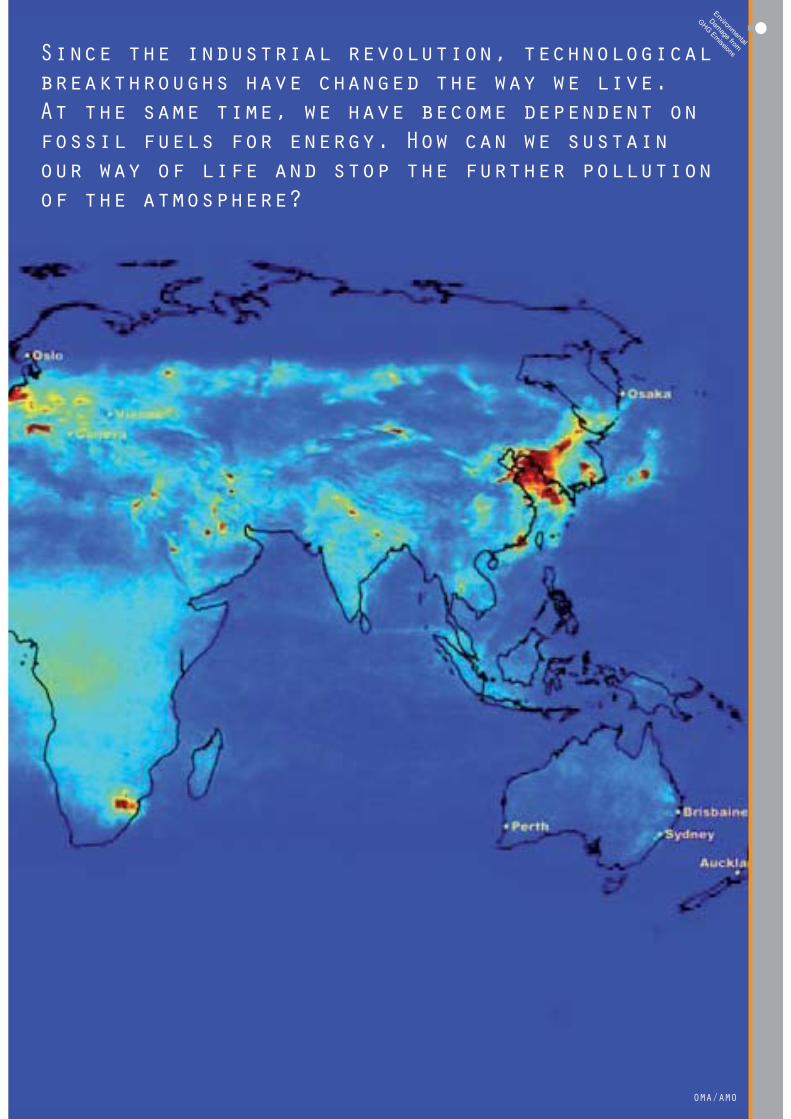
Environmental
Damage from
GHG EmissionsSince the industrial revolution, technological breakthroughs have changed the way we live. At the same time, we have become dependent on fossil fuels for energy. How can we sustain our way of life and stop the further pollution of the atmosphere?

6 Roadmap 2050: A practical guide to a prosperous, low-carbon Europe
Without drastic reductions in global CO2 emissions, the earth’s temperature could rise as much as six degrees Celsius by the end of the century…
SOURCES: www.grida.no/gowww.ipcc.chwww.epa.gov/climatechange There is a general scientifi c consensus that the he Earth’s most extreme temperature has fl uctuated between about 1 degree Celsius for the last 2000yrs. So 2 degrees or even 6 degrees would be a compartively enormous change!

7OMA/AMO
Do Nothing
Scenario
The Decarbonized pathways should be:1. Sustainable, Providing energy security, and re-ducing greenhouse gases.2. Feasible, tech-nically3. Impact Economy in a positive way.
8 Roadmap 2050: A practical guide to a prosperous, low-carbon Europe
Copyright © COP15

9OMA/AMO
COP 15Copenhagen recognized the case for keeping the rise in temperature below 2 degrees, but failed to produce a binding agreement …
10 Roadmap 2050: A practical guide to a prosperous, low-carbon Europe
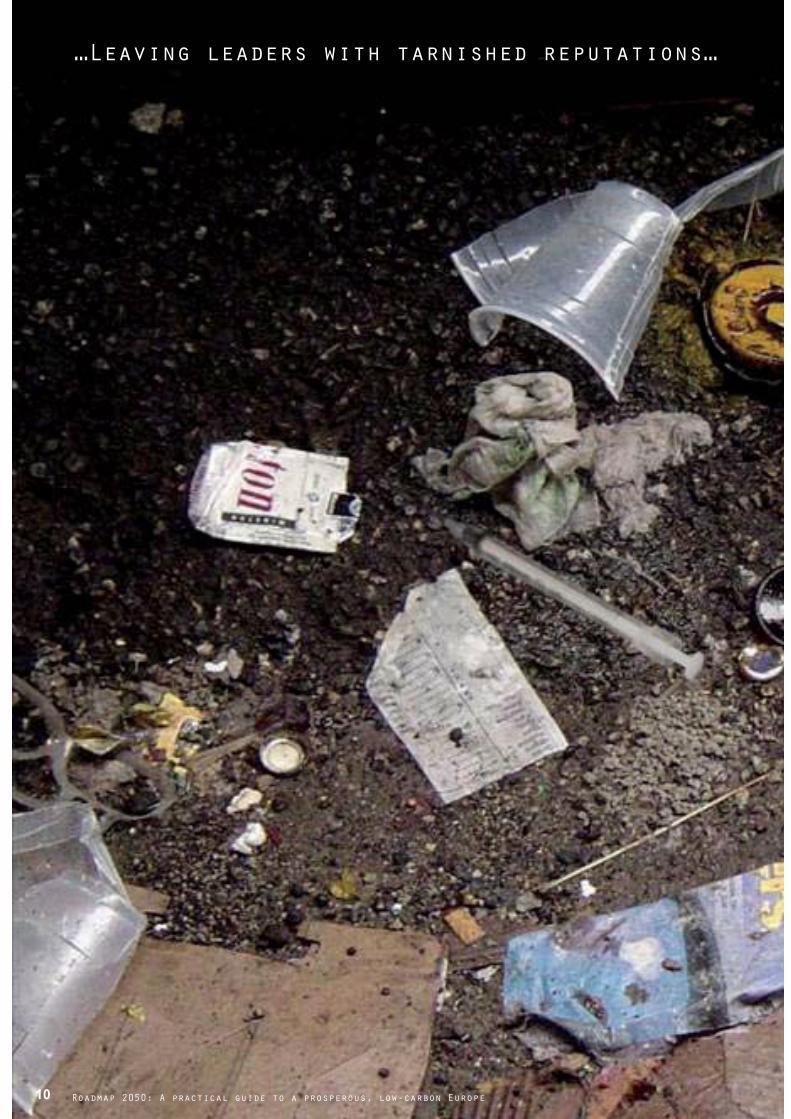
…Leaving leaders with tarnished reputations…

11OMA/AMO
COP Failure

12 Roadmap 2050: A practical guide to a prosperous, low-carbon Europe
… and allowing doubt to prevail in the debate about global warming.
SOURCES: www.economist.com, www.rasmussenreports.com, www.foxnews.com
Climate Science: Spin, Science and Climate Change'Action on climate is justifi ed: not because the science is certain, but precisely because it is not.'Leaders Article in The Economist, March18th 2010
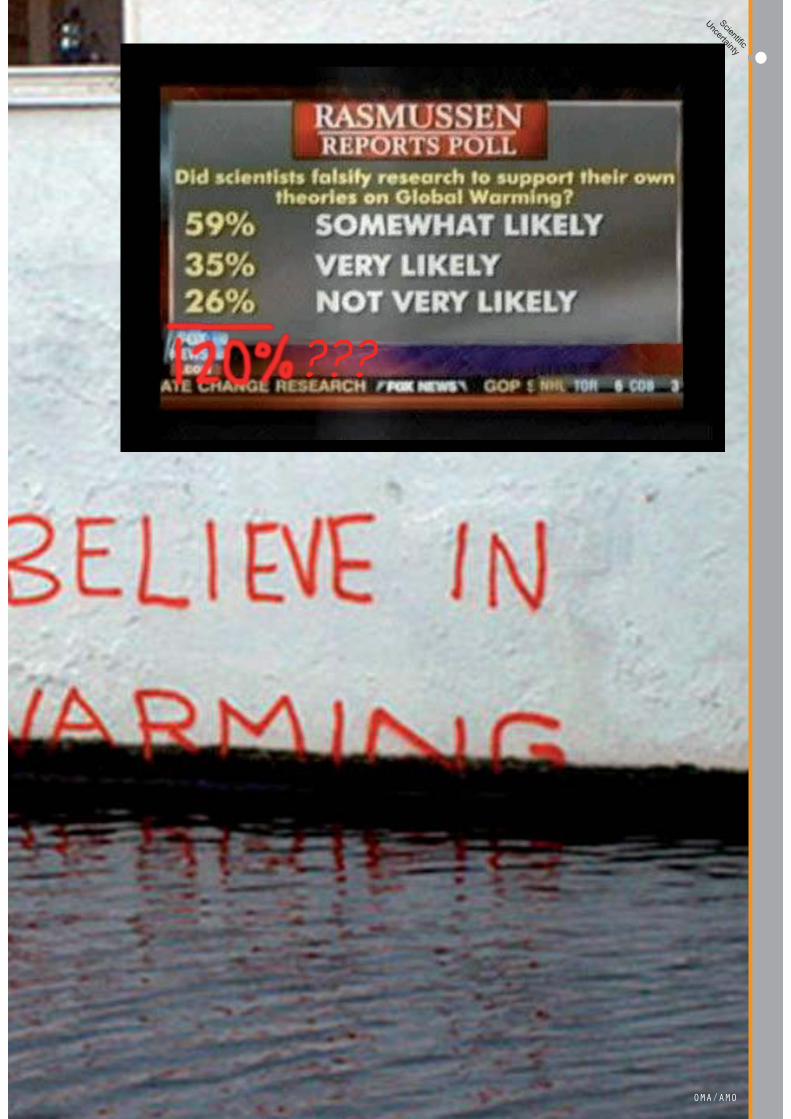
???
13OMA/AMO
Scientifi c
Uncertainty
14 Roadmap 2050: A practical guide to a prosperous, low-carbon Europe
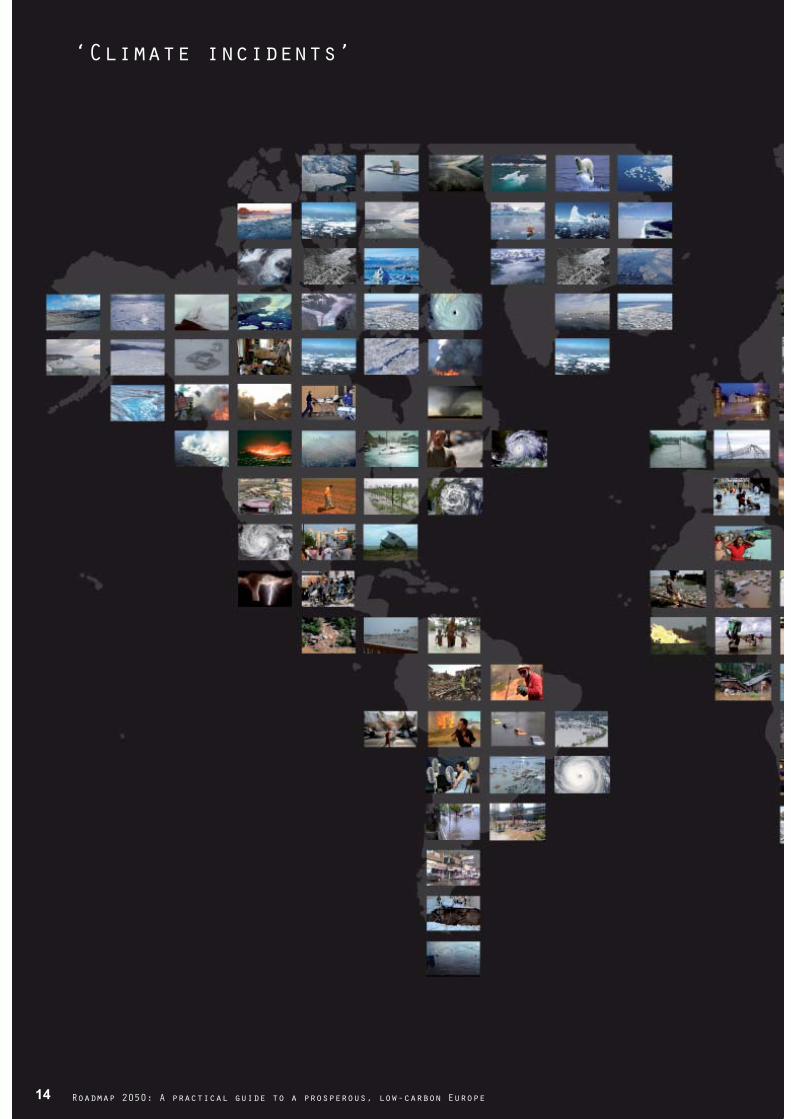
‘Climate incidents’

15OMA/AMO
Climate
Anomalies

16 Roadmap 2050: A practical guide to a prosperous, low-carbon Europe
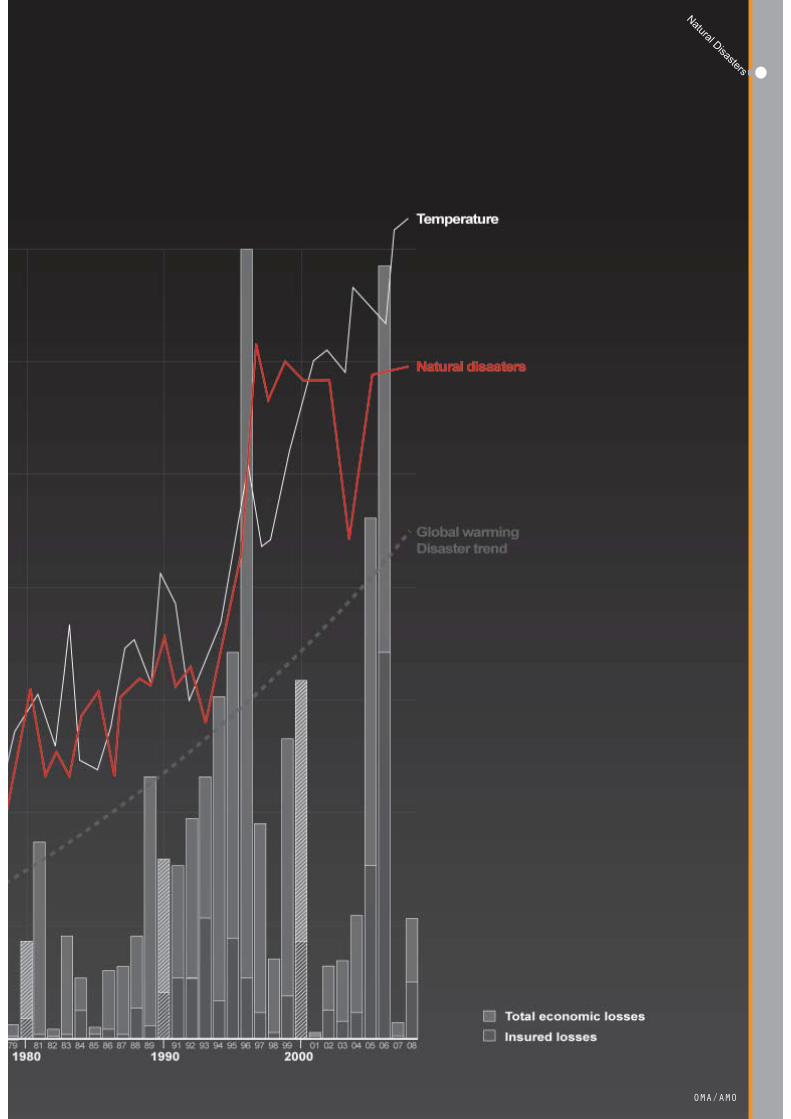
With the cost estimations of natural disasters ever increasing, failure to acknowledge the underlying cause could come at a very high price.
SOURCE: Munich-Re (2009)
17OMA/AMO
Natural Disasters

18 Roadmap 2050: A practical guide to a prosperous, low-carbon Europe
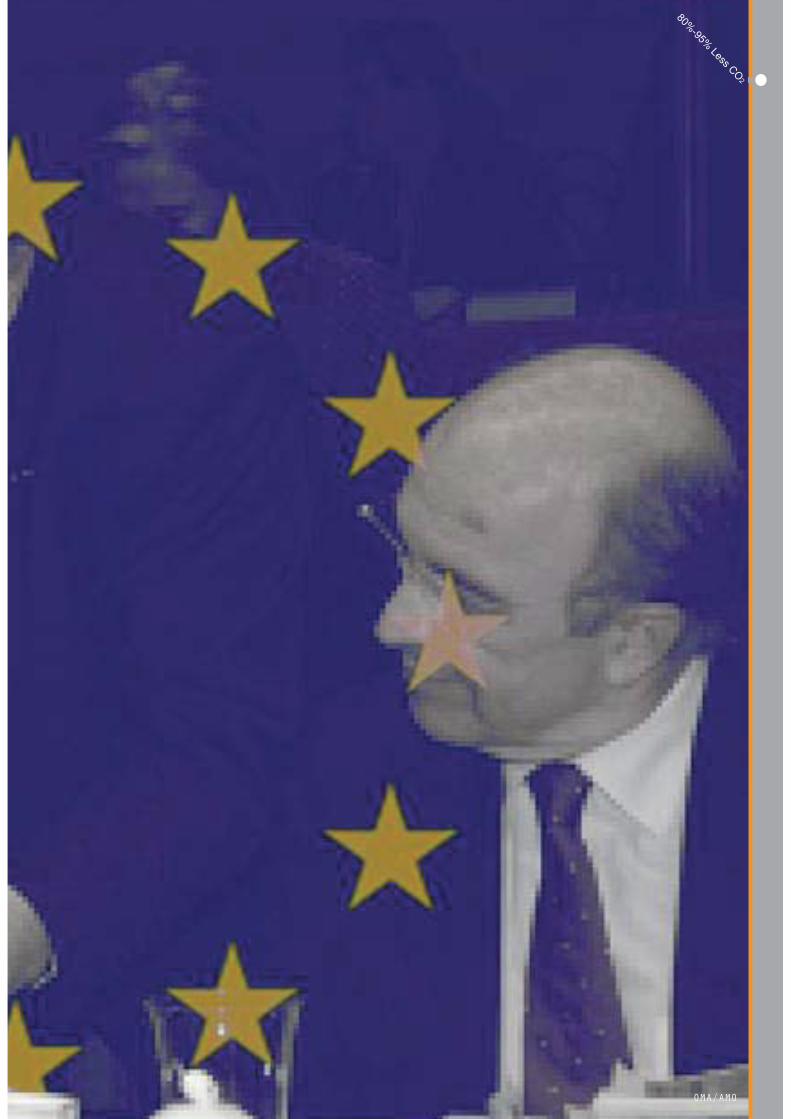
October 30, 2009: European leaders endorse the objective of an 80% - 95% reductions in CO2 emission by 2050.
19OMA/AMO
80%-95% Less CO2
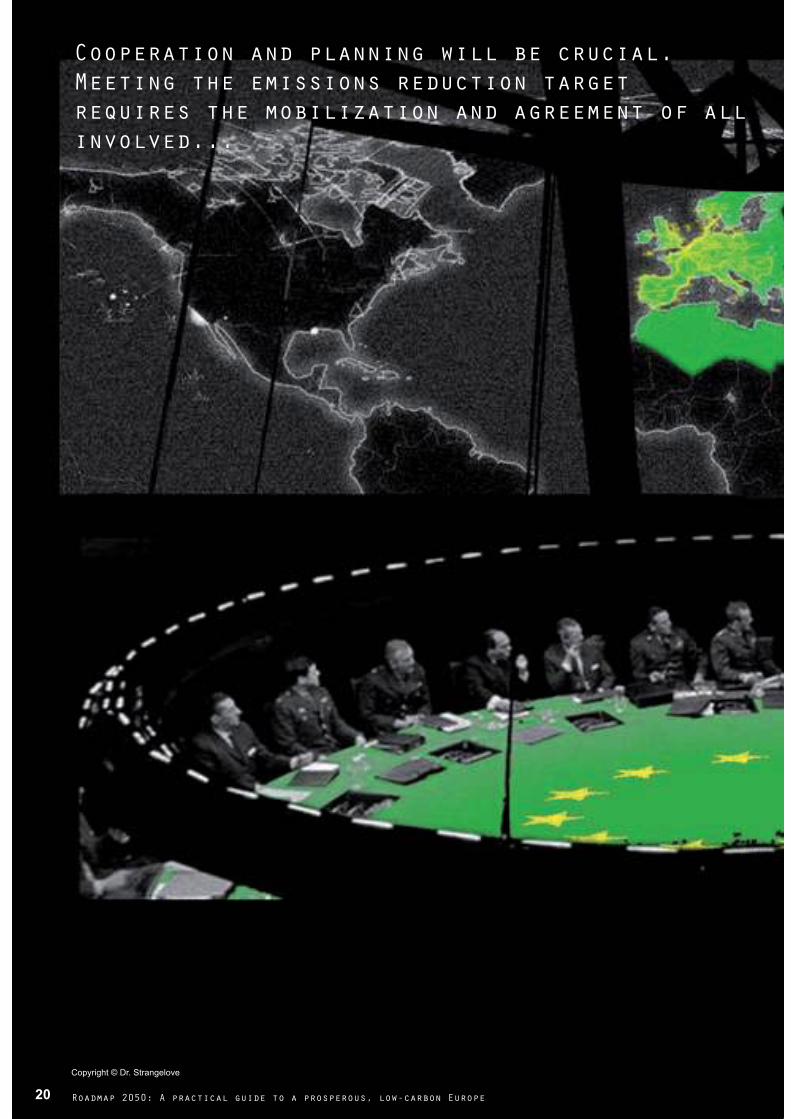
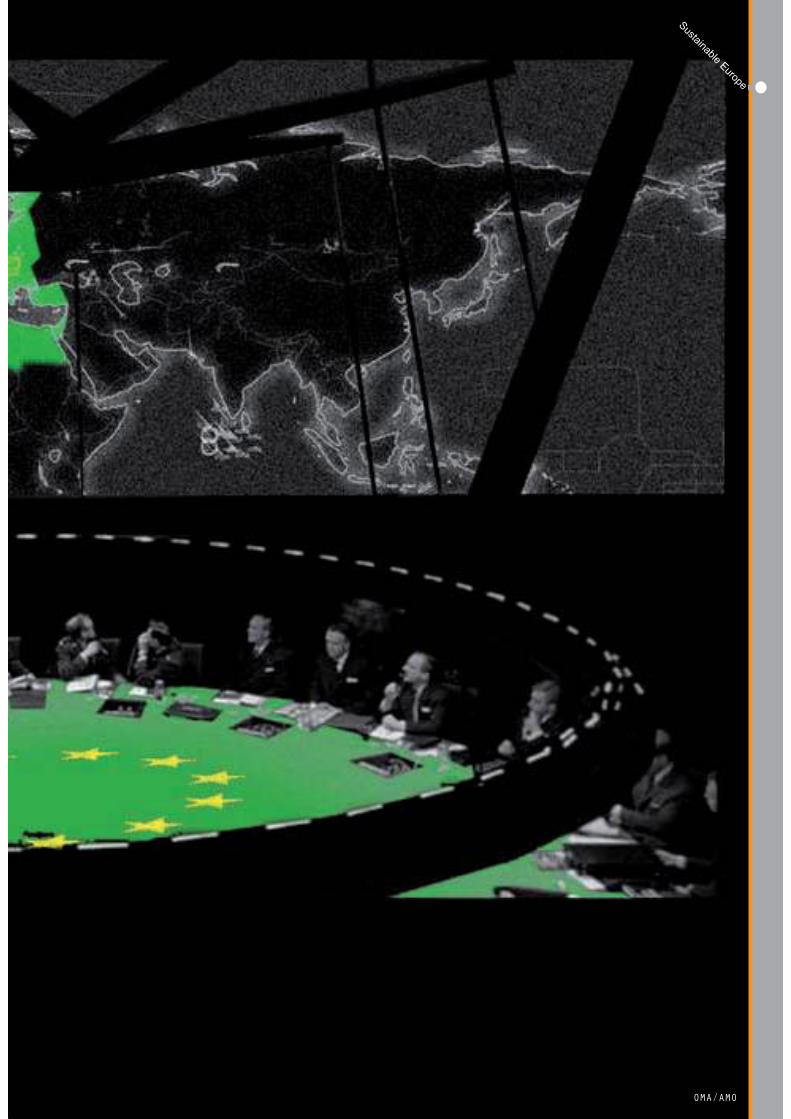
Cooperation and planning will be crucial. Meeting the emissions reduction target requires the mobilization and agreement of all involved...
20 Roadmap 2050: A practical guide to a prosperous, low-carbon Europe
Copyright © Dr. Strangelove
21OMA/AMO
Sustainable Europe
22 Roadmap 2050: A practical guide to a prosperous, low-carbon Europe

23OMA/AMO
History Repeats
“History we know, is apt to repeat itself.”1858 G. Eliot Janet’s Repentance in Scenes of Clerical Life II.

The steam revolution began.
Aristrocrats lobbied against the change...
But, planning & investment triumphed…
The revolution thrived... In less than 40 years, the industrial revolution changed the world forever...
The railroad revolution began.
24 Roadmap 2050: A practical guide to a prosperous, low-carbon Europe
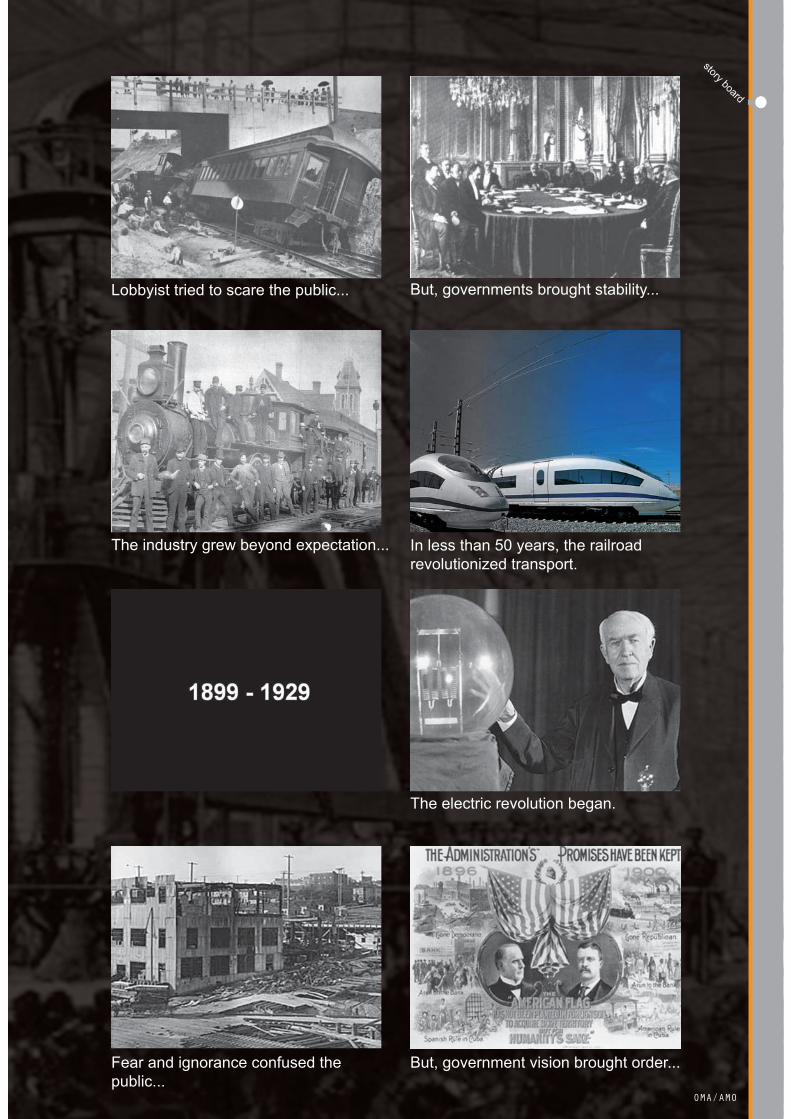
But, governments brought stability...
The industry grew beyond expectation... In less than 50 years, the railroad revolutionized transport.
Lobbyist tried to scare the public...
The electric revolution began.
But, government vision brought order...Fear and ignorance confused the public...
25OMA/AMO
story board

The revolution exploded with innovation... In less than 30 years, the impossible became possible.
The technological revolution began.
But, users overcame the skeptics...
The revolution created new opportunities...
In less than 25 years, technology changed the way we live.
Fear and distrust soared.
26 Roadmap 2050: A practical guide to a prosperous, low-carbon Europe
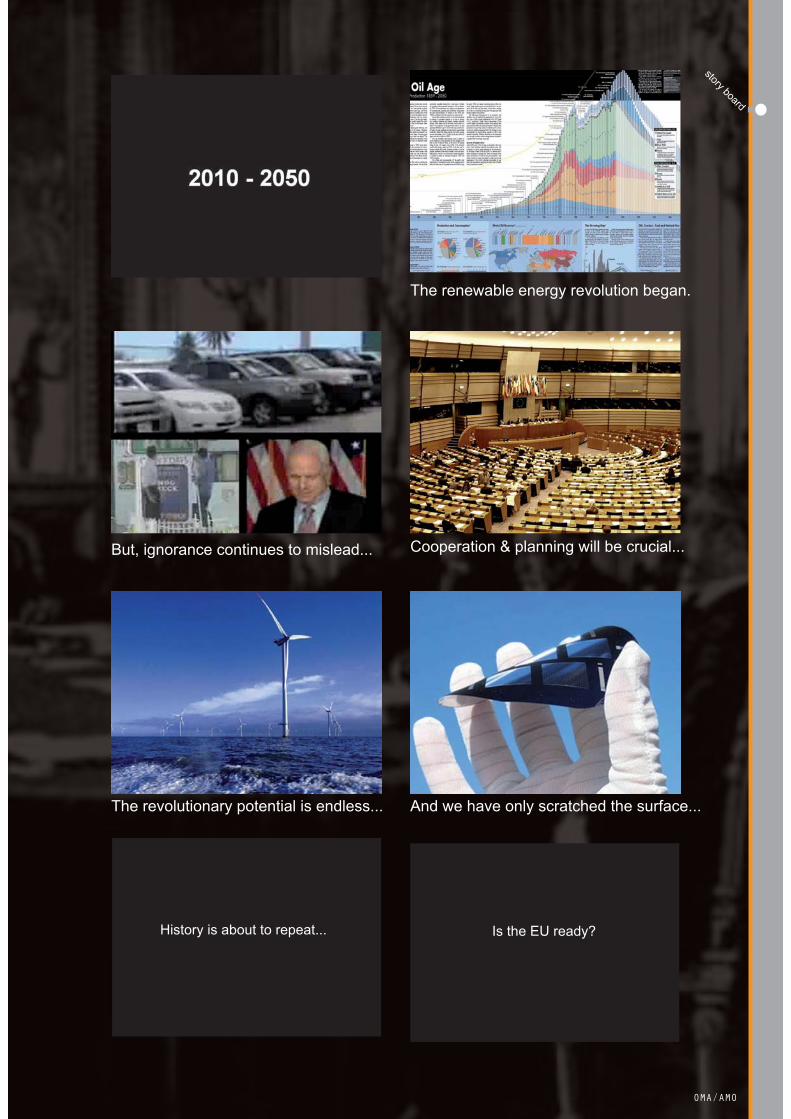
The renewable energy revolution began.
Cooperation & planning will be crucial...
The revolutionary potential is endless... And we have only scratched the surface...
But, ignorance continues to mislead...
History is about to repeat... Is the EU ready?
27OMA/AMO
story board

28 Roadmap 2050: A practical guide to a prosperous, low-carbon Europe
ROADMAP 2050A Practical Guide to a Prosperous,
Low-Carbon Europe
The mission of Roadmap 2050 is to provide a practical, independent and objective
analysis of pathways to achieve a low-carbon economy in Europe,
in line with the energy security, environmental and
economic goals of the European Union.
29OMA/AMO
Roadmap 2050 Mission
30 Roadmap 2050: A practical guide to a prosperous, low-carbon Europe
ROADMAP 2050 PARTNERS

31OMA/AMO
Roadmap 2050 Partners

Note: Hydrocarbons exist in many forms but the principle remains the same. To demonstrate the reaction we us the simplest form of hydrocarbon: Methane (CH4) Other related Hydrocarbons are: Pentane (C5H12) refi ned becomes Octane or petrol (C8H18) Nonane (C9H20) refi ned to hexadecane or diesel fuel (C16H34) Butane (C4H10) For example: C8H18 + 12.5 O2 --> 8 CO2 + 9 H2OThe cycloalkanes, are saturated hydrocarbons which have one or more carbon rings to which hydrogen atoms are attached according to the formula CnH2nThe aromatic hydrocarbons are unsaturated hydrocarbons which have one or more planar six-carbon rings called benzene rings, to which hydrogen atoms are attached with the formula CnHn.
32 Roadmap 2050: A practical guide to a prosperous, low-carbon Europe
CO2 PARADOX
For every barrel of oil we burn three times the quantity of CO2 is being produced. This means our actual carbon footprint is almost three times the size of our oil consumption footprint!

33OMA/AMO
CO2 Paradox
34 Roadmap 2050: A practical guide to a prosperous, low-carbon Europe
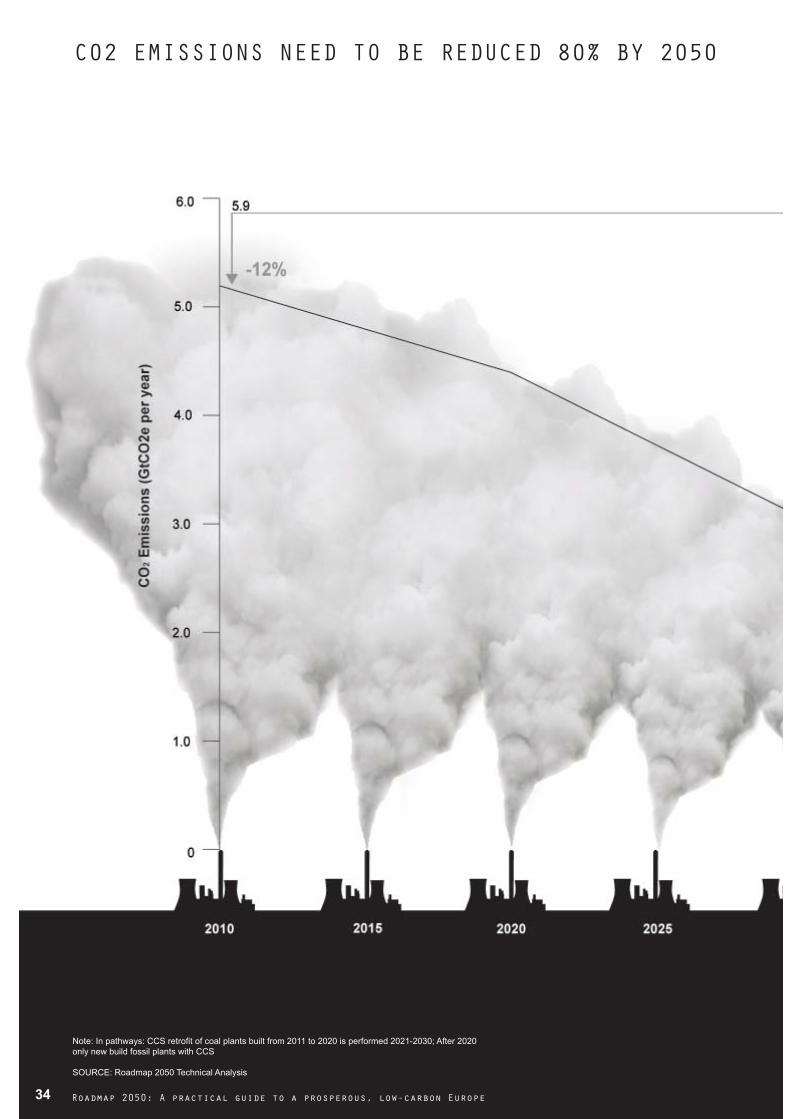
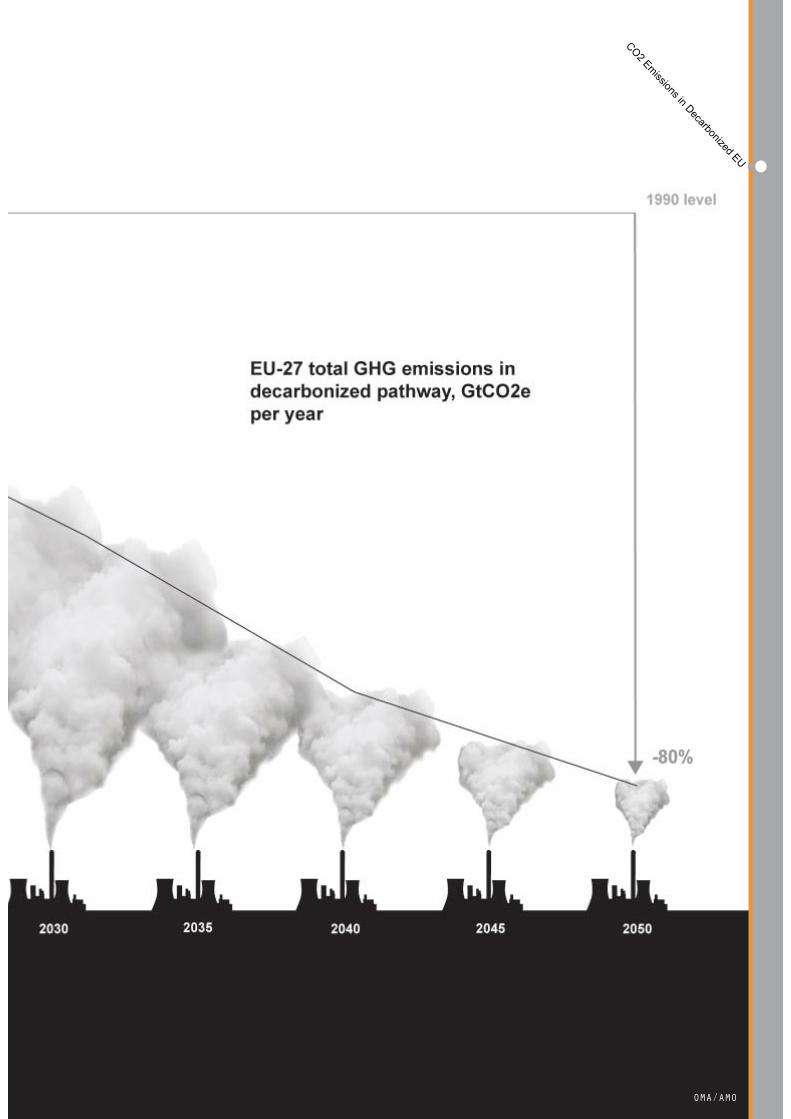
C02 EMISSIONS NEED TO BE REDUCED 80% BY 2050
Note: In pathways: CCS retrofi t of coal plants built from 2011 to 2020 is performed 2021-2030; After 2020 only new build fossil plants with CCS
SOURCE: Roadmap 2050 Technical Analysis
35OMA/AMO
CO2 Emissions in Decarbonized EU

36 Roadmap 2050: A practical guide to a prosperous, low-carbon Europe
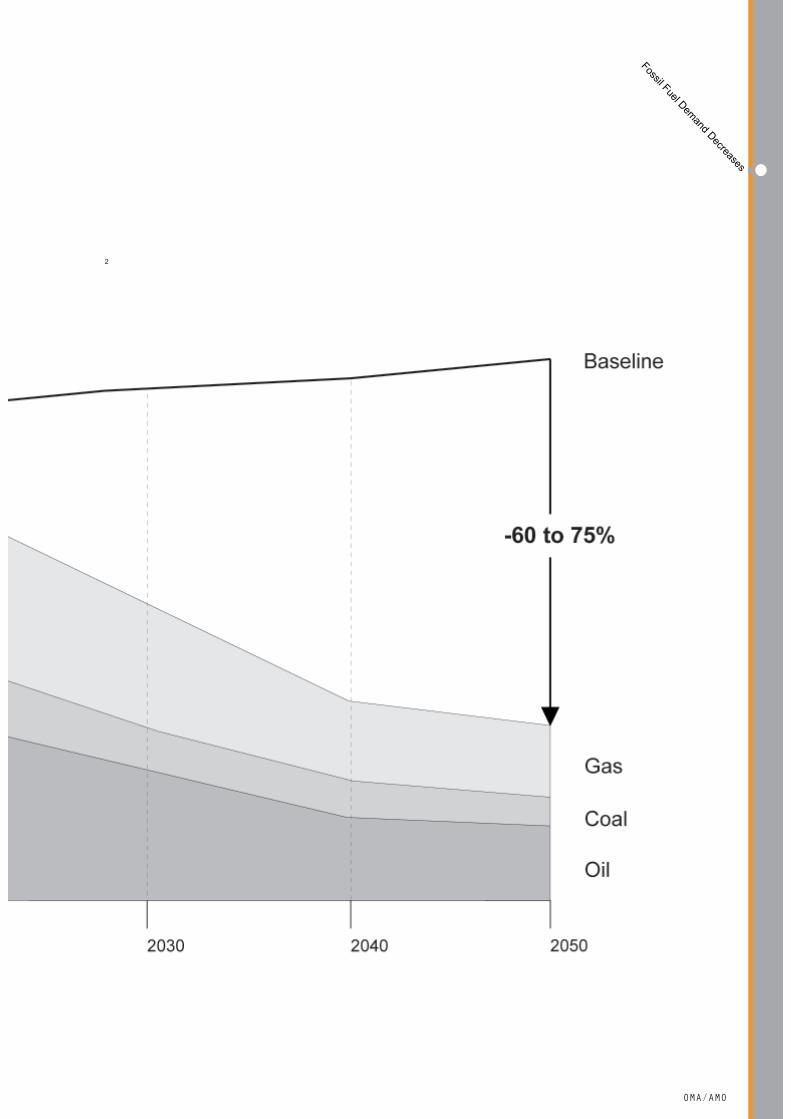
FOSSIL FUEL DEMAND DECREASES SIGNIFICANTLY
1
By 2050 fossil fuel demand for power generation decreases across all sectors/
SOURCE: Roadmap 2050 Technical Analysis
37OMA/AMO
Fossil Fuel Demand Decreases
2
38 Roadmap 2050: A practical guide to a prosperous, low-carbon Europe
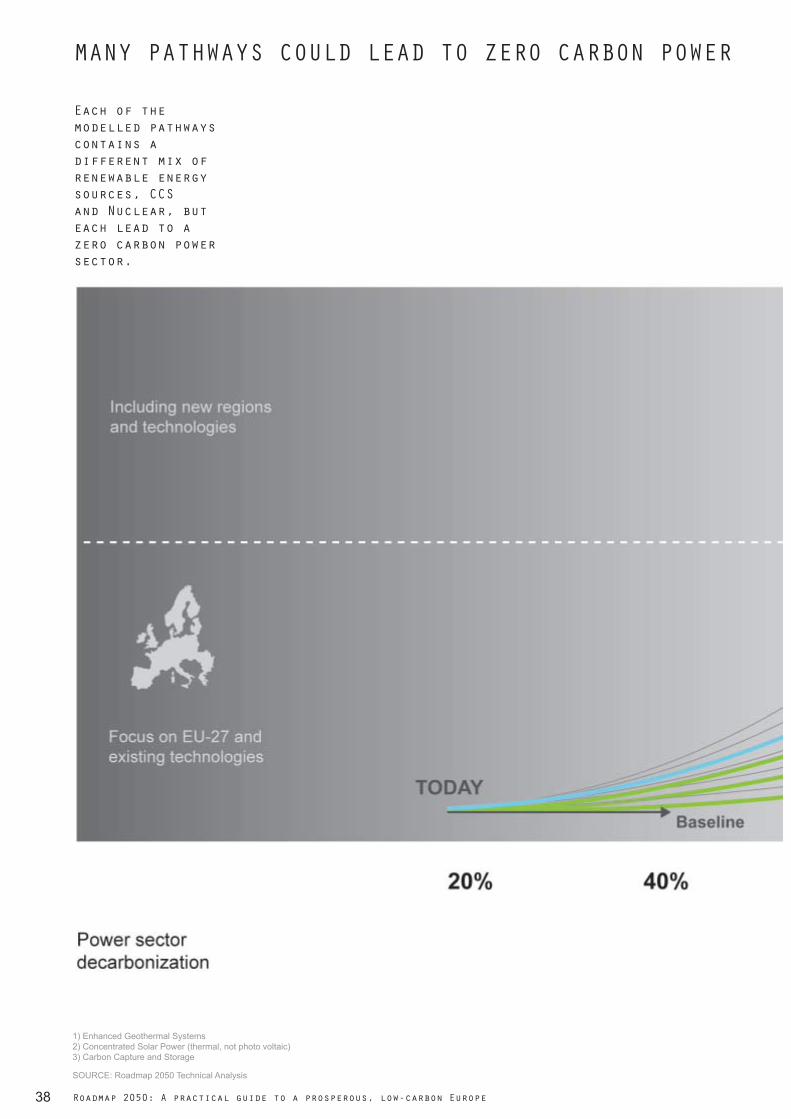
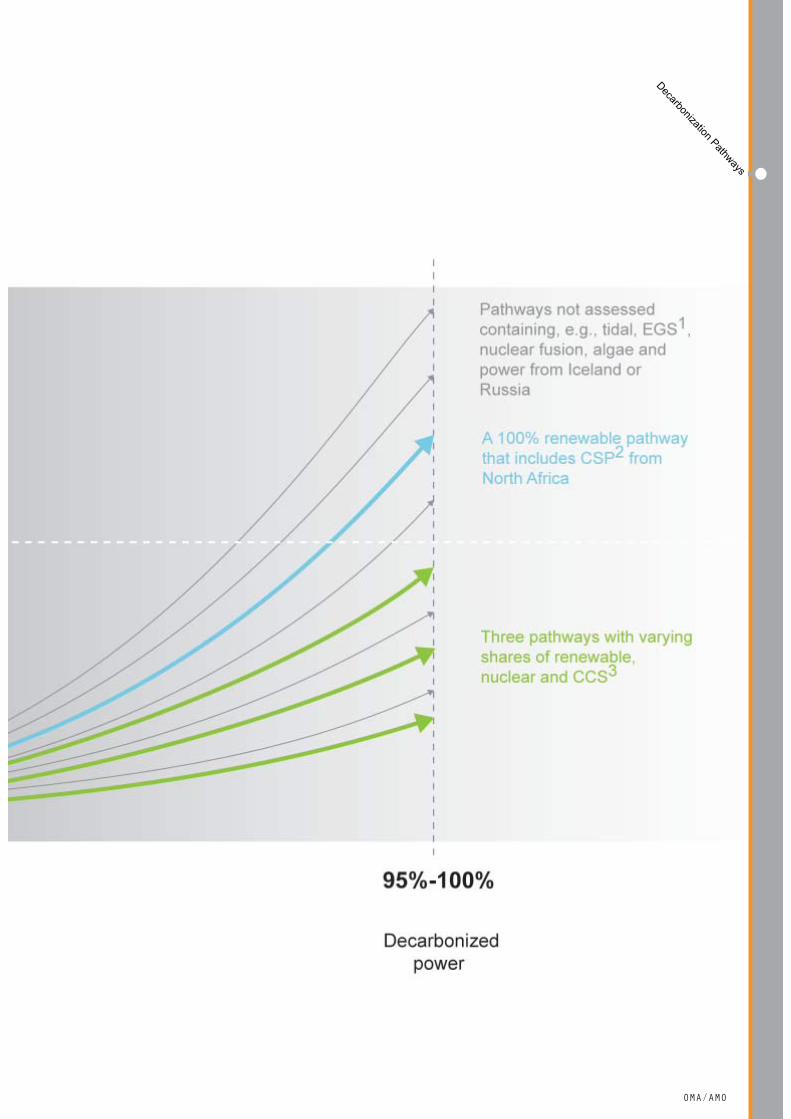
MANY PATHWAYS COULD LEAD TO ZERO CARBON POWER
Each of the modelled pathways contains a different mix of renewable energy sources, CCS and Nuclear, but each lead to a zero carbon power sector.
SOURCE: Roadmap 2050 Technical Analysis
1) Enhanced Geothermal Systems2) Concentrated Solar Power (thermal, not photo voltaic)3) Carbon Capture and Storage
39OMA/AMO
Decarbonization Pathways

40 Roadmap 2050: A practical guide to a prosperous, low-carbon Europe
1 Based on the McKinsey Global GHG Cost Curve
2 Large effi ciency improvements already included in the baseline
3 CCS applied to 50% of industry (cement, chemistry, iron and steel, petroleum and gas, not applied to other industries)
SOURCE: McKinsey Global GHG Abatement Cost Curve; IEA WEO 2009; US EPA; EEA; Roadmap 2050 Technical Analysis
41OMA/AMO
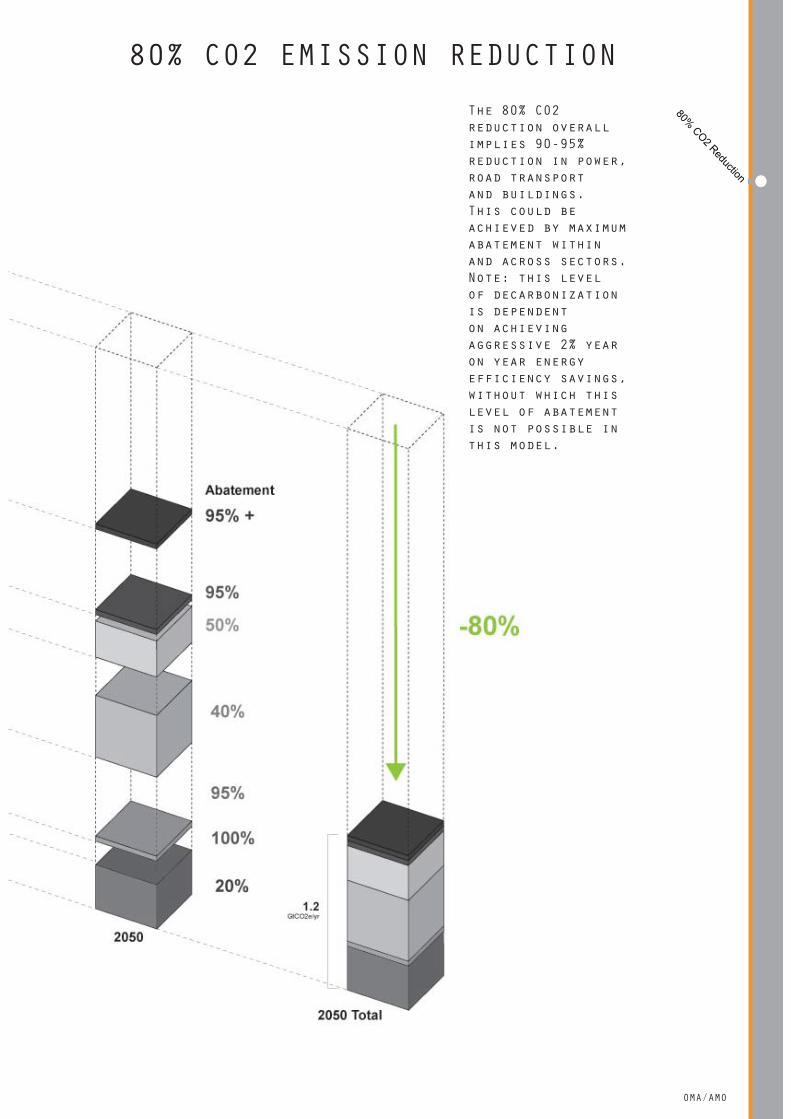
80% CO2 Reduction80% CO2 EMISSION REDUCTION
The 80% CO2 reduction overall implies 90-95% reduction in power, road transport and buildings. This could be achieved by maximum abatement within and across sectors. Note: this level of decarbonization is dependent on achieving aggressive 2% year on year energy efficiency savings, without which this level of abatement is not possible in this model.

42 Roadmap 2050: A practical guide to a prosperous, low-carbon Europe
Compared to current transmission infrastructure, the requirements for transmission capacity between the regions defined in the technical report are significant.
INTER-REGIONAL TRANSMISSION REQUIREMENTS
1 Demand response as used in this paper refers to changing a customer’s electricity demand in response to dispatch instructions or price signals through communications technologies. In the Volume 1 analysis, it is assumed that any such changes retained the total energy consumed within the day, that is, moved or shifted demand rather than reduced total daily consumptionNOTE: Iberia-France link is challenging and maybe reduced by different solar/wind mix.SOURCE: Roadmap 2050 Technical Analysis

43OMA/AMO
Transmission 2050

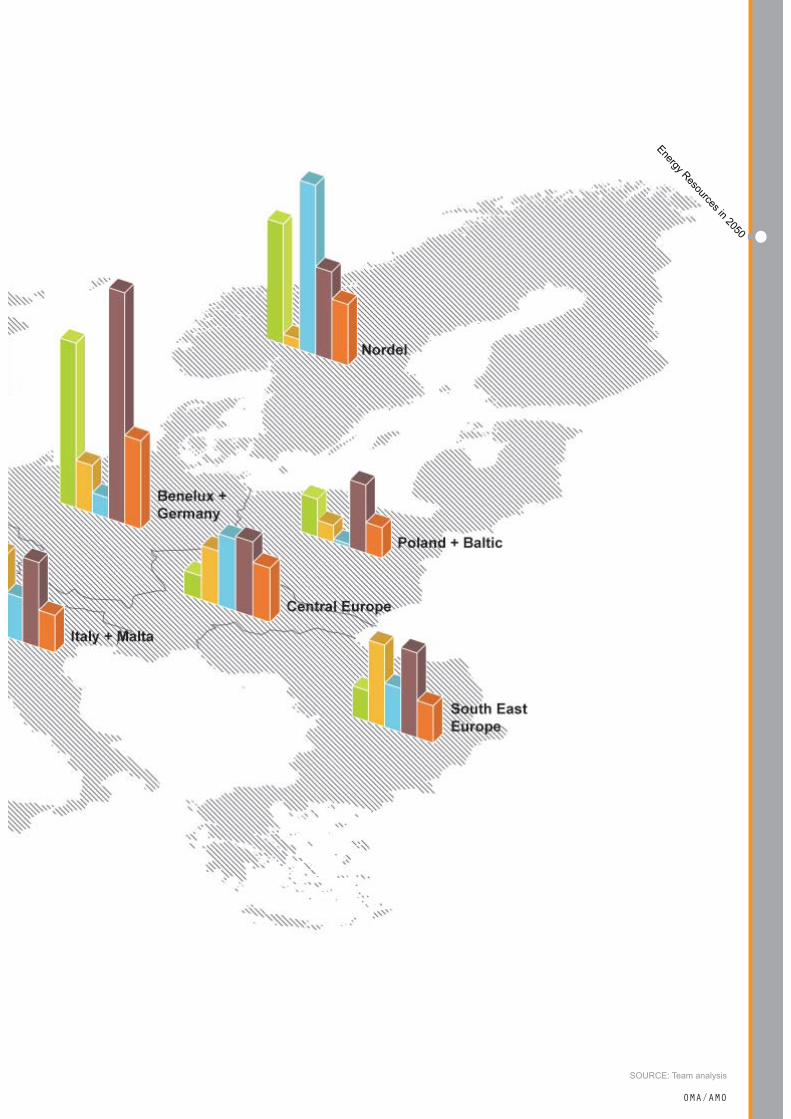
Renewable Technologies are allocated to regions based on the natural occurrence of the renewable source.
44 Roadmap 2050: A practical guide to a prosperous, low-carbon Europe
ENERGY RESOURCES IN 2050 (HIGH RES PATHWAY)
SOURCE: Roadmap 2050 Technical Analysis
45OMA/AMO
Energy Resources in 2050
SOURCE: Team analysis
Feasibility _ Projected Energy Needs
46 Roadmap 2050: A practical guide to a prosperous, low-carbon Europe
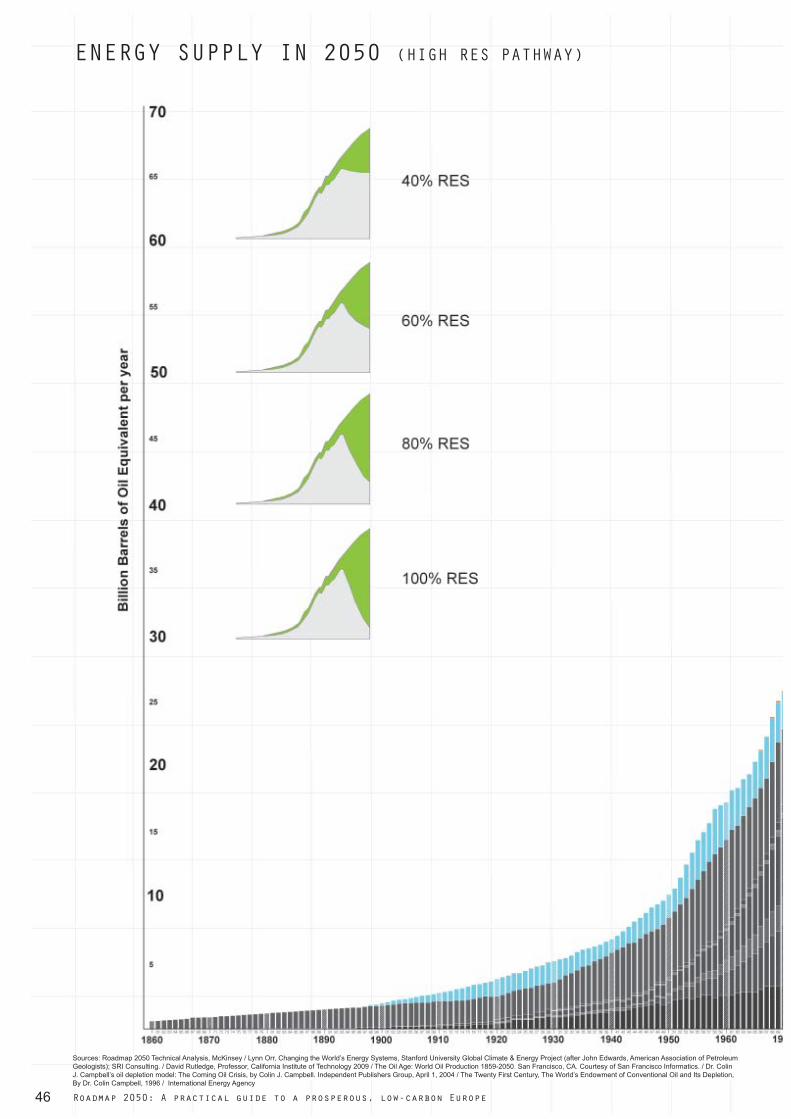
ENERGY SUPPLY IN 2050 (HIGH RES PATHWAY)
Sources: Roadmap 2050 Technical Analysis, McKinsey / Lynn Orr, Changing the World’s Energy Systems, Stanford University Global Climate & Energy Project (after John Edwards, American Association of Petroleum Geologists); SRI Consulting. / David Rutledge, Professor, California Institute of Technology 2009 / The Oil Age: World Oil Production 1859-2050. San Francisco, CA. Courtesy of San Francisco Informatics. / Dr. Colin J. Campbell’s oil depletion model: The Coming Oil Crisis, by Colin J. Campbell. Independent Publishers Group, April 1, 2004 / The Twenty First Century, The World’s Endowment of Conventional Oil and Its Depletion, By Dr. Colin Campbell, 1996 / International Energy Agency

47OMA/AMO
Energy Supply 2050
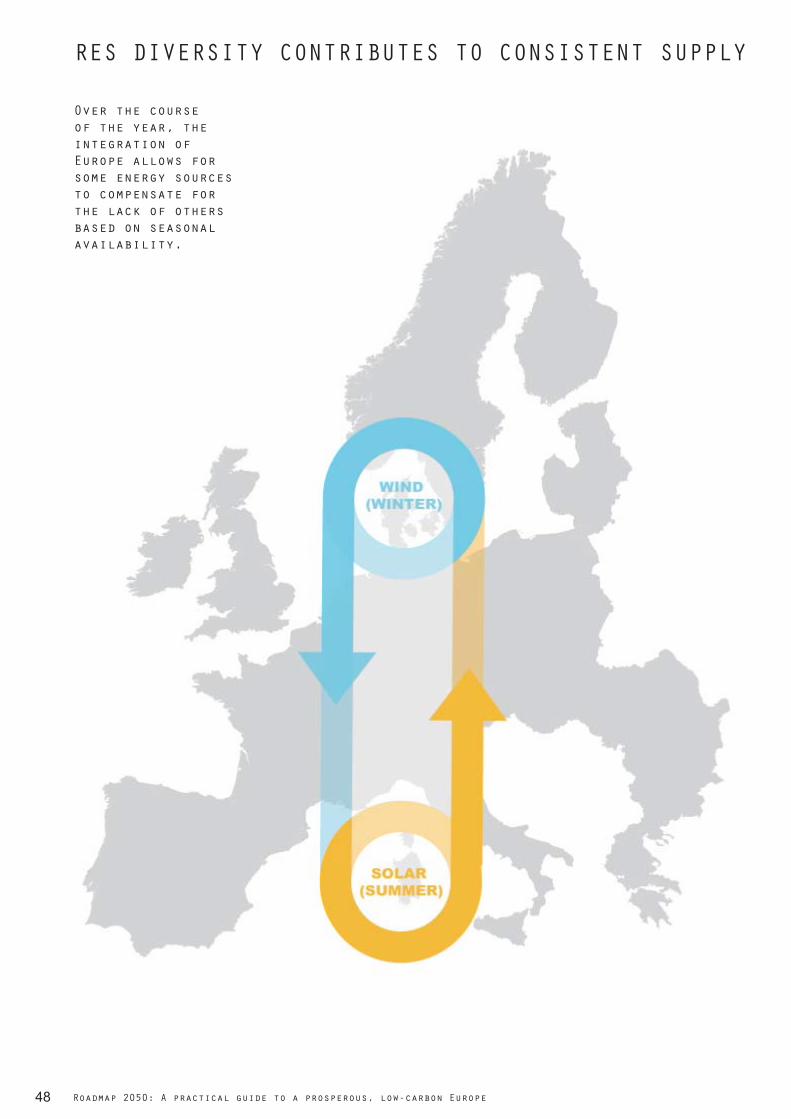
Over the course of the year, the integration of Europe allows for some energy sources to compensate for the lack of others based on seasonal availability.
48 Roadmap 2050: A practical guide to a prosperous, low-carbon Europe
RES DIVERSITY CONTRIBUTES TO CONSISTENT SUPPLY

1
49OMA/AMO
Seasonal Variation Correlates
1 Storage included in the model relates to the existing hydro storage available across the regionsSOURCE: Imperial College, KEMA, Roadmap 2050 Technical Analysis

50 Roadmap 2050: A practical guide to a prosperous, low-carbon Europe
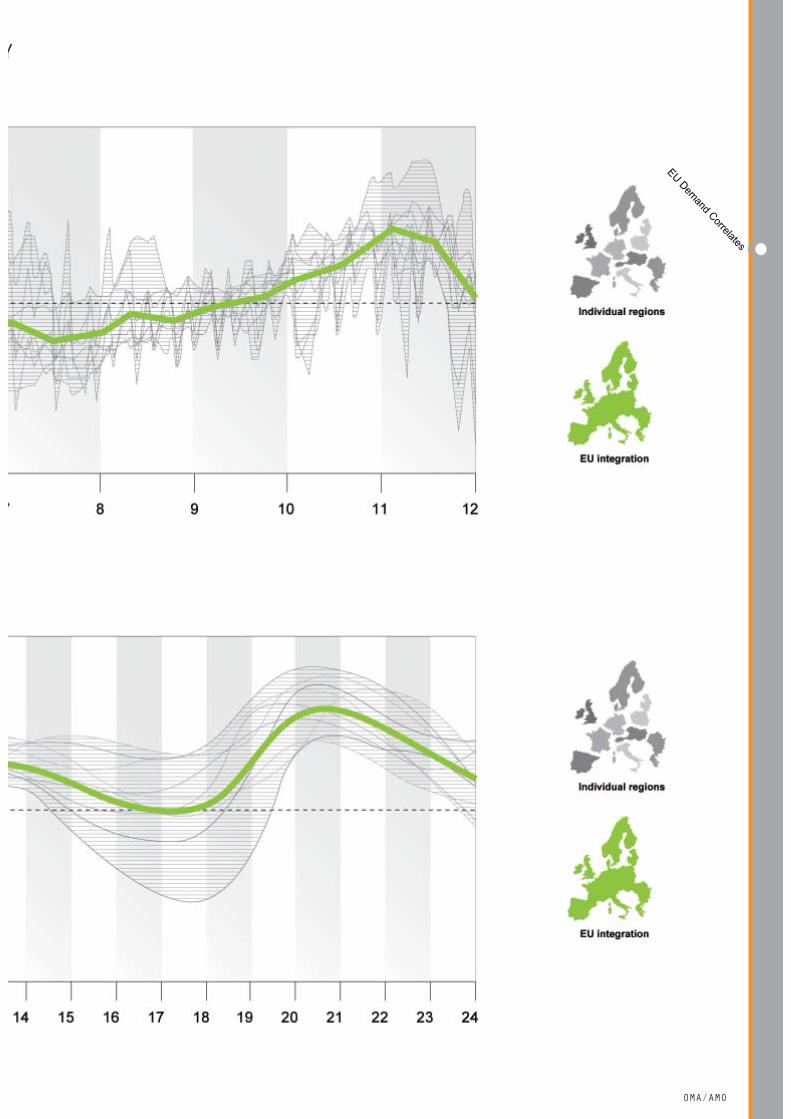
COMBINING REGIONAL DEMAND CURVES REDUCES VOLATILITY
SOURCE: Roadmap 2050 Technical Analysis
51OMA/AMO
EU Demand CorrelatesY
52 Roadmap 2050: A practical guide to a prosperous, low-carbon Europe
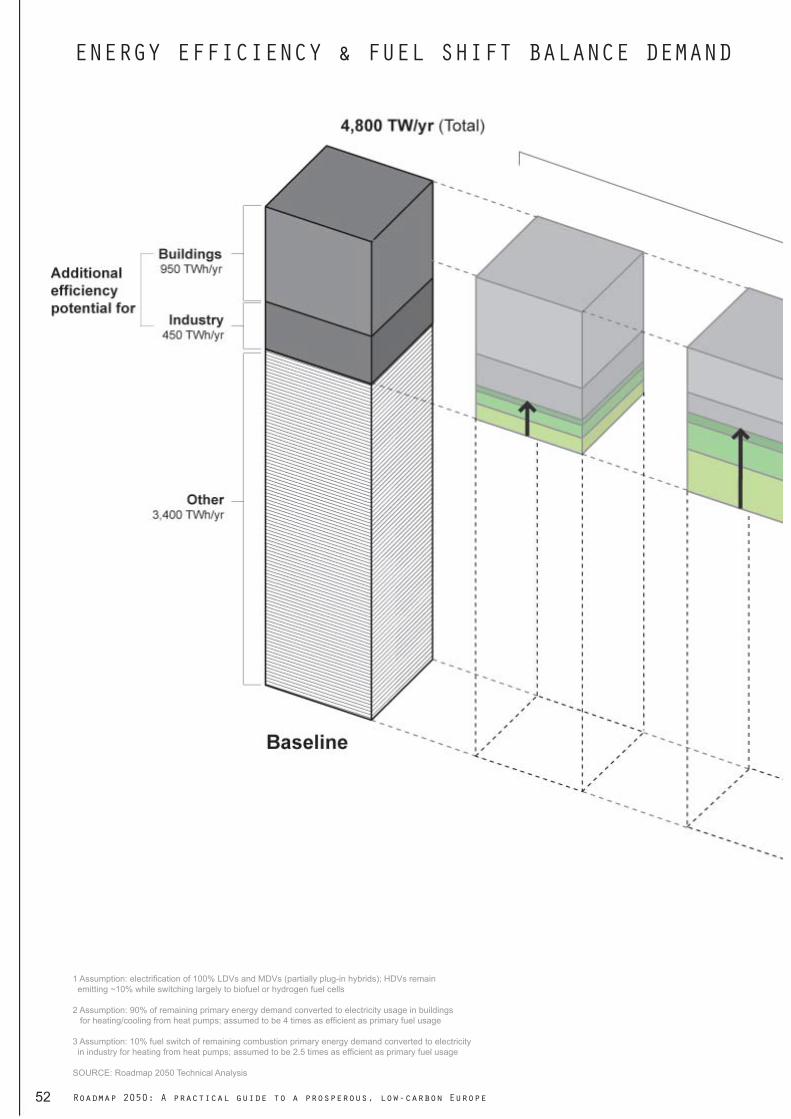
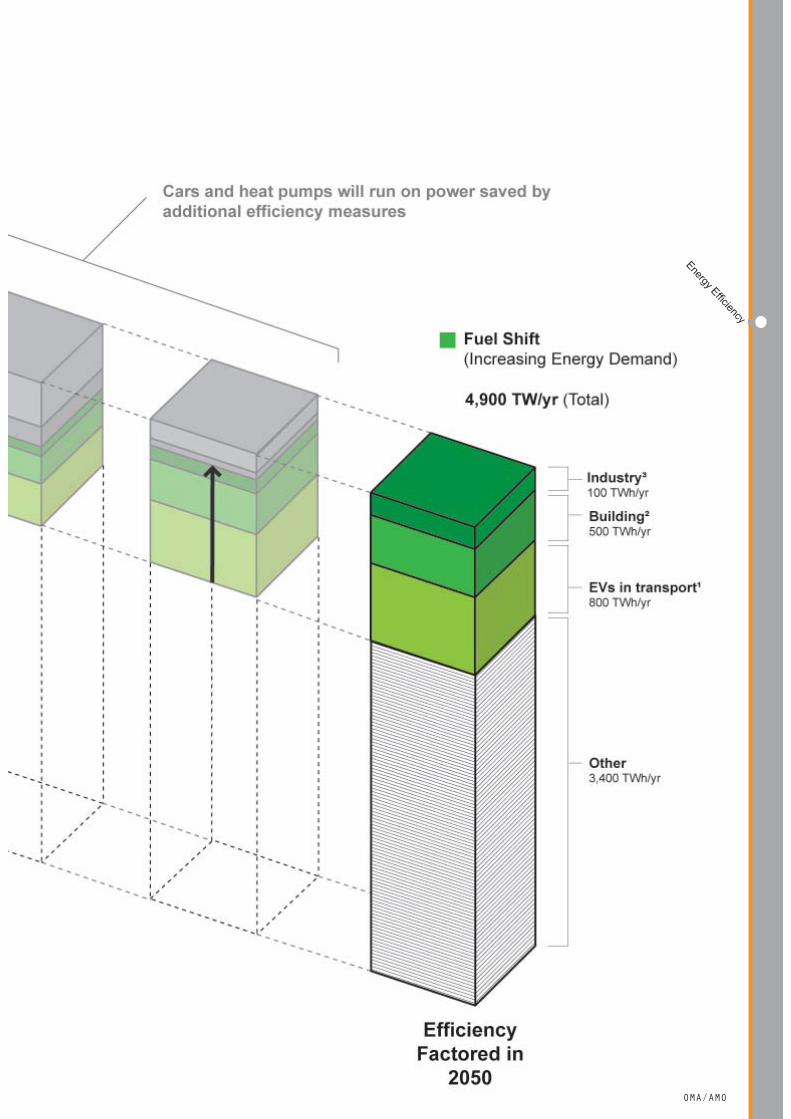
ENERGY EFFICIENCY & FUEL SHIFT BALANCE DEMAND
1 Assumption: electrifi cation of 100% LDVs and MDVs (partially plug-in hybrids); HDVs remain emitting ~10% while switching largely to biofuel or hydrogen fuel cells
2 Assumption: 90% of remaining primary energy demand converted to electricity usage in buildings for heating/cooling from heat pumps; assumed to be 4 times as effi cient as primary fuel usage
3 Assumption: 10% fuel switch of remaining combustion primary energy demand converted to electricity in industry for heating from heat pumps; assumed to be 2.5 times as effi cient as primary fuel usage
SOURCE: Roadmap 2050 Technical Analysis
53OMA/AMO
Energy Effi ciency
54 Roadmap 2050: A practical guide to a prosperous, low-carbon Europe
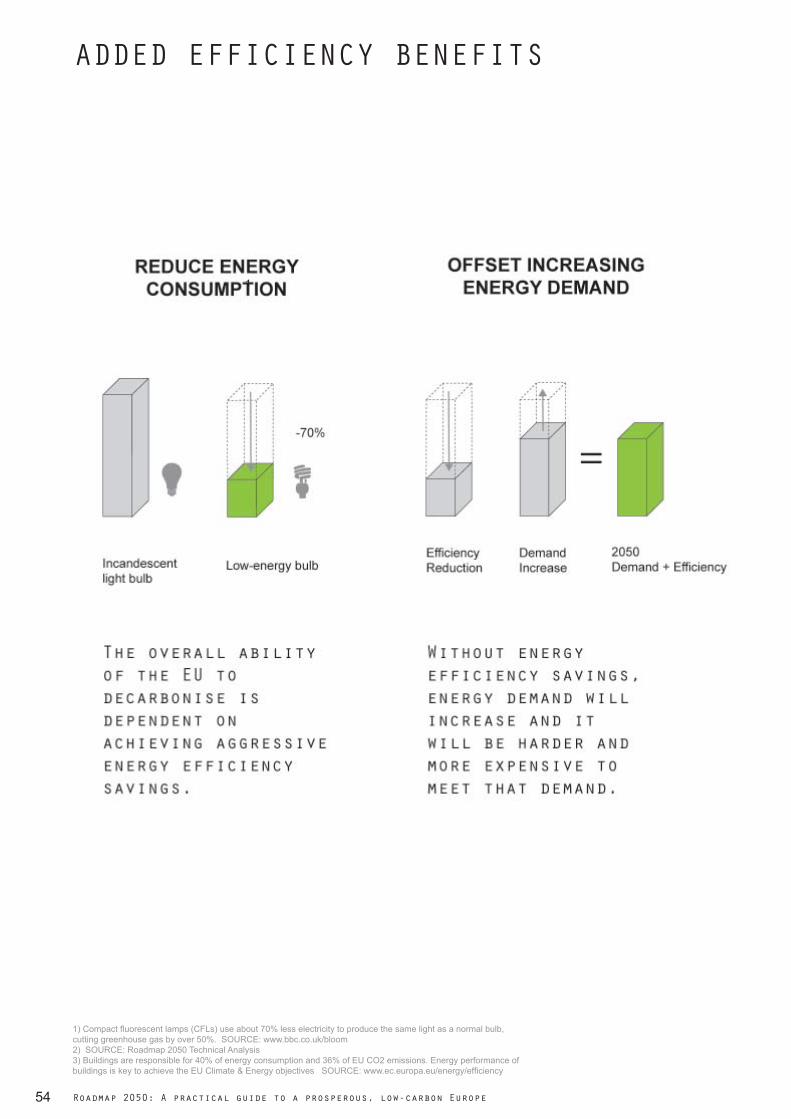
ADDED EFFICIENCY BENEFITS
1) Compact fl uorescent lamps (CFLs) use about 70% less electricity to produce the same light as a normal bulb, cutting greenhouse gas by over 50%. SOURCE: www.bbc.co.uk/bloom2) SOURCE: Roadmap 2050 Technical Analysis3) Buildings are responsible for 40% of energy consumption and 36% of EU CO2 emissions. Energy performance of buildings is key to achieve the EU Climate & Energy objectives SOURCE: www.ec.europa.eu/energy/effi ciency
1

55OMA/AMO
Energy Benefi ts
3
56 Roadmap 2050: A practical guide to a prosperous, low-carbon Europe
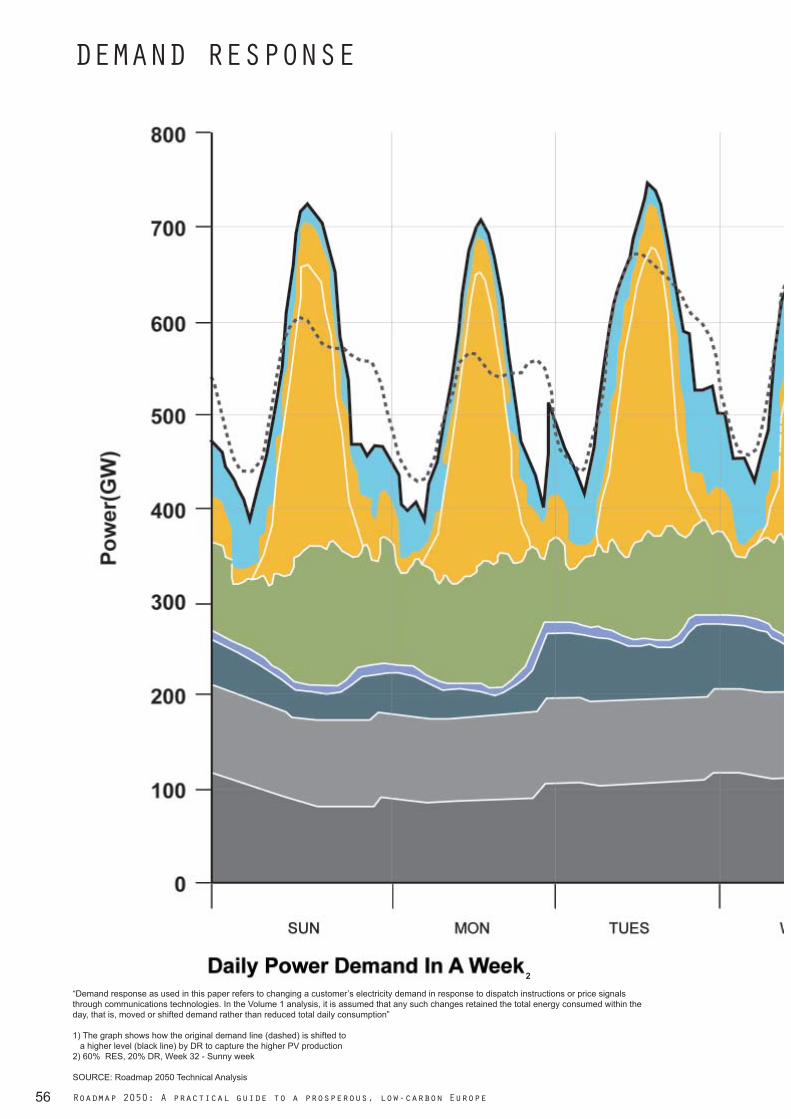
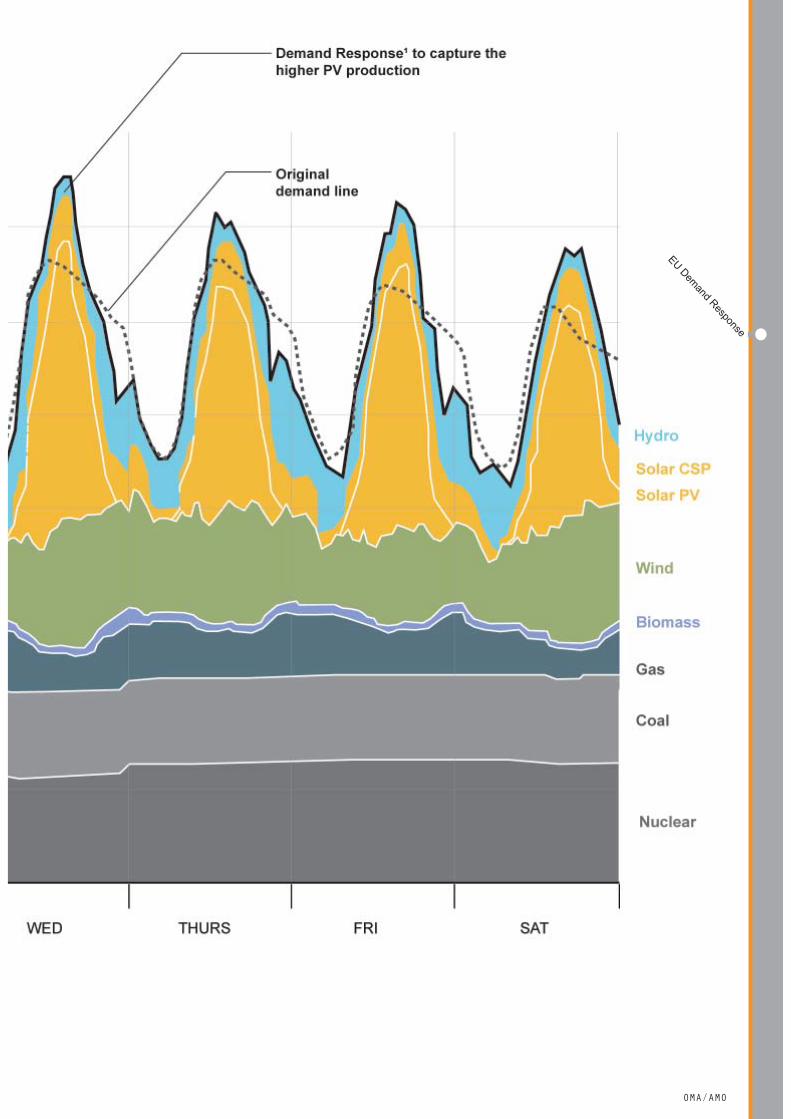
DEMAND RESPONSE
“Demand response as used in this paper refers to changing a customer’s electricity demand in response to dispatch instructions or price signals through communications technologies. In the Volume 1 analysis, it is assumed that any such changes retained the total energy consumed within the day, that is, moved or shifted demand rather than reduced total daily consumption”
1) The graph shows how the original demand line (dashed) is shifted to a higher level (black line) by DR to capture the higher PV production2) 60% RES, 20% DR, Week 32 - Sunny week
SOURCE: Roadmap 2050 Technical Analysis
2
57OMA/AMO
EU Demand Response
58 Roadmap 2050: A practical guide to a prosperous, low-carbon Europe
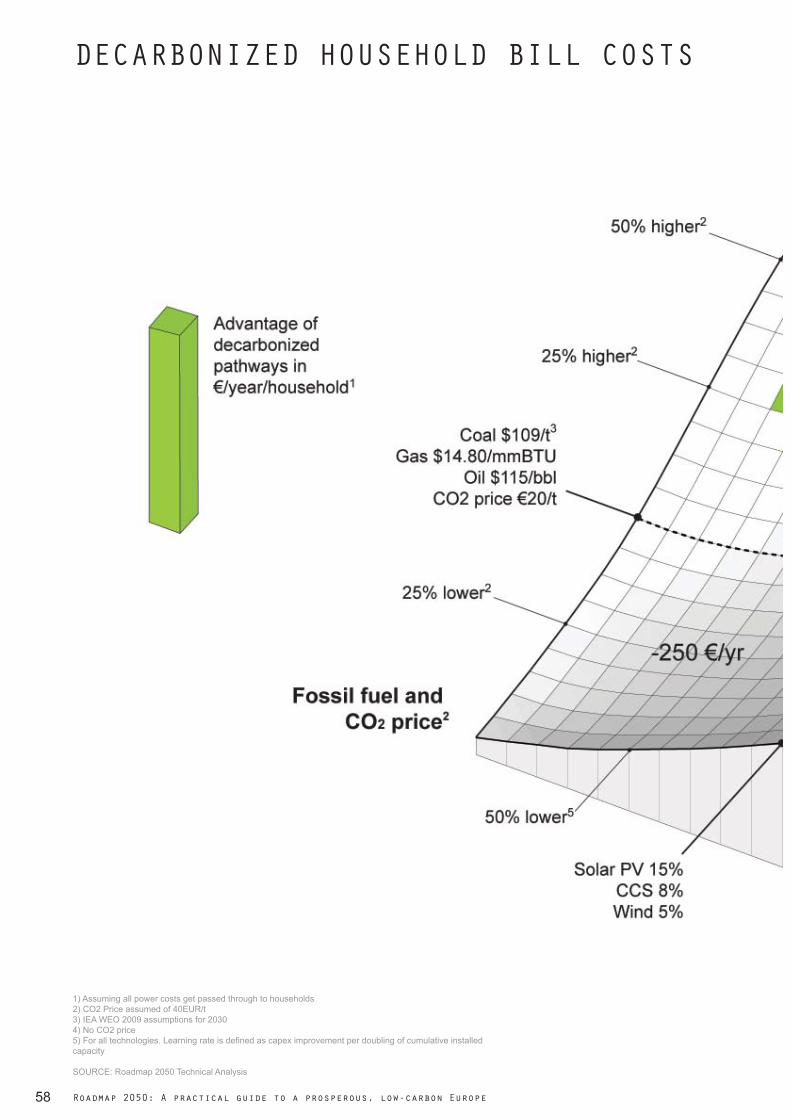
DECARBONIZED HOUSEHOLD BILL COSTS
1) Assuming all power costs get passed through to households2) CO2 Price assumed of 40EUR/t3) IEA WEO 2009 assumptions for 20304) No CO2 price5) For all technologies. Learning rate is defi ned as capex improvement per doubling of cumulative installed capacity
SOURCE: Roadmap 2050 Technical Analysis

59OMA/AMO
Decarbonized Household Bill

60 Roadmap 2050: A practical guide to a prosperous, low-carbon Europe
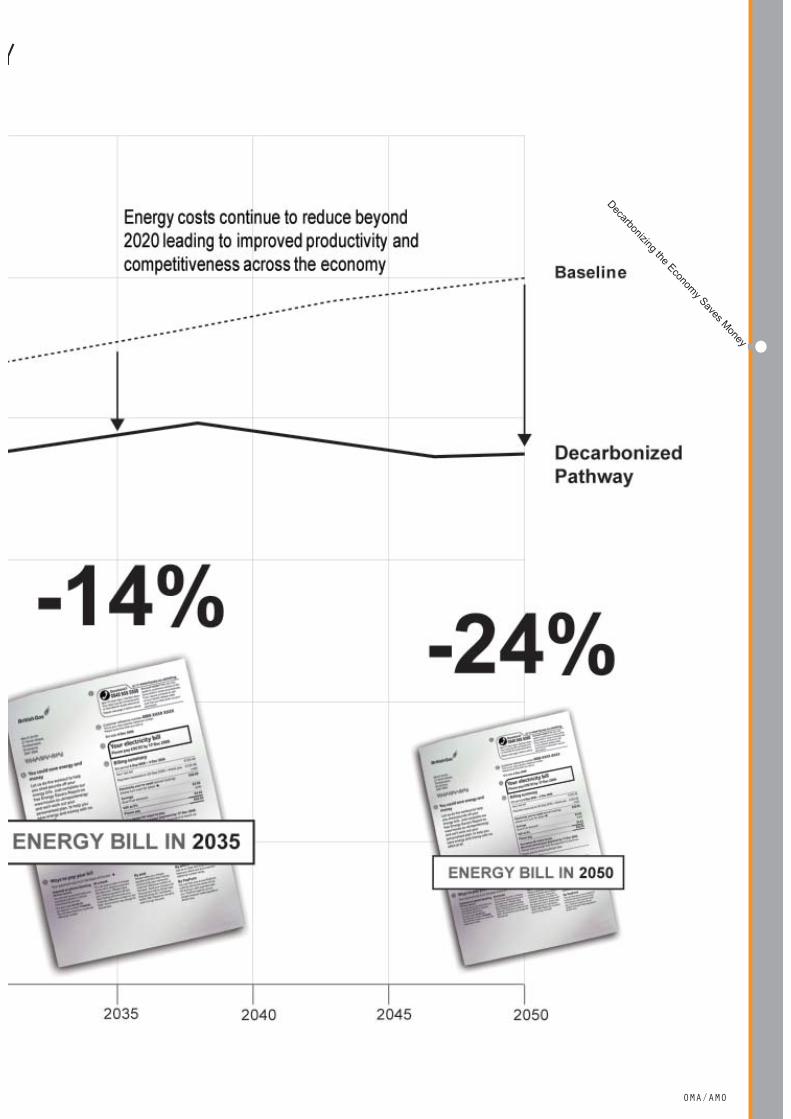
DECARBONIZING THE ECONOMY SAVES MONEY
NOTE: Energy prices are a weighted average of prices faced by consumers weighted by the shares of consumption of different fuels
SOURCE: Roadmap 2050 Technical Analysis
61OMA/AMO
Decarbonizing the Economy Saves MoneyY

62 Roadmap 2050: A practical guide to a prosperous, low-carbon Europe
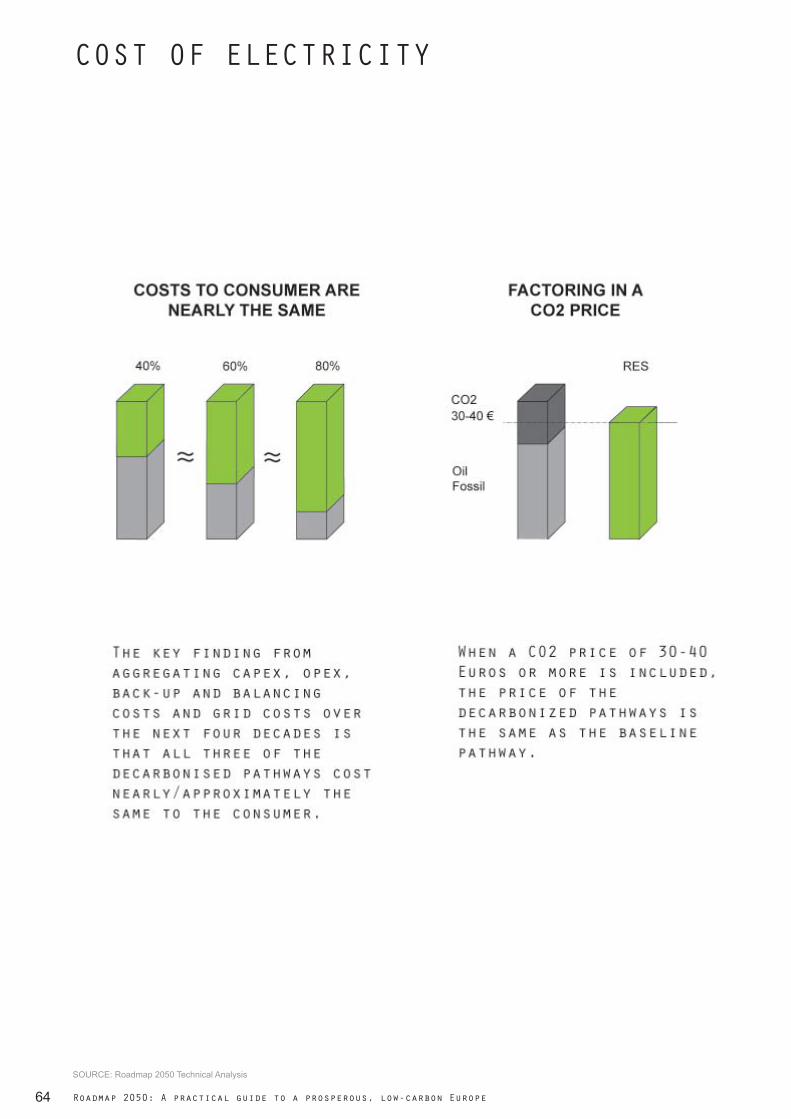
COST OF ELECTRICITYThe higher capital cost is offset by a lower operational cost.
1 Weighted average based on the CoE in each 10-year time frame (2010, 2020, 2030, 2040, 2050)2 Generation only3 Cost related to non optimal plant use, system dispatch cost for secure operation, running backup plants, storage losses, reserve and response cost4 Transmission and additional generation capex as well as fi xed opex for transmission and backup
SOURCE: Roadmap 2050 Technical Analysis

63OMA/AMO
Cost of Electricity
64 Roadmap 2050: A practical guide to a prosperous, low-carbon Europe
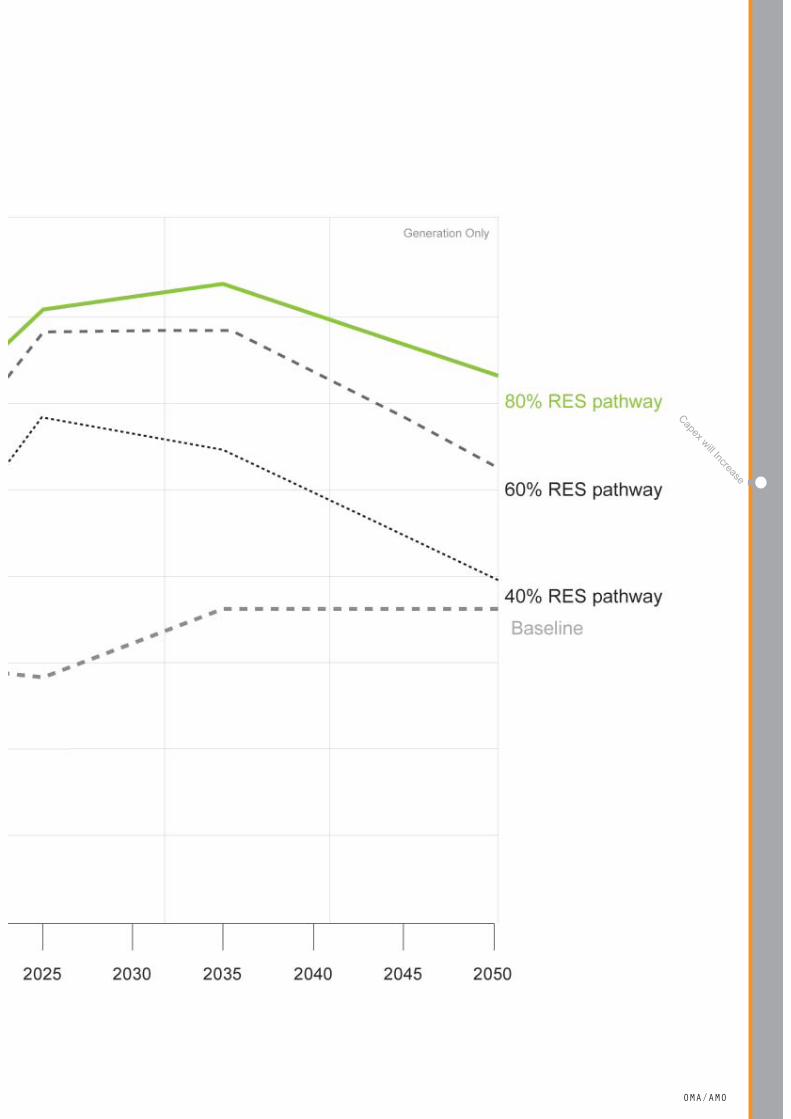
COST OF ELECTRICITY
SOURCE: Roadmap 2050 Technical Analysis

65OMA/AMO
Cost of Electricity

66 Roadmap 2050: A practical guide to a prosperous, low-carbon Europe
ANNUAL COST COMPARED TO EU SPENDING
1 Forecast for 2010 capex requirement not available for road and rail infrastructure investments; 2007 actual data is used instead2 Average yearly capex requirement from 2011 to 2020
SOURCE: Roadmap 2050 Technical Analysis

67OMA/AMO
Investment
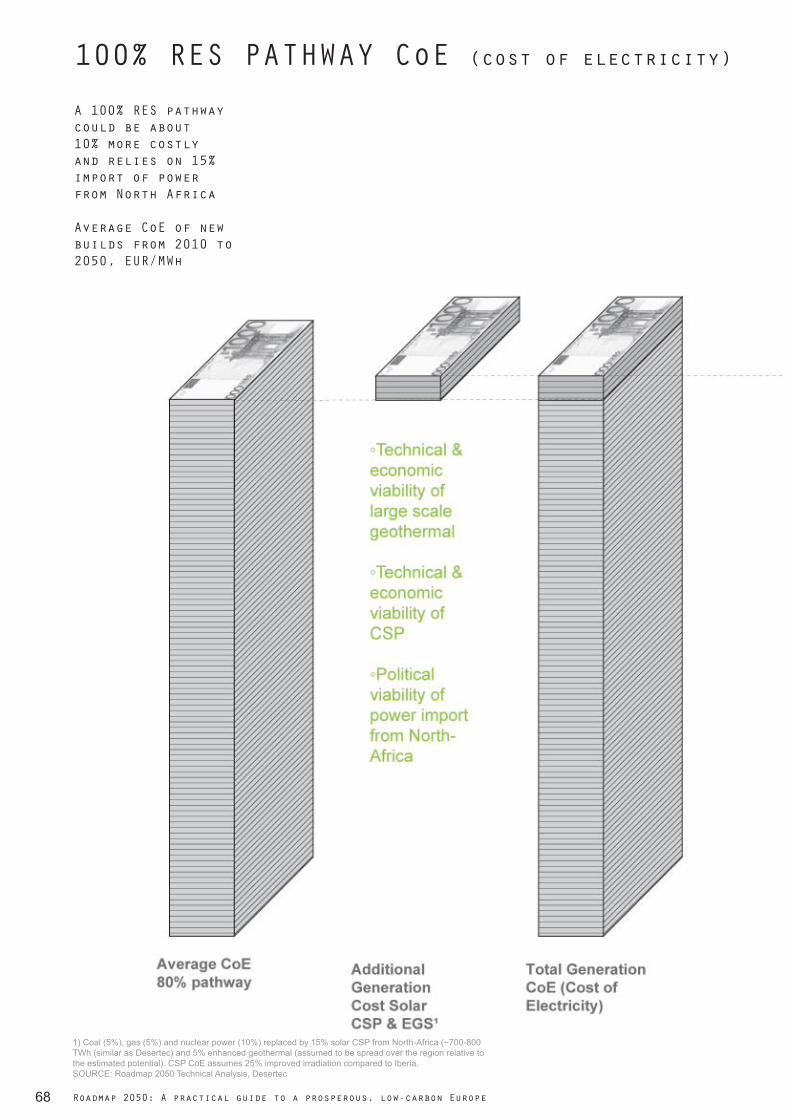
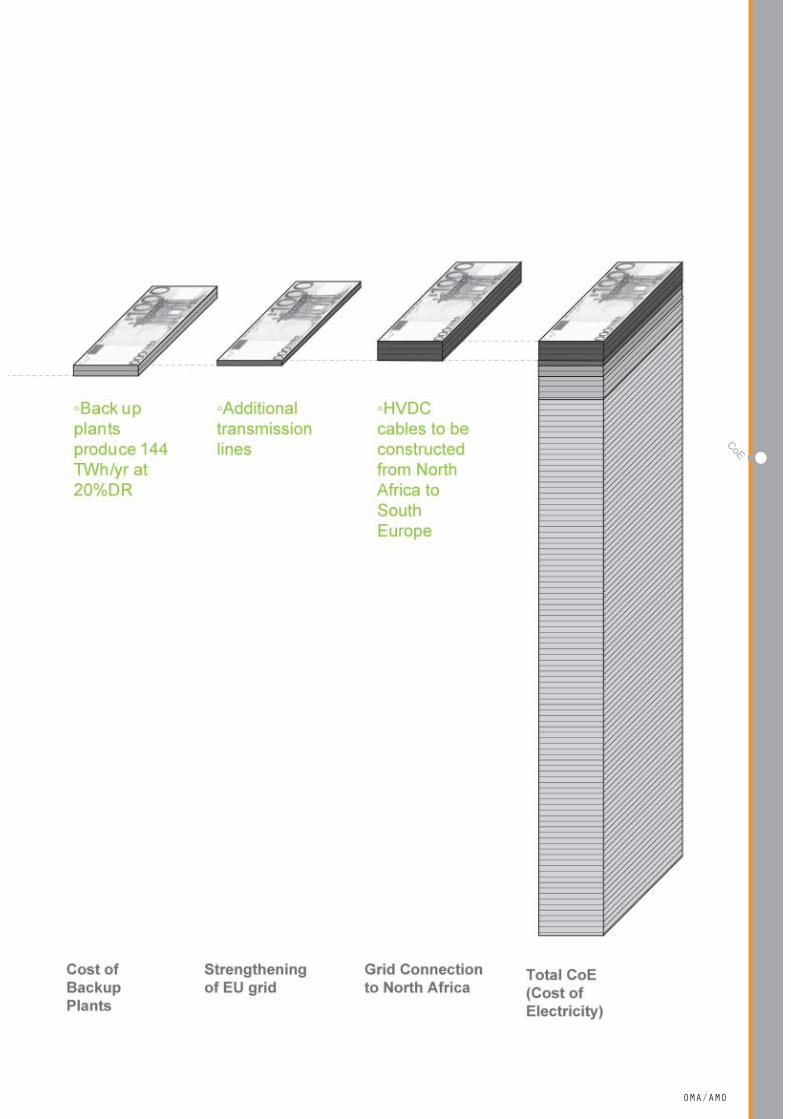
A 100% RES pathway could be about 10% more costly and relies on 15% import of power from North Africa
Average CoE of new builds from 2010 to 2050, EUR/MWh
68 Roadmap 2050: A practical guide to a prosperous, low-carbon Europe
100% RES PATHWAY CoE (cost of electricity)
1) Coal (5%), gas (5%) and nuclear power (10%) replaced by 15% solar CSP from North-Africa (~700-800 TWh (similar as Desertec) and 5% enhanced geothermal (assumed to be spread over the region relative to the estimated potential). CSP CoE assumes 25% improved irradiation compared to Iberia.SOURCE: Roadmap 2050 Technical Analysis, Desertec
69OMA/AMO
CoE
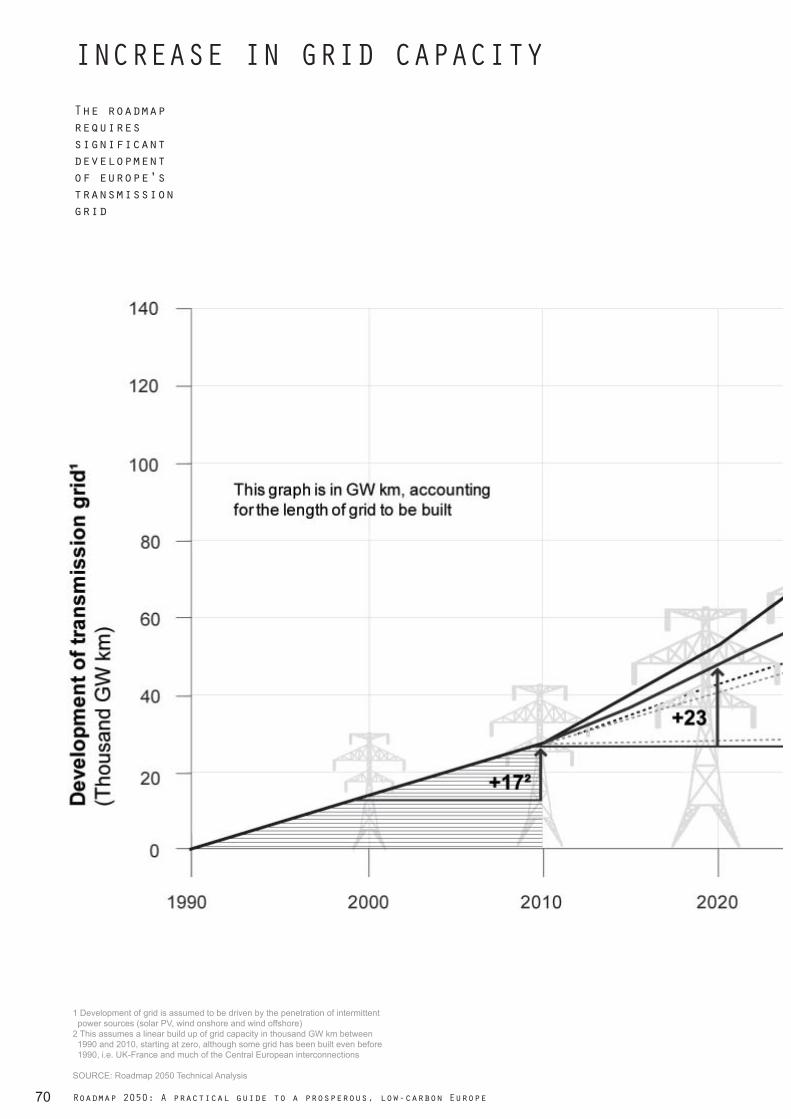
The roadmap requires significant development of europe's transmission grid
70 Roadmap 2050: A practical guide to a prosperous, low-carbon Europe
Decarbionized power requires an increase in CapacINCREASE IN GRID CAPACITY
1 Development of grid is assumed to be driven by the penetration of intermittent power sources (solar PV, wind onshore and wind offshore)2 This assumes a linear build up of grid capacity in thousand GW km between 1990 and 2010, starting at zero, although some grid has been built even before 1990, i.e. UK-France and much of the Central European interconnections
SOURCE: Roadmap 2050 Technical Analysis

71OMA/AMO
Increasing Grid Capacityacity
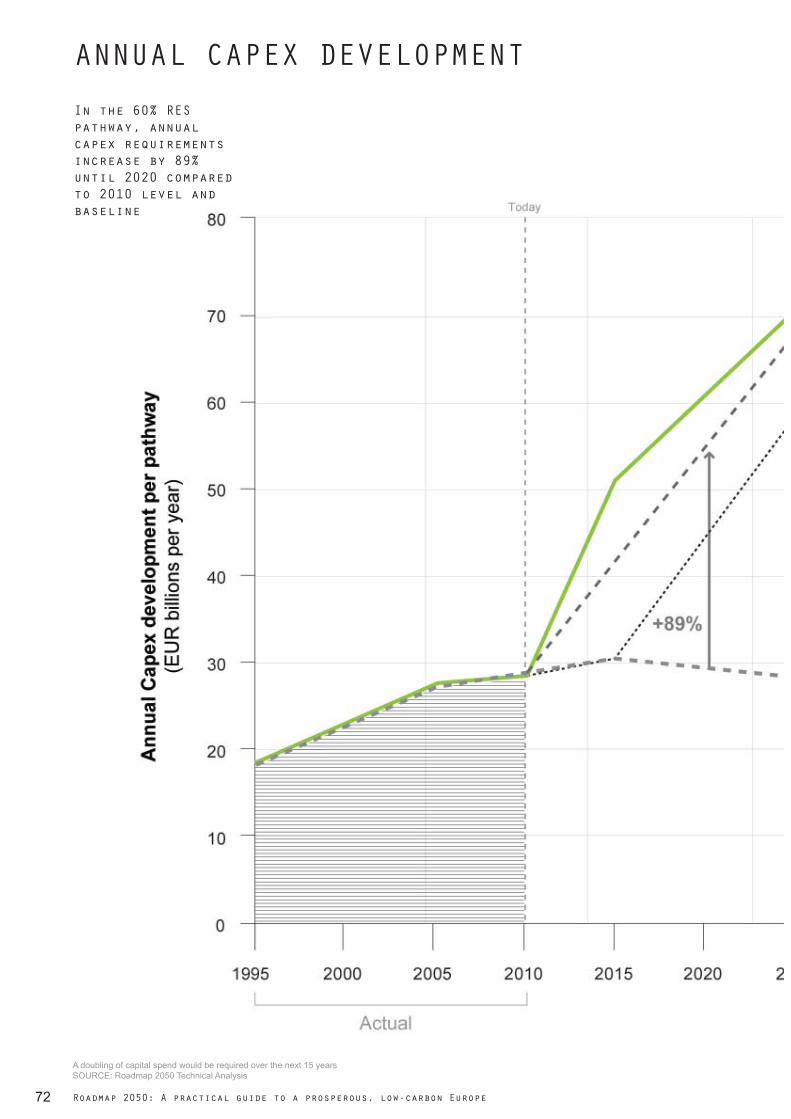
In the 60% RES pathway, annual capex requirements increase by 89% until 2020 compared to 2010 level and baseline
72 Roadmap 2050: A practical guide to a prosperous, low-carbon Europe
ANNUAL CAPEX DEVELOPMENT
A doubling of capital spend would be required over the next 15 yearsSOURCE: Roadmap 2050 Technical Analysis
73OMA/AMO
Capex will Increase

74 Roadmap 2050: A practical guide to a prosperous, low-carbon Europe
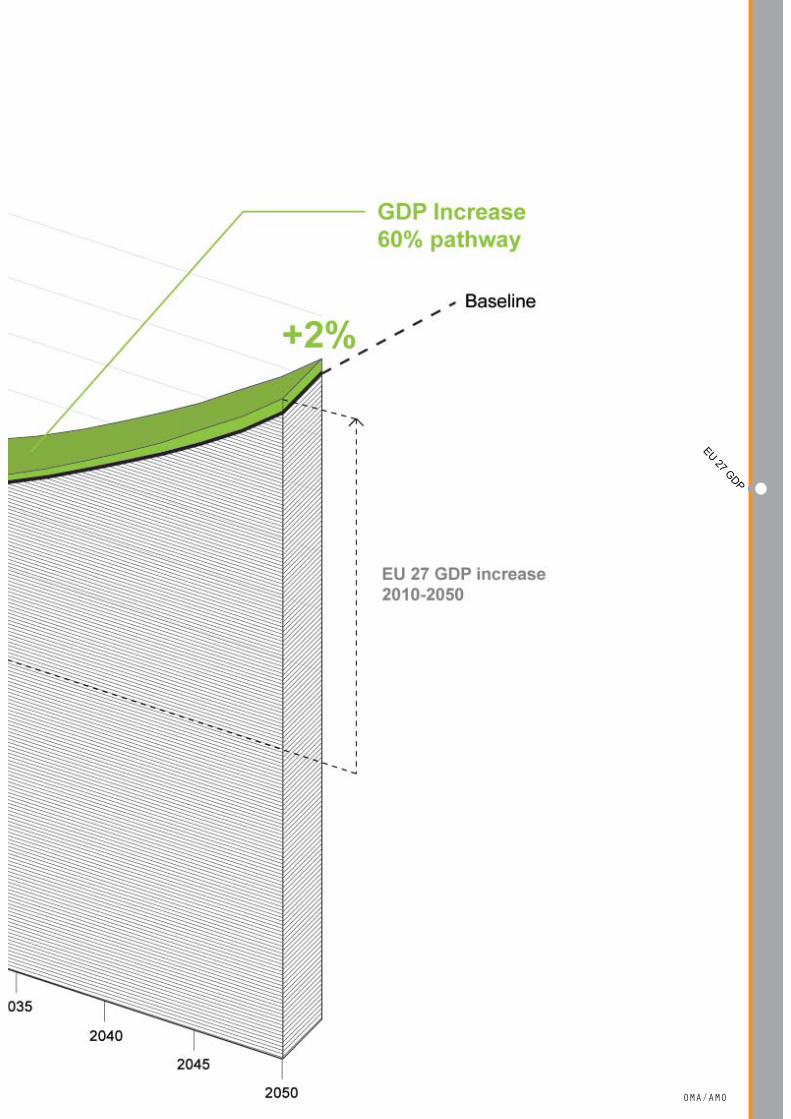
LONG-TERM EU27 GDP
SOURCE: Roadmap 2050 Technical Analysis
75OMA/AMO
EU 27 GDP
76 Roadmap 2050: A practical guide to a prosperous, low-carbon Europe
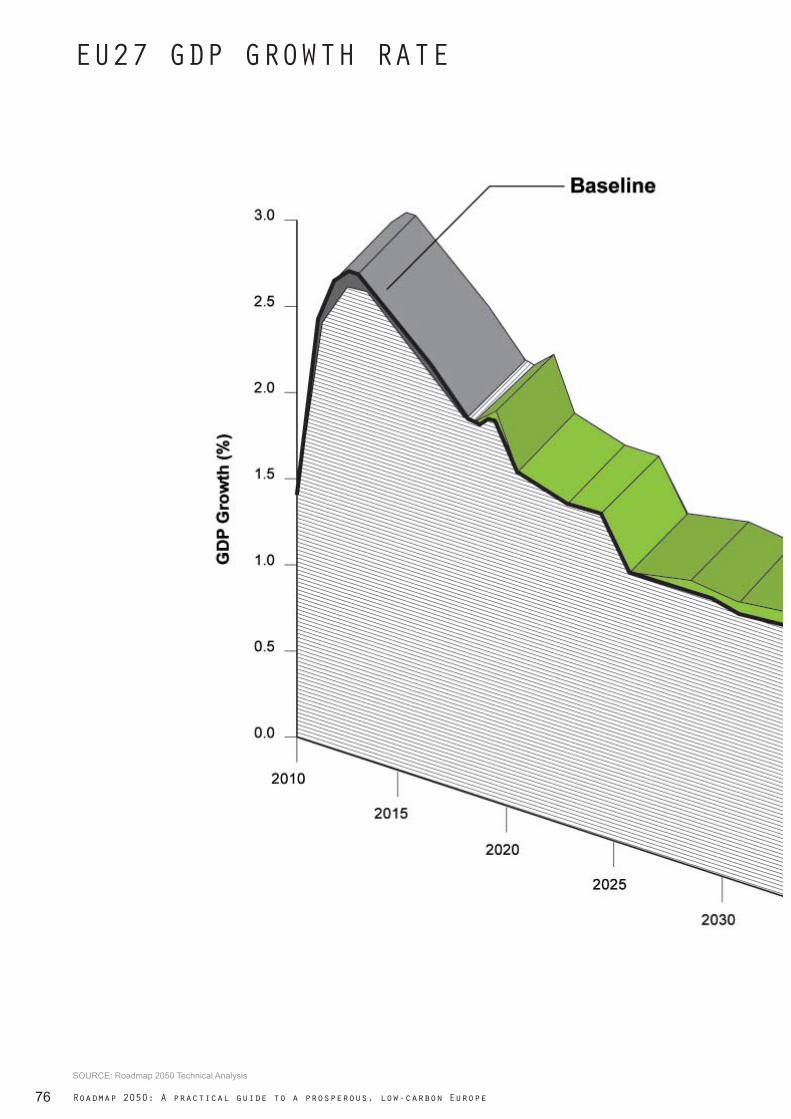
EU27 GDP GROWTH RATE
SOURCE: Roadmap 2050 Technical Analysis

77OMA/AMO
GDP Growth Rate

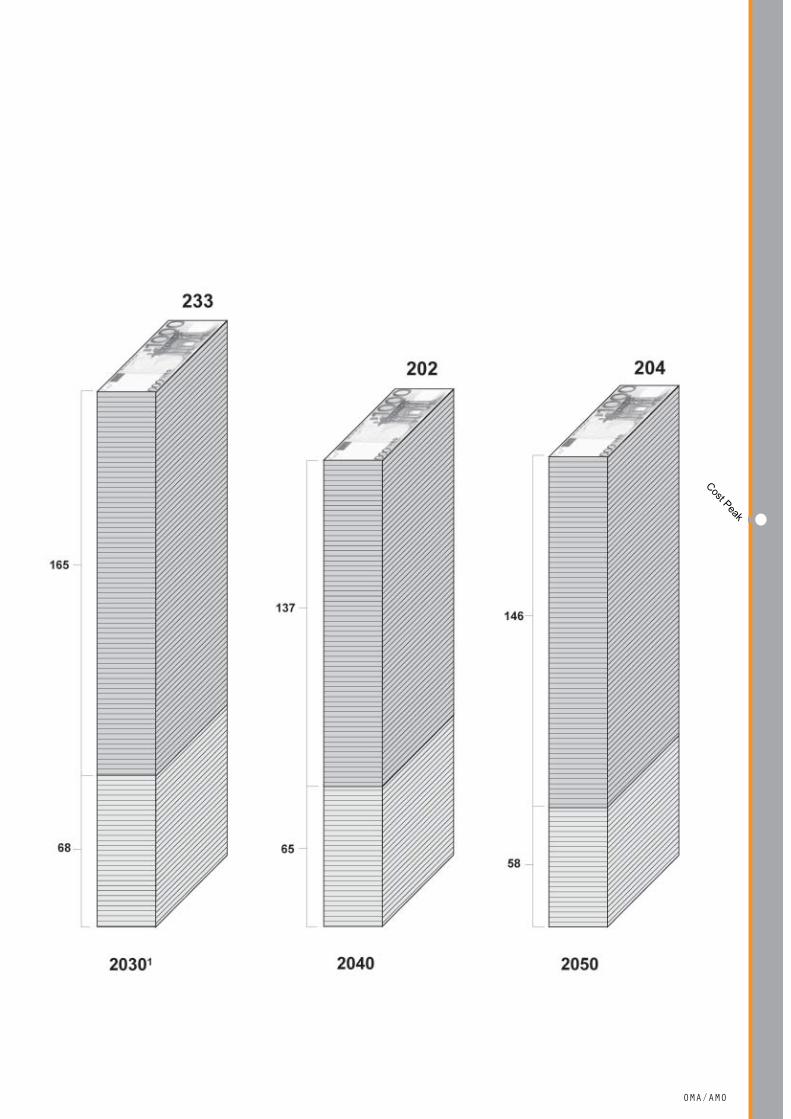
For the 60% pathway, the Total power costs peak in 2030 due to increasing fuel prices and capital investments(! billion per year)
78 Roadmap 2050: A practical guide to a prosperous, low-carbon Europe
POWER COSTS WILL PEAK IN 2030
1) Around 2030, a relatively large share of the ineffi cient existing fl eet is retired and replaced by new technologies, resulting in lower costs thereafter2) Including capex for grid and back up capacitySOURCE: Roadmap 2050 Technical Analysis
79OMA/AMO
Cost Peak
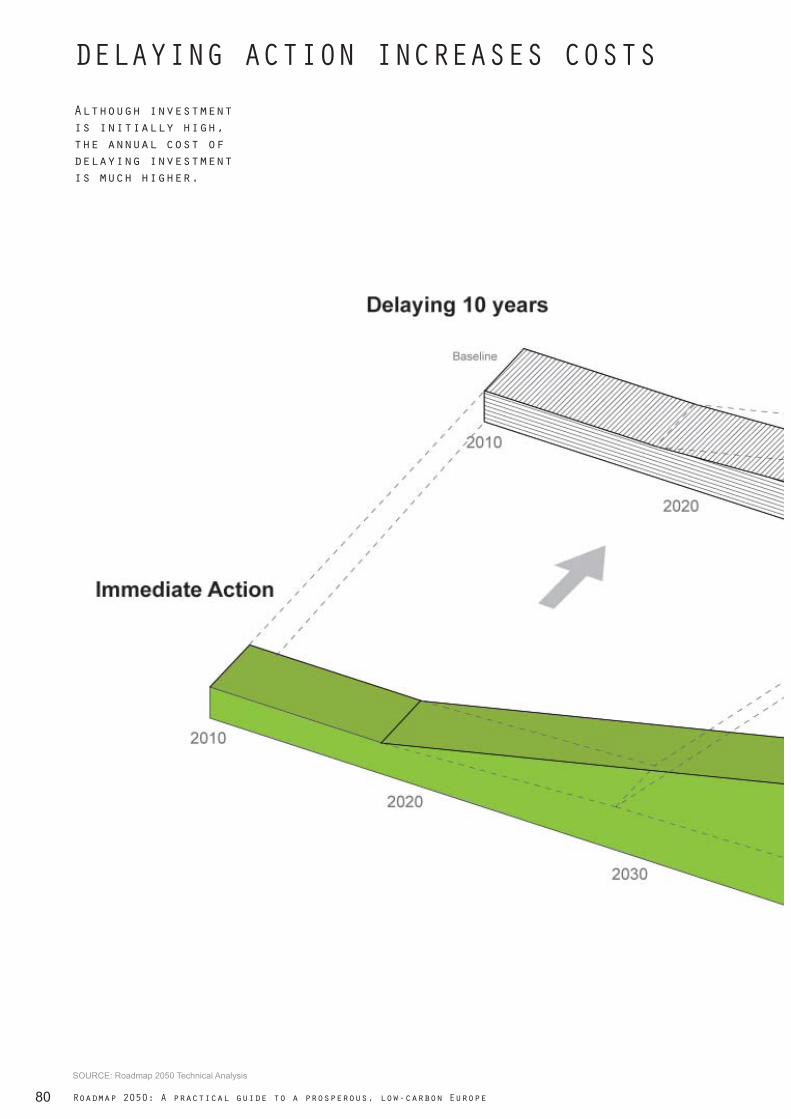
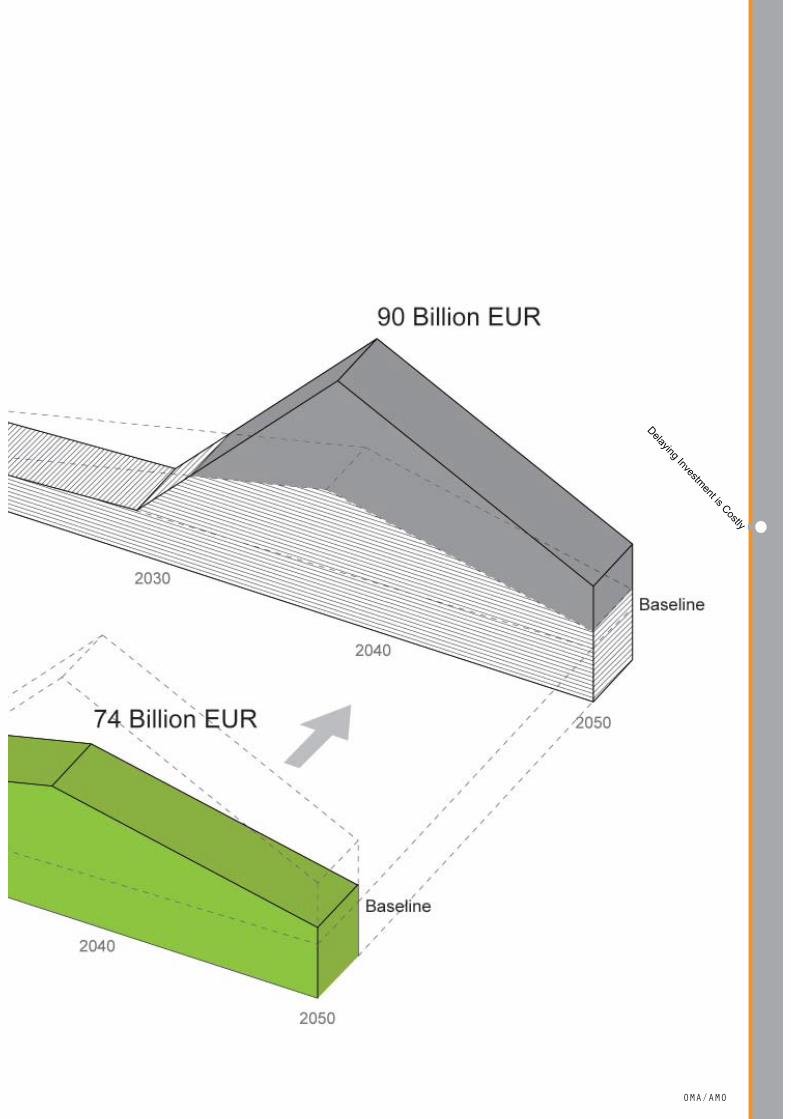
Although investment is initially high, the annual cost of delaying investment is much higher.
80 Roadmap 2050: A practical guide to a prosperous, low-carbon Europe
DELAYING ACTION INCREASES COSTS
SOURCE: Roadmap 2050 Technical Analysis
81OMA/AMO
Delaying Investment is Costly

82 Roadmap 2050: A practical guide to a prosperous, low-carbon Europe
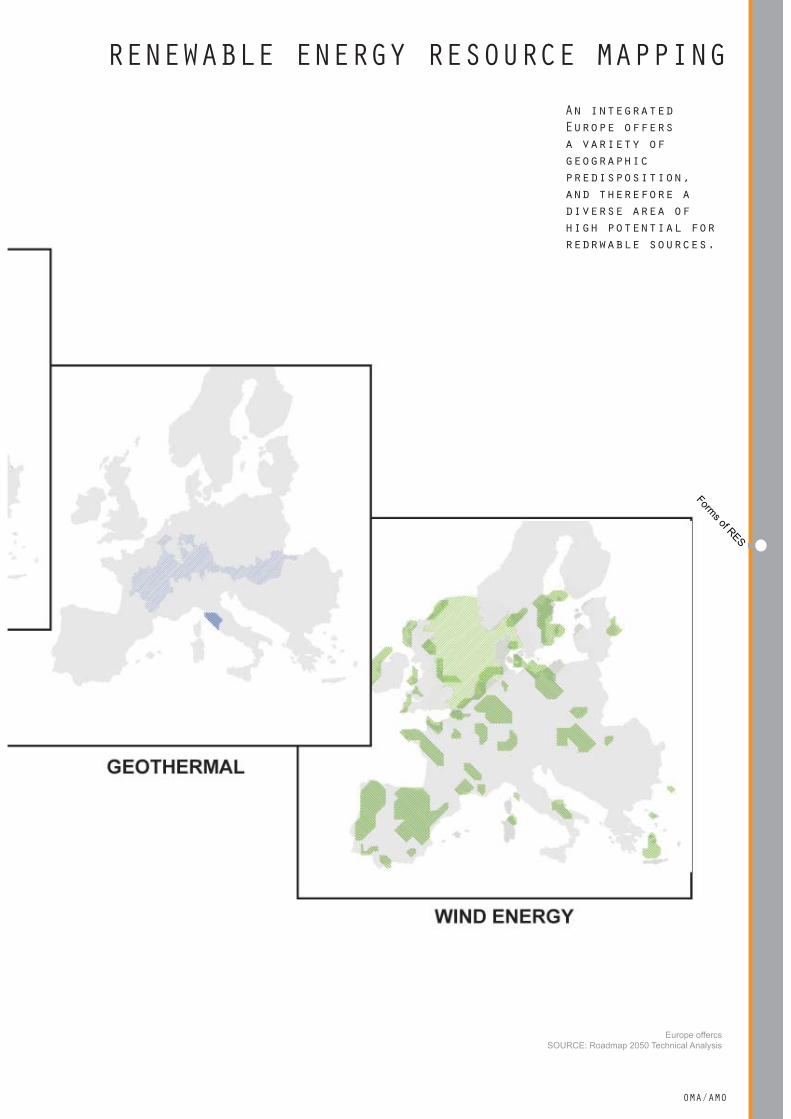
An integrated Europe offers a variety of geographic predisposition, and therefore a diverse area of high potential for redrwable sources.
83OMA/AMO
Forms of RESRENEWABLE ENERGY RESOURCE MAPPING
Europe offercsSOURCE: Roadmap 2050 Technical Analysis

overlay of current energy use and those regions with the highest energy potential.
84 Roadmap 2050: A practical guide to a prosperous, low-carbon Europe
EU ENERGY RESOURCE MOSAIC

85OMA/AMO
Mosaic RES Mapping

86 Roadmap 2050: A practical guide to a prosperous, low-carbon Europe
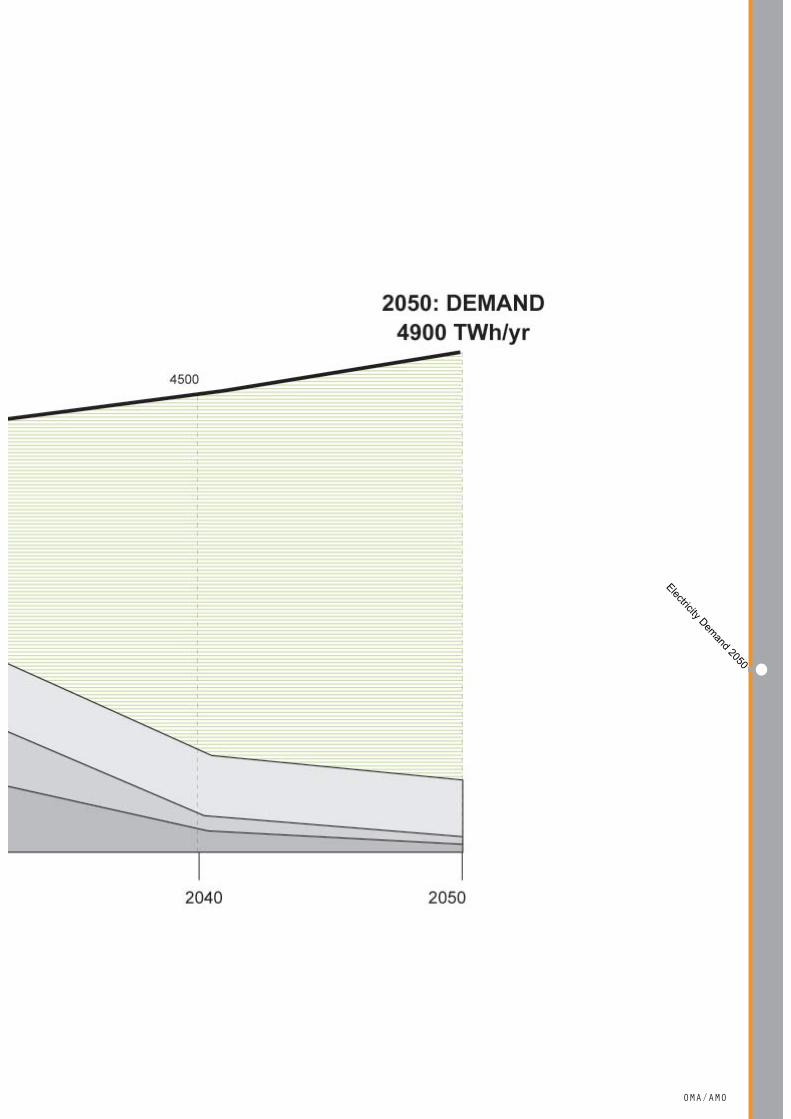
ELECTRICITY DEMAND 2050(EU27 PLUS NORWAY & SWITZERLAND)
Note Existing capacity includes new builds until 2010
SOURCE: Roadmap 2050 Technical Analysis (McKinsey Power Generation Model)
87OMA/AMO
Electricity Demand 2050

88 Roadmap 2050: A practical guide to a prosperous, low-carbon Europe
Now² 2050³
KEY: Units: TWH/Year
ENERGY DEMAND 2050energy consumption in the European union in 2006 was 3354Twh/yr"it is estimated that demand will be 4900Twh/yr in 2050.
SOURCE: EU Energy and Transport in Figures1) 3354 TWH/Year 2006 (Eurostat December 2008)2) 3534 TWH/Year 2010 (Estimate) 3) Projected European demand in 2050 is 4900TWH/Year4900 TWH/Year 2050 (Roadmap 2050 Technical Analysis)

89OMA/AMO
EU Demand
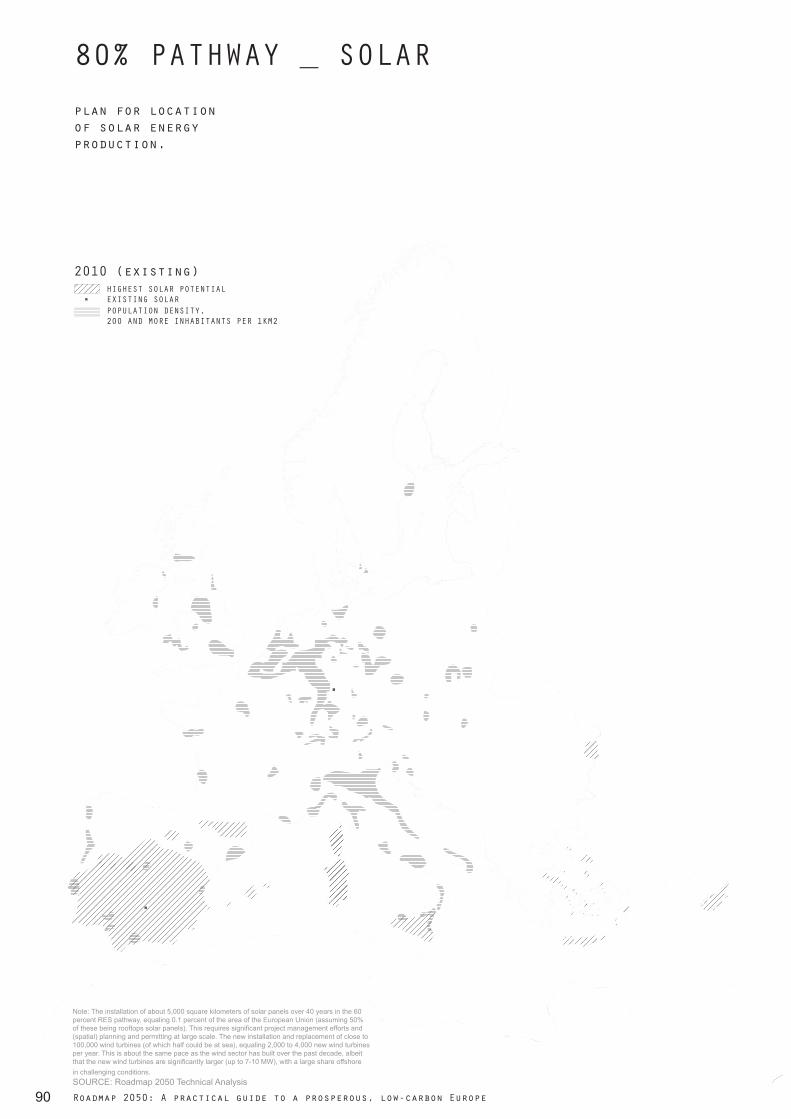
HIGHEST SOLAR POTENTIALEXISTING SOLARPOPULATION DENSITY, 200 AND MORE INHABITANTS PER 1KM2
2010 (existing)
Note: The installation of about 5,000 square kilometers of solar panels over 40 years in the 60 percent RES pathway, equaling 0.1 percent of the area of the European Union (assuming 50% of these being rooftops solar panels). This requires signifi cant project management efforts and (spatial) planning and permitting at large scale. The new installation and replacement of close to 100,000 wind turbines (of which half could be at sea), equaling 2,000 to 4,000 new wind turbines per year. This is about the same pace as the wind sector has built over the past decade, albeit that the new wind turbines are signifi cantly larger (up to 7-10 MW), with a large share offshore in challenging conditions.SOURCE: Roadmap 2050 Technical Analysis
90 Roadmap 2050: A practical guide to a prosperous, low-carbon Europe
80% PATHWAY _ SOLAR plan for location of solar energy production.
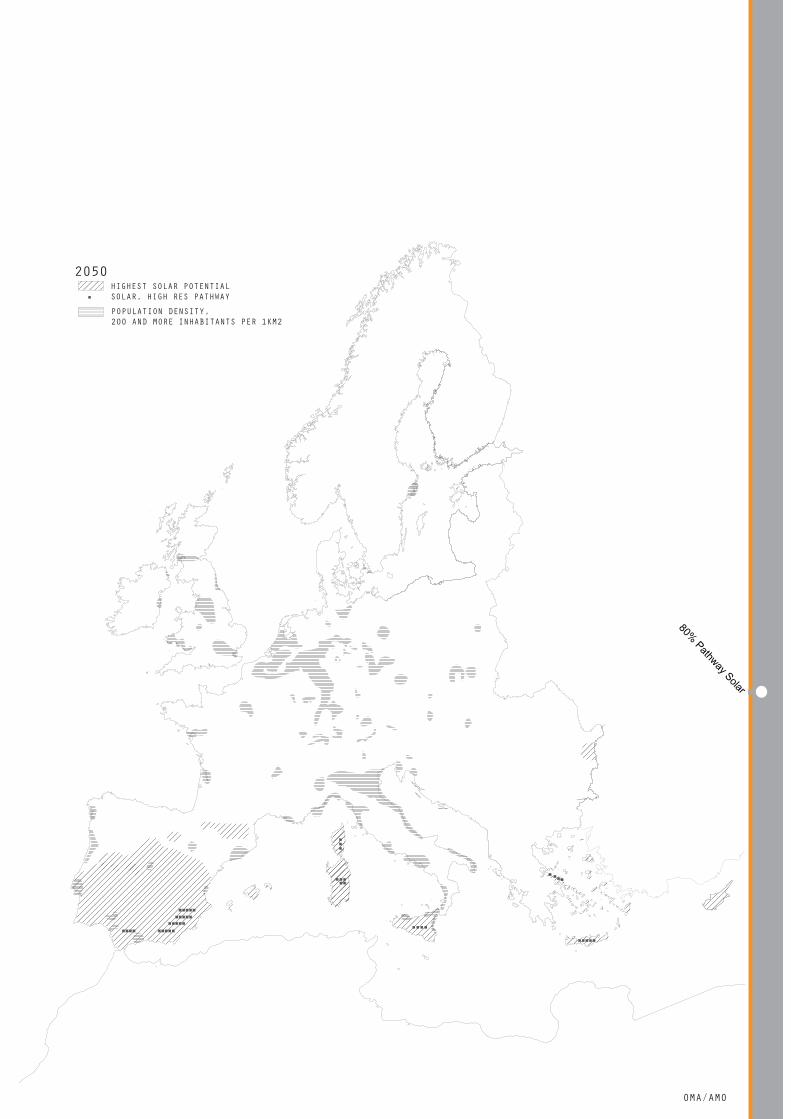
HIGHEST SOLAR POTENTIALSOLAR, HIGH RES PATHWAYPOPULATION DENSITY, 200 AND MORE INHABITANTS PER 1KM2
2050
91OMA/AMO
80% Pathway Solar

HIGHEST WIND POWER POTENTIALEXISTING WIND POWER POPULATION DENSITY, 200 AND MORE INHABITANTS PER 1KM2
2010 (existing)
92 Roadmap 2050: A practical guide to a prosperous, low-carbon Europe
80% PATHWAY _ WIND ENERGY plan for location of wind energy production.
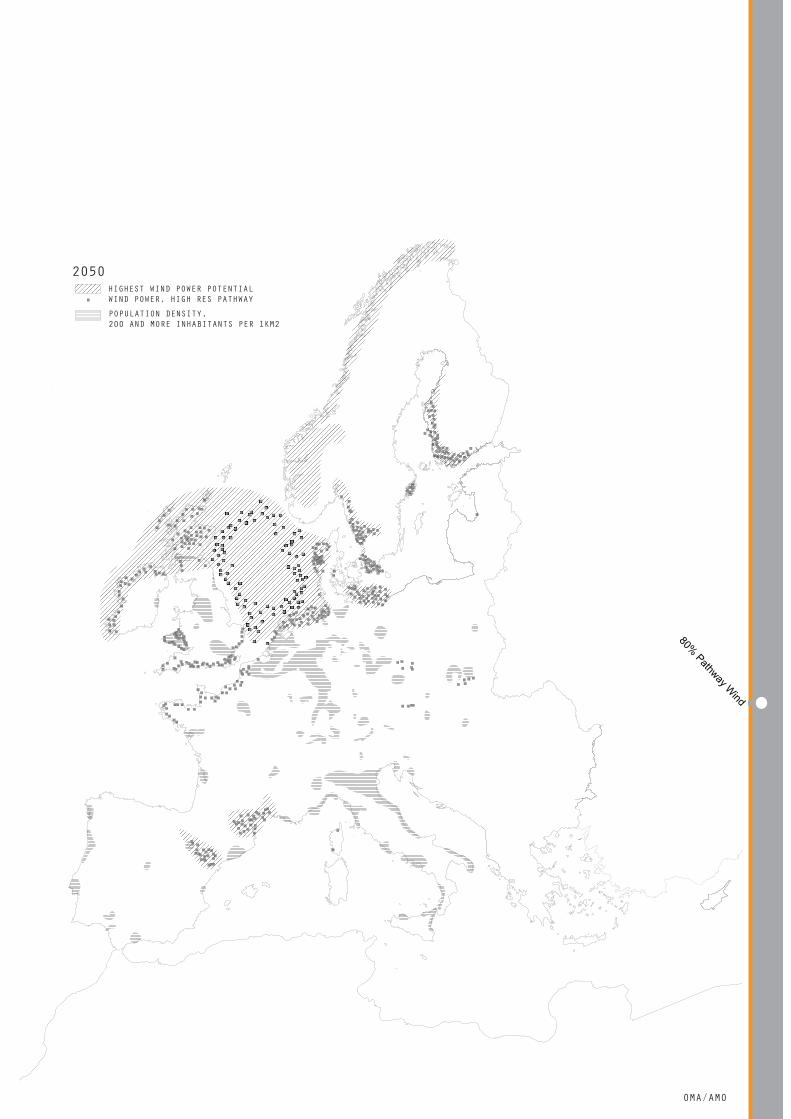
HIGHEST WIND POWER POTENTIALWIND POWER, HIGH RES PATHWAYPOPULATION DENSITY, 200 AND MORE INHABITANTS PER 1KM2
2050
93OMA/AMO
80% Pathway Wind
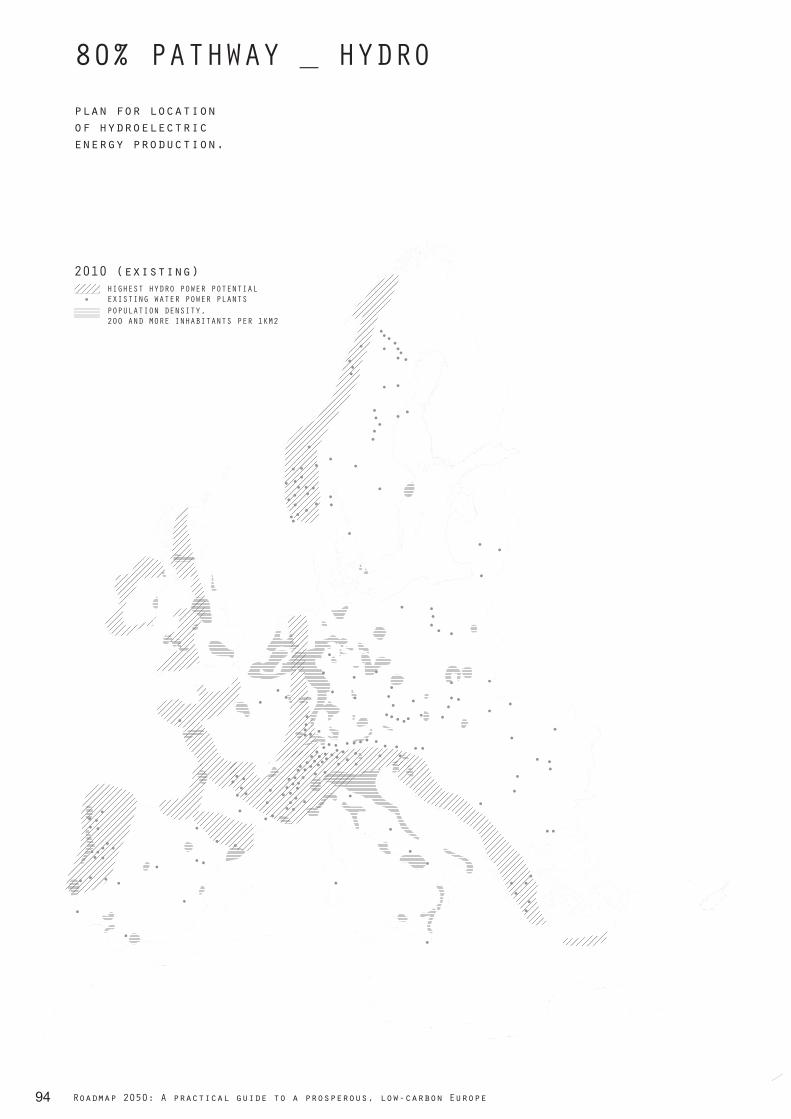
HIGHEST HYDRO POWER POTENTIALEXISTING WATER POWER PLANTSPOPULATION DENSITY, 200 AND MORE INHABITANTS PER 1KM2
2010 (existing)
94 Roadmap 2050: A practical guide to a prosperous, low-carbon Europe
80% PATHWAY _ HYDROplan for location of hydroelectric energy production.
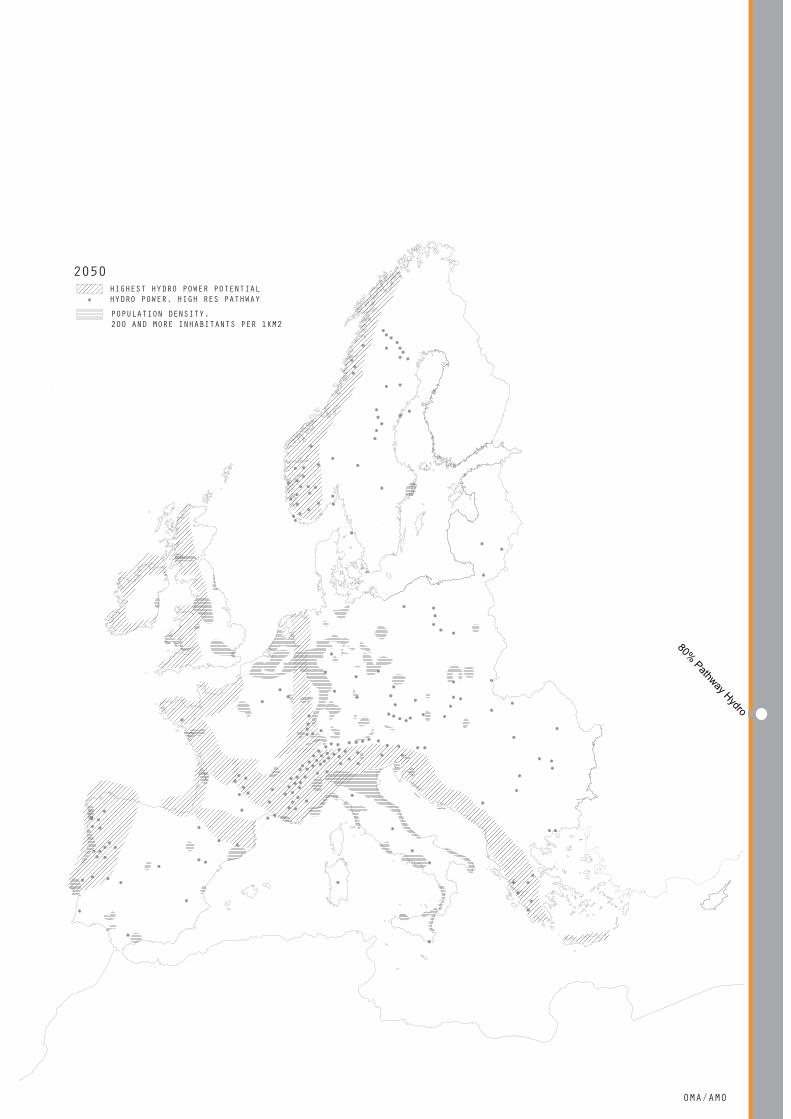
HIGHEST HYDRO POWER POTENTIALHYDRO POWER, HIGH RES PATHWAYPOPULATION DENSITY, 200 AND MORE INHABITANTS PER 1KM2
2050
95OMA/AMO
80% Pathway Hydro

HIGHEST GEOTHERMAL POTENTIALEXISTING GEOTHERMALPOPULATION DENSITY, 200 AND MORE INHABITANTS PER 1KM2
2010 (existing)
96 Roadmap 2050: A practical guide to a prosperous, low-carbon Europe
80% PATHWAY _ GEOTHERMAL plan for location of geothermal energy production.
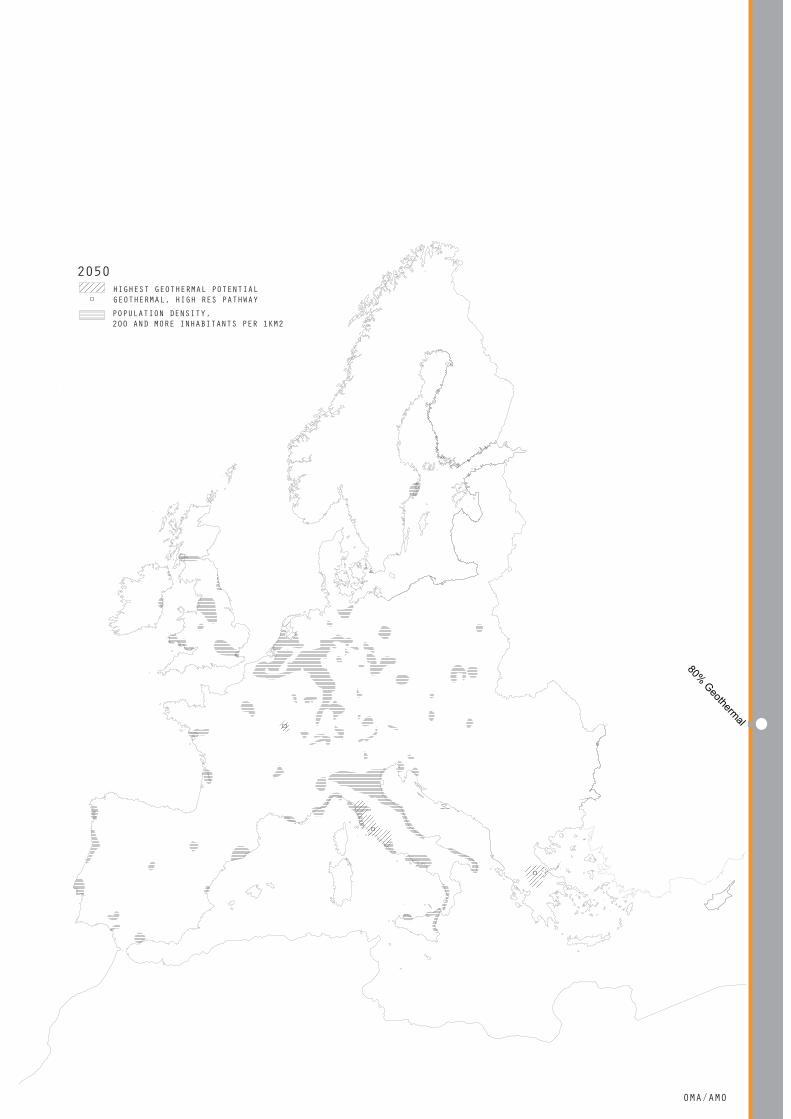
HIGHEST GEOTHERMAL POTENTIALGEOTHERMAL, HIGH RES PATHWAYPOPULATION DENSITY, 200 AND MORE INHABITANTS PER 1KM2
2050
97OMA/AMO
80% Geothermal

EXISTING COAL-OIL-GAS POPULATION DENSITY, 200 AND MORE INHABITANTS PER 1KM2
2010 (existing)
98 Roadmap 2050: A practical guide to a prosperous, low-carbon Europe
80% PATHWAY _ COAL/GAS/PETROLEUMplan for location of coal/gas/oil energy production. in 2050,the amount of coal/gas/petroleum power is reduced and includes carbon capture & storage.

COAL-OIL-GAS (CCS), HIGH RES PATHWAYPOPULATION DENSITY, 200 AND MORE INHABITANTS PER 1KM2
2050
99OMA/AMO
80% Pathway Fossil Fuel
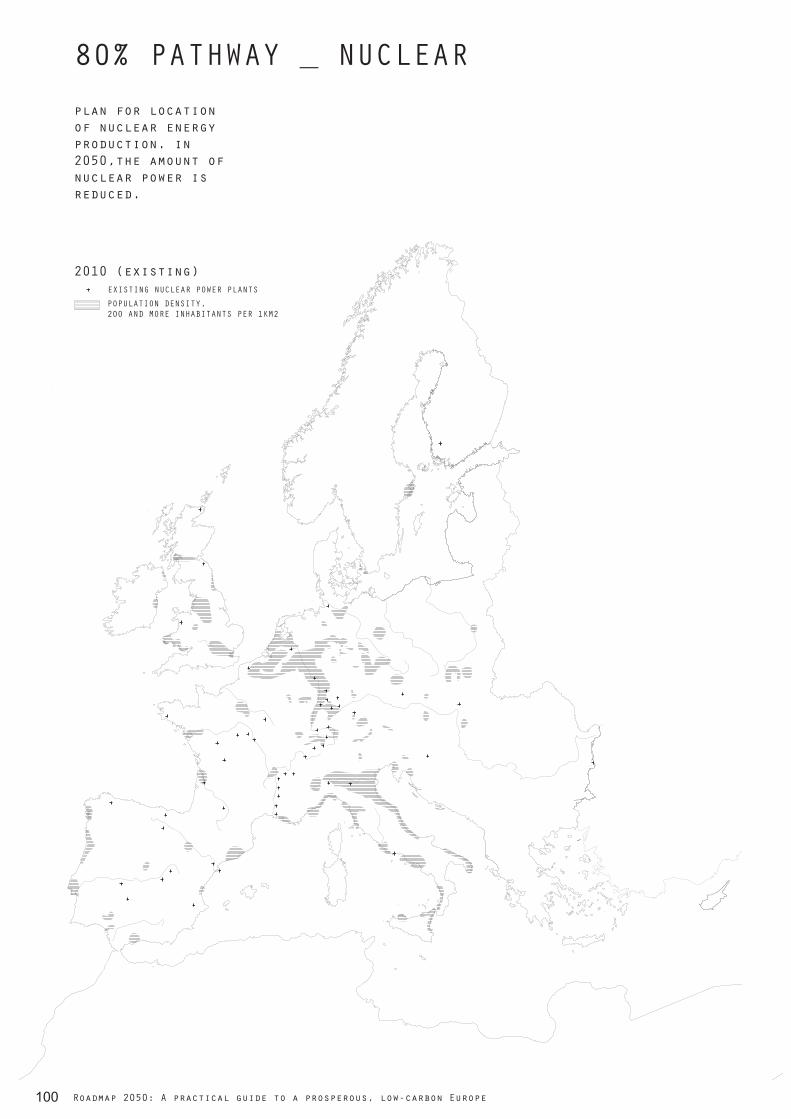
EXISTING NUCLEAR POWER PLANTSPOPULATION DENSITY, 200 AND MORE INHABITANTS PER 1KM2
2010 (existing)
100 Roadmap 2050: A practical guide to a prosperous, low-carbon Europe
80% PATHWAY _ NUCLEARplan for location of nuclear energy production. in 2050,the amount of nuclear power is reduced.

NUCLEAR POWER PLANTS, HIGH RES PATHWAY
POPULATION DENSITY, 200 AND MORE INHABITANTS PER 1KM2
2050
101OMA/AMO
80% Pathway Nuclear
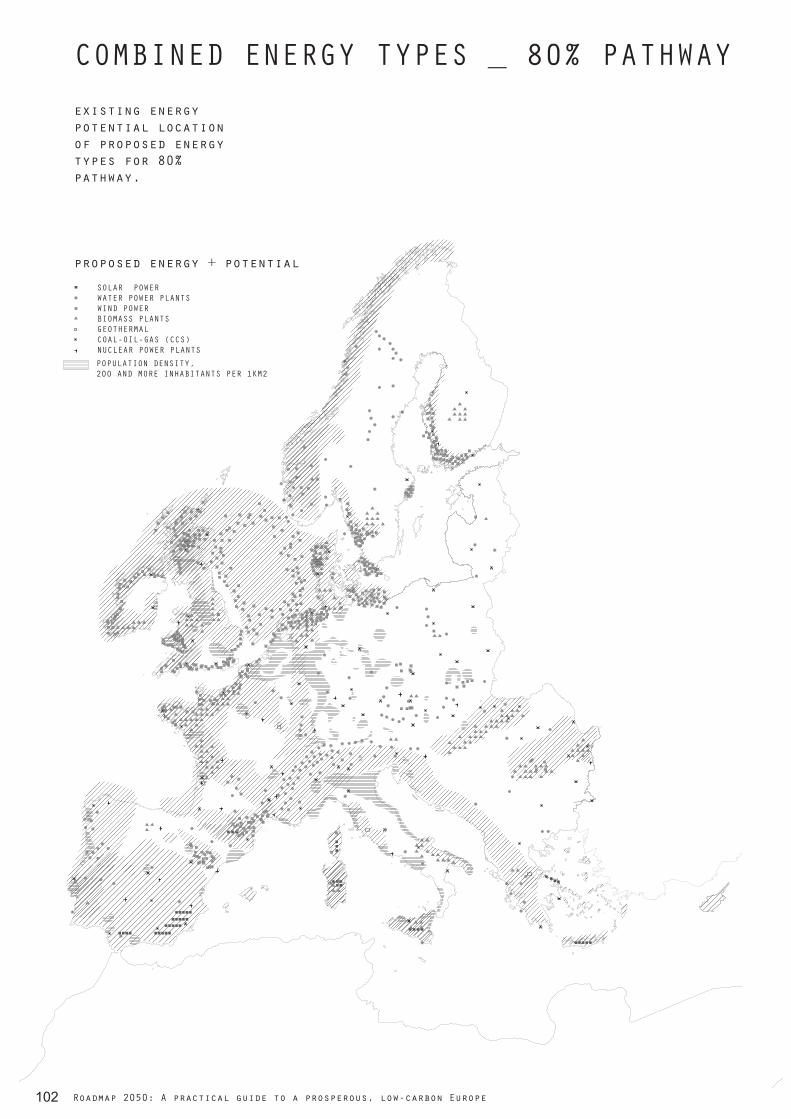
POPULATION DENSITY, 200 AND MORE INHABITANTS PER 1KM2
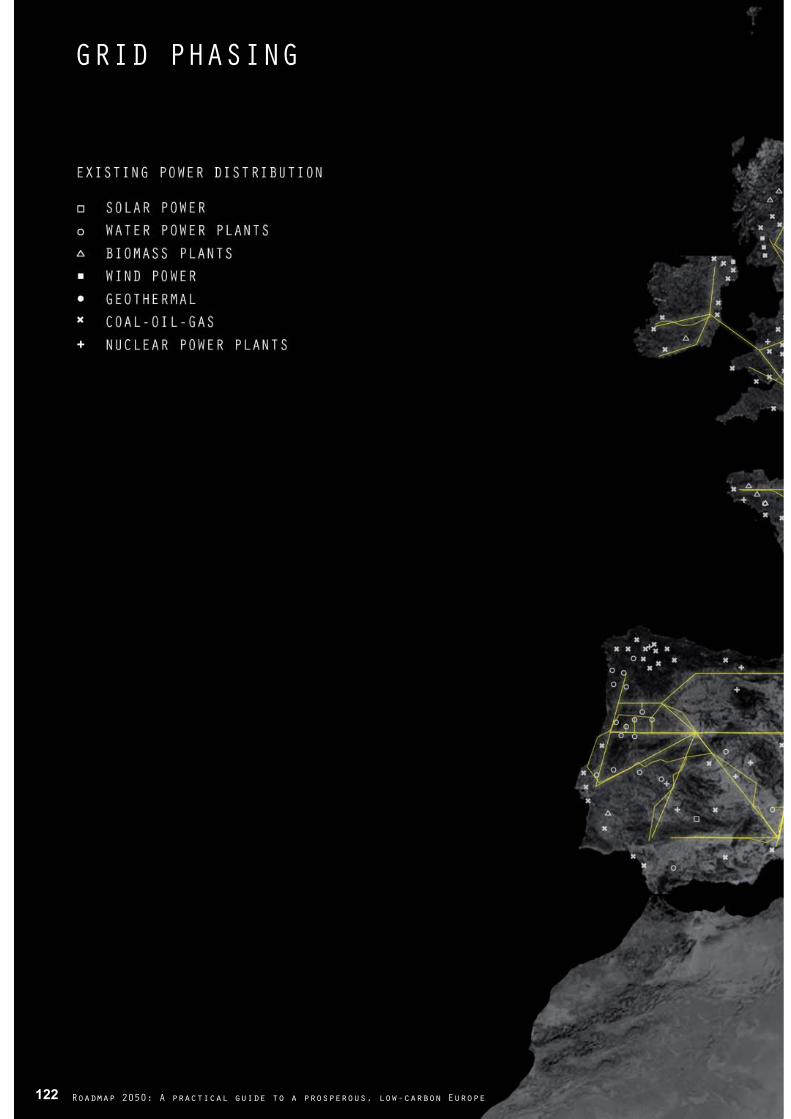
SOLAR POWER WATER POWER PLANTS WIND POWER BIOMASS PLANTS GEOTHERMAL COAL-OIL-GAS (CCS) NUCLEAR POWER PLANTS
proposed energy + potential
102 Roadmap 2050: A practical guide to a prosperous, low-carbon Europe
COMBINED ENERGY TYPES _ 80% PATHWAYexisting energy potential location of proposed energy types for 80% pathway.

SOLAR POWER WATER POWER PLANTS WIND POWER BIOMASS PLANTS GEOTHERMAL COAL-OIL-GAS (CCS) NUCLEAR POWER PLANTS
roadmap 2050
103OMA/AMO
Combined Energy Types
SOLAR POWER WATER POWER WIND POWER BIOMASS GEOTHERMAL COAL-OIL-GAS (CCS) NUCLEAR POWER
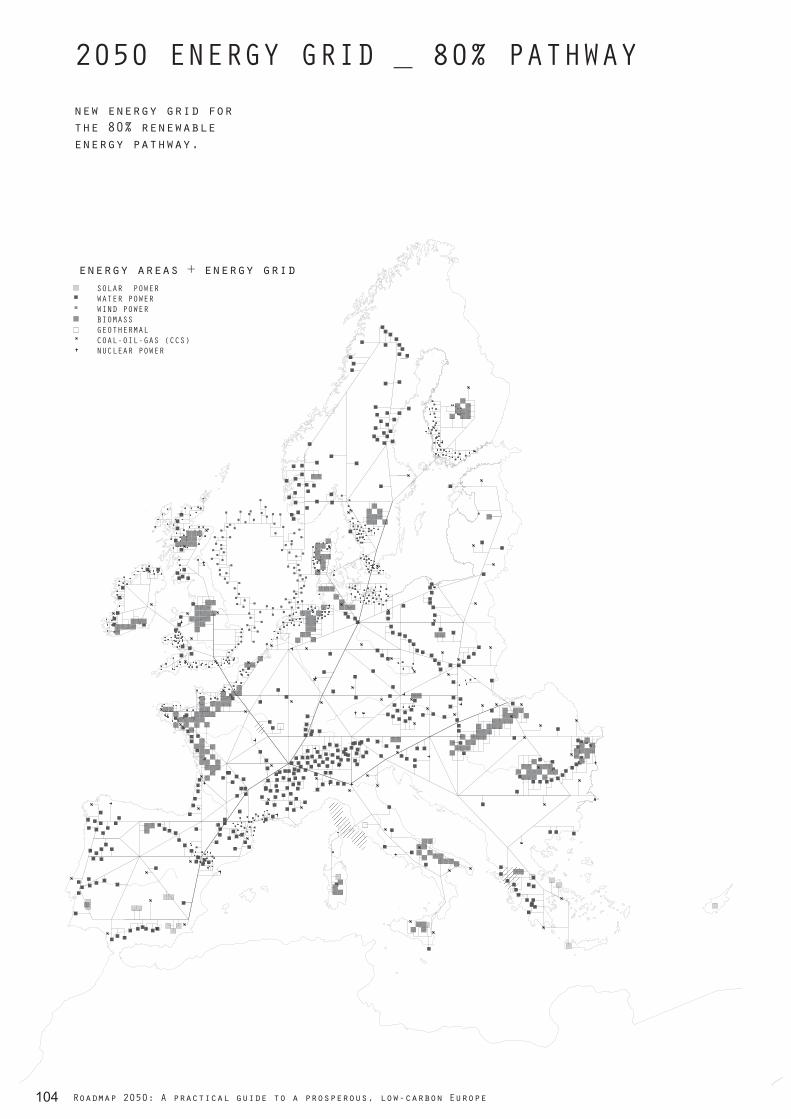
energy areas + energy grid
104 Roadmap 2050: A practical guide to a prosperous, low-carbon Europe
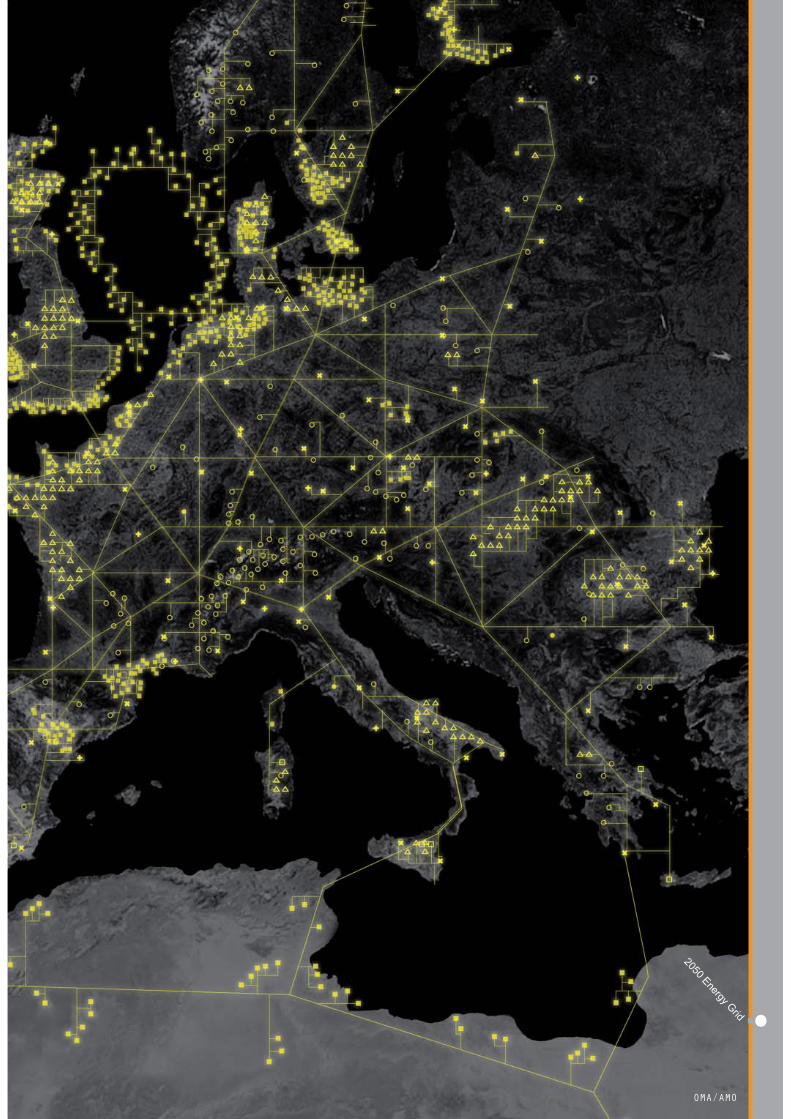
2050 ENERGY GRID _ 80% PATHWAYnew energy grid for the 80% renewable energy pathway.
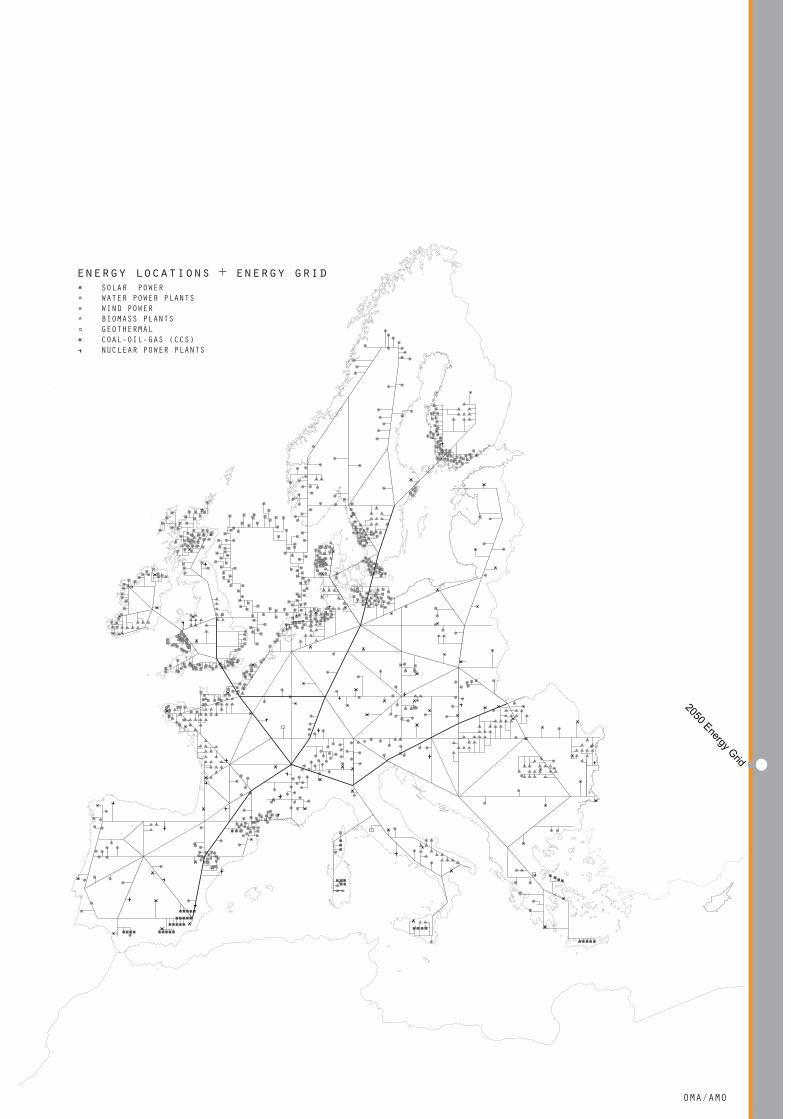
SOLAR POWER WATER POWER PLANTS WIND POWER BIOMASS PLANTS GEOTHERMAL COAL-OIL-GAS (CCS) NUCLEAR POWER PLANTS
energy locations + energy grid
105OMA/AMO
2050 Energy Grid
106 Roadmap 2050: A practical guide to a prosperous, low-carbon Europe
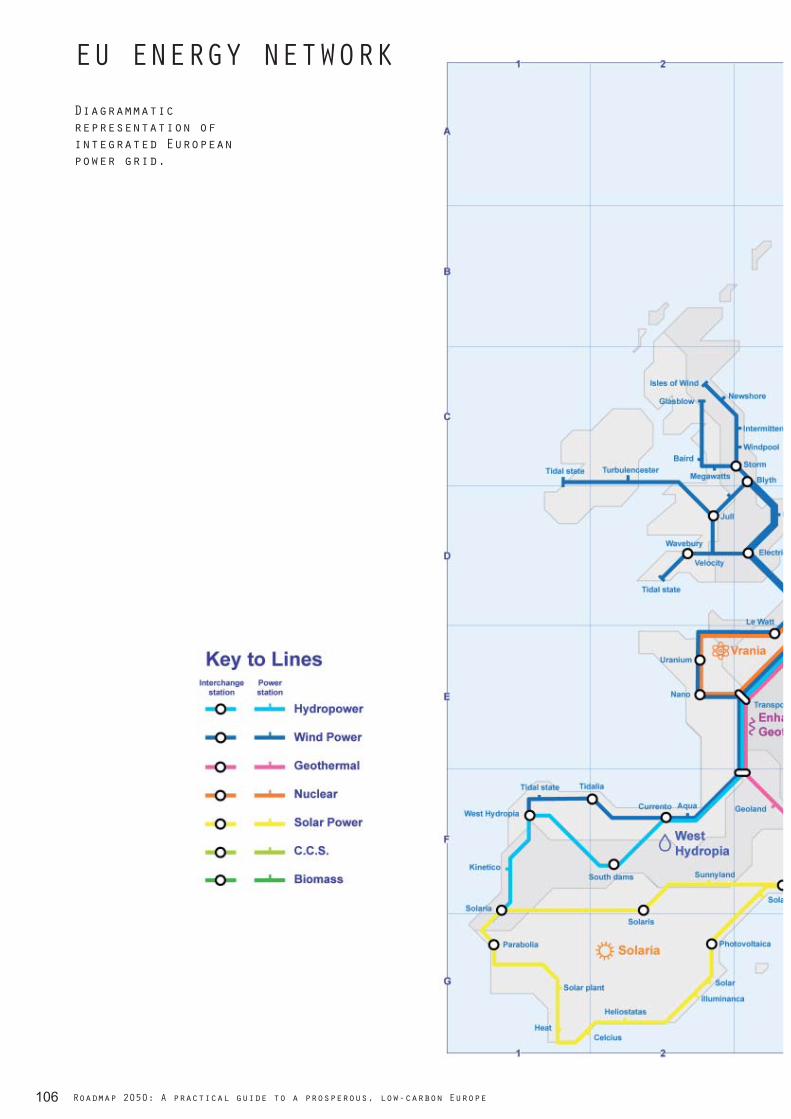
EU ENERGY NETWORKDiagrammatic representation of integrated European power grid.
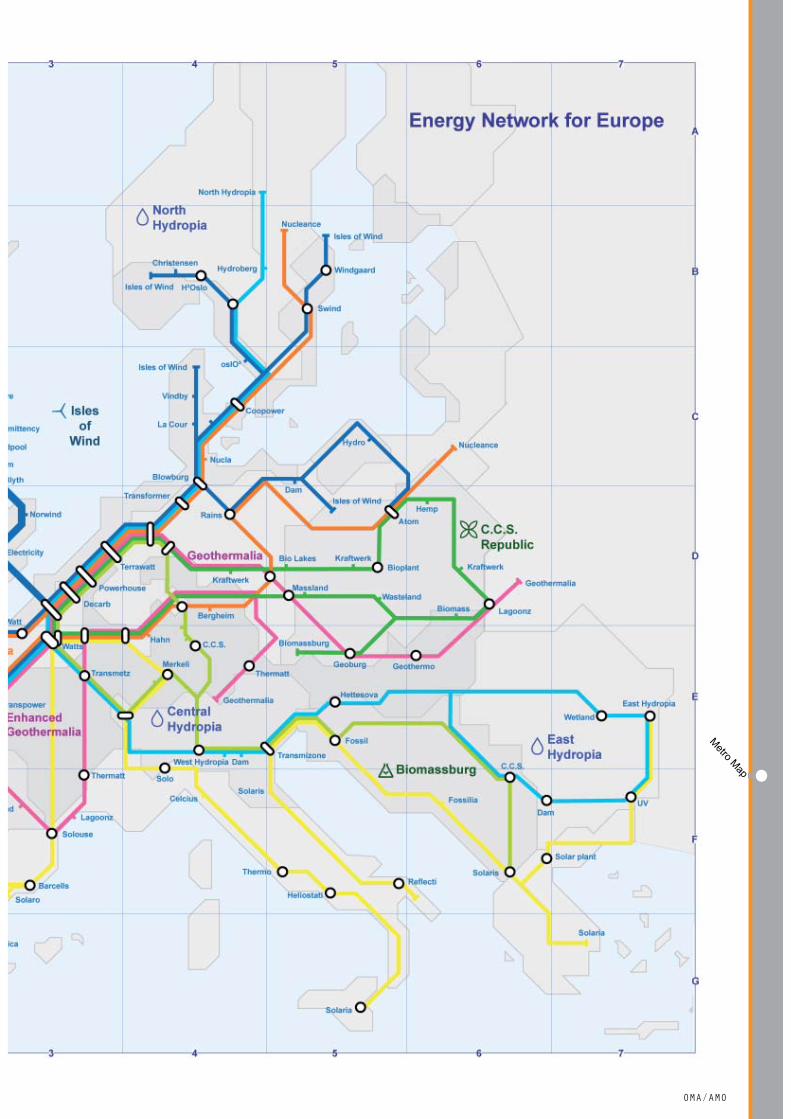
107OMA/AMO
Metro Map
108 Roadmap 2050: A practical guide to a prosperous, low-carbon Europe
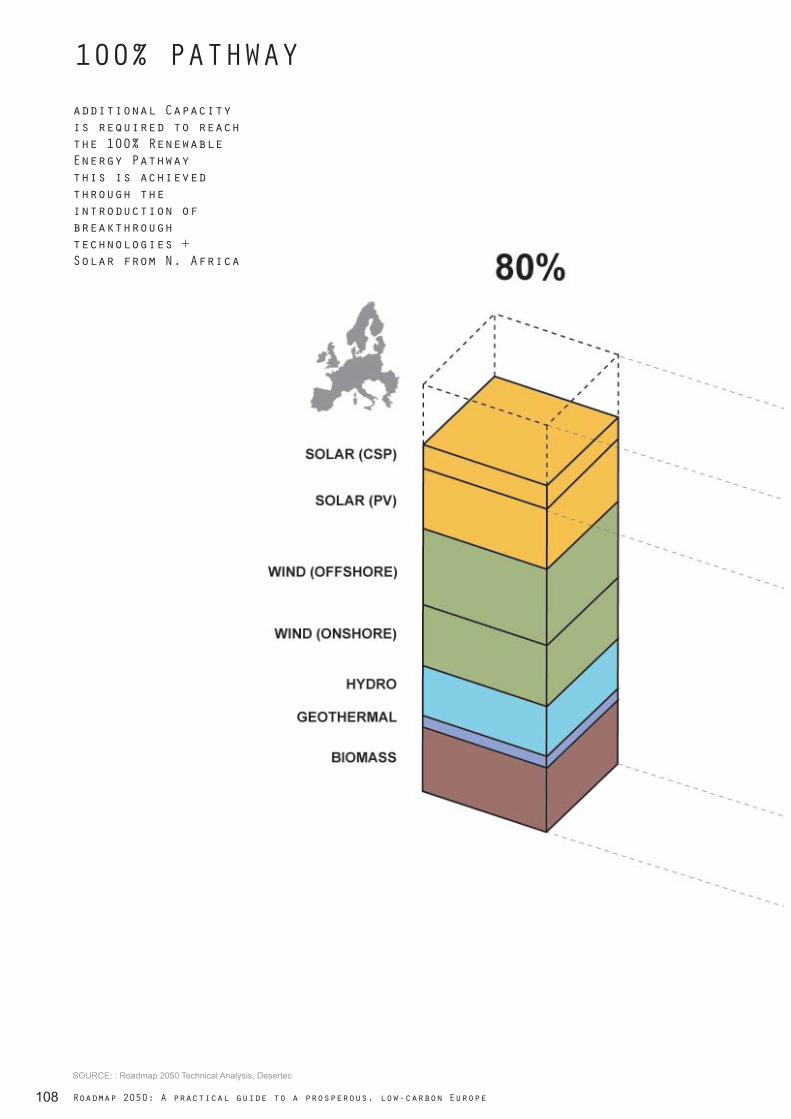
100% PATHWAYadditional Capacity is required to reach the 100% Renewable Energy Pathwaythis is achieved through the introduction of breakthrough technologies + Solar from N. Africa
SOURCE: : Roadmap 2050 Technical Analysis, Desertec

109OMA/AMO
100% RES Pathways

110 Roadmap 2050: A practical guide to a prosperous, low-carbon Europe
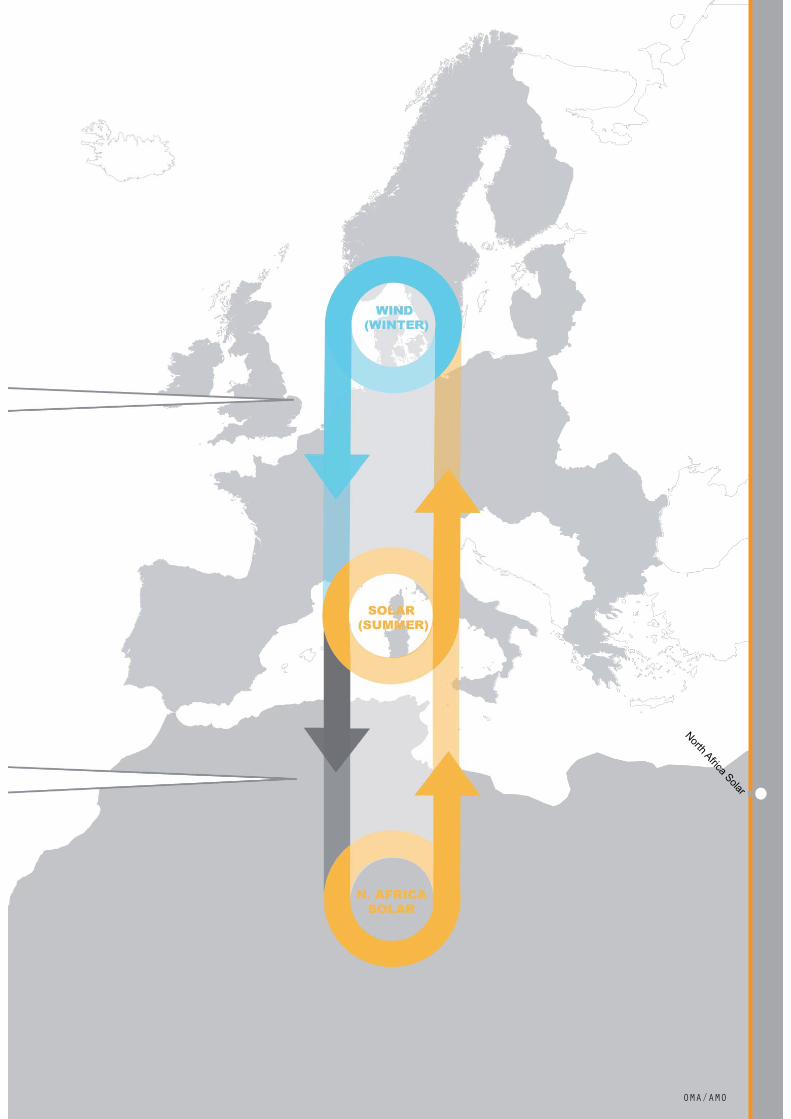
BENEFITS OF NORTH AFRICAN SOLARBoth the EU-27 and North Africa will benefit from their introduction into the European Energy grid.
111OMA/AMO
North Africa Solar
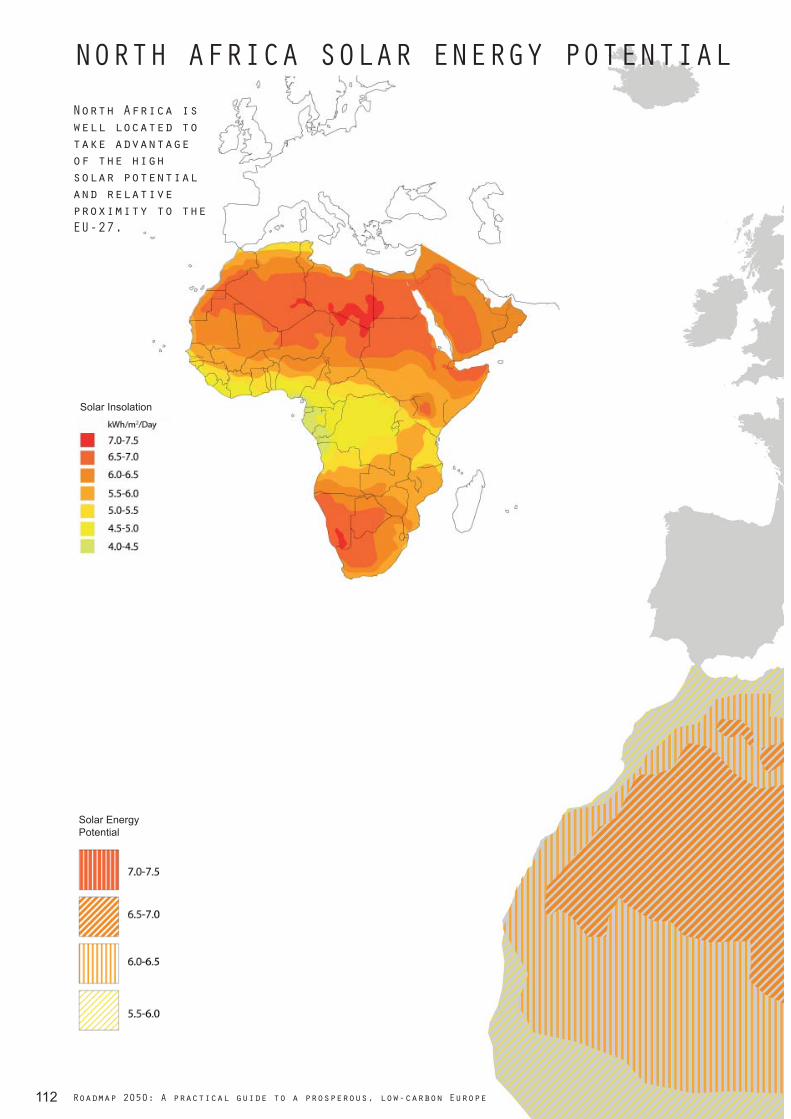
Solar EnergyPotential
Solar Insolation
112 Roadmap 2050: A practical guide to a prosperous, low-carbon Europe
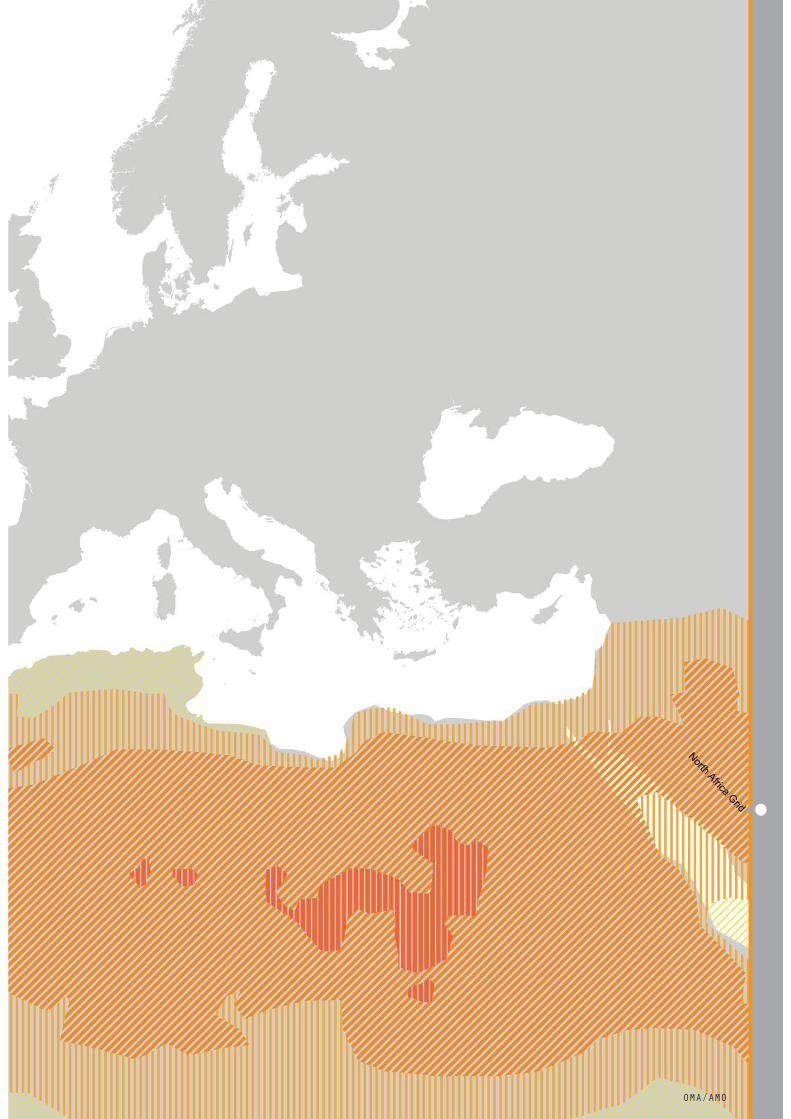
NORTH AFRICA SOLAR ENERGY POTENTIALNorth Africa is well located to take advantage of the high solar potential and relative proximity to the EU-27.
113OMA/AMO
North Africa Grid
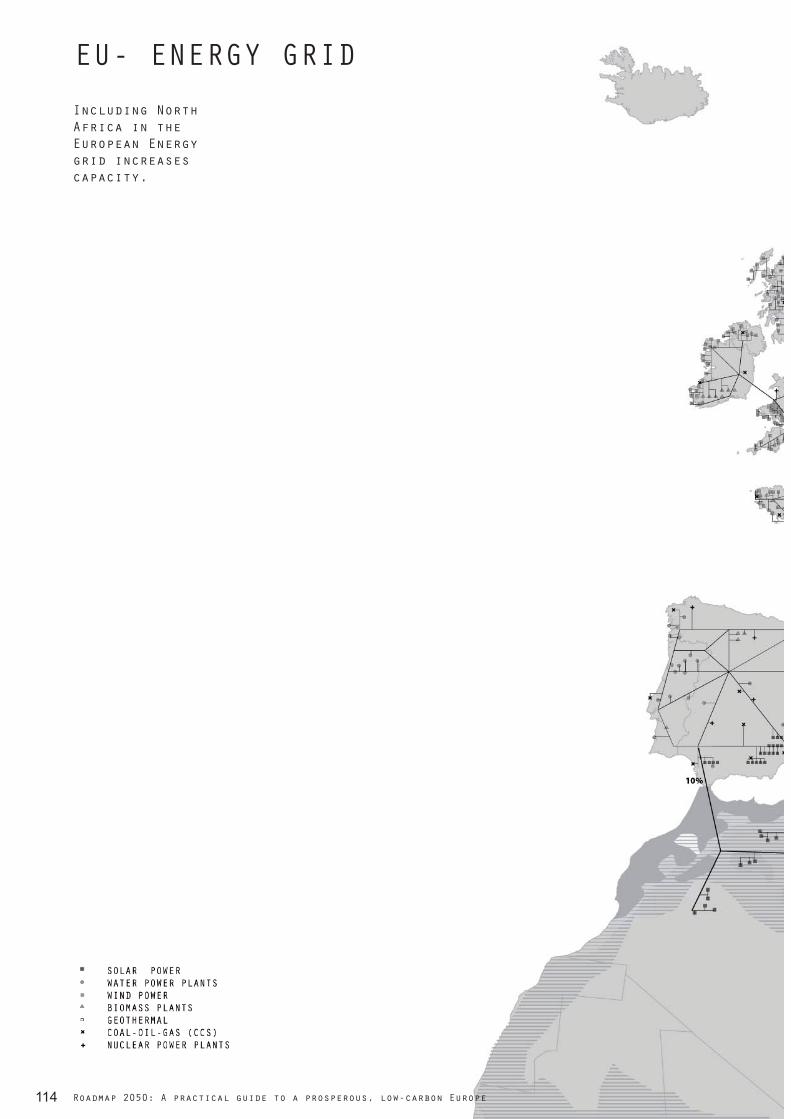
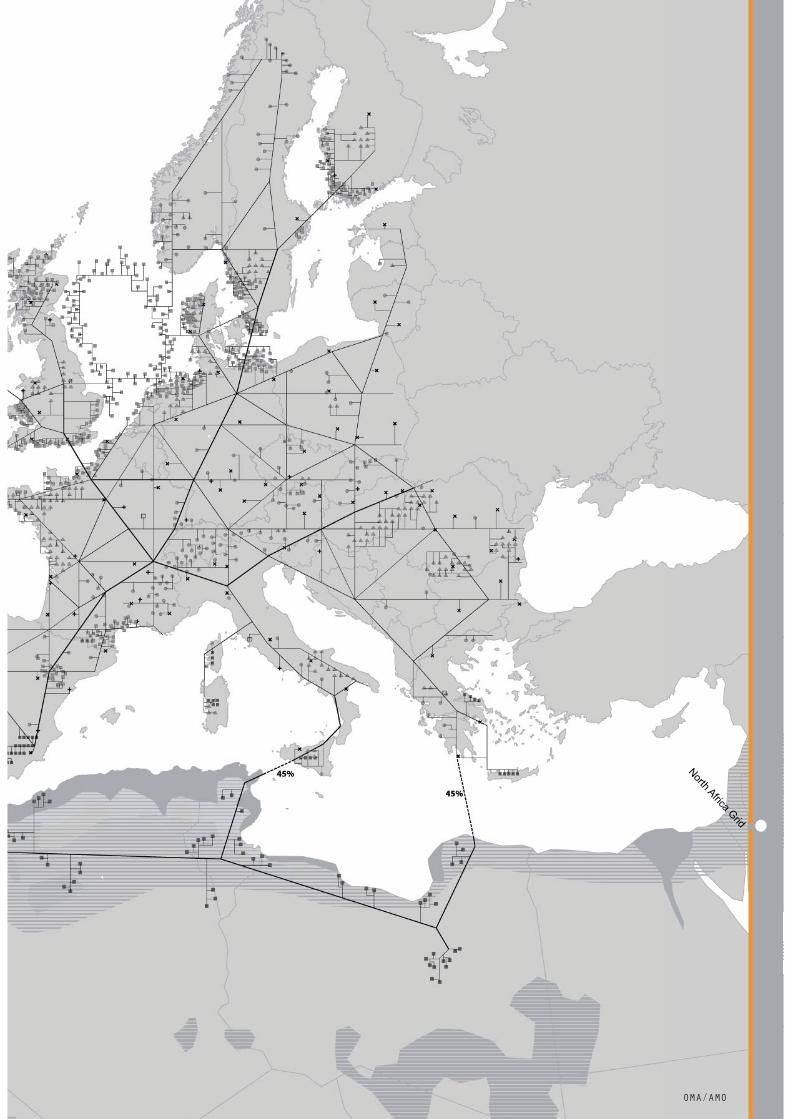
114 Roadmap 2050: A practical guide to a prosperous, low-carbon Europe
EU- ENERGY GRIDIncluding North Africa in the European Energy grid increases capacity.
115OMA/AMO
North Africa Grid

116 Roadmap 2050: A practical guide to a prosperous, low-carbon Europe

117OMA/AMO
EU North Africa Link
118 Roadmap 2050: A practical guide to a prosperous, low-carbon Europe
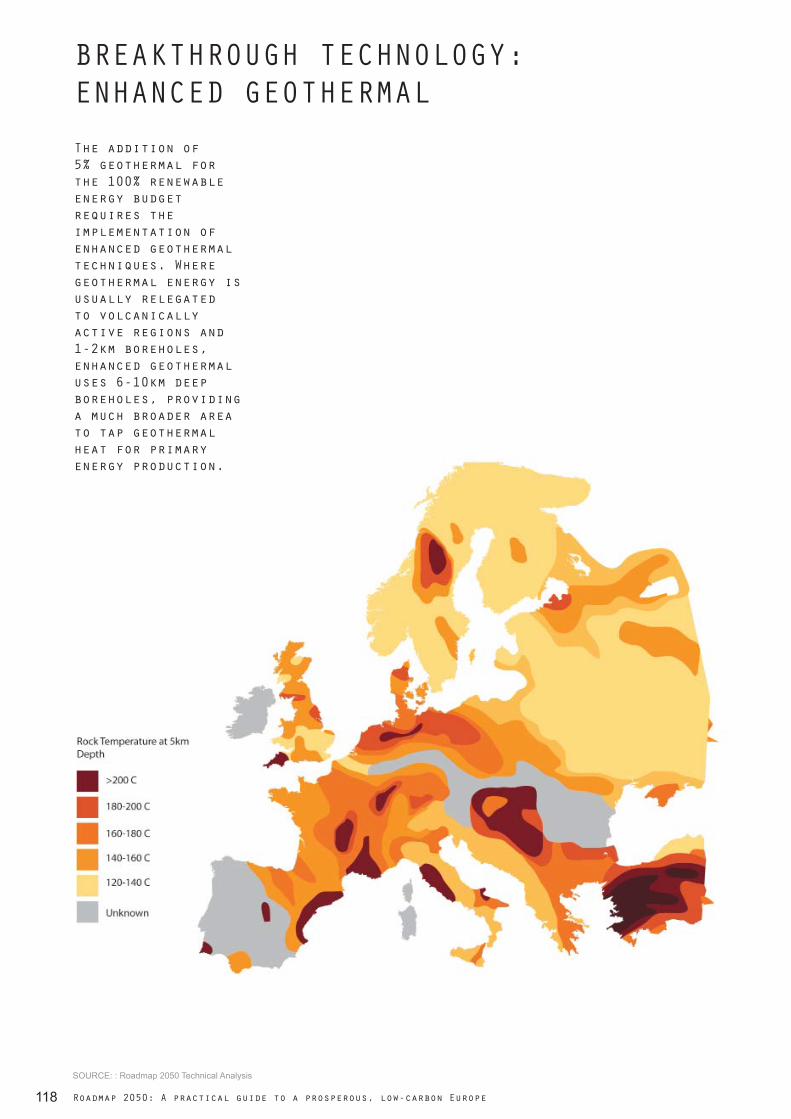
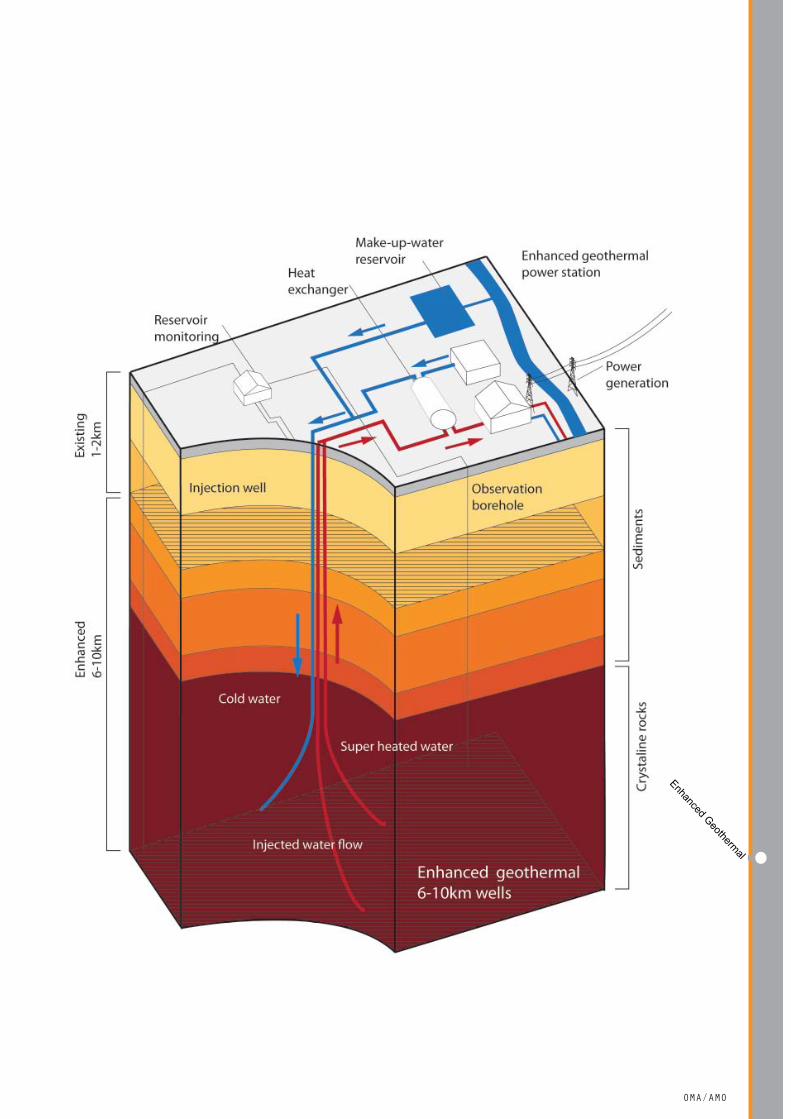
The addition of 5% geothermal for the 100% renewable energy budget requires the implementation of enhanced geothermal techniques. Where geothermal energy is usually relegated to volcanically active regions and 1-2km boreholes, enhanced geothermal uses 6-10km deep boreholes, providing a much broader area to tap geothermal heat for primary energy production.
BREAKTHROUGH TECHNOLOGY:ENHANCED GEOTHERMAL
SOURCE: : Roadmap 2050 Technical Analysis
119OMA/AMO
Enhanced Geothermal

120 Roadmap 2050: A practical guide to a prosperous, low-carbon Europe
EXISTING EUROPEAN GRID

121OMA/AMO
Transmission 2010
122 Roadmap 2050: A practical guide to a prosperous, low-carbon Europe
GRID PHASING

123OMA/AMO
Grid Phasing

124 Roadmap 2050: A practical guide to a prosperous, low-carbon Europe
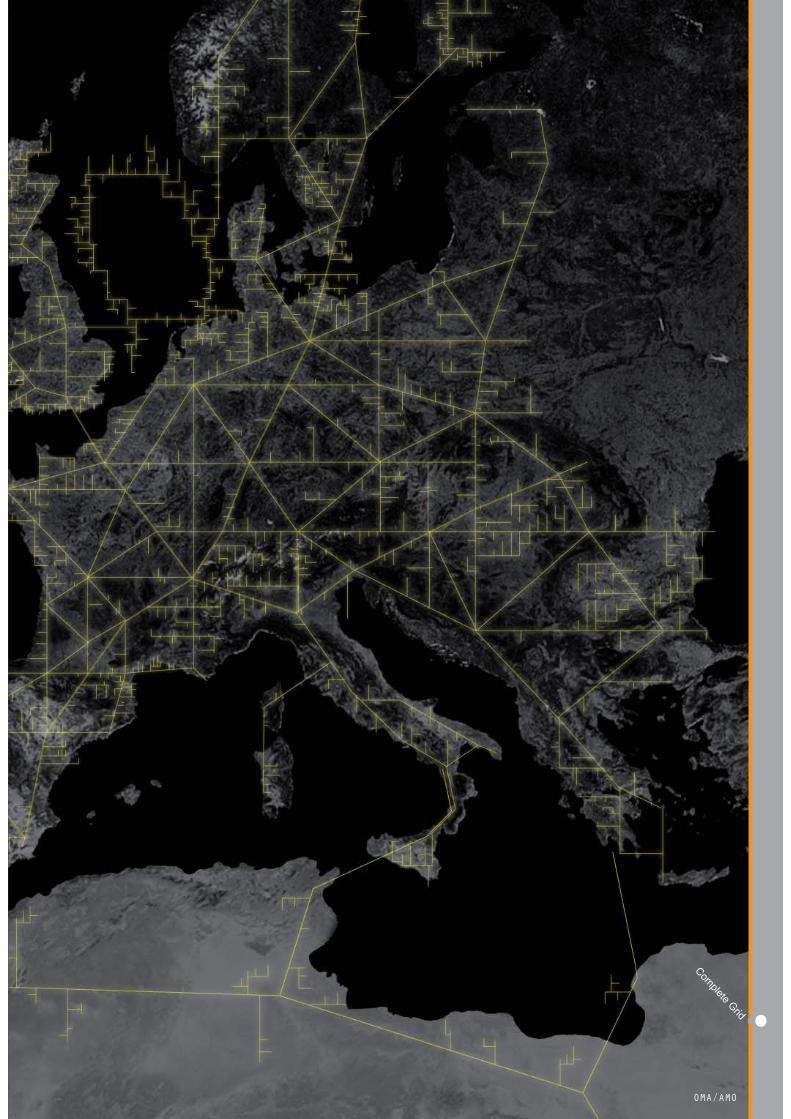
COMPLETE GRID
125OMA/AMO
Complete Grid

126 Roadmap 2050: A practical guide to a prosperous, low-carbon Europe
2050 EUROPEAN ENERGY GRID
127OMA/AMO
2050 Energy Grid
128 Roadmap 2050: A practical guide to a prosperous, low-carbon Europe
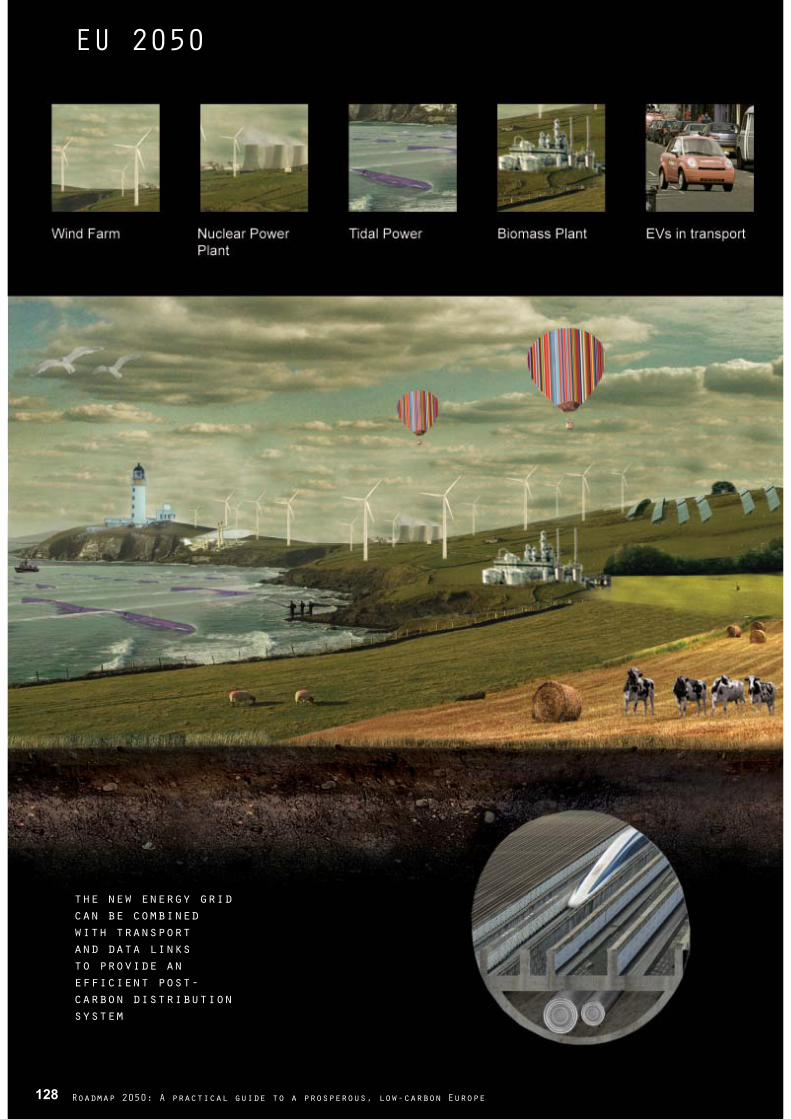
EU 2050
the new energy grid can be combined with transport and data links to provide an efficient post-carbon distribution system

129OMA/AMO
100% Decarbonization

IF YOU THOUGHT THE EUROPEAN ENERGY GRID WAS JUST A DREAM...
130 Roadmap 2050: A practical guide to a prosperous, low-carbon Europe

...THINK AGAIN.
131OMA/AMO
Green Europe

Disclaimer: The editors of Roadmap 2050 have been careful to acknowledge all copyright holders of the images used. If you claim ownership of any of the images presented here, and have not been properly identifi ed, please contact The Offi ce for Metropolitan Architecture PR department and we will be happy to make a formal acknowledgementin a future issue..

Roadmap 2050: a practical guide to a prosperous, low carbon Europe
The mission of Roadmap 2050 is to provide a practical, independent and objective analysis of pathways to achieve a low-carbon economy in Europe, in line with the energy security, environmental and economic
goals of the European Union.
The Roadmap 2050 project is an initiative of the European Climate Foundation (ECF) and has been developed by a consortium of experts
funded by the ECF.
The work on the three volumes of the Roadmap 2050 project has been undertaken by:
Volume 1: Technical and Economic AnalysisMcKinsey & Company; KEMA; The Energy Futures Lab at Imperial College
London; Oxford Economics and the ECF
Volume 2: Policy ReportE3G; The Energy Research Centre of the Netherlands (ECN) and the ECF
Volume 3: Graphic NarrativeThe Office for Metropolitan Architecture and the ECF
In addition, a wide range of companies, consultancy firms, research centres and NGOs have provided various forms of assistance during the preparation of this report. These organisations have provided valuable counsel that we have tried faithfully to reflect in this
analysis, however their willingness to consult and to be consulted in the course of this work should not be taken to mean that each of them
agrees with all of its assumptions or conclusions.
The ECF is the sole author of the Roadmap 2050 report, is solely responsible for its content and will act as a guardian of the
content.
The materials can be freely used to advance discussion on decarbonisation of the power sector and the broader economy. The report is made available to any and all audiences via a Creative
Commons license. For details of the terms and conditions, please see www.roadmap2050.eu/cc
The ECF would like to thank the Board of Advisors to the Roadmap 2050 project for their valuable support during its development and their
ongoing efforts:
Marta Bonifert; Avril Doyle; Meglena Kuneva; Jorma Ollila; Hans Joachim Schellnhuber; Lord Nicholas Stern; Graham Watson
For more information on Roadmap 2050: www.roadmap2050.eu
European Climate Foundation: www.europeanclimate.org