roadmap for a healthy, economical, and equitable …
TRANSCRIPT

PROSPEROUS, RENEWABLE MARYLANDROADMAP FOR A HEALTHY, ECONOMICAL,
AND EQUITABLE ENERGY FUTUREArjun Makhijani, Ph.D.
Institute for Energy and Environmental Research
PR
OS
PE
RO
US
, RE
NE
WA
BL
E M
AR
YL
AN
D:
ess


PROSPEROUS, RENEWABLE MARYLAND
ROADMAP FOR A HEALTHY, ECONOMICAL,
AND EQUITABLE ENERGY FUTURE
A report of the Renewable Maryland Project
Arjun Makhijani, Ph.D.
Institute for Energy and Environmental Research
The Renewable Maryland Project is funded by the Town Creek Foundation
November 2016
IEER Press

Find Renewable Maryland Project materials online at:
www.ieer.org/projects/renewable-maryland
The report is at:
http://ieer.org/resource/energy-issues/prosperous-renewable-maryland-2016
Copyright 2016
All Rights Reserved
The copyright of this work in all formats is held by the Institute for Energy and Environmental Re-search. An electronic ile is made available for downloading at no charge for non-commercial use
only. Any commercial use, including sales in paper, electronic, audio, or any other format or via the Internet, is strictly prohibited. Unauthorized sales in any format are a violation of copyright law.
© Institute for Energy and Environmental Research
ISBN: 978-0-9645168-4-7Library of Congress Control Number: 2016962432
Interior layout and cover design by Ryan Manning
Photo credits for cover: Lake City Village low-income housing, Seattle, Washington, courtesy of Solar World, www.solarworld.com; Ofshore wind turbines, http://upload.wikimedia.org/wikipedia/commons/thumb/f/f0/Barrow_Ofshore_wind_turbines_edit1.jpg/800px-Barrow_Ofshore_wind_turbines_edit1.jpg
Published by IEER Press
6935 Laurel Avenue, Suite 201
Takoma Park, MD 20912
Phone: (301) 270-5500
E-mail: [email protected]
www.ieer.org

i
INSTITUTE FOR ENERGY AND
ENVIRONMENTAL RESEARCH
6935 Laurel Avenue, Suite 201
Takoma Park, MD 20912
Phone: (301) 270-5500
FAX: (301) 270-3029
e-mail: [email protected]
http://www.ieer.org
Prosperous, Renewable Maryland:
Roadmap for a Healthy, Economical, and Equitable Energy Future
Arjun Makhijani
Report Overview1
Maryland can achieve a prosperous and healthy energy future with low greenhouse gas (GHG) emissions at lower cost than pursuing business-as-usual with fossil fuels. It has plentiful renewable energy resources to do so. Setting out irmly in the direction of deep GHG emission reductions is also consistent with the State’s Greenhouse Gas Emissions Reduction Act.
The goal of the 2015 Paris Agreement to limit global temperature rise to well below 2oC (pref-erably to 1.5oC) is as necessary as it is ambitious. It will mean deep reductions in greenhouse gas (GHG) emissions in the coming decades. States that act rapidly will secure for themselves a much more competitive position in the energy system of the future. That is also true of Maryland, which must build on and expand the programs it has already put into place.
New energy technologies are developing very rapidly. For instance, utility-scale solar and wind energy are now economical, even by Wall Street’s evaluation. Storage technologies are no longer an obstacle; costs are declining fast.
This report details a Climate Protection Scenario that can also be seen as a scenario for healthy prosperity. It shows that an energy system to protect climate would be 4 to 23 percent more economical than business-as-usual (BAU). It will save Marylanders between $1.3 billion and $7.3 billion a year (2011 dollars) in energy costs in 2050, even after making provisions for (i) assistance for low income households to pay no more than 6 percent of income on energy bills, (ii) proactive investments in com-munities now dependent on fossil-fuel-related jobs, and (iii) new job creation in underserved areas.
Reaching zero emissions in the electricity sector and low emissions in the energy sector over-all by 2050 will bring net economic beneits without even taking in account the huge avoided cost that climate disruption would otherwise wreak in a business-as-usual world. The 2006 Stern Review estimated global economic damage that could translate to a loss in Maryland’s Gross State Product of about $35 billion – almost $2 billion more than the cost of energy in the BAU scenario and over $7 billion more than the cost of energy in the Climate Protection Scenario.
1 This is a short summary of the inal report of the Renewable Maryland Project, funded by the Town Creek Foundation.

ii
There would be other collateral beneits of a climate-protecting energy system. The present energy system is much more land and water intensive, than would be one based on eiciency and on solar and wind energy. For instance, Marylanders use about half-a-million acres of land in other states just for the ethanol made from corn that is used as vehicular fuel; the land requirements of the Climate Protection Scenario are far lower. The Climate Protection Scenario would also free precious water resources: nearly three-fourths of the water in the Susquehanna River Basin, the main source of freshwater for the Chesapeake Bay, is today consumed by thermal electric generation. Solar and wind energy require essentially no water. Air pollution would be greatly reduced, as well, with the attendant health beneits.
The key features of the Climate Protection Scenario are:
• Eiciency: The vast majority of energy in the present system does not actually provide the desired energy service – it is lost in processing, during transport, or at the point of use. Wars are fought for oil but only 20 percent of the petroleum in the tank actually powers the wheels to move the vehicle. Two-thirds of the fuel used in thermal electricity generation is lost at the power plant condenser; in turn much of the electricity is then used ineiciently.
• Solar and wind energy: Renewable resources, notably solar and wind energy, which use no water and have low losses, are already price competitive as the main primary energy supply of a smart grid supported by demand response and storage.
• Democratization: Properly implemented, the energy system of Maryland’s future can provide people and small businesses the choice to become producers of energy as well, while contribut-ing to the integrity of the entire system.
• Total cost savings: Every unit of primary energy supplied in the Climate Protection Scenario energy system would power almost three times the energy services of the business-as-usual scenario. Average annual cost per person for all energy costs (including all direct energy and transportation fuel costs and all indirect costs embedded in the costs of goods and services) was about $10,500 in 2011 or about 13 percent of household income. In 2050, household income would be about two-thirds bigger in real terms. The total BAU cost per household would be about $11,500. It would be about $9,600 in the Climate Protection Scenario or about 17 percent less than in the BAU scenario. The residential energy burden in the CPS scenario for a house-hold with average income would be on the order of 2 percent (rounded).
• Maryland-speciic economic opportunity: About half the money that Maryland spends on energy today is exported to other parts of the country and the world. The Climate Protection Scenario provides a roadmap for reaping the economic beneits within the state by investing in renewable energy, eiciency, and smart grid and electric vehicle infrastructure. If Maryland provides policy certainty for its long-term direction, it could attract manufacturing, as other parts of the United States have already done.
• A coherent system: The Climate Protection Scenario will be a very diferent energy system – with variable solar and wind, a smart grid and smart appliances, consumers who are produc-ers, eiciency, storage, demand response, renewable peaking generation, and microgrids. All elements will work together to ensure reliability, resilience, and afordability.
In the past, major changes in energy systems have been accomplished in a few decades – from whale oil to kerosene to electric lights or from horses to internal combustion engines. That is what is envi-sioned here for the future. The main policies needed are:
Report Overview

iii
Prosperous, Renewable Maryland
1. Eiciency: Maryland’s EmPOWER program must continue at 2 percent eiciency gains per year, along with incentives for the conversion of fossil fuel heating systems to eicient electric ones (starting with fuel oil and propane).
2. Electric vehicle infrastructure: The Public Service Commission must ensure that utilities and others upgrade the distribution system and support EVs, with due attention to equity.
3. Renewable Portfolio Standard (RPS): Maryland’s deinition of renewable energy should be revised to ensure that the resources used are truly renewable, like wind and solar energy. A 55 percent RPS for 2030 and a 100 percent RPS by 2050 would provide a robust path to overall 90 percent GHG emission reductions by 2050.
4. Afordable and democratized Grid-of-the-Future: The business model of utilities must change from selling energy to becoming a platform for conveying energy services and enabling equity and the democratization of the grid. The Public Service Commission must ensure that.
5. Equity policies: Policies must be adopted that ensure (i) energy is afordable for low-income households (an afordable amount is generally deined as less than 6 percent of gross house-hold income), (ii) jobs are created in underserved areas, and (iii) fossil-fuel-dependent workers and communities are proactively protected. Raising revenues for these eforts should be an integral part of the energy transition.
6. Social co-beneits: The non-energy beneits of reduced homelessness and medical costs, in-creased employment, and better health should be accounted for and used as part of the assess-ment of climate protection policies.
The Climate Protection Scenario is based on present- and near-future commercial technology. It provides a policy blueprint; it is not a prediction for the year 2050. Periodic evaluation, for instance by the Maryland Commission on Climate Change, will be needed to ensure that the State is on track, avails itself of new opportunities, and responds to new challenges.
Maryland has the opportunity to create a prosperous and healthy energy system with tens of thousands of new jobs. At the same time, Maryland can ensure that energy is afordable for all and that workers and communities now dependent on fossil fuels participate fully in the new energy economy. The energy transition appears set to take place whether Maryland is on board or not. Technological innovation, the Paris Agreement, and many other developments across the world are pointing in that direction. This report provides a roadmap for Maryland to take a leadership role in developing an en-ergy system that will promote health and prosperity for its people.

iv
Contents
Report Overview .................................................................................................................................. i
Preface ..................................................................................................................................................1
Executive Summary .............................................................................................................................6
1. The Problem: climate disruption, pollution, energy inequity ....................................................6
2. The Social and Economic Impact ..............................................................................................6
3. Approach to the problem ............................................................................................................7
4. The Solution Part I: Renewable energy and eiciency ..............................................................8
5. The Solution Part II: Resilience and energy democracy in the grid-of-the-future ...................12
6. Energy equity and democracy ..................................................................................................14
i. Afordable energy................................................................................................................14
ii. Energy opportunities ..........................................................................................................14
iii. Energy democracy ............................................................................................................15
7. Jobs, communities, and the energy transition ..........................................................................16
i. Number of jobs ...................................................................................................................16
ii. The Community and Worker Protection Fund ...................................................................16
iii. Manufacturing jobs ...........................................................................................................17
8. Environment and sustainability ................................................................................................18
9. Obstacles ..................................................................................................................................19
10. Getting to a 100 percent emissions-free energy system .........................................................20
11. Overall conclusions ................................................................................................................20
I. Major aspects of the transition ........................................................................................................22
1. Climate context – the 2℃ limit ................................................................................................22
2. The Paris Agreement ................................................................................................................23
3. Technical aspects ......................................................................................................................25
4. Challenges during the transition ..............................................................................................27
5. Energy and sustainability .........................................................................................................28
II. Maryland’s energy system and greenhouse gas emissions ............................................................30
1. Energy use, 2011 ......................................................................................................................30
2. Energy production and processing ...........................................................................................32
3. The electricity system ..............................................................................................................33
4. Energy-related greenhouse gas emissions, 2006 and 2011 ......................................................34
5. Expenditures on energy ............................................................................................................36

v
III. Eiciency .....................................................................................................................................39
1. Electricity generation ...............................................................................................................42
2. Lighting ....................................................................................................................................42
3. Heating .....................................................................................................................................43
4. Petroleum fueled vehicles ........................................................................................................44
5. Design ......................................................................................................................................45
6. Conclusions ..............................................................................................................................46
IV. Direct fuel use in the residential and commercial sectors ............................................................48
1. Space heating ...........................................................................................................................49
2. Other end uses ..........................................................................................................................51
V. Transportation ................................................................................................................................53
1. On-road transportation .............................................................................................................55
i. Cars and light trucks ...........................................................................................................55
ii. Other road transport ...........................................................................................................59
2. Non-road transport ...................................................................................................................61
3. Connecting BEVs to the grid ...................................................................................................64
4. Biofuels ....................................................................................................................................65
VI. The electricity system ..................................................................................................................67
1. Introduction ..............................................................................................................................67
2. Renewable resources for the electricity sector .........................................................................69
i. Deining renewable energy .................................................................................................75
3. Eiciency .................................................................................................................................81
4. Demand response .....................................................................................................................86
5. Storage .....................................................................................................................................87
6. Combined heat and power .......................................................................................................89
7. Resiliency .................................................................................................................................89
VII. Getting to an emissions-free energy system ...............................................................................92
1. Introduction ..............................................................................................................................92
2. Roadmap to 2030 .....................................................................................................................93
i. Eiciency ............................................................................................................................94
ii. Demand response ...............................................................................................................94
iii. Resiliency .........................................................................................................................96
iv. Technical results ................................................................................................................97
v. Emissions .........................................................................................................................101

vi
vi. Contingency: nuclear power ...........................................................................................104
vii. Contingency: RPS deinition .........................................................................................109
viii. Other contingencies ......................................................................................................110
3. Roadmap to 2050 ...................................................................................................................110
i. An emissions-free electricity sector ..................................................................................112
ii. Compressed air energy storage ........................................................................................119
iii. Seasonal thermal storage ................................................................................................121
4. Energy sector results, 2050 ....................................................................................................124
i. The electricity sector .........................................................................................................125
ii. Direct use of fossil fuels ..................................................................................................134
iii. Overall energy supply and demand in 2050 ...................................................................135
iv. A reliable grid with variable resources ............................................................................139
5. Energy sector emissions in 2050 ............................................................................................140
i. Sensitivity analysis ...........................................................................................................142
6. Resiliency in 2050 ..................................................................................................................144
7. Getting to a 100 percent emissions-free energy system .........................................................145
VIII. Grid-of-the-Future, Energy Equity, and Energy Democracy ..................................................147
1. Introduction ............................................................................................................................147
i. Maryland’s GOTF proceeding ..........................................................................................155
ii. Carbon-neutral buildings .................................................................................................156
2. Equity and democracy in the grid-of-the-future ....................................................................157
i. Long-term: AEP-Plus-Transportation ...............................................................................160
ii. Broadband access .............................................................................................................161
3. Energy democracy..................................................................................................................162
4. Net metering and the value of solar energy ...........................................................................163
5. Structure of electricity system management ..........................................................................167
IX. Economic considerations ...........................................................................................................170
1. Cost details .............................................................................................................................170
2. Sensitivity analysis.................................................................................................................179
i. Solar and the cost of battery storage .................................................................................182
3. Energy sector business structure ............................................................................................183
i. Investments, business-as-usual scenario ...........................................................................183
ii. Investments, Climate Protection Scenario .......................................................................185
iii. Business-as-usual scenario sensitivity analysis ..............................................................187

vii
4. Existing, centralized merchant generation .............................................................................188
5. Natural gas .............................................................................................................................189
6. The value of eliminating fuel price volatility.........................................................................190
X. Jobs, communities, and just transition ........................................................................................192
1. Jobs created by the transition .................................................................................................193
2. Induced jobs ...........................................................................................................................200
3. Distributed jobs in underserved areas ....................................................................................200
4. Jobs summary.........................................................................................................................201
5. Protecting communities and workers .....................................................................................202
6. Energy justice .........................................................................................................................204
XI. Environmental, health, and resource considerations .................................................................205
1. Water ......................................................................................................................................205
2. Air pollution ...........................................................................................................................209
i. Outdoor air pollution ........................................................................................................209
ii. Indoor air pollution due to natural gas .............................................................................214
3. Residual impacts of the Climate Protection Scenario ............................................................215
4. Land use .................................................................................................................................215
i. Wind land area ..................................................................................................................215
ii. Solar land area .................................................................................................................219
iii. Comparing land area requirements .................................................................................219
iv. Reducing land area requirements ....................................................................................221
5. Upstream and downstream impacts .......................................................................................222
XII. Policy considerations ................................................................................................................226
1. Renewable energy ..................................................................................................................231
2. Eicient electriication of direct fossil fuel use .....................................................................232
3. Fossil fuel infrastructure ........................................................................................................232
4. Eicient buildings ..................................................................................................................234
5. Electriication of transportation .............................................................................................234
6. An open, equitable grid-of-the-future ....................................................................................235
7. An afordable and equitable transition ...................................................................................236
8. A just transition for workers and communities ......................................................................237
9. Pilot and demonstration projects ............................................................................................237
i. Renewable microgrids ......................................................................................................237
ii. Integrating short-term and seasonal storage ....................................................................238

viii
iii. Direct current demonstration ..........................................................................................239
iv. Electriied bus transport ..................................................................................................239
v. Residential fuel cell micro-CHP with renewable hydrogen .............................................239
10. The Paris Agreement and the 1.5℃ limit.............................................................................240
XIII. References ...............................................................................................................................241
Attachment A: Method .....................................................................................................................280
1. Overview ................................................................................................................................280
2. Details and Methodology – Residential Sector ......................................................................281
i. Residential customer growth ............................................................................................281
ii. Hourly electricity load proile – 2011 total load ..............................................................281
iii. Hourly electricity load proile – 2011 Heating and Cooling Loads ................................283
iv. Hourly electricity load proile – 2011 appliance loads ...................................................283
v. Hourly lighting load proiles ............................................................................................284
vi. Hourly water heating load proiles ..................................................................................285
3. Solar and wind energy data ....................................................................................................285
4. Dispatchable resources ...........................................................................................................286
Attachment B: Land requirements for corn ethanol compared to solar electricity
and some related issues ....................................................................................................................288
Attachment C: Joint Labor Network for Sustainability – IEER Discussion Paper ..........................291
Beyond a Band-Aid: ........................................................................................................................291
1. Introduction ............................................................................................................................291
2. The problem: Protecting fossil fuel workers and communities .............................................293
3. The opportunity ......................................................................................................................294
4. A community and worker protection fund .............................................................................294
5. Creating jobs prospectively ....................................................................................................295
6. Revenues ................................................................................................................................296
i. A carbon tax ......................................................................................................................296
ii. Ending oil and gas subsidies ............................................................................................297
iii. Decommissioning funds .................................................................................................297
iv. CWP Fund leverage ........................................................................................................297
7. Conclusion .............................................................................................................................297
8. References for Beyond a Band-Aid .......................................................................................298
9. Endnotes for Beyond a Band-Aid ..........................................................................................299

1
Prosperous, Renewable Maryland
Preface
This report is the last in a series of three produced by the Renewable Maryland Project of the Institute for Energy and Environmental Research (IEER). The project aims to create a roadmap for an energy sector with the following attributes:
• Essentially emissions-free: more than 90 percent reduction in CO2 emissions relative to
2006 by the year 2050;
• Reasonable cost: the fraction of income spent on energy by consumers does not exceed current levels (we use 2011 as our baseline year);
• Equitable: all Marylanders, including those with low incomes, can meet their energy needs without the high burdens that energy bills impose on them today;
• Just: communities and workers facing the loss of facilities and jobs in existing infrastruc-ture have the resources to create new jobs and protect community facilities like schools and ire and police departments;
• Robust and resilient: reliable, resistant to failure for essential services, and quick to re-cover from breakdowns;
• Democratized: a transparent electricity sector that provides more choices and more con-trol to people of all income levels, including greater opportunities to participate in various aspects of the electricity system, including electricity generation and demand response.
This report describes a roadmap for an energy future in Maryland with these attributes. Over-all, it is our assessment that we have the technology to greatly increase eiciency, to create a 100 percent renewable electricity sector, and to electrify end uses that now use fossil fuels, notably space heating and transportation.
This report can also be regarded as a substantial update of IEER’s book Carbon-Free and Nuclear-Free: A Roadmap for U.S. Energy Policy, initially published in 2007.2 This book was the irst to examine the technical and economic feasibility of a fully renewable energy system in the United States. Technology has developed much faster than I foresaw then: solar has become economical well before my estimate, which was deliberately cautious. So also has the development of electric road transport and the technology for smart grids, including demand response, renewable microgrids, and distributed energy systems. The energy sector can be afordably democratized and made resilient, and equitable. While this report analyzes the Maryland energy system in detail, the general approach and most of the details are applicable much more broadly. In fact, there are many regions of the United States, and the world, where renewable energy resources, notably solar and wind, are more plentiful and even more economical than in Maryland.
At the same time, the climate crisis has developed faster than most oicial estimates. The Conference of Parties (COP) meeting in Copenhagen in 2009 agreed that global average temperature
2 Makhijani 2010

2
Preface
rise should be kept below 2oC to reduce the risk of catastrophic efects; the COP21 meeting in Paris in 2015 agreed on the necessity of keeping the temperature rise to well below 2°C and if possible to 1.5°C above pre-industrial levels. A limit of 1.5°C is a very tough target; indeed the best estimate of a greenhouse gas (GHG) concentration that would keep temperature below this level is 430 parts per million CO
2-equivalent. This level was reached ive years ago in 2011.3
This points to the need for complete or near-complete elimination of GHG emissions, notably those from the energy sector, even more rapidly than the usual target date of the middle of the cen-tury. Fortunately, the technology has developed to the point where, with serious efort, that goal could probably be achieved a decade sooner. It is our hope that this report will not only be a roadmap for Maryland, but useful as a guide more generally.
Besides looking forward to 2050, we also looked back from 2050 in order to identify major obstacles that might hinder the achievement of an emissions-free future. For instance, natural gas is currently an economical fuel for many purposes, including space heating and electricity generation. What is the path to greatly reducing its use, which will be necessary to achieve major greenhouse gas reduction goals? Take Maryland’s nuclear power reactors at Calvert Clifs, which at present is a major source of electricity supply. What happens if the owners do not seek a license extension when their current permits expire in the mid-2030s? Suppose they shut down prematurely due to the kinds of rising operating costs and low energy market prices that are causing premature shutdowns of nuclear power plants in other regions? How should one make a reliable roadmap even though there is consid-erable uncertainty in future technology? And, as a last example, what policies are needed to change the present reality in which low-income households sufer from high energy burdens and yet do not have equitable access to solar energy?
It is important to note that this report is not a forecast of the set of technologies that will actu-ally be in use in the 2050. Technology is changing too fast even on decadal time-scales to enable a forecast in the strict sense of the term. Rather, what we seek to do is to create a roadmap that evaluates the feasibility and cost of a transition to renewable energy sources based on technology that is com-mercially available now, that is competitive with fossil fuels, or that can be reasonably estimated to become competitive with fossil fuels in the next decade. We also seek to deine an energy system that will be afordable – that is, comparable in cost as a fraction of income to present expenditures.
Our approach is admittedly cautious; yet it allows us to deine a roadmap that realistically ad-dresses the obstacles and that identiies paths to an emissions-free future that will be at least as eco-nomical and environmentally sound as the estimates in this report. In other words, the roadmap as de-veloped here relects the minimum economic and environmental attributes of an emissions-free energy future; reasonable policies and normal technological development along that road can be expected to lead to a technical-economic system that has more attractive attributes than the one discussed here.
The reliance on existing technology should not prevent a more ambitious approach. We have indicated some of the ingredients of such an approach, not least because it appears to be necessary to achieve the Paris Agreement goal of limiting temperature rise to 1.5oC.
For example, liquid hydrogen fuel has been demonstrated as a fuel for aircraft, including pas-senger aircraft.4 However, the demonstration that existing aircraft can be fueled with liquid hydrogen is not suicient for us to estimate the infrastructure and cost of a transformation of the air transporta-tion sector. Thus, we examine the implications of continuing to use petroleum for most air transport
3 IPCC5 Synthesis 2014, p. 20, fn 15, and p. 21 (in the Summary for Policymakers) 4 Makhijani 2010, Chapter IV, Section B.1.
3
Prosperous, Renewable Maryland
and we point to the emerging electric and hybrid aircraft technologies that could enable this fast-growing sector to become emissions-free as well.
The irst phase of the project, in late 2012 and early 2013 began with consulting various stake-holders and the formation of an Advisory Board, a process in which Stuart Clarke, Executive Direc-tor of the Town Creek Foundation, played a central role. The consultations have continued since that time, including Advisory Board meetings that reviewed a draft report on the buildings sector emission reductions and electricity sector modeling, a draft and a inal version of the report focused on heating and cooling of buildings in Maryland, and a draft of the present report, which is now being inalized. Advisory Board members serve in their personal (and not institutional) capacities; they may or may not agree with or endorse any of the indings, analyses, and recommendations of the work of this proj-ect, including the present report.
The role of the Advisory Board has been as follows:
1. Ensuring that IEER’s work is informed by near-term opportunities and careful understanding of what advocacy groups are doing. Reciprocally, there should be enough understanding on the part of advocacy groups to see what a path to climate protection and an emissions-free energy sector would look like.
2. Ensuring that the project remains grounded in - and cognizant of - Maryland’s legislative, regu-latory, and business landscape, a project where vision and pragmatism are linked to ensure that policies will be lexible enough to enable correction.
3. Advising on a communications approach and strategy, which is critical to achieving broad accep-tance, adoption, and implementation of an emissions-free energy sector.
4. Helping the project not only to illuminate paths to the long-term vision but also to help identify obstacles that may need to be overcome along the way as well as diversions and dead-ends that would distract or detract from the goal.
The Advisory Board members are:
1. Rebecca Bertram, Program Director, Environment and Global Dialog, Heinrich Böll Foundation, Washington, D.C., oice;
2. James McGarry, Chief Policy Analyst, Chesapeake Climate Action Center;
3. Lynn Heller, Baltimore Commission on Sustainability and Vice-President, Abell Foundation;
4. Larissa Johnson, University of Maryland Center for Environmental Science;
5. Pranay Kohli, Amidus;
6. Kathy Magruder, Executive Director, Maryland Clean Energy Center;
7. Ed Maibach, Director, Center for Climate Change Communication, George Mason University;
8. Alison Shea, Siemens;
9. Joe Uehlein, Labor Network for Sustainability.
Abby Hopper, who was Energy Advisor to the Governor of Maryland and Director, Maryland Energy Administration (MEA), was also a member of the Advisory Board until the end of 2014. Her appointment as Director of the United States Interior Department’s Bureau of Ocean Energy Manage-ment has meant that she is unable to continue in that capacity. The Project beneited enormously from her advice and participation.

4
Preface
Many other people have provided us with valuable guidance and advice. Since the publication of our energy justice report, we have also been delighted that some recommendations have been taken up as causes by other groups and individuals. Rebecca Ruggles, Director of the Maryland Environ-mental Health Network, has become an enthusiastic ambassador for Renewable Maryland Project’s work, promoting it at every opportunity. Tifany Hartung, Senior Coordinator of the Maryland Climate Coalition, introduced IEER to Energy Advocates leaders, including Mary Ellen Vanni. IEER has be-come a member of that group, which has revived its advocacy of the Afordable Energy Program that began several years ago. We are grateful to David Costello, former Acting Director of the Maryland Department of Environment and now an independent consultant, for his support and advice over the years, as also to Paula Carmody, Director of Maryland’s Oice of People’s Counsel (OPC), and Kevin Lucas, formerly of the Maryland Energy Administration, who have done the same. He also provided a detailed review of the inal draft.
The list of people who have provided help and advice in the course of this work is long. It in-cludes Cheryl Casciani, Chair of Baltimore’s Commission on Sustainability, Crissy Godfrey, Director, Energy Analysis & Planning Division of the Public Service Commission, Alice Kennedy, Sustainabil-ity Coordinator, Baltimore Oice of Sustainability, and Kristin Baja, Climate and Resilience Planner, Baltimore Oice of Sustainability, Roger Colton, a consultant on low-income energy issues, Seema Iyer of the University of Baltimore, Bill Ariano and his staf at the Maryland Department of Housing and Community Development, Myriam Tourneux, of the Fuel Fund of Maryland, and Cynthia Riely, Senior Consumer Liaison, Oice of People’s Counsel. We want to thank Dan Engelberg and the Cen-ter for Smart Growth of the University of Maryland for sharing their estimate of the average miles per gallon for personal cars and light trucks for the year 2030. We also deeply appreciate that Maryland State Delegate Dana Stein (who is also Executive Director of Civic Works) has taken up the issue of universal solar access for low-income households not only in Maryland but also circulated the idea to elected representatives from other parts of the country.
We worked with Tim Judson, Executive Director of the Nuclear Information and Resource Center, to produce a draft a paper on principles for the grid-of-the-future, and, with a Steering Com-mittee that included him, to organize a conference on that topic. The other members of the Steering Committee were David O’ Leary (Maryland Sierra Club), Corey Ramsden (Maryland Sun, who also provided comments on the Grid-of-the-Future chapter), Anya Schoolman (Community Power Net-work), and Jill Tauber (Earth Justice). We learned a great deal from the conference; some of the work that went to the paper that one of us (Arjun) drafted with Tim Judson is relected in the Grid-of-the-Future chapter. We owe him a special vote of thanks for that collaboration.
I have been a member of the Mitigation Working Group of the Maryland Commission on Cli-mate Change since 2015. The discussions during the meetings and the literature provided has been very helpful and provided useful insights into the development of Maryland’s oicial GHG emissions reduction plans. We are grateful to the Working Group members, including the staf of the Maryland Department of Environment, for the opportunity to learn a great deal and provide input that we hope is helpful.
A most special vote of thanks is due to the Town Creek Foundation, which has funded the Re-newable Maryland Project in its entirety since its inception. It has been a special privilege that Stuart Clarke has shared his keen insights with us from the start, and has been central to the stakeholder out-reach that has been part of our work since the beginning of the project. We also want to thank Megan Milliken on the Foundation’s staf – she has lawlessly organized several stakeholder meetings in the last two years and has participated in them.

5
Prosperous, Renewable Maryland
Christina Mills had been a staf person at IEER since before the start of the Renewable Mary-land Project until January 2016 and subsequently served as a consultant to IEER. Christina anchored the development of a very complex spreadsheet, including an hour-by-hour model of the Maryland electricity sector, under my technical direction. She also drafted the core of the Methodology at-tachment and did most of the graphics. She also reviewed this report and provided comments. I am deeply grateful to her for the expertise with numbers and spreadsheet design that she brought to the work. Annie Makhijani, Project Scientist, IEER, did much of the work putting together the underlying Maryland and national energy and transportation data that was essential in this analysis. Lois Chalm-ers, IEER’s Librarian, provided bibliographic assistance, fact checked and proofread the report, and carefully compiled the reference list. She is always due many thanks for her painstaking eforts in these critical areas. As usual, I alone, as the report’s author, am responsible for any errors, omissions, and problems that remain in this report and more generally for the analysis and recommendations in it.
Arjun Makhijani
November 2016

6
Executive Summary
Executive Summary5
1. The Problem: climate disruption, pollution, energy inequity
Maryland’s energy system, like that of the United States, is the primary contributor of green-house gas (GHG) emissions, accounting for about 90 percent of the total in 2011. These emissions are mainly in the form of carbon dioxide (CO
2) from fossil fuel burning for electricity, transportation, or
other energy needs. The current, centralized electricity system is reliable for the most part, but too vul-nerable to disruption, sometimes prolonged, due to extreme weather events, causing serious economic and social harm. It is inlexible, rather than resilient.
Fossil fuel burning is also a primary contributor to air pollution and associated ill-health. Ther-mal electricity generation in the region uses vast quantities of water – accounting for about three-fourths of the consumption in the Susquehanna River Basin. Mining for fossil fuels often causes devastating ecological impacts. New measurement-based research shows that unvented natural gas kitchen stoves frequently cause elevated levels of carbon monoxide and nitrogen oxides.
Climate change from continued emissions of CO2 is now judged so serious a prospect that even
the world’s poorest countries joined the wealthiest and agreed in Paris in December 2015 to reduce their emissions, though they have contributed little to the problem. The new goal in the Paris Agree-ment is to limit global temperature rise “to well below 2°C above pre-industrial levels and to pursue eforts to limit the temperature increase to 1.5°C above pre-industrial levels….”6 But the GHG concen-tration estimate of 430 parts per million (CO
2-equivalent), for keeping the limit to 1.5°C, was reached
in 2011.7 It is therefore imperative to eliminate emissions from fossil fuels as soon as practicable and to do so in a manner that is consistent with a healthy economy and equity.
2. The Social and Economic Impact
Jobs, comfort, health, and economic well-being in Maryland, like the rest of the country, are based on a reliable supply of the services that energy provides – heating, cooling, lighting, transporta-tion, and the motive power for industry. But the negative impacts are serious, and, as is often noted, in large part are not internalized in the cost of energy. In 2014, the Intergovernmental Panel on Climate Change (IPCC) estimated that “[w]ithout additional mitigation eforts beyond those in place today, and even with adaptation, warming by the end of the 21st century will lead to high to very high risk of severe, widespread and irreversible impacts globally.”8 The efects include loss of coastal cities, island communities, such as those in the Chesapeake Bay, increased disease, food system insecurity, and highly adverse economic impacts.9
5 Only direct quotes are cited here other than for the 2011 CO2-equivalent estimate. Citations for other facts are in the vari-
ous chapters.6 Paris Agreement 2015, Article 27 IPCC5 Synthesis 2014, p. 20, fn 15, and p. 21 (in the Summary for Policymakers) 8 IPCC5 Synthesis 2014, p. 17 9 IPCC5 Synthesis 2014, pp. 18-19, and Stern Review 2006, Executive Summary, Figure 2 (p. v) and following pages

7
Prosperous, Renewable Maryland
Energy costs are reasonable on average – about 7 percent of the State’s gross domestic product was spent on energy in 2011 – about half of that on transportation fuel. But the individual costs can be much less reasonable. Tens of thousands of low-income households cannot aford their heating and electricity bills and energy burdens often run to 10 percent 20 percent; they can reach 40 percent of income for the poorest families. Low-income households routinely face impossible choices between paying for heat, medicine, and housing. Many become homeless. The centralized energy system also limits consumer choices and lexibility in meeting their own energy needs, especially for low-income families. Further, as extremes of weather worsen, the electricity system becomes more vulnerable to disruption, sometimes prolonged.
3. Approach to the problemThe present energy system is ineicient in multiple, interacting ways:
• Fossil fuel and nuclear thermal power plants are the primary means of electricity generation. Energy losses in generation are typically about two-thirds of the primary energy input into the power plant, discharged as heat into condenser water; in addition several percent of the elec-tricity is lost in the transmission and distribution system. The overall eiciency of the system – from the fuel going in to the electricity in your home – is about 31 percent.
• A great deal of electricity is wasted in ineicient appliances, lights, and HVAC systems, com-pounding the ineiciency of the electricity system.
• Existing buildings are leaky, leading to further waste; even new buildings are ineicient com-pared to available economical methods of construction, such as passive house standards.
• Liquid-fueled vehicles are very ineicient. For instance, only about one-ifth of the energy in gasoline winds up as mechanical power at the wheels. Using vast amounts of land (30 million acres in 2016) to grow corn for making ethanol for vehicles aggravates the low eiciency.
• Fossil fuel space and water heating systems are much less eicient than the best heat pumps powered by solar or wind energy.
Solar and wind electricity production use no water and do not have the large losses associated with the steam cycle in thermal plants. Electric cars convert 80 percent or more of the electricity in the battery to power at the wheels, waste no energy at stop lights, and recover much of the energy that is otherwise lost in braking.
Based on present or near-future technology, an energy system that greatly reduces CO2 emis-
sions must be powered by electricity and that electricity should have low to zero emissions. Moreover, the technical potential for solar and wind energy in Maryland (and in the PJM grid region, of which Maryland is a part) is far greater than any conceivable need; this makes it possible, in principle, to have a zero emissions electricity system. That can be converted to reality because utility-scale solar and wind electricity generation is already more economical than coal and nuclear generation and on a par with, or cheaper than, natural gas generation. As this report shows, advances in energy storage and in electricity-system-related communications technology will make it possible to have a reliable and resilient zero-emissions electricity system by 2050 that is more economical than business-as-usual and that is based almost entirely on variable wind and solar resources.
Hourly modeling of loads, including electric vehicles, solar and wind generation, storage, de-mand response, and lexible peaking generation (fueled by renewable hydrogen) shows that baseload coal or nuclear power plants are not needed. Indeed, the inlexibility and slow response times of these

8
Executive Summary
plants to changing grid conditions is likely to be a hindrance to economical and smooth operation of an electricity system when solar and wind become the dominant sources of energy.
Finally, it is essential to note that the present statutory deinition of renewable energy in Mary-land includes a variety of carbon-emitting sources. In fact, carbon emissions from Maryland’s “Tier 1” renewable energy sources in 2014 per unit of electricity generation were greater than the average from all sources (mainly coal, natural gas, and nuclear). Our approach to an emissions-free electricity system assumes that Maryland will clean up its current deinition of renewable energy to include only zero-emission sources that conform to the deinition of the term “renewable energy” in the ifth assess-ment of the Intergovernmental Panel on Climate Change (IPCC5):
Any form of energy from solar, geophysical, or biological sources that is replenished by natural processes at a rate that equals or exceeds its rate of use.10
4. The Solution Part I: Renewable energy and eiciency Taken together, eiciency, renewable energy, storage, and a smart grid will enable Maryland to
transition to an essentially emissions-free energy system and save money in the process. The combina-tion of energy eiciency and the electricity in place of direct fossil fuel use in buildings and transpor-tation will greatly reduce primary energy use even as the economy grows. Figure ES-1 shows Mary-land’s primary energy use in 2011 and in the 2050 business-as-usual scenario and the 2050 Climate Protection Scenario, developed by IEER and discussed in detail in this report. The electricity system in the Climate Protection Scenario has zero emissions; there are some emissions from small residual direct uses of fossil fuels (for instance in aircraft, boats, and some HVAC systems) and industrial uses, as for instance in cement production. These residual emissions can be mostly or completely eliminated with foreseeable advances in technology and investments in converting HVAC systems to electricity beyond those envisioned in the Climate Protection Scenario.
Figure ES-1: Maryland’s primary energy input, in 2011, and in the 2050 business-as-usual
scenario and the 2050 Climate Protection Scenario. Source: IEER
10 IPCC5 Mitigation 2014, p. 1261, italics added
9
Prosperous, Renewable Maryland
Total energy sector GHG emissions would decline by over 90 percent relative to 2006. The economic growth assumption for the Climate Protection Scenario and the business-as-usual scenario are the same – an approximate doubling of the economy by 2050 in real terms.
The percentage of primary energy used in the Climate Protection Scenario is estimated to be less than half of that in 2011 even though the Maryland economy would be more than twice as large, as measured by the Gross State Product. The energy use in the business-as-usual case would not be much larger than in 2011 because we have assumed that present federal eiciency standards for vehicles and appliances and State standards for buildings will be implemented.
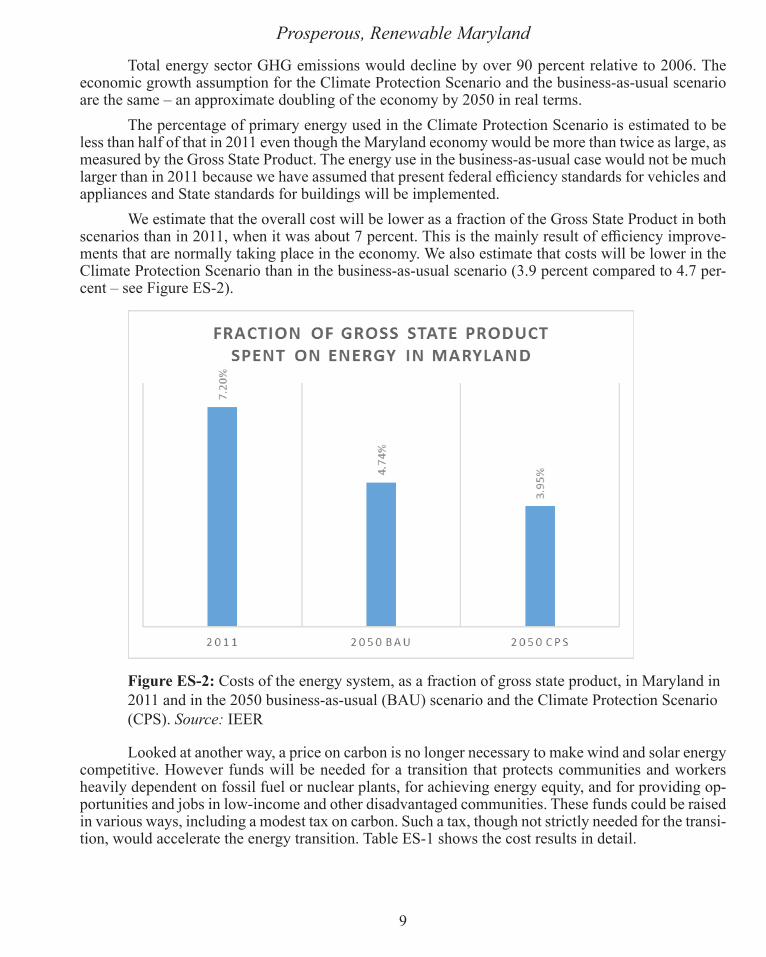
We estimate that the overall cost will be lower as a fraction of the Gross State Product in both scenarios than in 2011, when it was about 7 percent. This is the mainly result of eiciency improve-ments that are normally taking place in the economy. We also estimate that costs will be lower in the Climate Protection Scenario than in the business-as-usual scenario (3.9 percent compared to 4.7 per-cent – see Figure ES-2).
Figure ES-2: Costs of the energy system, as a fraction of gross state product, in Maryland in 2011 and in the 2050 business-as-usual (BAU) scenario and the Climate Protection Scenario (CPS). Source: IEER
Looked at another way, a price on carbon is no longer necessary to make wind and solar energy competitive. However funds will be needed for a transition that protects communities and workers heavily dependent on fossil fuel or nuclear plants, for achieving energy equity, and for providing op-portunities and jobs in low-income and other disadvantaged communities. These funds could be raised in various ways, including a modest tax on carbon. Such a tax, though not strictly needed for the transi-tion, would accelerate the energy transition. Table ES-1 shows the cost results in detail.

10
Executive Summary
Table ES-1: Energy system costs, for 2011, Business-as-Usual Scenario 2050, and Climate Protec-
tion Scenario 2050, millions of 2011 dollars per year (rounded to nearest $100 million)
2011
2050
Business-as-
Usual
2050
Climate
Protection
Scenario
Electricity generation (all uses, including transporta-
tion), T&D, storage, and smart grid (Note 1) $8,300 $15,000 $15,400
Energy eiciency and demand response relative to BAU (includes HVAC conversions from fossil fuels
to electricity) (Note 2) $0 $0 $7,100
RCI direct fuel use (includes industrial H2 in Cli-
mate Protection Scenario) (Note 3) $3,200 $5,400 $1,400
Transportation direct fuel use and electric transport
infrastructure (for CPS) (Note 4) $11,800 $12,800 $2,800
Road maintenance revenue to replace BAU trans-
portation fuel taxes (Note 5) $0 $0 $500
Afordable Energy Program and Community and Worker Protection Fund (Note 6) $0 $0 $400
Total $23,300 $33,200 $27,700
Source: IEER. For detailed notes to this table see Table IX-1.
Table ES-2 shows the costs of energy in the overall context of the Maryland economy. It is essential to note that the estimated cost of the Climate Protection Scenario includes $400 million per year for community and worker protection, creating jobs in low-income communities, and for making household energy afordable for low-income households.
Table ES-2: Comparison of energy systems costs and Maryland’s Gross State Product (GSP), in
2011 and in the 2050 business-as-usual scenario and the Climate Protection Scenario, in millions of
2011 dollars, rounded to the nearest $100 million
2011
2050
Business-
as-Usual
2050
Climate
Protection
Scenario
Maryland GSP, constant 2011 million $ (Note 1) $323,100 $699,500 $699,500
Total annual energy system costs, constant 2011 million
$ (Note 2) $23,300 $33,200 $27,700
Fraction of Gross State Product spent on energy 7.20% 4.74% 3.95%
Total primary energy use, trillion Btu (Note 3) 1,418 1,570 551
Economic eiciency of energy use, GSP $/million Btu $228 $446 $1,270
Energy expenditures as fraction of 2050 BAU 70% 100% 83%
Source: IEER. For detailed notes to this table see Table IX-2.

11
Prosperous, Renewable Maryland
Economic eiciency of energy use, usually termed “energy productivity,” can be deined as the amount of economic output per million Btu of primary energy input. This is shown in Figure ES-3, which compares economic eiciency of energy use in 2011, the 2050 business-as-usual scenario, and the Climate Protection Scenario, calculated in constant 2011 million dollars. Economic eiciency is about six times greater in the Climate Protection Scenario compared to 2011 and about three times greater than the 2050 business-as-usual scenario. The business-as-usual scenario is much more ef-icient than the 2011 economy because of the appliance standards, vehicle eiciency standards, and other eiciency improvements that have become a normal part of the U.S. economy in recent decades (in particular since the energy crisis of 1973).
Figure ES-3: Primary energy use and economic eiciency of energy use (dollars output per million Btu) in 2011, 2050 business-as-usual scenario, and 2050 Climate Protection Scenario. Source: IEER
The average household energy bill, excluding transportation, in 2011 was 2.7 percent of the average income of about $81,100 per year.11 Gross State Product would slightly more than double (assuming a growth rate of 2 percent per year), yielding a household income of about $175,000 per year. On this basis, the annual residential energy cost in the business-as-usual scenario would be about $3,300 per year; it would be about $2,300 per year in the Climate Protection Scenario.
Transportation energy costs would also be reduced – from about $3,000 per year in the busi-ness-as-usual scenario, taking into account lower fuel use due to federal eiciency (CAFE) standards, to about $2,200 per year in the Climate Protection Scenario. The latter igure includes the cost of elec-tric transportation infrastructure and the corresponding distribution system upgrades.
To meet the long-term (year 2050) carbon reduction goal, Maryland must transition to a fully renewable and eicient electricity sector while utilizing electriication to replace the vast majority of the direct use of fossil fuels in the transportation and buildings sectors. To reach that critical long-term goal, it is essential to set an intermediate goal for 2030 that will ensure the robust achievement of a 40
11 Note this is average income, which is considerably higher than median income.

12
Executive Summary
percent reduction in GHG emissions by 2030 as required by Maryland’s 2016 Greenhouse Gas Emis-sions Reduction Act. This means that the 40 percent goal should be achieved even if the Calvert Clifs nuclear plant is shut prematurely (as several nuclear plants around the country have done), if electric vehicles are slower to arrive on the market than indicated by current trends and assessments, or if elec-tricity eiciency improvements fall short of the 2 percent per year target. Our approach to reducing GHG emissions and increasing eiciency would ensure such a robust outcome. The most important policy element that is needed is a deinition of renewable energy that conforms with the IPCC5 dei-nition. In case biomass is used, a complete and careful accounting will be essential to ensure that the replacement of biomass carbon occurs at the same or greater rate than its use (including any changes in the soil content of carbon) in the same year of its use.
The most important short- and medium-term policies needed to achieve the transition to an economical renewable energy system are:
• Set renewable portfolio standards of 55 percent for 2030 and 100 percent for 2050 for the electricity sector, with intermediate target values as appropriate.12
• Deine renewable energy strictly to conform to the deinition of the most recent as-sessment of the Intergovernmental Panel on Climate Change (IPCC5), with additional speciic restrictions on biomass (in case it is used) to ensure that its use is renewable.
• Convert direct fossil fuel use in buildings to eicient electric systems and set stringent standards for new buildings.
• Build infrastructure for electric transport, including in areas with low-income resi-dents, and make electric vehicles the default transportation option for State purchases.
• Improve eiciency of electricity use for existing uses by 2 percent per year.
5. The Solution Part II: Resilience and energy democracy in the grid-of-the-future
Building a resilient electricity system will require a number of new elements; the most im-portant technical elements include far greater reliance on distributed energy resources (generation, demand response, storage). Some of the distributed energy resources will be in microgrids, which consist of combinations of generation, storage, and demand response elements. During grid outages, a microgrid automatically islands itself and continues to supply essential loads within the microgrid area.
The technical, institutional, and economic architecture of the grid will need to be very difer-ent from the centralized grid of today in which utilities and merchant generating companies are the suppliers and the rest are consumers. Revenues currently depend primarily on the amount of electric-ity sold. In the grid-of-the-future, millions of consumers will choose to be producers (a new term has been coined for them, “prosumers”). Equitable access on fair terms, consistent with reliability, will be essential – independent of the size of the prosumer. The overall concept for structuring the grid-of-the-future should be “grid neutrality” which consists of: 13
Tenet I: Empower the consumer while maintaining universal access to safe, reliable electricity at reasonable cost.
Tenet II: Demarcate and protect the “commons.”
12 Strictly speaking it is a 98 percent RPS plus about 2 percent hydroelectricity from the power plant at the existing
Conowingo dam. This hydropower can be replaced by wind and solar, if necessary, for a 100 percent RPS.13 Hu et al. 2015, quoting major points

13
Prosperous, Renewable Maryland
Tenet III: Align risks and rewards across the industry…Safeguard the public interest by containing the risks undertaken by private parties to those participants.
Tenet IV: Create a transparent, level playing ield. Promote and protect open standards, data access and transparency to encourage sustainable innovation on the grid. Prevent any single party -- public or private -- from abusing its inluence. Tenet V: Foster open access to the grid. Allow all parties who meet system-wide stan-dards the opportunity to add value to the grid. Apply all standards evenly and prevent any non-merit-based discrimination.
It is likely that real-time rates for a variety of services, including electricity supply, capacity, voltage and frequency regulation, demand response of various types, and interruptible service will be needed to reliably and economically operate the grid-of-the-future. Two-way communication between consumers, prosumers, various intermediaries, large-scale producers, regulators, and grid operators will be needed and should be embedded in the electric power system.
Open, equitable, and fair access is essential to a democratization of the grid. But it will not be enough. Complementary policies will also be needed to ensure equity. For instance, low-income households will need Internet access and smart appliances in order to beneit from demand response oferings in the grid-of-the-future. Their bills and energy burdens may rise without that. How will such equity issues be addressed for low-income renters or for households that cannot aford to replace appli-ances when they become obsolete? Equity would be promoted by community solar installations with equitable pricing policies will be important to ensure that households and businesses that cannot install rooftop solar (or other “behind-the-meter” solar, such as parking lot solar canopies) can still beneit from the value that solar energy provides.
The Climate Protection Scenario has signiicant resources that are devoted to increasing the resiliency of the electricity grid. They include distributed solar electricity generation, battery storage, combined heat and power (CHP), local hydrogen storage (at distributed production sites), smart grid investments, and extensive demand response capability. That said, we stress that this report does not contain an actual design of a resilient system. Such a design requires detailed consideration of essen-tial loads and their geographic locations on a neighborhood-by-neighborhood basis as well as by the function of the facilities. In addition, more than one category of essential load may need to be con-sidered. For instance, there are “critical” loads, which must be powered, and “priority” loads, which would receive power at high priority once critical loads have been met.14 The design of microgrids requires the input of a variety of stakeholders.
The considerations in this report are more aggregated; they are suicient for the purposes to show that signiicant provision for resilience can be made within the context of an emissions-free electricity system and the grid, therefore, made more reliable and functional even in the context of changing climate. And we will see, when we consider costs, that the costs of energy services in the Climate Protection Scenario are lower than those in the business-as-usual scenario, even though there is no speciic provision for resiliency in the latter. Finally, technology is changing very rapidly; this implies that the design of microgrids and the extent of their use will also evolve. For instance, a new solar panel scheduled to be on the market in 2017, combines a solar panel with an inverter, battery, and smart communications technology in a single panel called “SolPad.”15
14 Jensen et al. 2015, p. 1915 See SolPad 2016.

14
Executive Summary
6. Energy equity and democracy
Energy burdens for low-income households are already high – 10, 15, or 20 percent of income -- even more for very low income households. Relief is already an urgent need. Without explicit pro-tections, a transition to the grid-of-the-future could exacerbate energy inequities. For instance, real-time rates without real-time information, and without the automated operation of smart appliances to take advantage of the most economical times to run them, could result in low-income households having disproportionately high bills compared to typical households. Many low-income renters would be unlikely to become prosumers because of lack of capital or inadequate credit; they would therefore be unable to avail themselves of the opportunities for income and lower bills ofered by the grid-of-the-future. Equity requires action in two broad areas:
• Ensuring that energy bills are afordable (that is, preventing harm);• Opening up opportunities for low-income households in the grid-of-the future.
i. Afordable energyAfordable energy bills can be guaranteed if the Afordable Energy Program (AEP – also
known as a percentage of income payment plan) is adopted. The AEP, evaluated and recommended by the Public Service Commission Staf in 2012, limited electricity and heating bills to 6 percent of gross income as a central feature.16 Enacting the AEP now would provide many beneits both to low-income families as well as to taxpayers in the form of avoided costs of providing shelter and added medical care to families made homeless by unafordable energy bills. We have examined the issues at length in the Energy Justice report of the Renewable Maryland Project; we summarize the main recommenda-tions here:
• Put in place the Afordable Energy Program to limit energy expenditures to 6 percent of gross income;
• Provide universal solar access to low-income households through government or util-ity procurement of solar energy under the supervision of the PSC;
• Weatherize low-income homes and improve appliance eiciency; • Provide incentives and disincentives to landlords to ensure compliance with rental
property regulations.
Our evaluation showed that, besides the beneits to low-income Marylanders themselves, large non-energy beneits would low to ratepayers and taxpayers generally from AEP implementation, for instance, in the form of reduced emergency medical care expenses.
ii. Energy opportunities
Producing solar energy on the rooftop of one’s property, owning part of a community solar system, or trading renewable energy within a microgrid are among the currently feasible opportunities in the grid-of-the-future. Energy storage and supply of voltage and frequency support to the grid are now practically open only to large prosumers. These and other aspects of energy technology will be-come available at all scales in the coming years. Low-income households will need equitable access in both the economic and technical space to avail themselves of such economic opportunities. Broadband
16 The proposal has complex provisions regarding emergencies, arrears in bills, etc. Please see Energy Justice in Mary-
land’s Residential and Renewable Energy Sectors (Makhijani, Mills, and Makhijani 2015, Chapter V), for discussion and
references to the relevant PSC documents. This section is based on that report, unless otherwise speciied.

15
Prosperous, Renewable Maryland
access suicient to participate in and beneit from the grid-of-the-future will be essential. Providing access at reduced rates could have large collateral beneits in terms of increased spending power via reduced energy bills, and, perhaps more importantly, new educational and employment opportunities. Broadband access is already a signiicant equity issue in its own right. It will become more important in the grid-of-the-future.
It will also be important to maintain net metering – including virtual net metering – for behind-the-meter as well as community solar systems. Some have argued that sales of electricity to the utility by retail customers should be compensated at wholesale, rather than retail, generation rates.17 This not only grossly undervalues solar energy, but also shuts out low-income households from securing beneits of net metering in the future that have so far accrued mainly to middle- and upper-income households. The direct cost of net metering to non-solar consumers is low and the beneits are high, especially in Maryland where solar generation remains a small fraction of the total. Our recommenda-tions on energy opportunities in the context of equity, taking into account the speciic values of solar energy, equity, and Maryland’s situation are to
• Maintain net metering for behind-the-meter solar systems and extend it to community solar systems until a full and fair grid-of-the-future proceeding results in grid neutral-ity and equity rules that are appropriate to the energy transformation we need;
• Ensure afordable broadband access to low-income households at least suicient to beneit from grid-of-the-future opportunities;
• Ensure that low-income households, including rental units, have features like smart appliances and broadband connections to beneit from rate structures as they evolve. Maryland’s livability housing code will likely need to be updated to relect these requirements.
iii. Energy democracy
Democracy is basically about control, accountability, and transparency. By extension, energy democracy in the electricity sector is also about the process by which decisions are made. That process must transparent, accessible, and fair to all parties, including low-income households. Until recently, the controlling factors were limited to the extent of energy use and afordability of the bills. Even in that arena, much of the consumption relates to the nature of the building, the eiciency of the appli-ances, the type of HVAC systems, and the eiciency of the building structure. These are normally not under the control of renters. Homeowners replace appliances over time and can (and do) choose higher eiciency devices. Even in this arena, low-income homeowners are at a disadvantage when the more eicient devices have lower life-cycle cost, but signiicantly higher irst cost. Further, it is more complex and costly to retroit existing structures to make them more eicient than to build them well in the irst place. That control belongs to builders, who not only lack systematic incentives or require-ments to build the most eicient houses, but who often focus on keeping the construction costs as low as possible, even at the expense of higher operating costs. It also belongs to governments at various levels, which can require stricter building codes.
It is now possible for people and businesses to become owners of electricity generation sys-tems, either directly on their own property or as part owners of community installations. But the speciic situation of low-income households makes it diicult for them to partake of the beneits of the ownership even in community systems. In this context the following principles should be critical
17 The CEO of Exelon, Chris Crane is a prominent and, for Maryland, very relevant example. See quote in Makhijani 2015, pp. 5-6 and associated discussion.

16
Executive Summary
elements of energy democracy and the grid-of-the-future. The irst four in the list below were spelled out by the Energy Democracy Alliance.18
• Racial and economic injustice and energy insecurity must be remedied “by targeting the ben-eits of state-funded energy eiciency and distributed renewable energy development to com-munities confronting those injustices.”
• The beneits of an eicient and renewable system must accrue to all Marylanders, “regardless of home-ownership status, location, race, wealth, or income”
• “All institutions that make decisions for the public around energy or energy market develop-ment should create mechanisms to ensure widespread and meaningful participation in demo-cratic decision-making, transparency, and public accountability.”
• Creation of good jobs and economic opportunities “for local people often left out of economic opportunities, including people of color, youth, women, formerly incarcerated individuals, refugees, immigrants, veterans, long-term unemployed and members of frontline climate-vul-nerable communities” is essential if the beneits of a distributed and eicient energy system are to be equitably enjoyed.
• A just transition for workers and communities that are heavily dependent on the current cen-tralized generation system is also essential for energy democracy. We address this issue in the next section (7.ii).
7. Jobs, communities, and the energy transition
i. Number of jobs
Overall, about 64,000 steady full-time-equivalent jobs would be created in the United States, most of them in Maryland, in creating and maintaining Maryland’s energy system of the Climate Pro-tection Scenario. The increment of jobs within the state over business-as-usual depends strongly on state policy. Moreover, if the State proceeds vigorously to a renewable, eicient, and resilient energy system, it could become a manufacturing center as well, with attendant positive implications for jobs. The quality of the jobs would be comparable to those in the utility and construction sectors today.
In addition, since the Climate Protection Scenario energy system would save money, additional jobs, called “induced jobs,” would be created when the money is spent or invested. Total direct, indi-rect, and induced steady jobs in the United States corresponding to Maryland’s energy requirements and the stimulus of the savings in the Climate Protection Scenario would be between 70,000 and 120,000 jobs (rounded to the nearest 10,000 jobs). Far more of these jobs would be in Maryland than in the present-day fossil fuel dominated energy system in which most investments occur outside the state. However, the speciic proportion of in-state jobs will depend on how much leadership Maryland establishes relative to other states in the mid-Atlantic and Northeast regions (see Section 7.iii, of this summary below).
ii. The Community and Worker Protection Fund
Maryland’s energy system, like that in the rest of the United States, depends mainly on fossil fuels. In Maryland’s case, almost none of the fossil fuel production is within the state. Nonetheless, a transition to a renewable energy system means that fossil fuel installations must be phased out. Typi-
18 The irst four bullet points are quoted or paraphrased from the principles enunciated by the New York State Energy De-
mocracy Alliance, at http://energydemocracyny.org/about. (Energy Democracy Alliance 2015)

17
Prosperous, Renewable Maryland
cally, when such change happens, workers become unemployed and communities lose tax and other revenues that support essential services, like ire departments and libraries. If the energy transition is to be just and equitable, it will be essential to create jobs and alternative revenue streams that protect communities now dependent on fossil fuels. That may also be needed in the case of Maryland’s only nuclear plant, whose federal license is due to expire in the mid-2030s.
We estimate that there are now about 2,000 direct jobs associated with coal and nuclear gen-erating plants where transition funds will be needed. This number is small compared to the jobs that will be created by the energy transition; however, there is no guarantee that workers in small, heavily impacted communities will get them in suicient numbers and quality. A well-managed transition will require funds for investing in communities where there are large blocks of vulnerable jobs – coal mines in Western Maryland, coal-ired power plants, and the nuclear plant at Calvert Clifs (should it be closed).
There is also no guarantee that the new jobs will be created in areas of high unemployment, in disadvantaged communities, and in areas where there are large proportions of low-income households. The creation of good jobs in low-income areas and communities will provide the basis for higher in-come and opportunity in the grid-of-the-future. Success in that endeavor would also reduce the need for energy assistance.
Revenues for the Community and Worker Protection Fund could be raised in various ways – taxes, a carbon fee, and, in the long-term, when fossil fuel use is low and renew-able energy use is high, possibly even a fee on renewable energy. We have included the cost of the Community and Worker Protection Fund as well as the Afordable Energy Program in the overall cost of energy in the Climate Protection Scenario.
Maryland is already part of the Regional Greenhouse Gas Initiative. Some of the funds from this initiative are used to assist low-income households. The expansion of this initiative may be a way to raise part of the needed funds. The cost of the Climate Protection Scenario includes $200 million per year for the Community and Worker Protection Fund and an equal amount to implement the Af-fordable Energy Program.19
Finally, global equity will also make demands on all people in wealthy countries, under com-mitments made in December 2015 in Paris. That agreement, which went into efect in early November 2016, made a commitment that developed countries would provide at least $100 billion per year in the year 2020 and thereafter to developing countries. The latter have contributed a relatively small amount to climate disruption; many stand to sufer dire consequences. The shares of diferent developed coun-tries have not been determined, but it is reasonable to assume, based on the size of its economy and cumulative past emissions that the U.S. share would be substantial. A 20 percent share would amount to $20 billion per year. It is unclear how the U.S. government plans to meet its obligations or even whether there would be actual taxpayer funds involved.
iii. Manufacturing jobs
Manufacturing jobs are being created in renewable energy in areas as varied as upstate New York and Texas. One key appears to be leadership in renewable energy in the form of irm and large commitments to increase its use. For instance, the city-owned public utility in San Antonio, Texas, leveraged a decision to build 400 megawatts of solar PV capacity to bring solar module manufacturing to the region. The rapidly increasing demand for solar energy creates the basis for such manufactur-ing in the United States. It is more likely to go to areas that make irm commitments to solar energy
19 The provision for the AEP is over and above the business-as-usual cost of energy assistance.

18
Executive Summary
and leverage those commitments into manufacturing jobs. Speciically, it will take tens of millions of solar panels to meet the requirements of the Climate Protection Scenario as envisioned in this report. A commitment to a 55 percent RPS by 2030 and a fully renewable electricity sector by 2050, with a large fraction coming from solar energy in both years, would go a long way to creating the leverage for solar panel and other solar component manufacturing. A cleaned up renewable energy deinition is essential in any case.
Similar arguments apply to jobs in other areas of an eicient, renewable energy future: am-bitious ofshore wind targets, a commitment to transition from fossil fuel to highly eicient electric HVAC systems, building a foundation of an equitable and resilient grid-of-the future with electricity storage, and a commitment to electric transportation, notably electric public transportation.
8. Environment and sustainability
A transition to a renewable energy system based on solar and wind energy would create huge collateral beneits in the form of better health, reduced air pollution, vastly reduced water use, and reduced water pollution. These beneits would be in addition to eliminating over 90 percent of the CO
2
emissions.20
For instance, solar and wind generation require essentially no water. Water withdrawals due to thermal electricity generation for Maryland’s use (in-state generation and net imports of electricity) amounted to roughly 2.4 trillion gallons in 2011. Those water withdrawals will no longer be needed. Evaporation due to thermal generation (for various states in the PJM region) is responsible for almost three-fourths of the water consumption in the Susquehanna River Basin and is a major element in wa-ter shortage for new uses. This water would be available for new uses throughout the region and for increased freshwater low into the Chesapeake Bay.
The vast majority of air pollution, including sulfur dioxide, nitrogen oxides, and unburned hy-drocarbons would also be eliminated, with the concomitant reduction of air-pollution-related diseases.
Of course, like all investments, those needed to implement the Climate Protection Scenario would have their own environmental impacts. Metals will still be needed, with attendant mining and processing impacts. Quartz is mined for solar panels; chemicals are used to reduce it to silicon for solar cells. A variety of materials is needed for batteries. The impacts can be minimized through ma-terials recovery, low-impact processing technologies, and eicient materials use, but there must be a concerted efort and suitable policies to reduce impacts.
Solar and wind energy require land; however, it is little recognized that the impact of the Cli-mate Protection Scenario would actually be much lower than that of the present energy system. The physical footprint of onshore wind in 2050 of the Climate Protection Scenario would be well under 10,000 acres (within Maryland and in other states); the visual impact would be much larger. Utility-scale solar involves a signiicant amount of land – about 85,000 acres in 2050 in the Climate Protection Scenario (whether in Maryland or elsewhere).
Yet the total amount of land needed is far less than Maryland’s share of the agricultural land needed to produce corn for ethanol, which provides only a small fraction of automotive fuel today. Marylanders use over 500,000 acres of agricultural land for corn ethanol for vehicles – though it is generally not within the state (see Attachment B). The cumulative land requirements for producing the fuels needed for the present fossil-fuel-dominated energy system over decades are comparable or
20 Some of the remaining 10 percent are associated with air travel and boats, while the rest is associated with residual use
of natural gas in buildings that are diicult to convert. It may be possible to eliminate the last ten percent but it is diicult to estimate the costs within the scope of this study.

19
Prosperous, Renewable Maryland
larger – and the land and associated ecosystems are often severely harmed in the process. Reduction in land requirements would be a signiicant net beneit of implementing the Climate Protection Scenario.
9. ObstaclesMaryland is part of the PJM grid system, which covers most of the mid-Atlantic region and ex-
tends westwards to Ohio and in a patchwork up to Chicago (but not most of the rest of Illinois). In this system the owners of the wires – the transmission and distribution system for electricity – are regu-lated, but most of the supply of electricity, mainly provided by large merchant generating companies, of which Exelon is the largest, is not regulated. In the future, the amount of electricity carried by the distribution part of the grid is likely to grow signiicantly, despite eiciency improvements, because of the electriication of the vast majority of transportation and the conversion of fossil fuel space and water heating to eicient electric systems. Thus, the wires-only utilities can expect to beneit from the transition along with many other parties.
The same may not apply to merchant generating companies. Centralized generating plants can be expected to reach the end of their useful lives between now and 2050. However, the temptation to use political and economic leverage to keep economically obsolete plants running is even now being displayed in New York and Illinois. This could hinder distributed renewable electricity development. The ownership of wires-only utilities by merchant generating companies creates a long-term conlict of interest. Such ownership is permitted in Maryland and has resulted in a single merchant generating company also owning wires-only utilities that supply the vast majority of customers in the State.
Maryland should consider requiring a divestment of wires-only companies by merchant companies supplying electricity to the State’s grid in case control of the distribution wires by merchant companies becomes a hindrance to a democratized, distributed elec-tricity system.
Investment in new fossil fuel infrastructure, such as in natural gas production in the State or in-terstate natural gas pipelines could retard the transition. Speciically, it could set the stage for prolonged use of those facilities to recover costs from consumers that would otherwise become stranded costs. Renewable energy, eiciency, HVAC technologies that are economical and can replace natural gas are available and can be implemented to avoid new large-scale investments in fossil fuel infrastructure.
New large-scale fossil fuel infrastructure, such as natural gas production by hydraulic fracturing in Maryland and associated infrastructure, should not be permitted because it would hinder a transition to an emissions-free energy system and likely make it more expensive in the long-term.
Maryland’s inclusion of a variety of carbon-emitting sources in its current deinition of Tier 1 renewable energy is a signiicant obstacle to achieving a low-emissions energy system by 2050 and may even compromise the achievement of a 40 percent reduction in GHG emissions by 2030 (depend-ing on the mix of Tier 1 resources available in the PJM region and their relative prices). Changing the deinition of renewable energy in the coming years to conform to the IPCC5 deinition and taking care-ful account of the net carbon content of biomass energy (including soil carbon changes) is essential, though it appears to be politically diicult at the time of this writing. It is possible that combining these changes with putting a Community and Worker Protection Fund into place may reduce that diiculty. In addition, as discussed in Section 7.ii above, a irm commitment to solar and ofshore wind would provide leverage for increasing jobs related to renewable energy and eiciency manufacturing.

20
Executive Summary
10. Getting to a 100 percent emissions-free energy system
The Climate Protection Scenario modeled in this report has a 100 percent renewable electricity sector. To get to a low emissions energy future, it is also important to consider direct use of fossil fuels. Most of that is addressed by the conversion of the vast majority of space and water heating to heat pumps and of petroleum vehicles to electric vehicles. We assume that there will be some continuing CO
2 emissions from aircraft, boats and other non-road transportation, from a small fraction of heating
systems that are assumed to continue to use fossil fuels, and from some remaining use of fossil fuels in industry. The overall result is about 91 percent reduction in CO
2 emissions by 2050 relative to 2006.
It is possible to approach a 100 percent emissions-free energy sector, except possibly in the case of aircraft emissions. Micro-CHP systems with fuel cells powered by renewable hydrogen, sea-sonal storage of heat and coldness, community geothermal heat pumps systems, use of evacuated tube (high-temperature) solar hot water heating for industrial process heat, replacement of coal with hydrogen in cement production, ships powered by renewable energy, and other technologies could help achieve that goal (see Chapter VII, Section 7). Maryland can establish leadership in this area by implementing pilot projects and assessing the applicability and cost of these technologies (see Chapter XII, Section 9).
11. Overall conclusions
The decline in the cost of renewable energy, continuing vast low-cost energy eiciency po-tential, fast developing grid-of-the-future technology, immense beneits of adopting an afordable en-ergy program for low-income households, and the possibilities for increasing resilience and democ-ratizing the energy sector present a unique opportunity to transform the energy sector and to create a nearly emissions-free energy system. The electricity system can be 100 percent renewable based almost entirely on solar and wind as primary energy sources, complemented in various ways by de-mand response, combined heat and power (CHP), renewable hydrogen, and battery storage. Baseload generation is not required. Indeed, inlexible baseload generation with slow ramping rates, such as present-day coal and nuclear generation, is likely to be a hindrance at high levels of wind and solar penetration. Indeed, inlexible “24/7” nuclear generation was noted as a “real problem” for grid man-agement in California by David Olsen, who is a member of the Board of Governors of the California Independent System Operator:
Having a 24/7 nuclear plant, from a grid operator’s standpoint — that is a real prob-lem. Dealing with 2,200 MW coming in at every minute — we have to design our grid around that inlexibility. ‘Baseload’ refers to an old paradigm that has to go away.21
The detailed assessment we have made indicates that a completely renewable electricity system and more than 90 percent reduction in energy-sector GHG emissions will save Maryland consumers between $1.8 billion and $7.8 billion a year (5 percent to 24 percent less) compared to a business-as-usual approach by the year 2050. These estimated savings in energy cost take into account the added cost of creating a Community and Worker Protection Fund and limiting low-income households’ en-ergy expenditures to 6 percent of gross income.It is important to recognize the features that make the Climate Protection Scenario more economical than business-as-usual.
21 As quoted in Wilder 2016. The California Independent System Operator covers the vast majority of California and a
small part of Nevada. The context of the remark was the plan for the closure of the Diablo Canyon nuclear plant in the
2020s.

21
Prosperous, Renewable Maryland
• Primary energy use is only about one-third that in the business-as-usual scenario. A principal reason is the elimination the very large thermal losses that characterize the present electricity system, which would continue in a business-as-usual scenario. There are losses in the renew-able electricity system but they are much smaller.
• The electricity is used much more eiciently because investments are made in that sector in preference to generation – appliances, building envelopes, HVAC systems, lighting….
• Electriication of road and much non-road transportation makes that entire sector much more eicient. Electric vehicles deliver 80 percent or more of the energy at the plug to the wheels of the vehicles, in contrast to petroleum-fueled vehicles where the corresponding number from pump to wheels is only about 20 percent.
• Eicient electriication of space and water heating, both of which reduce primary energy use when solar and wind are the main energy sources.
• Efectiveness of demand response in reducing the efect of variability in wind and solar energy; the need for storage is also thereby reduced.
• The capital investments in the two scenarios are broadly comparable in magnitude though in very diferent areas. But solar and wind energy require very little maintenance compared to thermal generation, reducing a major cost, and no fuel, which further reduces energy system cost.
There are also vast non-energy beneits that we have not attempted to quantify, though we have in-cluded the costs of the energy system elements in our calculations. The non-energy beneits include:
• Near-total elimination of energy-related air pollution and consequent reduction of air-pollution related diseases;
• Elimination of water use for electricity generation; the water thus made available could have enormous economic and ecological value;
• Increased grid resilience, which would reduce economic losses and medical emergencies caused by prolonged electricity outages.
• Reduction of inequities – the Afordable Energy Program alone, for which costs are included, could produce tens of millions of dollars of non-energy beneits just in the form of reduced homelessness and emergency medical costs. Better health and higher productivity at school and work are other beneits that we have not attempted to quantify.
• A signiicant reduction of land needed over the long term compared to the present system where mining for fuel required continued need for more land. In a solar and wind system, land requirements can be expected to decline as eiciency of solar panels and capacity factor of wind turbines improve.
• A great reduction of land requirements when liquid fuels are replaced by electricity for ve-hicles by the elimination of approximately 500,000 acres that Maryland uses in other states to supply the ethanol for its vehicles. We estimate land requirements for solar and wind in the Climate Protection Scenario to be less than 100,000 acres (either within Maryland or in other states or both).

22
I. Major aspects of the transition
1. Climate context – the 2oC limit
Maryland’s greenhouse gas reduction goals are set in the context of the global climate problem and the analysis of that problem by, among others, the Intergovernmental Panel on Climate Change (IPCC). Speciically, the 2009 Greenhouse Gas Emissions Reduction Act (GGRA) set its goals in light of the IPCC’s work up to that time. Those goals had two components. The irst was the adoption by the end of 2012 of “a inal plan that reduces statewide greenhouse gas emissions by 25% from 2006 levels by 2020.” The second was a longer term goal:22
The [2020] plan shall be developed as the initial state action in recognition of the ind-ing by the Intergovernmental Panel on Climate Change that developed countries will need to reduce greenhouse gas emissions by between 80% and 95% from 1990 levels by 2050.
Speciically, the goal for developed countries was set so that they could meet their part of the overall global goal of 41 to 72 percent relative to 2010 reduction in GHG emissions by 2050. This range of reductions would, according to the IPCC, make it “likely” that the global average temperature increase could be limited to 2oC below the 1850-1900 average.23 Keeping the global temperature rise to “below 2 degrees Celsius, on the basis of equity and in the context of sustainable development” was a primary goal in the agreement reached in 2009 by the parties to the United Nations Framework Convention on Climate Change (UNFCCC).24 The more stringent goals for developed countries, as a matter of equity, arise from the far larger contribution they have made to date to the buildup of green-house gas concentrations in the atmosphere.
The 2009 GGRA translated the range of 80 to 95 percent emission reductions below 1990 into a speciic 2050 goal using a 2006 baseline; speciically, it asked for the preparation of “a plan to meet a longer-term goal of reducing greenhouse gas emissions by up to 90% from 2006 levels by 2050 in a manner that promotes new ‘green’ jobs, and protects existing jobs and the State’s economic well-being.”25
Maryland is on track to meet its 2020 goal of a 25 percent reduction in emissions relative to 2006 due to actions it has taken towards that end as well as changes in the marketplace such as higher mileage standards for cars and increased use of natural gas in place of coal for electricity generation.26
22 Maryland GGRA 2009, Section 2-1205(C)(1) and (2)23 IPCC5 Mitigation 2014, Table SPM.1 (p. 13)24 UNFCCC 2009, p. 5. The United States is a party to the UNFCCC.25 Maryland GGRA 2009, Section 2-1201(4)26 MCCC 2015. The attribution of a reduction in greenhouse gas emissions due to natural gas displacing coal for electricity
generation depends in large measure on the way natural gas CO2-equivalent accounting is done and on the fact that out-of-
state natural gas leaks and emissions are not included in Maryland’s GHG accounting.

23
Prosperous, Renewable Maryland
Further, the Maryland Commission on Climate Change, in its December 2015 report, recommended that Maryland “adopt a goal and develop a plan to reduce Maryland’s GHG emissions 40 percent from 2006 levels by 2030” with caveats similar to those in the 2009 GGRA.27
The 40 percent GHG reduction goal corresponds approximately to a trajectory of 70 percent reduction in GHG emissions by 2050 relative to 2006.28 This is at the upper end of the range of re-ductions needed estimated by the IPCC to limit temperature rise to 2oC. However, it falls short of the maximum goal of 90 percent reduction relative to 2006 articulated in the 2009 GGRA.
According to the December 2015 report of the Maryland Commission on Climate Change, 43 percent reduction in GHG emissions by 2030 would be needed on a linear trajectory that would achieve 80 percent reduction by 2050.29 Using the same chart, we estimate that a reduction of 50 per-cent in GHG emissions by 2030 would be needed to be consistent with about 90 percent reduction by 2050 (relative to 2006).
A target of 40 percent reduction relative to 1990, by 2030, was set by Executive Order in Cali-fornia in April 2015; this was deemed consistent with a trajectory of limiting temperature rise to 2oC.30 For Maryland a 40 percent reduction relative to 1990 would be consistent with a little more than a 50 percent reduction below 2006 GHG emission levels by 2030.31
The calculations in this report were prepared with a trajectory of 50 percent reduction in GHG emissions by 2030 and 90 percent by 2050, both with a baseline of 2006. A caveat: we have focused only on the energy sector, which is responsible for more than 90 percent of Maryland’s greenhouse gas (GHG) emissions.32 The implicit assumption is that parallel reductions in the sectors, like agriculture and waste management and cement production, not considered here, will be made. If these reductions are less than 90 percent, then more stringent targets would need to be set in the energy sector.
These goals (50 percent reduction by 2030 and 90 percent by 2050) are consistent with the greater eforts by developing countries and the requirement of such eforts under the UNFCCC as well as with keeping the temperature rise to less than 2oC. However, they will not be suicient under the more stringent goals adopted by the twenty-irst Conference of the Parties (COP21) to the UNFCCC in Paris in December 2015.
2. The Paris AgreementThe December 2015 Paris Agreement on climate protection seeks to hold “the increase in the
global average temperature to well below 2°C above pre-industrial levels and to pursue eforts to limit
27 MCCC 2015, p. 2828 MCCC 2015, Appendix 1, pp. 8-9 (pdf pp. 38-39)29 MCCC 2015, Appendix 1, p. 9 (pdf p. 39) and Appendix 1, Figure 5 (p. 9 )30 California Executive Order B-30-15 (2015)31 We estimated this percentage by omitting the ozone depleting compounds from the 1990 GHG inventory for Maryland published by the Maryland Department of the Environment (Maryland GHG Inventory 2001. See Table 3 (p. 14)) and us-ing a global warming potential for methane of 21 (instead of the 11 used in the report). Both these adjustments are neces-sary to make the 1990 inventory compatible with the 2006 inventory, which does not include ozone depleting compounds and which uses a global warming potential of 21 for methane. (Maryland GHG Inventory 2011, p. 10)32 We will consider only emissions of greenhouse gases in the quantitative analysis in this report. Storage of carbon in trees and soil is not evaluated here, though it is part of Maryland’s greenhouse gas accounting. We will use the terms “emissions-free” energy system in this report to mean a reduction of energy-related GHG emissions by 90 percent or more relative to 2006, which is the baseline year in Maryland’s greenhouse gas law. (Maryland GGRA 2009)

24
I. Major aspects of the transition
the temperature increase to 1.5°C above pre-industrial levels, recognizing that this would signiicantly reduce the risks and impacts of climate change.”33
The change from the limit of 2oC limit agreed to in Copenhagen in 2009 to “well below 2oC” with an even more stringent limit of 1.5oC, was motivated by a number of factors, including assess-ments that the impact of 2oC could be much more dire than previously estimated.
In a 2016 journal article, which was published as a discussion paper in June 2015 (i.e., before the Paris negotiations), Hansen et al. argue, based on “paleoclimate data, climate modeling, and mod-ern observations” that that a 20- to 30-foot sea level rise is possible in 50 to 200 years. Their conclu-sion regarding a 2oC temperature rise is as follows:
We also observe changes occurring in the North Atlantic and Southern oceans, changes
that we can attribute to ongoing warming and ice melt, which imply that this human-
driven climate change seems poised to afect these most powerful overturning ocean circulation systems, systems that we know have had huge efects on the planetary envi-ronment in the past. We conclude that, in the common meaning of the word danger, 2oC
global warming is dangerous.34
The Hansen paper clearly indicated a need to set a limit more stringent than the 2oC agreed to in Copenhagen in 2009. A number of countries, notably island countries threatened by sea-level rise, came to the conclusion that even a limit below 1.5oC may be needed.35 A simulation of the impact of 2oC (and 4oC) temperature rise on Chinese cities shows the possible profound impact on millions of people just in coastal cities in China.36 Hundreds of millions of people would likely be afected by sea-level rise; more would experience more severe typhoons/hurricanes/cyclones. The term “well below” in the phrase “well below 2oC” was not deined in the Paris Agreement, but the text indicates that it means a limit between 1.5oC and 2oC.
Unfortunately, the time when a 1.5oC limit may have been achieved with relatively straight-forward action on energy, forests, and agriculture, has long since passed. It will take eforts across a broad front to approach that goal by the end of the 21st century. The IPCC, in its ifth assessment, did not even evaluate any emission-reduction scenarios that would achieve this goal with high probability.
IPCC5 estimated that actions that would make it likely that the temperature rise would be limited to less than 2°C would have a small chance (about 16 percent) of keeping the temperature rise to 1.5oC. 37 These are poor odds. The IPCC also noted, in its summary explicitly addressed to policy-makers, that “Only a limited number of studies have explored scenarios that are more likely than not to bring temperature change back to below 1.5°C by 2100 relative to pre-industrial levels; these scenarios bring atmospheric concentrations to below 430 ppm CO
2eq [parts per million car-
bon dioxide equivalent] by 2100.”38 The world was already at 430 ppm CO2eq in 2011;39 the value in
mid-2016 was about 450 ppm CO2eq.40 The evidence therefore indicates the need to remove already
33 Paris Agreement 2015, Article 2 (1) (p. 22). For comments, see Makhijani Paris Agreement blog 2015.34 Hansen et al. 2016, pp. 3800-3801; see also abstract. Italics added.35 Tschakert 2015 and Structured Expert Dialog 4 (2015) 36 Watkins 201537 Inferred by IEER from IPCC5 Mitigation 2014, Figure 6-13 (p. 439).38 IPCC5 Mitigation 2014 p. 16, italics in original. 39 IPCC5 Synthesis 2014, p. 20, fn 15, and p. 21 (in the Summary for Policymakers) 40 The level in mid-2016 was about 450 ppm CO2eq. It does not include GHGs, like CFC-11 and CFC-12, covered by the
Montreal Protocol to protect the ozone layer. The CO2eq level without the Montreal Protocol CFCs was estimated by IEER
from NOAA 2016, Table 2, by using the 2014 to 2015 growth rate and excluding Montreal Protocol ozone-depleting com-

25
Prosperous, Renewable Maryland
emitted GHG from the atmosphere. Methods such as improved agriculture to store carbon in the soil as a means of removing already emitted CO
2 from the atmosphere can be used.41
The IPCC5 report laid out a range of GHG emission reductions that were more as well as less stringent than its 2oC scenario, reproduced below in Figure I-1. The United Nations fourth “Struc-tured Expert Dialog” indicated that the most stringent reductions in this igure, the lower edge of the blue band, can be taken to correspond roughly to the requirements of keeping within the 1.5oC limit provided there was an even larger removal of already emitted CO
2 from the atmosphere (so-called
“negative emissions”).42 Figure I-1 (following page) indicates that in that scenario, global emissions of greenhouse gases would have to go to zero by about 2080; after that time, emissions would have to be negative – that is, already emitted GHGs would have to be removed from the atmosphere and destroyed or sequestered. Given the requirement of equity (see Chapter I, Section 1 above), the target date for achievement of zero GHG emissions in the United States and other Western countries must be well before 2080.
After charting a course for reducing energy-related emissions by about 90 percent relative to 2006 by 2050, this report will also briely address some of the initiatives that are needed for a path that would be consistent with a 1.5oC target.
3. Technical aspectsThere are four broad areas in the Maryland energy sector that must be analyzed to create a
technical and economic roadmap to 90-plus percent reductions in energy-related emissions by 2050:
• Decarbonizing the electricity sector, where coal and natural gas are the main sources of CO2
emissions. Contingency provisions are also needed to maintain the CO2 reduction trajectory in
case nuclear power plants are shut down before 2050.
• Decarbonizing the direct use of fossil fuels in buildings. This mainly relates to the use of natu-ral gas, fuel oil, and propane for space and water heating, and of natural gas for a variety of other purposes, notably cooking.
• Decarbonizing on-road and non-road transportation. Petroleum fuels predominate in this sec-tor. Aircraft fuel use is a particularly diicult area.
• Decarbonizing direct use of fossil fuels in industry. Fossil fuels are used in a large variety of ways in industry, including for steam and hydrogen production. We include the use of fossil fu-els in agriculture for purposes such as crop drying in this category. Cement manufacture, which has emissions both due to fossil fuel (usually coal) use and due to conversion of limestone to calcium oxide (also known as “lime”) is a diicult area, but very important in Maryland and globally.
Renewable energy technology, and notably solar photovoltaic technology, has developed very rapidly in the last few years. Solar joins eiciency and wind, to make a trio that can enable a transition
pounds to make it comparable to the IPCC5 CO2eq estimate. The reason that temperature rise is not yet 1.5oC above late
19th century levels though the GHG level would suggest that is that there is a lag between greenhouse gas accumulations and global temperature rise. This is akin to the lag between the lame under a pot (greenhouse gas concentrations) and the water in the pot boiling. Of course, since GHG concentrations are changing, there is never a true equilibrium; rather the temperature rise generally lags the equilibrium value indicated by a speciic GHG concentration level. 41 Hansen et al. 2008 concluded that the combination of eliminating emissions and storing of carbon in soil and forests should initially target a level of 350 ppm for CO
2 concentration in the atmosphere, “with the target to be adjusted as scien-
tiic understanding and empirical evidence of climate efects accumulate.” (p. 229)42 Structured Expert Dialog 4 (2015), p. 14, paragraph 64, and Figure 15 (p. 15)

26
I. Major aspects of the transition
Fig
ure
I-1
: IP
CC
5 s
cenar
ios
for
GH
G e
mis
sions.
The
RC
P2.6
sce
nar
io s
et c
orr
espon
ds
appro
xim
atel
y t
o l
imit
ing t
em-
per
ature
ris
e to
2oC
. T
he
low
er l
ine
in t
he
light
blu
e ban
d c
orr
espond
s ro
ughly
to a
1.5
oC
tar
get
. S
ourc
e: I
PC
C5 M
itig
atio
n
20
14
, F
igure
SP
M.4
, upper
pan
el (
p.
11)

27
Prosperous, Renewable Maryland
to a zero emissions electricity sector at a cost below that of fossil fuel, notably coal, and new nuclear generation. The ongoing technical and cost breakthroughs in storage, smart grid, smart appliances, electric vehicles (on-road and non-road), advanced heat pumps, and communications technologies make a transition from direct fossil fuel use in buildings and transportation to renewable electricity possible as well. The overall cost, as estimated in this report, would be lower than that of a business-as-usual approach. This comparative statement is quite apart from the immense climate-related eco-nomic, health, and ecological costs that loom in the absence of strong action to reduce greenhouse gas emissions.
Of course, to say that something is technologically and economically possible far from guaran-tees its achievement. The current business model of the energy sector is based on centralized generat-ing technologies that use fossil fuels. Petroleum and natural gas infrastructures are similarly centered on far-lung production facilities and a vast infrastructure to process and bring them to consumers for use in homes, businesses, industries, and transportation. These can and in some cases do represent signiicant obstacles since huge investments, proits, jobs, and the well-being of many communities are bound up in the existing infrastructure. In other words, the existing system has signiicant eco-nomic, political, and social inertia that must be overcome by countervailing forward momentum in new industries, jobs, inclusiveness of underserved populations, and protection of adversely afected communities and workers from negative impacts of the transition. Indeed, given the magnitude of the transition, protection of workers and communities before the adverse impacts become serious is es-sential to achieving the transition rapidly since only such consideration can reduce the resistance to the changes that are urgently needed.
4. Challenges during the transitionOur evaluation indicates that the main challenges to a 90 percent reduction in emissions are
not technical. That is, no new breakthrough technology is needed, except in the areas of aircraft and possibly ships, to achieve an emissions-free energy system. The principal areas that need major re-structuring of present arrangements are as follows:
• Grid-of-the-Future: The institutional and business arrangements that will be needed to sup-port an electricity system in which a large fraction of generation is distributed and grid-con-nected, and in which resilience is at a premium will be very diferent from the principles on which the present-day centralized grid functions. This category of challenges usually go under the rubric of “grid-of-the-future.” The New York State Public Service Commission has initi-ated a proceeding to examine the challenges of the transition under the rubric of “Reforming the Energy Vision.” Ensuring open access to and transparency of the grid to all parties, whether they are large or small consumers and/or producers, will be critical to an equitable transition. In other words, a democratization of the grid will be essential for the public to beneit from the transition in ways that go beyond the reduction of GHG emissions.
• Energy justice: Low-income households in Maryland (and elsewhere) have energy bills that are such a high fraction of income (“energy burden”) that they cause conlicts between paying rent and buying food and medicines or paying the heating bill and getting through the win-ter. These problems may be exacerbated by a transition to a grid-of-the-future unless speciic measures are taken to ensure that low-income households can beneit from the transition. For instance, if rate structures are geared to the ability of appliances to adjust time of operation automatically, electricity bills will depend on whether households have the appliances and the information necessary to optimize the times of the electricity use, balancing energy and eco-nomic needs.

28
I. Major aspects of the transition
• Community and worker transition: A transition to the grid-of-the-future will create a large number of (net) jobs in Maryland. But some communities and groups of workers will be ad-versely impacted. A just transition for such communities and workers has not typically been a strong feature of major technological transitions in the past. Given that we know the problem exists and that the transition will take two to four decades, it is essential to address it and ind ways to provide good, remunerative employment to workers and security to communities be-fore they are grievously afected by the phase-out of fossil fuels.
• Resilience and renewable energy: Microgrids – electrical systems that can operate with the grid and provide essential services in deined areas during outages – are an essential technical component of increasing the resilience of the energy system. Microgrids typically use natural gas-driven electrical power systems as the major component of local electricity supply. This is in obvious conlict with the goal of reducing CO
2 emissions in the long-term. A major change
from fossil-fuel based resilience approaches to the renewable energy and storage-based ap-proaches will be needed to ensure that transition.
• Phasing out natural gas: Natural gas is the most common fuel used for space heating, nation-ally and in Maryland. Natural gas-fueled turbines provide a lexible electric generation capac-ity that is a good complement to the variability of solar and wind energy. Yet, it is a fossil fuel with associated CO
2 emissions; leaks of the main component of natural gas, methane, are an
important contributor to greenhouse gas buildup. Phasing out the vast majority of natural gas use will be essential for achieving a low-emissions energy system; it presents special policy challenges.
• Nuclear energy: Most of Maryland’s in-state low-carbon generation comes from two nuclear reactors at the Calvert Clifs site. The licenses of these reactors, which were extended by 20 years beyond the initial license period, expire in the mid-2030s. Contingency plans are needed to prevent a spike in CO
2 emissions in case of shutdown of these reactors at or before the expiry
of their operating licenses. It is important to note in this context that (i) the costs of operating nuclear reactors has been rising, and (ii) all U.S. nuclear power reactors that have so far shut down permanently have done so prior to the expiry of their licenses, sometimes with little notice.43
5. Energy and sustainability
The environmental, health, and economic damage from present energy use goes far beyond impacts on climate. Burning fossil fuels in vehicles and power plants is responsible for most air pollu-tion. In 2005, Maryland had the unfortunate distinction of topping the list of U.S. states for particulate air pollution-related deaths; it should also be noted that air pollution has declined since then but related data on health improvement are not available.44 Thermal electricity generation, used by all nuclear and almost all coal-ired power plants, tops the list of water withdrawals in the United States, exceeding even agriculture.45
43 New nuclear plants are far more costly than utility-scale solar, wind, or eiciency. (Lazard 2015, Slide 2) Therefore, we assume that existing nuclear power reactors will be replaced by a combination of eiciency and renewable energy. See also an article in Forbes, the Wall Street magazine, regarding the demise of the “nuclear renaissance” in the West. (McMahon 2013) 44 See Chapter XI, Section 2.45 USGS Fact sheet 2014-3109 and USGS Circular 1405 (2014), Table 2A (p. 10), from links at http://pubs.usgs.gov/
circ/1405.

29
Prosperous, Renewable Maryland
Unlike the western United States, water resources are not scarce in the East, but severe drought has already once impacted electricity generation the Southeast (in 2007).46
Mining and extraction of fossil fuels has created widespread destruction of land and pollution of water resources. Processing of fuels creates further deleterious impacts. Environmental impacts are not automatically eliminated by going to renewable energy and by increasing eiciency. Solar panels require raw materials and their processing, as do wind turbines and the towers on which they are mounted. Insulation must be manufactured. Batteries take raw materials. Ecological sustainability is more complex than a transition to a low or even zero-emissions energy system. It must involve a closed cycle, as nearly as possible, for the materials used in the energy system. For instance, the main materials used in solar panels, wind turbines, and batteries must be recycled. This means that the de-sign of these devices should take the end-of-useful life disposition and impacts into account.
Sustainability is a huge topic in its own right. We note here, in brief, the principal elements of our framework that played a role in shaping our choices and recommendations that would lead to an energy system that fully deserves the label “sustainable”:
● Mining: Mining of fuels or, more broadly, of any material resources such as copper or iron ore, is not sustainable. Mining is a principal source of ecosystem degradation and of soil and water pollution.
● Air and water pollution: Burning of fossil fuels is the principal source of air pollution and wa-ter pollution, including acid rain.
● Combustion: Burning of any carbonaceous material produces at least some air and water pollution.
● Materials: The underlying materials invested in the energy system must be amenable to reuse and/or recycling. Increasing energy services from a limited stock of materials in the energy sector can be accomplished by increases in the eiciency of materials use per unit of energy services.47
● Water: The use of large amounts of water – a characteristic of thermal generation – is inadvis-able for the long term since it reduces resilience and also the capacity to adapt to more severe climate extremes.
● Justice and democracy: Economic justice, the democratization of the energy system, the cre-ation of well-paying jobs, and the protection of communities through the energy transition are critical elements of political and social sustainability and of equity. Resilience is another aspect of social sustainability. In 2012, Hurricane Sandy demonstrated, among other things, that the functioning of all aspects of society from water supply to sewage treatment, from gasoline to food supply, from public safety to simple access to apartments in high rise buildings requires a prevention of failures of electricity supply to critical functions and the rapid restoration of power to all sectors when grid failures do occur. A robust grid that does not fail easily and a resilient one that bounces back rapidly are therefore essential.
46 See AP 2008. 47 For instance, the amount of silicon required per watt of solar panel has declined by more than half since 2005 (Osborne 2014). This also reduces the energy needed to make the solar cells.

30
II. Maryland’s energy system and greenhouse gas emissions
We have used 2011 as the base year for our analysis for two major reasons. First, this analysis began in early 2013, when 2011 data were the most recent available in reasonably complete form. Second, the most recent greenhouse gas inventory published by the State of Maryland is for 2011. This provides a basis on which to compare the ei cacy of the technical and policy measures the state might take to reduce CO
2 emissions and meet its long-term goals for the year 2050. Since Maryland’s
greenhouse gas law uses emissions in 2006 as the baseline against which to measure progress, we will also provide a comparison of energy-related GHG emissions in the years 2030 and 2050 with 2006.
1. Energy use, 2011
About half of Maryland’s primary energy use is attributable to electricity, which in turn in used in the residential, commercial, and industrial (RCI) sectors, and to a very small extent in transporta-tion. The rest of Maryland’s primary energy use is direct use of fuels by consumers – with petroleum for transportation being the top category,48 followed by direct use of natural gas, mainly for heating residential and commercial buildings in the winter. There is also some direct fuel use in industry.
Figure II-1: Maryland’s primary energy use in 2011, trillion Btu. Source: EIA SEDS Con-
sumption 2016, Table CT3, at http://www.eia.gov/state/seds/data.cfm?inci le=/state/seds/sep_use/tx/use_tx_MD.html&sid=MD, and IEER analysis.
48 There are dif erences of a few percent in data derived from dif erent oi cial sources in regard to the amount of petro-leum used in transportation. We discuss this issue briel y in Chapter III.

31
Prosperous, Renewable Maryland
Figure II-1 shows that more than one-third of the overall energy use in Maryland consists of losses in the electricity sector, mainly energy that is discharged as waste heat at thermal power plants.49 Remarkably, this is more than the entire amount of energy used for transportation. It is almost double the direct fossil fuel use in the residential, commercial, and industrial sectors combined. We will return to this ineiciency in the present energy system in some detail; we note it here because a transition to an emissions-free energy system presents the opportunity of greatly reducing losses in the electricity system by eliminating all or almost all thermal losses.
Two sectors dominate energy consumption in Maryland: transportation and buildings. The former uses mainly petroleum. The latter uses mainly electricity and natural gas, supplemented by the use of fuel oil and propane for heating, especially in less densely populated areas that lack natural gas infrastructure and/or have a large proportion of homes that were built before World War II.50
Table II-1 shows energy use broken down by end-use sector and by fuel. We only show elec-tricity and fossil fuels; biomass is not shown.51 It shows both the energy at the point of use as well as primary energy, including losses associated with electricity production and delivery to the point of use.
Table II-1: Direct fossil fuel and electricity use, by end-use sector, in Maryland for 2011, in trillion Btu
Electricity Coal Natural gas Petroleum
Total
direct
Electricity
losses
Total
primary
Residential 93.1 0 80.0 24.1 197.2 210.9 408.1Commercial 104.9 0.6 69.4 11.9 186.8 237.6 424.4Industrial 17.1 21.7 21.8 37.1 97.7 38.7 136.4Transportation 1.9 0 6.5 412.6 421 4.2 425.2Total electric-ity + fossil fuels 217 22.3 177.7 485.7 902.7 491.4 1394.1
Source: EIA SEDS Consumption 2016, Tables CT4 (residential), CT5 (commercial), CT6 (indus-trial), and CT7 (transportation)
Table II-1 shows that about ive-sixths of natural gas use is in the residential and commercial sectors. The principal uses are space and water heating; supplementary uses are cooking and natural gas clothes drying. About 85 percent of petroleum use is for transportation. We should note that trans-portation has two broad categories: on-road (cars, trucks, buses, etc.) and non-road (aircraft, boats, rail, tractors, lawn-related equipment, asphalt for roads, etc.). Almost all the coal is used in the indus-trial sector, mainly in two large cement plants and a paper mill.
49 Thermal power plants use a source of heat to drive a heat engine, which in turn provides the motive power for an electric generator. Most commonly the heat is used to boil water, which drives a steam turbine. Solar energy can also be used in this way but its potential applicability is limited to desert and semi-desert areas. In this report, we use the term “thermal power plant” to mean a power plant that uses a steam turbine to drive an electric generator. Coal, natural gas, and nuclear are the main fuels. Oil is also used.50 For a discussion of fuel oil and propane use in space heating see Makhijani and Mills 2015. For details of direct fossil fuel use in low-income households in Maryland, see Makhijani, Mills, and Makhijani 2015.51 We focus on direct fossil fuel use and the electricity sector in this report. Hence, we omit biomass for the rest of the analysis unless speciically mentioned. Wood and wood-derived materials are used mainly for domestic heating and as fuel in the paper industry.

32
II. Maryland’s energy system and greenhouse gas emissions
2. Energy production and processing
Apart from a small amount of coal, Maryland produces no fossil fuels – all of the natural gas and petroleum used in the state and almost all of the coal used in power plants is imported from other states or countries. Maryland has also begun to produce solar and wind electricity pursuant to State renewable portfolio standard mandates and state and federal incentives. The U.S. Energy Information Administration’s data on energy production show Maryland producing nuclear energy; this is because Maryland has two nuclear reactors that generate electricity at the Calvert Clifs plant in Calvert Coun-ty. However, Maryland has no uranium mines or mills; nor does it have other facilities downstream of uranium mills that produce and fabricate the fuel that is used in the Calvert Clifs plant. In this section, we deal only with primary energy produced in Maryland.
Maryland’s coal belt is situated in the extreme western part of the state, in Garrett and Allegany counties, which are part of the Appalachian region. Figure II-2, taken from the website of the Mary-land Department of Environment, shows the locations of the state’s coal resources.
Figure II-2: Maryland’s coal resource region. The inset shows the location of the two coal-resource counties in the context of the state’s map. Source: Maryland
Bureau of Mines Coal Division 2016
Coal production in Maryland peaked in 2004 at 129.1 trillion Btu and remained over 120 tril-lion Btu up to and including 2006; it fell precipitously to 53.8 trillion Btu in 2007, a drop of 56 percent in just one year. By 2014, production had fallen further to 46.2 trillion Btu 52 There were 3 under-ground mines and 18 surface mines, all in Garrett and Allegany counties, in 2013; almost two-thirds of the coal production was in the surface mines.53
52 EIA SEDS Production 2016, Table PT2 (p. 53)53 EIA Annual Coal Report 2015, Table 2, at http://www.eia.gov/coal/annual/.
Coal Basins of Western MarylandGeorges Creek, Upper Potomac, Casselman, Upper Youghiogheny, Lower Youghiogheny

33
Prosperous, Renewable Maryland
Allegany and Garrett counties are also among the places in Maryland with the highest rates of poverty, with households below the federal poverty level being 17.4 percent and 13.9 percent re-spectively. They are also among the counties where more than ten percent of the households apply for energy bill payment assistance.54
The production of solar and wind electricity has grown from zero in 2009, when Maryland passed the Greenhouse Gas Emissions Reduction Act, to about 385,000 megawatt-hours (MWh) in 2013.55 Though it was a very small fraction of total electricity consumption, which was almost 62 million MWh in that year,56 solar energy has been growing rapidly because of the renewable portfolio standard requirement that 2 percent of retail electricity sales in the year 2020 be solar electricity.57 This requirement was increased in the 2016 Maryland legislative session to 2.5 percent by 2020. However, the legislation was vetoed by the Governor.58
3. The electricity systemMaryland has a number of large thermal electricity generating stations, mainly fossil fuel but
also one nuclear power plant with two reactors. Since the combined generation of these plants do not meet the state’s total requirements for electricity, it also imports a large fraction of its electricity requirements. Maryland’s electricity system is part of the PJM grid, which in turn is part of the larger Eastern Interconnection, which includes other grid management operators. The fraction of imported electricity has increased from about one-third in the irst part of the decade of the 2000s to 40 percent or more in recent years (46 percent in 2013).59 The PJM grid also consists mainly of a mix of fossil fuel and nuclear generation. This means that it is dominated by thermal generation with intensive use of water. About two-thirds of the energy in the fuel is lost as waste heat in thermal generation, except in natural gas combined cycle power plants where losses are much lower. (See Chapter III on eiciency below).
Table II-2 (following page), reproduced from the State Electricity Proiles of the Energy Infor-mation Administration,60 shows the ten largest power generating stations in Maryland. The fuel mix is somewhat more complex than is shown in Table II-2, however. Coal is the main fossil fuel used. The largest fossil fuel power stations, notably the coal-ired ones, are also among the largest stationary sources of CO
2 emissions in Maryland.
54 Makhijani, Mills, and Makhijani 2015, Table II-4 (p. 34). Baltimore City and seven counties on Maryland’s Eastern Shore also have high poverty rates and applications for energy assistance.55 EIA States 2015 Maryland, Table 5, for production, and EIA SEDS Consumption 2016, Table CT8, for consumption. 56 EIA States 2015 Maryland, Table 10, net electricity sales57 Maryland Ofshore Wind 2013, Section (15)(I) (p. 12). The original RPS required 2 percent solar by 2022 (Maryland RPS 2007, Section (17) (p. 15).58 Maryland Clean Energy Jobs 2016 (vetoed), Section (15)(i) (p. 7)59 Calculated by IEER from EIA States 2015 Maryland, Table 10.60 EIA States 2015 Maryland, Table 2

34
II. Maryland’s energy system and greenhouse gas emissions
Table II-2: The ten largest electric power generating stations in Maryland (2013 data)
Plant
Primary
energy
source Operating company
Net
summer
capacity
(MW)
1 Chalk Point LLC Petroleum NRG Chalk Point LLC 2,248
2 Calvert Clifs Nuclear Power Plant Nuclear Calvert Clifs Nuclear PP LLC 1,716
3 Morgantown Generating Plant Coal GenOn Mid-Atlantic LLC 1,423
4 Brandon Shores Coal Raven Power Holdings LLC 1,273
5 Herbert A Wagner Coal Raven Power Holdings LLC 976
6 Dickerson Coal GenOn Mid-Atlantic LLC 849
7 NAEA Rock Springs LLC Natural gas NAEA Rock Springs LLC 654
8 Conowingo Hydroelectric Exelon Power 572
9 C P Crane Coal Raven Power Holdings LLC 399
10 Perryman Petroleum Constellation Power Source Gen 354
Source: EIA States 2015 Maryland, Table 2
4. Energy-related greenhouse gas emissions, 2006 and 2011
Energy use, including in heavy industry, was responsible for about 96 percent of Maryland’s greenhouse gas emissions in 2006, which is the baseline year for the state’s GHG accounting in Mary-land’s Greenhouse Gas Emissions Reduction Act; the percentage was the about the same in 2011, which is the starting point for the energy analysis in this report.61 Excluding industrial processes (con-sisting of heavy industry), energy use amounted to almost 90 percent of GHG emissions in 2006 and 91 percent in 2011.62
The 2009 Greenhouse Gas Emissions Reduction Act requires the preparation of a plan for re-ducing the state’s GHG emissions by “up to 90 percent” by 2050 relative to 2006.63 Given that almost all GHG emissions are energy-related, a near-total elimination (about 90 percent or more) will be needed from the energy sector to achieve Maryland’s 2050 goal.
Figure II-3 shows the various components of GHG emissions in 2006; the same data are shown in Table II-3. In this report, we will not analyze emissions related to agriculture and waste manage-ment. Forest and soil sinks of GHG are not shown.64
61 The Renewable Maryland analysis started in early 2013, when 2011 data were the most recent complete data available. 62 Calculated by IEER from Maryland GHG Inventory 2012.63 Emissions reduction goals can be keyed to various baseline dates. The Maryland baseline date is 2006. (Maryland GGRA
2009).64 Maryland’s GHG inventory estimates that forest and soil sinks ofset about 11 to 12 percent of the state’s GHG emissions (Maryland GHG Inventory 2012 (see Summary tab of 2011 ile)).

35
Prosperous, Renewable Maryland
Figure II-3: Maryland’s greenhouse gas emissions for 2006, Maryland’s baseline year for assessing GHG emission reductions (sinks not shown). Source: Maryland GHG Inventory 2012
In this report, we will follow the greenhouse gas accounting system adopted for reporting en-ergy system emissions under the state’s Greenhouse Gas Emissions Reduction Act. This law takes into account CO
2 emissions from the use of fuels in the state directly at the point of end use; for instance,
the use of natural gas and fuel oil for heating and cooling buildings or of gasoline and diesel in cars and trucks. It also takes into account the fuel used in electricity generation whether in the state or imported from other states. Transmission losses for imported electricity are included. However, it does not take into account upstream emissions in other states that supply fossil fuels to Maryland. It does include methane and nitrous oxide emissions in the state, including those associated with energy use. These are estimated to be small however, except for methane leaks associated with natural gas distribution within the state. These were estimated to be 0.7 million metric tons of CO
2-equivalent in 2011.65
65 Maryland uses a global warming potential of 21 for methane since that is the value used by the U.S. Environmental Protection Agency.

36
II. Maryland’s energy system and greenhouse gas emissions
Table II-3: Maryland’s greenhouse gas emissions in million metric tons of CO2-equivalent per year,
for the years 2006 and 2011
2006
(baseline year)2011
Electricity Use 42.48 37.86
(of which imports) (10.31) (13.31)
RCI Fuel Use 16.87 17.00
Transportation – On-road 29.67 28.25
Transportation – Non-road 5.80 7.02
(of which aircraft) (1.72) (1.13)
Fossil Fuel Industry 0.94 0.84
Industrial Processes 7.44 4.40
Agriculture 1.77 1.66
Waste Management 2.26 2.26
Energy-related emissions, subtotal 95.76 90.97
Energy-related emissions, including
industrial processes 103.20 95.36
Total, all emissions 107.23 99.28
Source: Maryland GHG Inventory 2012
Note: Greenhouse gas sinks not shown. Totals may not add up due to rounding.
As is the case for the United States overall, Maryland’s greenhouse gas emissions have been declining since 2006, due to a variety of factors, including lower energy use per unit of economic output and reduced use of coal in the electricity sector. Non-road emissions increased in 2011 rela-tive to 2006, in large part due to increased non-road petroleum use (as for instance in construction machinery).66
A 90 percent reduction of greenhouse gas emissions from 2006 levels in the energy sector means that GHG emissions must be reduced to about 10 to 11 million metric tons of CO
2-equivalent
by 2050.
We will briely consider the emissions from industrial processes in this report. The industrial process emissions in 2011 were mainly due to two cement plants and a paper mill.67
5. Expenditures on energy
The fact that Maryland produces very little of the primary energy that is used in the state has major implications for its economy in general, and for employment in particular. Table II-4 shows Maryland’s primary energy use in 2013, the prices per million Btu paid for each type of energy, and total amounts of energy expenditures that went out of state to purchase energy (including primary fuels and imported electricity). The energy revenue generated in the state is due to the value added from the electricity generation in the state, and the value added by the transmission and distribution of electric-ity and by the facilities and work associated with the delivery of other fuels to inal consumers. The diference between the retail price paid by the user and the price at the state boundary is due to the expenditures for distribution as well as state taxes.
66 Estimated by IEER from the Transportation worksheet of the Maryland GHG Inventory 2012.67 Maryland GHG Inventory 2012

37
Prosperous, Renewable Maryland
Table II-4: Primary energy use in Maryland in 2013, net primary energy imports, and net out-of-state expenditures for primary energy imports (Note 1)
Primary energy use, 2013 CoalNatural
gas
Petroleum
(all)
Nuclear
(fuel only)Electricity Total
Direct primary energy con-sumption, trillion Btu (Note 2) 183 209 464 149 N/A 1,005Primary energy production, trillion Btu 45 0 0 0 N/A 45Net imports, primary energy, trillion Btu 138 209 464 149 321 1,281
Price, $/million Btu$3.39 $9.47 $28.43 $0.77
$34.16 (retail) N/A
Out-of-state cost, $/million Btu of imported primary energy $3.39 $5.92 $19.45 $0.77
$5.00 (Note 3) N/A
Total out-of-state expenditures, million $ $470 $1,240 $9,020 $110 $1,600 $12,400
Total expenditures , million $$620 $1,910 $13,860 $110
$6,380 (Note 4) $22,900
Source: IEERNote 1: Calculated from data in EIA SEDS Consumption 2015; Table C3, EIA SEDS Production 2015, Table P2; EIA SEDS Prices 2015, Table E1 and Table E8 showing state-by-state energy expen-ditures. Individual column totals rounded to the nearest $10 million; the grand total is rounded to the nearest $100 million. We used wholesale natural gas and crude oil prices plus reinery cost to estimate out-of-state expenditures. For natural gas we used the simple arithmetic average of the monthly City-gate prices for Maryland as reported by the EIA (EIA Natural Gas Citygate 2015, at http://www.eia.gov/dnav/ng/hist/n3050md3m.htm). For petroleum we used crude oil prices as an approximation for prices of imports of petroleum products (EIA Crude Oil 2016, at http://www.eia.gov/dnav/pet/hist/LeafHandler.ashx?n=PET&s=F000000__3&f=M). For reinery costs we used data in California En-ergy Almanac 2016, at http://energyalmanac.ca.gov/gasoline/margins/index.php.Note 2: Wood and waste fuels are not included.Note 3: We used a wholesale price of $52.97 per MWh for the year 2013 from PJM Year in Review - Markets (PJM 2014, slide 8, at http://www.pjm.com/~/media/committees-groups/stakeholder-meet-ings/annual-meeting-members/20140513/20140513-pjm-2013-markets-year-in-review.ashx). The imported electricity fraction was derived from EIA States 2015 Maryland, Table 10. The Maryland State Electricity Proile tables are at http://www.eia.gov/electricity/state/maryland/. Note that $5 per million Btu for imported electricity represents $52.97 per MWh converted to $/million Btu of primary energy input for imported electricity.Note 4: Exclusive of fuel costs for in-state electricity generation. In-state fuel costs are included under the fuel columns.

38
II. Maryland’s energy system and greenhouse gas emissions
Most of the cost of energy imports in Maryland was attributable to petroleum imports. Mary-landers also spent about $1.6 billion to import about 46 percent of their electricity (not including revenues to Maryland utilities for distributing the imported electricity) and over $1.2 billion to import natural gas. The bill for Maryland to import out-of-state energy was about $12.2 billion in 2013, which was over half of total inal energy expenditures. These out-of-state energy expenditures represented about 3.6 percent of Maryland’s Gross State Product in that year. If Maryland kept more of its energy dollars in the state through eiciency and in-state renewable energy development, there could be more jobs in the energy sector (see Chapter X).
There is also considerable impact from the volatility of dependence on fossil fuels. Petroleum and natural gas prices luctuate over wide margins. For instance, since 2013, the cost of crude oil has dropped by about half. Notwithstanding that drop, the outlow of money for importing energy into Maryland in 2015 was still in the $9 billion to $10 billion range.68 The value of eliminating fuel price volatility by using zero fuel cost energy sources, like solar and wind, is briely discussed in Chapter IX, Section 6.
68 IEER estimate based on an average crude oil price of about $50 per barrel. The EIA estimate for 2015 is $49; it was made
in mid-2015 (EIA Today in Energy 2015, at http://www.eia.gov/todayinenergy/detail.cfm?id=22572).

39
Prosperous, Renewable Maryland
III. Eiciency
The present energy system is wasteful in a variety of ways. Despite large expenditures on energy, little of it actually provides the services we seek, like lighting or heating or motive power for transportation. The waste occurs throughout the fuel chain from production to end use.69
Assessing the eiciency of an energy system can be quite complex if one drills down very far. For instance, there is the eiciency of the use of gasoline in the car: how much of the energy in the gasoline shows up at the wheels? But this does not answer a larger question: how much of the energy is used to transport the people in the car and how much the car itself. At the next level, we have the question of whether the use of cars can be reduced by better design, zoning, smart cities, and use of public transport. Apart from occasional brief mentions, we restrict ourselves in this report to the direct eiciency of the energy system up to and including the use of energy by its consumers. The larger questions need to be addressed but are beyond the scope of the present report.
Losses of energy occur at every stage:
1. Loss of energy at the point of production – as, for instance, when natural gas is lared at the wellhead.
2. Energy required for processing crude products into inal products that can be used by various devices – oil reining is a major example.
3. Energy required to transport inished fuels to the point of use. The energy required to compress natural gas and transport it in pipelines, the petroleum diesel needed for tanker trucks to deliver gasoline and diesel to gas stations, and the transmission and distribution losses incurred in get-ting electricity from the generating station to inal consumers.
4. Energy conversion losses – losses involved in converting one form of energy into another more suitable for speciic end uses. By far the most important example of this is electricity produc-tion. As noted above, electricity is mostly produced in thermal plants, mainly coal and nuclear plants;70 this results in the discharge of about two-thirds of the energy in the fuel as waste heat at the power plant.
5. Losses at the point of use. These are of various types. For instance, most of the energy in the gasoline is waste heat and only about 20 percent shows up at the wheels of the car. In the win-ter, however, some of the waste heat is recovered to keep the car interior warm.
69 In addition to the direct waste, there are energy expenditures associated with the production and construction of energy producing and using equipment, energy use associated with cleanup after coal ash dam spills or at hazardous waste sites or uranium mines and mills or after reactor accidents.70 Natural gas is also used, though not to a great extent in Maryland’s in-state facilities; see EIA SEDS Consumption 2015, Table CT8. Thermal losses in natural gas plants are variable. Combined cycle plants have far lower losses than coal or nuclear plants; single stage gas turbines have comparable losses, but these are to the atmosphere rather than to water.

40
III. Eiciency
6. There are also losses because the devices used for a particular function like light bulbs or air-conditioners are less eicient than the best that are available or even the most economical that are available (on a life-cycle basis).
7. Design also afects energy use. “Passive” structures gain energy from the sunshine via the walls and windows in the winter and keep the heat out by awnings in the summer. Well-insulated and designed houses can eliminate most heating and cooling requirements. This allows for smaller and less expensive HVAC systems and much less primary energy use for the same comfort and energy services. In principle, the choice should be a question of what standards are adopted for buildings and the life-cycle cost of various alternatives.
Figure III-1 (facing page) shows a “Sankey diagram” of the U.S. energy system for the year 2014, produced by Lawrence Livermore National Laboratory. Of the total input of 98.3 quads, 59.4 quads or about 60 percent is lost, while the rest is deemed used for “energy services.” Most of these losses can be reduced through better technology.
The vast majority of losses are shown in the electricity and transportation sectors, for the reasons already discussed. However, the “energy services” segment implies that almost all the elec-tricity delivered to the point of use can be attributed to energy services. This is misleading. A rough estimate of the overall eiciency of the U.S. energy system would be closer to ten percent, rather than 40 percent.71
We now consider ive areas relating to energy eiciency in more detail.
71 Order of magnitude IEER estimate based on the eiciency potential of better appliances and lighting that are currently available, tighter buildings, and conversion of transportation (road and most non-road) and HVAC systems to eicient electric systems.

41
Prosperous, Renewable Maryland
Fig
ure
III
-1:
San
key
diag
ram
of
the
U.S
. ene
rgy
syst
em f
or 2
014.
Sourc
e: L
LN
L 2
015
(http
s://l
owch
arts.
llnl.g
ov/c
onte
nt/a
sset
s/do
cs/2
014_
Uni
ted-
Sta
tes_
Ene
rgy.
pdf)
. Cre
dit:
Law
renc
e L
iver
mor
e N
atio
nal L
abor
ator
y an
d U
.S. D
epar
tmen
t of
Ene
rgy

42
III. Eiciency
1. Electricity generation
Most electricity generation is thermal generation in which a fuel is typically used to boil water into high pressure steam that drives a turbine; the turbine in turn drives an electric generator. A sche-matic typical thermal generation system is shown in Figure III-2, which depicts a nuclear power plant of the pressurized water reactor design (the most common type). A coal-ired power plant is essentially similar, except that a boiler is used in place of the reactor and steam generator shown in Figure III-2.
Figure III-2: A typical thermal generating station with cooling towers, illustrated here by a
pressurized water nuclear reactor. The nuclear fuel is inside the reactor in the containment
building. In a coal-ired power plant, the equipment inside the reactor containment build-
ing would be replaced by a boiler, a coal pile, and a conveyor belt to feed coal to the boiler.
Source: NRC PWR 2015, at http://www.nrc.gov/reading-rm/basic-ref/students/for-educators/
pwr-schematic.html.
A thermal generation system typically converts 30 to 40 percent of the input energy into elec-tricity. The rest is discharged as waste heat, mainly to cooling water in a variety of ways. The speciic illustration in Figure III-2 shows the use of a cooling tower. Once-through cooling and cooling ponds or lakes are also used. Typically another 5 to 8 percent of the electricity is lost in transmitting it via high voltage lines and then distributing it at lower voltages to inal consumers.
2. Lighting
Figure III-3 shows the eiciencies of three types of lighting, a major use of electricity. Even the most eicient bulbs, LEDs, only convert about 20 percent of the electricity to light. If the electricity

43
Prosperous, Renewable Maryland
is, in turn generated in a thermal power plant, the overall eiciency of the conversion of fuel energy into light using LEDs is only about 6 or 7 percent. If the electricity is used in incandescent lamps (or “ilament lamps”), the eiciency of conversion of fuel to light energy is only about 0.6 percent.
Figure III-3: Eiciency of the conversion of electricity into visible light for three diferent lighting systems. Credit: Ally Davies, at http://www.myphysics.org.uk/ks4p3hotpot04.htm.
3. Heating Natural gas is the most common fuel used for heating in Maryland.72 Natural gas furnaces are
rated as 80, 90, or even 95 percent eicient. This rating is accurate so far as it goes – it means that the stated percentage of heat content of natural gas comes out of the vents as warm air; the rest is vented via the chimney. This eiciency provides no information about the quality of the energy or the amount of heating that a given amount of fuel could provide if used with the best available technology. For instance, if the same natural gas were used to generate electricity in an eicient combined cycle plant (60 percent eiciency), transmitted to a highly eicient geothermal heat pump in a home or business, the amount of heat available to warm the house could be more than double the energy content of the natural gas.
There is no magic in these numbers. Electricity is high quality energy that can drive the com-pressors in the heat pumps. The heat pump can then extract and move heat from the ground (in the case of a geothermal heat pump) or the air (in case of an air-to-air heat pump). This is “free” energy available in the environment that can be tapped, with suitable technology, and channeled to provide part of the required energy services.73 To a large extent, eiciency is a choice that depends on a variety of factors, such as the cost of purchasing and maintaining various kinds of systems, the afordability of the initial investment, and policies regarding the pollution associated with diferent devices.
72 Makhijani and Mills 2015, pp. 15-1673 When the season changes from winter to spring, we sense the greater warmth in the air: we are feeling the higher energy content of the air as its temperature increases. As long as temperature is above absolute zero (about 459.7 degrees below zero on the Fahrenheit scale or -273.15 on the Celsius scale), there is always some energy in the atmosphere. This energy can most eiciently be extracted by a luid that boils at a temperature lower than that of the air – the lower the boiling point, the better, in principle. This luid is known as a “refrigerant”; a variety of them are used in heat pumps, air-conditioners, refrigerators, and freezers. Older refrigerants, such as CFC-11, CFC-12, and HCFC-22 (more commonly known as R-11, R-12, and R-22) are being replaced by non-ozone depleting compounds, such as HFC-134a, which are organic compounds that do not contain chlorine. Unfortunately, like the earlier refrigerants, the latter are also greenhouse gases and, as such will eventually need to be phased out. See Makhijani and Gurney 1995. Fortunately, some of the potential replacement refrigerants have lower boiling points and could increase eiciency. Carbon dioxide is one good candidate; it has a global warming potential of 1, compared to several hundred to several thousand for typical present-day refrigerants. See IPCC5 Physical Science 2013, Chapter 8, Table 8.A.1 (pp. 731 to 738). Carbon dioxide is already used in several applications. See, for instance, Danfoss 2016.

44
III. Eiciency
The overall eiciency of any device that uses electricity also depends on the method of elec-tricity production. Solar electricity generation does not entail thermal losses; however there are losses in conversion from DC to AC current; these must be taken into account even though they are much smaller than thermal losses. Similarly wind farms have no thermal losses but do involve transmission and distribution losses. Energy storage, which will eventually be needed to overcome the variability of wind and solar energy, also involves losses.
Such considerations are integral to the transition from the present system to a much more ef-icient one. Eiciency matters because higher eiciency typically results in lower overall costs of energy services like lighting or air-conditioning and because it lowers environmental impacts during the transition to a renewable electricity system.
4. Petroleum fueled vehicles
Figure III-4 shows the useful energy, deined as the mechanical power at the wheels of a car, compared to the energy in the fuel. Only about 20 percent of the energy in the gasoline shows up at the wheels. The rest is wasted in various ways, mainly as waste heat. Moreover, most of the mechani-cal energy is used to move the mass of the vehicle, rather than the mass of the people it is intended to move, because the former is much greater than the latter.
Figure III-4: Mechanical energy output and energy losses in a typical automobile. Source:
DOE and EPA 2015 (https://www.fueleconomy.gov/feg/atv.shtml). Go to the original page
for the interactive features.

45
Prosperous, Renewable Maryland
For electric vehicles four-ifths (or more) of electrical energy in the electric outlet socket shows up at the wheels. The overall eiciency depends, of course, on the eiciency of electricity produc-tion, transmission, and distribution – which is high with solar and wind energy. The combination of solar and wind energy with electric vehicles can therefore eliminate most technical energy losses in transportation.74
5. DesignBuilding envelopes themselves are typically very ineicient compared to what is achievable.
This means that heating, cooling, and other energy requirements are far higher than they need to be to provide a given level of energy services. For instance, excessive in-leakage of cold outside air in the winter creates a greater demand for heating energy than would be needed in a tightly built house.75 A lack of insulation in the ceiling or walls creates further losses. Figure III-5 shows the various types of losses that occur in a typical detached single-family structure. Sound construction practices can reduce these losses by 60 to 80 percent.76
Figure III-5: Heat losses from a typical detached single-family structure. Sources:
Data: U.S. Department of Energy Savers - Stopping Air Leaks. Image: Icynene Corp.
74 The caveat “technical” is used since we are not considering the losses entailed by the high weight of the vehicle relative to the “payload” represented by the passengers. This is important in considering transportation systems, such as public transport, electric bicycles, or walking. Energy use in transportation can be reduced far more than considered in this report by design of transportation systems and communities that provide a mix of transport modes. 75 Some amount of air exchange is necessary in order to maintain indoor air quality; however, the rate of air exchange is generally in excess of that needed.76 Passive House Institute 2016

46
III. Eiciency
Carbon-neutral new buildings, especially low-rise residential buildings, are now economical and can be provided by available technology. It is more expensive to retroit buildings (with high energy losses and ineicient systems) once they are built than to build eicient ones in the irst place.
6. Conclusions
Figure III-6 (facing page) shows a Sankey diagram of Maryland’s energy system for the year 2011. The primary energy inputs are shown at the left, the processing steps in the middle, and the dis-position of the energy at the right, including losses in processing and approximate losses at the point of use. The total losses (“rejected energy”) and total useful energy are shown at the very right side of the diagram.
Our approach to an emissions-free energy sector combines these various forms of eiciency. For instance, solar and wind energy eliminate thermal losses and the carbon emissions that are typi-cally associated with thermal losses when fossil fuels are used. A transition from gasoline to electric vehicles improves end-use eiciency of energy use, as does the replacement of fossil fuel space heat-ing by electric heat pumps. The overall scenario we develop has very low CO
2 emissions (about 90
percent below 2006); we call this the “Climate Protection Scenario” (CPS). This scenario has the potential for being further developed into a complexly emissions-free system.

47
Prosperous, Renewable Maryland
Fig
ure
III
-6:
Mar
ylan
d pr
imar
y en
ergy
sou
rces
, con
sum
ptio
n, a
nd w
aste
, in
2011
, tri
llio
n B
tu. S
ourc
e: I
EE
R

48
IV. Direct fuel use in the residential and commercial sectors
IV. Direct fuel use in the residential and commercial sectors
About half of Maryland’s primary energy use consists of the direct use of fossil fuels – that is, combustion of fossil fuels at the point of use. Of these, the use of fuels derived from petroleum for transportation is the most important, followed by the use of natural gas for space heating and water heating in buildings.
About 60 percent of Maryland’s 2011 energy-related emissions shown in Table II-3 above are attributable to the direct use of fossil fuels (including transportation and industrial processes). Renew-able electricity can replace almost all or all of the direct use of fossil fuels in buildings and the vast majority of fossil fuels in transportation, and most of the direct use of fossil fuels in industry. In the industrial sector, the extent of the substitution can only be deinitively determined on an industry-by-industry basis, especially for large industrial establishments.
Direct fossil fuel use in the residential, commercial, and industrial sectors amounts to about 18 percent of total energy-related emissions; the vast majority of this is due to space and water heating in buildings. We cover buildings in this chapter and transportation in the next. The goal of 90 percent reduction in GHG emissions by 2050 cannot be achieved without greatly reducing emissions that arise from fossil fuel use in these two sectors.
The most straightforward and eicient way to approach the phase-out of fossil fuels in the resi-dential and commercial energy sectors is to electrify space and water heating because:
• Advanced electrically-driven heat pump systems increase eiciency;• Electriication makes end uses of energy “renewable-grid ready.” That is, once a system is
driven by electricity, no further change is needed to reduce emissions – that occurs automati-cally as the proportion of renewable energy in the system increases.
• The transition to a low-emissions energy system will involve mainly solar and wind energy; this eliminates most losses in the electricity system. Hence, electriication using eicient sys-tems powered by renewable energy produces a double eiciency beneit – once at the point of use and once at the point of electricity production.
We will examine the four major direct uses of fossil fuels in buildings in this chapter:
1. Space heating
2. Water heating
3. Cooking
4. Clothes drying

49
Prosperous, Renewable Maryland
1. Space heatingWe have completed a special study on the heating and cooling in buildings (with a focus on the
residential sector) examining the necessity, feasibility, and cost of transitioning from direct use of fuels for space heating to highly eicient heat pump systems (either geothermal heat pumps or cold climate air-to-air heat pumps).77 Geothermal heat pumps extract energy from the ground, which remains at constant temperature a few feet below the surface. The underground temperature at depths of 30 to 60 feet varies between about 40oF in the upper Midwest to over 70oF at the very southern tip of Texas and Florida. In Maryland, the ground temperature indicated by the map is about 55oF in the central and eastern parts and closer to 50oF in the westernmost areas. Figure IV-1 shows the isopleths of the average underground temperature in the 48 contiguous states of the United States.
Figure IV-1: Underground temperatures in the 48 contiguous states. Source: Schoen 2012, pdf p.7. Image courtesy of Don Penn Consulting Engineer (http://www.donpenn.com/).
In “closed loop” geothermal heat pump systems, the heat in the ground is transferred to a working luid (like anti-freeze) and circulated in a closed loop between the ground and the heat pump. The heat pump has a refrigerant luid similar to the ones used in central air-conditioners; it also has a compression system that pumps up the temperature to the level necessary for space heating (typi-cally 100oF or more). Air-to-air heat pumps work in the same way, except that the source of heat is the outside air. A heat pump is basically an air-conditioner in reverse: the heat pump takes heat from the outside, pumps it up to a higher temperature and heats the indoors; an air-conditioner does the reverse, taking heat from the inside and dumping it outdoors.
Normal air-to-air heat pumps work reasonably well at temperatures at or above 40oF. When temperatures fall to freezing levels or below, their eiciency drops signiicantly. Conventional air-to-air heat pumps have therefore tended to be used in areas that do not have severe winters, as for instance, in the southeastern part of the United States.
77 Makhijani and Mills 2015
50
IV. Direct fuel use in the residential and commercial sectors
Cold climate heat pumps use the same basic system but with new refrigerants and improved and more eicient compressors and mechanical drives. Their rated eiciency is closer to that of geo-thermal heat pumps over most of the operating temperature range in Maryland; that is, they can pro-vide comfortable space heat while remaining eicient at temperatures well below freezing. This al-lows such heat pumps to be used in colder climates, not only in Maryland but farther north, in New York State and New England.
Given the importance of the topic – for energy, economics, and emissions – IEER prepared a special report on heating and cooling and the path to phasing out fossil fuels from the buildings sector in Maryland, with a focus on the residential sector.78
In brief, we concluded that it was essential to eliminate fossil fuel use for heating and cooling nearly completely and to make electric space heating as well as air-conditioning much more eicient. We found that the change is economical (i.e., equal or lower in cost than present systems) in the case of fuel oil, propane, and electric resistance heating systems, but marginal or not economical without rebates for replacing natural gas heating with highly eicient heat pumps at the prices of equipment and fossil fuels in late 2014. A change in the state incentive structure for heat pumps from a technol-ogy-based one favoring geothermal heat pumps to a performance-based one would make the costs comparable in most circumstances.
We did not cover commercial buildings in detail in our space heating and cooling report; hence, we provide more detail here.
The commercial sector has many types and functions of buildings and a wider variety of heat-ing and cooling systems than the residential sector. By the same token, a broader set of options is avail-able for eicient heating and cooling systems. There are all-electric systems and combined heat and power systems. The latter can generate electricity and the rejected heat can be used to provide heating and air-conditioning. Such systems are normally powered by natural gas today, but they can also be powered by fuel cells using hydrogen fuel created from zero-carbon electricity sources.
Combined heat and power (CHP) can provide the foundation for microgrids, which could con-tribute to increasing the resilience of the electricity system. Microgrids typically have a combination of resources that operate in normal times to minimize cost, but can supply both power for essential operations and heating when there are grid outages. For instance, the microgrid in Albuquerque that supplies several corporations, the University of New Mexico, and a national laboratory located in a 78,000 square foot building. It has the following resources:
• 80 kilowatts of fuel cells
• A 50 kilowatt solar PV system
• A 240 kilowatt natural gas driven electric generator
• A 90 kilowatt battery system that can store 160 kilowatt-hours of electricity.
The system can supply a peak load of 400 kW; the building can function “indeinitely in island mode” so far as electricity supply is concerned.79 We have incorporated 2,000 megawatts of CHP in our design for the electricity system of 2050, along with more than 5,000 megawatts of distributed solar and ample battery storage as a key element in managing the variability of wind and solar sup-ply. We will discuss the resilience issue in more detail in Chapter VI, Section 7. Here we note that the combined heat and power capacity of 2,000 megawatts operated to supply heating requirements in the winter would cover about 20 percent of the commercial sector’s direct fuel needs in 2050.80 In
78 Makhijani and Mills 201579 Sanchez 2012, pdf p. 1780 CHP systems can run on a variety of fuels, including natural gas, renewable methane, or renewable hydrogen, or mix-
tures of the three. Renewable methane is made by combining renewable hydrogen with CO2.

51
Prosperous, Renewable Maryland
our modeling, we assume that the fuel for CHP systems would be renewable hydrogen produced by electrolysis in distributed facilities close to the point of use.
Reducing fossil fuel use would also require conversion of existing natural gas systems to ef-icient electric systems. A variety of options are available. Existing building conversion is, of course, often limited by the type and coniguration of the HVAC system installed at the time of construction.
Small, low-rise buildings can generally use heat pump technologies similar to those used in residential buildings. Nonetheless, large existing buildings and entire campuses of corporations and universities can and are being converted to eicient heat pumps, including geothermal heat pumps.81
The extent to which existing commercial structures can economically accommodate eicient electriication and/or combined heat and power is diicult to assess. We have assumed that about 20 percent of the heating load will be accommodated by rejected heat in CHP systems and that 70 percent of the remaining heating demand, currently met by fossil fuels, will be converted to eicient electric systems. The rest would remain fueled by natural gas. Our basic target is to assess the approach to an energy-sector that would have at least 90 percent lower greenhouse gas emissions by 2050 relative to 2006. Given that the use of geothermal systems is becoming much more common, it is possible that the entire existing commercial building sector can be converted to a form that will use renewable ener-gy using a variety of technologies, such as seasonal thermal storage, combined heat and power fueled with renewable hydrogen, and new types of heat pumps, such as a solar-assisted heat pump in which a few solar panels could replace the geothermal wells.82 It is diicult to estimate the cost of converting every last existing building; for this reason we have assumed some continued natural gas use, though it is likely that over the next three-and-a-half decades a full conversion to various renewable energy technologies should be possible (see Chapter VII, Section 7).
2. Other end usesWater heating is usually the third largest energy use in homes, after space heating and cool-
ing. Electric heat pump water heaters work in the same way as space heating heat pumps – they draw energy from the environment and pump it up to the required temperature. Every unit of electricity can produce two, three, or more units of hot water heat, depending on the eiciency of the device. In 2015, the U.S. government issued new standards for water heaters which will require a coeicient of per-formance or COP (called “energy factor” in the regulation) of about 2 for electric water heaters with more than 55 gallons capacity. Electric water heaters that are 55 gallons or less will not have to be heat pumps.83 These standards can be updated with time to cover all tank electric water heating systems.
A heat pump water heater installed indoors, as for instance, in a space-conditioned utility room, will cool the ambient air. Therefore, it increases space heating energy requirements in the winter and decreases the space cooling energy requirements in the summer. Since the heating and cooling re-quirements are minimal in the spring and fall, the performance of the water heater will be close to the nameplate rating in those seasons. For the Maryland climate the annual average performance may be around 10 percent less than the nameplate rating; we have factored this into our calculations.
Heat pump water heaters require a drain (as do central air conditioners) in which to discharge the condensation water. This is normally available in utility room spaces. However, it may not be pos-
81 For instance, Skidmore College, in New York State, had converted about 40 percent of its heating to geothermal systems by 2015. (Skidmore 2015) 82 SunPump 201683 DOE EERE 2016 Water Heaters

52
IV. Direct fuel use in the residential and commercial sectors
sible to install heat pump water heaters in some locations such as indoor closets in apartments.84 The ield is evolving rapidly, however. The best heat pump water heaters now have coeicients of perfor-mance of well over 3 – the best Energy Star-rated one has a COP of 3.39.85 We calculate that the efec-tive COP, taking into account lower winter and higher summer performance, will be about 10 percent lower on an annual average basis.
With some caveats, noted above, it should be very straightforward to replace electric resistance water heaters with heat pump water heaters, especially since no new wiring is required. It may be more complex to convert natural gas heated water heaters to heat pump devices since new wiring may be needed. Our Climate Protection Scenario assumes that all water heating in the residential sector and 70 percent in the commercial sector will consist of eicient electrical water heating systems by the year 2050.
Most clothes dryers are currently electric. Heat pump clothes dryers are available. We assume that heat pump dryers will become the norm and that appliance standards will evolve accordingly.
Electricity and natural gas together account for almost all cooking energy. Natural gas has the advantage of instant adjustment of the lame, providing more control of heat for cooking compared to normal electric stove cooktops. However, natural gas has the disadvantage of being a fossil fuel; as such, it is preferable to vent natural gas stoves; this is typical in commercial cooking but not in the residential sector. It is also considerably less eicient than electric cooking when the energy at the point of use is considered, though not when the large thermal losses at the power station in the present electricity system are included.
Induction cooking uses electricity to induce a current in the cooking vessel; like natural gas, the heat is instantly controllable. It is safer because the cooktop does not get hot and, being electric, no lame or products of combustion are involved at the point of use. It is also more eicient than a normal electric cooktop and uses much less energy as measured at the point of use. It makes cooking “renewable-grid ready.” Like natural gas stoves, induction cooktops heat the cooking vessels rapidly; they have touch controls, much like smart phones.
Induction cooking would be much more eicient than natural gas in an electricity system pow-ered mainly by wind and solar energy, which have no thermal losses; other losses are relatively small. Induction cooktops are the most expensive, however; they are often more expensive than the typical measure supported by EmPOWER, Maryland’s energy eiciency promotion program. Our calcula-tions have used a considerably higher cost for continued long-term eiciency improvements than the average of the present program (see notes to Table IX-5 in Chapter IX).
The approaches needed to transition gradually to heat pump water heaters, heat pump clothes dryers, and induction cooking include:
• Adoption of net zero energy standards for new buildings and major renovations that explicitly include cooking, clothes drying, and water heating.
• Incentives for induction cooking and heat pump clothes dryers.
• Induction cooking demonstrations.
• Use of induction cooking technology in public institutions, like schools, community colleges, public universities, and state and local government cafeterias.
84 A video review of heat pump water heaters is available on YouTube at https://www.youtube.com/watch?v=vKCsvRxpj2g (Matocha 2011).85 Energy Star water heater list is at http://www.energystar.gov/productinder/product/certiied-water-heaters/ (Energy Star
Water Heaters 2016).

53
Prosperous, Renewable Maryland
V. Transportation
In terms of primary energy use in 2011, the residential, commercial, and transportation sectors were each about 30 percent of Maryland’s energy use, with industrial energy use accounting for the rest (see Table II-1 above). Transportation is the single largest end use of fossil fuels, accounting for about 60 percent of the direct fossil fuel use in Maryland in 2011.86
Transportation consists of two broad categories: road transportation (including cars, trucks, buses, motorcycles) and non-road transportation, which is a very diverse category that includes every-thing from aircraft, diesel locomotives, and boats to tractors to lawn mowers.
Transportation is also a large contributor to air pollution. Air pollutants other than CO2 include
carbon monoxide, unburned hydrocarbons, nitrogen oxides, and particulates. In various combinations, these pollutants interact in the atmosphere and create ozone pollution. Transportation-related pollution increases the risk of respiratory and cardiopulmonary diseases, a problem that is more serious for low-income households, children, older people, and those with preexisting health problems.87 In fact, the transportation sector contributes disproportionately to air pollution. For the United States as a whole the EPA notes that:
“Today [September 2015], motor vehicles are responsible for nearly one half of smog-forming volatile organic compounds (VOCs), more than half of the nitrogen oxide (NOx) emissions, and about half of the toxic air pollutant emissions in the United States. Motor vehicles, including nonroad vehicles, now account for 75 percent of car-bon monoxide emissions nationwide.”88
Within transportation, the EPA has stated that the non-road sector, excluding aircraft contrib-utes “as much as 15 to 20 percent of unhealthy pollution in cities across the United States.”89
The entire road and non-road transportation (aircraft, lawn-mowers, tractors, etc.) sector is the largest contributor to Maryland’s greenhouse gas emissions: 33 percent of the gross and 37 percent of the net total GHG emissions in 2006.90 Achieving deep reductions in CO
2 emissions from the transpor-
tation sector is therefore essential for climate and energy policy.
Some combination of various possible approaches will likely be needed.
86 The various oicial sources for transportation energy (U.S Energy Information Administration, the Maryland Green-house Gas Inventory), are not fully consistent with one another. We have used our best estimate based on these oicial sources for our calculations relating to the transition to mainly electric transportation.87 EPA Transportation 2014, p. 388 EPA Transportation 2015 89 EPA Transportation 1996. Standards for both non-road equipment and road vehicles have been tightened since 1996. The limit for unburned hydrocarbon emissions from Class I non-road equipment (engines less than 225 cc displacement volume, but non-hand-held) was reduced from 16 grams per kilowatt-hour, in 1997, to 10 grams per kilowatt-hour, in 2012. (EPA Nonroad Engines 2016)90 Maryland GHG Inventory 2012. The gross emissions do not include sinks.
54
V. Transportation
• Electriication;• Hydrogen in fuel cells as an alternative electriication approach – the hydrogen would be pro-
duced from renewable energy (mainly solar and wind);
• The use of hydrogen in existing engines;
• Potentially some combination of electricity, renewable hydrogen, and biofuels for aircraft and ships, and long-distance road transport.
With some exceptions, such as biofuels from waste cooking oil, biofuels are the least desirable option for a number of reasons, including
• Most biofuels, if used to replace most transportation petroleum, would take up vast amounts of land;
• Converting food crops, like corn, to fuels, like ethanol, competes with land for food and puts upward pressure on food prices;
• They are hydrocarbon fuels and generate some degree of air pollution;
• The net energy output is low in some cases, such as corn to ethanol fuel;
• Even when the net energy output (energy content of the liquid biofuel, less process energy inputs, compared to the energy content of the biomass raw material) is high, the overall ef-iciency of biofuels in converting solar energy to motive power is generally low, with possible exceptions of algae and some aquatic weeds.91 Two reasons are the low eiciency with which most plants convert sunlight into energy (accompanied by further losses in converting plants to ethanol) and the low eiciency of the conversion of hydrocarbon fuels to motive power of ve-hicles (see Chapter III, Section 4, above). As a result, the land area required for biofuels would likely be very large if they were to become a principal source of transportation fuel. However, some biofuels produced from non-crop, eicient renewable biomass,92 may be essential for aircraft and ships.
In light of the above, we focus our technical and economic evaluation mainly on electriication and renewable hydrogen produced by electrolysis of water. 93 These are far cleaner and economical or close to economical. But some sectors may need biofuels, notably aircraft and ships, unless hydrogen can be produced and used economically in these sectors.
Two technologies can provide an eicient and nearly pollution-free approach for producing motive power for transportation:
• Vehicles and other machines that are powered by electricity stored on board in batteries (sometimes supplemented by supercapacitors);
• Vehicles that are powered by hydrogen produced renewably, notably from solar and wind energy. Hydrogen can be used in fuel cells or burned as a fuel directly in internal combus-tion engines or turbines.
91 Makhijani 2010, Chapter 3, Sections C, D, and E. 92 See Chapter VI, Section 2.i, for a deinition and discussion of renewable energy, including the minimum conditions necessary for biomass to be considered renewable. 93 There are a number of ways to produce renewable hydrogen without producing electricity irst. However, only electroly-
sis, which splits water into its hydrogen and oxygen components, is currently advanced enough to enable a reliable cost
calculation. Most hydrogen requirements are currently met by using natural gas as a feedstock.

55
Prosperous, Renewable Maryland
Battery and fuel-cell powered vehicles are both electric vehicle technologies in the sense that the motive power at the wheels is provided by electric motors. In the case of battery-electric vehicles (BEVs), the batteries needed to be charged from a source of electricity external to the vehicle. Fuel cell vehicles carry hydrogen on board, which the fuel cells convert to electricity. The hydrogen combines with oxygen in the air to produce water in the course of electricity production.
In general, a large variety of battery-operated transportation machines from lawn-mowers to cars to delivery trucks to buses is now commercially available. Other electric transportation approach-es are in various stages of commercialization or (in the case of aircraft) in development.
This chapter does not aim to provide a transportation plan or system; it simply assumes a business-as-usual increase in miles travelled by car, public transport, motorcycle, aircraft, and rail. We also assume business-as-usual freight requirements. All of the “business-as-usual” requirements are projected in the same way – at the rate of household growth.
The transportation sector is evolving very rapidly, not only in relation to electriication of ve-hicles. Self-driving vehicles will very likely be common well before the end of the period studied here (2050), which could signiicantly increase the total miles driven. On the other hand, with denser living patterns in cities, walking and bicycling (including electric bicycles) may greatly reduce vehicle miles. Our aim here is not to make scenarios for the transportation sector as such; rather it is to model the impacts of the electriication of the transportation sector to the extent possible for the many beneits it would bring and to illustrate what is needed for deep reductions of GHG emissions.94 This analysis would be qualitatively valid for any transportation scenario; the main diferences between transpor-tation options for the purposes of energy analysis would be in the amount of electricity required for the sector and the type and amount of infrastructure needed. We have made substantial provision for electric vehicle infrastructure in estimating the costs of the Climate Protection Scenario. We have also included costs of strengthening the distribution system; this will be needed for electriication of transportation and for other reasons, including electriication of space heating and possible widespread adoption of distributed solar generation.
1. On-road transportation
i. Cars and light trucks
There are two types of electric cars,95 which go under the general rubric of plug-in vehicles (PEVs): battery-electric vehicles (BEVs) and plug-in hybrid electric vehicles (PHEVs), which are battery-powered vehicles whose range is extended by a complementary internal combustion engine typically powered by a hydrocarbon fuel, usually gasoline.
Cumulative worldwide sales of a variety of models amounted to about 1 million by September 2015.96 Cumulative U.S. sales amounted to about 400,000 by the end of 2015, with almost half of them being fully electric (“battery-electric vehicles, or BEVs) and the rest plug-in hybrids with range extended by petroleum. Figure V-1 shows the chart for cumulative sales of plug-in vehicles (PEVs) in the United States.
94 We refer the reader to the University of Maryland’s National Center for Smart Growth, which is creating a transporta-tion model. See http://www.smartgrowth.umd.edu/statetransportationmodel.html (NCSG 2016). Driving the Future (Oge 2015) is also an excellent resource both on the history and the future of the transportation sector.95 We include light trucks meant for personal transport in the category “cars” in this report.96 EV Obsession 2015

56
V. Transportation
Figure V-1: Cumulative sales of plug-in motor vehicles in the United States. Source: Wikimedia
PEV Sales 2016
By contrast, fuel cell vehicles are still in the early consumer testing phases; fuel cell buses have a longer track record. We hold no particular preference for either approach. However, it is much more straightforward to calculate costs of a conversion to a transportation system based on BEVs than on fuel cell vehicles. This applies both to the vehicles themselves and to the fueling/charging infrastruc-ture needed to support them. Further, BEVs are more ei cient overall than fuel-cell vehicles; in the latter a considerable amount of energy is lost in converting renewable electricity to hydrogen and then the hydrogen back to electricity in the fuel cell (on board the vehicle).97
The largest advantages of fuel cell vehicles at present are the much shorter fueling time com-pared to BEVs and the signii cantly larger range, since the vehicles carry their fuel on board (in the form of compressed hydrogen).
However, a number of recent signs point to BEVs becoming the more common technology. The most notable event has been the start of the mass production of the Chevy Bolt in late 2016. This car has an EPA-estimated range of 238 miles, price before rebates, $37,500.98
97 The principal technology available to convert solar or wind energy to hydrogen is electrolysis. In principle, solar energy
can be used to split water into hydrogen and oxygen directly without i rst generating electricity. However the methods to do so are still a considerable distance from commercialization. The current state of research into the various approaches
can be found on a webpage of the National Renewable Energy Laboratory at http://www.nrel.gov/hydrogen/proj_produc-
tion_delivery.html (NREL Hydrogen Production 2014). 98 See Chevrolet Bolt EV 2016, footnotes 2 and 3.
57
Prosperous, Renewable Maryland
There is no good way to project which particular approach will prevail for long-distance trucks (like Class 8 trucks that carry goods for thousands of miles) or some other specialized vehicles, like tractors. It is possible that some will be of the fuel cell type. The matter will likely be sorted out in a decade or less since both types of vehicles are developing rapidly.
Hybrid BEV-fuel cell vehicles are also possible; in fact they have been tried on a pilot basis. The French postal service, which has an extensive leet of electric vehicles, tested a fuel cell range ex-tender for its battery-powered delivery vehicles for use in mountainous areas.99 However, the decline in fuel cell costs for transportation applications may make hybrid BEV-fuel cell vehicles unattract-ive.100 For one thing, they would require both hydrogen and electric charging infrastructure.
Our analysis would not fundamentally change were fuel cell vehicles to become more widely used than plug-in vehicles, or if fuel-cell-BEV hybrids were used, provided the life cycle costs are comparable. The main diferences would be that:
• Somewhat more electricity would be required to produce hydrogen, unless an eicient and economical method is found to convert solar energy directly to hydrogen;
• Fuel cell vehicles have higher electricity requirements if the hydrogen is made by electrolysis. If economical BEVs of suicient range are not developed; this ineiciency would, in efect, be the cost of having acceptable range for renewably-fueled vehicles of all types.
• Of course, BEV range is a big issue, as is charging time. The unveiling of the Chevy Bolt (noted above) and the Tesla 3, with a $35,000 price tag, as well as other similar developments in electric vehicle cost and range have transformed the debate of electric vehicles. Norway is considering a mandate for all cars to be electric by 2025; about 15.5 percent of cars were al-ready electric by May 2015.101 The cost of the cars is expected to decline with mass production of the batteries and of the cars themselves. Since a car with 200-plus mile range is on ofer, the question is no longer whether electric cars will become mainstream, but when. At that time, the lower operating expenses and better driving experience is expected to lead to a demise of the market for new gasoline and diesel cars.102
Table V-1 shows a comparison of some technical and performance characteristics of gasoline, battery-electric, and fuel cell cars as of the models available in 2016.
99 Fuel Cell Today 2013 100 High volume (~500,000 units) production costs with 2013 technology were estimated by the DOE to be $55 per kW; the “ultimate” Department of Energy target for vehicular fuel cells is $30 per kW (Kurtz, Sprik, and Alkire 2014, Slide 25) 101 Bellona 2015. At the same time, Tesla’s high-end model has a range rating of about 300 miles. (King 2016)102 See, for instance, Feldman 2016.

58
V. Transportation
Table V-1: Comparison of gasoline, battery-electric, and fuel cell cars, 2016
Aspect Current ICE Battery electric (BEV) Fuel cell (FCV)
Fuel type Gasoline Electricity Hydrogen
Number of vehicle models
available287 13 3
Average fuel economy (Note
1) 23.3 mpg 105.2 mpge 58.5 mpge
Fuel economy range (Note 1) 12 - 50 mpg 84 - 119 mpge 50 - 67 mpge
Efective [fuel] cost per mile $0.10 $0.04 $0.09
Well-to-wheels GHG emis-
sions (grams/mile) (Note 2)356 - 409 214 260 - 364
Driving range (average) 418 mi 110 mi 289 mi
Driving range (min - max) 348 - 680 mi 62-257 mi 265 - 312 mi
Time to refuel ~ 5 min
20 - 30 min (DC Level
2) 3.5 - 12 hr (AC
Level 2)
5 - 30 min
Vehicle maintenance issues -
Lower maintenance
than gasoline; possible
battery replacement
required during vehicle
lifetime
Lower maintenance
than gasoline; high-
pressure tanks may
require inspection and
maintenance
Source: Green Car Congress 2016, from Schoettle and Sivak 2016. Notes by IEER. ICE stands for
internal combustion engine.
Note 1: Fuel economy for electric cars does not take into account losses at power plants.
Note 2: Well-to wheels emissions of grams of CO2-equivalent for electric cars (miles per gallon-
equivalent or “mpge”) relects the present electric grid. Emissions for electric vehicles will decrease as the grid becomes decarbonized. In a completely decarbonized grid, such as that envisioned in
this report for 2050, GHG emissions per mile would be zero. The wide range of fuel cell vehicle
emissions relects the range of hydrogen production, with the higher end of emissions representing hydrogen production from natural gas. The CO
2eq of hydrogen from natural gas would be higher if a
20-year warming potential were used as opposed to the usual 100-year value.
Note 3: Color coding represents an evaluation of the characteristic: Green: Best. Yellow: Middle. Red: Worst

59
Prosperous, Renewable Maryland
Figure V-2 shows an annual cost comparison of a battery-electric Nissan Leaf compared to a gasoline-powered, 4-cylinder, Toyota Camry, based on a Department of Energy data for 2016 models.
Figure V-2: Annual costs (for 5 years), Nissan Leaf (30 kWh battery pack) versus Toyota Camry (4-cylinder), 2016 models. Source: Comparison model at AFDC 2016 (http://www.afdc.energy.gov/calc/)
Battery costs are the largest single component of electric car cost. The cost of the entire battery pack is coming down rapidly. While there is some uncertainty about the precise cost of the Tesla or the GM Bolt, an industry expert (formerly of GM) estimates the Bolt battery cost at $215 per kWh and the Tesla 3 battery cost at $260 per kWh. However, Tesla itself has claimed the current (2016) Tesla S battery cost is less than $190 per kWh.103 The lower estimate means that the cost of a battery pack for a BEV rated at 200 miles would be $12,000 or less.
High performance characteristics, low-fuel cost, and low maintenance are all advantages of BEVs over gasoline vehicles (at any given cost level). Finally, deep decarbonization of the transporta-tion sector is essential for achieving deep greenhouse gas emission reductions.
We irst cover on-road transportation other than personal vehicles, followed by a discussion of the electriication of non-road transportation. We have based our modeling of the transportation sector on the assumption that all road transportation can be electriied using BEVs. As noted, if some vehicles are fuel-cell powered, rather than BEVs, because of range, the results will be similar except that the electricity requirements would be somewhat higher.
ii. Other road transport
Other types of electric vehicles are also being commercialized. With a $300 per kWh battery cost, electric school buses may save school districts money even if the health beneits were not taken
103 Voelcker 2016

60
V. Transportation
into account.104 Pollution would also be reduced, including near schools. Financing is an issue given the higher irst cost of electric buses. Electric school buses could also be used as storage devices for the grid in the summers and in the evening and night.
Short-distance and medium-distance electric trucks and electric buses are already available for public transport. Such buses have been tested in many cities around the world. They are now in the early stages of commercialization. For instance, Chicago took delivery of two electric buses for testing in October 2014. The test phase has been successful. The two buses carried 100,000 passengers and ran for 25,000 combined miles. The Chicago Transit Authority estimates that fuel cost savings per bus will be $25,000 per year; the battery packs are expected to last the 12-year life of the buses. The Transit Authority plans to purchase 20 to 30 electric buses for regular use. First cost is still an issue – and the Authority will seek federal assistance for the purchase.105 Figure V-3 shows a Berlin electric bus that can be charged wirelessly. After trials, the buses began routine service, including exclusive use on one line, in Berlin on August 31, 2015.106
Figure V-3: Wirelessly charged electric bus pilot project in Berlin, Germany. This is a
Solaris Urbino 12 electric bus. Source: Bombardier 2015
Intercity heavy-duty trucking is more of a question mark at the present time. However, there is rapid progress even in this area. Figure V-4 shows four Class 8 intercity electric trucks (80,000 pound capacity) that have operated for a year between Los Angeles and San Diego, including while carry-
104 Noel and McCormack 2014. Of course, the savings would depend, in part, on future oil prices.105 Edelstein 2016106 BVG 2015

61
Prosperous, Renewable Maryland
ing full loads.107 It is recognized of course that the range of these trucks is still quite limited for many intercity uses.
Figure V-4: Intercity electric Class 8 trucks with 80,000 pound capacity. Source: TransPower 2015, at http://www.transpowerusa.com/press-releases/16-million-in-new-orders-for-transpower-trucks-and-tractors.
The state of electric vehicle technology and commercialization provides suicient basis to proceed to examine the implications of an essentially all-electric on-road transportation system. The purpose here is not to predict the transportation characteristics of a future system but rather to exam-ine the electricity system and cost implications.
2. Non-road transport A signiicant fraction – about 14 percent in 2011 – of energy use in the transportation sector
is in the “non-road” category, which consists of a vast array of end uses. Jet fuel was about a fourth of the non-road total; this translates into 3.6 percent of transportation energy, and just over 1 percent of all primary energy use in Maryland in 2011. But it is the fastest growing major use of fossil fuels.
The rest of the non-road category includes everything from lawn mowers, leaf blowers, and other lawn-related equipment, ships and boats, rail transport, tractors, construction equipment, logging equipment, and more.108
Non-road petroleum use constituted about 8 percent of Maryland’s energy-related greenhouse gas emissions. It will not be possible to achieve the 2050 goal of 90 percent reduction in GHG emis-sions by 2050 (relative to 2006) without substantially reducing the non-road emission component.
107 TransPower 2015 108 Strictly speaking, devices such as lawn mowers and leaf blowers are not “transportation.” However, there are oicially grouped under non-road transportation for purposes of energy and emissions accounting. We follow the same convention in this report.

62
V. Transportation
Of the major non-road petroleum uses, converting aircraft to renewable fuels is the most com-plex. Biofuels take a large amount of land (as noted above) and cellulosic biofuels have proved dif-i cult to commercialize. Large jet aircraft have been operated on hydrogen, but there is not much ongoing work to commercialize this approach.109 There is however a considerable amount of work on electric aircraft and hybrid electric-hydrocarbon fuel aircraft. The National Aeronautics and Space Administration, among others, is doing signii cant research and development on electric aircraft and has a “plan to help a signii cant portion of the aircraft industry transition to electrical propulsion within the next decade.”110 We have not included a transition to electric or hybrid aircraft in our modeling since the technology is, overall, some distance from commercialization. Cost and energy requirement calculations are therefore dii cult and would contain some element of speculation. We also exclude conversion of boats (and ships) to electricity, though research is being done on hydrogen-fueled ships and boats, including those with fuel-cell powered electric propulsion. There may be rapid progress on this front. France is building the $4.7 million “Energy Observer”; it will be powered entirely by wind and solar energy. Storage will be provided by electrolytic hydrogen and propulsion by fuel cell gener-ated electricity. A six-year voyage to 50 countries and 101 ports is planned. The boat, a catamaran, is under construction.111 There are also other designs in the works.112
The rest of the sector consists of equipment that can be largely or completely electrii ed; much of the non-road sector already has commercially available electrical equivalents of petroleum-fueled machines. Battery-powered lawn mowers that compare in performance with gasoline-powered mow-ers are, for instance, available; the range of the electric machines is restricted to less than one-third of an acre. However, this issue is similar to the range problem for electric cars – if the latter is resolved the former will be too. Electric leaf blowers are also commercially available. Figure V-5 shows a battery-powered lawn mower and a battery-powered leaf-blower.113
Figure V-5: Electric Lawn Mower and Electric Leaf Blower.
“60420 Earthwise 40 Volt Lithium Cordless 20″ Electric Mower (Source: Earthwise 2016;
used with permission) and Electric Leaf Blower EGO POWER+ 480 LB4801 (Source: EGO
2016; used with permission)
109 See Makhijani 2010, pp. 84-88, for a discussion of aircraft fuels, including hydrogen.110 NASA 2015111 Energy Observer 2016 and Chow 2016 112 A variety of zero emission or low-emission ships designs are being developed. See Marine Insight 2016 for examples.113 For small lawns, electric mowers with long extension cords powered by grid electricity from a household outlet have
long been available.

63
Prosperous, Renewable Maryland
Electric forklifts have been around for a long time and their numbers are growing. Their mar-ket share was already high about thirty years ago, at 40 percent; it had risen to 60 percent in 2010.114
Forklifts can be classiied by type and fuel:115
• Classes 1, 2, and 3 are electric, with class 3 forklifts being the lightest and class 1 forklifts being the heaviest
• Classes 4 and 5 have internal combustion engines using mostly propane but also natural gas, gasoline, and diesel
Generally electric forklifts have been designed for indoor use, but lately some models are outitted with tires designed for outdoor work.116 The two main reasons for the absence of outdoors forklift trucks are: the need for additional weatherization to protect against wet conditions and the fact that the battery needs to be recharged every 8 hours.117 Both increase the purchase cost. How-ever with the rapid progress made in battery manufacturing this problem should cease to exist. In fact according to EPRI “electric lift trucks operate as well as or better than their internal combustion counterparts in many of the same applications.”118
Other equipment, such as large dockside cranes are also available in electric models.119
However, it should be noted that not all electric non-road equipment is available at prices that would make life cycle costs comparable to machines that use fossil fuels. Riding lawn mowers and tractors belong in this category. While improvement of batteries will make non-road equipment much more attractive, especially when maintenance, pollution, noise, and CO
2 pollution are taken into ac-
count, the sector is so complex and diverse that we have assumed that only about 70 percent of non-road, non-aircraft energy use can be electriied. As with on-road vehicles, this allows us to explore the electricity sector in more detail. If fuel cell technology develops rapidly, this could become an alternate route to powering the non-road sector, including farm equipment, with renewable energy.
Table V-2 shows the speciications of a Caterpillar 2EP1100 with an 11,000 pound load ca-pacity and 80 volts. There are also models with smaller capacities.
Table V-2: Speciications for Caterpillar 2EP1100, designed for outdoor use
Model
Basic
Capacity
(lbs)
Maximum
Fork Height
Voltage
(or Fuel
Type)
Length
To Fork
Face
Chassis
Width
(in)
Chassis
Height
(in)
Gross
Weight
(lbs)
2EP11000 11,000 263 80 116.2 57.1 92.5 17,476
Source: Caterpillar 2016, Speciications
Figure V-6 is a photograph of an electric lift truck.
114 Yale 2010, p. 1 115 EPRI Forklifts 2015116 Bond 2013 and OSHA 2013117 LiftsRUs.com 2016 118 EPRI Electric Equipment 2013119 EPRI Cranes 2009

64
V. Transportation
Figure V-6: The Clark GEX 40/45/50 with an 80 volt power and load capacities of
8,000, 9,000, and 10,000 pounds. Source: Clark 2013. Courtesy of Clark Material
Handling Company
Overall, about 30 percent of the electricity generation in the year 2050 is estimated to be for transportation sector requirements. We have assumed continued petroleum use for all the requirements of the aircraft and boats sectors.
3. Connecting BEVs to the grid
The total electricity use for all on-road vehicles in 2050 will be substantial: about one-fourth of all electricity demand. We used the average of existing car eiciencies of models on ofer in 2015 and increased that modestly, according to the efect of reduction in battery weight as presently pro-jected over the next few years to determine demand in 2050. We estimate electricity requirements of the non-road sector by translating the gasoline and electricity requirements for typical cars using that comparison to convert non-road petroleum to non-road electricity. This is evidently very approximate; however, the total electricity involved in the non-road sector is well under 2 percent of the total genera-tion for all uses; errors in this component will therefore not afect the overall result materially, within the context of our calculations.
The greater diiculty is in the assumptions about when people will charge their vehicles. To-day’s patterns, when there are very few electric vehicles and, for the most part, residential electricity rates that are not geared to time of use, are not a suitable guide. The grid-of-the-future (See Chapter VIII) will require variable rates and demand response – beneiting those who can charge their vehicles (and/or use other appliances) at times when electricity availability in plentiful (such as windy and sunny summer days) compared to still summer or winter nights.
Electriication of the transportation sector (both road and non-road) will provide ample op-portunities for demand response. Devices like buses, cars, lawn mowers, and leaf blowers could be

65
Prosperous, Renewable Maryland
prospectively charged, with the electricity being provided to the grid when needed and as compatible with the users’ restrictions on the minimum amount of charge needed that particular day.
For instance, school buses could be used for vehicle-to-grid technology (V2G) operations. Noel and McCormack estimate that school buses could be available for V2G power exchanges for over 18 hours per day on school days and all 24 hours on weekends120 (during which one would ex-pect both charging from and discharging into the grid). They could be used even more extensively during vacation periods during the summer and at the end of the year. These are the periods when air-conditioning and heating demand would be high. Electric school buses could also be used as storage devices for the grid during evening and nighttime hours. This could be an important consideration in the long term, when space heating is electriied, since peak demand relative to renewable energy avail-ability will tend to occur during winter evenings or during winter nights. Similarly, battery-electric lawn equipment could be used from November through March for V2G type of operations, not just on an intra-day basis but on a weekly or even seasonal basis.
Maryland has already made some progress in creating electric car charging infrastructure, a principal need for the transformation to an electriied transportation system. Maryland has also es-tablished an Electric Vehicle Infrastructure Council in 2011. Its mandate, scheduled to expire in June 2015, was extended to June 2020 in the 2015 legislative session.121
4. BiofuelsThe United States has a large mandate for ethanol, but this is mainly from corn. Converting
food to fuel is a poor choice of technology from a number of points of view, including these three:
• The net energy output – energy output minus the energy input – is low. There are a variety of estimates, but a net energy of about 20 percent appears reasonable.122 On this basis, the net con-version eiciency of solar energy to ethanol is only about 0.04 percent, more than two orders of magnitude lower than solar electric generation. The eiciency of converting ethanol into mo-tive power, is typically only 20 percent (see Chapter III, Section 4). So the overall eiciency of corn to motive power is less than 0.01 percent. The net eiciency of converting solar energy to electricity using commercially available panels and including space between panel rows, and all losses, is about 4 percent – or 400 times higher.123
• Using food to make fuel puts upward pressure on food prices in the United States and abroad. This is not in the spirit of Article 2 of the Paris Agreement on climate change which states in part that the Parties’ actions should be “in the context of sustainable development and eforts to eradicate poverty” and that greenhouse gas emissions should be reduced “in a manner that does not threaten food production.”124
120 Noel and McCormack 2014, Table (pp. 2-3)121 See Maryland EVIC 2016 (http://www.mdot.maryland.gov/oice_of_planning_and_capital_programming/electric_ve-hicle/about_the_council.html) and for the extension of the mandate, see Maryland Senate Bill 714 (2015) (http://mgaleg.maryland.gov/webmga/frmMain.aspx?id=sb0714&stab=01&pid=billpage&tab=subject3&ys=2015RS). 122 Rounded up from 19 percent, the “Ethanol Today” value in Figure 2 of Farrell et al. 2006.123 Losses include losses conversion from DC to AC and back to DC current as well as transmission and distribution losses. 124 Paris Agreement 2015, Article 2

66
V. Transportation
• It takes a huge amount of land. The 2016 U.S. mandate of 14.5 billion gallons of corn ethanol125 will take up about 30 million acres of land.126 This land, were it used to generate solar electricity, could generate three times as much as the entire current electricity requirements of the United States. This is a heuristic calculation, made to illustrate the amount of land involved rather than to suggest that all that land be used for electricity generation.
Cellulosic biofuels have the potential of improving the eiciency of biofuels several-fold, but none are likely to approach the eiciency of using solar electricity in electric vehicles. Still, to date, liquid fuels retain the huge advantage of higher energy density; their use in aircraft and ships may take some time to displace. Developing eicient biofuels not based on food, for limited uses therefore con-tinues to be important. Speciically, biomass such as algae used to make biofuels may be an important part of reducing greenhouse gas emissions, provided the criteria for renewable energy are met. The replacement of the carbon in new biomass must be at the same rate and in the same year as the use of the biofuel. And there must not be an increase of carbon emissions from the soil. (See Chapter VI, Section 2.i, for further discussion of the deinition of renewable energy.)
When all is said and done, liquid fuel use in internal combustion engines will remain much less eicient than electricity as a source of motive power. Therefore, parallel development of fuel cell and electricity approaches to all transportation including aircraft and boats, will remain important. If successful, there would be little or no need for biofuels.
125 80 FR 77420-77518 (2015-12-14), p. 77488126 Thirty million acres was calculated based on the following sources: 80 FR 77420-77518 (2015-12-14), p. 77488; EIA
Corn Ethanol 2015; and Thiesse 2014.

67
Prosperous, Renewable Maryland
VI. The electricity system
1. Introduction The electricity system will essentially be the energy system of the future, with small supple-
ments of gaseous, liquid, and, potentially, solid fuel sources. The main reason is that the vast majority of direct fuel uses must be converted to electricity if energy-sector GHG emissions are to be reliably and economically reduced. Speciically, direct use of fossil fuels in buildings and in transportation must be electriied to the extent possible.
Maryland’s electricity grid is a part of the PJM grid that also includes Pennsylvania, New Jersey, Delaware, the District of Columbia, almost all of Virginia, and parts of other states (13 in all), including the Chicago metropolitan area.127 Figure VI-1 shows the oicial map of the PJM region, as published by the Federal Energy Regulatory Commission.
Figure VI-1: The region covered by the PJM grid. Source: FERC PJM 2016, at http://www.ferc.gov/market-oversight/mkt-electric/pjm.asp
127 See PJM 2016.

68
VI. The electricity system
The PJM grid is part of the larger interconnected electricity system in the Eastern United States known as the Eastern Interconnection. Power lows in this region are vast and complex; the Eastern Interconnection is therefore divided up into regions; in each region, Regional Transmission Organizations (RTOs), such as PJM, manage electricity lows and ensure reliability of supply both in the immediate moment-to-moment sense and over the years. The latter aspect includes assessing the interconnection of new power plants and the retirement of obsolete or uneconomical ones, according to the proposals presented to it by plant owners and developers. There are also electricity transfers between RTO regions within the Eastern Interconnection.
The structure of grid management in the PJM region has been determined by the deregulation of the electricity sector. It was created, among other things, as an independent entity to operate and manage “a competitive wholesale electricity market and …to ensure reliability” of the high-voltage portion of the grid.128 The RTOs manage the lows of electricity through the (high-voltage) transmis-sion system. State-level Public Service Commissions (PSCs) in the region oversee the distribution of that electricity to almost all end users, within their respective states. Most of that distribution is done by investor-owned companies, but there also a number of cooperatives and municipal utilities in Maryland. Cooperatives and municipal utilities are sometimes, but not always, regulated by state-level PSCs.
Merchant generating companies bid their available capacity into the grid. It is the RTO’s re-sponsibility to ensure that suicient capacity (both generation and transmission) is available to meet demand at all times. Within any state that has deregulated their electricity supply, the Public Service Commission must ensure that distribution utilities, which own essentially no generation but own the network of distribution wires and other equipment, can provide service at the most afordable prices consistent with reliability. There is an hourly and daily spot market for electricity as well. Investor-owned regulated distribution utilities are guaranteed a rate of return on their investment.
The peak load in the PJM grid in 2014 was 156,140 MW.129 The weather-normalized peak load in 2015 was 150,295 MW.130 The EmPOWER Maryland energy eiciency program target for the peak load for the state in 2015 was 13,130 MW; however, the actual weather-normalized peak load in 2015 was about 14,200 MW,131 which makes the Maryland peak load about 9.4 percent of PJM total. In other words, Maryland is a relatively small part of PJM; it has been an electricity importer and that fraction has been increasing. In 2013, 46 percent of Maryland’s electricity requirements were met by imports from other states, as noted in Chapter II, Section 3.
Maryland possesses a great deal of lexibility as a result of being a small part of the PJM grid. It could just as easily become an electricity exporter, provided it had the right economical mix of gen-eration that would enable generation owners to successfully participate in PJM’s wholesale markets. It could greatly increase its variable renewable electricity (solar and wind) generation by enacting am-bitious targets. In a future with high penetration of renewable electricity, Maryland could balance its requirements by purchasing from other states when the variable supply falls short, by building storage, by ofering demand response within the state, and various combinations of these resources.
In 2011, about half of Maryland’s primary energy consumption was for electricity generation and its transmission and distribution to users (see Figure II-1 above, with details in Figure III-6). As
128 PJM 2016129 PJM 2015, p. 2130 PJM Peaks 2015 131 PSC’s 2016 EmPOWER Maryland Energy Eiciency Act Standard Report, available at http://www.psc.state.md.us/wp-
content/uploads/2016-EmPOWER-Maryland-Energy-Eiciency-Act-Standard-Report.pdf (Maryland PSC EmPOWER
2016, Table 30 (p. 35)). Calculated by IEER from Maryland PSC EmPOWER 2016, Table 30.

69
Prosperous, Renewable Maryland
discussed in Chapter III, Section 1, about two-thirds of the primary energy used for electricity genera-tion is discharged as waste heat at power plants, mainly coal and nuclear plants (both in and out of state). Natural gas power plants also contribute to Maryland’s electricity supply. About 5 to 6 percent of the overall power plant output is lost in transmission and distribution; as a result only about 31 per-cent of the energy input to the electricity sector reaches inal consumers. This is quite typical of most of the United States, notably in the eastern region where solar and wind energy are less developed than in the West, notably California. On top of that, as discussed in Chapter III, much of the electricity is wasted at the point of use in ineicient equipment.
In this chapter, we consider the elements of a roadmap for the transition of the electricity sector to a zero emissions system by the year 2050 that is more resilient than the one we have today. We also examine milestones for the year 2030. The year 2040 can be interpolated between 2030 and 2040. This transition includes the eicient electriication by the year 2050 of almost all residential space and wa-ter heating and of most commercial space heating (see Chapter IV) to the extent the latter is not served by combined heat and power systems. It also includes the electriication of the road transport sector and of much of the non-road transport sector (see Chapter V). We will put these elements together as a roadmap to 2030 and 2050 in the next chapter (Chapter VII), and then examine the technical integra-tion and cost aspects in subsequent chapters (Chapters VIII and IX).
2. Renewable resources for the electricity sectorThe main renewable energy resources in Maryland, and more generally in the Eastern United
States, are solar and wind; the latter has two distinct subcategories: onshore wind and ofshore wind. Indeed, based on presently available technology, Maryland has over ten times more technical
potential for solar and wind electricity compared to the projected requirements for 2050. The ratio of technical potential to requirements will likely increase with time because both wind and solar tech-nologies are evolving to be able to produce more from the same land area. For instance, the reference eiciency that the National Renewable Energy Laboratory used to calculate technical potential for solar photovoltaic generation in its 2012 report was 13.5 percent.132 Panels with greater than 20 percent eiciency are already available;133 eiciencies have been demonstrated to be more than double that,134 though these very high eiciency panels are not yet cost competitive.
Table VI-1 shows the components of wind and solar energy resources in Maryland and com-pares them with 2011 electricity use and estimated electricity use in the 2050 Climate Protection Scenario. It is clear that even when essentially all energy functions, including transportation and space heating in buildings, are electriied, the electricity requirements estimated for the year 2050 in the Climate Protection Scenario are a small fraction of the technical potential of renewable and wind en-ergy. This is reasonable, since, typically, only a small fraction of technical potential can be realized. It should be noted that this fraction is policy- and technology-dependent.
For instance, urban solar energy potential at 20 percent panel eiciency, which is available today, could provide over half of the 2050 electricity requirements. Increasing panel eiciency has the potential to reduce costs of solar installations of all kinds, since it also reduces the requirements for ancillary hardware and for installation labor. Of course it also reduces the land area needed for a given amount of solar energy.
132 NREL Potentials 2012, p. 4133 Mittal 2015134 NREL Solar Cells 2016

70
VI. The electricity system
Table VI-1: Maryland technical potential of solar and wind energy in GWh/year and in comparison
with 2011 and Climate Protection Scenario (CPS) 2050 electricity requirements
Low estimate
GWh/y High estimate GWh/y
Urban utility scale solar PV (Note 1) 29,000 43,000
Rural utility scale solar PV (Note 1) 586,000 868,000
Urban rooftop solar PV (Note 1) 15,000 22,000
Onshore wind (Note 2) 31,000 55,000
Ofshore wind 201,000 201,000
Total technical potential, supply 862,000 1,189,000
2011 electricity generation requirements,
including losses 69,000 69,000
Supply technical potential compared to 2011
requirements 1,249% 1,723%
Estimated 2050 generation requirements,
including losses, CPS 107,400 107,400
Supply technical potential compared to CPS
2050 requirements 803% 1,107%
Sources: Compiled by IEER from NREL Potentials 2012, Tables 2, 3, 4, 6, 7 and NREL 2008, Table
1 (for assumptions about panel eiciency), and NREL and AWS Truepower 2015 for onshore wind potential. For 2011 electricity requirements (rounded up, including losses and generation for self-
consumption), EIA States 2015 Maryland, Table 10. 2050 generation relects requirements that in-
clude conversion of most transportation and space and water heating to electricity.
Note 1: The low estimate is based on 13.5 percent panel eiciency; the high estimate on 20 percent panel eiciency.Note 2: The low onshore estimate is based on current technology with 110-meter hub height; the
high estimate is based on near-term technology at 140-meter hub height. Both use a 35 percent ca-
pacity factor, which is the lower bound estimated by NREL and AWS Truepower.
Wind turbine capacity factors and solar panel eiciency continue to improve; one may antici-pate that in 10 to 15 years, there will be much more lexibility in combining various resources together economically than there is with near-term prices and eiciencies. For instance, we have not included the technical potential for solar parking lot canopies. Eiciency of panels is likely to rise, further in-creasing technical potential. The balance of the various components will depend not only on their rela-tive price but also on the kinds and costs of storage and demand response technologies that are used when variable energy sources provide the primary energy supply.
Figure VI-2 shows the technical potential of distributed solar resources as well as onshore wind potential in Maryland. These in combination could provide most of the requirements of the Climate Protection Scenario and ensure suicient distributed resources for reslience as well as seasonal bal-ance of sumamr and winter supply.

71
Prosperous, Renewable Maryland
Figure VI-2: Maryland’s solar resources and onshore wind resources. For reference: 2011 requirements including losses about 69,000 GWh. Sources: Based on Table VI-1
Figure VI-3 shows that wind power locations with capacity factors of 35 percent using the emerging technology are available on a 10,000 square kilometer area of Maryland, which is about 30 percent of the area of the State. As with solar, there are land area constraints (see Chapter XI, Section 4).
The potential increase in capacity factor for wind means more than a reduction in land area required for a given amount of electricity generation. It means a large potential reduction in the cost of power; it also means that the variability of wind can be made much smaller; this would result in much smaller requirements and expense for electricity storage and demand response.
The prospect of high capacity factors (and hence lower costs) is even greater, considering the United States as a whole. Wind power with capacity factors of 50 percent or more is available in 3 mil-lion square kilometers of land (about 30 percent of the US land area of 9.8 million square kilometers); capacity factors of 60 percent or more characterize almost 2 million square kilometers (see Figure VI-4). Since Maryland is part of the Eastern Interconnection, imports of power from very high capacity factor areas such as South Dakota are possible.135
135 DOE WINDExchange 2015 (South Dakota)

72
VI. The electricity system
Fig
ure
VI-
3:
Rec
ent-
pas
t, p
rese
nt,
an
d n
ear-
futu
re w
ind p
ow
er c
apac
ity f
acto
rs v
ersu
s la
nd a
rea
for
Mar
yla
nd. Sourc
e: N
RE
L a
nd
AW
S T
ruep
ow
er,
at D
OE
WIN
DE
xch
ange
2015 (
Mar
yla
nd)

73
Prosperous, Renewable Maryland
Fig
ure
VI-
4:
Rec
ent-
past
, pre
sent
, and
nea
r-fu
ture
win
d po
wer
cap
acit
y fa
ctor
s ve
rsus
land
are
a fo
r 48
con
tigu
ous
U.S
. sta
tes.
S
ou
rce:
NR
EL
and
AW
S T
ruep
ower
, at D
OE
WIN
DE
xcha
nge
2015
(U
.S)

74
VI. The electricity system
One important consideration in the design of a renewable energy system based mainly on solar and wind is seasonal balance. Solar is plentiful in the summer but not in the winter. Maryland is for-tunate in that the of shore wind resource complements that pattern and is more plentiful in the winter. Figure VI-5 shows the monthly total generation for a 40-megawatt-peak solar and a 20-megwatt-peak of shore wind installation in Maryland. The summer-winter complementarity is evident. This feature helps reduce seasonal imbalances; however, the daily and weekly variability remains and must be dealt with in a variety of ways.
Finally, new hydropower resources are very limited; based on presently available data from the National Renewable Energy Laboratory, they may be locally useful but are not of a magnitude to con-tribute signii cantly to the overall electricity supply of the state.136 We have only included the existing hydropower source of 572 MW associated with Conowingo dam in the Climate Protection Scenario.137
Figure VI-5: Monthly total generation for a hypothetical 40 megawatt-peak solar and a 20
megawatt-peak of shore wind installation. Source: NREL data compiled by IEER
A transition to solar and wind as the main sources of electricity would eliminate the losses of heat associated with thermal generation stations because there is no steam cycle and no steam turbine. Some losses would remain, including transmission and distribution losses and losses in the conver-sion of DC electricity to AC (see Chapter VII). However, these are small compared to thermal losses in coal, nuclear, and natural gas plants. As a result, there is an automatic ei ciency gain in the transi-tion from thermal generation to solar and wind generation. Ei ciency gains at the point of use, as for instance in transitioning from incandescent bulbs to LEDs or from resistance heating to heat pumps, compound the increases in ei ciency.
136 NREL Hydropower 2004, bar chart on p. 3137 Exelon Conowingo 2016

75
Prosperous, Renewable Maryland
The transition to renewable energy will have seven components:
1. Mainly solar and wind generation, instead of mainly thermal generation.
2. A combination of distributed generation (mainly solar, supplemented by combined heat and power) and centralized generation by renewable resources (a combination of onshore and of-shore wind as well as utility-scale solar138), instead of mainly by fossil fuels.
3. Signiicant increases in the eiciency of electricity use.4. Increases in electricity requirements due to conversion of fossil fuel space heating, water heat-
ing, and transportation to eicient electric technologies.5. Storage of electricity (and energy) in various ways to deal with variability and to make the best
use of available resources.
6. A communications system that will parallel the grid to enable demand response and microgrid operation and management of distributed generation, demand response, and storage resources, and to provide consumers and consumer-producers with a much wider array of energy choices than available at present.
7. An increase in the services that energy provides to accommodate economic growth.
In this report we do not take into account changes in personal habits or changes in consump-tion patterns of goods desired. Changes in energy use as estimated here are meant to accommodate a business-as-usual economic model. For instance, we do not consider changes in the infrastructure of transportation to increase public transit or to accommodate bicycles, including electric bicycles, safely. There is a good case to be made for changing that model, but it would take us far aield from the scope of this report.
i. Deining renewable energy A principal goal of the analysis in this report is to create a roadmap for an energy system that is
“emissions-free” so far as greenhouse gases are concerned. We have deined this in practical terms as being a system where energy-related GHG emissions are at least 90 percent lower than some reference date. We have used 2006 as the reference year, since that is the one used in the Maryland Greenhouse Gas Emissions Reduction Act.139
However, the criteria related to sustainability that we set forth in Chapter I, Section 5, are much broader. For instance, sustainability relates to the mining and processing of materials needed to build an emissions-free energy system. There is the issue of what happens at the backend of the system, when the energy system is decommissioned, and the wastes that result from decommissioning. Air pollution and water use are also major criteria for health and long-term sustainability.
A major consideration relates to whether the energy system is “renewable” – a term that goes beyond GHG emissions-free.
A consistent and careful deinition of “renewable energy” is needed to guide energy choices. Equally important, the rebates, carbon trading credits, and other inancial attributes that are or can be attached to “renewable” energy create practical questions of considerable importance and potential conlict along the road to an emissions-free system. 138 Note, however, that “utility-scale” solar is far smaller, 10 megawatts or more, compared to utility-scale fossil fuel plants, which are typically several hundred megawatts. Wind farms are usually in the range of few tens of megawatts to several hundred megawatts.139 Maryland GGRA 2009

76
VI. The electricity system
The Intergovernmental Panel on Climate Change (IPCC) has provided the essential ingredients of a deinition of “renewable energy” in its glossary:
Renewable energy (RE): Any form of energy from solar, geophysical, or biologi-
cal sources that is replenished by natural processes at a rate that equals or exceeds its
rate of use. For a more detailed description see Bioenergy, Solar energy, Hydropower,
Ocean, Geothermal, and Wind energy.140
This deinition excludes most of the fuels that are used in the energy system today. Fossil fuels are not renewable – they are not a source of energy “replenished by natural processes at a rate that equals or exceeds its rate of use”; rather, they were formed over millions or hundreds of millions of years and are being used up in decades or centuries. It is important to note that the total quantity of the resource is not part of the deinition. The total potential fossil fuel amount in the Earth may well be vast. For instance, increasing the investment in extraction via hydrofracturing, from tar sands, and from geologic formations under the oceans could greatly expand the extractable amounts of fossil hydrocarbons. But large or small, fossil fuels are not a renewable resource.
Similarly, nuclear ission relies on non-renewable resources – uranium-235, uranium-238,141 and thorium-232. In principle, uranium and thorium resources are plentiful, but they are not renew-able. Indeed, they are primordial materials that were present when the Earth was formed; they are not renewed by natural processes at all.
In contrast, wind and solar are essentially renewable – they must be used at a rate that is equal to or less than the natural rate of replenishment. That is not necessarily the case for biomass or even geothermal energy. Given the importance of these two sources, it is important to consider the matter in more detail. Renee Cho, a staf blogger at the Earth Institute of Columbia University, has framed the biomass issue well:
Whether or not biomass is truly carbon neutral depends on what type of biomass is used, the combustion technology, which fossil fuel is being replaced, and what forest management techniques are employed where the biomass is harvested. The combustion of both fossil fuels and biomass produce carbon dioxide. When short-term biomass is burned, such as annual crops, the amount of carbon generated can be taken up quickly by the growing of new plants. But when the biomass comes from wood and trees, not
140 IPCC5 Mitigation 2014, p. 1261. IPCC5 deines “bioenergy” as “Energy derived from any form of biomass such as recently living organisms or their metabolic by-products” (p. 1253). But this deinition is very general and not constrained by the renewable energy deinition. IPCC5 also contains an important deinition of primary energy: “Primary energy (also referred to as energy sources) is the energy stored in natural resources (e. g., coal, crude oil, natural gas, uranium, and
renewable sources). It is deined in several alternative ways. The International Energy Agency (IEA) utilizes the physical energy content method, which deines primary energy as energy that has not undergone any anthropogenic conversion. The method used in this IPCC5 report is the direct equivalent method (see Annex II.4 (pp. 1293-1295)), which counts one unit
of secondary energy provided from non-combustible sources as one unit of primary energy, but treats combustion energy
as the energy potential contained in fuels prior to treatment or combustion. Primary energy is transformed into secondary
energy by cleaning (natural gas), reining (crude oil to oil products) or by conversion into electricity or heat. When the secondary energy is delivered at the end-use facilities it is called inal energy (e. g., electricity at the wall outlet), where it becomes usable energy in supplying energy services (e. g., light)” (p. 1261). We have followed the IPCC convention in this report. Solar and wind energy are counted as primary energy as generated, while fossil fuels are counted as primary
energy at the point of production of the fuel. The heat generated from nuclear ission in a nuclear power reactor is counted as primary energy. 141 Uranium-238, the most abundant isotope of uranium, does not sustain chain reactions but can be converted into pluto-
nium-239, which does sustain chain reactions and can fuel nuclear reactors. Thorium-232 is also not a nuclear reactor fuel
but can be converted into uranium-233, which is.

77
Prosperous, Renewable Maryland
only can the regrowing and thus the recapture of carbon take years or decades, but also, the carbon equation must take into consideration carbon the trees would have naturally stored if left untouched….[T]he notion that all biomass results in a 100% reduction of carbon emissions is wrong. Biomass can reduce carbon dioxide if fast growing crops are grown on otherwise unproductive land; in this case, the regrowth of the plants ofsets the carbon produced by the combustion of the crops. But cutting or clearing forests for energy, either to burn trees or to plant energy crops, releases carbon into the atmosphere that would have been sequestered if the trees had remained untouched, in addition to producing carbon in the combustion process, resulting in a net increase of CO
2.142
A case-by-case approach to determine the renewability of biomass is important. But a central criterion is necessary: the replacement time of carbon in new biomass must be in the same timeframe (or faster) as the use of the biomass. Since growing cycles are typically a year or a season, the biomass used as fuel (including biogas) must be replaced within a year or season to be considered renewable.
Soil carbon balance is a second necessary criterion for renewability of biomass. Palm oil is an important example of the problems that can occur with biomass use. When tropical forests are cleared and peat bogs exposed to create the plantations for its production, the carbon emissions can be larger than extracting and using petroleum, possibly even petroleum from tar sands.143
The assessment of fuels that derive from biomass, such as ethanol made from food crops or crop residues, must include the carbon emissions attributable to the conversion of biomass to ethanol (or other liquid fuels) as well as CO
2-equivalent emissions from other agricultural and industrial pro-
cesses, including nitrogen fertilizer application.
For these reasons, it is essential to add speciic constraints on biomass in the deinition of re-newable energy:
Biomass can only be considered renewable if the rate of replacement of carbon in bio-mass is the same as that emitted in the process of processing and use, within the year of processing and use, and if there is no net decrease in carbon stored in the soil as a result of biomass production.
The soil carbon constraint is important because (i) reductions in carbon stored in the soil can wholly or partially ofset any carbon beneit from biomass use, and (ii) increasing carbon stored in agricultural and forest soil is likely to be an important part of reducing greenhouse gases that have al-ready accumulated in the atmosphere. As we noted in Chapter I, a 1.5oC temperature limit will require removal of already emitted carbon. Therefore it is counterproductive to produce and use biomass as a fuel in ways that would decrease carbon stored in the soil.
Geothermal energy, used for electricity generation where underground thermal resources are of adequate quality, also illustrates the issue of rate of use: it is only strictly renewable if the rate of heat withdrawal is less than the rate of replenishment by inlow of heat into the geothermal reservoir from the interior of the Earth. If the withdrawal is too rapid, the ield must be abandoned because the diminishing amount of energy reduces viability of the site for energy production. However, unlike biomass, closed-loop geothermal energy releases no greenhouse gases and the ields can be expected to renew themselves after being left “fallow” for an appropriate period of time.144 Closed loop geother-
142 Cho 2011 143 See UCS 2013 and Green Car Congress 2012. 144 Open loop systems do have some CO
2 emissions. In addition, like all energy sources whose construction occurs in an
economy that uses fossil fuels, there are also CO2 emissions from the construction of geothermal power plants. (UCS 2012)

78
VI. The electricity system
mal energy can therefore be regarded as a constant or variable source of renewable energy depending on the rate of use.145
Zero carbon emissions are essential for sustainability but not suicient. Considerations relating to the front and back ends of energy production are also important. Mountaintop removal and vast coal ash ponds containing toxic materials are among the enduring byproducts of the production and use of coal. Likewise, uranium mine waste and mill tailings that contain radioactive materials with half-lives in the thousands of years are associated with nuclear fuel mining and processing; they will litter the landscape eons after the beneits of the energy produced have been enjoyed.146 Navajo lands in the U.S. Southwest are still contaminated with uranium mine wastes, with continuing serious adverse impacts on water and habitation.147
Intergenerational impacts are also a consideration at the back end. Spent fuel, the waste from nuclear energy generation, has radionuclides that last hundreds of thousands of years; some, like iodine-129, have half-lives in the millions of years. Severe accidents, like Chernobyl in 1986 and Fu-kushima in 2011, can destroy land, water, and other resources for generations. Thus, even an energy source that is relatively low carbon on a life-cycle basis, like nuclear energy, can damage resources in ways that render them non-usable and non-renewable over many generations.
Ecosystem renewability should also be included in assessing sustainability. It is an essential feature of functioning ecosystems that they tend to renew themselves based on continuous and natu-ral lows of energy and materials through them. Routine withdrawal of resources from ecosystems can disrupt and even destroy them. Water is perhaps the most important example. Coal and nuclear plants require vast amounts of water for cooling. In the speciic case of Maryland and the mid-Atlantic region, thermal generation is by far the single largest consumptive use of water in the Susquehanna River basin, accounting for almost three-fourths of the total consumption.148 At the same time that same river basin accounts for half of all the fresh water lows into the Chesapeake Bay,149 a “legendary resource” that is under “tremendous stress.”150
The technical aspects of renewability and, more broadly, sustainability are made more dif-icult by socio-economic aspects. We should note that trash, while often included in legal deinitions of renewable energy, is not “replenished by natural processes”; rather it is an artifact of a throwaway civilization. There is no “trash” in nature. In general, trash does not it the IPCC deinition of renew-able quoted above.
Maryland’s deinition of renewable energy is quite expansive. Renewable energy, eligible to be granted tradeable credits known as renewable energy credits (RECs), was deined when Maryland initially enacted its renewable portfolio standard law in 2004. Two levels or “tiers” of renewable en-ergy were deined: Tier 1 included solar; wind; biomass of various types but excluding old growth trees; biogas; ocean energy sources, like tides and waves; small (less than 30 megawatts) hydropower, geothermal; waste to energy; fuels derived from refuse and some other varieties of waste and biomass materials, fuel cells that use fuels from qualifying biomass or methane from landills or waste water
145 Geothermal energy stored in rocks or soil is also used as part of geothermal heat pump systems, also known as ground-
source heat pumps. There is no electricity generation in such systems; like all other heat pumps, they need a source of
electricity to operate them.146 Thorium-230 is the main contaminant in mill tailings, for instance. It has a half-life of over 75,000 years. It decays into
radium-226, which has a half-life of 1,600 years. 147 EPA Uranium 2013. For a historical account see Pasternak 2010. 148 Calculated from Susquehanna Comprehensive Plan 2015, p. 84. 149 Chesapeake Bay Program 2016 150 Chesapeake Bay Foundation 2009

79
Prosperous, Renewable Maryland
treatment plants. Tier 2 included existing hydropower, but that will no longer be eligible after 2018. One REC was deined as equaling one megawatt-hour of energy from these qualiied sources. To ful-ill their renewable energy obligations, Maryland’s energy suppliers had to acquire RECs equaling a speciied amount of generation deined as the “renewable portfolio” for that year.
A maximum value of $40 and $15 were set for each Tier 1 and Tier 2 REC, respectively; a spe-cial category of renewable energy credit was created for solar energy called Solar Renewable Energy Credit or SREC, with a much higher initial value of $450 (or 45 cents per kWh) that declined over time.151
Maryland allows suppliers to purchase renewable energy credits from entities that generate renewable energy, including from existing sources.152
Since biomass sources can be included, the ability to purchase RECs from existing facilities has given rise to a situation where the carbon emissions from Maryland’s “Tier 1” renewables per unit of electricity production were higher than the average Maryland generation. This is a problematic situ-ation given that Maryland’s generation includes coal. The carbon content of Maryland’s Tier 1 RECs has also been consistently higher than the carbon content of electricity imported from the rest of the PJM grid. This is illustrated in Figure VI-6 (following page).
The actual carbon picture is more complex however. The carbon emissions shown in Figure VI-6 are counted at the point of combustion. However, this does not tell us whether the biomass was replaced in some way, by tree planting, for instance, and if that tree planting replaced the carbon at the same rate it was burned. Indeed, given the variety of biomass included in Tier 1 from wood pallets to black liquor (waste material created during paper manufacture), not to speak of refuse, it would be a very diicult task to come up with an overall carbon balance.
Another diiculty is that utilities can purchase RECs corresponding to existing electricity gen-eration from the qualiied fuel sources from anywhere in the PJM region and even somewhat beyond. As noted in Section 1 of this chapter, Maryland is just 9 percent of the PJM region; this has created a variety of opportunities to purchase RECs that have relatively high carbon content and also do not represent any new contribution to renewable generation. In other words, the existence of much of the “renewable energy” represented by RECs was not stimulated by Maryland’s renewable energy law. In efect Maryland is exporting a good deal of money to purchase RECs from existing facilities in or near the PJM region outside the state without actually ensuring the growth of renewable energy generation.
A part of the rationale of including existing biomass sources was to provide subsidies to in-dustries like paper mills, including one within the State. But the Tier 1 deinition that includes exist-ing biomass sources has had a paradoxical result that Maryland is importing high carbon RECs and exporting money out of the state; this provides neither climate nor economic beneits to the State. Change to a technically sound deinition of renewable energy should be accompanied by simultane-ously adopting a Just Transition plan that would create jobs in adversely afected communities before they are lost (see Chapter X, Section 5 and Attachment C).
It is essential for Maryland to tighten its deinition of renewable energy to conform to the IPCC deinition. The term “renewable energy” should be restricted to wind (onshore and ofshore), solar (electric and thermal), ocean, geothermal (within limits of natural replenishment), and small hydro-power installations. Given the complex history of the term “renewable energy” in the State, Maryland could start with a predeined baseline year in the past beyond which existing facilities will not be
151 Maryland Public Utilities Statute 2015, Sections 7-701 through 7-705152 Maryland Public Utilities Statute 2015, Section 7-704(a)(1)(i)

80
VI. The electricity system
Figure VI-6: Carbon intensity of Maryland electricity sources.
Source: Lucas 2015, Slide 14. Note: REC stands for “Renewable Energy Credit.” counted towards the fuli llment of RPS requirements. No a priori inclusion of biomass resources un-der the rubric of “renewable energy” is warranted. As noted, biomass is a complex issue that requires case-by-case consideration. It can be included only when strict criteria of renewability for biomass (including soil carbon) discussed above are demonstrably met.
As we have shown, Maryland has ample wind and solar resources. It can also import wind and solar energy from other parts of the Eastern Interconnection (transmission capacity permitting). It is possible to build an af ordable and reliable energy sector by 2050 that relies almost completely or even completely on these two resources, given appropriate complementary technical resources like ei ciency, demand response, and storage capacity.

81
Prosperous, Renewable Maryland
3. Eiciency Eiciency is generally recognized as the most economical resource for providing energy ser-
vices. The EmPOWER program is Maryland’s main vehicle for increasing eiciency in the electricity and natural gas sectors. The EmPOWER program began in 2009. Its goals were “to achieve a 15% reduction in per capita electricity consumption and a 15% reduction in per capita peak demand by the end of 2015, derived from a 2007 electricity consumption baseline.”153 Of the 15 percent in electricity consumption reduction, utilities were responsible for 10 percent, while State actions were expected to accomplish the other 5 percent. Maryland’s accomplishments to 2015 and projections out to 2017 are shown in Figure VI-7.
Figure VI-7: Maryland business-as-usual forecast, eiciency (EmPOWER) goals, and actual electricity sales. Source: Lucas 2015, slide 6
The cost of these accomplishments has been very low – just 3.5 to 4.5 cents per kWh of elec-tricity, including the marginal cost of more eicient appliances and utility rebates (and associated administrative costs) that are used to incentivize electricity savings.154 Thus, so far saving electricity has had a total cost of just one-third the average retail price of electricity of 11.66 cents per kWh in the year 2013.155 Figure VI-7 indicates almost 10 million megawatt hours per year of savings in gross elec-
153 Maryland PSC EmPOWER 2016, p. 1154 Energy eiciency monetary cost is calculated by amortizing the irst cost increment of the eiciency measure over the savings expected over the life of the measure. So light bulb savings are amortized over the life of the new light bulb, air-conditioner savings over the life of the air-conditioner, etc. The irst cost increment is the added cost of the more eicient device compared to the normal device that people would buy in the absence of eiciency promotion.155 Lucas 2015, slide 9, for eiciency cost and EIA States 2015 Maryland, Table 8, for average electricity price. The ef-iciency cost is the total cost, and includes the added expenditure by the electricity user as well as the expenditures on incentives and administration of eiciency programs by utilities.

82
VI. The electricity system
tricity requirements (that is electricity use plus transmission and distribution losses) relative to 2007, or about 9 million MWh in retail sales. About 5.4 million MWh of this is estimated to be attributable to the EmPOWER program. At the average retail price of $121 per MWh, the total electricity savings provided an annual beneit in 2015 of almost $1.1 billion, of which about $650 million is attributable to the EmPOWER program. The value of peak demand reduction is in addition to the savings repre-sented by electricity use reductions.
The perspective in this report is for the long-term – to 2030 as an intermediate date on the way to deep reductions in GHG emissions by 2050. Figure VI-8 shows estimates of residential energy savings potential up to the year 2030 compared to the cost of those savings made by the American Physical Society. The eiciency measures are arranged in order of cost, with the height of the bar showing the cost per kWh of savings, and the width of the base showing the total savings potential, if implemented widely.
Figure VI-8: Supply curve for residential electricity eiciency improvements. Electricity savings are shown in terawatt-hours (TWh). One TWh is equal to one million megawatt-hours. Source: APS 2008, Figure 25 (p.76). Used with permission from the American Physical Society’s report: “Energy Future, Think Eiciency” (2008)
Table VI-2 shows the weighted average cost of eiciency calculated from the APS data. For instance, standards for more eicient water heaters would save about 40 million MWh (40 TWh) na-tionally at a cost of about 2.0 cents per kWh. Water heaters are an example of a product with a split incentive. In the case of rented homes, the savings from the lower electricity bills go to the tenant whereas the increased capital cost of the more eicient heaters will usually be borne by the landlord. Similarly, the national eiciency potential for residential lighting as estimated in 2008 was huge – 170 million MWh (170 TWh), at a cost of about 1.2 cents per kWh.156 The overall savings for the entire package of measures would amount to 2.6 times the cost in the year 2030.
156 Since then the costs of LED bulbs has declined dramatically. Economical energy reductions are now possible in lighting
compared to the device that previously was a symbol of eiciency: the compact luorescent lamp.

83
Prosperous, Renewable Maryland
The estimated weighted average cost of 2.6 cents per kWh only includes the costs incurred by the electricity consumer (“participant cost”); it does not include costs of incentives and associated administrative expenses of eiciency programs. The overall cost (“total resource cost”) of Maryland programs of 3.5 to 4.5 cents per kWh is in line with this average participant cost. Adding 1.5 cents per kWh to the cost of each kWh saved as shown in Table VI-2 still yields a total resource beneit to cost ratio of 2.0.
Table VI-2: Residential electricity savings estimates and corresponding total and weighted average cost per kWh for year 2030
Item
Sav-
ings,
TWh
Cost, cents/kWhTotal costs,
million 2007 $
Total annual
savings in 2030,
million 2007 $
(Note 1)
Color TV 67 0.8 $536 $5,762Lighting 169 1.2 $2,028 $13,858Other 74 1.8 $1,332 $5,624Water heating 39 2 $780 $2,886Clothes washer 4 2.2 $88 $288Space heater 28 3.2 $896 $1,736Furnace fans 10 3.5 $350 $590Personal computers 39 4.1 $1,599 $2,067Refrigeration 38 4.3 $1,634 $1,938Space cooling 89 5.2 $4,628 $3,738Dishwasher 1 5.7 $57 $37Freezer 9 7.4 $666 $180Totals (Note 2) 567 2.6 $14,853 $38,704
Source: Estimated from data in Figure VI-8 and Brown et al. 2008, Table 1 (p. 2).
Note 1: Savings are relative to the electricity price of 9.4 cents per kWh.
Note 2: The ratio of beneit (savings in electricity costs) to costs (the cost of the eiciency measures) of all measures taken together is about 2.6.
A more recent detailed national study by the American Council for an Energy-Eicient Econ-omy estimated the electricity savings in kilowatt-hours and the costs of those savings as well as the monetary beneits of those savings out to the year 2050. The study estimates that electricity use can be reduced relative to the business-as-usual scenario by about 41 percent in the residential sector.157 This is comparable to the APS estimate of 30 percent by 2030 in Figure VI-8, since savings and investments would continue after 2030.
For the 2050 Climate Protection Scenario, we made speciic evaluations of the eiciencies of the major end uses like space heating, water heating, air-conditioning, refrigerators, lighting, clothes washers and dryers, and dishwashers. We assumed an approximately 2 percent improvement per year in eiciency between 2015 and 2050 for the residual electricity load in the residential sector.
157 ACEEE Eiciency to 2050 (2012), Table 17 (p. 60). The study also estimates large savings in the direct use of fossil fuels due to building envelope and technology improvements.

84
VI. The electricity system
In addition, as discussed in Chapter IV, a transition to an emissions-free energy sector requires a transition out of direct fossil fuel use for space and water heating into eicient electric modes for accomplishing the same things. In general our approach has been to assume that the best currently available technology will be the average technology in 2050. This is a long-transition time and likely underestimates eiciency potential. However, it allows us to estimate cost more reliably especially for the more costly end-uses like heating and air-conditioning, where the added investments required are signiicant.
In addition to eiciency achieved by better appliances, lighting, and heating and cooling sys-tems, we also take account of building envelope improvements such as sealing leaks and installing weather stripping and added insulation. Here we assume a 30 percent reduction in heating and cool-ing requirements in existing residential structures and 20 percent for existing commercial structures by 2050158; implementation will be gradual. Greater reductions are possible; however, it is diicult to estimate the cost of such reductions on average for existing homes due to the wide variety of homes, diferent vintages, diferent condition of existing homes, and other factors. Here again, the eiciency improvements we have assumed are signiicant, but more could be done. One of the principal threads that runs through our approach to eiciency is that we should be able to reliably estimate the costs of the improvements based on presently available information.
Eiciency standards for appliances and buildings have been an efective way to improve per-formance and reduce cost. Standards, set with due attention to the state of technology and innovation potential in any particular area, can do far more than reduce energy use economically. They encourage innovation (provided there is competition to supply the particular item); energy use reduction can even be accompanied by reduction in the irst cost of the item.
Refrigerators are perhaps the most dramatic example of the efect of standards on improving performance and declining price of the appliance. Figure VI-9 shows the history of refrigerator per-formance, price, and the dates at which standards were set and tightened. This history is noteworthy in a number of ways. First, the standards were repeatedly updated. This indicates that the industry was not presented with a single giant leap to accomplish; yet the standards were at each stage ambitious enough to encourage innovation that allowed further tightening of eiciency requirements. Second, it was not the federal government but a state – California – that led the way, starting in 1976. The irst federal standard was not promulgated until 1990. Third, the price of refrigerators, in constant dollars, fell by more than half between 1972 and 2010, even as the energy consumption fell by almost four times. Fourth, while not shown in the chart, refrigerator manufacturers were able to handle the phase-out of the ozone depleting compound, CFC-12, that was used until the end of the 1980s to operate the refrigeration system and replace it with a non-ozone-depleting compound.159 Finally, these improve-ments occurred as the size of refrigerators was increasing. One can infer from the size and electricity consumption data in Figure VI-9 that the electricity consumption per cubic foot fell about 80 percent between 1972 and 2010. Refrigerator eiciency improvements continue.
158 In the scenario most comparable to the Climate Protection Scenario, ACEEE estimates that existing building envelopes
can be improved by 40 percent on average in the residential sector by 2050. (ACEEE Eiciency to 2050 (2012), Table 2 (p. 15)). In a comprehensive evaluation of commercial building envelope retroitting in three climates, an Air Force Institute of Technology master’s thesis concluded that cooling energy would be reduced between 10 and 17 percent and heating energy
between 42 and 94 percent using certain window technologies. (Pratt 2016, p. 88)159 The phase-out of CFCs and the introduction of replacement compounds for various end uses is discussed in Makhi-
jani and Gurney 1995. Unfortunately, most of the replacement compounds are greenhouse gases, as were the CFCs they
replaced.

85
Prosperous, Renewable Maryland
Figure VI-9: Refrigerator energy use, size, and price in constant dollars. Source: Appliance Stan-dard Awareness Project (ASAP 2015 Graph)
The overall conclusion is that standards helped the markets to function eiciently – without them, manufacturers would have little incentive to ofer more eicient products, since they don’t pay the energy bills and since consumers typically would have price, functionality, and appearance as more important considerations in their decisions.160 Moreover, the cost of electricity to run a refrigerator is quite low compared to the cost of the device itself. Thus, taxes on energy (or carbon) would have to be punitively high to have a material efect on eiciency. Alternatively, a tax could be imposed on ineicient devices. However, it would be diicult or impossible to know where to set the tax without detailed consideration of realistic technical potential for eiciency improvements. Such assessment would, moreover, have to be done periodically. In the meantime, the cost of refrigerators (or other appliances) would increase, afecting purchases negatively and hence also replacement of even more ineicient devices.
Eiciency standards, carefully considered, have been an excellent driver of steady reductions in energy use, of innovation, and, often, of reductions in price even as performance improves. Stan-
160 See, also, Goldstein 2011.

86
VI. The electricity system
dards also create a market for appliances that go beyond the minimum regulatory requirements. This is the foundation of the Energy Star system, which recognizes such appliances. Utility incentive rebates are often tied to the Energy Star label. The Energy Star program is estimated to have saved consumers a cumulative $295.4 billion up to the year 2013.161
4. Demand response
The electricity grid overall is a very inely tuned system that takes real-time control on the time scale of seconds in order to maintain an essentially continuous balance between supply and demand. Generators are spread out over vast geographic areas and number in the thousands. Consumers number in the tens of millions. In between there are a myriad nodes through which the electricity is channeled from the points of production to the points of consumption to ensure that each point of electricity use has exactly the right amount of electricity at all times. Vast computer networks with intricate informa-tion lows keep the system in balance.
Yet, in the present centralized electricity system, the main communication between consumers and producers is very limited; it occurs via an electric switch: when it is on, the utility provides the electrons; when it is of, the current is shut of. Each on-of switch is one bit of information; eight bits make a byte. Even if there were as many as 300 switches in each home (taking into account that each outlet can accommodate more than one device), the amount of information in the residential sector would amount to roughly 5 gigabytes. Assuming a similar number in the commercial and industrial sectors, the overall information content of communication capability between electricity producers and consumers would be about 15 gigabytes – about the size of a $10 lash drive. This extremely lim-ited communication between demand and supply results in a rather ineicient system: a large amount of electrical capacity is kept on standby for the vast majority of the time – often 90 percent or more of the time – to supply peak loads.
In the last two or three decades some improvement has been made in a few sectors. Program-mable thermostats convey information about the temperature preferences according to time of day, day of the week, season, and cost. Utilities ofer free programmable thermostats that can automatically cut of air-conditioning by the utility, by prior arrangement with the consumer, for brief periods of time – in return for compensation for the (presumed) discomfort. Occupancy sensors have become more common for turning of lights or changing temperature settings in rooms when no one is in. Some de-vices, like computers, go into a low-energy consumption “sleep mode” when no key has been tapped for some time.
This trend will have to be accelerated and deepened as the grid transitions to a supply provided mainly by wind and solar energy. The need for a parallel communication system in which demand is responsive to variable supply will lower the cost and increase the reliability of the system, while providing both consumers and suppliers with more options for the ways they consume and supply electricity and the ways they are compensated for it.
For example, it would be beneicial to the grid if dishwashers and clothes washers were run when wind and solar were in plentiful supply. Real time rates could be set so that it would be cheap to run them at such times; smart outlets and Wi-Fi controls, already available, could enable automatic operation at such times and allow for overriding and resetting of times when necessary or desirable. For the system to work, multiple new modes of communication, including between the consumer and the devices in the home, between the utility and the consumer will be necessary.
161 EPA Climate Protection 2015, p. 3

87
Prosperous, Renewable Maryland
A dense communication network operating in concert with the grid could enable demand re-sponse – that is, making the times when electricity for particular uses is demanded – a central part of the operation of the grid. Demand response will become much more central to grid operation as the number of electric vehicles and electric space and water heating systems increases.
The technology has advanced to the point that there is a term to describe a network of Internet connected devices, including appliances, heating and cooling systems, lights, and vehicles – the Inter-net of Things.162 We discuss these issues further in Chapter VIII on the Grid-of-the-Future.
5. StorageVery high penetration of variable sources will also require energy storage systems to function
reliably. A variety of energy storage systems are available including the following:
• Battery storage: this category includes battery storage systems that are built speciically to store electricity from the grid when available in excess and to supply it back to the grid when the demand is in excess of supply. While batteries can hold their charge for long periods, it is most economical to use them for weekly, daily, or hourly operations. That way they are repeatedly used and their cost can be spread over time with a signiicant amount of electricity alternately stored and supplied to the grid. This category can also include batteries that are normally used for other functions, such as electric vehicles or lawn mowers, but which can be deployed to support electricity grid operations. The technology to enable the former is called “vehicle-to-grid technology,” or “V2G” for short. They could also be used for longer-term storage, as for instance if lawn mower batteries are charged in the late fall and used during the most extreme peak period in the winter. Vehicles that are in long-term (on the order of months) storage could be used in the same way. Of course, the owner of the device gets a payment for the use of the battery.
• Flywheels: these are electro-mechanical devices, in which a cylinder is driven to high speeds by an electric motor when surplus electricity is available. When the grid needs electricity the motor serves as a generator, converting the energy stored in the motion of the lywheel back to electricity. Flywheels are useful to smooth out very short-term luctuations in supply, includ-ing for stabilizing frequency and voltage to within the narrow margins needed by a modern grid.
• Pumped hydropower storage: A pumped hydropower system has upper and lower reservoirs. Electric generators at the upper reservoir supply electricity when needed; in times of surplus supply, pumps at the lower end pump water back to the upper reservoir. The system functions essentially as a battery. However, in addition to losses associated with pumping the water back up, there are also losses of water due to evaporation. Pumped storage is a site-speciic large-scale storage technology that can be used for long-term storage of energy – daily, weekly, or even seasonally.
• Compressed air energy storage (CAES): Air under high pressure is stored in depleted oil or gas reservoirs, aquifers (as a high pressure bubble), salt caverns, or underground cavities excavated for the purpose. Compressors use electricity when surplus is available to pressur-ize the air and put it in the storage system. When electricity is needed, the high pressure air is withdrawn and reheated, usually with a small amount of natural gas; the hot high pressure air drives a gas turbine. The technology is commercial and has been in use in Germany since 1978
162 Weber et al. 2015 describes the role of the Internet in creating an automated oice that includes features that would allow extensive demand response capability.

88
VI. The electricity system
and in Alabama since 1991.163 Figure VI-10 shows a schematic diagram of a CAES system. Systems which use above ground tanks for compressed air storage are also available; these are useful for shorter term (days) storage purposes and have limited capacity relative to CAES systems with storage in caverns, salt domes, or aquifers. See Figure VII-13.
• Capacitors: These devices store energy in the form of static electric charge. They are use-ful for providing high power short bursts of electricity. In many situations, they are a good complement to batteries, which provide bulk electricity storage.
• Thermal energy storage: Both heat and coldness can be stored for later use.164 Ice-making devices are available to store coldness in the form of ice; the ice can then be used for air-con-ditioning. Such systems are useful for diurnal energy storage and for reducing peaks. Longer term thermal storage systems – called “seasonal thermal energy storage” are also available. They store heat in the summer or on warmer days in some kind of underground formation for use months later in the winter. Similarly they can store coldness for use in the summer. See Figures VII-14 to VII-17.
• Hydrogen: Energy can also be stored as hydrogen gas. If the gas is produced from solar and/or wind energy, its use to generate electricity or for motive power for vehicles becomes a zero-CO
2 emission technology. Hydrogen can be produced renewably by splitting water into its
hydrogen and oxygen components (“electrolysis”). Electrolysis is a well-understood technol-ogy; however, large-scale hydrogen production using electrolysis is still being commercial-ized. There are also other methods of renewable hydrogen production that are in the research phase, such as using solar energy to generate high temperatures to split water or mimicking photosynthesis to produce hydrogen directly from solar energy.
In this report we will consider batteries, compressed air energy storage, hydrogen, and seasonal thermal energy storage in the context of illustrating the range of technologies needed for a renewable electricity system and for estimating costs.
163 For more information see Makhijani 2010, pp. 69-71.164 See Drake Landing Solar Community 2011.

89
Prosperous, Renewable Maryland
Figure VI-10: Schematic of a compressed air energy storage system. Source: Sandia 2001
6. Combined heat and powerCombined heat and power systems are local power generation systems that use rejected heat to
provide space heating; reject heat can also be a source of energy for air-conditioning, for instance via the use of in absorption air-conditioning systems. (Such systems operate on the same principle as the old ammonia refrigerators.) CHP systems are systems are far more eicient than using fuel in central station coal and nuclear plants, natural gas for heating, and electricity for air-conditioning.165
Combined heat and power systems generally use natural gas as a fuel. Smaller systems use reciprocating gas engines, larger systems use gas turbines. In recent years, fuel cell systems are also used. The usual fuel for fuel cell CHP systems is also natural gas. The hydrogen that is needed for fuel cell operation is made from natural gas on site. However, fuel cell CHP systems do not need natural gas. They can be run on hydrogen alone – and the hydrogen can be made from renewable solar and/or wind energy. We incorporate CHP systems fueled by renewable hydrogen in the Climate Protection Scenario.
7. ResiliencyClimate change is expected to result in a greater frequency of more severe weather events
– and a foretaste of this future is being widely experienced already. The June 2012 North American derecho caused widespread outages, including in Maryland; some outages lasted for many days that stretched, in some cases, to weeks. Hurricane Sandy, later that year, caused even more widespread
165 The most advanced combined cycle natural gas power plants are much more eicient than coal or nuclear plants, though they are less eicient than the most advanced combined heat and power systems. CHP systems are also used in industry to provide electricity and process heat for plant applications. For a list of CHP systems in Maryland, see DOE CHP 2015.

90
VI. The electricity system
severe disruption, notably in the New York City and in New Jersey’s coastal areas. A resilient grid is now widely seen as necessary to protect against future severe losses and to provide for quick recovery. Figure VI-11 shows that the frequency of weather-related major power outages, involving 50,000 or more customers has increased many-fold since the turn of the century.
Figure VI-11: Weather-related and non-weather-related major power outages af ecting more than 50,000 customers. Source: NREL Resiliency 2014, Figure A, variant of graph from Climate Central,
at http://assets.climatecentral.org/ pdfs/PowerOutages.pdf (Kenward and Raja 2014, Figure 2 (p. 9))
The National Renewable Energy Laboratory has dei ned the “resiliency” property of the elec-tricity grid as having the following features:166
• Prevention of power disruption
• Protection of life and property dependent on electricity service
• Mitigation to limit the consequences of a power disruption
• Response to minimize the time needed to restore service
• Recovery of electricity supply.
The approach in the past has been to equip major essential facilities like hospitals or water supply systems with emergency generators that would kick in in case of a power outage. This does not provide sui cient protection and may not sui ce in cases of severe disruption when even fuel avail-ability may be in question. Moreover, the number of essential services has now multiplied to the point that such approaches are insui cient and costly. For instance, gas stations depend on power supply, as do grocery stores, and elevators in tall buildings. Prolonged power failures to this wider range of criti-cal community needs are no longer acceptable. Microgrids, which are local power supply systems that
166 NREL Resiliency 2014, p. 1. This is a quote.

91
Prosperous, Renewable Maryland
function in concert with the grid in normal times, and in isolation from the grid during power outages (“island mode”) are an essential component of a more resilient grid.
Microgrids have traditionally used natural gas generators, or natural gas combined heat and power (CHP) systems, to provide the mainstay of the local electricity supply. However, these systems have the disadvantage that they use a fossil fuel. Secondly, some disasters may result in a cut-of of natural gas supply to the microgrid, leading to complete power failure. Integrating local renewable generation – notably solar photovoltaic electricity – and battery storage (and possibly with thermal storage) are therefore critical considerations both for resiliency and for constructing an emissions-free energy system.
The importance of a combined approach to microgrid capability was illustrated in the imme-diate aftermath of the devastating March 11, 2011, earthquake and tsunami that, among other things, destroyed the electrical grid of the port of Sendai, Japan. A microgrid has been operating at the Tohoku Fukushi University since 2004. It has a natural gas generator, a solar PV system, and battery storage. The natural gas engine was started a day later using microgrid power.167
167 Hirose et al. 2013. The Sendai Microgrid operated as a demonstration project from 2004 to 2008. Note that the year in the chronology should be 2011, not 2012.

92
VII. Getting to an emissions-free energy system
VII. Getting to an emissions-free energy system
An emissions-free energy system of the future will, very likely, essentially be an electricity system, based on present as well as near-term technological prospects, land use constraints, and other considerations.168 We have discussed the elements that such an electricity system will need in Chapter VI. In this chapter, we discuss the technical aspects of how these elements need to be connected to form a coherent, reliable grid that has a variety of essential attributes – afordable, clean, equitable, socially just for workers and communities, including those that might be adversely afected, reliable and resilient, and democratic. We call this the “Climate Protection Scenario.” It is discussed in this and the next four chapters.
1. Introduction
We have adopted the following approach in constructing this roadmap for deep to 100 percent reductions in energy-related emissions:
• We consider a key intermediate date of 2030 and what needs to be accomplished by that time to lay the foundation for 90 percent or greater reductions in energy-related greenhouse gas emissions by 2050 (relative to 2006). We adopt the same approach to estimating emis-sions that is used by the State of Maryland in its Greenhouse Gas Inventory. We take the target of 25 percent reduction in GHG emissions by 2020 as a given. Our reference date for baseline energy data throughout is 2011.
• We evaluate an emissions-free energy scenario by 2050 in two steps:
We irst evaluate deep reductions (~90 percent relative to 2006) using technologies that are well established commercially, like solar, wind, and eiciency measures, and those technologies that are proven commercially but are not yet at the produc-tion scale but are foreseeable in the near future (less than 10 years), like batteries and electric vehicles. The costs of the latter are reasonably foreseeable since the efect of scaling up production of established technologies is well-understood.
We then outline the technologies and policies needed for eliminating the rest of the energy sector GHG emissions.
• We design our system to account for the fact that as the amounts of variable solar and wind supply increase, the peak is no longer deined by demand alone but by the demand in relation to variable supply. This means that the “peak” is now deined in relative terms (we use the term “relational peak”) rather than by the time of actual maximum demand for electricity.
168 It is possible that biofuels may play a signiicant role. However, for the reasons discussed in Chapter V, we have focused on electriication of transportation and heating rather than on a mix of electricity and biofuels.

93
Prosperous, Renewable Maryland
• We assume that Maryland’s two nuclear reactors would continue in operation until their licenses expire in the mid-2030s. The 2050 scenario has no nuclear energy in it. We also discuss contingencies for maintaining a declining emissions trajectory in case of early nuclear retirement and other contingencies. It is important to note in this context that all U.S. nuclear power reactors that have been shut down permanently have closed before the expiry of their operating licenses (including any extensions).169
• We use recent Maryland historical data and U.S. Energy Information Administration pro-jections to deine a “business-as-usual” scenario for comparison purposes (primary energy use, cost, GHG emissions).
This roadmap is not a forecast of actual technologies that will be in use, but rather an estimate based on currently available information and current and near-term technologies and costs. For in-stance, the cost and shape of the grid-of-the-future are based on present-day communications technol-ogy and projections of what it could achieve in the electricity sector. But it is likely that the capabilities per unit cost will be beyond what is presently available. Further, it is possible, even likely, that the role of distributed solar would be much larger than assumed in the Climate Protection Scenario, particu-larly as electricity storage costs decline in a manner similar to recent decreases in solar PV costs. The costs and technologies for a renewable grid-of-the-future should therefore be regarded as indicative minimums rather than as forecasts. In the real-world, the roadmap will need to be evaluated for course corrections every few years.170 We address a few of the practical considerations of planning for an emissions-free energy system in Section 7 of this chapter.
2. Roadmap to 2030There are three major components to the roadmap to 2030:
Evolution of the electricity sector with its present major demand components but with increas-ing eiciency and renewable energy, as well as signiicant progress towards a smart grid and resiliency infrastructure. The eiciency is estimated against a business-as-usual scenario in which electricity growth occurs at the rate of household growth. The growth data we use are based on state, Energy Information Administration data, and U.S. Census data.
Increased electricity demand from conversion of fossil fuel space and water heating to ei-cient electric systems. This includes only conversion of some fuel oil and propane systems on the assumption that natural gas systems, being the most economical of the fossil fuel heating systems, would continue until 2030. Their conversion to electricity would be in the 2030 to 2050 period. We assume 30 percent of the homes heated with fuel oil and propane would be converted to eicient electric systems.
Increased demand due to partial replacement of petroleum-fueled on-road and non-road trans-portation by electric devices. We assume that 5 percent of the vehicle miles will be electric (from a combination of plug-in hybrids and purely electric vehicles) by 2030.171
169 Shutdown dates are given in NRC Information Digest 2015, Appendix C. Initial commercial reactor licenses were for 40 years; most of them have been extended for another 20 years. All permanently closed reactors were shut down prior to either the 40-year or 60-year period. 170 The Maryland Greenhouse Gas Emissions Reduction Act of 2009 and its extension in 2016 requires such periodic evalu-ation and updating of plans. (Maryland GGRA 2009 and Maryland GGRA 2016)171 This may well be a conservative, i.e., low-end estimate. The market for electric vehicles of all kinds is developing rap-idly. As noted in Chapter V, Norway is considering a mandate for all cars to be electric by 2025.

94
VII. Getting to an emissions-free energy system
In the business-as-usual scenario we assume that existing appliance and vehicle CAFE stan-dards will continue to be implemented since they are already part of federal law and regula-tions. Speciically, we assume that in respect of fossil fuel vehicles there will be no diference between the business-as-usual and the Climate Protection Scenario so far as fuel eiciency of fossil fuel vehicles is concerned. The diference will be in electric vehicles – the 2030 Climate Protection Scenario will have 5 percent electric vehicle miles compared to negligible number in the business-as-usual scenario. Miles driven are assumed to be the same in both cases, since economic output is assumed to be the same (continuation of growth).
Based on continued competition between renewables, eiciency, and natural gas generation on the one hand and coal on the other, we assume that there will be no coal-ired generation in Maryland. A Renewable Portfolio Standard of 25 percent by 2020 was passed by the General Assembly but ve-toed by the governor. It would have put Maryland on track for a 40 percent RPS by 2025. On this basis, a suitable RPS target for 2030 would be 55 percent, which we have evaluated below.172 This would make Maryland a national leader, if not the national leader, in renewable generation.
i. EiciencyWe have taken detailed account of the evolution of residential appliance eiciency in light of
federal appliance standards and the fact that the average new appliance sold tends to be somewhat more eicient than the minimum requirement.173 For heating and air-conditioning, we assumed that the best available technology at the time of the preparation of this report would the norm in 2050, with intermediate average eiciency in 2030 calculated on that basis.
We assume that Maryland’s eiciency program would set the target rates for improving ei-ciency in end-use electricity demand not modelled speciically. Maryland’s energy eiciency program, called the EmPOWER program, has had a goal of reducing per capita electricity use by 1.5 percent per year up to 2015. In July 2015, the Maryland Public Service Commission issued an order to ramp up the savings rate to 2 percent per year sometime in the 2018-2020 period.174 We assumed that the EmPOWER program would be intensiied and that the average eiciency for residual loads in the 2015-2030 would reduce demand by 2 percent per year relative to the business-as-usual projection. We have correspondingly increased eiciency costs above recent historical levels (see Chapter IX).
ii. Demand response
It will be more economical to increase the proportion of variable wind and solar energy in the electricity system if demand response is more broadly integrated into the technical and economic parameters of grid operation.175 Demand response can be aggregated and even put on the interstate market in the PJM system. Certain proportions of water heaters, clothes washers, and other appliances would also be available for demand response in return for payment. These arrangements can be prof-itable for all parties involved, as a recent study of water heater demand response has shown.176 The
172 We assume that the renewable generation will be solar and a mixture of onshore and ofshore wind; solar and ofshore wind are Maryland’s main in-state renewable energy resources (See Chapter VI, Section 2, above). We assume that the hy-
dropower generation from Conowingo dam will continue but that there will be no more hydropower in the state. Maryland
law stops counting large-scale hydropower as a renewable (“Tier 2”) energy source after 2018. Conowingo generation is not counted in any RPS target beyond 2018.173 IEER commissioned a statistical analysis of eiciency improvements based on appliance shipment data for estimating future eiciency improvements.174 Maryland PSC EmPOWER 2015, pp. 21-22175 See a brief overview of demand response at DOE Demand Response 2016.176 Hledik, Chang, and Lueken 2016

95
Prosperous, Renewable Maryland
penetration of electric vehicles by 2030 is not assumed to be large and we do not take it into account in our modeling of demand response.
Our demand response model for 2030 is rather simplii ed; a more elaborate calculation, which we performed for the year 2050, was not warranted for the purposes of this analysis. We assumed in our model that demand response would operate within a specii c day; that is, all devices on demand response would have the energy service provided during that day but at the time surplus electric-ity is available after fuli lling all other electricity requirements. If added demand response potential remained, then it was used to smooth demand within the 24-hour period. 177 These two features of demand response allow a l attening of the relational peaks, and thereby a reduction of the peaking capacity needed to meet demand at all time. If there is still surplus generation available in a particular hour, it would be exported to other parts of PJM outside Maryland at zero cost or curtailed.178
The limited storage and demand response used in the modeling of the year 2030 means that there will be some curtailed energy. This occurs mainly in the spring and fall, when electricity usage is low compared to other seasons and generation is substantial. This is in contrast to the summer and winter seasons when curtailment is low and the requirement for gas turbine (or fuel cell) generation is high. This can be seen in Figure VII-1, which shows cumulative curtailed generation and peaking generation, from gas turbine or fuel cell generation, for each month of the year 2030.
Figure VII-1: Cumulative monthly peaking generation (in GWh/month) and cumulative monthly curtailed generation, showing opposite trends in the two by month in the year 2030. Source: IEER
177 Demand response requires that appliances be committed in advance. For instance, a clothes washer or dishwasher would be loaded but operated with an automatic signal about supply availability. This would be in return for a payment (much like air-conditioner cut-of switches today). There would also be an override that would allow at-will operation for a payment for using the override. When coupled with variable energy sources, advanced demand response would also require meteo-rological capabilities that allow reasonably accurate forecasts of wind and solar on an hourly basis any particular day. We have not included vehicle discharge into the grid in this intra-day demand response model. See Section 3.i, in this Chapter, for longer-term storage and demand response considerations.178 Generation is curtailed when a generation system is switched of or otherwise disconnected from the grid even though it could produce electricity.

96
VII. Getting to an emissions-free energy system
Figure VII-2 shows generation from natural gas turbines (or other lexible dispatchable genera-tion like fuel cells) that is needed with and without demand response – and the dramatic diference that demand response makes. It shows gas turbine generation in 1,000 megawatt increments and the num-ber of hours each 1,000 megawatt increment is needed to maintain reliable supply throughout the year.
Figure VII-2: Natural gas turbine or fuel cell generation versus number of hours
each 1,000 megawatt tranche of capacity is needed, with and without demand
response in the year 2030. The number on the vertical axis corresponding to “<1,000” is the number of hours that peaking generation capacity is being used at less than
1,000 MW but more than zero. The number above “1,001-2000” means the number of hours when an added peaking capacity of up to 1,000 MW is needed, etc. The
chart shows that demand response reduces the maximum amount of peaking capacity
needed by shifting demand to a lower demand hour. Source: IEER
Even this simpliied approach of shifting demand within the day to when surplus renewable generation is available allows a reduction of capacity from about 5,600 megawatts to only about 1,400 megawatts. This capacity would be somewhere in PJM and not necessarily within Maryland. “Flex-ible” dispatchable capacity can respond to demand within seconds or minutes. Additional reductions would be possible with a more elaborate approach to demand response.
iii. Resiliency
Ramping up variable renewable energy in Maryland to about 55 percent by 2030 will require a very substantial ramping up of the acquisition of wind and solar energy; however it will not, in it-self, require large amounts of storage. This is because conventional generation facilities, imports and exports from the rest of the PJM grid, and demand response can provide supply that is comparable in reliability to the present. However, the exigencies of climate change indicate the need for iner

97
Prosperous, Renewable Maryland
grained reliability metrics in which essential services of many kinds from gas stations to elevators in tall buildings are kept operating in times of outages and in which recovery time should be as short as possible. We have provided for 800 megawatts of combined heat and power (fueled by natural gas in 2030 and by renewable hydrogen in 2050) and about 1,000 megawatts of battery storage, all of which is assumed to be local and mainly part of microgrids designed to increase resiliency. In addition, there would be almost 3,000 megawatts of distributed solar by 2030. These choices are not based on detailed consideration of the needs for microgrids; rather we have chosen the values as plausible ones to make provision in the technical and cost modeling relative to business-as-usual so as not to underestimate costs and to test how these elements can be integrated into a system with a high fraction of variable renewables.
iv. Technical results
Figure VII-3 shows electricity supply, demand, and demand response on a typical winter day in 2030. Wind and solar are the main sources of supply; however, nuclear and natural gas generation also play signiicant roles. We assume the state, national, and global exigencies relating to climate change policies, pollution control policies, as well as continued competitiveness of natural gas relative to coal will result in zero coal-ired generation by the 2030. Electricity demand is shown by a blue line, while the various color-illed areas show the diferent components of generation. Generation above the blue line means excess electricity supply. This is used either for running loads that can be shifted (demand response) or is exported or is curtailed since it is not needed anywhere.
Our choice of solar and wind generation is high enough that Maryland’s goal of 40 percent reduction in GHG emissions by 2030 would be achieved even in the face of presently unscheduled circumstances, such as a premature shutdown of Calvert Clifs nuclear plant or the failure to achieve targeted conversions of space heating from fuel oil and propane to electricity (see Sections 2.vii and 2.viii below).

98
VII. Getting to an emissions-free energy system
Figure VII-3: Electricity supply, demand, and demand response on a typical winter day in 2030.
Source: IEER
Dei cits in supply occur in the in the evening and night hours from about 6 pm to 11 pm. The demand at these hours is shifted to the daytime when surpluses are available due to both solar and wind generation. Note that demand can be shifted both to later in the day and earlier in the day, which requires a demand response system where appliances are preset to be available for operation (or not) at any time during that 24-hour day. No inter-day demand response is assumed. Appliances assumed to be available include dishwashers, clothes washers, the defrost coil in refrigerator freezers, and freez-ers (50 percent in all), HVAC systems (15 percent total), and 10 percent of commercial demand in the daytime, and 30 percent of commercial demand between 6 pm and 6 am. Note that all demand is met; it is just shifted within that particular day. Of course, there must be sui cient surplus generation available in those hours to meet the dei cit. If there is not, the remaining dei cit is met by l exible dis-patchable gas turbines.179 As can be seen from Figure VII-3, no gas turbine generation was necessary on that winter day.
179 We use gas turbines as the reference technology for supporting short-term (intra-day) supply dei cits not met by demand response. Batteries storing surplus electricity, fuel cells, and compressed air storage are among the other technologies that
could meet all or part of this demand. These would make the system more complex than it needs to be in 2030. We evaluate

99
Prosperous, Renewable Maryland
Wind and solar electricity supply amount to about 56 percent of electricity use (including elec-tric transportation) in 2030, but not including transmission and distribution losses. Overall, only about 6 percent of the available demand response is used during the year.
Figure VII-4 shows electricity supply, demand, and demand response on a summer day in 2030. Comparing this summer day to the winter day shown in Figure VII-3 above, we note that wind generation is much lower in the summer. This is typical of wind supply – better in the winter than in the summer. The lower wind generation in the summer is made up by much more solar generation. This winter-summer balance of renewable generation reduces the overall capacity needed and the amount of demand response needed to fuli ll electricity demand. Most supply-demand imbalances occur within a day or a few days and they can be handled by demand response and moderate amounts of storage.
There is no magic formula for optimization however. It is a matter of relative cost of storage, wind, and solar generation.
Figure VII-4: Electricity supply, demand, and demand response on a typical summer day in 2030. Source: IEER
Table VII-1 shows the various components of generation in in 2030.
a broader range of technologies in the context of an emissions-free electricity sector in 2050 in Section 3 of this chapter below.

100
VII. Getting to an emissions-free energy system
Table VII-1: Primary generation in 2030, Climate Protection Scenario, in MWh/year
MWh/year
Capacity,
MWComments
Wind 9,960,875 4,900
2,500 MW ofshore, 400 MW in-state wind, and 2,000 MW Midwest wind
Solar 21,413,943 7,000
3,000 MW distributed (commercial and
residential); rest utility-scale
Nuclear 14,293,085 1,632
Net output 24/7. Assumed to remain on
line till license expiry in the mid-2030s
Hydro 1,942,858 572 Existing Conowingo dam
CHP 1,188,362 800
Natural gas fuel in 2030, renewable hy-
drogen in 2050
Combined cycle
natural gas plant 13,215,505 3,000
From PJM (in-state and out-of-state); not
required in 2050
Single stage gas
turbine or fuel cell 1,456,534 2,000
Natural gas fueled in 2030, renewable hy-
drogen in 2050
Total 63,471,162 19,904
Source: IEER
High fractions of variable generation introduce seasonal imbalances that are more diicult to cure, in large measure because they are not amenable to demand response. Figure VII-5 shows demand, curtailed generation, and gas turbine generation on a cumulative monthly basis. It is clear that the largest curtailed (or unneeded) generation occurs in the spring, followed by the fall, while gas turbine generation is needed in July, August, December, January, and February to meet demand. The amount of gas turbine generation needed is small compared to the spring and fall excess generation. This indicates that seasonal energy storage could allow the surpluses in the spring and fall to be stored for use in the summer and winter; this would reduce the need for gas turbine generation.
The amount of excess generation in 2030 is not very large; therefore, it does not impose a large economic penalty. It can be exported for a very low price to other states in the PJM region. We will revisit this issue in the context of the more complex situation with even higher variable generation in 2050.
Finally, there is the issue of the peak margin: how much capacity is available in excess of the highest load in the year. The calculation includes the capacity of the generating stations, the battery capacity, and the demand response available. The various elements are shown in Figure VII-5 (follow-ing page).

101
Prosperous, Renewable Maryland
Figure VII-5: Generation, storage, and demand response capability at the time of peak load in 2030. The peak margin – the percent of capacity over and above the peak load – is 15 percent. Source: IEER
v. Emissions
We now examine the efect on CO2 emissions in 2030 of the changes in the energy system. We
also consider whether the measures to reduce emissions are robust enough that the goal of 40 percent GHG emissions reduction by 2030 will withstand adverse circumstances such as the premature retire-ment of nuclear plants or a failure to restrict renewable energy to non-carbon-emitting energy sources.
The assumptions and policy changes that we used to estimate emissions for the energy sector in 2030 are as follows:180
• Growth in the business-as-usual case is assumed to be at the rate of household growth of about 0.69 percent per year. This same growth rate is applied across the board, except in the case of aircraft mileage, which is growing much faster than the rest of the transportation sector (about 3.2 percent per year);
• More intensive energy eiciency in the electricity sector (2 percent per year reduction in de-mand compared to 1.5 percent per capita in the pre-2015 EmPOWER program), but not includ-ing new uses such as conversions of petroleum fueled vehicles and of oil and propane heated homes to electricity;
• 55 percent renewable portfolio standard by 2030 – that is, solar and wind generation would equal about 55 percent of the electricity usage;
• Conversion of 30 percent of oil and propane heated homes to eicient electric systems;• Conversion of 5 percent of road vehicle miles and an equivalent amount of non-road petroleum
use to electricity;
180 Further details can be found in Attachment A: Method.

102
VII. Getting to an emissions-free energy system
• Balance of transportation (including aircraft) would be the same as in the business-as-usual case, with fuel eiciency performance increasing in line with the efect of federal fuel ei-ciency standards on the average leet performance in 2030;
• Aircraft eiciency is assumed to increase in line with recent trends;• 800 megawatts of combined heat and power fueled by natural gas;
• 3,000 megawatts of combined cycle natural gas generation (either in-state or elsewhere in the PJM region available to Maryland);
• Continued operation of the Calvert Clifs nuclear plant;• Extensive demand response capability for appliances, water heaters, and space heating and
cooling, including capability to aggregate the demand response and bid it into the market on a basis equivalent to electricity supply;
• Gas turbine generation (single stage) available to meet residual demand (2.3 percent of the total demand).
The central station combined cycle generation is phased out during the 2030-2050 period and other natural gas use is converted to renewable hydrogen (see Section 3 below).
Table VII-2 shows the emission results for the Climate Protection Scenario in the year 2030 compared to the business-as-usual case for that year; in turn these 2030 emissions are compared to the baseline year 2006 for Maryland’s GHG targets and the baseline year of 2011 that we have used in this report as the starting point for analyzing energy supply and demand.
Table VII-2: CO2eq emissions in 2006, 2011, and 2030 (two cases: business-as-usual (BAU) and
Climate Protection Scenario (CPS) (Note 1), in million metric tons per year
2006 2011 2030 BAU 2030 CPS
Electricity consumption (CO2 only) (Note 1) 42.3 37.8 44.0 6.2
RCI direct fuel use (CO2 only), except wood 16.7 16.8 17.3 12.4
Road transportation (CO2 only) 29.1 28.2 18.5 17.5
Non-road transportation (CO2 only) (Note 2) 5.8 7.0 5.4 5.1
Fossil fuel industry (CO2 only) (Note 3) 0.0 0.0 0.0 0.0
Fossil fuel associated CH4 (in-state only)
(Note 4) 1.1 1.0 1.0 1.0
Fossil fuel associated N2O (in-state only)
(Note 4) 0.8 0.2 0.1 0.1
Total energy-related emissions CO2-eq 95.8 91.0 86.2 42.4
% reduction GHG relative to 2006 0% 5% 10% 56%
Source: 2006 and 2011: Maryland GHG Inventory 2012 and 2030: IEER calculations
Note 1: Includes CO2 emissions associated with electricity imported into Maryland.
Note 2: Emissions from asphalt use are not included. Maryland assumes that petroleum use for
asphalt is fully sequestered CO2.181
181 See the asphalt and road oil item, row 10 of the “Industrial” worksheet for 2011 in Maryland GHG inventory 2012. Further, there appears to be an error in the sequestration estimate (which is greater than total energy use in the sector); this
results in a negative emissions estimate for “asphalt and road oil”; this is, of course, impossible. The error does not make a material diference to the GHG inventory.

103
Prosperous, Renewable Maryland
Note 3: The numbers are rounded; emissions are less than 0.05 million metric tons.
Note 4: Only in-state emissions are taken into account. Speciically, upstream methane (CH4) and
nitrous oxide (N2O) emissions in fuel production and delivery are not included as per the Maryland
approach to its 2006 GHG inventory. The 100-year methane global warming potential of 21 is used, as per the Maryland approach to its 2006 GHG inventory (Maryland GHG Inventory 2011, p. 10)
Figure VII-6: CO2eq emissions in 2011 and 2030 (two cases: business-as-usual (BAU) and Climate
Protection Scenario (CPS), in million metric tons per year. Source: Based on Table VII-2 above
With the approach taken here and with the assumptions regarding business-as-usual eiciency changes, the eiciency, renewable energy, and fossil fuel conversion targets for 2030 result in a reduc-tion of energy-related GHG emissions of more than 55 percent by 2030 compared to 2006. This is much larger than the 40 percent reduction required by 2030 under the 2016 Greenhouse Gas Emissions Reduction Reauthorization Act.182 However the Act requires a 40 percent reduction for all sectors, and not only the energy sector. We have not analyzed the other sectors, like cement, agriculture, and waste management. If emissions in these areas grow in the Climate Protection Scenario in the same way as business-as-usual, then a reduction of 56 percent in energy sector emissions by 2030 will result in a smaller reduction of about 52 percent in overall GHG emissions (not including CO
2 sinks in soil and
forests).
This margin of 12 to 16 percent added emissions reduction in the Climate Protection Scenario serves an important purpose: it will ensure that the 40 percent reduction of emissions is achieved even if there are adverse circumstances for reductions such as continued operation of a coal-ired power plant or a premature closure of the Calvert Clifs nuclear plant. We turn now to assessing the impact of such contingencies on the GHG emissions reduction target for 2030. The overall goal is to have a
182 Maryland GGRA 2016

104
VII. Getting to an emissions-free energy system
suicient cushion in the Climate Protection Scenario that the 40 percent reduction would be achieved even if one or more adverse circumstances occurred or if the targets in certain areas such as conver-sions of oil and propane heating systems to eicient electric systems were to be missed.
vi. Contingency: nuclear power
The 55 percent reduction in energy-related GHG emissions is based on the assumptions that fossil fuel generation will be fueled by natural gas – mainly central station and combined heat and power, supplemented by peaking gas turbine (or fuel cell) generation. For the year 2030, we also as-sume that the Calvert Clifs nuclear power plant will still be in operation; the licenses of the two reac-tors there will expire in July 2034 for Unit 1 and August 2036 for Unit 2.183
Continued operation of any given nuclear power plant until the end of licensed lifetime is not assured. Twenty-nine reactors licensed by the Nuclear Regulatory Commission have been closed permanently for a variety of reasons.184 All of them were closed before their licenses expired – some before the original 40-year license, some before the 20-year extension granted beyond the initial 40-year license. As another example, in mid-May 2016, the CEO of the Omaha Public Power District informed his Board of Directors of his recommendation to shut down the Fort Calhoun reactor due to high operating costs compared to other sources of power.185 Unanticipated closure of reactors can cause CO
2 emissions to rise if replacement power comes in whole or in part from fossil fuel sources.
As another example, the California utility Paciic Gas and Electric Company (PG&E), came to an agreement with labor and environmental groups in June 2016 to not seek a license extension for its two Diablo Canyon nuclear reactors. The decision was taken in light of the increasing renewable (in-cluding variable renewable) energy and the higher eiciency targets set by the state. PG&E recognized
that California’s new energy policies will significantly reduce the need for Diablo Canyon’s electricity output. There are several contributing factors, including the increase of the Renewable Portfolio Standard to 50 percent by 2030, doubling of energy efficiency goals under SB 350, the challenge of managing overgeneration and intermittency conditions under a resource portfolio increasingly influenced by solar and wind production, the growth rate of distributed energy resources, and the potential increases in the departure of PG&E’s retail load customers to Community Choice Aggregation.186
The italicized part (emphasis added by IEER) indicates that nuclear reactors, which have very slow ramping rates for increasing and decreasing power output are unsuited to situations where the variable generation is a large fraction of the total. The hindrance that such “24/7” plants pose to grid management was reairmed in October 2016 by David Olsen, who is a member of the Board of Gover-nors of the California Independent System Operator, which is that state’s equivalent of PJM. He called it “a real problem” and an “old paradigm.”187
183 NRC Information Digest 2015, Appendix A, p. 110184 NRC Information Digest 2015, Appendix C (pp. 125-127). The list includes four small reactors (less than 100 mega-
watts thermal) and ten early medium-size reactors (less than 1,000 megawatts thermal). Almost all these licenses were
issued in the late 1950s or in the 1960s. But 15 large commercial reactors have also been permanently shut, all prematurely.185 Epley 2016a. The Board voted in mid-June 2016 to accept the CEO’s recommendation. (Epley 2016b)186 PG&E Diablo Canyon 2016, italics added187 As quoted in Wilder 2016. The California Independent System Operator covers the vast majority of California and a
small part of Nevada.

105
Prosperous, Renewable Maryland
Having a 24/7 nuclear plant, from a grid operator’s standpoint — that is a real prob-lem. Dealing with 2,200 MW coming in at every minute — we have to design our grid around that inlexibility. ‘Baseload’ refers to an old paradigm that has to go away.It is also noteworthy that PG&E concluded that the shutdown of the reactors would be eco-
nomical in view of the likely lower overall cost of renewable energy, storage, and eiciency compared to relicensing the plant and running it for another 20 years. The operating license of the plant will expire in 2025.188
The issue of nuclear power plant closure is complex but germane to Maryland as well. The impact of nuclear power plants in the context of rising renewables is more diicult to assess because PJM is a larger electricity system overall than that managed by the California ISO and there are many more nuclear, coal, and natural gas plants in it. Maryland is a net electricity importer and so long as that is true, its CO
2 emissions are impacted by emissions outside the state in the PJM grid.
Any nuclear plant closure would, in general, be a decision of the owner or the licensing au-thority, the Nuclear Regulatory Commission. Costs are one factor that could induce early closure. Historically, operating costs of nuclear reactors have been quite low, but they have been rising. Table VII-3 shows cost trends for existing reactors from 2002 to 2012 as published by the Nuclear Energy Institute, along with the growth rates for the various components of cost that we calculated based on the data provided. The data are contained in a set of slides presented by the Nuclear Energy Institute in an “Annual Brieing for the Financial Community” in 2014.
Table VII-3 and Figure VII-7 show data for the years 2002, 2007, and 2012. It is clear that all three components of cost have been rising since 2007. But one element of cost stands out both because it represents over 50 percent of the total increase since 2002 and because the rate of growth of this cost element far outstrips that of the others: capital cost. Note that these cost increases are in constant dollars.
Table VII-3: Costs of running existing nuclear power plants, 2002 to 2012, in constant 2012 dollars per megawatt-hour
Year Fuel Capital Operating Total
2002 5.57 3.76 18.58 27.912007 4.98 6.34 20.31 31.632012 7.35 12.96 23.86 44.17
Annual growth rates
2002 to ‘07 -2.21% 11.01% 1.80% 2.53%2007 to ‘12 8.10% 15.37% 3.27% 6.91%2002 to ‘12 2.81% 13.17% 2.53% 4.70%
Source: NEI 2014, slides 5 and 6. Growth rates calculated by IEER.
188 PG&E Diablo Canyon 2016

106
VII. Getting to an emissions-free energy system
Figure VII-7: Costs of running existing nuclear power plants, 2002 to 2012, in constant
2012 dollars per megawatt-hour. Source: Based on Table VII-3 above
Table VII-3 shows average costs for all plants that were operating on the dates indicated. How-ever, costs are highly variable from one plant to the next. In particular, when there is only a single reactor at a site, like Fort Calhoun, operating costs tend to be higher than at sites with two reactors, like Calvert Clifs. The average total generating cost in 2012 for sites with one reactor was $50.54 per MWh and for sites with two or more reactors was $39.44 per MWh.189 The average total generat-ing cost from multi-unit sites declined to $33.76 in 2014.190 We do not have a cost estimate speciic to Calvert Clifs; so we have assumed that the average two-reactor cost would apply for the sake of illustrating the risk that Maryland faces.
The problem of escalating cost was acknowledged by the Nuclear Energy Institute in its 2014 presentation to the “inancial community” when it stated that “price signals [are] inadequate to support operating capacity” and complained that “[m]erchant markets do not recognize or monetize valuable attributes of nuclear plants.”191 Financial dramas to collect extra revenues for nuclear power plants above market rates are playing out in New York and Illinois, where merchant companies are planning to or threatening to close nuclear plants unless they are guaranteed greater revenues.192 Though the average total generating cost declined between 2012 and 2014, the nuclear industry continues to argue that nuclear power should have greater revenues than present market valuation.193 Importantly, the
189 NEI 2014, Slide 5 190 NEI 2016, Slide 8191 NEI 2014, Slides 11 and 13.192 For references relating to Illinois, see Makhijani 2015. 193 NEI 2016 (Slide 8) and NEI 2014, Slides 5 and 6. The same NEI presentation argues that nuclear is undervalued (slide
23 onward) without examining the potential undervaluation of other resources, including renewable energy and eiciency. It also does not note the problems that inlexible 24/7 generation poses while stressing its beneits.

107
Prosperous, Renewable Maryland
New York Public Service Commission has made a controversial decision to provide upstate nuclear plants with very substantial subsidies to prevent premature closure.194
There are a number of factors that afect the total cost of producing electricity from existing reactors. Capital investments tend to vary a good deal. For instance, Fukushima-related retroits in-creased capital expenditures, but these are expected to decline.195 Rising cost due to aging is a struc-tural factor. David Lochbaum, a nuclear engineer on the staf of the Union of Concerned Scientists with experience in the nuclear industry, has hypothesized that the failure rates of nuclear plants (and their components) follows a “bathtub curve” – high in the early years, the “break-in” period, low in the middle years, once the teething troubles have been taken care of, and rising as the plant ages.196 U.S. nuclear plants are in the aging portion of the “bathtub curve.” This factor would therefore be expected to result in sporadic increases in capital expenses, depending on failures or obsolescence of equipment.
Nuclear plants may also close unexpectedly due to safety concerns. All of Japan’s nuclear power plants were closed in the 15 months that followed the Fukushima disaster that began on March 11, 2011.197 Only two reactors were operating as of mid-March 2016. Germany accelerated its phase-out of nuclear power and shut eight reactors soon after the Fukushima accident.
In the United States, three reactors were closed due to unanticipated problems arising out of steam generator replacements. Crystal River in Florida closed in February 2013 and two reactors at San Onofre in California closed in June 2013.198 It is noteworthy that Calvert Clifs was identiied as early as 2013, in one analysis, as one of three dozen nuclear plants where reactors have four or more early closure risk factors.199
Safety and cost are often related since safety improvements often involve capital investment. As noted, that in turn has been a central element in the increases in the cost of running nuclear plants in the past decade.
Further, new safety issues afecting existing reactors emerge from time to time. For instance, a new safety and regulatory issue emerged in 2016; it provides an example of the unexpected problems that could afect nuclear power plant viability. In March 2016, seven engineers on the Staf of the NRC felt strongly enough about a design problem that afects all but one U.S. reactor (as well as reactors in other countries). The problem relates to nuclear plant operation if the power supply from the grid becomes unbalanced.200 A design defect may result in the motors of pumps required for emergency cooling to burn out. The problem has been known since 2012. The NRC sent a note about it to nuclear power plant operators but did not require them to take action. The concerned engineers iled a petition asking that the NRC require the problem to be corrected because the plants are not currently in compli-ance with regulations:
194 The subsidy for the irst two years was ixed at $17.48 per MWh, to be adjusted in future years for a 12-year period in all. The “social cost of carbon” was central to the calculation; it would increase through the period. See NYS PSC CES Order 2016, pp. 20 and 131. The total subsidy over 12 years would amount to billions of dollars. Note that this decision was made in 2016, despite the decline in average nuclear generation costs.195 NEI 2016, Slides 10 and 17196 Lochbaum 2016 197 Makhijani 2012198 NRC Information Digest 2015, Appendix C, for closure dates.199 Cooper 2013, Table III-6 (p. 25). Were Calvert Clifs to get a subsidy at the same rate as the New York plants cited above ($17.48 per MWh), the annual cost to ratepayers would be about $250 million, based on average annual generation of about 14.3 million MWh. See EIA States 2015 Maryland, Table 5. We note that no request for such a subsidy has been made for the plant.200 Technically known as “open phase operation,” the condition occurs when one of the three phases of grid power supply is lost (hence “open phase”).

108
VII. Getting to an emissions-free energy system
As of this iling, the NRC has not informed the licensees that they are not in compliance with applicable regulatory requirements and their licensing and design basis for electric power systems.201
The safety issue is serious because a malfunction could result in Fukushima-size meltdowns of nuclear power reactors and potential widespread contamination in case of a severe accident. Such acci-dents, as we have seen, can afect not only the plants involved in the accident but also plants elsewhere. While the NRC has accepted the petition, it did not ask for the requested actions to be implemented immediately “because of the risk reduction provided by the interim compensatory measures.”202
Another safety issue relating to existing reactors was discovered in France and has already led to closures of 20 reactors (out of a total of 58) as a safety precaution until the issue is resolved. The problem relates to an excess of carbon in the steel in a critical component in steam generators; the in-tegrity of the component is essential to safety since it is part of the primary water circuit that cools the reactor. Additional reactors may be afected.203 Such prolonged shutdowns involve multiple sources of cost increases: the cost of replacement power, the cost of the inspections, the cost of replacement equipment, and the cost of labor for replacing the equipment.
Most reactors in the United States, including the two reactors at Calvert Clifs, are of the same pressurized water design as the ones that have been shut down in France.204 It is not known how many U.S. reactors, if any, are afected by the excess carbon problem that has led to the closures in France. But it is remarkable that manufacturing safety defects leading to prolonged reactor shutdowns were discovered in reactors decades after they were put into service.
The above two examples, along with the expenses relating post-Fukushima retroits, illustrate the risk that total power production costs could increase signiicantly and sometimes unpredictably. The competitiveness of existing nuclear power plants is also afected by market power prices, which have been declining. In the PJM region, average wholesale prices of electricity declined between 2014 and 2015 from $71.62 per megawatt-hour to $56.86 per megawatt-hour or about 20 percent in a single year.205 Generation from coal decreased and that from natural gas increased, while prices of both fuels fell.206 The downward trend in prices has continued in 2016:
The load-weighted average real-time LMP [Locational Marginal Price] was 36.0 per-cent lower in the irst six months of 2016 than in the irst six months of 2015, $27.09 per MWh versus $42.30 per MWh. The load-weighted average real-time LMP in the irst six months of 2016 was lower than for any corresponding period since the irst six months of 2002. Energy prices were lower as a combined result of lower fuel pric-es and lower demand. If fuel and emission costs in the irst six months of 2016 had been the same as in the irst six months of 2015, holding everything else constant, the load-weighted LMP would have been higher, $32.17 per MWh instead of the observed $27.09 per MWh.207
Two other issues are prominent in nuclear power plant closure debates:
201 Mathew et al. 2016, p. 9202 NRC 2016203 Buchsbaum 2016204 NRC Information Digest 2015, Appendix A205 Monitoring Analytics 2015 (2016), v. 2, Table 1-8 (p. 14)206 Monitoring Analytics 2015 (2016), v. 2, p. 14, for generation and p. 34, for prices.207 Monitoring Analytics 2016, p. 1. Prices are diferent in diferent parts of the PJM system. The weighted average is a good indicator of the trends in the system as a whole.

109
Prosperous, Renewable Maryland
• Nuclear power plants, usually located in rural areas, provide a large part of the tax base of lo-cal communities and often a large fraction of well-paid jobs; loss of taxes (or payments in lieu of taxes) poses the threat of increased unemployment and serious funding problems for local governments, giving nuclear plant owners a strong bargaining chip to get subsidies that are not warranted by market conditions.
• Unexpected closure of nuclear plants could cause CO2 emissions to increase.
In view of the above risks of nuclear power plants being caught between possible rising costs and falling prices, it is important from a consumer protection point of view for Maryland to protect it-self from possible future demands for additional revenues above market prices for keeping the Calvert Clifs plant on line. The importance of contingency planning has increased in light of the acquisition of PHI, Maryland’s distribution only utility, by Exelon.208
None of this means that one or both Calvert Clifs reactors will close prematurely. But it would be prudent, in view of the risk factors, for Maryland to shield its greenhouse gas goal and its economy, including that of Calvert County, from the adverse consequences of such a contingency. A 55 percent renewable portfolio standard by 2030 would accomplish that.
Speciically, were Calvert Clifs to close before 2030 and the rest of the energy sector evolved as speciied in the Climate Protection Scenario, energy sector emissions in 2030 would be 49 percent below 2006, while all GHG emissions (excluding sinks) would be just 42 percent below 2006 (48 percent below 2006 with sinks). 209 Thus, a 55 percent RPS provides Maryland a considerable margin to protect the 40 percent GHG emissions reduction goal if sinks are included; there would still be some margin, though smaller, even if sinks are excluded. Adopting a 55 percent RPS would, in efect, provide insurance against the kinds of huge subsidies that the New York PSC has granted nuclear fa-cilities in upstate New York. As noted, a part of New York’s reasoning has been that the upstate facili-ties provide low-carbon electricity sources that are important to meeting its greenhouse gas emission reduction goals. As noted in Section 2 of this chapter and below, it is essential to clean up the deinition of renewable energy if increased RPS goals are to achieve the GHG emission reduction purpose.
vii. Contingency: RPS deinition Potentially, the most damaging eventuality would be if electricity sector emissions per unit
of consumption continued at the level prevalent in 2014 (about 0.6 metric tons per megawatt-hour) despite an increasing RPS.210 Such an eventuality could occur if Maryland set a high RPS level but allowed high carbon-emitting sources to qualify. As can be seen in Figure VI-6 (Chapter VI), the aver-age carbon emission rate from Tier 1 “renewable” sources in Maryland in 2014 was over 1,500 pounds per MWh, while the average emission rate from all Maryland generation was about 1,300 pounds per MWh (which includes a mix of coal, nuclear, oil, natural gas, hydro, and a small component of renew-able energy). This problem may not continue. It may be that just setting the RPS at 55 percent would induce construction of new solar and wind resources to greatly reduce the carbon content of its renew-able portfolio. But this is not assured.
Maryland electricity sector is only about 9 percent of the PJM system. This creates opportuni-ties in that the State can rely on imports and exports to bufer variability in in-state generation for a 208 Makhijani 2015. These comments also include references to the Illinois nuclear plant situation. The merger of PHI with Exelon has been operationalized as of this writing (early July 2016).209 We note that the Nuclear Regulatory Commission is considering the possibility of a second 20-year extension of nuclear licenses. The arguments made here regarding aging-related cost increases and the need for Maryland to protect itself against demands for above-market compensation or a spike in CO
2 emissions would apply a fortiori in such a case.
210 Based on Figure VI-6 in Chapter VI.

110
VII. Getting to an emissions-free energy system
considerable period of time. But being a small part of PJM also creates vulnerabilities. Speciically, if Maryland allows high carbon-emitting sources to remain in its RPS and also allows existing sources for fulilling RPS requirements, the carbon content of its electricity sector will largely be out of the State’s control. It may be cheaper for suppliers to acquire the renewable energy credits on paper and fulill RPS requirements from biomass, landill, paper mills, and other facilities. For instance, Maryland al-lows “a plant that is cultivated exclusively for purposes of being used as a Tier 1 renewable source” to qualify under its RPS.211 This inclusion is without reference to the replacement of the biomass at the same rate that it is burned and does not include any consideration of the changes in the carbon content of soil. Other biomass and waste provisions also raise problems of the net amount of carbon emitted.
Under present RPS rules, expenditures on RECs do not guarantee low CO2 emissions. If the
carbon content continues at the level of carbon content per MWh indicated in Figure VI-6 above, Maryland’s nominal energy sector related emissions would decline by only 26 percent by 2030 with overall GHG emissions reductions (including non-energy sectors) being at about that level as well (excluding sinks).
However, as noted in the text associated with Figure VI-6, it is diicult, perhaps impossible, to determine the net carbon content of Maryland’s RPS portfolio because of the variety of carbon-containing components in it. But even if the net carbon content is somewhat lower than that estimated at the point of burning, a failure to restrict the RPS to strictly renewable resources, as per the IPCC deinition, creates a real risk that Maryland could spend large amounts of money on purchasing renew-able energy credits, including from out of state, and still not meet the mandated 40 percent reduction in GHG emissions by 2030.
To give value to expenditures on RECs, create jobs in renewable energy, and ensure that the 40 percent GHG reduction target is met, it is essential for Maryland to clean up its deinition of renewable energy. Clean energy requires a clean deinition; the IPCC deinition plus speciic safeguards to ensure renewability of biomass (including solid carbon) is the minimum that is necessary.
viii. Other contingencies
There are a number of other steps that we recommend as part of the Climate Protection Sce-nario to reduce emissions by 2030:
• Five percent of vehicle miles would be in electric vehicles.
• Thirty percent of oil and propane heated homes would be converted to eicient electric systems.• Eiciency of appliances not explicitly evaluated would increase by 2 percent per year.
Table VII-2 (in Section VII.2.v) shows that the emission reductions achieved by the irst two measures (above) are relatively small by 2030. Failure to achieve them would not materially com-promise the 2030 GHG emissions reduction goal. Our aim in including them is to indicate that an infrastructure for a transition to electric vehicles and electric HVAC systems is needed to achieve deep GHG emission reductions by 2050. Further, substituting electric vehicles in congested cities in place of petroleum fueled vehicles would produce many other health beneits in terms of reduced air pollution.
3. Roadmap to 2050
Maryland’s 2009 Greenhouse Gas Emissions Reduction Act (GGRA) and its reauthorization in 2016 refer to a “plan” to reduce GHG emissions by 90 percent relative to 2006 in the following way:211 Maryland PSC RPS 2016

111
Prosperous, Renewable Maryland
The State has the ingenuity to reduce the threat of global warming and make greenhouse gas reductions a part of the State’s future by achieving a 25% reduction in greenhouse gas emissions from 2006 levels by 2020 and by preparing a plan to meet a longer-term goal of reducing greenhouse gas emissions by up to 90% from 2006 levels by 2050 in a manner that promotes new “green” jobs, and protects existing jobs and the State’s economic well-being.212
This evaluation by the Renewable Maryland Project is our attempt to deine the technical and cost parameters for a 90 percent reduction in GHG emissions by 2050 in the energy sector that would also be consistent with the energy justice goals described in our report on that topic, with resilience, and with the democratization of the energy sector in Maryland. We also describe the technologies and approaches needed to eliminate GHG emissions from the energy sector altogether.
Most of the ingredients of the transition derive from extending the direction set between 2015 and 2030 to 2050:
• A continuation of the transition to electric transportation until road transportation is all-electric (through some combination of battery-electriication and fuel-cell vehicles with the hydrogen being produced from renewable electricity);
• A continuation of the phase-out of almost all oil and propane use in buildings and its exten-sion, the phasing out the direct use of almost all natural gas in residential buildings and the vast majority of commercial buildings;213
• A continuation of energy eiciency investments so that the average appliances by 2050 have the performance equivalent of the best available technology in 2015;
• Continuation of weatherization eforts to reduce heating and cooling energy requirements in existing residential buildings by 30 percent and existing commercial buildings by 20 percent;
• Intensiication and diversiication of demand response capability and smart grid investments to cover all sectors of electricity use;
• An increase in the RPS for the electricity sector to about 90 percent (to achieve about 90 per-cent reduction in GHG emissions from the energy sector).
In addition, new elements need to be introduced between 2030 and 2050 to accommodate a very high renewable portfolio standard consisting of variable wind and solar and to achieve a com-plete elimination of CO
2 emissions from the electricity sector. However, making the electricity sector
emissions-free does not complete the job of making the energy sector emissions-free. The following sectors will need to be addressed:
• Converting nearly all remaining fossil fuel use in residential buildings (including nearly all natural gas) to eicient electric systems and most natural gas use in commercial buildings not using CHP to eicient electric systems;
212 Maryland GGRA 2009, Section 2-1201(4). The 2016 reauthorization act left Section 2-1201 intact. The main change from the 2009 bill was to require a 40 percent reduction in GHG emissions by 2030 (by adding Section 2-1204.1) and related sections requiring action to achieve the 2030 goal. (Maryland GGRA 2016)213 We assumed that 90 percent of residential direct fossil fuel use for space heating would be converted to electricity. For the commercial sector we assumed that all oil and propane use for space heating would be converted to electricity, but only 70 percent of the buildings using natural gas, that were not converted to use combined heat and power, would be amenable to electric heating technologies.

112
VII. Getting to an emissions-free energy system
• Signiicantly reducing natural gas use and petroleum use in industry by conversion to renew-able hydrogen;
• CO2 emissions from non-road transportation, notably aircraft, boats, and some miscellaneous
non-road transportation demand.214
• Elimination of natural gas use from electricity generation.
• Signiicant investments in the grid-of-the-future and in the distribution system to accommo-date variable renewables and the signiicant new electricity demand that will be created by the electriication of transportation.
• Integration of battery storage into demand management.
Overall energy-sector emissions can be reduced by about 90 percent by 2050. We irst address the path to an emissions-free electricity sector. The 2050 electricity grid powered essentially fully by solar and wind, with supporting elements to ensure reliability, will be very diferent from the one today. It is also likely to be more sophisticated than the one modeled in this report. For one thing, de-mand response will be more ine-grained. A signiicant amount of demand may be met directly by DC generated from solar panels. There may be several diferent kinds of storage, ranging from compressed air storage to seasonal thermal storage. Boats and aircraft may be at least partly electric. We have dis-cussed these technologies but not integrated them into the hour-by-hour modeling or the cost estima-tion here. Apart from complexity, the main reason is that costs of technologies that are not expected to be commercial in the near term (less than 10 years) are diicult to estimate. Finally, the modeling done here is suicient to show that the direction needed is compatible with a range of technologies which would only improve performance, reduce emissions, reduce costs, or reduce impacts.
i. An emissions-free electricity sector
As discussed in Chapter VI, Maryland has plentiful renewable resources. In addition, Mary-land is part of the PJM and more broadly of the Eastern Interconnection. There are three big electrical interconnection areas in the United States and Canada (Figure VII-8).
The Eastern Interconnection includes almost all of the Midwest, which has excellent wind re-sources. With near-term wind technology, there are large areas that have wind power availability with capacity factors of 35 percent, 50 percent, and even 60 percent or more in Maryland (See Figure VI-3 above). This is not to say that constructing large amounts of wind capacity and the associated needed transmission lines does not face obstacles; it is only to say that excellent resources are available to the Eastern region, far in excess of any conceivable energy requirements, as discussed in Chapter VI. In addition, Maryland and the rest of the region also have ample solar resources.
We have seen in Section 2, of this chapter, that a 55 percent renewable portfolio standard by 2030 in Maryland will not require large investments in storage so long as demand response is well de-veloped and Maryland remains part of the PJM system with which it can exchange power as it does in the normal course of events today. Battery storage can and should be developed as a part of the State’s resilience strategy, but this observation is separate and distinct from whether Maryland electricity sup-ply can operate reliably at 55 percent RPS without a large amount of storage.
214 The non-road transportation sector is very heterogeneous and a full analysis is beyond the scope of the Renewable
Maryland Project. We assumed that about half of the rail sector would not be electriied and about 30 percent of the non-identiied miscellaneous non-road transportation sector would not be electriied.

113
Prosperous, Renewable Maryland
Fig
ure
VII
-8:
The
mai
n el
ectr
ical
reg
ions
in th
e U
nite
d S
tate
s an
d C
anad
a. N
ote
that
Que
bec
Inte
rcon
nect
ion
has
tran
smis
sion
li
nks
to th
e U
.S. N
orth
east
. Sourc
e: W
ikim
edia
NE
RC
Map
200
6; c
reat
ed b
y F
jbfo
ur)

114
VII. Getting to an emissions-free energy system
The matter is more complex for a system with near-100 percent solar and wind generation (apart from the modest amount of hydropower available from the existing Conowingo dam).215 If the rest of the PJM region and the Eastern Interconnection also sets high renewable portfolio goals, issues of storage must be addressed to maintain system reliability. Of course, it is not a given that the entire region will move towards high solar and wind generation. But it is prudent to assume that it will in the present evaluation for three main reasons.
First, storage questions become unavoidable if variable resources are at very high levels even with demand response at advanced levels. Demand response can move daily or even weekly electricity demand from times of deicit to times of surplus electricity (presuming an appropriate rate structure and compensation for customers who shift demand). But this will not suice to address reliability. A realistic technical and cost evaluation therefore requires that storage be included. In other words, an assumption that suicient lexible generation will be available to meet, on its own, the supply and de-mand balance in Maryland is risky.
Second, as is widely recognized, the problem of GHG emissions is a global one. For Maryland to beneit from its actions in terms of climate change mitigation, other parts of the region and the world must also take action. This will very likely involve a large increase of variable generation throughout the region. Fortunately, the December 2015 Paris Agreement on climate set the whole world on a course to reduce GHG emissions to protect climate.216 There is a long way to go to make the agreement a reality, but the framework for action is in place. There is no longer an excuse for some countries, states, or regions to avoid action to protect climate because developing countries have not made com-mitments to do so. The commitments of all parties need to be stronger, but the agreement to take action is nearly universal. It is therefore prudent to assume that energy supply in Maryland and in the PJM region is likely to consist increasingly of solar and wind energy.
Third, new wind energy is now more economical than new coal, nuclear, and even natural gas generation; utility-scale solar is more economical than new coal and nuclear, and about on a par with natural gas generation. Moreover, solar is getting cheaper. It is therefore in Maryland’s economic in-terest to plan for a fully renewable electricity system as the anchor of its energy system. It will have cleaner energy with far more jobs. As discussed in Chapter II, Section 5, Maryland sends $9 billion to $12 billion out of state each year for its energy purchases (see Table II-4 for 2013 estimates). Building renewable energy facilities to replace the imported oil, gas, and coal will keep most of that money in the region. The extent to which the money stays in the state will depend on how much of a leadership role Maryland is willing to take along the road to a renewable and eicient energy future (see Chapter X).
It should be noted that new solar, wind, or natural gas generation will in many cases not be cheaper than existing depreciated generating plants. The problem in such cases will be retirement of capacity. Coal plants are being retired because they are expensive to run compared to existing natural gas, wind or solar power plants facilities – that is, once the latter are built, they are less expensive to operate. But the issue of retirement of existing natural gas plants and their replacement with wind and solar will remain. We will take this up in the context of costs of the transition to a zero emissions electricity system (see Chapter IX).
215 Maryland has about 2 million MWh per year of hydropower generation on average. (EIA States 2015 Maryland, Table
5). We assume that the Calvert Clifs nuclear plant will close in 2036, by which date the licenses of both reactors at the site will have expired.216 The Paris Agreement is now part of the treaty known as the United Nations Framework Convention on Climate Change
to which the United States is a party. For a commentary on the Paris Agreement, see Makhijani Paris Agreement blog 2015.

115
Prosperous, Renewable Maryland
There are many ways in which a 100 percent renewable electricity sector can be approached. It is not possible to predict which combination of technologies will produce the most satisfactory result. We therefore explore options with recommendations on actions that will maximize Maryland’s ability to take advantage of technological developments that are consistent with a course to deep emission reductions by 2050 in the entire energy sector.
The principal basis for the period beyond 2030 must be laid before 2030. The main require-ments for a robust foundation for achieving the 40 percent reduction in GHG emissions by 2030 are (i) to set a 55 percent renewable portfolio standard by 2030, (ii) to clean up the deinition of renewable energy, (iii) change the way in which RECs are accounted for to meet the State’s Renewable Portfolio Standard, (iv) to strengthen eiciency improvements, (v) to lay the foundations for the grid-of-the future, and (vi) to make a strong beginning to a transition away from direct fossil fuel use for space heating and transportation.
The issue of REC accounting needs some explanation. Currently, electricity suppliers to Mary-land purchase RECs to meet their RPS obligations. But these are paper credits that represent qualiied generation, not actual new renewable generation. As the RPS is increased, it is important as a matter of policy, to ensure that new generation is constructed to meet the requirement for renewable energy. That would also make the accounting for renewable energy compatible with the physical requirements for production of wind and solar energy and also compatible with emission reduction requirements.
The main technical questions facing an emissions-free electricity sector are the methods for ensuring reliability in the context of variable generation sources and the associated cost. Given the uncertainties about the precise evolution of the rest of the PJM grid, we chose to evaluate an emis-sions-free electricity system as if reliability is addressed entirely within the State, understanding that while this is not how current regulatory structures function, it provides a “worst-case scenario” for reliability. Clearly, if relational peaks can be managed with resources from within the state, then it can certainly be balanced when regional considerations are added. Speciically, any particular mix of solar and wind resources (which may be a mix of in-state and out-of-state resources) will exhibit deicits at certain times of the year, even with a broad range of demand response actions. We do not assume that dispatchable resources will be available in the PJM region to meet the demand at such times. In general this approach overestimates cost because normal power exchanges with the rest of the PJM system enable cost reductions that we do not take into account.
Besides demand response, we consider the following mix of resources to meet reliability and resilience criteria:
• Hydrogen produced from renewable sources – we have considered distributed electrolytic hy-drogen at near-term costs estimated by the Department of Energy for certain electricity genera-tion options; in efect, the hydrogen serves as an element of distributed energy storage;217
• Combined heat and power systems in the commercial sector that would run on renewably pro-duced hydrogen (either internal combustion engines or fuel cells);
• Light duty fuel cell power plants (or gas turbines) using renewably produced hydrogen for meeting relational peaks;
• Battery storage (not including electric vehicle batteries);
217 We chose distributed hydrogen production since that does not involve the construction of an extensive hydrogen distri-bution infrastructure. Centralized hydrogen production is more economical but the costs of the hydrogen infrastructure that would be needed would be highly dependent on the locations of the large-scale hydrogen production and therefore more speculative. For hydrogen cost analysis see DOE FCT 2011-2020, Section 3.1 (Hydrogen Production).

116
VII. Getting to an emissions-free energy system
• Microgrids218;
We will also consider other likely elements of the future grid but have not integrated them into the hour-by-hour model:
• Seasonal thermal storage;
• Compressed air storage and generation; the air would be reheated by renewably produced hy-drogen before it is passed through the turbine to generate electricity (see Section 3.ii below in this chapter).
• Vehicle-to-grid (V2G) storage and demand response.
We consider the technology of the irst two in this section. It is possible to add biogas (i.e., methane produced from biomass) to the mix of resources, provided it is renewably produced, though we have not done so in our technical modeling. For instance a demonstration project in Germany has created a fully renewable microgrid with mainly wind power and a relatively small biogas component. It will supply all requirements from space heat to vehicle fuel to electricity. Its components are:219
• 6 MW of grid-connected wind turbines (3 turbines of 2 MW each);
• 1 MW biogas plant
• A 500 kilowatt electrolytic hydrogen production system (hydrogen capacity: 120 cubic meters per day at standard temperature and pressure);
• Four compressors to compress hydrogen gas to 30 atmospheres pressure;
• Five hydrogen storage tanks, with storage a 30 atmospheres pressure;
• Two combined heat and power plants (350 kW-electrical and 340 kW-thermal) that can use a variety of gas mixtures from 70 percent hydrogen and 30 percent biogas to 100 percent natural gas.
The cost of this entire system was estimated at 21 million euros or about 23 million dollars, which is modest considering its completeness, complexity, and size. It has been operating since 2011, delivering district heating to nearby Prenzlau, Germany. Its surplus hydrogen is delivered to illing stations in Berlin.220 Figure VII-9 shows a schematic of the system. The costs we use are comparable to the ones for this system.
218 Microgrids are not explicitly modeled as such in the hourly model. Rather, provision has been made for signiicant amounts of distributed resources: distributed solar, CHP, battery storage, and demand response. If arranged in appropriate
microgrid conigurations, these resources could increase resilience in the sense of being able to supply essential loads for extended periods of grid failure. 219 Enertrag 2009, slide 7. These were the components described before the 2011 opening. Enertrag, a major renewable
energy company in Germany, proposed the project as a collaboration with the multinational company Total, among others. 220 EC Regional Policy 2015. A pilot illing station at the Berlin Brandenburg Airport includes solar panels to supplement the electricity from an Enertrag wind farm. That station will include a “research campus” (Fuel Cell Bulletin 2013, p. 6).

117
Prosperous, Renewable Maryland
Figure VII-9: An integrated electricity-heating-renewable hydrogen energy system, near Prenzlau, Germany. Source: Courtesy of ENERTRAG AG (Enertrag 2009, Slide 6)
This Enertrag system provides an excellent illustration of a renewable, reliable, and distributed energy system. Note that the system is grid connected.
A variable electricity supply must also address seasonal balance of supply and demand. When the residential and commercial sectors use electricity for space heating and cooling, the absolute de-mand for electricity is considerably higher in the summer and the winter. However, with space heating mainly electric, the relative demand (compared to variable supply) would tend to occur in the winter, mostly in the late evening or at night. Figure VII-10 illustrates that monthly electricity use is highest in a winter month, January, followed by a summer month, July, then December, February and August follow. The lowest use per month is in the spring and fall, with the smallest use being in April.

118
VII. Getting to an emissions-free energy system
Figure VII-10: Aggregate net monthly electricity use in 2050, including transportation, but
not including electricity for hydrogen fuel production. Transmission and distribution losses
are not included. Source: IEER
Without seasonal energy storage, there is likely to be a need to sell the surpluses to other areas within the state at low to zero price, or to curtail it. Figure VII-11 shows monthly unused generation in the absence of seasonal storage that would be curtailed or sold outside Maryland at zero price.
Figure VII-11: Monthly unused generation before seasonal storage, 2050. Source: IEER
The total annual curtailed energy is about 13 million MWh, a signiicant amount. There are two perspectives on this. On the one hand, it represents only about 13 percent of total generation, which might be regarded as the equivalent of annual average idle capacity in the renewable electricity system

119
Prosperous, Renewable Maryland
modeled here. On the other hand, it is throwing away precious energy resources that could be put to good use.
In practice, much of the curtailed energy would be sold at a positive price, since other states in PJM would be likely to have demand when Maryland does not and Maryland would buy from other states when it is in short supply. Thus, being part of PJM would reduce capacity requirements and curtailment compared to the in-state only model we have used.
There are also ways in which the curtailed energy could be put to good use. One important technology is large-scale seasonal energy storage. It is clear from Figure VII-11 that there are signii-cant surpluses in the spring that could be used to create storage of coldness, which could be used for air-conditioning in the summer. Heat could be stored in the fall for use in the winter. Seasonal thermal storage would reduce the need for battery storage and peaking generation.
A number of approaches could enable use of seasonal surplus electricity; the actual mix of technologies will be determined by relative cost and rate structure:
• Seasonal thermal storage of heat and coldness;
• Seasonal vehicle-to-grid storage in which battery-operated devices, like lawnmowers and leaf blowers in the winter and school buses in the summer and winter holiday periods, are used for long-term storage;
• Renewable hydrogen storage;
• Compressed air energy storage.
ii. Compressed air energy storage
We have already discussed the basics of compressed air energy storage (CAES) in Chapter VI, Section 5. Here we discuss whether this form of storage could be practical for Maryland. The cost and feasibility of large-scale compressed air energy storage depend irst of all on the availability of underground storage locations. These can be in aquifers, caverns that were former oil or gas produc-tion sites, salt domes, or caverns that are explicitly mined for the purpose of CAES. The last option is expensive and associated with siting problems and we will not consider it in this report.
Large-scale storage of natural gas in underground caverns that are former oil and gas produc-tion sites is a common form of storage for meeting winter heating peak demand. This form of storage is especially common in the stretch of the Appalachian region from southwestern New York, through western Pennsylvania, eastern Ohio, and Maryland and into West Virginia. This can be seen in Figure VII-12, which shows the locations of diferent types of underground natural gas storage facilities in the United States. There is one facility in the State of Maryland in a small town (named Accident) in the westernmost county in the State (Garrett County).221
221 EIA Natural Gas 2012 and Spectra Energy 2016. There are apparently a number of inactive vertical natural gas wells in the area. See FrackCheckWV 2015.

120
VII. Getting to an emissions-free energy system
Figure VII-12: Underground natural gas storage facilities in the United States.
Source: EIA Natural Gas 2016
It may be possible to convert some or many of these natural gas storage caverns to compressed air storage facilities. The practicality and safety of such conversions needs to be investigated and es-tablished. In 2009, the U.S. Department of Energy granted PG&E, a California utility, $25 million for a demonstration project, after which the California Public Utilities Commission added $25 million.222 Figure VII-13 shows a schematic of the project.
Were the conversion of many of these natural gas storage facilities to CAES facilities feasible, it could contribute signiicantly to the options for reaching a fully renewable energy system in the mid-Atlantic and Northeast regions of the United States in the following ways:
• Large-scale economic storage would become available at modest cost since the caverns al-ready exist;
• Storage could at least partly be integrated in much or most of the PJM and the Northeastern United States (including New York), potentially lowering costs;
• It would maintain and expand jobs in the Appalachian region, an area that is economically depressed;223
222 PG&E CAES 2016 223 Jobs would be added because CAES would require compression as well as electricity generation operations. The in-
crease in jobs would be both in the construction phase and the operations period.

121
Prosperous, Renewable Maryland
• It would allow easier integration of storage with imports of high-capacity-factor wind energy from the Midwest, including North and South Dakota (among other states), where there is a plentiful potential for such wind energy supply.
Figure VII-13: Schematic of the use of a depleted natural gas reservoir for compressed air energy storage. Source: PG&E CAES 2016
iii. Seasonal thermal storage
Seasonal thermal storage is another approach that could be used to balance the larger availabil-ity of renewable energy relative to demand in the spring and fall and the greater demand for electricity in the summer and winter. There are a variety of thermal storage systems. Some store only coldness, as for instance in systems that make ice in times of low-cost (i.e., plentiful) electricity supply in order to use it for air-conditioning at peak demand times. Such systems are usually cycled daily and are an adaptation of central air-conditioning systems to which an ice-making machine has been added. Figure VII-14 shows one such system. Typically many such units would be used in a commercial-building setting. This technology is commercially available.

122
VII. Getting to an emissions-free energy system
Figure VII-14: An “Ice-bear” system, which makes ice at of-peak times for air-conditioning use at on-peak times. Source: Courtesy of Ice Energy (http://ice-energy.com/technology/)
Seasonal thermal storage usually involves some form of underground storage of heat and cold-ness. A small community, Drake Landing, has been built in Alberta, Canada, which gets almost all its heat in the winter from seasonal storage of heat during the warmer seasons. The heat to be stored is generated in solar hot water systems that use glycol as a working luid.224 Figure VII-15 shows a schematic of the system.
224 Drake Landing Solar Community 2016

123
Prosperous, Renewable Maryland
Figure VII-15: Schematic of the Drake Landing Solar Community (Town of Okotoks, Alberta, Canada) seasonal thermal storage system. Source: Drake Landing Solar Commu-nity 2011, Figure 2 (p. 9). © Her Majesty the Queen in Right of Canada, as represented by the Minister of Natural Resources, (2011)
Another seasonal storage system uses pipes laid in the ground, as for instance under a park-ing lot, to store heat or coldness in the ground for later extraction. The stored heat is used to increase the performance of a geothermal heat pump system. This technology is commercially used in Britain. Figure VII-16 shows a schematic of such a system.
Figure VII-16: Schematic of thermal storage under a parking lot. Source: ICAX Projects 2016. Courtesy of ICAX. Copyright ICAX www.icax.co.uk

124
VII. Getting to an emissions-free energy system
Figure VII-17 shows a photograph of “thermal bank” pipe being laid under the grounds of a school in Britain.
Figure VII-17: Thermal bank pipe being laid at Howe Dell School (Britain). Source:
ICAX ThermalBanks 2016. Courtesy of ICAX. Copyright ICAX www.icax.co.uk
Such storage systems are not needed in the near future for eiciency of grid operation, though they could be used to reduce direct fossil fuel use in commercial buildings. They may be an important element in a total or near total phase-out of fossil fuels for space and water heating. They may also be useful in microgrid arrangements, since stored heat would be available in case of grid outages in the winter.
4. Energy sector results, 2050
The essential features of the evolution of the energy sector from 2030 to 2050 are:
• Continuation of increases in eiciency of electricity use and of weatherization of existing structures;
• Electriication of 90 percent of direct fossil fuel use for space heating in buildings, including conversion of buildings using natural gas;
• Complete electriication of the on-road transportation sector;• Electriication of most of the non-road transportation sector, except boats and aircraft;

125
Prosperous, Renewable Maryland
• Hydrogen production via electrolysis for use in industry, combined heat and power plants, as well as combined cycle and gas turbine generation; fuel cells could also be used;
• All generation would be wind and solar, except for a small amount of existing hydropower from the Conowingo dam;
• Battery storage;• Automated demand response capability – meaning that certain appliances like clothes wash-
ers, dishwashers, electric car chargers, water heaters, etc., would operate automatically when electricity was cheap (i.e., supply plentiful relative other hours in the day) and defer operation when there was not enough supply to times when there was. Signing up would be voluntary (as it is with air-conditioner cycling programs at present). In normal times (when the overall system is not under supply stress), consumers could opt out for convenience and pay a higher rate; but at times of the highest relational peaks, opt out would not be available since demand response would be essential for system reliability. From the point of view of the grid (and therefore the ensemble of consumers), the entire point of the demand response payment is real-ized at those times;
• Suicient distributed generation and storage to enable essential loads to be met without disrup-tion during grid outages;
• Continued use of a small amount of fossil fuels for limited uses in industry and non-road trans-portation (like aircraft and boats) with possible replacement by renewable energy if technology and costs permit;
• Overall energy sector reduction of GHG emissions more than 90 percent relative to 2006 and a completely emissions-free electricity sector as described in Section 3.i, of this chapter.
i. The electricity sector
Table VII-4 and Figure VII-18 show the components of electricity demand in the year 2050. Final demand at the point of end use would be about 93.7 million MWh compared to about 63.6 mil-lion MWh in 2011 and a projected 83.3 million MWh in the 2050 business-as-usual scenario. These numbers exclude transmission and distribution losses and net losses in storing electricity (applicable only in the Climate Protection Scenario).
Table VII-4: Electricity use in 2050 in the Climate Protection Scenario, MWh
Residential heating and cooling (Note 1) 5,975,749
Commercial heating, cooling, ventilation (Note 2) 13,902,751
Water heating (Note 3) 4,854,003
Lighting (residential and commercial) 8,134,629
Other Residential + Commercial + Industrial (Note 4) 13,713,041
Transportation (road and non-road) 26,438,268Hydrogen production net demand (gross demand less CHP and fuel cell generation from H
2), includes T&D losses for H
2 (Note 5) 15,089,850
Electricity usage 88,108,291
Battery losses 1,090,991
Transmission and Distribution losses 4,479,374
Total gross electricity supply requirements (Note 6) 93,678,655Source: IEER (Notes following page)

126
VII. Getting to an emissions-free energy system
Note 1: The average coeicient of performance for electric space heating in 2050 would be 4.2 com-pared to an estimated 1.5 in 2011. The building envelope of existing residential buildings would be improved 30 percent by 2050 on average. 90 percent of direct fossil fuel use for residential space heat-ing would be converted to eicient electric systems.Note 2: Eiciency of commercial electric space heating would be the same as that for the residential sector. The building envelope of existing commercial buildings would be improved 20 percent by 2050 on average. We have assumed that some of the space heating and cooling would be met by using rejected heat from combined heat and power systems; 70 percent of rest of direct fossil fuel use for space heating would be converted to eicient electric systems.Note 3: All water heating is converted to electric heat pump systems; this includes conversion of present-day resistance electric systems to heat pump systems as well as conversion of natural gas, oil-fueled, and propane-fueled water heating to heat pump water heaters. Heat pump water heaters draw heat from the ambient air to boost the eiciency of electric water heating (similar to a space heating heat pump which draws heat from the outside air or from the earth). Because of this operating charac-teristic, the use of heat pump water heaters reduces space cooling requirements when the equipment is located indoors. By the same token it increases heating requirements in the winter. We have taken approximate account of both these efects and reduced the average coeicient of performance of heat pump water heaters from the name plate rating of 3.4225 by about 10 percent on an annual basis. In some cases, it may be complex to install heat pump water heaters because the local cooling efect may afect home comfort, notably, in the winter. In the commercial sector, water demand peaks in hotel buildings tend to be sharp. Supplementary heat sources may be needed for satisfactory performance. Geothermal heat pumps that include a water heating component would not be afected by these considerations. Note 4: We assume a continuation of the EmPOWER eiciency program in Maryland with 1.5 percent per capita eiciency improvements to 2015 (already achieved) and 2 percent per year after that for all residual loads – that is, loads for which eiciency is not explicitly considered (including space heating, air-conditioning, water heating, large appliances, and lighting). In the category of residual loads, we assume that all natural gas and propane cooking will be converted to electric induction cooling, which is far more eicient when powered by solar and wind energy. Conversions are assumed to occur in the 2030 to 2050 period. Induction cooking has the characteristic of transferring heat very rapidly to the cooking vessels and shutting of the heat instantly as well. In these respects, it is similar to natural gas (or propane) cooking. Induction cooking in the commercial sector can reduce space heating and cool-ing requirements considerably by reducing the need for ventilation due to heat of cooking areas. We have not attempted to evaluate this beneit.Note 5: We assume that hydrogen is produced locally for use in electricity generation or for direct use in industry to displace oil and natural gas. Some direct use of fossil fuels in industry is assumed to con-tinue (see Section 4.ii, below in this chapter). Note that today hydrogen is generally produced using natural gas as a feedstock. In the Climate Protection Scenario, the hydrogen is assumed to be produced by electrolysis of water using electricity from the grid, which by 2050 would be emissions-free. We call this “renewable hydrogen” for short.Note 6: Total does not include curtailed electricity generation.
225 This is the best available commercial technology at the time of preparation of this report. (Energy Star GE Water Heater
2016)

127
Prosperous, Renewable Maryland
Figure VII-18: Electricity use in 2050 in the Climate Protection Scenario, MWh. Source: Based on Table VII-4 above
The main reasons for the much higher electricity use in the Climate Protection Scenario, de-spite greater investments in ei ciency, are:
• Conversion of fossil fuel space and water heating to electricity;
• Conversion of all road and a large part of non-road transportation to electricity;
• Net electricity use for producing hydrogen that is then used to produce electricity in fuel cells, combined cycle plants, or to reheat air in compressed air energy storage.
Note that the largest sources of demand are represented by electric transportation and hydrogen production, in contrast to their very small role in the present-day electricity system. The total for the residential, commercial, and industrial sectors is a little under 47 million megawatt-hours, consider-ably lower than in 2011, despite population growth, economic growth, and the conversion of fossil fuel space heating, water heating, and cooking to electricity. This is because of continued vigorous imple-mentation of and investments in energy ei ciency in the areas of existing electricity use (see Note 4 in Table VII-4 above). For instance, the average ei ciency of electric heating today is more than doubled because of implementation of the most ei cient currently available heat pump technology. Costs of ei ciency improvements have been taken into account (see Chapter IX below). On the other hand, we have used existing or near-term parameters for electrolytic hydrogen production, which results in rather large losses. Development of hydrogen technology beyond that modeled here is likely and could decrease the electricity needs even further.
Table VII-5 shows electricity supply in the Climate Protection Scenario. The i rst four items are the components of primary generation – that is, they use primary energy sources to create electric-

128
VII. Getting to an emissions-free energy system
ity. There are four of them: solar, onshore wind (obtained in the Eastern Interconnection), ofshore wind, and hydropower. Solar electricity is assumed to be supplied by photovoltaic panels at various scales – residential (5 percent), commercial (15 percent), and utility-scale (80 percent). Utility-scale facilities could be in urban or rural areas. These fractions could be varied substantially as relative costs change and the requirements of microgrids, resiliency, and consumer choice become clearer.
We have separated onshore and ofshore wind because they have very diferent costs; there-fore the speciic breakdown into the two types is important for the economic assessment (Chapter IX below). The last item consists only of a single existing generating station at Conowingo dam. We as-sumed that the power station at this dam would continue in operation until 2050. Its overall contribu-tion to generation is less than 2 percent but it can provide a responsive and lexible generation source. Further, as the use of water for thermal generation in the Susquehanna River basin is reduced the lex-ibility in the operation of the hydropower station may increase.
Table VII-5: Electricity supply in the year 2050, Climate Protection Scenario (CPS), Capacity
(MW) and Generation (MWh), with 2011 and business-as-usual (BAU) 2050 totals for reference
CPS 2050
Capacity,
MW
CPS 2050
Generation,
MWh
2011
Generation
requirements,
MWh
BAU 2050
Generation
requirements,
MWh (Note 6)
Solar PV (Note 1) 36,000 55,064,426
Onshore wind (Eastern
Interconnection) (Note 2) 7,000 27,634,397
Ofshore wind (Note 3) 6,000 23,004,194
Hydropower (Note 4) 572 1,722,489
Total primary generation
(rounded)49,572 107,400,000 68,800,000 90,100,000
CHP and peaking generation with
H2 (Note 5) 4,155,474
Generation from stationary
batteries (secondary) 7,069,246
Total secondary generation 11,224,720
Source: IEER, for 2050
Note 1: 20 percent of solar PV capacity is assumed to be distributed (5 percent in the residential sector and 15 percent in the commercial and industrial sectors). The rest, 80 percent, would be utility-scale (~10 MW or more). Some of the utility-scale solar could be in urban areas. In principle, the vast ma-jority of solar energy requirements could be fulilled by facilities in urban areas, if most of the techni-cal potential can be utilized (see Table VI-1 for technical potential). Utility-scale solar is assumed to be single-axis tracking; the rest is assumed to be in ixed-tilt conigurations. We assume that all solar generation will be within the State of Maryland for purposes of hourly modeling. We used population-weighted average insolation data from ive Maryland stations: Andrews Air Force Base, BWI Airport, Hagerstown Regional Airport, Patuxent River Naval Air Station, and Salisbury-Wicomico Regional Airport.
Note 2: Land-based wind could be from within the PJM or Midcontinent Independent System Opera-tor (MISO) grid region. For convenience, we have used a mix of Western Maryland and South Dakota

129
Prosperous, Renewable Maryland
data to estimate capacity factor. In practice, onshore wind supply will be a more general mix available on the PJM grid and the MISO grid; the specii c mix will depend on transmission availability.Note 3: We used wind data for of shore Maryland only. In practice, of shore wind supply is likely to be more diverse, coming from a mix of of shore Atlantic coast locations.Note 4: 572 megawatts is the installed capacity at the Conowingo dam.226
Note 5: The hydrogen is produced from solar, wind, and hydropower sources. This hydrogen fuels both the CHP systems and the peaking generation. Note 6: BAU electricity generation is less than the Climate Protection Scenario, despite greater ei -ciency in the latter because almost all transportation and space and water heating are electrii ed in the latter and not in the former.
We recognize that renewable capacity required is large. We discuss land area requirements in detail in Chapter XI. We note here that the total land area requirement for wind and solar in terms of footprint of the actual facilities (including the land between solar panel rows) would be under 100,000 acres. The land used to grow corn to produce ethanol for vehicles occupies a much larger area. The national total for the corn ethanol mandate in 2016 is about 30 million acres; Maryland’s share on a per person basis, is well over 500,000 acres (see Attachment B for details). This provides some perspec-tive on the land area needed for renewables – it is much smaller than that currently used. In addition, Marylanders also use signii cant amounts of land for supplying coal to existing generating plants. See Chapter XI, Section 4, for more details on land use issues.
(The following three charts are based on Table VII-5 above)
Figure VII-19: Installed electricity capacity in the year 2050, Climate Protection Scenario (CPS), MW
226 Exelon Conowingo 2016

130
VII. Getting to an emissions-free energy system
Figure VII-20: Total primary electricity generation, by source, in the year 2050, Climate
Protection Scenario (CPS), GWh
Figure VII-21: Total primary electricity generation in the year 2050, Climate Protection
Scenario (CPS), GWh, with 2011 and business-as-usual (BAU) 2050 totals for reference

131
Prosperous, Renewable Maryland
We use a mix of solar and wind in approximately equal amounts because they complement each other seasonally: wind is more plentiful in the winter and solar in the summer. This allows sim-pler balancing of demand with a smaller amount of short-term storage (stored energy that is designed to be used on the same day or within a few days). The cost of utility-scale solar and onshore wind per MWh is broadly comparable; this could provide substantial lexibility in the choice of the mix, espe-cially if battery storage (and possibly thermal storage) becomes very inexpensive. Storage technology is developing rapidly with corresponding reduction in costs.
Large-scale manufacturing of batteries for vehicles and for grid electricity storage is only just beginning in the middle of the current decade of the 2010s. The Tesla “gigafactory” is expected to be-gin production in 2017 and reach full production by 2020. It will produce enough batteries annually to power half-a-million cars.227 Figure VII-22 (following page) shows a typical scale-up curve for tech-nologies that are in the initial stages of commercialization, which is the case of lithium-ion batteries (or more correctly battery packs) designed for storing large amounts of power.
The estimate of battery costs in the future is based on past cost reductions in a variety of new technologies and production methods when they were scaled up, ranging from the Model-T Ford car a century ago to solar panels in this century.228
We have only assumed costs of batteries will decline as indicated to about the mid-2020s as seen in Figure VII-22. But as the experience with solar panels has shown, and as indicated in the above igure, the costs could come down by several-fold after that, due to economies of scale in manufactur-ing and technology development.
There is a variety of battery chemistries that can be used for grid electricity storage. Lithium-ion batteries have been at the center of the discussion since the same basic technology can be used for vehicles and for grid storage. However, grid storage can use a wider array of technologies because, unlike batteries for use in vehicles, there are no space and weight considerations. For instance, sodi-um-sulfur batteries, which are both too heavy and too unsafe (in case of crashes) for vehicles, can be used for grid-electricity storage. Flow batteries, which are very bulky and store the electrolyte in tanks external to the batteries, are also being developed rapidly.229 The intensive development is spurred by the rapid global increase in electricity generation from variable sources, notably wind and solar and the expectation of even more rapid growth in the coming years and decades. This has spurred demand for storage and the expectation that the market will be orders of magnitude larger than at present.
The point here is not to present a dissertation on future battery technologies, but simply to note that if electricity storage costs in stationary devices fall to the 2 to 4 cents per kilowatt-hour range and if the batteries can hold their charge with low losses over weeks or months, the roughly equal partition between wind and solar that we have assumed in the Climate Protection Scenario may lose some of its technical merit. Seasonal balance in electricity generation is needed with present commercial tech-nologies to reduce the need for storage at high penetrations of variable energy sources. But if storage is cheap, solar would likely be favored over wind. It may also render moot the need for compressed air energy storage.230
227 Tesla 2014 228 Naam Solar 2015229 See, for instance, Casey 2015-06.230 Dramatic new concepts are also possible and indeed are likely. Solar, wind, storage, and related technologies, while already commercial, are developing rapidly. For instance, an emerging technology has integrated solar panels, inverters and battery all in one smart panel, called SolPad that also allows residential appliance and HVAC energy management. The panels are easy to assemble. (Pyper SolPad 2016 and SolPad 2016)

132
VII. Getting to an emissions-free energy system
Fig
ure
VII
-22
: P
rice
est
imat
ion o
f li
thiu
m-i
on b
atte
ries
as
a fu
nct
ion o
f cu
mula
tive
glo
bal
in
stal
led c
apac
ity.
Sourc
e: R
amez
Naa
m
(Naa
m S
tora
ge
201
5, at
htt
p:/
/ram
ezn
aam
.com
/2015/1
0/1
4/h
ow
-ch
eap-c
an-e
ner
gy-s
tora
ge-
get
)

133
Prosperous, Renewable Maryland
Turbine towers are hundreds of feet tall, as are blade sizes. Both are getting bigger, since that provides more economical generation at higher capacity factors and makes more areas economically suitable for wind. It is important to note that there is opposition to siting of onshore wind in certain areas, notably on the ridgetops of mountains, which are both scenic and among the most viable areas for onshore wind. For instance, there is strong opposition even in the economically depressed coal-mining region in Virginia’s Appalachian Mountain region, where it is viewed as “insulting” and as one more thing the outside world wants to take, after it is through with coal.231
Despite several wind projects being suspended, many more wind projects are being developed in the PJM region and are in the PJM queue for interconnection – with status ranging from active consideration to under construction. They total about 7,000 megawatts with estimated in-service dates ranging from 2016 to 2018.232
Wind resources in the Midwest are even more attractive economically than those in the mid-Atlantic region. As noted in Chapter VI, capacity factors in the best regions are 60 percent or more, compared with an average of about 44 percent in the mix used in this report. Transmission lines are an issue, not from a technical or economic point of view, but because opposition to transmission line siting is common. However, it is noted that such opposition tends to be stronger when there is the per-ception or reality that the resource is being exploited for export rather than for use both in the region and outside of it.233 Thus sharing of renewable energy resources along the transmission corridors may allow development of the most economical wind resources.
In this context, we should note that existing transmission lines can be used to carry much more power by using new conductor technology.234
Finally we should note that we have assumed distributed hydrogen production. This is more expensive per unit of hydrogen produced but it has the advantage that extensive pipeline infrastruc-ture is not needed, which also makes it less complex to estimate the cost of using hydrogen. It may be possible in the future to modify some or much of the existing natural gas pipeline infrastructure for hydrogen transportation but this is a complex enterprise that still requires a great deal of work.235 If it is feasible, it would have the advantage of providing more lexibility in the transition to a renewable energy economy.
The amount of hydrogen used in the Climate Protection Scenario is signiicant – almost 400,000 metric tons, some of it being for direct use in industry and the rest for use as a fuel in the elec-tricity sector. This imposes signiicant added costs on the overall system compared to more extensive demand response, seasonal energy storage, including seasonal vehicle-to-grid (“V2G”) use of batter-ies in lawnmowers, leaf blowers, school buses, etc. We have opted to assume that hydrogen will be used for ease of cost estimation. It is very diicult in the absence of real-world experience with high penetration of electric transportation and rate structures suited to the grid-of-the-future to estimate the extent of demand response and its availability for multi-day periods. In practice, it is likely that the amount of hydrogen would be substantially lower or that more of it would be coupled with heating systems than represented in the combined heat and power systems in our model.
231 Portnoy 2015. The principal author of this report has heard similar sentiments regarding wind power development in Western Maryland, also part of the Appalachian region. The Virginia project is still under consideration. See Dominion 2016. 232 Complied by IEER from the interconnection queue for wind projects at PJM Queues 2016. 233 Cardwell 2016234 One approach uses carbon ibers instead of steel to provide mechanical strength to the aluminum conductors. This is claimed to almost double the transmission capacity. (Composites World 2014) 235 DOE QTR 2015, Chapter 7E, pp. 9-10
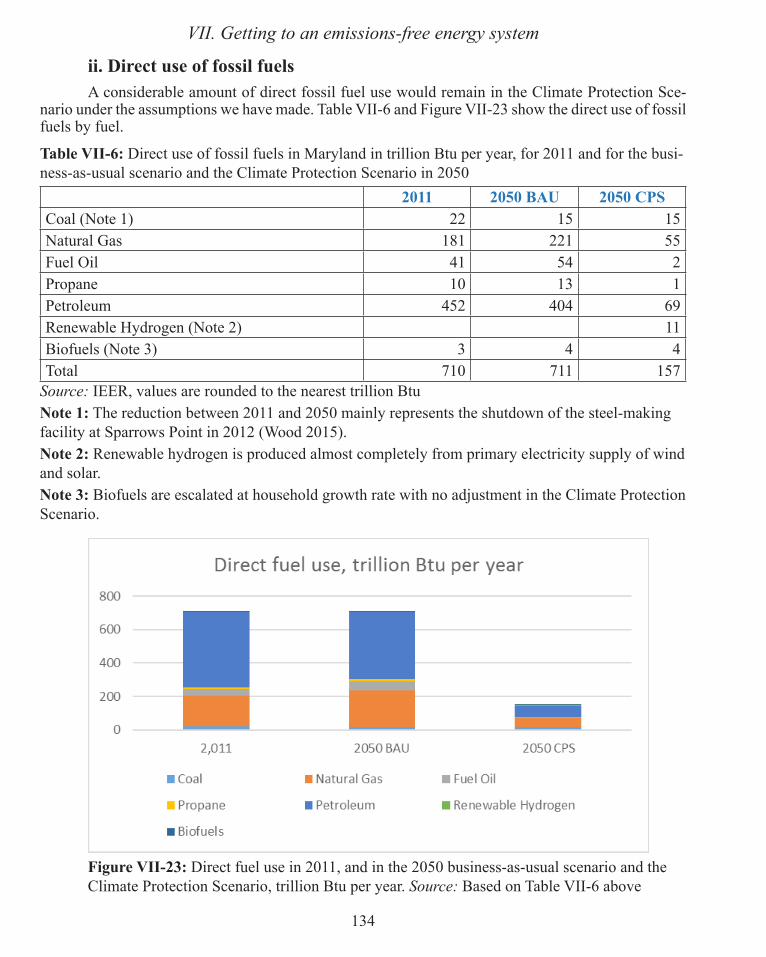
134
VII. Getting to an emissions-free energy system
ii. Direct use of fossil fuels
A considerable amount of direct fossil fuel use would remain in the Climate Protection Sce-nario under the assumptions we have made. Table VII-6 and Figure VII-23 show the direct use of fossil fuels by fuel.
Table VII-6: Direct use of fossil fuels in Maryland in trillion Btu per year, for 2011 and for the busi-
ness-as-usual scenario and the Climate Protection Scenario in 2050
2011 2050 BAU 2050 CPS
Coal (Note 1) 22 15 15
Natural Gas 181 221 55
Fuel Oil 41 54 2
Propane 10 13 1
Petroleum 452 404 69
Renewable Hydrogen (Note 2) 11
Biofuels (Note 3) 3 4 4
Total 710 711 157
Source: IEER, values are rounded to the nearest trillion Btu
Note 1: The reduction between 2011 and 2050 mainly represents the shutdown of the steel-making
facility at Sparrows Point in 2012 (Wood 2015).
Note 2: Renewable hydrogen is produced almost completely from primary electricity supply of wind
and solar.
Note 3: Biofuels are escalated at household growth rate with no adjustment in the Climate Protection
Scenario.
Figure VII-23: Direct fuel use in 2011, and in the 2050 business-as-usual scenario and the
Climate Protection Scenario, trillion Btu per year. Source: Based on Table VII-6 above

135
Prosperous, Renewable Maryland
The direct use of fossil fuels in 2050 incorporates the following assumptions:
• With some exceptions, noted below, fossil fuel use is expected to grow at the rate of household growth (as in the case of electricity), except for aircraft use, in the business-as-usual case.
• Petroleum continues to be the main fuel in the transportation sector; energy use in transporta-tion is assumed to decline despite a steady increase in vehicle-miles driven because we have assumed that the eiciency targets in federal CAFE standards will be achieved.
• In the Climate Protection Scenario, industrial eiciency is assumed to increase at 1 percent per year relative to business-as-usual – half the rate of eiciency improvements in the electricity sector.
• Coal use in the industrial sector in Maryland has been declining due to a variety of factors, including the shutdown of the blast furnace at Sparrows Point in 2012.236 The remaining major users of coal (apart from electricity generation) are two cement plants and one paper mill.237 We have used a constant coal consumption in the industrial sector at the 2013 level in both the business-as-usual and Climate Protection Scenarios. It is possible (or even likely) that some of this may convert to natural gas; we have not taken this into account.
• Natural gas use in Maryland’s industrial sector has also been declining. We used the 2013 value and escalated it at the rate of household growth to 2050. We assume a 1 percent per year rate of eiciency improvement for the Climate Protection Scenario.
• We assume that electricity will displace gasoline for industrial sector vehicles in the Climate Protection Scenario.
• Finally, we assume that renewable hydrogen would displace half of the remaining natural gas, fuel oil, and liquid petroleum gas in the Climate Protection Scenario. A detailed feasibility study would be needed to determine the fraction that can be displaced with available technol-ogy; another assessment would be needed to determine whether emerging technologies could displace greater fractions of direct fossil fuel use in industry, including in cement plants, paper mills, food processing, etc. Such studies are beyond the scope of this report. However, we note here that emissions both above and below the estimate made for the Climate Protection Scenario are possible; the end result is not very sensitive to the exact remaining fraction, so long as modest eiciency improvements are made and some natural gas use is displaced by renewable hydrogen. Further, it is possible that renewable biogas could be used in place of re-newable hydrogen. We have assumed hydrogen use since it is diicult to evaluate the caveats associated with biogas. Speciically, a case-by-case analysis will be needed to establish that a particular source of biogas is renewable and that it could be practically supplied to the facilities in question.
Direct use of fossil fuels or emissions from such use can be reduced in various ways to ap-proach a completely emissions-free energy sector. (See Section 7 of this chapter below).
iii. Overall energy supply and demand in 2050
Table VII-7 shows energy delivered to the point of use, as well as energy system losses for the year 2011 (the reference year for energy calculations in this report), electricity system losses, and primary energy use. Losses at the point of use and losses upstream in fuel production are not included. But losses in conversion of solar energy to AC and other associated solar energy losses are included.
236 Wood 2015 237 Maryland GHG Inventory 2012

136
VII. Getting to an emissions-free energy system
Thermal losses are included. They are high in 2011 and in the business-as-usual scenario in 2050, but minimal in the Climate Protection Scenario. This is because thermal generation has been almost completely eliminated in the Climate Protection Scenario. Curtailed electricity is not shown since it is likely to be used at low or zero cost outside Maryland or be reduced through better demand response and seasonal storage.
Table VII-7: Delivered and primary energy in Maryland in 2011, 2050 Business-as-Usual Scenario,
and 2050 Climate Protection Scenario, MWh and trillion Btu (as indicated)
2011 2050 BAU 2050 CPS
Res., Comm., Ind. electricity, MWh 63,596,409 83,268,480 46,580,173
Transportation electricity, MWh small small 26,361,053
Electricity for industrial H2, MWh 0 0 4,016,692
Total electricity use, MWh 63,596,409 83,268,480 76,957,918
Total electricity end use, trillion Btu 217 284 263
Res., Comm., Ind. direct fuel use, trillion Btu 274 332 97
Transportation direct fuel use, trillion Btu 435 379 48
Total direct fuel end use, trillion Btu 710 711 146
Total end use energy, trillion Btu 927 995 408
T&D losses + battery losses, trillion Btu 14 18 19
Losses in hydrogen production for electricity genera-
tion (CHP and peaking) 38
Other electricity losses (thermal for 2011 and BAU) 478 557 47
Total primary energy input, trillion Btu, AC + fuels 1,418 1,570 512
Solar losses (including DC to AC) small small 38
Total primary energy, trillion Btu 1,418 1,570 551
Source: IEER
Note: Columns may not add exactly due to rounding. Curtailed generation is not shown.
We have arrived at a truly remarkable result. Both the business-as-usual scenario and the Cli-mate Protection Scenario assume the same economic growth. We assume an economic growth rate of 2 percent per year for both scenarios; no lifestyle changes are assumed.238 Primary energy use barely grows compared to 2011 in the business-as-usual scenario despite an approximate doubling of eco-nomic output between 2011 and 2050. This is mainly because the growth in energy use in the residen-tial, commercial, and industrial sectors is largely ofset by the reduction in the transportation sector, where motor vehicles are projected to become considerably more eicient as a result of federal fuel economy standards.
(The following 2 charts are based on Table VII-7 above – note that we did not break out the electricity use again since we did that above in Table VII-4)
238 Changing culture in favor of energy conservation, such as temperature settings of thermostats and remembering to turn
of lights, would further reduce primary energy requirements in the Climate Protection Scenario.

137
Prosperous, Renewable Maryland
Figure VII-24: Primary energy use in 2011, and in the 2050 business-as-usual scenario and the Climate Protection Scenario, trillion Btu
Figure VII-25: Primary energy use in the Climate Protection Scenario, showing the detail of direct fuel use, trillion Btu
But the doubling of economic output is achieved in the Climate Protection Scenario even though end-use energy is only about 40 percent the business-as-usual level and about 44 percent of the 2011 level. The primary energy use in the Climate Protection Scenario is only about 35 percent of the BAU case and about 40 percent of the level in 2011. This large reduction in energy use is due to the following factors:

138
VII. Getting to an emissions-free energy system
• Elimination of almost all thermal losses from electricity generation. There are losses in the Climate Protection Scenario that are not in the BAU scenario, notably losses due to hydrogen production and use in the electricity sector, but these are small compared to thermal losses.
• Conversion of road transportation and most non-road transportation to electricity. Note that the direct use of fossil fuels is almost 8 times greater in the BAU scenario compared to the Climate Protection Scenario. Much of the increase in electricity use in the latter scenario is due to the electriication of transportation, which increases eiciency at the point of use several fold. When the electricity is generated with almost no thermal losses, there is a further large eiciency gain when primary energy use is calculated.
• Conversion of fossil fuel space heating, water heating, and cooking to electricity powered by renewable sources without signiicant thermal losses.Table VII-8 shows the losses in the Climate Protection Scenario electricity sector.
Table VII-8: Components of losses in electricity generation in the Climate Protection Scenario in
2050, MWh (thermal (MWh-th or electrical (MWh-e) as noted)
MWh
Solar conversion losses (MWh-e) (Note 1) 11,280,000
Net electricity used for CHP and peaking hydrogen fuel (Note 2) 11,115,144
CHP generation (MWh-th) 1,980,000
Fuel cell generation losses (MWh-th) 1,280,000
Losses in battery cycle (MWh-e) 1,090,000
Total losses during electricity generation, MWh (thermal and electrical total) 26,773,908
Source: IEER
Note 1: includes DC to AC conversion losses
Note 2: Hydrogen would be produced from solar and wind electricity. Some of this hydrogen is used as a fuel in combined heat and power plants and in peaking electricity generation. The amount of elec-tricity shown in this row is the total electricity consumption for producing hydrogen for re-use in the electricity sector less the amount of electricity so generated. In efect, hydrogen is being used in this application as a form of very lexible energy storage.

139
Prosperous, Renewable Maryland
Figure VII-26: Losses in the electricity sector, Climate Protection Scenario, 2050. Curtailed generation not shown. Note numbers are in GWh. Source: Based on Table VII-8 above
The thermal losses in the Climate Protection Scenario are only about 3.2 million MWh-th. The comparable i gure for 2011 was 144 million MWh-th.
iv. A reliable grid with variable resources
A more detailed comment on one of the most remarkable results of the electricity sector in the Climate Protection Scenario is in order. The primary supply comes almost entirely from solar and wind energy. The existing Conowingo dam supplies 572 megawatts of l exible and responsive hydro-power; yet the capacity is so small relative to the variable primary supply – 36,000 megawatts of solar and 13,000 megawatts of of shore and onshore wind – that it could be removed without signii cant change to the i nal result.
The dispatchable electricity generation resources are an existing hydropower plant (572 MW), 2,000 megawatts of combined heat and power, and peaking fuel cells (or gas turbines). The CHP and fuel cells are fueled by renewable hydrogen. The hydrogen is produced when surplus (hence, very low-cost) electricity is available. The downside of that approach is that the utilization factor of the electrolysis plant is low (just 33 percent). The resultant higher capital cost and higher i xed operations and maintenance cost per kilogram of hydrogen has been factored into the analysis.
Seasonally balanced wind and solar energy, complemented by hydrogen-fueled CHP, make it possible to meet about 87 percent of the total annual load without the mediation of storage or demand response. When l exibly operated hydropower is added, that rises to 89 percent. It is the reliable fuli ll-ment of the last 11 percent of electricity use239 and high loads for short periods of time when neither wind nor solar are available in adequate amounts that necessitates a storage, demand response, and peaking supply infrastructure. That 11 percent of total electricity usage is distributed over about one-third of the hours of the year. The fraction of hours when load is not met directly by generation would
239 Including transmission and distribution losses.

140
VII. Getting to an emissions-free energy system
likely be signiicantly lower in practice since it is likely that rate structures will incentivize charging of electric vehicles at times when surplus energy is available. Other aspects of demand response, in-cluding HVAC system settings, water heating, dishwashing, clothes washing, and the defrost coils in refrigerators and freezers, would also contribute to a system where there is a need for storage or peak-ing generation for a much smaller fraction of the year.
The optimization of the system will depend greatly on the rate structures and how the various kinds of demand response resources are incentivized. We have not made an attempt to optimize the system, even though all three elements -- demand response, battery storage, and peaking generation using fuel cells or gas turbines – are included in the Climate Protection Scenario. We expect, therefore, that the cost of a smart system with communications integrated into it will be lower than that estimated here.
Because of developments in the rapidly evolving world of electricity, there is increasing recog-nition that baseload plants, especially inlexible ones with slow ramp rates, are not needed and, at high levels of renewable penetration, result in higher costs than renewables and eiciency plus storage. This was implicitly recognized in the PG&E agreement with labor and environmental groups to phase out California’s last two nuclear power reactors by 2025 (see Section 2.vii, above in this chapter). Ed Smelof, the former CEO of the Sacramento Municipal Utility District, explicitly noted as much after the PG&E decision:
Starting in the 1980s, solar and wind power plants, driven forward by nation-al energy policies like the Public Utilities Regulatory Policy Act (PURPA) and state-enacted renewable portfolio standards, began to be connected to the elec-tric grid. Early on, many utilities warned that these variable output technologies would make the grid unstable and couldn’t be counted on to provide reliable power around the clock.
The PG&E agreement to close Diablo Canyon shows that those fears have been outpaced by innovation. It is now possible to envision an energy future where the grid will be balanced moment to moment by a combination of energy storage, responsive load and fast-ramping technologies like fuel cells. In fact, an entire section of the agreement PG&E reached with environmental groups like Friends of the Earth, Environment California and the Natural Resources Defense Council addresses the issue of grid stability and reliability through resource integration and energy storage.
This key section of the agreement acknowledges that the removal of a large base-load unit during periods of peak solar production will reduce the need for the pe-riodic curtailment of renewable resources. It also calls on regulators to give seri-ous consideration to PG&E’s development of large-scale energy storage projects, including pumped hydro storage like the Helms Pumped Storage Plant located 50 miles east of Fresno.240
5. Energy sector emissions in 2050
Table VII-9 shows the energy-sector CO2 and CO
2eq emissions for the years 2006 (baseline
year for Maryland’s GHG law), 2011 (the reference year for energy data in this report), the 2050 business-as-usual scenario, and the 2050 Climate Protection Scenario (“CPS 2050”). As per the con-
240 Smelof 2016, italics added

141
Prosperous, Renewable Maryland
vention in Maryland, out-of-state upstream emissions, including methane leaks, are not included. A 100-year warming potential for methane is used.
In the modeling assumptions we have used, the following fossil fuel uses would remain in the Maryland energy sector even in the Climate Protection Scenario:
• Some natural gas use for space and water heating in buildings, especially in the commercial sector, and a small amount of fuel oil and propane use in residential buildings;
• Non-road petroleum use in aircraft, boats, and a part of railway fuel;
• Use of coal in Maryland’s paper mill and its two cement plants at 2013 levels.
Table VII-9: Maryland CO2 and CO2eq emissions in 2006, 2011, and 2050 (two cases: business-as-usual (BAU) and Climate Protection Scenario (CPS)), in million metric tons per year
Emissions sources 2006 2011BAU
2050
CPS
2050
% reduction in
CPS relative to
2006
Electricity consumption (CO2 only) (Note 1) 42.3 37.8 42.9 0.0 100%
RCI direct fuel use, except wood, CO2 only 16.7 16.8 18.0 4.6 73%
Road transportation (CO2 only) 29.1 28.2 20.8 0.0 100%
Non-road transportation (CO2 only) (Note 2) 5.8 7.0 6.6 3.5 38%
Fossil fuel industry (CO2 only) (Note 3) 0.0 0.0 0.0 0.0 0%
Fossil fuel associated CH4 (in-state only) (Note 4) 1.1 1.0 1.3 0.1 89%
Fossil fuel associated N2O 0.8 0.2 0.2 0.1 88%
Energy-related emissions CO2eq 95.8 91.0 89.8 8.3 91%
% reduction GHG relative to 2006 0% 5% 6% 91% Source: 2006 and 2011: Maryland GHG Inventory 2012 and 2050: IEER calculationsNote 1: Includes CO
2 emissions associated with electricity imported into Maryland.
Note 2: Emissions from asphalt use are not included. Maryland assumes that petroleum use for asphalt is fully sequestered CO
2.241
Note 3: Rounded to the nearest 0.1 million metric tons. Emissions from this sector are less than 0.05 million metric tons.Note 4: Only in-state emissions are taken into account. Speciically, upstream methane (CH
4) and
nitrous oxide (N2O) emissions in fuel production and delivery are not included as per the Maryland
approach to its 2006 GHG inventory. CO2-equivalent calculations use the same GHG warming poten-
tials as the Maryland GHG inventory 2011, p. 10. The methane warming potential is calculated on the basis of 100-year averaging.
Figure VII-27 shows the data in Table VII-9 in the form of a bar chart.
241 See the asphalt and road oil item, row 10 of the “Industrial” worksheet for 2011 in Maryland GHG inventory 2012. Further, there appears to be an error in the sequestration estimate (which is greater than total energy use in the sector); this results in a negative emissions estimate for “asphalt and road oil”; this is, of course, impossible. The error does not make a material diference to the GHG inventory.

142
VII. Getting to an emissions-free energy system
Figure VII-27: Maryland CO2 and CO2eq emissions in 2006, 2011, and 2050 (two cases: business-
as-usual (BAU) and Climate Protection Scenario (CPS))
Table VII-9 above shows that these amount to about 9 percent of Maryland’s 2006 energy-related CO
2 emissions. In other words, an emissions-free electricity sector and conversion of all road
transportation and most non-road transportation to electricity can get Maryland to over 90 percent reduction in GHG emissions below the 2006 level.
i. Sensitivity analysis
The above calculations assume that the evolution of the technology and economics of electric-ity and on-road transportation sectors will allow about 90 percent reduction in GHG emissions from the energy sector by 2050. A number of assumptions were necessary for arriving at this result. The most important are the conversion to electricity of all on-road and most non-road petroleum-fueled transportation and the conversion of the vast majority of direct fuel use in buildings to electricity. We test here the sensitivity of the inal result – 91 percent reduction in energy-related GHG emissions by 2050 relative 2006 – should some of these goals not be achieved. .
In our sensitivity analysis, we estimate CO2-equivalent energy sector emissions, based on pres-
ent Maryland methodology, in two general areas. We have already estimated the reduction in emis-sions associated with our basic approach to the Climate Protection Scenario. We call this the Reference Case. We test variants for the Reference Case of the Climate Protection Scenario in case some of the reduction targets are not achieved.

143
Prosperous, Renewable Maryland
Table VII-10 shows total energy sector CO2eq emissions in the following variants of the Cli-
mate Protection Scenario:
• Natural gas is used instead of renewable hydrogen for fueling combined heat and power plants, and for fuel cells in the electricity sector;
• Fossil fuel is used in the residential, commercial, and industrial sectors at 50 percent of busi-ness-as-usual instead of about one-fourth assumed in the Climate Protection Scenario;
• Half of the petroleum usage for on-road transportation continues as in the BAU scenario, in-stead of all on-road transportation being zero-emission electric;
• The non-road transport sector is not electriied.
Table VII-10: Climate Protection Scenario: sensitivity analysis for sector-speciic carbon emissions reductions
Increment
in emissions,
million mt
Total
emissions,
million mt
% of 2006
emissions
% emissions
reduction
below 2006
Variant 1: Natural gas instead of renewable H
2 for fuel cells and CHP 1.7 10.1 11% 89%
Variant 2: Fossil fuels use in RCI = 50% of BAU 4.4 12.7 13% 87%Variant 3: On-road vehicles use petroleum = 50% of BAU 10.4 18.7 20% 80%Variant 4: Non-road transport CO
2
emissions = BAU 3.0 11.4 12% 88%Variant 5: Natural gas in electricity sector and on-road vehicles = 50% of BAU petroleum 12.1 20.5 21% 79%All variants occur 19.9 28.2 29% 71%
Source: IEER
It is clear that a failure to achieve the levels of renewable energy and eiciency transformation modeled in the Reference Climate Protection Scenario in any one of the cases would result in Mary-land not meeting its maximum Greenhouse Gas Emissions Reduction Act target of 90 percent reduc-tion in energy sector CO
2eq emissions relative to 2006 by the year 2050. Transforming on-road trans-
portation to electricity is the most critical element in success, along with transforming the electricity sector. If there are multiple deviations from the Climate Protection Scenario, then Maryland could fall seriously short of its 2050 GGRA target. We also note that we have used a very limited approach to methane emissions related to natural gas. Full accounting of methane emissions, including upstream out-of-state emissions, and use of a 20-year warming potential for methane, would considerably in-crease CO
2eq emissions estimates.

144
VII. Getting to an emissions-free energy system
Figure VII-28 shows the results in Table VII-10 in bar chart form.
Figure VII-28: Climate Protection Scenario: sensitivity analysis for sector-speciic carbon emissions reductions. Source: IEER
It is important to remember that more stringent reductions than the 90 percent reduction rela-tive to 2006 are likely to be needed if there is to be an equitable achievement limiting temperature rise to 1.5oC. That warming limit is the aspirational goal in the 2015 Paris Agreement on climate (see Chapter I).
6. Resiliency in 2050
The Climate Protection Scenario has signiicant resources that are devoted to increasing the resiliency of the electricity grid. They include distributed solar electricity generation, battery storage, combined heat and power, local hydrogen storage (at distributed production sites), smart grid invest-ments, and extensive demand response capability. That said, this report does not contain the actual design of a resilient system. Such a design requires detailed consideration of essential loads and their geographic locations on a neighborhood-by-neighborhood basis as well as by the function of the fa-cilities. In addition, more than one category of essential load may need to be considered. For instance, there are “critical” loads, which must be powered, and “priority” loads, which would receive power at high priority once critical loads have been met.242 Finally, the design of microgrids requires the input of a variety of stakeholders.
The considerations in this report are more aggregated; they are suicient for the purposes to show that signiicant provision for resilience can be made within the context of an emissions-free electricity system, and the grid therefore made more reliable and functional even in the context of changing climate. And we will see, when we consider costs, that the costs of energy services in the
242 Jensen et al. 2015, p. 19

145
Prosperous, Renewable Maryland
Climate Protection Scenario are lower than those in the business-as-usual scenario, even though there is no speciic provision for resiliency in the latter.
We can provide a semi-quantitative idea of the resiliency built into the Climate Protection Scenario. If we take 10 percent of the total load to consist of critical loads to be maintained without interruption during grid outages,243 then the daily critical load in the week of highest load would be about 28,700 MWh. Compared to this, the distributed daily solar generation would be about 23,000 MWh and total CHP daily output, running the generators at full load, would be 48,000 MWh. In addi-tion, there is a total battery capacity of 50,000 MWh, though only a fraction of that would be expected to be available if there is no advance warning of a total outage (though there would be such warning in case of extreme weather events). In all, we might expect critical loads to be supplied for 3 to 4 days of a total grid outage throughout the state if most CHP and battery capacity were strategically located in microgrids to supply essential loads. In other weeks, the total time would be longer. Further, if only portions of the state were afected, and critical loads and microgrids were linked, the period for which critical loads could be met would be longer, with the likelihood that other loads could be added as well. This type of linking would likely occur only in the long-term; appropriate technical and infrastructure and legal and regulatory bases would be have to be created as well.
7. Getting to a 100 percent emissions-free energy systemThe energy system described in this chapter so far would reduce energy sector CO
2 emissions
by about 90 percent relative to 2006. The main remaining elements of emissions in the energy system are:
• The use of natural gas in the commercial sector, mainly for space heating, and some residual use of natural gas in the residential sector.
• The use of natural gas in industrial processes, for instance for high temperature process heat.
• The use of coal and other fossil fuels in cement and paper production.
• The use of petroleum in non-road transportation, notably aircraft and boats.
There are a variety of methods by which essentially all the remaining CO2 emissions can be
eliminated from the energy sector. No single technology can achieve reductions in the variety of sec-tors remaining; a mix of the following approaches can achieve a completely emissions-free energy sector.
• Use of micro-CHP systems based on small fuel cells (a few kilowatts) for the residential sector and larger ones for the commercial sector.244 To be zero-emissions the fuel cells would need to be powered by renewable hydrogen or biogas that meets the criteria for renewable energy, as discussed in Chapter VI.
• Use of geothermal and/or cold climate heat pumps for remaining space heating applications;
• Use of district geothermal heating systems;
• Integration of seasonal storage of heat and coldness, with or without district heating systems;
243 Stadler 2014244 Dodds et al. 2015. Japan has been commercializing residential fuel cell CHP systems since 2009. A small residential electrolyzer system to produce hydrogen has been tested in New Jersey since 2006. This “hydrogen house” was built with the approval of the New Jersey Board of Public Utilities. (Hydrogen House 2016)

146
VII. Getting to an emissions-free energy system
• Use of renewable biogas or hydrogen as a fuel in place of coal for cement and paper production;245
• Use of evacuated tube solar hot water technology for industrial process heat;
• A transition to hybrid jet-fuel/electric aircraft, now being developed by the NASA, and/or hydrogen-fueled aircraft;246
• Use of renewable biofuel for aircraft, if renewability can be clearly established;
• Use of all electric aircraft;
• Replacement of short-haul aircraft by high-speed electric rail;
• Transition to some combination of renewable hydrogen, renewable biofuels, and electricity for boats and ships, along with increases in eiciency;
• Sequestration of CO2 in the curing of concrete and alternatives to concrete as a building
material.
Aircraft and boats may be among the most diicult areas of remaining fossil fuel use to elimi-nate, especially if large amounts of biofuels are to be avoided. If biofuels are used, it will be essential in such cases to demonstrate their renewability in the strict sense of the term discussed in Chapter VI, Section 2.i. A case-by-case approach within general technical and ecological guidelines is necessary and public policy regarding constraints and incentives should be made in that case-by-case context. The commercialization of purely electric or hybrid aircraft may also lead to a signiicant reduction in fossil fuel use and, hence, CO
2 emissions.
Detailed research on these topics is beyond the scope of this report, but we provide some refer-ences to indicate that deep reductions are possible in each of these areas.247
245 Biogas can be a direct substitute for natural gas if appropriately puriied. Natural gas could also be used. Maryland’s present method of calculation of the GHG emissions impact of natural gas omits upstream, out-of-state emissions and uses
a 100-year warming potential and leaks as estimated by the EPA. Under this method, the emissions would decline. How-
ever, the emissions reduction achieved by using natural gas in place of coal are diminished or eliminated if one considers
a 20-year warming potential, upstream emissions, and higher rates of leaks. See the discussion on this topic in Makhijani
and Ramana 2014, Section V. The Maryland Commission on Climate Change is due to consider whether and how it will
address the issue of upstream methane emissions as part of its 2016 deliberation. (MCCC 2015, p. 27 and p. 29)246 Commercial aircraft have been lown using both cryogenic hydrogen and cryogenic methane as a fuel. For a discussion of hydrogen-fueled aircraft see Makhijani 2010, pp. 86-88. 247 EPA Heating 2015, at https://www.epa.gov/rhc/renewable-industrial-process-heat. Hybrid and electric aircraft: For a
survey of activity, see RT News 2014, at https://www.rt.com/news/203687-electric-aircraft-commercial-stage/. For the
status of NASA’s works see RT USA 2016, at https://www.rt.com/usa/328220-nasa-electric-plane-future/ and NASA 2016,
at http://www.nasa.gov/centers/armstrong/features/sceptor.html. For hybrid ships and battery operated vessels, see Sie-
mens 2015, at http://www.siemens.com/innovation/en/home/pictures-of-the-future/mobility-and-motors/electric-mobili-
ty-hybrid-electric-ships.html. For the use of CO2 to cure concrete, see Hamilton 2008, at https://www.technologyreview.
com/s/410499/a-concrete-ix-to-global-warming/.

147
Prosperous, Renewable Maryland
VIII. Grid-of-the-Future, Energy Equity, and Energy Democracy248
1. IntroductionThe present structure of the electricity system is designed around centralized electricity gener-
ating plants, generally located far from the main consuming centers, mainly using fossil and nuclear fuels. High voltage transmission lines bring the electricity closer to the centers of consumption where the power is distributed to homes and businesses at lower voltages.249 Among other things, the transi-tion to the new electricity system will mean that solar and wind will become the primary sources of supply. In addition, there will be large numbers of distributed generating points. The grid-of-the-future must be designed for accommodating these two characteristics – increasing variable energy sources and large numbers of consumers also becoming producers – and do so while enhancing reliability and opening new opportunities for reducing costs and increasing resilience.
In the mid-Atlantic market of the multistate Regional Transmission Organization (RTO), PJM, the generating plants are owned by merchant generating companies. PJM was set up to ensure ad-equate and reliable supply of electricity in the interstate market, to promote competition in supply, and to provide electricity to the interstate market at the lowest price consistent with adequacy and reliabil-ity. It also allows non-utility electricity generators access to the grid.250 PJM also handles billing and payments in this market. Its budget comes from charges on the electricity it manages. It refunds any excess charges. It is incorporated in Pennsylvania.251
The merchant sellers of electricity in PJM are not regulated and generally are multi-billion-dollar companies. They are not restricted to owning generation assets and selling electricity but can have a variety of other interests and assets. They may contract to sell power on short-term or long-term arrangements to distribution utilities or ofer their power into the wholesale markets. Additionally, some are compensated through capacity markets to have their capacity available, independent of their energy production. They get compensated for committing to have capacity available up to three years in advance. Dispatch of power is determined by PJM to satisfy the requirements of reliability and price. Payments are made by the regulated utilities that purchase the electricity for distribution via the wires that they own in each state. PJM handles the transactions as part of its responsibilities.252 The
248 Some issues pertaining to the grid-of-the-future are also covered elsewhere in this report; see for instance, Chapter IX, Section 3.249 Transmission at high voltages reduces electricity losses.250 PJM 2016251 PJM Settlement 2016. PJM’s operating budget (i.e., not including capital expenses) in 2015 was about $270 million. (PJM 2015 Annual Report (2016)), p. 28)252 These distribution utilities are called “Load Serving Entities” or “LSEs, because they are the ones that deliver the elec-tricity to electricity-using devices (loads) in their respective areas.
148
VIII. Grid-of-the-Future, Energy Equity, and Energy Democracy
distribution utilities pass through the cost of the electricity purchased from the merchant generators to their customers. Maryland consumers are also free to purchase their electricity from other providers.253
Exelon is a major supplier in the PJM region. It had revenues of $34.5 billion in 2015. Besides over 30,000 megawatts of generating plants, Exelon also owns distribution companies that own the wires (but generally almost no generation or no generation at all). Among other companies, Exelon owns BGE, the largest distribution company in Maryland.254 This is not permitted in all jurisdictions. For instance, New York does not permit merchant generating companies to own distribution utilities.
There are also large companies that own the transmission and distribution network that is need-ed to bring electricity from the centralized generating plants to a variety of consumers from individual homes to schools and oices to large, energy-intensive industries. These are the “wires-only” utilities. Besides BGE, there are three other investor-owned distribution companies in Maryland: Pepco, Del-marva Power, and Potomac Edison. In addition Maryland has municipally-owned utilities and coop-eratives, the largest of which is the Southern Maryland Electric Cooperative or SMECO.
The business model has been that the merchant generating companies make money in a com-petitive environment, since the lowest cost resources that are able to deliver power to a particular geographic area within PJM are dispatched irst. This process is designed to marry reliability to eco-nomics. Generators that cleared the capacity auction255 are also paid to have capacity on ofer, whether called upon to provide electricity or not on any given day. As prices for capacity and electricity change, along with the supply mix and fuel prices, diferent sources of electricity gain or lose competitiveness relative to others.
The wires-only utilities are granted a monopoly for providing service in deined territories since it would be prohibitively expensive to install duplicate distribution systems. In return, they are guaranteed the opportunity to earn a rate of return on their investments (net of accumulated deprecia-tion). In contrast, since deregulation, merchant power companies are not guaranteed a rate of return on their investment. This distinction was a key part of deregulation.
The present grid is vulnerable in a variety of ways to extended disruption – severe weather events, like Hurricanes Sandy or Katrina, terrorist attacks at key nodes in the electrical transmission infrastructure, or geomagnetic storms caused by intense solar ejection of charged particles that could knock out large portions of the grid for days, weeks, months, and in the case of solar storms, even years. The present grid consists overwhelmingly of centralized capacity; it is not very resilient. It is vulnerable in a variety of ways and is likely to become more so as climate change makes unusual weather events more extreme and more frequent, as can be seen in Figure VI-11 above. As the depen-dence of the economy and society on electricity deepens, outages, especially if they extend over large areas and last for more than a few hours, are less and less tolerable. There is a need for a grid structure that has less frequent and shorter outages, more restricted in geographic area, with essential functions being served continuously – that is, for a grid that is far more resilient than today’s centralized grid.
Increasing resilience of the electricity sector at reasonable cost requires (among other things) that distributed generation be greatly increased. This is because a central feature of resilience is that critical loads be met essentially uninterrupted, which would be very diicult and costly to achieve in 253 Maryland AG Electricity 2016, which links to the PSC’s list of licensed electricity suppliers. 254 Exelon About 2016. The merger of Exelon and PHI, a wires-only company that provides service in large areas of Mary-
land (and elsewhere), was approved by the, Public Service Commission of the District of Columbia in April 2016, the last
in a series of required approvals; the merger has since been operationalized. However, it is under appeal in the District of
Columbia (Bade 2016) and in Maryland (Seltzer 2016)255 A generating plant “clears an auction” when the price at which its capacity is ofered is equal to or less than the price of the highest capacity bid that is required to meet capacity needs.

149
Prosperous, Renewable Maryland
a system that consists mainly of centralized generation sources and long distance transmission. Today this function is carried out for a limited set of loads, such as for hospitals, with emergency generators. But the centrality of electricity supply to everything from elevator operation to gas station operation to food supply necessitates a far wider set of critical loads be covered. Doing so with emergency genera-tors means that a large amount of capital equipment is idle essentially all the time. Opportunities for economic and energy eiciency are lost.
Microgrids, notably in the commercial sector (including both private and public facilities) can be an important part of increasing resilience, especially in maintaining essential public services through extended outages. A microgrid is a grid over a deined local area that is connected to the larger, macro-grid, at a single point. It has one or more types of electricity generation equipment as well as en-ergy storage. During normal operation, power is exchanged at the point of connection with the larger grid to ensure reliable operation and suicient electricity supply to all loads in a way that optimizes the economics within the microgrid, while not penalizing other customers. When there is a grid outage, the microgrid disconnects automatically from the grid and operates in “island” mode: essential loads within the microgrid continue to be met independently of the grid. Non-essential loads are not met. Other loads may operate with pre-designated priority.
Natural gas or diesel engine powered electrical generators are the usual generation equipment currently used in microgrids. The former has the advantage of burning more cleanly at the point of combustion; the latter has the advantage that a fuel supply can be stored on site. Neither is compatible with a zero-emissions electricity sector.
Resilience within the context of an emissions-free electricity sector requires that the electricity for on-site generation be solar, wind, renewable hydrogen, a biofuel that is demonstrably renewable, or some combination of these energy sources, in areas where there are essential public services. For instance, the hybrid power plant in Prenzlau, Germany, discussed in Chapter VII, Section 3.i (Figure VII-9) has wind and biogas as energy sources. There is a hydrogen electrolyzer on site as well; it sup-plies renewable hydrogen fuel for transportation ofsite (in Berlin). Such an arrangement could serve as the basis for a renewable microgrid. Variations are possible – it could use various combinations of solar energy, wind energy, battery storage, hydrogen production, seasonal thermal storage to supply heating and cooling loads, etc. It may or may not use biogas depending on fuel availability and renew-ability of the biogas.
As discussed in Chapter VII, Section 4.i, we have made signiicant provision for distributed solar and battery storage in the 2050 grid for the Climate Protection Scenario. These are comple-mented by extensive demand response capability. Optimizing the technical and economic operation of these resources will require a very diferent grid than the centralized one we have today with limited consumer-to-grid communications capability.
Distributed solar generation also provides the opportunity for democratization of the grid. The choices for individuals and small and medium businesses to own their electricity production have so far been very limited and costly. The increasingly favorable economics of distributed solar opens the door to widespread ownership of generation. Instead of thousands of generating stations, there would be millions of generating stations in the country. We are already well along on the way to that.
There is general agreement that as the fraction of distributed generation increases and as the ownership of generation also becomes much more distributed, the rules by which the grid is governed must be changed. These changes will be profound; they will open up the potential for democratizing the grid, creating opportunities for widespread ownership of emissions-free generation; it will also be generation that is free of fuel cost risk. But the challenges for maintaining grid reliability, of reforming the grid, of changing the ways revenues are generated, and achieving resilience will also be signiicant.

150
VIII. Grid-of-the-Future, Energy Equity, and Energy Democracy
It will be necessary to have a very diferent rate structure to accommodate millions of gen-erating stations, possibly millions of storage devices, demand response, electric transportation, and climate conditioning both in the winter and the summer while increasing resilience. At present, elec-tricity rates have four components:
• A connection charge;
• A charge for the amount of electricity used (in kilowatt-hours or megawatt-hours), which in-cludes a generation component, a transmission component, and a distribution component; the generation component is usually adjusted for luctuations in fuel prices (which can be signii-cant for natural gas generation);256
• A charge for the highest power demand within a month – that is, the rate for maximum electric-ity usage in the month. At present this component is typically not applied to residential or small commercial users; it is generally applied to medium and large commercial and industrial users;
• Applicable taxes, fees, and surcharges.
In some cases, especially for large consumers (and some residential consumers), the electricity rate may vary according to the time of day it is used; the electricity rate is higher when the load on the grid is expected to be high and vice versa. There are many types of rate structures that are available. Lazar Webinar 2014 has summarized them as follows (the last two of which are only feasible if Ad-vanced Metering Infrastructure (AMI) has been installed):257
– Declining Block: Lower price for increase[d] usage
– Flat Rate: Uniform rate per kWh for all usage
– Inclining Block: Higher price for increased usage
– Seasonal: Higher price in peak season
– TOU [Time of Use]: Higher price for on-peak hours
– TOU with Inclining Block
– Critical Peak: A TOU price that has a much higher price for a limited number
of hours. [Requires AMI]
– Real-Time Price (RTP): A price that changes frequently with market
conditions. [Requires AMI]
We take for granted, if we are aware at all, that certain parameters of the grid must be con-trolled to within very narrow limits: voltage, frequency, and power factor. In simpliied terms, fre-quency is the measure of the number of times voltage (or current) completes a full cycle in one second in an alternating current (AC) system. AC systems have two components of current (and voltage): one
256 There are many ways in which electricity charges can be expressed in rates: lat rates, declining block rates, where the cost per kWh goes down as consumption increases, increasing block rates (which do the opposite), time-of-use rates, etc.
See Lazar Webinar 2014.257 Lazar Webinar 2014, Slide 11. Square brackets are found in the original. “AMI” stands for “Advanced Metering Infra-
structure,” which allows automatic communication of electricity usage information in quasi-real time. This is distinct from the traditional meters which record electricity use in analog mode and which are read by meter readers periodically. AMI
can therefore be used, among other things, for providing information about real time rates to consumers. However, at pres-
ent consumers do not get real-time information. Rather it is delayed by 24 hours or more. This delay limits its usefulness
to consumers. In time, consumers will need real time (or nearly real time) information as well.

151
Prosperous, Renewable Maryland
that provides the power to do work (that is to run things) and the other that is called “reactive power” that does not work but cycles through the system. Power factor expresses the relationship between the two. These parameters are controlled by having suicient capacity available to supply load with some in reserve, including “spinning reserve,” that can adjust to rapid changes in demand as well as complementary devices on the grid for power factor control.
Further, the amount of electricity carried by the wires is almost equal to the amount consumed plus transmission and distribution losses. This is because generation by consumers for their own use, without the involvement of utility wires, has so far been very limited except in certain areas with high concentrations of heavy industries that generate their own electricity on site. The way that wires-only utilities recover their expenses and make a proit is by charging for the service of connecting consum-ers to the supply of electricity they require at all times.
Voltage, frequency, and power factor control are relatively straightforward in a centralized system. Various elements in it are coordinated and controlled so that these characteristics of electricity supply are maintained within narrow, prescribed limits. This allows devices like clocks and motors that use the electricity to operate as designed.
Distributed generation, especially distributed solar generation, changes things in very signii-cant ways:
• Large numbers of distributed solar systems that are “behind the meter” will reduce electricity carried by the common utility wires. But the need for those wires will remain for almost all consumers, if electricity is to remain afordable.258 Solar-generated electricity has a constant power factor of 1. Power factor control can be provided by specialized inverters (already in commercial use); they can also provide frequency and voltage control. Because there will be very large numbers of distributed solar resources, the job of ensuring that electricity supply meets quality criteria in regard to these parameters will become more complex. More of the job will also shift to the distribution (low-voltage) side of the grid.
• Distributed generation reduces transmission and distribution losses, the more so at times of peak consumption.259 When a local solar generator provides surplus electricity to the grid, it would generally go to a nearby point of consumption, if the density of solar installations is small; things are more complex as the density of solar installation in any neighborhood be-come high – that is, when there are more solar producers in the neighborhood.
• Voltage and frequency are not as straightforward to control if there are millions of generation points and the amount of generation is vulnerable to sudden changes, as for instance when a cloud passes over many rooftops in the middle of a sunny day. Without compensating mea-sures, the system could become vulnerable to sudden luctuations in voltage and frequency.
• Native solar generation is direct current and, as such, has zero frequency and a power factor of 1 (100 percent). Inverters, which convert this DC electricity to the AC supply compatible with electricity, can also be designed to provide voltage regulation and reactive power; it is available and is not expensive. In fact, it has already been integrated into so-called “smart inverters” that convert direct current solar electricity to alternating current at a voltage and frequency that is compatible with the grid.
258 This judgment is based on presently available commercial or near-commercial technologies.259 Average transmission and distribution losses in Maryland are about 6 percent (in round numbers). But on the hottest summer days, when demand is highest, they are much higher. At 100 percent of maximum load they can be two or even three times that. See RAP 2011, p. 1 and Figure 3 (p. 4).

152
VIII. Grid-of-the-Future, Energy Equity, and Energy Democracy
Taken together, these are signiicant technical and economic changes. For wires-only utilities to stay solvent (whether they are investor-owned, cooperatives, or publicly-owned), revenues must be suicient to pay for the wires and associated equipment needed to maintain the quality and reliability of supply and for the investments that will be needed to transition to a grid-of-the-future. Moreover, merchant generators may see a decline in sales and revenues unless they invest in renewable energy.260 The reliability of supply is evidently an interest and a concern to grid operators, but those concerns do not extend automatically to the proitability of single plants or even of particular companies (see below for further discussion).261
The electricity customers of Maryland should not be forced to pay higher prices for a transi-tion to an emissions-free electricity system in case owners of the wires-only utilities who also own generating plants (like Exelon) choose to not adapt their business models to a grid where most genera-tion is variable and renewable and much more of it is distributed. So far as the wires-only utilities are concerned, their viability should be ensured in the transition to the grid-of-the-future by the regulatory regime managed under the supervision of the Public Service Commission.
Jon Wellinghof, a former Chairman of the Federal Energy Regulatory Commission (FERC), and his colleagues published a seminal paper in 2015 setting forth “grid neutrality” principles ac-cording to which the reorganization of the wires-only portion should take place, while seizing new opportunities:262
Tenet I: Empower the consumer while maintaining universal access to safe, reli-able electricity at reasonable cost. Maximize consumers’ ability to achieve their indi-vidual energy needs and the needs of the grid without compromising the universal right of all consumers to access a safe, reliable energy service at reasonable cost. We call this “The Consumer Empowerment Principle.”
Tenet II: Demarcate and protect the “commons.” Establish clear operational and jurisdictional boundaries for public and private interests. We call this “The Commons Principle.” Tenet III: Align risks and rewards across the industry. Allocate inancial risks to stakeholders who are most willing and able to assume them. Safeguard the public inter-est by containing the risks undertaken by private parties to those participants. We call this “The Risk/Reward Principle.”
Tenet IV: Create a transparent, level playing ield. Promote and protect open stan-dards, data access and transparency to encourage sustainable innovation on the grid. Prevent any single party -- public or private -- from abusing its inluence. We call this “The Transparency Principle.”
Tenet V: Foster open access to the grid. Allow all parties who meet system-wide stan-dards the opportunity to add value to the grid. Apply all standards evenly and prevent any non-merit-based discrimination. We call this “The Open Access Principle.”
260 Merchant generators, notably owners of nuclear plants, can also seek special payments and subsidies beyond those
available in the marketplace when their plants become uneconomical. This is becoming increasingly frequent as the eco-
nomics of existing nuclear plants deteriorate. See Chapter VI, Section 7, above.261 A 2016 PJM report noted the following in regard to electricity markets and the proitability of power plants in a de-
regulated environment: “Moreover, broad economic and social harm beyond the energy markets could occur if inaccu-
rate prices in organized electricity markets result in a suboptimal resource portfolio. Nevertheless, the simple fact that a
generating facility cannot earn suicient market revenue to cover its going-forward costs does not reasonably lead to the conclusion that wholesale markets are lawed. More likely, it demonstrates that the generating facility is uneconomic.” (PJM Markets 2016, p. 36)262 Hu et al. 2015, emphasis added to some sections

153
Prosperous, Renewable Maryland
This is a sound set of principles. In a distributed grid, utility wires will carry electricity from large numbers of suppliers on the distribution side of the grid. Individuals, corporations, non-proits, cooperatives, municipalities, etc., could supply system attributes such as voltage, frequency regulation and power factor support, generation, capacity reserves, and demand response capability. They would be compensated for the provision of each attribute. The wires-only utility would be compensated for handling the various inputs from suppliers in the most economical sequence and providing power of suicient quantity and quality to all consumers at all times. The wires and associated equipment that is identiied as the “commons” of the electricity system will have to be protected, with provision for adequate investment and return (if private).
For instance, consumers who agreed to have their appliances participate in a demand response system would be compensated for that participation. Demand response allows a third party to control an electricity consuming device, such as a dishwasher or water heater or air-conditioner; the owner of the device is compensated for allowing this control, which provides lexibility in grid operation and reduces the need for peaking generation capacity and/or storage.263 In one example, a demand-response-connected clothes washer would operate some time during the day, but at a time on that day when supply was cheapest (i.e., plentiful). Those who agree to a two-day demand response schedule would be compensated more than those who sign up for one-day response only. Those who want clothes washing on demand at all times would have the highest electricity charges for that function unless they manually restricted their washing to times of surplus electricity. Consumer choice would be ensured by allowing demand response consumers a capability to override automatic operation; ex-ercise of that option could result in a higher electricity charge. This option would not be available at the times of largest peak demand (relative to variable supply) because the reliability of supply would depend on the use of demand response at such times.
Evidently, data on the electricity system must be available to individual customers if they are to take advantage of these opportunities and use electricity in a manner best suited to their situations and pocketbooks. The grid will need a communications backbone as an essential complement to the power system to enable these choices and to make them consonant with economical and reliable sup-ply of electricity services to all parties. In all cases, privacy would have to be protected; cybersecurity will also be a big issue. Lessons can be learned from other sectors of the economy that also experience privacy and security issues in the digital age.
Similarly, consumers who have solar on their rooftops but whose equipment in general use at present cannot provide frequency, power factor, or voltage support may be compensated less for feed-ing solar into the grid than those who could supply these services. Adequate account also needs to be taken of the fact that distributed solar generation, and especially distributed onsite generation (whether rooftop, canopy, or ground-mounted) signiicantly reduces transmission and distribution losses, more so during periods of peak demand. In this respect, distributed generation, including behind-the-meter systems will be no diferent than any other grid-connected element – the expense and revenue will correspond to the service provided and to the need of the grid for that service at a given time. Specii-cally, surplus generation fed into the grid could be compensated at real-time rates; this would ensure that compensation values the electricity (with all the attributes supplied) in real time.264
The wires-only utility would be compensated for handling the electricity from a variety of sup-pliers, from small to huge, and supplying it with the necessary quality (in terms of voltage, frequency,
263 See, for instance, PJM Demand Response 2016.264 At present, residential net metering occurs mainly in the context of ixed rates for electricity. Thus the compensation for solar electricity provided to the grid is also ixed rather than variable according to the state of electricity supply and demand. See Section 4 below in this chapter for further discussion of net metering.

154
VIII. Grid-of-the-Future, Energy Equity, and Energy Democracy
etc.) to all consumers. The entire system would likely require real-time rates – that is, electricity rates that change by the hour according to supply, the state of storage, and the relationship of both to the demand. Peaks of stress on the system would not necessarily occur on hot summer evenings as they do now; rather they would occur when variable renewable supply is lowest for a signiicant period of time and storage devices are depleted. In other words, in contrast to present-day peaks, which depend only on the weather and the number of consuming devices on the grid, peaks in the future would also depend on the state of the supply in relation to wind and sunshine; they would be relational peaks. If space heating is electriied, such peaks are more likely to occur during winter evenings than during summer late afternoons. Demand response will be a much more critical resource to maintain an eco-nomical system.
Just above 89 percent of the total annual electricity usage is directly met by the electric gen-eration facilities – wind, solar, CHP, and hydropower. In other words storage, demand response, and peaking generation are needed only for a small fraction of total annual electricity consumption. Spe-ciically demand response – the load met by shifting consumption from one part of the day to another, accounts for only about 0.2 percent of total annual electricity consumption. Generation from battery storage is about 9 percent; peaking generation is about 1.5 percent.
However, the picture changes drastically when one examines the situation at the time of peak demand. Only about one-third of this is met directly by wind, solar, CHP, and hydropower. The rest is met by a combination of battery capacity, demand response, and peaking capacity.
Compensation for the provision of ancillary services, such as load reduction and support to maintain voltage and frequency within prescribed limits, to providers of demand response and storage would be highest at times of lowest available supply. Consumers who do not want to or who are not equipped to provide such services would pay more for electricity at such times. It will be important to protect low-income households, especially those which may not be in a position to avail themselves of the opportunity to provide ancillary services, from the vicissitudes of real-time rates.
The balancing of supply and demand in the grid-of-the-future would be very dynamic, with much consumer choice involved. Speciically, consumers could decide to have solar supply, to partici-pate in demand response and in the provision of other ancillary services by investment in the needed equipment (smart appliances, smart inverters that can provide power factor support, etc.). Their costs will be lower if they do; higher if they do not. The implementation of an Afordable Energy Program is an essential safeguard for low-income households as the rules for the grid-of-the-future are developed. The State of New York Public Service Commission has recognized this and has ordered the implemen-tation of an afordable energy program and more than doubled the reach of the program as part of its “Reforming the Energy Vision” program:
The Commission adopts a policy that an energy burden at or below 6% of household in-
come shall be the target level for all 2.3 million low income households in New York.3
[Footnote 3 reads]: The current utility programs reach about 1.1 million customers. Be-cause customers could receive both a gas and electric discount, the 1.1 million customers equates to approximately 700,000 households. 265
It is essential for Maryland to do the same.
A sophisticated communication system with the capability to provide real-time information to consumers, providers of services, and intermediaries, will be needed. Today the main instrument of communication between consumers and suppliers is the electricity switch, which is about at the level
265 NYS PSC Afordability Order 2016, p. 3

155
Prosperous, Renewable Maryland
of functionality as the rotary dial phone – only good for one thing. And at least the rotary phone com-munication was two-way! The grid-of-the-future will be as dif erent from that as the smart phones are from the rotary dial device.
Figure VIII-1: Communications capability between producers and consumers – now and in the grid-of-the-future. Sources: Rotary phone Wikimedia Rotary Phone 2011; Smart phone: Wikimedia Nokia 2013
When seen in light of the technical and economic requirements discussed above, the need for grid-neutrality principles becomes more evident. There must be transparency of the grid parameters to all participants, large and small, if all are to be able to participate and benei t. A level playing i eld means that the grid must be open to small and large suppliers on an equitable basis; charges and compensation for services must be commensurate with what is provided in the context of the overall requirements of the grid to remain reliable and open to all participants at all times.
i. Maryland’s GOTF proceeding
The Maryland PSC ordered PHI, the distribution utility acquired by Exelon in 2015-2016, “to i le with the Commission on or before July 1, 2016 a request to initiate a grid-of-the-future proceeding that builds upon the existing infrastructure and grid modernization initiatives in Maryland.”266 PHI did so on June 30, 2016.267
PHI’s i ling is interesting in a number of respects, notably including the fact that the potential conl ict between increasing distributed generation and the resultant reduction in large-scale merchant generation, and specii cally baseload coal and nuclear plants, is not mentioned. While distributed gen-eration is mentioned extensively, the term “baseload” does not even appear in the document at all. This is remarkable for several other reasons.
• Nuclear plants in particular are inl exible and poor complements to renewables at high levels of solar and wind penetration.
• Exelon, the owner of PHI, is also the largest owner of merchant nuclear generation in the United States.
• Exelon has been and currently still is seeking large amounts of additional revenues for some of its nuclear units beyond market prices (though not in Maryland).
266 Maryland PSC 2015, p. 76267 Pepco Holdings Grid 2016

156
VIII. Grid-of-the-Future, Energy Equity, and Energy Democracy
• The potential for curtailment of variable solar and wind generation is far greater when there
are inlexible baseload resources (nuclear and coal) on the grid. The cost allocation issues from such curtailment in a deregulated merchant generation environment can be signiicant.
ii. Carbon-neutral buildings
Eiciency will need to be integrated into the grid-of-the-future with due consideration of the predominance of the role of variable renewable resources in it. Speciically, the patterns of peak load will change in basic ways from one dominated by summer peaks to relational peaks between variable supply and variable demand. Further, moving from fossil fuel space and water heating to electric space and water heating, even if eicient, tends to shift the relational peak to winter evenings and nights and secondarily to summer evenings and nights. This will put a greater premium on highly eicient build-ings that have tight envelopes similar to passive house standards and very eicient HVAC systems and appliances.
It will be important to retroit existing buildings. Over the long-term it is far more economical to build them right in the irst place. The “split incentive” – the lack of incentive on the part of build-ers to spend money making buildings eicient beyond required legal standards – is a major obstacle. Builders do not pay the energy bills; purchasers do, but their priorities in acquiring space tend to relate to “location, location, location” as the saying in the real-estate business goes. Schools, transportation, safety, convenience, beauty, functionality, and of course, price are critical elements of the decision. Energy costs are generally not a consideration in the mortgage qualiication process. In this context, spending more money to make a building more eicient is often thought to be a competitive disad-vantage. This is exactly the kind of circumstance in which regulations are required to level the playing ield. Reasonable, achievable standards for new building eiciency are no diferent than other stan-dards relating to ire and electrical codes or to structural integrity. Greenhouse gas emissions impose a burden on society.
Stringent building standards are part of the answer. Carbon-neutral buildings are those that do not use any fossil fuels in their operation and generate as much energy as they require to operate on an annual basis. In practice, this requires highly eicient electric HVAC, as well as electric cooking, water heating, and clothes drying, along with other highly eicient appliances. Building envelopes must also be tight. On-site energy supply would generally be from solar.
Architecture 2030’s 2030 Challenge has set a schedule by which new buildings and major renovations of existing buildings would be required to meet decreasing fossil fuel consumption:
• 80 percent reduction by 2020
• 90 percent reduction by 2025
• 100 percent by 2030
This would be accomplished by a combination of increasing eiciency and renewable genera-tion. The Architecture 2030 energy challenge has been adopted by “the U.S. Conference of Mayors, the federal government, and many other organizations and state and local governments….” Some have gone farther. California requires carbon-neutral new residential buildings by 2020; for commercial buildings the 2030 date was retained.268
268 Architecture 2030 Challenge (2015)

157
Prosperous, Renewable Maryland
Carbon-neutral residential buildings are feasible and economical. The average Maryland resi-dential energy expenditure in 2013, by household, was about $2,233.269 If the energy expenditures increase at the rate of inlation, say 2 percent, the present value of 30 years of expenditures amounts to about $43,000 (using a 5 percent discount rate). This means that an investment of $43,000 upfront can be justiied to build a home with zero energy expenditures, but otherwise with the equivalent attributes of an average home today.
Passive house standards are the most stringent for the building envelope. They eliminate three-fourths or more of the energy used for heating and cooling270 and cost ive to ten percent more com-pared to standard construction.271 Single family, detached home construction data indicate an excess cost of between $12,000 and $24,000 to build to these standards.272 This does not take into account the near-certain result that enactment of passive house standards would lower the cost, because such construction still tends to be custom-designed.
There is no reason for Maryland to hold back. Maryland should adopt both passive house standards and carbon-neutral new residential construction by 2020 and adopt the Architecture 2030 Challenge for new commercial buildings and all major renovations.273 That would make Maryland a leader in eiciency and create jobs in the State (see Chapter IX).
2. Equity and democracy in the grid-of-the-futureGrid neutrality principles, as described by Hu et al. (quoted above in this chapter), can set the
stage for democratization of the grid. In theory, everyone could participate in an equitable way. But that is not ensured. For instance, if landlords do not invest in smart appliances, renters could not par-ticipate in certain kinds of demand response. We may infer that the likelihood is low that low-income families who rent would be able to participate on an equitable basis under present circumstances. On the contrary, without signiicant policy changes and complements that ensure equity, a transition to the grid-of-the-future could exacerbate inequities, make energy even more unafordable for low-income households, and intensify conlicts between paying energy, housing, food, and medical bills.274
Equity and democracy require that grid neutrality principles be complemented by requirements for equity. The most fundamental principle that applies today and that needs to remain in the future, is afordability. Energy burdens, the fraction of incomes that households pay for energy, are three to four percent on average; for low-income households burdens can range from eight percent to 20 percent, rising to as much as 40 percent for households with incomes at 50 percent of the federal poverty level.
Most low-income households face heavy rent burdens as well. For instance, Matthew Des-mond has documented that rental burdens for low-income households in Milwaukee are routinely over 50 percent and can run as high as 70 percent and more of the household income.275 The interplay of rent-or-energy bill conlicts is intense. In the winter, when heating cannot be disconnected due to a
269 Total residential expenditures are at EIA SEDS Prices 2015, Table E10; the 2013 number of households was interpolated from 2010 and 2014 data at US Census Maryland 2016 270 Gregor 2015 271 Passive House Institute FAQ 2016. The added cost per square foot is smaller for larger buildings.272 Data on construction cost are from National Association of Home Builders (Taylor 2015, Table 2). We used the construc-tion cost as 60 percent of $400,000, which approximates the typical sales price of single-family houses provided for 2011, 2013, and 2015.273 Architecture 2030 Challenge (2015)274 We have described these conlicts in Makhijani, Mills, and Makhijani 2015 on which the following four paragraphs are based; for a summary of some landlord-related issues, see pp. 17-18.275 Desmond 2016, pp. 3-4

158
VIII. Grid-of-the-Future, Energy Equity, and Energy Democracy
moratorium on winter disconnections, families pay the rent and defer energy bills; come April, when the winter moratorium ends, households receive utility disconnection notices due to non-payment; rent is then deferred to pay utility bills to forestall disconnection. Inevitably, evictions follow, peaking in the summer and early fall, creating a tragic seasonal cycle.276
Energy afordability is therefore the most important principle for low-income households, now and for the grid-of-the-future. Energy afordability cannot by itself address the more diicult problem of afordable housing,277 but it could help alleviate it, signiicantly in some cases, by reducing energy burdens. Maryland has considered but not yet implemented an Afordable Energy Program (AEP). The PSC staf recommended it in 2012, but it was put on hold on grounds of high cost, among other issues.
A central feature of the AEP (also known as a percentage of income payment program -- PIPP) is that it would limit energy burdens to 6 percent of gross household income. Were the AEP to be implemented, the prospect that a transition to the grid-of the-future would exacerbate energy burdens would be forestalled. It would be systematically addressed in advance. The AEP would not by itself provide the opportunities that the grid-of-the-future would open up. But it would provide an essential safeguard: its implementation would forestall the prospect of increased energy burdens during and after a transition to the grid-of-the-future.
As noted above in this chapter, the State of New York, which has the most detailed process so far of planning for a new grid architecture (“Reforming the Energy Vision” or REV for short) has already put an afordable energy program in place as an integral part of REV. In New York, this has rightly been seen as integral to the process of creating a grid-of-the-future.278
Those complementary policies include:
• Eiciency and weatherization programs that give priority to low-income households: Struc-tures in which low-income families live are, on average, much less eicient, notably in relation to heating, than the average structure – and average structures leave a lot to be desired.279
• Universal solar access: Maryland could procure solar energy for low-income households as a group, providing them with universal solar access. The cost of solar energy has declined to a level that electricity from utility-scale installations costs less than the mix of electricity ac-quired by wires-only utilities (called “standard ofer service”).280 Treating low-income house-holds who get electricity bill assistance as a discrete group for solar energy acquisition would lower their bills at no cost to the State and allow assistance funds to help a larger number of families.
• Community solar: A community solar program would help households and businesses, which for one reason or another cannot install solar on their properties, purchase or lease a part of a
276 Desmond 2016, pp. 15-16277 Housing is deemed afordable for a household if the expense of rent (or mortgage) plus energy bills is less than 30 per-cent of gross household income. (Maryland AEP 2012, pp. 1-6)278 NYSERDA 2016279 Makhijani, Mills, and Makhijani 2015, Chapter III, Section C, and Chapter VI.280 The economics of solar are evolving rapidly and are complex. Maryland does not need to subsidize utility-scale solar
for it to be lower cost than standard ofer service. However, there is a 30 percent federal investment tax in place currently. It will start declining at the end of 2021 and go down to 10 percent after 2023. (SEIA 2016) Accelerated depreciation is
available for a wide variety of investments including solar energy. See IRS Pub 946 (2015), Section 4. With these and
the declining cost of solar, the price of electricity from competitively procured utility-scale solar and even larger installa-
tions of one or two megawatts should continue be lower than current typical standard ofer service prices (about 8 cents a kilowatt-hour for Pepco from October 1, 2016 until May 31, 2017) unless the cost of standard ofer service declines signiicantly. (Pepco 2016)

159
Prosperous, Renewable Maryland
larger community installation that is built elsewhere. Maryland has instituted a pilot commu-nity solar program to test the parameters for wider implementation.281
In our energy justice report, we recommended universal solar access on the principle of com-munity choice aggregation for a number of reasons, including the fact that it could provide all low-income households with the beneits of solar energy in a manner which would reduce their electricity costs. This could be done essentially at no cost to the State or to other Maryland ratepayers. The prin-ciple can be extended to cover wind energy as well. Of course, such acquisition would be conditioned on the renewable energy being cheaper than standard ofer service.
As is well known, low-income households have little or no access to solar energy for a com-plex mix of reasons, including the fact that they are low-income households (i.e., without the upfront cash needed for solar) and that most are renters (i.e., without access to a place to install solar). Figure VIII-2 shows data from Arizona, California, and New Jersey on the income groups that have rooftop solar installations.
Figure VIII-2: Income distribution of households installing solar in the 2009-2013 period (APS = Arizona Public Service (17,162 installations in 187 ZIP codes); CSI = California So-lar Initiative (80,440 installations in 1,275 ZIP codes,); NJCEP = New Jersey’s Clean Energy Program (17,987 installations in 562 ZIP codes). Source: Recreated from Hernandez 2013, Figure 3 (p. 4) and p. 7. This report, Solar Power to the People: The Rise of Rooftop Solar
Among the Middle Class, by Mari Hernandez, was published by the Center for American Progress.
281 Maryland PSC 2016, p. 7, and Maryland PSC RM56 2015-2016
160
VIII. Grid-of-the-Future, Energy Equity, and Energy Democracy
In reviewing Figure VIII-2 it is important to note that the federal poverty level for a family of four in 2013 was only about $23,000, compared to the below $40,000 at which solar access was found to be very low in the states studied.
The answer to the problem of unequal access to the beneits of solar energy is not to shut the door on those who have that access, but to create reasonable and achievable paths for those who don’t.
In addition to outcome-oriented equity, there is also process-oriented equity. The issues of ownership of energy resources and equitable access to opportunities, given the diferential in incomes and home ownership, need to be systematically considered in the context of the grid-of-the-future. The extra efort needed to make utility data and information accessible and understandable to consumers, including low-income consumers, as new opportunities arise, is all the more important in the context of a transition to the grid-of-the-future.
For instance, community solar beyond Maryland’s pilot program would, in principle, create opportunities for all to invest in solar energy to meet their energy needs. But in the absence of inanc-ing in the context of the real-world situations of low-income households, these opportunities will be accessible to only a few.
Representatives of community organizations who advocate for low-income households and distributed ownership should be provided with the resources to intervene in public proceedings where grid-of-the-future issues are considered. The safeguards provided by the Oice of People’s Counsel are critically important. But energy democracy can and should go much farther in its inclusiveness, with due consideration to the imbalance in resources between members of the public, small organiza-tions, and the utilities that appear before the PSC. The PSC should also consider evaluating the fair-ness and equity of its own proceedings by the outcomes as they relate to conversion of opportunities to favorable outcomes for people with limited means, including low-income households.
i. Long-term: AEP-Plus-Transportation
Household energy costs today occur in two or three separate bins: an electricity bill, a natural gas, fuel oil, or propane bill (for homes that are not all-electric), and transportation-related energy costs – almost always in the form of payments for gasoline or diesel fuel. The irst two go under the general rubric of “household energy costs”; the fraction of gross income spent in a household called “energy burden.” The Afordable Energy Program (also known as the percentage of income payment program) is designed (among other things) to limit this household energy burden to six percent with the rest being covered by assistance.
Transportation-related fuel costs are highly variable – more so than any other element of house-hold energy cost. On average, for all households, transportation fuel costs were about $1,000 or about 2 percent of household income in 1999. They rose to about $2,700 or about 4 percent of income in 2008, fell to 3 percent in 2009 (due to the recession) and rose again to 4 percent by 2012.282 They have been going down in 2015 and 2016 due to falling crude oil prices. At $2,000 per year, the transporta-tion fuel cost burden for a three-person low-income household at poverty level would be roughly 10 percent,283 or over three times the expected 3 percent or so on average.284
In a system with electriied cars, the transportation fuel bill would be (i) much lower (since electric cars are much more eicient) and (ii) would be integrated with the electricity bill to the extent that cars are charged at home. Electric cars can only fully replace petroleum-fueled cars if they have
282 EIA Today in Energy 2013 283 The poverty level for a three-person household in 2016 is $20,090. (Federal Poverty Level 2016)284 Estimated by IEER based on 4 percent burden being $2,700 in actual fuel expenses in 2008.

161
Prosperous, Renewable Maryland
adequate range (see Chapter V); in this context they would be likely to be charged at home, but not always. Thus, in the long-term, the Afordable Energy Program would likely have to be adjusted to accommodate electric cars:
• The percentage of their income that low-income households would pay for an integrated household-plus transportation fuel cost would be increased from 6 percent to some higher value to relect the larger mix of fuels and expenses being covered by the program;
• Adequate account will need to be taken in order that the program does not discriminate against, but rather encourages, public transport.
• Low-income households must have convenient options, such as pre-paid cards with reason-able (or zero) fees, for payment at public charging stations, to allow for cases where people do not have credit cards or prefer not to pay by credit.
ii. Broadband access
Additional eforts will have to be made to level the playing ield as the grid-of-the-future be-comes a reality. As noted, communications capability will be essential to take advantage of the oppor-tunities for ofering demand response and other ancillary services to the grid. If, as we recommended in our prior reports, heating is electriied using eicient technologies,285 demand response opportunities would be even wider than they would be with natural gas or fuel oil heating, which account for about two-thirds of home heating systems in Maryland. In fact, demand response could become an important method for low-income households to reduce their electricity bills. However, it will require suitably equipped homes – smart outlets, thermostats, and eicient appliances. Broadband access and the smart devices to control energy use will be needed. Education eforts to enable low-income households (and not only low-income households) to take advantage of the opportunities will also be needed.
It is critical to stress the point about broadband and/or smart device access. There are already stark diferences in such access between income groups. In 2015, only 41 percent of households with annual income below $20,000 had home broadband connections; another 21 percent had smart phones but no broadband. The comparable igures in the $50,000 to $75,000 income bracket were 80 percent and 10 percent respectively.286
Lack of broadband access already hampers access to government services, health information, and opportunities for learning. Cost is the single most common reason for not subscribing to broad-band, cited by a third of non-subscribers with the cost of the computer being a barrier for an additional 10 percent.287 It also hampers the opportunities for telework, which could be far more economically important to low-income families, since it would save transportation costs.
The lack of opportunities is likely to be aggravated with the advent of the grid-of-the-future in the absence of suitable public policies. For instance, rental codes and possibly other local, state, and federal regulations may need to be updated to include requirements for smart appliances when appli-ances are replaced. Incentives can be directed preferentially to units occupied by low-income renters or owned by low-income households. Specialized devices dedicated to energy-control opportunities could be made part of energy assistance. Software to enable smart phones to serve the functions of control of energy consuming devices already exist. Coordination between telecommunications and energy regulations will be important to protecting low-income households and ensuring that they have equitable opportunities to beneit from the grid-of-the-future and in telework, telehealth, etc. At
285 Makhijani and Mills 2015286 Horrigan and Duggan 2015, p. 2 287 Horrigan and Duggan 2015, p. 4

162
VIII. Grid-of-the-Future, Energy Equity, and Energy Democracy
a minimum, equity implies access to services at an afordable price. We recognize that the availability of opportunities does not ensure that people will take advantage of them. A signiicant education efort will also be needed, as is also the case with eiciency.
3. Energy democracy
Democracy is basically about control and choice; as a corollary, energy democracy is about control and choice in regard to energy supply and use. These choices must, of course, be within certain parameters for everyone who makes use of the common grid because they must be compatible with afordability and choice of others who share the commons of the grid and with the ability of the operators of the grid to maintain its reliability.
Until recently, the main thing in the control of households relating to energy was the extent of use. Even in that arena, much of the consumption relates to the nature of the structure, the eiciency of the appliances, the type of HVAC systems, and the eiciency of structures. These are normally not in the control of renters at all. Homeowners replace appliances over time and can (and do) choose higher eiciency devices, though low-income homeowners are generally at a disadvantage unless there are eforts to ensure equity in outcomes. Further, it is more complex to retroit existing structures to make them more eicient and more costly to do so than building them well in the irst place. That control belongs to builders, who currently have no systematic incentive or requirement to build the most eicient houses and to governments (federal, state, and local) who set building codes.
If democracy is about inclusion of all people, then equity must be a central principle; the rules must level the playing ield in the context of recognizing the unequal economic, institutional, and information access power of the various parties. If all Marylanders are to partake of the beneits of a clean, afordable, and resilient elec-tricity system, then programs and processes must systematically be oriented towards ensuring afordability and opportunity.
It is now possible for millions of people to become owners of electricity generation systems, notably of dis-tributed systems, either directly on their own property or as part owners of community installations. But the speciic situation of low-income households makes it diicult and, so far in Maryland, almost impossible to partake of the beneits of the ownership of community systems. In this context the principles created by the New York State Energy Democracy Alliance, paraphrased here in the Maryland context should be critical ele-ments of energy democracy and the grid-of-the-future.288
• Racial and economic injustice and energy insecurity must be remedied “by targeting the beneits of state-funded energy eiciency and distributed renewable energy development to communities con-fronting those injustices.”
• The beneits of an eicient and renewable system must accrue to all Marylanders, “regardless of home-ownership status, location, race, wealth, or income.”
• “All institutions that make decisions for the public around energy or energy market development should create mechanisms to ensure widespread and meaningful participation in democratic decision-making, transparency, and public accountability.”
• Creation of good jobs and economic opportunities “for local people often left out of economic oppor-tunities, including people of color, youth, women, formerly incarcerated individuals, refugees, immi-grants, veterans, long-term unemployed and members of frontline climate-vulnerable communities” is essential if the beneits of a distributed and eicient energy system are to be equitably enjoyed.
• A just transition for workers and communities currently heavily dependent on the centralized thermal generation system is also essential for energy democracy. We address this issue in Chapter X.
288 The irst four bullet points are quoted from or paraphrased from the principles enunciated by the New York State Energy Democracy Alliance, at http://energydemocracyny.org/about. (Energy Democracy Alliance 2015)
163
Prosperous, Renewable Maryland
As we have discussed, widespread adoption of distributed solar installations and other features of the emerging grid structure will require many changes to the way the grid is operated. It will also require change in the way utilities, other participants in the electricity market, as well as individual owners of electrical assets, including solar installations, are compensated. Transparency is essential to energy democracy in this context. Transparency includes:
• Availability of real-time data on the state of the grid, rates, and household energy use status as the system evolves to accommodate large fractions of variable solar and wind resources289;
• Openness of regulated utility information to the public before, during, and after the conclusion of regulatory proceedings;
• Transparency and full disclosure of data, prices, advantages and disadvantages of particular technology options, and contracts;
• Ensuring that renters and advocates for low-income households and economic and racial jus-tice have the capacity to make use of the data to advocate for equity and for new opportunities beyond the current essential advocacy for all ratepayers, including low-income ratepayers, done by the Maryland Oice of People’s Counsel. Timely availability of regulatory information, a reduction of the cost barriers to intervene in
cases for parties who have been granted standing, will become more important in the future. At the same time, ancillary beneits to the public, the environment, and taxpayers of an equitable and democ-ratized grid-of-the-future that combines choice with afordability could be immense. We have argued, in our energy justice report, that just the reduction of homelessness that would accompany the adop-tion of the Afordable Energy Program would provide a large number of beneits beyond the realm of energy, both to low-income households and to taxpayers and society at large. Similarly, using the occasion of a transition to the grid-of-the-future to ensure broadband access could provide many non-energy beneits, including educational and employment opportunities and health information.
We will explore the net metering issue in some detail since it is at the heart of considerable de-bate and conlict in the electricity sector and since it is germane to the future of distributed generation.
4. Net metering and the value of solar energyRooftop solar energy in the United States has generally been “behind the meter” and has been
accompanied by a “net-metering” policy. When solar generation is less than or equal to the demand on site, the electricity produced is consumed entirely on site; it does not register on the meter – hence the term “behind the meter.” Also when solar output is less than on-site demand, the deicit is supplied by the grid at the same price as for other consumers. When solar output is more than demand the surplus electricity is exported for a price that is the same as the retail rate charged to the customer, at least in Maryland. The term “net metering” derives from these two features – the purchase price from the grid is the same as the sale price to the grid. The usual way of implementing this net-metering approach is that the meter goes forward – i.e., registers billable consumption – when solar generation is less than consumption; the meter goes backward – i.e., subtracts from billable consumption – when surplus gen-eration is exported to the grid. “Virtual net metering” is a variant of net metering; in this case the solar installation is not literally behind the meter, but generation is credited to owners of the solar installa-tion as if it were. Maryland’s pilot community solar program will avail itself of virtual net metering in which the equality of purchase and sale price is maintained.
289 The general availability of real-time data will take time and investment. It becomes more important as smart appliances become more widespread and high penetration of variable resources increases the value of demand response.

164
VIII. Grid-of-the-Future, Energy Equity, and Energy Democracy
Net metering is generally not used with utility-scale generation, where large-scale solar (or wind) installations feed all the electricity into the grid and sell it into the wholesale markets or to consumers with whom they have contracts for electricity supply at an agreed price. In such instances, the wires-only utilities collect their normal transmission and distribution charges from the consumer.
Net metering has provoked signiicant opposition from some utilities. They argue that the grid is serving as storage for the on-site solar, accepting generation at times of surplus and providing elec-tricity during deicit periods. They argue that compensating exports of solar electricity to the grid at the retail rate is unfair to non-solar customers and that a lower (perhaps wholesale) rate should be credited.
The basic problem, as discussed, is that under the present business model, wires-only utilities revenues depend on the amount of electricity sold (and for large commercial customers the maximum demand per month as well). Behind-the-meter solar generation reduces sales made by the utility and hence revenues. That is why there is general agreement that the business model of wires-only utilities must change as the amount of behind-the-meter solar grows to a large fraction of sales. The function of the wires needs to change in any case with millions of producers as well as consumers. Behind-the-meter solar production is therefore just one element of the transition, but one that is prominent and particularly contentious at the present time. The ability of consumers to produce their own electricity, currently usually done behind the meter, is also a principal aspect of emerging energy democracy. Both equity issues (fairness to consumers who do not have rooftop solar) and democracy require a reason-able resolution of how to compensate behind-the-meter generation.
An important example of opposition to net metering can be found in the views of Exelon’s
CEO, Chris Crane. Exelon owns BGE as well as PHI; it therefore distributes electricity to the vast
majority of retail electricity consumers in Maryland. Mr. Crane has suggested that net metering should
be replaced by a diferent, much lower, wholesale price for the portion of rooftop solar electricity sold to the grid. . In his remarks at a Resources for the Future forum in May 2014 (posted on the Internet),
he said:
As I said earlier, if you put a solar panel on your roof, that is your choice. If you have excess
power and want to sell that power back to the grid, that’s fantastic for the grid. But what has
to happen to enable that? The design of the system, the local distribution system, has got to
handle the voltage luctuations. They’ve got to be able to dispatch the power out and they’ve got to be able to dispatch the power in. There’s a speciic capacity need that each customer has. If they’ve got a 200 amp service entrance on their house, that utility distribution system
needs to be designed to provide them 200 amps at any instantaneous moment they want. Just
because they put a solar panel on doesn’t mean they’re disconnecting from the grid. There’s
a dependency, but there should be an enabling on the grid to allow that and the consumer
should be compensated at the wholesale price of energy.290
It is quite common for houses to have 200-amp service. To charge solar-producing customers for 200-amp service but not others would be clearly discriminatory. For instance, even heavier lines are often needed for multi-million dollar mansions. There is no additional charge for service up to 400 amps. All of them demand electricity at any moment they want, to the limit that the supply line allows. There is not a lower charge for people living in homes with 100-amp service. The electricity connection to the grid that is provided is covered by the ixed charge in an electricity bill, which gen-erally “include[s] the costs of metering, billing, and payment processing.”291 It is the obligation of a distribution utility to provide a connection to customers on a non-discriminatory basis – that is part of
290 Crane 2014, ca. min. 56:27 to 57:32 291 Lazar 2014, p. 1

165
Prosperous, Renewable Maryland
the bargain on which the distribution monopoly is granted. Payment for electricity exported to the grid, whatever the rate, should not be confused with non-discriminatory provision of the service.
A special charge for some customers just because they have solar generation is discrimina-tory and divisive. 292 This was dramatically demonstrated in Nevada in 2015, when ixed charges were tripled for solar customers retroactively; the policy change caused a severe downturn in the solar industry in that state293 and a political and economic upheaval that has not yet ended.294 Such a policy would also put roadblocks in the way of developing distributed solar generation that is a critical ele-ment in the future grid that we need. For instance, distributed renewable generation is important for reducing emissions in a manner compatible with increasing grid resiliency.
It is widely acknowledged that calculating the value of the grid to rooftop solar and the value of solar to the grid and to customers who do not have rooftop solar is a complex issue that eventually needs to be resolved by moving to a more comprehensive set of considerations about distributed generation generally and solar generation in particular. The most important point in this context is that the value of solar is contextual. When there is little rooftop solar on the grid, the value may be very high. There are many beneits: from reduction of peak loads and transmission and distribution losses to reduction in air pollution, water use, and CO
2 emissions.
Maryland is not at the point where behind-the-meter solar generation is a signiicant economic issue.295 A 2014 study done by Lawrence Berkeley National Laboratory estimates that at a distributed, “customer-sited” solar PV penetration of 2.5 percent of electricity use, the rate increase would only be 0.2 percent for a northeastern utility operating in an environment where generation has been deregu-lated.296 This implies a bill increase of 30 or 40 cents per month.
Maryland’s current law sets a goal of 2 percent solar by 2020. By September 2016, 508 mega-watts of solar had been installed in Maryland of which 238 megawatts (47 percent) were residential and 207 megawatts (41 percent) were commercial; the rest was utility-scale, which is not net metered.297 Net-metered electricity would correspond to less than 1 percent of Maryland’s electricity sales, even if all the residential and commercial capacity were net-metered, a considerable distance from the 2.5 percent used in the Lawrence Berkeley National Laboratory study to estimate costs. Maryland’s solar renewable energy credit system may produce somewhat higher costs than estimated in the Lawrence Berkeley study. Even so, the cost of distributed solar PV would be less than two dollars a month by 2020 for a typical residential customer, all other things being equal. Rather than abandoning net meter-ing, increasing access to low-income households and adoption of the Afordable Energy Program are important instruments to protect low-income households during the transition to the grid-of-the-future.
Rooftop solar and, more generally, distributed solar are critical to a renewable energy future in Maryland that is also afordable and democratized. The value of solar as distributed generation grows will be contextual as will the value of all the other elements of the grid-of-the-future. As discussed pre-viously, the value of solar to the grid would be greater if the inverter were able to supply power factor support and that support were controllable by the grid operator (directly or via an aggregator). Such an
292 Levying high ixed charges for all consumers would be very deleterious for low-income households and also be a dis-incentive for energy eiciency. Since wires-only utility revenue requirements are ixed by regulation, high ixed charges would mean lower per kilowatt-hour electricity rates, which would encourage consumption.293 Pyper 2015 and Shallenberger 2016294 Pyper Nevada 2016 295 This and the following paragraphs on net metering are based on or taken from Makhijani 2015, unless otherwise noted. References to sources are found there.296 LBNL 2014, p. ix. The study used Massachusetts data in its calculations (Section 3.2). 297 See SEIA Maryland 2016

166
VIII. Grid-of-the-Future, Energy Equity, and Energy Democracy
arrangement would produce value for the owner of the solar in the form of greater compensation for solar energy than were such support not available. Similarly, the value of solar to the grid is greater if it is accompanied by battery storage on the feeder on which the solar is located and the storage can be controlled by the grid operator. The owner of the solar may forgo the compensation (or lower rates) implied in such an arrangement by choosing to use the storage on the premises at will. In all cases, the value will depend on the amount of solar and storage on the distribution side of the grid and on the availability of the resource as a resource for the commons. In this sense, determining the value of solar is not diferent than determining the value of any other element that interacts with the grid.
For instance, the value of demand response is also similarly contextual. When is it available? What are the load characteristics? Can it be aggregated with other elements of demand response? How much overall demand response is available at a particular time?
Until the time that such questions are considered in the context of the transition to a grid-of-the-future, net metering can be left in place. In the context of low penetration of solar, net metering may even undervalue distributed solar electricity. A study commissioned by the Maine Public Utilities Commission on the value of solar energy to the grid concluded that it is very large – 18.2 cents per kWh in the irst year, growing to more than 33 cents per kWh in subsequent years (levelized 25-year value).298 The elements of that long-term levelized value can be seen in Figure VIII-3.
Figure VIII-3: Components of the levelized value of solar electricity. Source: Adapted from
Maine PUC 2015, Figure ES-2 (p. 6)
298 Maine PUC 2015, Figures ES-1 and ES-2 (pp. 5-6)

167
Prosperous, Renewable Maryland
This is a far cry from being pegged at the avoided wholesale energy cost, which at about 8.1 cents per kWh is only about one-fourth the total estimated value. The reduced pollution alone is valued at more than that. There is a signiicant capacity value (avoided capacity costs); the elimination of fuel cost risk (“avoided fuel price uncertainty”) is also a signiicant beneit.
However, a number of the beneits are social, health, and environmental beneits. Most are not monetized in the current regulatory system. Valuing solar energy in this way would take signiicant regulatory changes. We are not arguing for those changes to be made in Maryland’s net metering sys-tem. Rather, this study is cited to show that for the coming years, Maryland can maintain and expand its net metering policy as it pursues the equitable rules for the grid-of-the-future. Lazar 2014 has pro-posed a “minimum bill” approach that is something of a compromise between increasing ixed charges and net metering. The minimum bill is higher than the usual ixed charge, but also includes a small initial block of electricity.299
It is likely that real-time rates that include compensation for ancillary services would provide the most eicient overall scheme. Equity considerations necessitate that an Afordable Energy Pro-gram be into place as a critical safeguard for low-income households under all scenarios and should be pursued proactively. That path will allow Maryland to pursue a grid structure that will meet the criteria of equity, reliability, and afordability, even as emissions are lower and the system transitions to a democratized one that has many more afordable choices than are available today. Given the huge stakes, there is of course a special need here for an open and participatory resource planning process (including non-governmental and utility stakeholders) as the changes needed for a grid-of-the-future are put into place.
But given that solar penetration is low in Maryland and that a grid-of-the-future proceeding has been initiated by the Maryland PSC,300 there is no reason to make a change to the State’s net meter-ing policy. Behind-the-meter generation will be just one element among many in the redesign of the grid-of-the-future.
5. Structure of electricity system management A grid with a larger number of distributed generation, storage, and demand response elements
will need technical and economic resource management in the distribution system that will be much more sophisticated and structured than at present. At the same time, large-scale resources, such as wind farms and utility-scale solar sold in interstate markets may require a reworking of the structure of the wholesale electricity market because both wind and solar have no fuel costs or maintenance costs that vary with the amount of generation. Rather, fuel costs are zero, and maintenance costs tend be ixed according to the size and type of system.
Managing thousands of generating stations and ensuring that the electricity arrives at every one of millions of consumption points at the exact time it is demanded – that is, when the switch is turned on – and is disconnected at the exact time when the switch is turned of – requires a complex technical and economic structure managed by Regional Transmission Operators (RTOs), like PJM. RTOs man-age the high-voltage side of the electricity grid.
On the distribution side of the system, there are mainly consumers who use electricity at low voltages. The complexity of the system on the consumer side of the system is increasing signiicantly; indeed it will become more complex when there are millions of prosumers, who have rooftop solar, batteries, demand response capabilities, and the capacity to provide ancillary services. As we have
299 Lazar 2014, Table 1300 Maryland PSC Grid 2016

168
VIII. Grid-of-the-Future, Energy Equity, and Energy Democracy
discussed, managing this complexity will require a communication system working in parallel with the power system. Institutionally, the power and communications system on the distribution side of the grid will need to be managed by one or more entities similar to an RTO. Such an entity is called a distribution system operator (DSO), which is
...the entity responsible for planning and operational functions associated with a distri-
bution system that is modernized for high levels of DERs [Distributed Energy Resourc-
es]. The term DSO is not intended to imply the need for a diferent entity from the exist-ing utility. Although the term is becoming more widely used in industry discussions, it
does not yet indicate a single, well-deined business model, organizational structure or complete set of functional capabilities, nor does it need to. Rather, we adopt the term
DSO simply to recognize that distribution operations of the future will have some func-
tional capabilities beyond those of utility distribution operators today, if for no other
reason than to be able to plan and operate the system reliably with large amounts of
diverse DER and multi-directional energy lows. Depending on policy choices in each jurisdiction, the DSO may be limited to the minimal functions needed for high-DER
operations, or may expand to a more proactive role in guiding DER deployment to meet
locational needs or facilitating or “animating” markets for DERs and prosumer energy-related transactions.301
Pricing of electricity supply today takes into account supply from large generating stations. A critical consideration in the order in which generation resources are selected is the price at which they are ofered on the market.302 Marginal cost – the added cost of generating a kilowatt-hour of electric-ity, once the generating system has been built – plays a large role in dispatch order in order to provide consumers with the lowest cost at a given level of reliability. In fossil fuel and nuclear generating sta-tions, which provide the bulk of the electricity supply at present, marginal cost is determined by fuel cost and the added cost of maintaining the generating station if it is used to generate more electricity. In addition there are ixed costs of operations. This is much like the cost of operating a car, where there are fuel and added maintenance costs when it is driven (like gasoline, more frequent oil changes, and tire wear) compared to the ixed costs like insurance and motor vehicle licensing fees that must be paid whether the car is driven or not.
Further, electricity follows complex and varying routes from generating station to millions of consumers depending on the amount of electricity being demanded at any time, the various places where it originates, and the transmission nodes it must pass through. Just as water travels from higher pressure to lower pressure till it comes out of the tap, electricity cascades through the transmission system from slightly higher voltage to lower voltage passing through a variety of nodes. If certain points in the system become congested, transmission losses increase, voltage drops, and, if congestion is too great, the system may break down. Managing these lows is a central task of RTOs. They are aided in this by a system of congestion pricing, called “locational marginal pricing” (LMP). This is like varying the toll on a road according to the amount of traic on it at any given time. These costs can be substantial especially for low-income households. For instance, Maryland consumers served by regulated distribution (wires-only) utilities had to pay congestion charges of about $304 million, $114 million, and $215 million in 2011, 2012, and 2013 respectively.303 On average, residential consumers would pay about $40 each year in their electricity bills just for congestion charges.
301 De Martini and Kristov 2016, p. vi302 The price of supplying electricity includes, among other things, the cost providing a irm commitment in advance that capacity will be available.303 Maryland PSC Plan 2014, Table 12 (p. 30)

169
Prosperous, Renewable Maryland
Solar and wind generation have zero fuel cost and essentially no variable operations costs. The maintenance requirements are ixed by the size and type of system. Thus, the marginal cost of genera-tion is zero. The patterns of congestion and therefore congestion pricing patterns will change as well. Wholesale electricity pricing on the high voltage side, as managed by PJM, will have to take account of the supply from large-scale generating stations, like ofshore wind farms. Those prices will be af-fected by how much electricity is being generated on the distribution side of the system and where in the system the distributed generation (like rooftop solar) is located.
Finally, the procuring large amounts of wind and solar electricity will be more economical if project developers can secure long-term contracts (ten years or more) for sale of the electricity at pre-determined prices (with or without escalation over time). If that approach is adopted, it would will re-quire signiicant changes to how electricity is procured, since present patterns of electricity purchases are on much shorter time scales.
The transition to a grid-of-the-future with signiicant distributed resources, supplied mainly by variable generation, will be a complex afair and will require many changes to all aspects of the electricity system. In other words, the diferent technical structure of the grid-of-the-future will require a corresponding economic, regulatory, and institutional model that is adapted to the new technical
structure.

170
IX. Economic considerations
IX. Economic considerations
We have done a comprehensive cost assessment of the Climate Protection Scenario in 2050. We have compared this to 2011 costs, in absolute terms, as well as relative to the size of the Maryland economy. We have also projected a “business-as-usual” case, using details in the Energy Information Administration 2015 Annual Energy Outlook Reference Case.
It is very important to note that we do not attempt to quantify the severe damage due to climate disruption and continued use of fossil fuels that would occur in the business-as-usual case. Nor do we impute monetary costs to air and water pollution and GHG emissions for the purposes of comparison. The main reason is our central cost inding: it makes economic sense to transition to a low-emissions energy sector and an emissions-free electricity sector independently of climate considerations because the overall cost of doing so is lower than the business-as-usual case. All of the other beneits are a huge bonus that derives from the boldness to make the decision to create an essentially emissions-free energy sector and a completely renewable, emissions-free electricity sector. Put another way, the over-all cost of decarbonizing the energy sector by about 90 percent is negative. The main issues relate to the distribution of the costs and beneits – we must ensure that communities and workers in fossil fuel industries are protected in advance of the negative impacts of the transition afecting them and that all people in the Maryland, including low-income households, can beneit from the lower costs.
1. Cost details
The components of cost for the three primary energy sources include:
i. Solar electricity generation, both distributed and utility-scale (which may be in rural or urban areas);
ii. Wind energy – onshore (in Maryland and elsewhere in the Eastern Interconnection) and of-shore wind;
iii. Existing hydropower from the Conowingo dam.
Other electricity sector related costs include investments in:
i. Peaking generation using light-duty fuel cells;
ii. Renewable hydrogen production using electrolysis;304
304 There are many methods of producing hydrogen from renewable resources. In this report we have used electrolysis
of water, since it is a developed technology and near-term (2020) and cost estimates for both centralized and distributed
generation have been published. We assume distributed hydrogen production. Centralized production is cheaper but re-
quires transportation infrastructure (trucks, rail, and pipelines) to bring it to the point of use. We have included the cost of
compression of hydrogen produced in a distributed manner. We do not envision very small-scale residential production
here. Rather it would be medium-scale production on the order of one or two metric tons per day. The use of hydrogen is
envisioned in three ways -- in industry, for peaking generation in relatively large-scale installations, and for commercial
and industrial combined heat and power plants.

171
Prosperous, Renewable Maryland
iii. Batteries for electricity storage, including but not limited to storage in microgrids, and to pro-vide other ancillary services like voltage and frequency support;
iv. Combined heat and power systems using renewable hydrogen as fuel;
v. Demand response;
vi. Smart grid investments;
vii. Upgrade of distribution infrastructure to accommodate electric vehicles;
viii. Electric transportation system infrastructure.
No central station thermal generation is required.
Extensive eiciency investments are also included:i. Conversion of almost all residential fossil fuel use to eicient electric systems;
ii. Signiicant commercial space heating would use CHP; 70 percent of the rest would be con-verted to eicient electric systems;
iii. Weatherization of residential and commercial buildings;
iv. Industrial sector direct fuel use eiciency investments;v. Partial conversion of industrial sector fossil fuel use to renewable hydrogen.
For projecting costs we have chosen to take a “conservative” approach to start with – that is, we initially assume costs that are higher than technological trends indicate for the 2020-2050 period when the vast majority of investments will need to be made; we then do a sensitivity analysis to esti-mate a range. One important assumption in this regard has been to calculate solar and wind generation costs without tax credits or accelerated depreciation. Speciically, the higher, 30 percent federal invest-ment tax credit for solar expires in the early 2020s; however, present U.S. law, dating back to 1986, allows a 10 percent investment tax credit without any sunset date as well as accelerated depreciation known as the Modiied Accelerated Cost Recovery System (MACRS), which covers many kinds of business investments, including renewable energy.305 We have assumed zero investment tax credit and zero accelerated depreciation in our initial calculation. We use U.S. cost estimates, except for ofshore wind energy, which is in its nascent stages in the United States, but well established in Western Eu-rope, though still in early stages of commercialization compared to onshore wind energy.
We use today’s costs for onshore wind energy, which is a relatively mature technology, even though it is still evolving in the direction of lower costs. The same is true of advanced heat pump tech-nology – notably cold climate heat pumps. We use near-term cost projections for solar energy where costs are declining steadily and even for batteries, where costs are declining very rapidly and are likely to be much lower in 10 or 15 years (see Figure VII-22).
Our approach results in a robust basic conclusion regarding the relative costs of the business-as-usual scenario and the Climate Protection Scenario. A more realistic consideration of costs would, in general point to lower costs for the Climate Protection Scenario. This is the topic of the sensitivity analysis included in this chapter.
The costs of the energy system in 2050 are shown below in a series of tables. All costs are in constant 2011 dollars. Totals are rounded to the nearest ten million or nearest hundred million dollars as indicated.
305 For MACRS summary see DSIRE Federal 2016, Depreciation, and for the investment tax credit see DSIRE Federal 2016, Business ITC. The investment tax credit is not available for large wind turbines (more than 100 kW).

172
IX. Economic considerations
• Table IX-1: Energy system costs, for 2011, Business-as-Usual Scenario 2050, and Climate Protection Scenario 2050, million 2011 dollars per year
• Table IX-2: Energy sector cost: overall economic context and the Gross State Product, for 2011, Business-as-Usual Scenario 2050, and Climate Protection Scenario 2050
• Table IX-3: Electricity sector, annual cost details, Climate Protection Scenario 2050, million 2011 dollars
• Table IX-4: Cost of electricity generating system components, Climate Protection Scenario 2050, (cost numbers are in 2011 dollars)
• Table IX-5: Eiciency expenditures, annual, in million 2011 dollars• Table IX-6: Electric vehicle charging infrastructure costs, annual (cost numbers are in 2011
dollars)
Table IX-1 shows the major components of the cost of the energy system in the Climate Pro-tection Scenario and in the business-as-usual scenario. The costs of the latter are based on a simple projection of various components of energy use and Energy Information Administration prices of fuels and electricity as projected for 2040, extended out to the year 2050.
Table IX-1: Annual energy system costs, for 2011, Business-as-Usual Scenario 2050, and Climate
Protection Scenario 2050, million 2011 dollars per year (rounded to nearest $100 million)
2011
2050
Business as
Usual
2050 Climate
Protection
Scenario
Electricity generation (all uses, including
transportation), T&D, storage, and smart grid (Note 1) $8,300 $15,000 $15,400
Energy eiciency and demand response relative to BAU (includes HVAC conversions from fossil fuels to
electricity) (Note 2) $0 $0 $7,100
RCI direct fuel use (includes industrial H2 in Climate
Protection Scenario) (Note 3) $3,200 $5,400 $1,400
Transportation direct fuel use and electric transport
infrastructure (for CPS) (Note 4) $11,800 $12,800 $2,800
Road maintenance revenue to replace BAU
transportation fuel taxes (Note 5) $0 $0 $500
Afordable Energy Program and Community and Worker Protection Fund (Note 6) $0 $0 $400
Total $23,300 $33,200 $27,700
Source: IEER
Note 1: Includes all elements of the electricity generation system, storage, losses, cost of hydrogen
used in electricity generation (including hydrogen storage), demand response, capacity needed to
maintain a reserve margin, eiciency investments, investment in smart grids. Total may not add up due to rounding.

173
Prosperous, Renewable Maryland
Note 2: Smart grid investments were estimated from national investment estimates made by the Electric Power Research Institute. (EPRI 2011, Table 1-1 (p. 1-4)) We took the average of the low and high estimates and estimated the Maryland share based on its share of the national population.
Note 3: Fossil fuel costs for BAU and CPS in 2050 per million Btu are from the 2015 Annual En-ergy Outlook. We used the AEO Reference Case costs for 2040 escalated by the real dollar growth rate for 10 years more for BAU and the low oil price case for CPS because there would be very low demand for fossil fuels in the latter case. Data are at http://www.eia.gov/forecasts/aeo/data/browser/#/?id=3-AEO2015®ion=1-2&cases=ref2015~lowprice&start=2012&end=2040&f=A&sourcekey=0 (EIA AEO 2015, Table). In the CPS scenario, some fossil fuel use is displaced by renew-able hydrogen (produced using electrolysis). The electricity costs of the hydrogen for industrial use are included in the irst row showing electricity production cost. The rest of the cost, $2,400 per met-ric ton, is from DOE FCT 2011-2020 (p. 3.1-11).
Note 4: The electricity costs for transportation in the CPS are included in the top row showing elec-tricity costs. Direct primary fuel use is included in this line for 2011, BAU, and CPS. The CPS cost on this line also includes the cost of electric transportation infrastructure and corresponding distribu-tion system upgrades. The EIA Reference Case is used for BAU and the low oil price case is used for CPS. Data are at http://www.eia.gov/forecasts/aeo/data/browser/#/?id=3-AEO2015®ion=1-2&cases=ref2015~lowprice&start=2012&end=2040&f=A&sourcekey=0 (EIA AEO 2015, Table).
Note 5: Taxes on fuel are included in direct fuel use costs in the BAU case; they are a separate line item in the CPS because on-road transportation would be electriied and taxation of electricity for transportation is not assumed or recommended. The revenues needed for road maintenance, etc., could be raised through a charge per vehicle mile, vehicle registration fees, or a combination of the two approaches.
Note 6: We assume that low-income households would be protected from increases in energy bills by enactment of an Afordable Energy Program. The marginal costs for such a program at double the rate of 2013 participation are included. Also included in this line item is about $200 million per year for community and worker protection to create jobs in communities that now depend on fossil fuel and nuclear technologies and to have payments in lieu of taxes paid by large fossil fuel and nuclear power plants to support local budgets.
It is important to note that Climate Protection Scenario includes $400 million per year for an Afordable Energy Program for low-income households and for the Community and Worker Protec-tion Fund, even in the year 2050. If the transition is carried out equitably and justly for low-income people and for communities now dependent on fossil fuels, such funds may not be needed. We have included them to show that as the use of fossil fuels goes down, some method of raising revenues may still be needed for these purposes. It is not necessary that they should come from the energy system, but it is appropriate to show them as part of the cost of the energy system. We have not included either the Afordable Energy Program or a Community and Worker Transition Fund in the business-as-usual scenario.
Table IX-2 shows the costs of energy in the context of the overall economy of the State of Maryland. We assume a state-wide economic growth of 2 percent per year in both the BAU and CPS cases. The table shows energy costs as a fraction of Maryland’s Gross State Product. We also compute the economic output per million Btu of primary energy input; this provides an economic measure of the eiciency of energy use. External costs, such as damage from climate change, air pollution, ill-

174
IX. Economic considerations
health, etc. are not included in this table. Further, the reduction in costs in the CPS due to the Aford-able Energy Program, which would be expected to reduce shelter and medical costs associated with homelessness are not included.306 Some of the savings in energy costs may be plowed back into the purchase of more energy services. However, this would have a minor efect on the amount of electric-ity required. Speciically, the savings in energy expenditures in the Climate Protection Scenario would be about $5.5 billion per year in 2050. If spent on the typical mix of the GSP, 3.95 percent of the sav-ings, or about $200 million (rounded) would be on energy services compared to the total estimated above of $27,700 million. On this basis, we may estimate that the efect on the demand for energy services due to the higher disposable income created by the savings in energy expenditures would be less than one percent. This is less than the uncertainty in the cost calculations (See Section 2 below in this chapter) and can therefore be ignored.
Table IX-2: Energy sector cost: overall economic context and the Gross State Product, for 2011,
Business-as-Usual Scenario 2050, and Climate Protection Scenario 2050
2011
2050
Business as
Usual
2050 Climate
Protection
Scenario
Maryland GSP, constant 2011 million $ (Note 1) $323,100 $699,500 $699,500
Total annual energy system costs, constant 2011
million $ (Note 2) $23,300 $33,200 $27,700
Fraction of Gross State Product spent on energy 7.20% 4.74% 3.95%
Total primary energy use, trillion Btu (Note 3) 1,418 1,570 551
Economic eiciency of energy use, GSP $/million Btu $228 $446 $1,270
Energy expenditures as fraction of 2050 BAU 70% 100% 83%
Source: IEER
Note 1: Gross State Product for 2050 calculated from 2011 GSP using a real growth rate of 2 percent
per year.
Note 2: See Table IX-1 above.
Note 3: See Table VII-7, in Chapter VII, Section 4.
Table IX-3 shows the details of electricity sector costs, including generation, demand response, eiciency, electric transportation infrastructure, battery storage, and smart grid investments in constant 2011 dollars. This table provides details of the major cost elements in the 2050 Climate Protection Scenario energy system.
306 For an evaluation of the non-energy beneits of the Afordable Energy Program, see Makhijani, Mills, and Makhijani 2015, Chapter VIII.

175
Prosperous, Renewable Maryland
Table IX-3: Electricity sector, annual cost details, Climate Protection Scenario in the year 2050, mil-lion 2011 dollars per year (rounded to the nearest $100 million)
Electricity generation cost (Note 1) $9,900Eiciency, demand response, and heating conversion costs $7,100Transmission, distribution costs (includes taxes and charges) (Note 2) $3,600Electric transportation costs (Note 3) $1,900Battery storage costs (Note 4) $1,100Smart grid investments, annual (Note 5) $800Total $24,400
Source: IEER.
Note 1: See Table IX-4 below for details
Note 2: At $50 per MWh. Smart grid and storage investments are separately included.
Note 3: For charging infrastructure and added costs of distribution system upgrades to accommodate electric vehicles. Normal distribution costs are included in the Transmission, distribution costs line.
Note 4: Battery capacity of 50,000 MWh (12,500 MW) in 2050. Cost per MWh of $100,000 for the battery and electronics was estimated as the cost around 2030 from Naam Storage 2015, Scott and Simon 2015, footnote 3 (p. 5), and availability in 2016 of a zinc-hybrid grid storage battery at $160 per kWh and 4 kWh of storage per kilowatt of capacity (Eos Energy Storage 2016). Power conver-sion equipment cost was taken as $300,000 per MW for the mid-2020s, including power condition-ing equipment, based on Roselund 2016. The overall cost is then about $210,000 per MWh. This cost is much higher than the costs of battery storage for the 2030-2050 period implied in Naam Stor-age 2015.
Note 5: Total national investment over 20 years was estimated between $378 billion and $476 Bil-lion. We used the average of $427 billion and calculated the annual cost using a cost of capital of 8 percent and applied it on a per person basis to the population of Maryland. (EPRI 2011, Table 1-1 (p. 1-4))
Further breakdown of generation system components is shown in Table IX-4. The solar and wind costs do not include any investment or production tax credits (after 2030) or the Modiied Ac-celerated Cost Reduction System (MACRS). A 10 percent investment tax credit is included until 2030. It currently has no expiry date. Our levelized costs are also higher than projections for the mid-2020s and beyond, based on the rapidity of the growth of solar energy capacity and the pace of cost declines in an industry that is still maturing. We will address these issues when we consider sensitivity of cost to our assumptions in Section 2 below in this chapter.

176
IX. Economic considerations
Table IX-4: Cost of electricity generating system components, Climate Protection Scenario 2050 (in
2011 dollars)
$/MWh (except
H2 is per mt)
MWh (except
H2 is in mt)
Cost,
million $
Solar PV (mix of utility-scale and distributed) (Note
1) $68 55,064,426 $3,720
Onshore wind (Note 2) $54 27,634,397 $1,500
Ofshore wind (Note 3) $92 23,004,194 $2,120
Hydropower (Note 4) $46 1,720,203 $80
Combined Heat and Power, excluding fuel (Note 5) $131 2,970,904 $390
Fuel cell or gas turbine, includes 15% standby,
excluding fuel (Note 6) $645 1,176,745 $870
Cost of hydrogen ($/mt, mt, and total $) for use in
CHP and peaking generation (Note 6) $3,873 305,970 $1,180
Total (may not add up due to rounding) $9,860
Source: IEER
Note 1: Weighted average of distributed generation and utility scale and pre-2030 (12,000 MW) and
post-2030 (24,000 MW) solar installations. Distributed generation assumed to be ixed-tilt; utility-scale assumed to be single axis tracking. We assume that the SunShot program goal of $1 per watt
for utility-scale installations will be met by 2020 and that costs would decline further to $0.75 for in-
stallations built after 2030. (DOE 2012 SunShot, p. xix). A ten percent investment tax credit was in-
cluded for pre-2030 installations; no tax credit was assumed for post-2030 solar facilities. The DOE
SunShot Program has set even more ambitious goals for 2030 than we have assumed: $0.03/kWh for
utility-scale solar, $0.04/kWh for commercial-scale solar, and $0.05/kWh for residential solar. DOE
SunShot 2016. On this basis, the cost of solar would be 40 to 50 percent lower than the estimate we
have used for the Climate Protection Scenario.
Note 2: Onshore wind energy capital cost from DOE Wind 2015, p. 6. We have used current costs
since this is a mature technology, though costs are still decreasing. Operation and maintenance costs
are from EIA AEO 2015, Levelized Costs, Table 1 (p. 6).
Note 3: Costs of ofshore wind are declining rapidly in Western Europe as turbine size and other aspects of the technology improves. We have used $92 per MWh based on the latest wind farm bid
of the cost of Holland (“Borssele 1&2” wind farm, 700 MW total (Wind Energy Update 2016)). The levelized cost is estimated at 68 euros per MWh, the bid price was 72.70 euros per MWh. The
levelized cost, including underwater transmission to shore, was estimated at 82 euros/MWh or about
$92/MWh, using the September 27, 2016, exchange rate of $1.125 per euro. We assume an ofshore wind farm turbine life of 25 years and also that post-2025 U.S. costs will be about what they are for
the lowest cost European project as of the date of publication of this report. Until 2030 we use higher
costs, since the United States is still in the nascent stage of building ofshore turbines. We have used a German assessment (Hobohm et al. 2013, p. 13), in which costs in 2023 are estimated in the 3,000
to 3,500 euros per kW range. We have used $4,000 per kW. For 2030, we used operation and mainte-
nance costs from EIA AEO 2015, Levelized Costs, Table 1 (p. 6).

177
Prosperous, Renewable Maryland
Note 4: Hydropower costs are for generation from the existing Conowingo dam. (FERC 2015, Table 4-6 (p. 348))
Note 5: CHP costs do not include fuel. The hydrogen costs are separately accounted for. See Note 6 to this table. Capital costs of $1,600 per kW are from Wei et al. 2014 (p. iv) and operating costs are estimated from EPA CHP Partnership report (EPA CHP 2015). CHP plants are operated when there are heating and/or cooling needs. The capacity is available as standby at other times; partial capacity would be available to the grid at almost all times.
Note 6: This item is for meeting the balance of electricity demand remaining. It could consist of light duty fuel cells, such as those planned for fuel cell motor vehicles, since the duty cycle would be light (capacity factor 3 percent in our model). The fuel would be renewable hydrogen.
The speciic mix of solar, onshore, and ofshore wind is for the purposes of estimating the electrical resources needed for a reliable system and the costs of the various elements. With existing or near-term storage, solar, and wind technologies, an approximate balance between wind generation on the whole and solar generation on the whole is needed for winter and summer seasonal balance. Such a balance reduces the frequency of prolonged periods with low generation, during which the demand response and storage, including battery storage, and or other forms of storage, and peaking power sup-ply, would meet demand. In Chapter XI, Section 5, we discuss the ways in which future developments in solar, storage, and wind technology could allow a change in the solar/wind balance with a greater emphasis on distributed solar generation.
Table IX-5 shows the details of eiciency costs. Building envelop improvements and conver-sion of fossil fuel heating systems to eicient electric systems are the largest cost items.
Table IX-5: Eiciency expenditures in the year 2050, in million 2011 dollars Residential space heating conversions + building envelope improvements (Note 1) $2,270
Residential appliance eiciency (Note 2) $800Commercial space heating conversions (Note 3) $1,800Commercial end-use eiciency, including building envelope improvements (Note 4) $1,950Demand response (Note 5) $280Total $7,090
Source: IEER
Note 1: McKinsey 2009, Exhibit 13 (p. 34). Costs have been doubled to account for utility incen-tives, audit expenditures, and incentives for audits. Total cost per existing structure: $5,000.
Note 2: $60 per MWh. Costs of the EmPOWER program up to 2015 have been in the $35 to $45 range per MWh (Lucas 2015, Slide 9). We have used a higher igure since initial eiciency gains are often focused in the simpler area of lighting improvements. The range of eiciency cost estimates in ACEEE 2014 (Table 6 (p. 23)) for large states is $41 to $73 per MWh with four of the ive states evaluated (Illinois, Iowa, Pennsylvania and Wisconsin being under $50 per MWh and New York costs being estimated at $73 per MWh. These costs are program costs, and include participant (i.e., consumer) and utility costs for rebates, incentives, and administration.
Note 3: We use the same cost per unit energy converted for HVAC conversions as for the residential sector.
(Notes continue on following page)

178
IX. Economic considerations
Note 4: We use the same estimate of $60 per MWh as in the residential sector for electric eiciency cost. We escalate the commercial sector building envelope improvement cost according to total
electricity used in that sector compared to the residential sector in 2011. Further, we assume that the
heating and cooling loads would be reduced by 20 percent in the commercial sector, compared to 30
percent in the residential sector. This is an uncertain calculation. We address the uncertainty in the
sensitivity analysis in Section 2 of this chapter.
Note 5: The cost of demand response is assumed to be set equal to the cost of peaking generation,
estimated at $642 per MWh, not including fuel cost (since no fuel is required for demand response).
The conversion to electric vehicles will involve signiicant investments in private and public charging infrastructure. Table IX-6 shows the annual costs that would be typical in the latter part of the 2030 to 2050 period. They include one private charging station for each electric vehicle as well as a large number of public Level 2 and Level 3 charging stations.
Table IX-6: Electric vehicle charging infrastructure details, cumulative and annual costs in the 2030
to 2050 period, in 2011 dollars
Item Number
Cost per station,
2011 $
Total cost,
million 2011 $
Personal stations (Note 1) 4,900,000 $1,700 $8,300
Level 2 stations (Note 2) 395,000 $6,250 $2,500
Level 3 stations (Note 2) 19,800 $60,000 $1,200
Total investment over 20 years 5,314,800 $12,000
Annualized investment cost $1,200
Operations and Maintenance cost $200
Total annual cost $1,400
Source: IEER
Note 1: One personal charging station per vehicle is assumed. For cost of low-voltage charging sta-
tions see Agenbroad and Holland 2014. We have added $500 for a circuit breaker box. This upgrade
is likely to be needed in many existing homes.
Note 2: For numbers of Level 2 and Level 3 stations see Funke, Gnann, and Plötz 2015. For costs
see Agenbroad and Holland 2014.
The distribution system will also have to be upgraded to accommodate the additional load put on it by EV charging stations. Distribution transformers may have to be larger, for instance. Voltages may need to be increased in certain segments of the distribution system; substations may have to be upgraded. The amount of investment needed could be reduced signiicantly by placement of distrib-uted solar generation, distributed storage batteries, and combined heat and power systems. Such re-sources could reduce the need for distribution system upgrades in some cases. We added a distribution system upgrade capital cost according to the increase in peak load that would occur despite eiciency investments. That peak load increase would be due to EVs and electriied space and water heating systems. The total capital cost added was about $4.2 billion,307 which would be invested over a period of 15 or 20 years, as the number of EVs in Maryland increased.
307 This is an approximate number. The depreciated value of the distribution system of Baltimore Gas & Electric in 2013
was about $2.6 billion. (Maryland PSC BGE 2013, p. 11)] BGE serves about half of Maryland electricity consumers. As-

179
Prosperous, Renewable Maryland
The tables in this section show annual costs in 2050. The total capital investment required will be very large, since using solar and wind energy in a smart grid with energy storage, eiciency, and demand response essentially replaces a stream of annual expenditures on petroleum and natural gas in Maryland into capital investments. See Section 3.i below in this chapter.
2. Sensitivity analysisIn performing a sensitivity analysis we vary a few important parameters to estimate a range
of costs for the Climate Protection Scenario focusing on areas where the uncertainties could make a signiicant diference to increasing or decreasing overall costs. We will call the estimates of cost we have done above as the Climate Protection Scenario Reference Case, and develop a low cost case and a high cost case.
We focus on two areas in which energy costs could be lower than in the Climate Protection Scenario Reference Case:
• Costs of solar PV continue to decline signiicantly;• Costs of onshore wind continue to decline;
We include three areas in which costs may be higher than estimated in the previous section:
• Ofshore wind energy cost in the 2025 to 2050 period would be $155 per MWh instead of being about equal to the lowest cost for a large European project to date ($92 per MWh);
• HVAC conversions to eicient electric systems would cost 50 percent more than the Reference Case estimate;
• Retroitting residential and commercial building envelopes would cost twice as much as the Reference Case estimate.
We do not consider a scenario in which electric vehicles will not be afordable. Electric ve-hicles with a 200-plus mile range that are only modestly higher in cost than the average gasoline vehicle are scheduled for manufacture in signiicant numbers by 2017. Their costs are expected to be comparable to their gasoline counterparts by about 2022 according to an assessment by Bloomberg Finance.308 Moreover, electric vehicles have far lower operating costs for fuel and maintenance than gasoline or diesel vehicles. Further, we do not assume signiicant adoption of electric cars until the mid-2020s, with near universal adoption for new vehicles by the mid-2030s. It is far more likely that the cost of transportation would decline (on a per mile basis) than that they will increase. We note that there is already a proposal, not yet enacted, in the Netherlands to ban new petroleum-fueled car sales altogether by 2025.309 We do not envisage that happening in Maryland or in the United States. Rather, the better performance and lower maintenance costs of EVs would lead to petroleum-fueled vehicles becoming essentially obsolete in the next 15 to 20 years both on technological and economic grounds.
Solar PV is a technology that is still developing despite large investments globally in recent years. Figure IX-1 shows the estimates of future costs per kilowatt-hour in three regions with diferent quality of solar energy; the middle curve approximately resembles Maryland insolation.
suming that the original capital cost was about double the 2013 value, the overall investment in the Maryland distribution system would have been about $10 billion over a 30 year period. We escalated this by the GDP delator between 2011 and 1995 to get a value of the distribution system in 2011 dollars. We calculated the GDP delator for these years from St. Louis Federal Reserve 2016. 308 Randall 2016309 Cole 2016

180
IX. Economic considerations
Figure IX-1: Solar electricity cost trends for three dif erent insolation areas. Source: VDMA 2016,
Fig. 45 (p. 40) (International Technology Roadmap for Photovoltaics)
The International Technology Roadmap in Figure IX-1 indicates a reduction in cost to $41 per MWh by 2026; continuing reduction in costs after that date can be inferred from the slope of the curve. The Climate Protection Scenario Reference Case uses an average cost of $68 per MWh, a mix of pre-2030 costs of about $76 per MWh and post-2030 costs of $63 per MWh. About two-thirds of the capacity in 2050 would be installed in the 2030 to 2050 period. We choose the International Tech-nology Roadmap value of $41 per MWh as the average embedded cost of solar PV for the year 2050.
For onshore wind we assume that increasing hub height will enable a higher capacity factor at about the same cost of construction. As noted in Figure VI-3 in Chapter VI, there are large areas where near-term technology can enable capacity factors of 50 percent, 60 percent, or even higher.
For of shore wind, we assume that the capacity factor of the collection of wind farms in 2050 would be 60 percent. The combined ef ect of lower costs in the four areas examined here for sensitivity analysis is shown in Table IX-7.

181
Prosperous, Renewable Maryland
Table IX-7: Sensitivity analysis showing potential cost decreases (low cost case) relative to the Climate Protection Scenario Reference Case assumptions in the year 2050 (cost numbers in 2011 dollars)
$/MWh Total MWh
Total cost
$mn
Cost delta,
relative to
CPS, $mn
Solar PV $41 55,064,426 $2,300 ($1,420)Land-based wind $40 27,634,397 $1,100 ($400)Total low-cost case $3,400 ($1,820)
Source: IEER.
Note: Negative numbers in red in parentheses mean a cost reduction compared to the Climate Pro-tection Scenario Reference Case (shown in Table IX-4 above).
Table IX-8 shows the cost increases corresponding to the three elements of increase discussed above.
Table IX-8: Sensitivity analysis showing potential cost increases (high cost case) relative to Climate Protection Scenario Reference Case assumptions in the year 2050 (cost numbers in 2011 dollars)
$/MWh MWh Total cost
Cost delta
relative to
CPS, $mn
Ofshore wind $125 23,004,194 $2,900 $800Building envelope improvements $3,700 $1,800HVAC conversions $4,800 $1,600Total high cost case $11,400 $4,200
Source: IEER.
Note: The Climate Protection Scenario Reference Case value for ofshore wind is in Table IX-4. The Reference Case annual cost for building envelope improvement is about $1,950 million and for HVAC conversion the annual cost is about $2,400 million.
The sensitivity calculations give us a range of costs of the Climate Protection Scenario, which we compare to the business-as-usual scenario cost estimate in Table IX-9. The estimated costs of en-ergy services in the Climate Protection Scenario are lower than the business-as-usual case even in the high cost case. The costs of energy the Climate Protection Scenario range from a low of 78 percent to a high of 96 percent of the business-as-usual case costs. BAU scenario costs are based on the as-sumption of continued fossil fuel use and projections of costs by the Energy Information Administra-tion (see Section 2.i below). Since the energy costs are lower in the Climate Protection Scenario, the money saved could be spent on consumer goods or invested, creating a “stimulus efect” in the general economy of the state. The amount of this efect is shown as a fraction of Maryland’s Gross State Prod-uct in 2050 and also of the State’s budget in 2050, assuming it increases in proportion to the GSP. This gives an idea of the stimulatory efect as if the State had spent that added money.

182
IX. Economic considerations
Table IX-9: Cost comparison of reference, high, and low cost cases for the Climate Protection Sce-
nario with the Business-as-Usual Scenario for the year 2050, in 2011 dollars
BAU
CPS
reference
CPS
high
CPS
low
Total Cost, million 2011$ $33,200 $27,700 $31,900 $25,900
Cost increase (reduction) in CPS, relative to BAU
million $/year $0 ($5,500) ($1,300) ($7,300)
Cost relative to BAU, % 100% 83% 96% 78%
Stimulus efect as fraction of 2050 Maryland GSP 0.8% 0.2% 1.0%
Stimulus efect as fraction of state budget in 2050 18% 4% 23%
Source: IEER
Note: We assume that the state budget of Maryland would grow proportionally to the Gross State
Product (GSP). The budget in 2015 was $15,700 million. On that basis the projected budget in 2050
would be about $31.3 billion assuming a 2 percent annual GSP growth rate.
Our overall conclusion is that the total cost of energy services in the Climate Protection Sce-nario is very likely to be considerably lower than business-as-usual, with the middle estimate of sav-ings being about 17 percent of BAU annual energy costs in the year 2050.
All the avoided costs of damage to health, the environment, economic infrastructure, agricul-ture, and human habitation are in addition to the direct monetary savings resulting from lower costs of energy services in the Climate Protection Scenario. We should note that the Climate Protection Scenar-io includes about $400 million per year to ensure that energy will be afordable for low-income house-holds, to provide transition funds for communities and workers who would be adversely afected by a shift from fossil energy to solar and wind energy, and to provide seed funding and other investments for creating energy-related jobs in low-income communities. The non-energy beneits such as reduced homelessness and reduced medical costs of these expenditures are not included; they are substantial.310
i. Solar and the cost of battery storage
The costs of battery storage are declining rapidly, as discussed in Chapter VII, Section 4.i. Fig-ure VII-22 shows that there is a prospect that they could decline to as low as 2 to 4 cents per kWh by the end of the 2030s from about 25 cents per kWh in 2015. Such an order-of-magnitude cost decline along with low cost of solar generation – about $40 per MWh, possibly less – could create the poten-tial for a structure of a renewable energy system that is signiicantly diferent from the one we have modelled in the Climate Protection Scenario.
Our basic approach in selecting the mix of generation for the Climate Protection Scenario is to approximately balance wind and solar generation in an annual basis because the former has a higher capacity factor in the winter and the latter in the summer. This reduces the amount of storage needed to deal with intra-day or intra-week variations in supply. The residual problem that arises is the sea-sonal surpluses that occur in the spring and fall when heating and cooling energy requirements are low. This problem can be addressed by seasonal energy storage. The overall system is economical not only because the costs of wind and solar are declining, but also because the combination of wind and solar allows well over 85 percent of the load to be met without any involvement of a storage technology. When the rest is coupled with demand response, the costs of storage are very manageable.
310 Makhijani, Mills, and Makhijani 2015, Chapter VIII

183
Prosperous, Renewable Maryland
If battery storage were an order of magnitude lower than the near-term costs assumed in the Climate Protection Scenario reference case, that component of storage could be increased by an or-der of magnitude without an increase in overall cost. This allows a change in the mix of generation towards solar and away from wind. An approximate balance between the two is no longer required. Solar could be twice the amount of wind generation or even greater without materially afecting costs.
There are of course land-use considerations associated with utility-scale solar, which we exam-ine in more detail in Chapter XI, Section 4.
We have not used a greater fraction of solar generation in our reference case scenario because it involves cost projections that are too far out in the future – 20 years or more. However, reasonable cost projections for solar (see Figure IX-1 above) indicate that an economical renewable energy future that is far more distributed and far more solar-oriented than the Climate Protection Scenario is quite possible. It should be at the forefront of periodic evaluations of the most desirable approach to elimi-nating CO
2 emissions from the electricity sector.
3. Energy sector business structureThe energy sector in Maryland consists of two distinct parts, so far as expenditures are con-
cerned. About half of the expenditures on energy are for imports from outside the state. The main components are imports of oil and natural gas, for direct use, and coal, mainly for use in electricity generation. Apart from a small amount of coal, Maryland produces no fossil fuels. Maryland also does not produce the fuel needed to run the Calvert Clifs nuclear reactors. Table II-4 in Chapter II details the in-state and out-of-state energy expenditures in 2011, when about 54 percent of the total of $22.9 billion was spent out-of-state. Of this about ive-sixths was for imports of oil and natural gas.311 The investments that correspond to the production of the oil and natural gas and most of the coal that Maryland uses occur in other states, in Canada and Mexico, as well as in other oil exporting countries. They are massive investments, but Marylanders do not see them as such; their demand for these fuels is relected in steady purchases of natural gas and electricity from utilities, and of gasoline, diesel, fuel oil, and other petroleum products from retail vendors. In the world of the Climate Protection Scenario, the upstream investments in fossil fuels will almost entirely vanish; they are replaced by investments in solar and wind energy, storage, eiciency, electric transportation infrastructure, and other aspects of the grid-of-the-future. We explore some key aspects of the structure of the investments of the future and the changes that will be needed to redirect capital from the present CO
2-intensive patterns to future
emissions-free ones.
i. Investments, business-as-usual scenario
Reliable supply of energy in the business-as-usual scenario, with continued reliance on fossil fuels and nuclear energy would require investments in the following areas:
• New fossil fuel and possibly nuclear electricity generating stations;
• Transmission and distribution infrastructure to the extent that it is required to accommodate electricity use growth and depreciation of existing equipment;
• Investments in fossil fuel, notably oil and natural gas production;
• Investments in fossil fuel processing, such as oil reineries to the extent required to replace depreciated facilities and to the extent necessary to accommodate growth in use.
311 The fraction of out-of-state expenditures is variable due to the volatility of crude oil and wholesale natural gas prices, but generally, roughly half of Maryland’s energy expenditures are spent outside the state.

184
IX. Economic considerations
Over the next 35 years, much or most of the electric generating capacity, with the exception of relatively recently installed natural gas fueled plants, will likely have to be replaced. Further, there would be growth in electricity use in the business-as-usual scenario. Peak load plus a 15 percent peak margin would be about 19,700 megawatts. Assuming 75 percent of that capacity is built between 2020 and 2050, at an average cost of three million dollars per megawatt,312 the total investment required would be on about $44 billion. Such investments would be mainly private, since merchant power is the main source of supply in PJM. An adequate price for wholesale electricity induces the supply. Dis-tribution system investments would amount to roughly $4 billion (rounded).313
Oil and natural gas use would not grow signiicantly in the BAU scenario, mainly because of federal CAFE standards for on-road vehicles. Supplying Maryland, the rest of the country, and the world with fossil fuels would require massive investments.314 It is diicult to estimate such invest-ments for decades into the future in part because the extent to which resources that are more diicult and costly to extract would be needed cannot be determined. We can estimate capital requirements in diferent ways. Since the oil and gas requirements are not estimated to change much, the stream of expenditures over 20 to 30 years315 can be used to estimate total investment requirements. An estimate can also be made by examining U.S. investments in oil and gas exploration and production, which varied between 100 and 160 billion dollars a year in the 2011-2015 period.316 Using an average value of $130 billion, Maryland’s share annually would be about $2.4 billion or about $60 billion over 25 years (rounded). There are additional investment requirements abroad since the U.S. imports about one-fourth of its petroleum requirements. Thus the total investment required would be about $80 bil-lion. This assumes that oil production investments luctuate within the range experienced in the 2011 to 2015 period. In addition, investments would be needed for reineries and pipelines. Thus, the cumu-lative oil and natural gas investments over a 25 year period needed to supply Maryland with oil and gas would be on the order of $100 billion.
Adding electricity system investments, about $150 billion (rounded) would be needed over about 30 years for the business-as-usual scenario. If the pattern of investments follows the present structure of energy supply, about 60 percent of the generation investments and all of the distribution
312 Mixture of natural gas combined cycle, integrated gasiication combined cycle with coal, gas turbine peaking, and nuclear. Estimated by IEER from Lazard 2015, p. 11.313 BGE, which serves about half of Maryland’s electricity customers, had a rate base of about $2.6 billion in 2013. (Mary-
land PSC BGE 2013, p. 11)) This is the depreciated value of the capital investment on which it is allowed a guaranteed
rate of return. We doubled the value to account for all Maryland customers and assumed that the undepreciated value is
double the depreciated value; we also adjusted by the Gross Domestic Product Delator between 1995 and 2011 to express the number if 2011 dollars. This amounts to about $14 billion, which is a rough estimate of the investment that would
be needed if Maryland’s electricity distribution system were built in 2011. We then assume that the added investment to
accommodate growth by 2050 is proportional to the increase in electricity use. Electricity use in the BAU scenario and
Climate Protection Scenario is about the same in 2050 even though transportation and most heating is assumed to be elec-
triied in the latter, This is because electricity for all other uses such as lighting or air-conditioning is much lower in the Climate Protection Scenario due to eiciency investments.314 We do not consider the issue of the actual feasibility of such investments in the context of severe damage from climate
disruption. As discussed in Section 2.i of this chapter above, the BAU scenario is a heuristic placeholder that allows us
to estimate the energy picture based on present approach to meeting energy requirements and compare it to the Climate
Protection Scenario. 315 The life of an oil and gas well is highly variable and depends on the type of well, price of oil (or gas), and the technology
used. The same well can yield more oil (or gas) if greater investments are made. The life of hydrofracturing wells is very
sensitive to price and can range from 3 to 30 years. (Quora 2013) An average life of 20 to 30 years can be assumed for the
purposes of the calculations here. (For oil-related investments see Encana 2011) 316 Approximate values read from the chart at EIA Today in Energy Oil 2015 (http://www.eia.gov/todayinenergy/detail.
php?id=23072).

185
Prosperous, Renewable Maryland
investments, amounting to about $31 billion, would be made in Maryland. This amounts to an average of about $1 billion per year. The rest, about $120 billion, would be out of state, mainly in oil and gas exploration, production, processing, and transport to Maryland.
The most important caveat for the business-as-usual investment estimate is that we assume future investments in the petroleum sector will be the average of the 2011-2015 period. The likelihood that future resources would be more expensive, if intensive fossil fuel consumption continues, is not taken into account. The total should be regarded as a likely underestimate.
ii. Investments, Climate Protection Scenario
The Climate Protection Scenario would also require large investments, but the pattern would be diferent. Eiciency investments and investments in electriication of space heating, water heating, and transportation would substitute for fossil fuel production investments. The electricity genera-tion investments would be in solar and wind energy, with the complementary investments in storage, smart-grid, and other technology needed to make the system reliable. Table IX-10 shows cumulative investments in the major elements of the Climate Protection Scenario and the period over which those investments are assumed to be made.
Table IX-10: Cumulative capital costs in the Climate Protection Scenario and period over which each investment is cumulated
Investment item
Total investment million
2011 $ (Note 1) Period, years
Generation investments Solar PV $34,000 30Onshore wind $11,000 25Ofshore wind $18,000 25CHP $3,000 25Peaking generation $5,000 25Sub-total electricity generation $71,000 27Other investments EV Transportation infrastructure $12,000 20Distribution infrastructure (additional) $5,000 20Building envelope improvement $21,000 20Other eiciency $41,000 20Grid storage batteries $9,000 15Hydrogen production (Note 2) $5,000 20Smart grid $8,000 20Subtotal, other investments $101,000 20Grand total $172,000 23
Source: IEER
Note 1: All cost values rounded to the nearest million dollars.
Note 2: About one-ifth of the hydrogen production is for use as a fuel in industry. The rest is used in the electricity sector for combined heat and power and peaking power plants.

186
IX. Economic considerations
In addition to the electricity-related investments, some fossil fuel use (aircraft, boats, etc.) would remain. However, it would likely not require additional investment, since the small supply needed would be from existing production and processing facilities. It is clear that the total amount of investment needed in the Climate Protection Scenario is somewhat higher, but generally of the same order of magnitude, as in the business-as-usual scenario, especially if we take into account that BAU petroleum sector investments are likely to be underestimates. But there are some major diferences in the structure of the investments:
• About 60 percent of the investment needed in the Climate Protection Scenario would be in various aspects of eiciency, electriication of heating and transportation, and the distributed grid to enable reliable operation with variable solar and wind. The vast majority of these in-vestments would be within the state. In contrast the vast majority of fossil fuel investments are in production and are not in Maryland.
• There is considerable scope for increasing the rate base of distribution utilities compared to the BAU scenario. Much of the smart grid investment, at least some of the battery storage in-vestment, and possibly some of the transportation infrastructure investment could be made by them. However, large investments will also be made by consumers in a variety of items, such as building envelope improvements, HVAC systems, and residential EV charging systems. Policies that enable inancing of such investments would therefore be a critical element of the transition to an eicient renewable energy system.
• Much of the investment in electricity generation would be made by consumers, turning them into producer-consumers or “prosumers.”
• While total capital investment is somewhat higher in the Climate Protection Scenarios – about $20 billion cumulative (rounded), or just under one billion dollars per year than the BAU total of $150 billion – electricity generation fuel costs are zero in the Climate Protection Scenario; in addition, solar and wind generation have lower operations and maintenance costs. When these factors are taken into account, overall annual costs for consumers would be lower in the Climate Protection Scenario.
• Another way to contrast the business-as-usual scenario with the Climate Protection Scenario is that in the latter almost all the costs are capital costs, with capital equipment being replaced on a 15 to 30 year time frame depending on equipment, with a weighted average of 23 years. The average annual investment is about $7.5 billion. In addition, it would take about $2 bil-lion per year to maintain generation plus hydrogen production equipment (see Table X-2 in Chapter X below) for a total of about $9.5 billion.317 This is much less than the annual cost of nearly $13 billion that Marylanders would pay to purchase transportation petroleum fuels alone in the year 2050 in the BAU scenario (all transportation sectors). In fact, a large part of the better afordability of energy services in the Climate Protection Scenario derives from the replacement of petroleum fueled vehicles by electric vehicles, which are far more eicient.
In Chapter VIII, on the grid-of-the-future, we discussed the need for profound changes in the way wires-only utilities cover their costs and make a proit on their investment (in the case of investor-owned utilities). The principal reasons include distributed ownership, more behind-the-meter genera-tion, the centrality of variable generation in the renewable grid-of-the-future, and the need for a wider variety of services to be ofered, delivered, and priced in equitable ways.
317 Electricity transmission and distribution costs are about the same in the BAU Scenario and the Climate Protection
Scenario.

187
Prosperous, Renewable Maryland
A large part of the concern of utilities arises from the prospect that the ixed costs of delivering electricity to consumers will be spread out over an ever-decreasing amount of electricity if net-metered generation accounts for a signiicant fraction of electricity requirements. There is also downward pressure on electricity consumption due to increasing implementation of energy eiciency programs and the simple fact that it is more economical to use eicient appliances than to pay for the additional energy needed by ineicient appliances. And even without conscious choice to do so, consumers pur-chasing new appliances will have more eicient ones due to pressures in the marketplace that demand greater eiciency all around.
But this is not the whole story. As we have seen in Chapter VII, a low-emissions energy system will require the electriication of two major sectors where fossil fuels are used by consumers: (1) for transportation and (2) for space and water heating in buildings. The goal of 90 percent greenhouse gas emission reductions by 2050 relative to 2006 cannot be achieved without converting the vast major-ity of direct fuel use in these areas to electricity. The conclusion that we have arrived at is, even with increasing eiciency in existing uses of electricity like lighting or refrigeration, the need for electricity will grow substantially. The electricity use in the Climate Protection Scenario in the year 2050 would be about 60 percent greater than in 2011, despite increasing eiciency in existing electricity uses and improvements in building envelopes. If properly managed, there need be no downward spiral of de-creasing revenues for distribution utilities. On the contrary, given the much wider opportunities for in-vestment on the distribution side of the grid in a variety of resources, distribution utilities could grow.
iii. Business-as-usual scenario sensitivity analysis
We have not done a sensitivity analysis for the business-as-usual scenario for three major reasons. First, this scenario is essentially an artiicial construct that represents the energy use corre-sponding to a normal economic growth (2 to 2.5 percent per year) but without any consideration of the deleterious efects of continued fossil fuel use. The damage to climate from such use is estimated to range from disastrous to catastrophic. For instance, a recent paper in Nature estimated an accelerated melting of the Western Antarctic ice cap within this century, which could “contribute to more than a metre of sea-level rise by 2100.”318 In their reassessment, Hansen et al. estimate that there is evidence that global sea-level could reach “several meters over a timescale of 50–150 years,” along with the potential for more severe storms. They even postulate the possibility of a “slowdown and eventual shutdown of the Atlantic overturning circulation with cooling of the North Atlantic region.”319 This last phrase refers to what is commonly called the “Gulf Stream”; it keeps northwestern Europe much warmer than it would otherwise be.
Second, given the climate disruption that is already occurring and that it is likely to intensify greatly, a more realistic business-as-usual case should include an estimate of the cost of the economic damage from inaction even though these costs are diicult to estimate. But they are almost certain to be huge. Even before the grim recent assessments such as those cited in the previous paragraph, the Stern Review estimated, in 2006, that inaction would lead to a loss of 5 percent of global GDP each year. Taking a broader range of costs into account could quadruple loss estimate.320 Five percent of Maryland’s GSP in 2050 works out to about $35 billion per year, or almost $2 billion more than our estimate of the entire cost of energy in the year 2050 in the business-as-usual case. Thus, a realistic assessment of the costs of business-as-usual in the framework of the Stern Review would yield an ef-fective energy cost, including gross state product loss, of about $70 billion (rounded); possible total damage could be larger than that. This compares to direct energy costs of about $33 billion in the
318 DeConto and Pollard 2016, pp. 591 and 596319 Hansen et al. 2016, p. 3762320 Stern Review 2006, Summary of Conclusions, p. vi (pdf p. 2)

188
IX. Economic considerations
business-as-usual case. Thus, the relative economic beneit of the Climate Protection Scenario can be established even if fossil fuels in the business-as-usual scenario were free. The economic and other damage of climate disruption would in any case be in excess of the entire cost of energy in the most expensive Climate Protection Scenario case – about $32 billion (see Table IX-9 above in this chapter).
The Stern Review does not exhaust the damage estimates. For instance, the possibility that the Gulf Stream might shut down was considered in a Citigroup report, with the carbon cost for that estimated at $1,000 per metric ton.321 This translates into a cost on this one count alone of about $100 billion per year (in very round numbers) – or three times the cost of energy in the business-as-usual scenario.
It is not diicult to see that the business-as-usual scenario is not a normal scenario to which a sensitivity analysis can be applied. Rather, it is a stand-in for estimating the energy requirements of typical economic growth were they to be met primarily by increasing supply. These energy numbers can then be viewed as representing energy services for heating, cooling, lighting, running machines, etc., that can be provided in various ways by diferent types of supply, storage, eiciency, and demand response technologies.
4. Existing, centralized merchant generation
Existing merchant generation need not be an obstacle to a transition to the grid-of-the-future. After all, it will remain essential for reliable grid operation for years to come. But problems loom, especially in states like Maryland, where merchant generation and wires-only utilities have combined ownership.
Speciically, merchant generating companies own capacity in fossil fuel and nuclear generat-ing stations, which are large, centralized plants whose role will diminish for a variety of reasons as we move to a renewable, more distributed, resilient, and democratized grid. The amount of centralized fossil fuel generation that merchant utilities can put on the wires must necessarily decline as distribut-ed and renewable generation increase, even if overall electricity requirements grow. Coal-ired power plants must be phased out. New nuclear plants are too expensive and existing ones are becoming more expensive. The loss of competitiveness of centralized merchant generation may increase as time goes on; in any case, tightening constraints on fossil fuel generation required by the Regional Greenhouse Gas Initiative (RGGI)322 will necessarily result in lower fossil fuel generation in much of the PJM re-gion. In addition, the Obama Administration’s Clean Power Plan, if and when it goes into efect, will also limit and reduce coal-ired power plants and incentivize eiciency and renewable energy.323
The existing fossil and nuclear generation assets of the fossil fuel and nuclear companies are increasingly at risk. The companies can deal with this problem by restricting their generation invest-ments to renewable energy and retiring their existing assets, many of which are old and depreciated. Yet, some merchant generating companies in the deregulated parts of the Eastern Interconnection are making ever more strenuous eforts to get increased revenues for existing fossil fuel and nuclear facili-ties in the form of added fees, new subsidies, and, in the case of nuclear, proposals to provide carbon credits to existing nuclear plants. For instance, Exelon has loated various proposals before the Illinois legislature that would allow it to collect large sums of money from ratepayers for two nuclear plants
321 Citi GPS 2015, p. 31 322 RGGI limits the aggregate CO
2 emissions from participating states in the mid-Atlantic and Northeastern United States.
The participating states are: Connecticut, Delaware, Maine, Maryland, Massachusetts, New Hampshire, New York, Rhode Island, and Vermont. (RGGI 2016, at http://www.rggi.org/) 323 EPA CPP 2015

189
Prosperous, Renewable Maryland
that are losing money; these sums are considerably in excess of what the market provides.324 While the company proposal is simple: without signiicantly more revenues above the current market, it would shut down two nuclear plants, the outcome would be a considerable loss of employment and economic distress to the communities where the plants are located. Yet, PJM, the grid operator in much of the region, has noted that
the simple fact that a generating facility cannot earn suicient market revenue to cover its going-forward costs does not reasonably lead to the conclusion that wholesale markets are lawed. More likely, it demonstrates that the generating facility is uneconomic.325
In response to demands for additional revenues by owners of upstate nuclear power plants, the New York Public Service Commission has granted added revenues of billions of dollars above market prices to them (see discussion above Chapter VII, Section 2.vi).
A related problem that applies to Maryland with particular force (though not only to Maryland) is the acquisition of wires-only utilities by merchant generating companies. Ownership of wires-only regulated utilities by merchant generating companies, like Exelon and First Energy, is not allowed in some states (like New York) but it is in others, including Maryland and Illinois. In the speciic case of Maryland, Exelon owns BGE, the largest wires-only utility in the state, as well as Pepco and oth-ers that it acquired after the completion of its merger with PHI, the wires-only utility with holdings in Maryland, Washington, D.C., Delaware, and New Jersey.326
The so-called “ring fence” around the wires-only portion of Exelon is supposed to allow opera-tion in a manner that allows regulatory oversight over the wires-only portion. And that may well be true so far as routine day-to-day and even year-to-year operations are concerned. But the transforma-tion of the grid will be anything but routine. Among the assets most at risk are the fossil fuel and, to some extent, nuclear generating assets of merchant generating companies. Exelon, one of the largest electric holding companies in the United States, controls both unregulated generating plants and regu-lated wires-only utilities. Top management is, after all, accountable to shareholders, who, in turn, have an interest in getting the largest return on existing assets no matter how thoroughly depreciated they are.
It is possible that ambitious renewable portfolio standards, the RGGI program, equitable rules for grid neutrality, and tough regulation could smooth Maryland’s way to the grid-of-the-future with distributed ownership. But this is far from guaranteed given that there is an inherent conlict between the owners of existing merchant fossil generation on the one hand, and the interests of the ratepayers and the people of Maryland in a democratized grid-of-the-future on the other. Existing nuclear power plants, notably the Calvert Clifs plant in Maryland, present similar challenges even though nuclear is a low-carbon electricity generating system. (See discussion above in Chapter VII, Section 2.vii.)
5. Natural gas Phasing out almost all, if not all, use of natural gas will be essential to getting to the goal of 90
percent reduction of GHG emissions by 2050. The electriication of space and water heating, which are the main direct uses of natural gas in Maryland, is essential in this process.327 This makes these end uses renewable-grid ready because wind and solar energy are most readily and lexibly available in the form of electricity. The sensitivity analysis in Chapter VII, Section 5.i, shows that a signiicant (50
324 Daniels 2016325 PJM Markets 2016, p. 36326 Exelon About 2016327 This would still leave some room for natural gas use in industry and buildings.

190
IX. Economic considerations
percent or more) shortfall in this area could result in emission reductions falling somewhat short of the 90 percent reduction by 2050 that is Maryland’s goal. The shortfall is greater if impact of natural gas on time scales of a few decades or less is factored in. Further, it would leave no room for shortfalls in any other area or for the contingency that more stringent measures than foreseen in the IPCC5 report will be required to protect climate (see Chapter I). We have analyzed this issue in some detail in our report on heating and cooling in buildings, published as part of the Renewable Maryland Project. We have shown there that a restructuring of HVAC-related eiciency incentives could help in this transi-tion.328 Net-zero emissions buildings will also help in this regard.
Cooking is a smaller use of natural gas – just under 5 percent of natural gas use in buildings;329 nonetheless, it is important to address its conversion to electricity for several reasons:
• Natural gas connection to a building just for cooking will become more expensive once space and water heating are electriied. This will create the incentive for conversion to electricity, all other things being equal.
• The importance of phasing out natural gas is magniied by the greater short-term impact of methane, its main constituent.
• Natural gas cooking, when used in unvented kitchens creates indoor carbon monoxide pollu-tion (see Chapter XI, Section 2.ii).
• Commercial sector natural gas cooking requires substantial ventilation, increasing energy use for heating and air-conditioning.
In this context, it must be noted that natural gas cooking is preferred by many, including for the ability to quickly adjust the lame and hence cooking conditions, especially when compared to a traditional electric stove or cooktop. For another, the lame is visible, providing the cook with a feel for cooking conditions and the ability to connect with recipe instructions. Thus, there is likely to be strong cultural and experiential resistance to conversion from natural gas to conventional electric cooking for those who are used to natural gas cooking. Stoves with induction cooktops are currently more expen-sive than any other type of stove for ordinary stoves. The diferences in cost are not material for high end cooktops and stoves.330
However, induction cooking can be a suitable replacement for gas cooking in terms of its fea-tures. It heats the food in the pot by inducing an electric current in the pot – which means the pot must be of a magnetizable material, like cast iron. The heating is fast – usually much faster than any other technology; the coupling of the heating to the food is more eicient than with a resistance cooktop and much more eicient than natural gas.
The conversion to induction cooking is likely to be less diicult in the commercial sector. The higher eiciency, lower ventilation requirements, and savings in heating and air-conditioning costs could be important motivating factors. The conversion to induction cooking would it in with the goals of institutions that want to become carbon neutral. Rebates, demonstrations, and pilot projects, starting with the commercial sector are likely to be required to make the transition in existing buildings.
6. The value of eliminating fuel price volatility
One of the most attractive economic features of an energy system with solar and wind energy as the main supply sources is that fuels are eliminated. Oil and natural gas price volatility prevents business planning and personal budgeting. When prices rise suddenly, energy costs can play havoc
328 Makhijani and Mills 2015329 DOE EERE 2012 BEDB, Table 1.1.4. The cooking data is for all of U.S. in 2010.= 330 Cost comparisons obtained by a search of evaluations by Consumer Reports.

191
Prosperous, Renewable Maryland
with people’s lives and hurt businesses. Figure IX-2 shows the wellhead prices of natural gas. This is the kind of volatility that caused the former CEO of Duke Energy to bring a famous aphorism coined by Ben Franklin into the fossil fuel era:
Ben Franklin said there are two certainties in life: death and taxes. To that, I would add the price volatility of natural gas.331
Figure IX-2: Natural gas wellhead price, for about 90 years. Source: EIA Natural Gas Wellhead 2016
In particular, rising prices can hurt low-income households and small businesses. Solar and wind energy installations once built have low operating costs, essentially all of which are i xed and predictable. In a time when these energy sources were more expensive than fossil fuels, the issue was in part a trade-of between the higher i rst cost of renewable energy and the risk of fossil fuel price volatility. But wind energy and utility-scale solar are approximately as economical as new natural gas electricity generation, even at low natural gas prices.332 Thus, going to solar and wind energy essen-tially provides free fuel price hedging – an insurance policy with zero cost.
The Rocky Mountain Institute, in a 2012 study, evaluated this aspect by comparing a wind farm with a new combined cycle natural gas plant in the case of the Public Service Company of Colo-rado. The net present hedge value of wind energy was estimated at more than $20 per megawatt-hour, at a discount rate of 8 percent.333 This is a very substantial amount, considering that the levelized cost of wind energy is estimated at between $32 and $77 per MWh, depending on location.
Overall, the Climate Protection Scenario would free the electricity system of fuel price alto-gether. It would also free the transportation sector of fuel price risk, since electric vehicles would be powered by renewable energy with no fuel requirements. Maryland should evaluate the value of the hedge value of solar and wind energy in the context of setting renewable portfolio standards.
331 Jim Rogers, as quoted in Huber 2012, p. 5. 332 See Lazard 2015, slides 2 and 5, for comparative levelized costs.333 Huber 2012, Figure 10b (p. 18)

192
X. Jobs, communities, and just transition
X. Jobs, communities, and just transition
Producing “a net economic beneit to the State’s economy and a net increase in jobs in the State” is a requirement of the planning process mandated by Maryland’s Greenhouse Gas Emissions Reduction Act.334
Any major economic transition generally creates both positive and negative impacts on jobs. In the present case, the job creation impacts could be much larger than job loss impacts in two ways. First, Maryland will have the opportunity to spend more of its energy dollars within the state. At pres-ent most expenditures on natural gas, petroleum, and almost all expenditures on coal low to other states (and countries). They can potentially be replaced by in-state renewable electricity generation and eiciency expenditures. Building eiciency improvements add net jobs within the state since most of the work is necessarily done within the state. In the renewable electricity sector, the in-state jobs will largely depend on state policies, the extent of distributed solar, ofshore wind generation, and in-state wind generation.
Second, we estimate that the cost of a renewable energy system will be lower than the contin-ued use of fossil fuels in the business-as-usual case, even without counting the avoided damage due to climate change or the other health and environmental costs of using fossil fuels. This will leave Marylanders more disposable income to spend on goods and services than in the business-as-usual case, creating a substantial economic stimulus.335
Nonetheless, there will be some negative impacts – coal-ired power plants will be closed; most of the natural gas infrastructure will be retired; the coal mines in Western Maryland may not be economically sustainable. We note that in our Climate Protection Scenario, some coal use remains for cement and paper production, though it is possible that such coal use may be converted to natural gas and/or to renewable energy sources in the future.
Some negative job impacts are likely to occur independently of greenhouse gas policy. For instance, the Calvert Clifs nuclear reactor licenses expire in the mid-2030s. Wall Street is not bullish on nuclear power; the “nuclear renaissance” has essentially collapsed. Costs of operating and main-taining existing nuclear plants have been rising (Chapter VII, Section 2.vii). It is also possible that the plant’s license may be further extended, should 80-year operation be allowed by the Nuclear Regula-tory Commission. Given the anticipated license expiry date, it is prudent to put in place measures to protect communities and workers near Calvert Clifs and in any areas where a power plant closure would have large negative impacts.
Finally, low-income households may be adversely afected by the transition unless speciic measures are taken to protect them and include them in emerging economic opportunities (see Chapter VIII).
334 Maryland GGRA 2009, Section 2-1206(8)(VI)335 The sensitivity analysis in Chapter IX, Section 2, indicates a range of $1.4 billion to $7.9 billion in annual savings in
the year 2050.

193
Prosperous, Renewable Maryland
In light of the above, we will consider four issues in this chapter:
• Jobs created as a result of the energy transition.
• Policies to assist communities and workers that may be adversely afected to ensure that jobs and economic protections are created in advance of, or concurrently with, the anticipated ad-verse efects – the aim would be to avoid adverse efects.336
• Policies to ensure that energy is afordable for low-income households and that they can avail themselves equitably of the opportunities that will be opened up by a transition to the grid-of-the-future.
• Policies to address the creation of jobs in communities that are at present underserved and have relatively high unemployment.
We note at the outset that it is diicult to estimate the in-state component of energy supply jobs in either the Climate Protection Scenario or the business-as-usual scenario. This is because the por-tions of wind and solar energy needed that will be built within the state are uncertain. They will depend on policies in Maryland compared to other states in the PJM and MISO (Midcontinent Independent System Operator) regions for promoting investments in a renewable grid-of-the-future, availability of transmission, and social factors such as support or opposition to wind energy.
1. Jobs created by the transitionWith the caveat that jobs estimates are uncertain, we make an approximate estimate of job
creation in the transition in two categories:
• Direct and indirect jobs created by the in-state investments needed to transition to a distributed, emissions-free energy system.
• Jobs created as a result of greater disposable income in Maryland due to the Climate Protection Scenario having lower overall costs to meet the requirements for energy services in the State.
The National Renewable Energy Laboratory (NREL), which is the principal source for the direct and indirect jobs estimates we have made in this chapter, deines direct and indirect jobs as follows:337
• Direct (project development and onsite labor) jobs, earnings, and output are the jobs and economic activity associated with the design, development, management, construction/installation, and maintenance of generation facilities. For example, in in-stalling a PV or large wind system, the direct impacts include the jobs, earnings, and output associated with the specialty contractors, construction workers, clean-up crews, truck drivers, and other specialists hired to permit, design, and install the system. It also includes management and support staf.
• Indirect (supply-chain labor and local revenue) jobs, earnings, and output are the jobs and economic activity associated with the manufacturing of equipment and ma-terials used for the facility, the supply chain that provides raw materials and services to these manufacturers, and the inance and banking sectors that provide services for the construction and operation of a facility. For example, for a wind facility, this would include jobs at wind turbine manufacturing plants and jobs at other manufacturing
336 See the discussion paper on a just energy transition in Attachment C. 337 NREL Jobs 2012, p. 8

194
X. Jobs, communities, and just transition
facilities that fabricate structural hardware, foundations, and electrical components for
the wind facility’s systems. It also includes the banker who inances the construction contractor, the accountant who keeps the contractor’s books, and the jobs at steel mills
and other suppliers that provide the necessary materials.
Note that manufacturing jobs are included in the indirect (supply chain) jobs.
From these two deinitions, it is clear that the direct jobs will tend to be in the area where the investment is taking place, while indirect jobs, for the most part, could be located anywhere in the world. NREL estimates direct and indirect jobs within the United States, which is the approach we have used; in other words, the jobs estimates here do not include jobs in other countries, unless speci-ied otherwise.
Estimating in-state jobs associated with renewable energy supply requires some additional screening tests. Are there suicient resources? Can generating facilities be sited within the state given the constraints of technology, zoning, environmental, and social factors? In general, we may assume that distributed solar generation would be the least diicult to site, while tall wind turbines may be much more diicult. Energy eiciency, transportation infrastructure, and smart grid related jobs will, by their nature, be mostly within the state.
The potential for distributed solar338 in Maryland is very large; it could, in theory, accommo-date essentially all of the solar generation of 55 million megawatt-hours per year that we estimate will be needed in the year 2050 in the Climate Protection Scenario.339 Rural land unsuitable for farming and not forested could provide additional solar generation. The solar energy requirements could, therefore, be met essentially entirely from within the state. We estimate if the solar facilities are built within the state, almost three-fourths of the solar jobs would be in Maryland. The fraction of solar energy of the total electricity required could be increased if storage becomes much cheaper than anticipated. Much of this additional solar could also be distributed, though that will depend on the evolution of solar PV technology and on the nature of the transformation of the electric grid.
Investments in wind energy, both onshore and ofshore, are an uncertain element, especially in regard to the in-state fraction. The Climate Protection Scenario as modeled in this report will require about 51 million megawatt-hours of wind energy coming from 6,000 megawatts of ofshore wind, 1,000 megawatts of in-state wind, and 6,000 megawatts of out-of-state onshore wind (which we as-sume will be imported from South Dakota for the purposes of hour-by-hour modeling).
Maryland does not have major manufacturing facilities for wind and solar energy components. However, a irm commitment to develop a renewable electricity system based on solar and wind, could be used to leverage the addition of both solar- and wind-related manufacturing in the state (see below).
Creating manufacturing jobs related to ofshore wind faces a similar requirement, with one additional hurdle. The United States is about two decades behind some Western European countries in building ofshore wind farms.340 Only one small 30-megawatt installation is under construction of Rhode Island. Denmark and Germany already have major manufacturing infrastructure for ofshore
338 We use the term distributed solar in this context to mean solar in urban areas, which includes residential and commercial
rooftop solar, medium-scale ground-mounted facilities, and urban utility-scale ground-mounted facilities. Rural utility-
scale facilities are excluded from the term “distributed solar.” 339 At 20 percent panel eiciency, we calculate the urban rooftop plus utility-scale solar potential to be about 62 million megawatt-hours. This does not include the potential of parking lot canopies. Given the continuing improvements in panel
eiciency and in solar PV technology more generally, the distributed solar potential in Maryland is considerably greater than the requirements we calculate for the year 2050. 340 EESI 2016

195
Prosperous, Renewable Maryland
wind. Thus, it will take signiicant commitment in the United States to provide the assurance that in-vestors will require to build additional manufacturing facilities for major components here.
Ofshore wind has signiicant advantages over onshore wind, despite higher cost per kilowatt. The capacity factors are generally higher. The transmission requirements in terms of length of the lines are shorter in the mid-Atlantic region, and the visual impact is usually smaller. The balance between ofshore wind and onshore wind, and in-state deployment versus electricity imports is only margin-ally a technical one at present. Electricity supply, as modeled in the Climate Protection Scenario has approximately equal wind and solar generation. This results in winter and summer loads being met mainly from wind and solar generation, plus daily demand response and battery storage.341 This mini-mizes the need for peaking generation or long-term demand response strategies. It does result in some curtailed energy in the spring and fall seasons in the model developed in this report. Such curtailment can be signiicantly reduced, as briely discussed in Chapter XI.
Several states in the region have plans for ofshore wind installations.342 In 2013, Maryland passed a law for a maximum of 2.5 percent of electricity supply from ofshore wind.343 Depending on the capacity factor, this could amount to about 500 megawatts of ofshore wind; of this about 200 megawatts would be supported by the issuance of Ofshore Wind Renewable Energy Credits (ORECs).344 But it will take a commitment to build ofshore wind farms at a more signiicant and steady pace to have a prospect of manufacturing of the major components along the Eastern seaboard in general and in Maryland in particular.
We will estimate the total jobs created by a transition to the Climate Protection Scenario in the following categories:
1. Design and installation of solar, onshore, and ofshore wind energy systems;2. Operations and maintenance (O&M) jobs for solar and wind facilities;
3. Investments for a smart, resilient grid, including battery storage, electric vehicle charging transportation infrastructure, smart grid infrastructure, and eiciency investments.We do not consider transmission investments separately and assume that they will be about
the same in the business-as-usual and Climate Protection Scenarios (except that the items in Point #3 above are speciic only to the Climate Protection Scenario). Distribution investments in the electricity sector will be higher that the business-as-usual scenario, due to electriication of transportation and space and water heating. However, the increased jobs in these distribution investments would be ofset by the retirement of natural gas distribution infrastructure.
We start with total direct and indirect jobs created within the United States for the items listed above, estimating total job-years and steady full-time-equivalent (FTE) jobs that will persist for the long-term. Job-years add up the total FTE years over the entire buildup of the infrastructure of the Climate Protection Scenario. The number of steady jobs is calculated by dividing the jobs in each cat-egory by the total job-years by number of years the equipment is estimated to last.
The estimation of in-state jobs far into the future is more complex and diicult. Direct jobs, as deined by NREL, would mostly be within the state. Indirect jobs would partly be within the state, but the fraction is diicult to estimate. At present Maryland has little renewable-energy-related manu-
341 By “daily demand response” we mean that a particular demand, such as the operation of a clothes washer or dishwasher can only be shifted within a particular day; it cannot be carried over to the next day.342 The status of ofshore wind proposals in the United States is summarized in BizNOW 2016.343 Maryland Public Utilities Statute 2015, Section 7-303(b)(13)(i)(2) and Maryland Ofshore Wind 2013344 See BizNOW 2013.

196
X. Jobs, communities, and just transition
facturing. In addition, the supply chain for any modern technology is complex; it is beyond the scope of this study to examine supply chains in detail. Moreover, Maryland could attract manufacturing by making clear commitments, mandated by law and/or regulations to achieve certain renewable energy and eiciency targets that steadily and predictably rise over the long-term. The amount of solar energy and ofshore wind energy as well as the ultra-eicient HVAC equipment needed is large enough that an ambitious approach on the part of the state could attract new, large-scale manufacturing. For instance, the public utility owned by the City of San Antonio, Texas, leveraged its decision to build 400 mega-watts of solar PV installations to bring solar module manufacturing to the area.345
Table X-1 and Table X-2 show the estimates for solar and wind investment-related jobs and O&M-related jobs.
Table X-1: Solar, onshore wind, and ofshore wind investment and jobs in the United States for the Climate Protection Scenario in Maryland (Note 1)
Investment item
Total
investment
million
2011 $
Period,
years
MW
installed
Job-
years
per MW,
CPS
(Note 2)
Total
job
years
Steady
long-
term
jobs
Average
job-years/
million $
investment
Solar PV, capital
investment $34,000 30 36,000 4 154,000 5,100 4.5
Onshore wind,
capital investment $11,000 25 7,000 10 70,000 2,800 6.4
Ofshore wind, capital investment
(Note 3) $18,000 25 6,000 25 149,000 6,000 8.3
Combined heat and
power (Note 4) $3,000 25 2000 2 4,000 160 2
Peaking generation
(Note 5) $5,000 25 6,000 2 12,000 480 2
Sub-total electricity
generation $71,000 27 57,000 7 389,000 14,540 5.5
Source: IEER for Climate Protection Scenario capacity, cost, and period (lifetime) estimates. Jobs
per MW estimated by IEER from NREL Jobs 2012.
Note 1: All numbers rounded as indicated.
Note 2: NREL Jobs 2012 estimated the direct and indirect jobs created in the United States by the
investments in wind and solar energy as well as the corresponding O&M jobs. Since the cost of solar
and wind was higher in the time period evaluated by NREL, we proportionately reduced the number
of job-years to build one megawatt of capacity to correspond to the capital costs for the Climate Pro-
tection Scenario.
Note 3: Ofshore wind costs were estimated from the mid-Atlantic jobs estimates in NREL Ofshore 2015, p. iv. We used the geometric mean of the range of estimates (14 to 44 (per MW)) for a wind
farm located of Virginia’s coastline. 345 OCI Solar Power 2014, CPS Energy 2016

197
Prosperous, Renewable Maryland
Note 4: CHP jobs derived from Kim, Baer, and Brown 2013, Table 3 (p. 10).
Note 5: Peaking generation jobs per MW assumed equal to CHP jobs per MW
Table X-2: O&M jobs in wind and solar energy in the Climate Protection Scenario in 2050
Electricity sources
Annual
O&M cost
in million
2011 $ MW
FTE
O&M
jobs/MW
Steady
FTE jobs,
gross
FTE per
million $
Solar PV, O&M, annual (Note 1) $630 36,000 0.27 9,500 15Onshore wind, O&M annual (Note 1) $350 7,000 0.36 2,500 7Ofshore wind, O&M annual (Note 2) $520 6,000 0.61 3,600 7Hydrogen O&M, annual (Note 3) $500 3,500 7Total O&M jobs, energy supply $2,000 19,100
Source: Calculated by IEER using estimates in NREL Jobs 2012. O&M costs for hydrogen are from DOE FCT 2011-2020, p. 3.1-11.
Note 1: These are steady jobs required for the operation and maintenance of renewable energy gen-eration. NREL Jobs 2012 provided estimates for the facilities built with a mix of private and Ameri-can Reinvestment and Recovery Act (ARRA) funds. We adjusted these to the estimates for O&M cost per MWh used in the Climate Protection Scenario in the case of solar electricity costs. No ad-justment was needed for onshore wind.
Note 2: We used the average of the O&M jobs estimates per MW made by NREL in its ofshore wind study (NREL Ofshore 2015, p. iv).Note 3: Hydrogen FTE per million $ assumed equal to wind energy O&M.
Table X-3 provides data on how solar PV jobs are distributed in the various categories of work.
Table X-3: Solar industry jobs in the United States, in 2014 (Note 1)
Job category Solar Jobs Share
Installation 97,031 56%
Manufacturing 32,490 19%
Sales and distribution 20,185 12%
Project developers 15,112 9%
All other 8,989 5%
Total 173,807 100%
Source: Solar Foundation 2015, Table 1 (p. 6)
Note 1: Well over 90 percent of these jobs are in solar photovoltaics. The rest are in solar thermal technology and concentrating solar power. (Solar Foundation 2016, p. 10)
There is much less experience with the jobs in the grid-of-the-future, including large amounts of battery storage, communications systems needed for a smart grid, and charging infrastructure. In the realm of eiciency, a very large fraction of the investments is in converting fossil fuels space heating systems to eicient heat pump systems. These investments amount to about 44 percent of the total ef-

198
X. Jobs, communities, and just transition
iciency investments. Commercial and industrial sector investments in eiciency account for another third. Given that, we applied the average jobs per million dollars invested for renewable energy shown in Table X-1 above for this mix of grid-of-the-future investments. Table X-4 shows a very approximate estimate of jobs associated with the grid-of-the-future.
Table X-4: Grid-of-the-Future jobs, Climate Protection Scenario
Other investments
Investment,
million 2011 $
Lifetime,
years
Job-years/mn
2011 $
(Note 1)
Total job
years
FTE
steady
jobs
Transportation infrastructure $12,000 20 5 66,000 3,300
Grid storage batteries $9,000 15 5 49,000 3,300
Smart grid $8,000 20 5 44,000 2,200
Eiciency $62,000 17 5 340,000 19,900
Hydrogen $5,000 20 5 27,000 1,400
Total grid-of-the-future
investments (Note 2) $96,000 18 526,000 30,100
Source: IEER calculations
Note 1: Job-years per million dollars assumed equal to the average of renewable energy investments
shown in Table X-1 (and rounded down).
Note 2: Incremental electric distribution investments are not included in this table. The jobs in this
sector are assumed to be ofset by reduction of natural gas distribution infrastructure.
Table X-5 shows a summary of the direct and indirect steady FTE jobs in the United States in the Climate Protection Scenario.
Table X-5: Summary of steady full-time direct and indirect jobs (gross) in the Climate Protection
Scenario (rounded to the nearest $100 million and 1,000 jobs)
Item
Annual amount,
million 2011 $
Long-term jobs,
gross
Renewable energy investments $2,600 15,000
Grid-of-the-future and eiciency investments $5,400 30,000
Operations and Maintenance $2,000 19,000
Total energy sector, CPS $10,000 64,000
Source: Summary of Tables X-2 to X-4
Note: Table X-5 represents an approximate gross jobs total – that is, the total steady jobs in the
Climate Protection Scenario – within the United States. The vast majority of jobs in the grid-of-the-
future (including eiciency investments) are likely to be within the state. If solar and ofshore wind investments are also within the state, possibly as many as 50,000 of the total of 64,000 jobs would be
within the state, excluding new major manufacturing.
A study published by Labor Network for Sustainability, 350.0rg, and Synapse Energy Econom-ics (LNS et al. 2015) estimated that an energy system that was the mainstay of reducing GHG emis-sions by 80 percent relative to 1990 by the year 2050 would have about 2 million total gross direct

199
Prosperous, Renewable Maryland
and indirect long-term jobs in the United States. In addition there would be about one million induced jobs due to the economic stimulus of a transition to renewable energy in that year.346 On a population basis, Maryland’s share of the direct and indirect jobs would be just under 2 percent or about 40,000 gross jobs, which is somewhat lower than the total for gross jobs in Table X-5 above. However, there are several diferences in the composition of the jobs estimates between the LNS et al. report and the Climate Protection Scenario in this report. For instance, the LNS et al. report includes automobile manufacturing, since vehicles of the future will be electric. We have not included this sector on the as-sumption that present and future vehicle manufacturing jobs will be the same order of magnitude. On the other hand, we have included extensive investments in the grid-of-the-future and in storage; our renewable energy investments are also more extensive than those in LNS et al. So the gross direct and indirect jobs comparison above is intended only as an order of magnitude exercise for the year 2050 rather than a precise projection.
LNS et al. also estimated that the net jobs created, after accounting for job losses in the fossil fuel and electric power industries, is about 1 million in that year, including induced jobs. Essentially the entire increase in net jobs is due to induced jobs. When applied on a per capita basis, the national estimate yields a net steady addition to jobs in Maryland of almost 20,000 in the year 2050.347
Finally, the LNS et al. report includes year-by-year estimates of gross and net jobs.348 We have not made such a detailed estimate. The number of jobs would grow over the next two to three decades but should hold steady after that because equipment would be replaced in the post-2050 period at about the same level as the annual buildup in the prior years. Table X-5 represents our estimate of steady long-term jobs by about the decade of the 2040s and thereafter in the Climate Protection Scenario.
We have not made an independent estimate of net jobs in Maryland as a result of the transi-tion, though that is an important economic indicator for the state. This is because the net jobs created in the state is critically dependent on the policies adopted, the timing of those policies, and the vigor with which they are implemented. However, since a much larger fraction of energy sector investments will be in eicient, smart grid, distributed generation, and storage, most of the jobs would tend to be within the state. There is a critical diference in the control that states have over in-state jobs in a fossil fuel future and a renewable-energy/eiciency future: states have much more control over the number of jobs in a renewable energy future because renewable energy resources are amply and widely dis-tributed compared to fossil fuel resources. State policy also determines how vigorous the approach to energy eiciency and to the grid-of-the-future, and the corresponding jobs, will be.
Further, almost all states, including Maryland, have renewable resource potential far in excess of their own requirements; they are therefore in a position to become energy exporters to other states. Evidently, not all states can be exporters. Vigorous renewable energy development leading to net elec-tricity exports can create jobs over and above those needed for Maryland’s own energy requirements. On the other hand, if Maryland lags behind in renewable energy development, it may remain an energy importer with the corresponding loss of jobs to other states.
Similarly, states and local governments that take the initiative can increase manufacturing associated with renewable energy, eiciency, and the grid-of-the-future. For instance, as discussed above, the city-owned utility in San Antonio, Texas (CPS Energy), leveraged a decision to build 400 megawatts of solar PV generation to get solar module manufacturing to locate in the area. Maryland could do the same. The Climate Protection Scenario has 36,000 megawatts of solar electric capacity by
346 LNS et al. 2015, Figure 2 (p. 7)347 LNS et al. 2015, p. 7 and Figure 2. The induced jobs estimate in LNS et al. is similar to that in this study – see below in Section 2 of this chapter.348 The average net increase in the 2016-2050 period is estimated at 550,000 steady jobs, nationally. (LNS et al. 2015, p. 7)

200
X. Jobs, communities, and just transition
2050. This is more than enough, with a suitable renewable portfolio standard mandate, to bring solar panel and other solar PV related manufacturing to the state. The same is true of ofshore wind – with 6,000 megawatts by 2050. HVAC equipment provides another example. A irm policy commitment and schedule to convert natural gas, fuel oil, and propane heating systems to eicient electric ones could make a fertile starting point for manufacturing of cold-climate and geothermal heat pumps in the state.
These jobs are much more likely to go to the states that lead others in making irm commit-ments to a renewable, resilient, future energy system. Once major ofshore wind, solar panel, or HVAC manufacturing facilities are built, they will tend to supply entire regions from large-scale facilities. Baltimore has a world class port and a history of large-scale manufacturing, both signiicant advan-tages in securing manufacturing for a climate-protection-oriented energy system. If Maryland lags behind in making a irm commitment to an emissions-free, renewable energy future, many jobs that could be in Maryland in principle are likely to go to other states (or countries).
Finally, it is important that jobs created be steady. Most renewable energy, eiciency, grid-of-the-future, storage, and electric transportation infrastructure investments are modular by their very nature. This means that unsteady policy would result in boom and bust cycles of economic activity and employment. On the other hand, if there is certainty regarding steadily improving eiciency, increas-ing legally-mandated renewable portfolio targets with a clear deinition of renewable energy (Chapter VI, Section 2.i above), the jobs can be sustained over decades. This will especially be true if the pace of construction corresponds approximately to the expected economic life of the investments – 10 to 20 years for most eiciency investments and 20 to 30 years for renewable energy investment.
2. Induced jobs
The cost estimates in Chapter IX indicate that the energy system in the Climate Protection Scenario is very likely to cost considerably less than a business-as-usual approach. The sensitivity analysis (Chapter IX, Section 2) indicates that the savings will be in the range of $1.7 billion to $7.7 billion per year by the year 2050. Marylanders would have this amount of additional money to spend and invest, creating more economic activity and jobs in the state.
The American Council for an Energy-Eicient Economy estimates that general expenditures create about seven more jobs than utility-related expenditures per million dollars of spending.349 On this basis, the savings and resultant economic stimulus occasioned by lower cost energy services would result in between 12,000 and 54,000 jobs, most of which would be within the state.350
3. Distributed jobs in underserved areas
Eiciency, distributed solar energy installations, and much of the electric transportation and smart grid infrastructure will involve jobs that are widely dispersed – close to where most people and businesses are located. Speciically, a great many of these jobs will be in urban areas, including areas where unemployment and underemployment are serious, even endemic, problems and areas where la-bor force participation is low and unemployment is high for a variety of reasons. The creation of a dis-tributed, resilient, eicient, and renewable energy system would also bring with it the opportunity of greatly increasing employment in areas of economic and social distress. Baltimore, by far Maryland’s largest city, is an example of an urban area where there are serious economic problems – as evidenced, for instance, by the high rate of need for energy bill payment assistance. Some rural areas where pov-erty is high, such as many of the counties on Maryland’s Eastern Shore, present similar opportunities.
349 ACEEE 2011 350 See Breslow 2011 for an example of in-state jobs estimates.

201
Prosperous, Renewable Maryland
It will take investment, leadership, training, and organization to join the building of a distrib-uted energy system with job opportunities in Baltimore, Western Maryland, and the Eastern Shore. Existing organizations, such as Civic Works in Baltimore, provide examples of how this can be done. It is a community-centered multi-issue organization and the energy work is a part of that larger efort, which includes:
• Building brighter futures “for Baltimore’s youth through education and hands on job training” – these jobs include green jobs in solar energy, weatherization, and environmental remediation;
• “Food and farm programs” for producing more healthy food and “combatting food deserts in Baltimore”;
• Building “green communities” through converting vacant lots into “community green spaces”;• Creating “safe and afordable homes” by weatherizing them and making them more eicient
and “ofering residents access to solar energy.”351
GRID Alternatives, created to provide low-income households with solar energy access and job training along with that efort, provides another example of the kind of organization that can create dispersed jobs in the very communities where they are needed most while building up a green energy economy. Started in California, the organization has recently expanded to the mid-Atlantic region, including Maryland.352
Such eforts can and should be greatly expanded, given the need for large increases in renew-able energy, weatherization and other eiciency improvements, and energy equity in the transition to an emissions-free energy sector. Providing universal solar access to low-income residents who cur-rently receive energy assistance would require on the order of 1,000 megawatts of solar capacity; this would create hundreds of jobs in the very same communities, if there were the adequate community-based social infrastructure for participatory decision-making, job training, and a holistic approach to the needs of low-income people and households. In fact, the scale of the requirement for universal solar access is such that, were it mandated by law, it could be used to leverage the creation of solar panel and other manufacturing in the state (see the example of San Antonio in Attachment C).
While renewable energy and eiciency are generally more economical, there are added invest-ments that need to be made, for instance in job training of youth or workers who have experienced long bouts of unemployment. Further, the inancing of rooftop solar systems for low-income house-holds faces signiicant hurdles. The scale-up of the work of organizations like Civic Works and GRID Alternatives, and the provision of the needed resources, should be part of the transition to a renew-able energy system in order to ensure that the economic beneits are equitably distributed. Such funds should be a part of the Community and Worker Protection Fund discussed in Section 5 of this chapter below.
4. Jobs summaryOverall, about 64,000 steady full-time-equivalent jobs would be created in the United States,
most of them in Maryland, in creating and maintaining Maryland’s energy system of the Climate Pro-tection Scenario. The increment of jobs within the state over business-as-usual depends strongly on state policy. Moreover, if the State proceeds vigorously to a renewable, eicient, and resilient energy system it could become a manufacturing center as well with attendant positive implications for jobs. The quality of the jobs would be comparable to those in the utility and construction sectors today.
351 Civic Works Annual Report 2014, pdf pp. 2-3352 GRID Alternatives 2016

202
X. Jobs, communities, and just transition
Total direct, indirect, and induced steady jobs in the United States corresponding to Maryland’s energy requirements and the stimulus of the savings in the Climate Protection Scenario would be in the 70,000 120,000 range (rounded to the nearest 10,000 jobs). This range of job totals consists mainly of jobs in eiciency, grid-of-the-future, and operations and maintenance sectors as well as in the induced jobs due to the economic stimulus of lower costs of energy services. Therefore, it is reasonable to infer that most of the total of 70,000 to 120,000 jobs would be within the State.
5. Protecting communities and workers
The main industries that are expected to be adversely afected are:• Centralized coal and (possibly) nuclear power generating stations, if the latter retire at the ex-
piry of their licensed periods;
• Natural gas and fuel oil supply and natural gas infrastructure;
• Coal mining.
The Calvert Clifs nuclear plant has about 900 employees;353 coal-ired power plants have about one employee per seven megawatts at the largest three plants.354 On this basis, about 2,000 jobs would be afected at Maryland’s major power plants with a capacity of about 10,500 MW, almost half of which would be at the Calvert Clifs plant, which we assume would be retired when the licenses of its reactors expire in 2034 and 2036 (See Chapter VII, Section 2.vii). This would not be a net loss of jobs; rather these are jobs that would be lost in the afected communities if adequate renewable and associated energy facilities are not located there or if other measures are not taken to prevent job loss as these plants retire.
Garrett County and Allegany County in Western Maryland are the State’s coal mining areas. The mines had 401 workers in 2013.355 There is already signiicant solar energy activity in that part of the state. Adequate planning, notably in regard to distributed solar generation in the rural areas of the State, could help in the transition away from fossil fuels.
An associated problem is that the small communities where these plants or mines are located would face loss of tax revenues and with them the loss of funds for public services – schools, libraries, police, and ire department funds. For instance, the Calvert Clifs nuclear plant paid about $23.5 mil-lion in taxes, or payments in lieu of taxes, and fees to Calvert County in 2015,356 amounting to about $1.70 per megawatt-hour generated from that plant.
When coal plants are added, the total requirements for community protection would be on the order of $50 million per year. Of course, these funds would be needed every year. Therefore, it is important to build up a fund over time before the plants close, so that communities will have funds available for a number of transition years after plant closure.
Provision must also be made for the employment of displaced workers. IEER and the Labor Network for Sustainability have proposed that jobs in communities that are vulnerable to the adverse
353 Exelon Calvert Clifs 2016 354 Chalk Pont generation station, 2,413 megawatts, had 271 employees in 2009 (Mirant Chalk Point 2009); Morgantown
generation station, 1,486 MW, had 199 employees in 2009 (Mirant Morgantown 2009); and Brandon Shores, 1,273 MW,
has 205 employees (EPA Brandon Shores 2016). This gives a total of 4,944 MW and 675 employees, for an average of one
employee per 7.3 MW. 355 Maryland Bureau of Mines 2013. The number of employees does not “include oice, supervisor personnel, or indepen-
dent truck haulers.” 356 Calvert County 2016. A small amount, about $0.4 million, was also paid to the State of Maryland.

203
Prosperous, Renewable Maryland
efects of a transition to renewable energy be created prospectively or concurrently with the phase out of fossil fuels. The jointly published paper advocating this policy nationally is reproduced in Attach-ment C. The jobs would be inanced using a Community and Worker Protection Fund (CWP Fund), which could be raised in various ways. The monies in the Fund could also be leveraged to stimulate more investments, in the same way the ratepayer funds for eiciency incentives leverage private in-vestments in more eicient appliances and buildings.
Finally, it is also essential to create distributed jobs in low-income communities (along with needed worker training), notably as they relate to eiciency, solar energy, and improving homes to make them heathier (see Section 3 of this chapter, above).
We have made a provision of $200 million per year for the CWP Fund. If the CWP Fund is created early enough in the transition and the process works, most of this amount may actually not be needed by the year 2050. That is, if good jobs are created before fossil fuel-related jobs disappear, there may be little need for a continued Community and Worker Protection Fund by the year 2050. However, as noted in Chapter IX, the cost estimates for the Climate Protection Scenario assume a continued need for public funding of community and worker protection throughout the process of a transition to an emissions-free energy system and even after that.
The LNS et al. study point out that job creation alone does not guarantee good jobs:
Climate protection will require the creation of tens of thousands of new jobs. But there is no guarantee that they will be good jobs. Indeed, depending on other economic trends, spending on climate protection could increase inequality and provide increas-ingly insecure, contingent work. Climate protection strategy should be designed to pro-vide the maximum number of good, secure, permanent jobs with education, training, and advancement that provide maximum possible improvement in our job shortage.357
The LNS et al. study notes that strong policies, including creation of a fund to protect workers and communities, increasing collective bargaining power, and vigorous climate protection policies will be needed to ensure that the jobs are good, living wage jobs.358
In general, it is essential that communities and workers should have a fund that serves to protect them from the loss of facilities that employ large numbers of people, especially if they are in sparsely populated areas where loss of a single major employer can devastate a community for a long time. Communities often provide incentives, such as tax breaks, to corporations to welcome them to increase the number of jobs. Large corporations typically make provisions for what is commonly called “golden parachutes” for upper management when they leave, retire, or even in cases where their employment is terminated. There is no reason that workers and communities should not have at least a stainless steel parachute if a corporation chooses to leave or if a plant is shut down due to obsoles-cence, for environmental reasons, or for any other reason.
Such funds could be handled, at least in part, in the manner that Norway manages a portion of its oil revenues. Norway created an Oil Fund, from levies on petroleum. It is the largest such sov-ereign fund in the world.359 Maryland could levy a charge on fossil fuel use and create a Community and Worker Protection Fund. A part of the CWP would be accumulated for communities (local gov-ernments and other public entities) for the time that fossil-fuel-related revenues decline or disappear.
357 LNS et al. 2015, p. 14358 LNS et al. 2015, pp. 14-15359 Norway Oil Fund 2016. Its formal name is Government Pension Fund Global.

204
X. Jobs, communities, and just transition
The rest would be spent along the way to create good jobs and diversify the economies of fossil-fuel dependent communities.
The community protection part would be spent if and when an industry shuts down or leaves, to pay for public services, until economic development eforts enable replacement revenue. A part would be spent to create new jobs in areas expected to be afected but before jobs are lost. Thus, a part or all of the replacement revenue would be generated from these economic activities, further cushion-ing the impact caused by closure of plants. Attachment C provides more detail on the approach as a national policy for the United States.
6. Energy justice
We have extensively covered the issue of energy justice in a prior report of the Renewable Maryland Project.360 In Chapter VIII of this report we noted that the transition to a grid-of-the-future will increase the need to ensure equity and opportunity for low-income households:
• The equity feature: The Afordable Energy Program, which would limit household energy ex-penditures to 6 percent of gross income is needed now, but would be even more critical to prevent additional distress during a renewable energy transition.
• The opportunity feature: The rules for the grid-of-the-future must ensure that low-income house-holds can actually avail themselves of the opportunities as we transition to a grid-of-the-future.
In regard to equity, we have included $200 million per year in additional funds over the as-sistance normally provided to low-income households to pay their electricity and heating bills.361 It is diicult to make a reliable estimate until a well-designed pilot program is carried out. But the $200 million provision corresponds, approximately, to a doubling of the participation level in assistance programs compared to recent years.362
So far as opportunities are concerned, the rules for the grid-of-the-future will play a central role, as discussed in Chapter VIII above. The Climate Protection Scenario has ample provision for so-lar energy to enable the inclusion of universal solar access for all low-income households. It also has ample provision for eiciency investments and for converting fuel oil and natural gas heating systems to eicient electric ones. Both of these measures would systematically lower energy bills – reducing the amount of assistance needed to pay bills under the Afordable Energy Program. In many cases, bills would decline below six percent of income after eiciency and HVAC investments are made, eliminating the need for energy assistance in those cases.
Finally, we note that the fraction of income devoted to energy would decline compared to the present in the Climate Protection Scenario. This does not by itself assure that low-income households would experience a decrease in energy expenditures any more than average income growth guarantees an amelioration of the budgets of low-income households. A suitable set of policies, which we have described here, in Chapter VIII, and in our energy justice report, will be needed.
360 Makhijani, Mills, and Makhijani 2015361 This is in addition to the $200 million for the CWP Fund.362 See Makhijani, Mills, and Makhijani 2015, Chapter V, for details of the Afordable Energy Program.

205
Prosperous, Renewable Maryland
XI. Environmental, health, and resource considerations
The total or near total elimination of fossil fuels from the energy system will generate enor-mous health, environmental, resource, and related indirect economic beneits in addition to complete or almost complete elimination of CO
2 emissions from the energy sector. However, no energy source,
or even energy eiciency, is without environmental impact.In this Chapter we do a brief and necessarily incomplete survey of some of the environmen-
tal, health, and resource beneits. This is followed by some observations on the remaining impacts of changing the energy system, the ways in which they may be minimized, and the approaches needed to ensure compatibility with a sustainable energy system.
1. WaterThermal generation, notably in coal and nuclear plants, is the most common form of electricity
production. A transition to a renewable electricity system based on solar and wind would eliminate essentially all water consumption and eliminate associated water withdrawals.363
As discussed in Chapter III, Section 1, thermal generation requires the use of vast amounts of water to condense the steam that drives the turbines. The heat rejected in the condenser is respon-sible for the largest use of fresh water in the region. Figure XI-1 shows the water consumption per megawatt-hour for various types of electricity generation. Consumption of water is almost all due to evaporation. With once-through cooling, which has the lowest water consumption, the intake require-ments are high – roughly 150 times the consumption. Water is heated in the process of condensing the power plant’s steam, and discharged at a higher temperature back into the water body. With cooling towers, the evaporative losses are high, but intake is far lower than with once-through cooling. Figure XI-1 shows typical water consumption per megawatt-hour for diferent types of thermal power plants and diferent types of cooling.
363 Hydropower reservoirs also have evaporation associated with them. There is a small amount associated with evaporation from the Conowingo dam.

206
XI. Environmental, health, and resource considerations
Figure XI-1: Typical water consumption, gallons per MWh, for various electricity generation
technologies. Source: NREL 2011, Tables 1 and 2 (pp. 12-13)
Table XI-1 (facing page) shows more detail on water withdrawals and consumption for fossil and nuclear technologies with once-through and cooling tower technologies.
Almost all Maryland’s thermal generation uses once-through cooling.364 Evaporative losses due to in-state generation, including from power plants on the Chesapeake Bay, amounted to about 10 billion gallons per year. Maryland imports about 40 percent of its electricity requirements from other states in the PJM grid, where thermal generation also dominates. Assuming that imports are characterized by approximately the same average water consumption as in-state generation, annual water consumption for Maryland’s thermal electricity use amounts to about 16 billion gallons. Water withdrawals would amount to roughly 1.3 trillion gallons per year for in-state generation and about 2.4 trillion gallons for overall electricity use, including imports of thermal electricity.365
364 Water consumption and withdrawal of water estimates can be found in a database of power plants compiled by the Union
of Concerned Scientists, at www.ucsusa.org/ew3database (UCS EW3 2012). The database includes information on sources
of water and type of cooling used (if any). 365 Only coal and nuclear water consumption is estimated here on the basis that all of it is once-through. These are there-
fore approximate values. Since some out-of-state thermal generation uses cooling towers, the water withdrawals would be
somewhat lower and the consumption somewhat higher for the imports portion of the estimates. In-state natural gas and
petroleum generation were only about 6 percent to the total. (EIA States 2015 Maryland, Table 5). Maryland also has about
2 million MWh per year of hydropower generation at the Conowingo dam. However, this is a run-of-the-river hydropower
plant, which does not have a large reservoir, so that evaporative losses would be expected to be far lower than those shown
in Table XI-1. We have not included evaporative losses associated with the Conowingo dam in our calculations, which
would be small relative to evaporative losses associated with thermal generation. Those losses would be the only ones as-
sociated with the Climate Protection Scenario. No water withdrawals in the manner of thermal power plants are involved.

207
Prosperous, Renewable Maryland
Table XI-1: Water withdrawals and consumption for coal, nuclear, and natural gas power plants, gallons/MWh
Withdrawal
gal/MWh
Median
consumption
(evaporation)
gal/MWh
Comments, withdrawal
values in gal/MWh
Nuclear, once-through 25,000 to 60,000 269 Median withdrawal = 44,380Nuclear, cooling tower 800 to 2,600 672 Median withdrawal = 1,101Coal, once-through 20,000 to 50,000 250 Median withdrawal = 36,350Coal, cooling tower 500 to 1,200 687 Median withdrawal = 1,005Natural gas steam, once-through 10,000 to 60,000 240 Median withdrawal = 35,000Natural gas steam, cooling tower 950 to 1,460 826 Median withdrawal = 1,203
Combined cycle, natural gas, once-through
7,500 to 20,000 100Median = 11,380;
can also use dry cooling: median = 2 gal/MWh
Combined cycle, natural gas, cooling tower
150 to 283 198Median = 253;
can also use dry cooling: median = 2 gal/MWh
Hydropower plants with reservoirs (Note 1)
N/A 4,491Range for evaporation 1,425
to 18,000 gal/MWh
Source: NREL 2011, Tables 2 and 3 (pp. 13-14)
Note 1: These values do not apply to Maryland’s Conowingo dam, which is a run-of-the-river hydro-power plant. (Exelon Conowingo 2016)
Water withdrawals for Maryland electricity use of about 2.4 trillion gallons amount to more than 10 times the total annual water use by all Maryland households.366 The impacts of domestic and power plant withdrawals are diferent in some respects. Domestic water must meet high standards of purity requiring extensive treatment and corresponding energy and chemical inputs. Power plant water intake can be brackish water, wastewater, Chesapeake Bay water, or fresh river water. However, the massive rate of water intake at large power plants causes impacts on aquatic life and also results in thermal discharges and evaporation that have ecosystem efects. The amount of impact varies by loca-tion, type of cooling, and types and locations of water withdrawn.
Much of water withdrawal due to thermal power plants located in Maryland is from the Chesa-peake Bay (in the case of Calvert Clifs nuclear plant) or its inlets (in the case of the C.P. Crane coal-ired power plant) or in the tidal basin of the Patapsco River (the Gould Street, Herbert A. Wagner, and Brandon Shores power plants).
The coal-ired Morgantown and Dickerson generating stations reported, to the Energy Infor-mation Administration, a withdrawal of about 640 billion gallons of water from the Potomac River. The Union of Concerned Scientists’ (UCS) best estimate of withdrawal was 350 billion gallons; UCS estimated the consumption at 2.5 billion gallons per year. In addition, the Chalk Point power station is
366 Calculated by IEER using Table XI-1. Maryland households withdraw about 100 gallons per person per day (Maryland Water 2003, p. 2), giving an annual withdrawal of about 0.2 trillion gallons per year, or just 8.3 percent of the withdrawals for thermal electricity generation.

208
XI. Environmental, health, and resource considerations
located on the Patuxent River. The annual withdrawal and consumption estimated by UCS are about 145 billion gallons and 1.3 billion gallons per year respectively. The UCS consumption estimates in-dicate that Maryland’s fossil fuel power plants result in the consumption of about 100 million gallons of fresh water per day, which is enough to supply about one million households. The water saved from thermal generation could be available, in principle, in Maryland for some mix of residential, commer-cial, industrial, and agricultural applications.367
The magnitude of thermal electric power plant water consumption is also illustrated by its dominant role in water consumption in the Susquehanna River Basin, where some of the power plants that are in the PJM region, but not in Maryland, are located. Figure XI-2 shows that thermal evapora-tive losses are responsible for about three-fourths of the entire consumptive use of water in the Basin. The total losses are estimated more than 100 million gallons of water per day in a “typical year”368
Figure XI-2: Consumptive uses of water in Susquehanna River Basin, 2011. Total consumptive use
127 million gallons per day. Percentages are rounded. Source: Susquehanna Comprehensive Plan
2015, p. 84
367 This is only a statement of availability, rather than a recommendation to consume the water.368 Susquehanna Comprehensive Plan 2015, p. 93. The amount of water in 2011 was less than this typical amount at about
93 million gallons per day (p. 84).

209
Prosperous, Renewable Maryland
The economic and ecological impacts of thermal generation on the region are substantial. For one thing, it is the main consumptive use by far, and consumptive uses are a principal cause of “water availability shortages in the basin”:
[Susquehanna River Basin] Commission regulations require mitigation for consump-tive use of water. Consumptive use is broadly deined to be the loss of water due to a variety of processes by which the water is not returned to the waters of the basin undi-minished in quantity. As discussed in Priority Management Area A – Sustainable Water Development, consumptive use is one of the principle [sic] causes of water availability shortages in the basin.369
If other states in the Susquehanna River Basin also transition to solar and wind energy, a great deal of fresh water from that Basin – about 90 million gallons per day – would become available for other uses because it will not be lost to evaporation. The amount is equivalent to the water consump-tion of about 900,000 average households. Since most residential water use is returned rather than con-sumed, it can be discharged into water bodies after appropriate treatment. Normally, municipal water is reused downstream “a number of times” in this way.370 Thus, the water saved from thermal genera-tion could be available, in principle, for millions of households in the Susquehanna River Basin or for other uses, including industry and agriculture. The beneit would accrue to people and the economy of the entire Basin. A transition away from thermal generation may also have positive impacts on the Chesapeake Bay; the evaluation of such impacts is beyond the scope of the present report. The Envi-ronmental Protection Agency regulates such impacts.371
Coal-ired power plants are also responsible for a variety of water pollution impacts both at the power plant, at upstream mining locations, and due to coal ash remaining after the coal is burned.
Finally, thermal pollution of rivers as well as of Chesapeake Bay waters due to the end of ther-mal electricity generation would also essentially end in the Climate Protection Scenario. The ecologi-cal beneits of restoring the temperature balance should be evaluated.
2. Air pollutionAir pollution is widely recognized as a leading cause of death and disease, especially respira-
tory diseases, throughout the world, even apart from CO2 emissions and the resultant climate change
impacts. We will consider outdoor air pollution irst and then consider indoor air pollution due to the use of natural gas.
i. Outdoor air pollution
The use of petroleum fuels in transportation and the use of coal in power production are the principal sources of such pollution, which includes emissions of ine particulates, nitrogen oxides, sulfur dioxide, carbon monoxide, and unburned hydrocarbons. In turn, these pollutants interact in the atmosphere and create new pollutants, notably tropospheric ozone.
369 Susquehanna Comprehensive Plan 2015, p. 84 370 EPA Water Reuse 2016 371 After a 2009 study of discharges and treatment technologies from the steam electric power generating industry (EPA 2009), the EPA tightened its rules relating to eluents from coal-ired power plants in 2015 (EPA 2015).

210
XI. Environmental, health, and resource considerations
These pollutants have substantial negative impacts on health:372
An extensive body of scientiic evidence shows that long- and short-term exposures to ine particle pollution, also known as ine particulate matter (PM
2.5), can cause prema-
ture death and harmful efects on the cardiovascular system, including increased hospi-tal admissions and emergency department visits for heart attacks and strokes. Scientiic evidence also links PM to harmful respiratory efects, including asthma attacks.Ozone can increase the frequency of asthma attacks, cause shortness of breath, aggra-vate lung diseases, and cause permanent damage to lungs through long-term exposure. Elevated ozone levels are linked to increases in hospitalizations, emergency room visits and premature death.
Both pollutants cause environmental damage, and ine particles impair visibility.The U.S. Environmental Protection Agency recognizes six “criteria pollutants” which it uses to
gauge overall air quality: particulate matter, ground-level ozone, sulfur dioxide, nitrogen oxides, car-bon monoxide, and lead. Particulate matter is abbreviated as PM and has two subclasses – particles of less than 2.5 microns diameter (PM2.5) and those less than 10 microns in diameter (PM10). Of these PM2.5 and ozone “are the most widespread health threats.”373
Regulation of emissions of air pollutants has had a signiicant impact on improving air qual-ity and greatly reducing the number of days when air quality criteria are not met and, in some cases, eliminating altogether days with very poor air quality. Aggregated air pollution, with the six criteria pollutants taken together declined 68 percent from 1970 through 2011.374
We can further illustrate this by examining the evolution of air pollution in the Baltimore met-ropolitan area between 2005 and 2014.
The Environmental Protection Agency publishes real-time and historical data on criteria air pollutants. A well-known study done by researchers at the Massachusetts Institute of Technology in-dicated that in 2005 ine particle air pollution (PM2.5) was a cause of a large number of deaths in the United States. Among the states, Maryland was adjudged the worst, in terms of death rates. Among the 20 metropolitan areas and cities covered in this study, it was the Baltimore metropolitan area.375
The results for some of the states are shown in Figure XI-3 and some Eastern metropolitan areas are shown in Figure XI-4. Apart from the speciic values of death rates, it is clear that direct fuel use, fuel use for transportation and for electricity generation are all major contributors. The MIT study estimated that there were more than 6,000 deaths in Maryland due to PM2.5 pollution in 2005.
372 EPA 2016 373 See EPA’s air quality webpages at https://www.epa.gov/criteria-air-pollutants (EPA Criteria Air 2016) and https://www3.
epa.gov/airquality/particlepollution (EPA PM 2016). The EPA provides real time air pollution maps at http://airnow.gov/
(AirNow 2016).374 State of the Air 2013, p. 5375 Caiazzo et al. 2013, pp. 203-205

211
Prosperous, Renewable Maryland
Figure XI-3: PM2.5 related death rates in selected Eastern states in 2005, by sector. Source: Caiazzo et al. 2013, Table 5 (p. 203). Chart by IEER.Note: Transport includes road, marine, and rail. RCI includes residential, commercial, and industrial.
Figure XI-4: PM2.5 related death rates in selected Eastern metropolitan areas in 2005, by sector. Source: Caiazzo et al. 2013, Table 6 (p. 204). Chart by IEER.Note: Transport includes road, marine, and rail. RCI includes residential, commercial, and industrial.
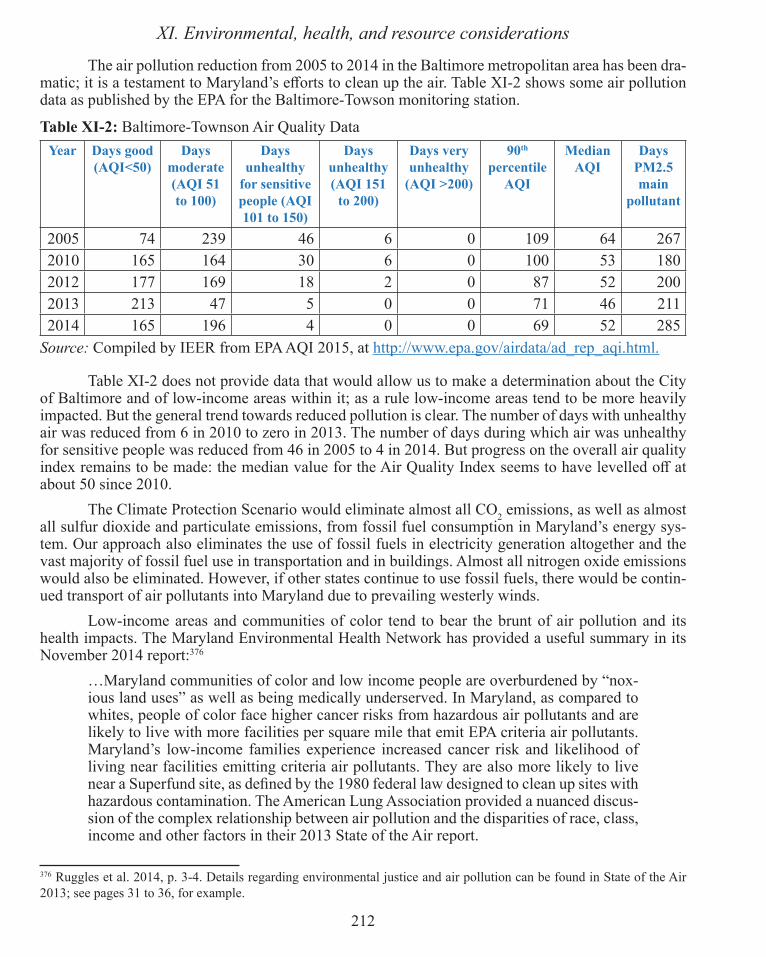
212
XI. Environmental, health, and resource considerations
The air pollution reduction from 2005 to 2014 in the Baltimore metropolitan area has been dra-matic; it is a testament to Maryland’s eforts to clean up the air. Table XI-2 shows some air pollution data as published by the EPA for the Baltimore-Towson monitoring station.
Table XI-2: Baltimore-Townson Air Quality Data
Year Days good
(AQI<50)
Days
moderate
(AQI 51
to 100)
Days
unhealthy
for sensitive
people (AQI
101 to 150)
Days
unhealthy
(AQI 151
to 200)
Days very
unhealthy
(AQI >200)
90th
percentile
AQI
Median
AQI
Days
PM2.5
main
pollutant
2005 74 239 46 6 0 109 64 267
2010 165 164 30 6 0 100 53 180
2012 177 169 18 2 0 87 52 200
2013 213 47 5 0 0 71 46 211
2014 165 196 4 0 0 69 52 285
Source: Compiled by IEER from EPA AQI 2015, at http://www.epa.gov/airdata/ad_rep_aqi.html.
Table XI-2 does not provide data that would allow us to make a determination about the City of Baltimore and of low-income areas within it; as a rule low-income areas tend to be more heavily impacted. But the general trend towards reduced pollution is clear. The number of days with unhealthy air was reduced from 6 in 2010 to zero in 2013. The number of days during which air was unhealthy for sensitive people was reduced from 46 in 2005 to 4 in 2014. But progress on the overall air quality index remains to be made: the median value for the Air Quality Index seems to have levelled of at about 50 since 2010.
The Climate Protection Scenario would eliminate almost all CO2 emissions, as well as almost
all sulfur dioxide and particulate emissions, from fossil fuel consumption in Maryland’s energy sys-tem. Our approach also eliminates the use of fossil fuels in electricity generation altogether and the vast majority of fossil fuel use in transportation and in buildings. Almost all nitrogen oxide emissions would also be eliminated. However, if other states continue to use fossil fuels, there would be contin-ued transport of air pollutants into Maryland due to prevailing westerly winds.
Low-income areas and communities of color tend to bear the brunt of air pollution and its health impacts. The Maryland Environmental Health Network has provided a useful summary in its November 2014 report:376
…Maryland communities of color and low income people are overburdened by “nox-ious land uses” as well as being medically underserved. In Maryland, as compared to whites, people of color face higher cancer risks from hazardous air pollutants and are likely to live with more facilities per square mile that emit EPA criteria air pollutants. Maryland’s low-income families experience increased cancer risk and likelihood of living near facilities emitting criteria air pollutants. They are also more likely to live near a Superfund site, as deined by the 1980 federal law designed to clean up sites with hazardous contamination. The American Lung Association provided a nuanced discus-sion of the complex relationship between air pollution and the disparities of race, class, income and other factors in their 2013 State of the Air report.
376 Ruggles et al. 2014, p. 3-4. Details regarding environmental justice and air pollution can be found in State of the Air
2013; see pages 31 to 36, for example.

213
Prosperous, Renewable Maryland
In view of the disparate impact of the present fossil-fuel-dominated system on low-income households and communities of color, we can expect a correspondingly large positive impact of the Climate Protection Scenario on these communities, especially if appropriate policies to make energy afordable and provide universal solar access are put into place.377
Mobile sources and power plants are the main sources of air pollution. Table XI-3 shows the EPA’s estimates for four air pollutants according to whether they are from mobile sources, stationary fuel burning, industrial processes, ires, etc. Carbon monoxide and nitrogen oxides, which are both precursors to ground-level ozone, are dominated by mobile sources. Almost all of this pollution would be eliminated by a transition to electric transport and renewable electricity generation. The vast major-ity of ine particulate air pollution PM 2.5 (particles of efective diameter less than 2.5 microns) would also be eliminated.
Overall, it is clear that for all categories except volatile organic compounds (VOCs), mobile sources and stationary fuel combustion are by far the dominant sources of air pollution. In the case of VOCs, biogenic sources are the dominant source, followed by mobile sources and emissions from the use of solvents.
Table XI-3: Air pollution by source in Maryland, 2011, short tons per year
Carbon
monoxideNO
XPM 2.5 SO
2VOCs
Mobile (Note 1) 641,721 118,838 5,829 6,731 65,391Fuel combustion (Note 2) 34,759 37,280 8,774 62,410 4,679Industrial processes (Note 3) 23,370 6,293 1,712 2,088 2,973Fires 33,005 360 2,761 225 7,483Biogenics/Agriculture 19,783 3,451 2,791 Not listed 137,890Solvents 12 16 4 0 37,265Miscellaneous/Other (Note 4) 19,645 2,690 9,231 491 7,888
Source: See https://www3.epa.gov/air/emissions/ (EPA Air Pollutants 2016) and extract data by pol-lutant and state.378 For the various processes that comprise each of the sources, see https://www3.epa.gov/air/emissions/basic.htm (EPA Air Pollutants 2016, Basic Information).
Note 1: Includes cars, trucks, aircraft, lawn-mowers, leaf-blowers, and other sources that fall into the “transportation” category. Note 2: Includes fuel combustion at power plants and direct use of fuels in the industrial, commer-cial, and residential sectors.
Note 3: Includes cement plants, pulp and paper mills, mining, reining, etc.Note 4: Includes gasoline stations and commercial cooking; for PM2.5, we have included dust.
377 Makhijani, Mills, and Makhijani 2015 discusses such policies.378 See EPA Maryland Emissions Data 2016, formerly for 2011 and now for 2014 data for the listed pollutants.

214
XI. Environmental, health, and resource considerations
The pollution is typically concentrated in Central Maryland.379 Speciically, several of Mary-land’s fossil fuel power stations are located in the vicinity of Baltimore, including the Brandon Shores and Herbert A. Wagner generating stations on the Patapsco River and the Chalk Point generation sta-tion on the Patuxent River. A transition to wind and solar energy would eliminate the pollution from these sources. We note that there is a substantial amount of land associated with fossil fuel power plants; this land could, in principle, be used for solar energy production. For instance, the Brandon Shores and Herbert A. Wagner generating station is located on 483 acres of land. It could easily ac-commodate 100 megawatts of solar PV generation and double that if the most eicient solar panels are used.
ii. Indoor air pollution due to natural gas
The Agency for Toxic Substances and Disease Registry (ATSDR) lists the sources of CO in homes:
Carbon monoxide levels in indoor air are strongly inluenced by the presence of vari-ous appliances and whether or not the occupants of the residence smoke tobacco prod-ucts. Unvented kerosene and gas space heaters; leaking chimneys and furnaces; back-drafting from furnaces, gas water heaters, wood stoves, and ireplaces; gas stoves, generators, and other gasoline-powered equipment; automobile exhaust from attached garages; and tobacco smoke all contribute to indoor air levels of carbon monoxide. 380
We have not found measurement-based data on routine indoor air pollution due to indoor fossil fuel use in Maryland. However, a recent study by the Lawrence Berkeley National Laboratory (LBNL) that measured both indoor and outdoor air pollution in 352 homes that used natural gas in California found that natural gas use for cooking caused indoor carbon monoxide and nitrogen dioxide and NOx pollution:
(1)…use of natural gas cooking burners substantially increases the risk of elevated CO,
and
(2)…gas cooking and the presence of pilot burners on cooking and heating appliances within the living space are associated with elevated NO
X and NO
2 are consistent with
prior studies….Smaller homes are more impacted by pollutant emissions from unvent-ed cooking and pilot burners.381
The LBNL study noted that its California indings were “likely” to apply to homes in other parts of the United States.382 The inding regarding the level of CO was as follows:
Of the 316 homes with CO data in the current study, roughly 5% had short term concen-
trations exceed California ambient air quality standards of 20 ppm over 1 h or 9 ppm
over 8 h. Arithmetic and geometric mean values of highest 1-h CO were 6.4 and 3.8
ppm in the current study.383
379 The web pages in the previous footnote include maps showing county-by-county emission concentrations (in short tons
per square mile).380 ATSDR 2012 p. 9 381 LBNL Indoor Pollution 2015, p. 6382 LBNL Indoor Pollution 2015, p. 6383 LBNL Indoor Pollution 2015, p. 13

215
Prosperous, Renewable Maryland
Adverse health efects have been observed at levels above a 10 to 15 ppm threshold, in the form of cardiac arrhythmia in people with coronary artery disease; healthy adults begin to experience loss of stamina above about 30 ppm.384 This does not mean that there are no ill-health efects below that level, only that they are not acute enough to be observed.
NO2 and NOx were also found at elevated levels.385
Given that low-income homes have less eicient heating systems and may also have older ap-pliances, the problem of indoor air pollution may be greater than average in such homes. There is a real need for actual data in Maryland, including in the context of phasing out fossil fuels.
Natural gas is a common fuel for cooking, water heating, and space heating in Maryland as it is in other states. Its elimination in residential use, and especially from cooking may therefore pro-vide signiicant health beneits especially in cases where stoves and ovens are not tuned or have pilot lights. In 2015, the Maryland Public Service Commission ordered the inclusion of non-energy beneits in estimation of the costs and beneits of energy eiciency. It speciically cited the health beneits of reduced pollution as one of the non-energy beneits.386 There is therefore a reasonable qualitative case, based on the LBNL study, that such beneits should be attributed to replacement of natural gas cooking by eicient electric modes.
3. Residual impacts of the Climate Protection ScenarioThe transition to a fully renewable electricity system deriving its primary energy supply from
wind and solar sources (and a small hydropower component from the existing Conowingo dam) will eliminate essentially all routine pollution associated with the electricity use, in addition to reducing electricity sector CO
2 emissions to zero. There will be a small amount of air pollution associated with
the residual direct use of oil and gas – natural gas for space heat and petroleum in the non-road trans-portation sector, largely for aircraft and boats. We have outlined ways in which the remaining fossil fuel use could be reduced or eliminated in Chapter VII, Section 7. In addition the CO
2 emissions as-
sociated with cement manufacture would remain unless alternative materials are used or renewable fuels are used to make cement; in addition a replacement would be needed for the limestone that is now essential for making cement.
4. Land useLand use is an important aspect of the impact of wind and solar energy at present levels of ef-
iciency and technology. Evolving technology can reduce these impacts signiicantly, and is likely to do so. We will consider land area use and some other environmental impacts of wind and solar energy. We also briely consider how land area impacts could be reduced. Finally, we examine a part of the land use of the present energy system – and ind it is far larger than an energy system based on wind and solar energy.
i. Wind land area
Land area impacts of wind farms can be measured in three ways:387
384 Inferred by IEER by combining data in ATSDR 2012, Figure 2-1 (p. 21) and Table 3-2 (p. 29)385 LNBL Indoor Pollution 2015, Figures 1 and 2 (pp. 22-23). The NO
2 levels even exceeded 100 parts per billion in a few
homes (LBNL Indoor Pollution 2015, Figure 1); 100 ppb is the EPA’s one-hour limit for NO2 air pollution. (EPA NO
2 2016)
386 Maryland PSC EmPOWER 2015, pp. 5-6. See Makhijani, Mills, and Makhijani 2015, Chapter VIII, Section A, for a detailed discussion.387 This wind farm land impact discussion is based on NREL 2009.

216
XI. Environmental, health, and resource considerations
• Permanent direct land area impact: This is the actual land area occupied by the wind turbines, permanent access roads, substation, and other permanent infrastructure needed for the wind farm;
• Temporary land area impact: This consists mainly of temporary access roads needed during the construction period and staging areas; this can be restored after construction is completed;
• Overall wind farm area: The overall wind farm area can be deined in various ways – the pe-rimeter of the wind farm, for instance, could be one such measure. This area is on the order of a hundred times larger than the direct land area occupied by the constructed parts of the wind farm.388 The variability of this measure is considerable.
Table XI-4 shows the direct permanent land area impact of wind turbine facilities within Mary-land and in the Midwest. The temporary land area impact is also shown.
Table XI-4: Direct wind farm land disturbance, permanent and temporary, Climate Protection Sce-
nario 2050, square miles
Wind farms
Direct Land Area Impact
Permanent (Note 1) Temporary (Note 2) Total
Onshore in Maryland 2.3 5.5 7.8
Onshore in Midwest 7.0 16.4 23.4
Total onshore land area 9.4 21.9 31.3
Source for per megawatt impact: NREL 2009, Table 1 (p. 10)
Note 1: Areas calculated on the basis of 1,000 MW in Maryland, at 1.5 acres direct impact per MW,
and 6,000 MW in the Midwest, at 0.75 acres direct impact per acre.
Source for capacity requirement: IEER.
Note 2: The ratio of temporary impact to permanent direct impact is taken as 2.3, based on the aver-
age value in Table 1 of NREL 2009.
The area of direct impact of the onshore wind energy requirements is quite small. However, the overall wind farms perimeter could cover on the order of 1,000 square miles. Of this, about 200 to 300 square miles would be in Maryland. The permanent area of impact of the wind farms in Maryland would be a very small fraction, about 0.02 to 0.03 percent, of the State’s land area of 9,844 square miles.389 But the perimeter area of impact (the “footprint” in NREL’s terminology) would be much larger – 2 to 3 percent of the land area of Maryland. Given that the windy areas are not spread evenly throughout the state, the local visual impact could be signiicant; it is likely to be an important consid-eration in siting, permitting, and environmental impact evaluation.
Figure XI-5 shows a map of areas with good wind resources, by the amount of area available when evaluated by near-term technology availability using 140-meter hub height. Older technology (80-meter hub height) indicated onshore resources in Maryland being concentrated in the Western part of the state (Garrett and Allegany counties – about 1,100 square miles in total). The area with good wind resources is much larger with near-term technology) – over 3,800 square miles,390 or almost 40 percent of the land area of the state. Moreover, while the areas of good wind resources (deined as
388 NREL 2009, Table 1 (p. 10)389 Maryland at a Glance Land 2015390 NREL and AWS Truepower 2015 Table

217
Prosperous, Renewable Maryland
resources with capacity factor more than 35 percent) are uneven, there is some availability in almost every part of Maryland.
Figure XI-5: Areas where good quality wind resources (140-meter hub height) are available in Maryland Source: http://apps2.eere.energy.gov/wind/windexchange/wind_resource_maps.asp?stateab=md (DOE WINDExchange 2015 (Maryland))
We restricted onshore wind within Maryland to 1,000 megawatts largely on the ground of pe-rimeter land area impact. This capacity is much below the technically available onshore resource of more than 18,000 megawatts.391 The visually impacted land area from a single wind turbine is greater the taller the tower; however, the number of turbines can be signiicantly reduced, since newer turbines and higher hub heights have much higher capacity per turbine.
Bird impacts need to be carefully considered in siting as well. They are summarized in a De-partment of Energy study.392 We briely outline some of the considerations here.
391 NREL and AWS Truepower 2015. For a discussion of the role of higher hub height and land area available for wind energy development see DOE Wind 2015.392 DOE Wind 2015, Chapter 6

218
XI. Environmental, health, and resource considerations
The central and eastern parts of Maryland are on the migration routes of many birds – a con-sideration in the impact of large wind farms.393 The impacts could change with higher hub heights and longer blades. According to a Department of Energy assessment:
Potential interactions may increase with other species of migratory birds as well, since most migrating birds ly higher than the rotor-swept zone of existing turbines. Greater rotor heights may increase the potential for interaction between birds and turbines as well as alter the species composition of interactions.394
Further, some protection eforts may require curtailment of wind power at certain times of the year. For example, eforts to protect bats may require curtailment during the late summer and early fall.395 However, the economic impacts may be reduced by the fact that there are surpluses of renew-able energy in the spring and fall in the Climate Protection Scenario, enabling curtailment to protect birds at low cost.
One important new element is introduced by the emerging wind technology with 140-meter hub heights: it creates technical potential for economical wind energy that is far more distributed than with the 80-meter hub height technology now commonly in use in the United States.396 This is because at 140 meters, good wind resources are widely available, in contrast to 80-meter hub height, which has been typical of wind installations in the not-too-distant past. Distributed deployment could have the efect of greatly reducing the transmission line land requirement of wind energy, especially in combi-nation with ofshore wind deployment in coastal states like Maryland.
Ofshore wind installations impact can be quite diferent than onshore turbines. Siting requires non-interferences with shipping, for instance. Visual impact from the shore is an issue at least in some cases. Marine mammals are afected by construction noise and exhibit avoidance behaviors. Noise during operation does not appear to present a signiicant issue.397
However, there may be beneicial efects since the ofshore structures can become artiicial reefs for marine life, including commercially valuable ish. Ofshore wind farms, properly planned, could produce signiicant ecological and commercial beneits:
…beneits may accrue from adding physical structure to the environment in some lo-cations, as it provides a new, albeit artiicial, reef habitat for organisms to settle on (such as ilter feeders). Such structure tends to attract and concentrate ish. Provision of physical structure results in increased benthic and ish biomass, though whether this is a concentration efect of ish or is a true boost to local populations is as yet unsure, in parallel with other artiicial reef structures. Another impact of introducing extensive new hard structures across parts of the seabed is to reduce the level of current destructive ishing activity within the area, particularly restricting the use of towed ishing gear. Although this may have socio-economic im-pacts, particularly if coupled with displacement of ishermen from Marine Protected Areas, this may be ofset through the use of static gear and increases in populations of commercial ish and shellish. In addition, there is also much scope for looking at
393 Migration routes by state, county, season (spring and fall), and type of bird can be found at Nutty Birdwatcher 2016394 DOE Wind 2015, p. 32395 DOE Wind 2015, p. 32396 Hub heights in Germany are already typically over 120 meters for new installations. (DOE Wind 2015, Figure 4-3 (p.
17))397 Friends of the Earth (UK) 2013, pp. 5-8

219
Prosperous, Renewable Maryland
colocating aquaculture, algal biomass production etc. within a wind farm to maximise use of the marine space.
MRE [Marine Renewable Energy] areas could function as de facto Marine Protected Areas….[S]uch potential to protect or enhance biodiversity raises important issues for marine nature conservation managers and, if marine spatial planning is done carefully, the environment can beneit from ofshore renewable energy developments.398
ii. Solar land area
Solar has land-use impacts mainly for utility-scale projects and some urban ground-mounted projects that are not in brownield areas. Roof-top systems have some visual impact and may be restricted by historic preservation or other covenants. The National Renewable Energy Laboratory only included 22 to 27 percent of rooftops in estimating the technical potential for rooftop solar; for commercial buildings the estimate was 65 percent. In turn, the estimate for rooftop solar in this report uses less than ten percent of the technical potential. In view of these assumptions, we will not consider rooftop-related issues further in this report. About 4 percent of solar generation in the Climate Protec-tion Scenario would be from rooftop installations.
The urban and rural ground-mounted solar required in the Climate Protection Scenario in 2050 uses 23 percent panel eiciency. 399 The only statewide assessment of the potential for ground-mounted systems was published by the National Renewable Energy Laboratory in 2012, where both urban and rural utility-scale technical potential for solar PV systems (and other solar and renewable systems) was published on a state-by-state basis.400 We assume that the ixed-tilt installations are urban and the single-axis tracking systems are rural. On this basis about 21 square miles of urban land area (13,500 acres) and 113 square miles of rural land (72,000 acres) would be needed. These areas represent about one-and-a-half percent of the urban and rural land area of Maryland respectively.
We compare land area requirements for corn ethanol for vehicles attributable to Marylanders and examine briely the ineiciency of land and energy use of the current ethanol policy in Attachment B. We note there that the stress that using so much food for fuel puts on global food prices and food supply is not in the spirit of the Paris Agreement of 2015 on climate.
iii. Comparing land area requirements
The land area occupied by solar and onshore wind energy in the Climate Protection Scenario in the years 2050 would be 144 square miles (92,000 acres), including the footprint of the onshore wind installations outside the state. This is a signiicant land impact, but it should be put in the perspective of present-day land requirements.
Consider, for instance, that the 10 percent of ethanol required to be added to gasoline by federal mandate comes essentially from corn turned into motor fuel. The mandate for 2016 is 14.5 billion gal-lons, which will require 30 million acres of corn nationally.401 Maryland’s share of the national corn ethanol area (though not in the state), based on its population, is over half-a-million acres (about 780
398 Friends of the Earth (UK) 2013, p. 8399 Twenty-two percent eicient panels were available commercially at the time of the preparation of this report. (Wesof Panels 2015) 400 NREL Potentials 2012, Table 2 (p. 10) and Table 3 (p. 11)401 Thirty million acres was calculated based on the following sources: 80 FR 77420-77518 (2015-12-14), p. 77488; EIA Corn Ethanol 2015; and Thiesse 2014.

220
XI. Environmental, health, and resource considerations
square miles) or more than ive times the land area footprint of essentially all of the Climate Protection Scenario energy supply in 2050. More detail on this issue can be found in Attachment B.
In addition, fossil fuel electricity requires signiicant land area. The footprint of a coal-ired power plant would be much smaller than a solar power plant of the same generating capacity in terms of the power plant itself. Yet, the area of a coal-ired power plant, while generally smaller, is more comparable to the land requirement of a wind farm for the turbines and associated roads and facili-ties. For instance, a large 1,000 megawatt wind farm would occupy between 750 and 1,500 acres.402 For comparison, the Morgantown generating station is on a 427-acre site.403 The chimneys are usually hundreds of feet high,404 and therefore have a large visual impact.
The main land-area impact of coal-ired power is at the coal mine. Unlike solar or wind energy that require no fuels, the footprint of fossil fuel electricity generation (and other non-renewable en-ergy generation) expands continually since mining of fuels is required to keep the generating plants in operation. Accounting for mining land use is complex. For instance, it could be claimed that surface-mined lands are required to be restored. But often they are not. Ted Nace of Grist.org has estimated that coal-ired power requires 1 acre for every 15,000 megawatt-hours of electricity generated.405 On this basis, the use of coal-ired electricity in Maryland (including in-state production and imports) would be about 2,000 acres per year. At this rate, 45 years of coal-ired generation for half of Mary-land’s generation would use the same amount of land as the entire solar and wind land requirements in 2050 in the Climate Protection Scenario.
Petroleum land requirements are highly variable, ranging from small for the giant oil ields of Saudi Arabia to large areas disturbed by tar sands oil produced in Canada.
In addition to land, water resources are also often damaged by mining operations. Land and water contaminated by accidents are an additional consideration. Coal ash ponds have a variety of contaminants that can and do spill into water bodies. Earthjustice lists four contaminated coal ash sites in Maryland: Faulkner, Westland, Gambrills Fill Site, and Brandywine.406 Maryland also contaminates sites in other states, since it imports electricity generated in coal-ired power plants, among others.
Maryland’s natural gas use also has an external footprint, since none is produced within the State. The efects of natural gas produced by hydraulic fracturing (“fracking”) extend underground, where mixes of toxic materials are injected during the fracking process, which also creates a risk of water supply contamination.407
Finally, there are vast amounts of radioactive and toxic uranium mining and milling waste in the United States and the world attributable to U.S. requirements for nuclear materials for its nuclear weapons and nuclear power programs.408 Oil and gas production also creates radioactive waste in the form of radium-contaminated materials.409
In summary, the land impacts of the present energy system are essentially out of sight of the vast majority of energy users. They are concentrated at a few places in Maryland and at many more
402 Estimated from NREL 2009, Table 1 (p. 10)403 Maryland PPRP 2010, p. 1-3404 The Brandon Shores Generating Station has stacks of 700-feet and 400-feet. (Wikipedia Brandon Shores 2016)405 Nace 2010406 Earthjustice 2009 407 For a summary of the efects described in peer-reviewed literature, see PSE Healthy Energy Survey 2016. See also NRDC 2016. 408 For a global, if somewhat dated, account of uranium mining and milling impacts, see Chapter 5 of Makhijani, Hu, and
Yih 2000. 409 See EPA TENORM 2015

221
Prosperous, Renewable Maryland
places across the country and the world (the latter notably in the case of oil and nuclear fuels). The amount of land involved cumulatively over the decades is comparable or larger than that for the Cli-mate Protection Scenario. When the land required for making ethanol from corn for vehicular fuel is included, the land required for the present energy system is far greater than that for the Climate Protec-tion Scenario.
This raises an important philosophical question. Should we be required to look at the devices that supply us with energy even if we deem the view unpleasant or even ugly rather than consign much worse land (and other adverse) impacts to places we cannot see and may not ever visit and to people we may never meet?
iv. Reducing land area requirements
All that said, it is important to consider ways in which the footprint of a solar and wind energy can be reduced.
The wind land footprint depends on a variety of factors including turbine technology and hub height used. The land-area impacts estimates in this report (Table XI-1 above) are based on wind tur-bine projects that were planned or completed as of 2009 – the year that the National Renewable Energy Laboratory prepared its report. Wind turbine technology has advanced considerably since that time and continues to progress. Near-term turbine technology with 140-meter hub heights would result in capacity factors much higher than those we have used in the estimates above. The direct area impacted can be considerably reduced. However, much taller and larger turbines could have a far wider visual impact. But that impact could be more equitably distributed closer to the areas of consumption of the electricity by locating large wind turbines in a more distributed way than is now typical.
Solar energy land impacts can be reduced in a number of ways:
• Locating more of the capacity on rooftops. A 2016 re-assessment of rooftop potential by NREL on a building-by-building basis covering 23 percent of the buildings in the United States con-cluded that Maryland could meet almost 50 percent of its present electricity requirements from rooftop generation alone, at a solar panel eiciency of 20 percent. Parking lots and use of non-optimal rooftops would increase this potential.410 This would amount to roughly half of the solar energy requirement of the Climate Protection Scenario (instead of 4 percent assumed in the land area calculation in this section). Using the most eicient panels available, the vast majority of solar energy requirements could technically be met by rooftop installations. Cur-rently rooftop installations cost more than ground-mounted ones. But their cost could come down with the right incentives and developments over time. The SunShot initiative aims at a cost of $1.50 per watt for residential rooftop solar by 2020. The commercial rooftop target is $1.25 per watt.411 At these prices, notably the latter, there should be little economic diiculty in increasing the fraction of rooftop solar energy. The collateral beneit of increasing the distrib-uted ownership potential is also a positive factor.
• Using solar canopies over parking lots and urban road areas: We have not included any parking lot or other canopies in the Climate Protection Scenario. Canopy structures entail ad-ditional costs. At the same time they increase solar PV’s distributed energy potential. There is a clear cost/land use trade-of, especially between rural utility-scale solar PV and increasing urban canopy structures.
410 NREL Rooftop 2016, p. 35, provides an estimate of 38.7 percent at 16 percent panel eiciency (see p. vii for panel eiciency). A 20 percent panel eiciency results in a 25 percent increase in the solar generation potential. See also p. 39.411 DOE 2012 SunShot, p. xix

222
XI. Environmental, health, and resource considerations
• Low-cost batteries and low-cost seasonal thermal storage: If grid-energy batteries follow a cost trajectory similar to solar energy installations, the approximate balance between solar and wind energy assumed in the Climate Protection Scenario, would no longer be essential. The on-shore wind energy footprint could be reduced. Low-cost seasonal thermal storage could serve as a complement to battery storage and also increase the resiliency provided by microgrids.
• New solar technology: Solar panels are the main approach to generating solar electricity at present. However, other approaches are possible, including windows that are transparent to visible light but also contain solar cells412 or solar paint that can be applied to surfaces like the sides of buildings.413 It is mainly a question of the relative costs of the various approaches.
• Lower cost solar canopies: In general, solar canopies, such as solar parking lot structures cost signiicantly more than rooftop or ground-mounted solar, largely because of the canopy con-struction costs. Lower cost solar canopies that meet structural requirements, higher eiciency, and lighter panels, etc., could signiicantly expand the potential for distributed solar genera-tion. Crediting solar canopy structures in appropriate ways for their environmental attributes, such as longer life for the parking lot and the potential for rainwater collection for gray water use, may also add to this potential.
In sum, the land impacts of a solar- and wind-based energy will be signiicant, assuming tech-nology does not fundamentally change from that presently available. Even then the land impacts are far lower in amount and have far smaller environmental, health, and even visual impact than the pres-ent fossil-fuel dominated system. It is a question of who is experiencing those larger impacts – for the most part the impacts of the present system are out of sight of the consumers of energy, especially in a state like Maryland that produces almost none of the fuels that it uses.
Modest improvements in technology and reductions in cost, notably for rooftop solar systems, will allow a signiicant reduction of the land impact of solar systems and, at the same time, increase the potential for wider individual and community ownership of energy production. Low-cost storage coupled with solar will allow the choice of having a much larger fraction of total energy requirements coming from distributed solar energy than modeled in this report in the Climate Protection Scenario.
5. Upstream and downstream impacts
All energy sources have impacts upstream and downstream of the point of electricity genera-tion of direct use of fuels. 414 The upstream impacts associated with renewable energy are mainly as-sociated with the manufacturing of components (such as solar panels, wind turbines, and batteries) and the construction of the renewable energy generating facilities. The downstream impacts arise from the manner in which the facilities are decommissioned and the disposition of the materials resulting from the decommissioning.
A full consideration of life-cycle impacts is beyond the scope of this report. The attributes of a sustainable energy system go well beyond a system that uses only renewable energy, in which carbon and air pollution impacts are zero, as we have discussed in Chapter VI, Section 2.1. Metals like copper and steel will still be needed as will cement and sand and gravel for concrete.
412 See, for instance, Hanley 2015. 413 See, for instance, Peters 2015. 414 The only zero impact approach is to conserve energy: switching of lights when they are not needed is a common ex-
ample, but there are many others. For example, fastening seat belts before starting a car or light truck could save over 100
million gallons of fuel a year across the United States, assuming an idling fuel requirement of 0.2 gallons per hour (DOE
EERE 2015), 10 seconds delay to buckle up and 1,000 starts per vehicle per year.

223
Prosperous, Renewable Maryland
We examine briely a few of the impacts of the Climate Protection Scenario. But irst, we stress that this is not a comparative analysis with the business-as-usual scenario. The continued use of fos-sil fuels will have far larger impacts in mining, water use, land use, and pollution, besides a variety of adverse impacts for workers and neighbors. There are also vast upstream and downstream impacts associated with continued fossil fuel use, apart from the immense impacts of climate disruption. We discuss the Climate Protection Scenario impacts here apart from any comparative aspects because their recognition can point the way to greatly reducing or eliminating them.
First there are carbon impacts associated with manufacture and installation of all energy sys-tems, including renewable energy systems. These impacts, except those associated with limestone use in cement, can be eliminated if the energy system, including all energy for manufacturing, is fully renewable.
There are many mining-related impacts. Copper, steel, and aluminum are essential metals for electricity systems. Quartz is mined for solar panels; graphite is mined for lithium-ion batteries. Chemicals are used to reduce quartz to silicon for solar cells. These impacts can be minimized or even eliminated. Metals can be recycled; intermediate chemicals, like silicon tetrachloride in silicon manu-facturing, can be recovered and reused if there are appropriate industry norms, as well as regulations, enforcement mechanisms, and incentives to achieve that result.
Generally, the best way to conceptualize a system with minimal environmental impact is to connect the decommissioning with the fabrication. The only resource that is actually used up is energy; in the Climate Protection Scenario almost all of it is replenished by natural currents since solar and wind are the mainstays of primary energy supply. In principle, that can made fully renewable, includ-ing energy for aircraft and boats.
The issue of materials is fundamentally diferent from energy. Energy is used up; materials are not, though age can degrade their performance. In some cases, erosion and corrosion disperses them. If not widely dispersed, materials can be recovered and reused. Further, in many cases, such as recov-ery of metals, the input of energy required for recycling is lower than for mining and reining. More eicient use of materials is also possible through design and innovation, in the same way as a given amount of energy can be used to deliver diferent amounts of energy services such as lighting, heat-ing, cooling, or computing. Design of devices can incorporate ease of recovery and reuse of materials. Complementary policies to encourage reduction of mining impacts would be needed. Toxic materials can be eliminated through low-impact processing technologies. New processes can be invented for materials production. And new materials that have lower impact can be used.
Recovery and recycling of the materials used in a renewable energy system is a critical ele-ment for a renewable energy system to become sustainable. We note here that a non-renewable energy system cannot become sustainable because new fuel is needed to replace the fuels consumed but not replaced by natural lows of energy.415
The materials that it will be most important to recover and reuse are those used to make solar panels and the structures that are used to mount them, wind turbines and the electrical generators and other machinery associated with them, batteries, including the core materials, such as lead zinc, lithium, sodium, sulfur, etc., used to make them. In addition, the grid-of-the-future will involve an
415 See Chapter VI, Section 2.1. Note that nuclear fuels, though plentiful in theory are not renewable. New nuclear fuels must either be mined or non-fuel materials, notably uranium-238 and thorium-232, must be converted into nuclear fuels. In both cases, the materials are non-renewably consumed. For detailed considerations of safety, proliferation, fuel-related issues, and a variety of environmental impacts, see Smith 2006. For details regarding conversion of uranium-238 to pluto-nium fuel, see Makhijani 2001 and Makhijani Reprocessing 2010.

224
XI. Environmental, health, and resource considerations
extensive communications system, including the devices, such as computers and smart phones, used to access information and use it.
The handling of materials from decommissioning energy- and electronics-related materials is far from satisfactory today. For example, the export of the work of recovery of lead from lead-acid batteries to Mexico is causing immense harm to workers, their families, and the communities in which they live because of poor enforcement of safety and environmental laws.416 Much the same can be said of the industry that recovers precious metals from discarded electronic goods (when they are recov-ered at all) or the industry that mines them in the irst place. Illegal processing in developing countries, often using child labor, in dangerous conditions, is routine. The International Labour Oice has noted that “human health risks from e-waste [electronic waste processing] include breathing diiculties, respiratory irritation, coughing, choking, pneumonitis, tremors, neuropsychiatric problems, convul-sions, coma and even death.”417
Making workers and their families sick and polluting their communities is inherently unjust and unsustainable. If that occurred it would be part of the same ethic that has resulted in the very prob-lem that renewable energy is designed to solve: the unjust (from the point of view of social equity for this and future generations) and unsustainable use (in ecological terms) of fossil fuels.
A transition to an electriied, renewable energy system in Maryland, the United States, and globally will result in changes in the nature and amounts of materials that low through the energy system. Most of this will be for the better, since the mining, processing, and use of fuels to operate the energy system will be eliminated. But the remaining use of materials must be as near to a closed cycle as possible, with decent and safe working conditions. Recovery and processing of materials resulting from decommissioning of facilities might be done in the countries that obtained the beneit from the facilities. The expense of materials recovery and reuse can be built into the cost of the installation at the front end.418
The solar energy industry is aware of the need to recover materials and reuse them. So far as solar panels are concerned, there has been little need so far because almost all the installations are of recent vintage; they are far from the stage where decommissioning is an issue. At present, programs for recycling tend to be voluntary. Given the rapid growth of the solar industry and its centrality to the grid-of-the-future, it is essential to move beyond voluntary programs and integrate recovery cost at the front end. The same applies to wind energy, electronic devices associated with the grid-of-the-future, batteries, and the materials that go into the transmission and distribution system. In addition, materials in the devices that use energy (light bulbs, refrigerators, HVAC systems, televisions, etc.) also need a similar system of recovery and reuse. The philosophical concept that captures the sustain-ability implicit in this is approach is called the “cradle-to-cradle” system, which seeks to mimic Nature in leaving no waste behind.419
416 Partlow and Warrick 2016417 ILO 2012, p. 18 418 We note here that while most solar panels are made of silicon, which is derived from sand (silicon dioxide), some solar
cells use toxic material like cadmium. This underlines the need for taking the entire lifecycle of renewable energy-related
materials into account at the start of the process. The lithium in lithium-ion batteries, as well as the materials in other types
of batteries, can be recovered. At present, recycling is a market issue without explicit consideration of the pollution and
ill-health and ecological damage that mining and processing causes in the absence of recycling. For current conditions in
relation lithium recycling see Kumar 2011. For more general descriptions of recycling batteries of various types, see Bat-
tery University 2016.419 A business point of view on the cradle-to-cradle system by its promoter can be found at Cradle to Cradle 2014. A more
general description is available in Wikipedia Cradle to Cradle 2016.

225
Prosperous, Renewable Maryland
Finally, we should not forget a stubborn problem that appears in the form of cement used for construction. Cement has CO
2 emissions associated with it due to limestone reduction, even in the
absence of fossil fuel use. It is the most common CO2-intensive material used in construction: about
6 percent of the world’s anthropogenic GHG emissions arise from this industry.420 Its importance for Maryland’s emissions has already been noted (Chapter VII, Section 5). Both conventional and renew-able energy use copious amount of cement, including for wind farms and coal and nuclear power plants. Solar PV installations are a major exception.
Downstream impacts are a major issue in sustainability. The energy system must not only have zero CO
2 emissions on a life-cycle basis; it should also be sustainable regarding other downstream
impacts. A true zero waste system mimicking the way that Nature reuses everything is essential for sustainability. That philosophy is captured by the “cradle to cradle” goal,421 where no waste would be generated on a lifecycle basis; everything is reused. Reuse often requires a supply of energy; that energy must, of course, be renewable.
420 Worldwatch 2009 421 The concept is described at Product-Life Institute 2016.

226
XII. Policy considerations
XII. Policy considerations
The main policy areas are:
1. Promoting renewable energy in the electricity sector, with a suitable deinition of renewable energy;
2. Ensuring the eicient electriication of all or almost all of the direct fossil fuel use in residential and commercial sector buildings;
3. Discouraging new fossil fuel infrastructure to minimize stranded costs or pressure to continue fossil fuel use beyond the earliest economically feasible phase-out date;
4. Making buildings much more eicient than they are today and adopting stringent standards for new buildings;
5. Promoting transportation sector electriication as completely possible for both the on-road and non-road sectors.
6. Ensuring that the grid-of-the-future is open, democratized, and equitable;
7. Enacting policies to make energy afordable for low-income households and to open up opportunities for low-income families and small businesses in the grid-of-the-future;
8. Raising suicient funds to ensure a just transition for workers and communities who are likely to be adversely afected by a transition away from fossil fuels;
9. Putting pilot and demonstration projects in place to enable the complete phase-out of fossil fuels in areas that are diicult and/or to enable fuller use of surpluses of renew-able energy that are likely in the spring and autumn seasons.
Before getting into the details of each of these areas, an overview of the transition will provide some context. The energy transformation to a distributed, renewable, afordable grid coupled with the electriication of heating and transportation involves a number of major changes. At irst glance the scale of the inancial investment appears large; but as we have shown in Chapter IX, Section 3, that is not the case when the scale of all investments (whether in Maryland or out of it) needed for a business-as-usual approach is taken into account. Rather the major change is that investments shift from oil and gas ields outside Maryland to eicien-cy, storage, and smart grid investments, mainly within Maryland. The generation investments may be largely within Maryland or outside of it, as is the case today, except to the extent that distributed generation and its coupling with increasing resilience is built in as a value.
The mobilization of capital for inancing these investments is a key consideration. Much or most of the capital can be elicited from the private sector if there are appropriate standards and regulations. For instance, the added investment needed for passive buildings that also have net zero carbon emissions, will come from the private sector for private buildings, if state and local governments set building standards. As we have shown such standards are economically

227
Prosperous, Renewable Maryland
justiied and environmentally necessary. For individual households, inancing arrangements can be provided by using a small amount of public capital to leverage large amounts of private capital, as can be done with a Green Bank.422
The Climate Protection Scenario has signiicant resources that are devoted to increasing the resiliency of the electricity grid. They include distributed solar electricity generation, battery storage, combined heat and power, local hydrogen storage (at distributed production sites), smart grid invest-ments, and extensive demand response capability. That said, this report does not contain the actual design of a resilient system. Such a design requires detailed consideration of essential loads and their geographic locations on a neighborhood-by-neighborhood basis as well as by the function of the fa-cilities. In addition, more than one category of essential load may need to be considered. For instance, there are “critical” loads, which must be powered, and “priority” loads, which would receive power at high priority once critical loads have been met.423 Finally, the design of microgrids requires the input of a variety of stakeholders.
The considerations in this report are more aggregated; they are suicient for the purposes to show that signiicant provision for resilience can be made within the context of an emissions-free electricity system, and the grid therefore made more reliable and functional even in the context of changing climate. Building in resilience, afordability, equity, and energy democracy will be a process with many actors and many tensions. It will by no means be simple. But the end result of the process, if well done, promises to provide an afordable energy system that is dramatically healthier, and with other beneits like reducing energy-related water consumption, upstream mining impacts, reducing land use, and reducing waste impacts.
Finally, it is important to see the transition as a whole, not as a collection of elements. For instance, there are elements in it that will make energy services much cheaper in the fu-ture. The greater emphasis on building and appliance eiciency as well as the electriication of transport will greatly reduce costs. But increasing resilience at the same time as reducing emis-sions will require distributed solar resources as well as battery, and possibly other forms of, storage. The combination of resources in a microgrid will be more expensive than the average supply, if seen in isolation as something that afects electricity rates and costs. But microgrids, appropriately located and designed, provide an added value of increasing resilience and pre-venting economic and other losses by allowing essential energy services to be maintained dur-ing outages.
Similarly, onshore wind energy is cheaper than current average generation, cheaper than solar (at present), and cheaper than ofshore wind. Indeed, in contrast to Western Europe, ofshore wind is in the very early stages of development in the United States. Costs of ofshore wind, seen in isolation from all other generation, will be higher than utility-scale solar or on-shore wind for some years, as the industry develops. Barring signiicant technological break-throughs, which are very possible but not assumed here, the costs of ofshore wind are likely to remain higher than onshore wind. Yet, we have used ofshore wind in the Climate Protection Scenario for a number of reasons:
• Ofshore wind is a plentiful Maryland resources; its development can create a large number of jobs and matches well with the fact that Maryland has a major port, Balti-
422 A Green Bank study for Maryland was prepared by the Coalition for Green Capital; it was commissioned by the Mary-land Clean Energy Center. (MCEC 2015)423 Jensen et al. 2015, p. 19

228
XII. Policy considerations
more, where economic distress is high (as expressed for instance in the need for energy bill assistance424).
• Maryland would likely need wind resources from other states in the absence of of-shore wind energy development. This would require transmission line development. The Climate Protection Scenario does include import of onshore wind from the Mid-west. Given that region’s plentiful wind resource, that amount could be increased and costs decreased. But the uncertainty regarding timely transmission would increase.
• Ofshore wind development can create a host of commercial and ecological beneits, including marine life habitat and commercial ishing that are not available with onshore wind.
• It provides a diversity of supply that reduces the need for energy storage.
• The diversity of supply also increases the options for completing the transition to a fully renewable electricity sector. This is important, given that there are frequent objec-tions to onshore wind, often on grounds of visual impact.
The use of renewable hydrogen as a fuel for CHP and peaking generation is also a high-er cost element (relative to solar and onshore wind). Hydrogen production would, like ofshore wind, develop a new industry. Hydrogen provides lexibility in the overall energy system, for instance, as a fuel for long distance land transportation or even ships.
We have taken these elements as a set: examined that they can meet the demand on an hour-by-hour basis, estimated the costs, and evaluated whether they are compatible with in-creasing resiliency. This is not the only set of choices that is possible. But if elements in it are changed, other elements also need to be examined afresh since they are connected, notably in terms of assuring reliable supply as a system. This has some implications for policy:
• It is essential to change the economic perspective from rates to bills. This is another way of saying that energy must be seen from the perspective of energy services – light-ing, heating, air-conditioning, refrigeration, etc. A unit of energy at the point of use in the Climate Protection Scenario in 2050 will provide about ive times the energy ser-vices compared to 2011 and almost two-and-a-half times compared to the 2050 BAU scenario.425 Thus efective rates per unit of energy supplied to the end user (whether from the grid or the rooftop) at the point of end use can be higher in the Climate Pro-tection Scenario; still the bills will be lower. This is because efective rates include the cost of eiciency, transportation infrastructure, and conversion to eicient HVAC systems from fossil fuels. These same investments reduce energy use greatly, making bills lower.
• Average bills do not express the wide variety of circumstances of individual house-holds. Speciically, low-income households may feel the efects of the overall rate in-crease per unit of supply because they may not be able to lower their energy use with eiciency responses and therefore to lower overall bills. This is a central reason to adopt an Afordable Energy Program in the course of energy system restructuring. Such a program is needed in any case, as we have shown.426
424 Makhijani, Mills, and Makhijani 2015, Chapter II, Section B425 Energy services are computed here as dollars of gross state product per unit of energy at the point of use.426 Makhijani, Mills, and Makhijani 2015

229
Prosperous, Renewable Maryland
It is relatively straightforward to compare energy costs in 2011 with the costs in the BAU scenario in 2050 because the structure of the energy system is assumed to be the same. Household energy use would be a mix of electricity and direct fossil fuel use. Electricity gen-eration would still be mainly centralized generation. Transportation expenditures would be essentially all on petroleum fuels. In contrast, the Climate Protection Scenario is a structurally diferent energy system. Since it is powered essentially completely by solar and wind, there are no fuel costs other than a small residual amount for direct fossil fuel use in buildings and industry and a modest amount of petroleum for non-road transport. There are large invest-ments in eiciency, in conversion of direct fossil fuel use to eicient electric heating systems, in electric vehicle charging infrastructure, electricity storage, and a smart grid. Since vehicles would be electric, charging would take place at home and at public charging stations. Thus the residential, commercial, and transportation expenses are not separable unless a rate structure is established along with patterns of charging.
We can compare overall costs on a per person basis by segregating transportation elec-tricity requirements from the combined use in the residential, commercial, and industrial sec-tor. A further assumption that the cost per unit of electricity in these two major categories will be about the same. The cost of capital investments other than for transportation are added to the combined cost of electricity in the residential, commercial and industrial sectors. Table XII-1 (following page) shows the results of the analysis. Speciically, it illustrates the substantial efect of eiciency in lowering energy bills and lowering the costs of energy services. This is because the energy services increase faster than the cost of supply.
The situation with assessing the whole energy system and its efects is analogous to the way energy eiciency savings are guaranteed by Energy Service Companies (ESCOs). ESCOs perform investment grade audits and bundle together low cost, medium cost, and higher cost energy eiciency (and often water conservation) measures into a package where the total cost of energy supply plus eiciency is less than the pre-eiciency-investment energy bills. The grid-of-the-future assessment has more elements, but the principle is the same. What matters is whether the package is more economical. Moreover, in the case of the grid-of-the-future, the package must achieve multiple goals, including deep emission reductions (up to 100 percent), resilience, protection of fossil fuel industry workers and low-income households, etc.

230
XII. Policy considerations
Table XII-1: Average energy cost per person for 2011, Business-as-Usual Scenario 2050, and Cli-
mate Protection Scenario 2050, in 2011 dollars (rounded as shown)
2011 2050 BAU 2050 CPS
Total electricity sales, MWh 63,600,000 83,270,000 76,960,000
of which RCI, MWh (Note 1) 63,600,000 83,270,000 50,600,000
of which transportation, MWh (Note 2) small small 26,360,000
Total electricity services cost $8,270,000,000 $14,965,000,000 $22,950,000,000
of which RCI electricity (Note 3) $8,270,000,000 $14,965,000,000 $15,089,000,000
RCI direct fuel use, cost, $/year $3,241,000,000 $5,381,000,000 $1,399,000,000
Total non-transport energy costs $/year $11,511,000,000 $20,346,000,000 $16,488,000,000
Maryland population 5,843,800 7,307,790 7,307,790
Non-transport energy expenditures,
$/person per year (Note 4) $1,970 $2,780 $2,260
Transportation energy + EV infrastruc-
ture cost (Note 5) $11,755,000,000 $12,831,000,000 $11,176,000,000
Transportation cost per person $/year $2,010 $1,760 $1,530
Total energy cost per person (Note 6) $3,980 $4,540 $3,790
Average household income $81,100 $134,200 $134,200
Number of people per household 2.65 2.53 2.53
Energy expenditures per household,
direct and indirect (Note 7) $10,530 $11,470 $9,580
Percent of average income spent on
energy services 13.0% 8.5% 7.1%
Source: IEER
Note 1: RCI means the residential, commercial, and industrial sectors combined.Note 2: Climate Protection Scenario transportation includes all road and non-road electricity use.Note 3: Electricity costs for each segment of use are assumed proportional to use. In other words, no account is taken of diferent use patterns and rates.Note 4: The expenditure per person includes the direct expenditures for residential energy use and expenditures to pay for the cost of energy that is embedded in the costs of goods and services. Note 5: CPS cost includes an allowance for maintaining road infrastructure. In the other two cases, this cost is included in the cost of petroleum fuels.Note 6: The total energy cost includes the direct personal expenditures on energy as well as all the indirect expenditures that are embedded in the costs of goods and services.Note 7: It is important to keep in mind that this includes all direct and indirect expenditures on ener-gy. As a irst approximation, household energy bills for electricity and fossil fuels would be roughly one-fourth of the totals shown in this row if the pattern for 2011 holds for 2050. On this basis, the household energy burden in 2050 in the BAU scenario would be about 2.2 percent and in the CPS scenario 1.8 percent, compared to 3.3 percent for the year 2011.427
427 Based on Table III-1, III-2 and III-3 in Makhijani, Mills, and Makhijani 2015, p. 40 and p. 42.

231
Prosperous, Renewable Maryland
We now examine policies in the speciic areas that contribute to the system that we have evaluated in this report.
1. Renewable energyAs we have discussed in Chapter VI, Section 2, and Chapter IX, Section 1, wind and solar en-
ergy are plentiful and economical. The cost analysis in Chapter IX also shows that it is very likely that the Climate Protection Scenario, driven mainly by solar and wind energy, will be considerably more economical than the business-as-usual scenario. The main policy conclusion is as follows:
A transition to a fully renewable electricity sector does not require rebates and subsi-dies to promote solar and onshore wind energy beyond those already in place (and due to expire in the early 2020s), with the possible exception of policies to make renewable energy access equitable. A suitable progression of renewable portfolio standards is required and should be mandated.
Our analysis indicates the following recommendations for renewable electricity targets:
• 55 percent for the year 2030, which is robustly compatible with a goal of 40 percent reduction in GHG emissions by 2030.
• 100 percent for the year 2050, which is compatible with 90 percent reduction in GHG emis-sions by 2050.
These levels should be incorporated as renewable portfolio standards into Maryland’s green-house gas law and planning for reducing GHG reductions. It is important to plan for a balance between solar and wind energy in order to prevent seasonal imbalances in supply. In contrast to solar, wind is more plentiful in the winter. Balance between the two keeps storage requirements low and permits a larger role for demand response on a daily basis.
For the year 2025, a 40 percent RPS with fewer or no carbon-emitting sources is a reasonable intermediate target, given our 55 percent RPS by 2030 recommendation. Subsidies for preservation of industrial jobs should be done on a case-by-case basis rather than as sweeping inclusions of carbon-emitting sources under the rubric of renewable energy. We note that the Climate Protection Scenario is based almost entirely on solar and wind energy; geothermal heat pumps are included as part of space heating and cooling.
The concept of renewable energy was discussed at length in Chapter VI, Section 2.i. We repro-duce the deinition provided by the Intergovernmental Panel on Climate Change here for convenience:
Renewable energy (RE): Any form of energy from solar, geophysical, or biological sources that is replenished by natural processes at a rate that equals or exceeds its rate of use.428
This deinition excludes nuclear energy and much biomass energy as well. The issue of biogas is of considerable practical importance in Maryland and many other places. Biogas may meet the dei-nition of renewable energy under a variety of circumstances. However, its collateral environmental impacts related to the impact of spreading high nutrient-content residues on the soil, need to be care-fully examined before widespread use, especially in the Chesapeake Bay region. (See Chapter VI, Section 2.1 for a detailed discussion.)
428 IPCC5 Mitigation 2014, p. 1261

232
XII. Policy considerations
2. Eicient electriication of direct fossil fuel useIt will be necessary to convert almost all direct fossil fuel use in buildings to eicient electric
systems or to combined heat and power systems powered by renewable fuels. We have examined this issue at length in our report on heating and cooling in the residential sector.429
The conversions should begin with converting buildings using oil and propane to geo-thermal or cold climate heat pumps, along with associated water heating conversions. Incentives for conversion should be based on combined heating and cooling perfor-mance, rather than by HVAC technology.
Currently, cold climate heat pumps have far lower rebates than they would under a perfor-mance-based system. Further, no account is taken of the fact that an electriied heating system, pow-ered by wind and solar energy eliminates natural gas price volatility risk. Among other things, the signiicant additional distress experienced by low-income households during times of high natural gas prices would be avoided; that needs to be relected in policy. Finally, the most eicient cold climate heat pumps and geothermal heat pumps will reduce summer peak loads considerably, providing sig-niicant system beneits. The incentives need to relect these beneits to the electric grid.
3. Fossil fuel infrastructure
There are several issues associated with fossil fuel infrastructure in the context of phasing out fossil fuels:
• Addressing and preventing dislocation of workers and communities in advance of closure of existing fossil fuel infrastructure (see Section 8 below in this chapter);
• Avoiding new investments in fossil fuel infrastructure (production, transportation, utilization), since such investments will (i) lock in fossil fuel use for decades with all the costs associated with increasing CO
2 emissions and climate disruption, or (ii) be abandoned prematurely with
signiicant costs for ratepayers (via allocation of stranded costs) and/or shareholders due to failure to recover fully the expected beneits of the investment.
• Examining whether parts of existing infrastructure could be used, with or without modiica-tions, in a low-emissions, renewable energy future.
In the case of Maryland, two issues relating to new investments are critical:
1. Hydraulic fracturing: A part of the large Marcellus Shale formation lies in Western Mary-land.430 Hydraulic fracturing techniques (”fracking” for short) used in this formation could yield natural gas, as they have in Pennsylvania. Should Maryland authorize fracking, signii-cant investments would be needed in exploration and production and in pipelines to transport the natural gas. Investments in the oil and gas industry typically take decades to fully pay of. Thus, new production would mean locking in CO
2 emissions, and any associated methane
leaks, for decades. The analysis in this report shows that even without such new infrastructure, it will take considerable efort get to the goal of 90 percent GHG emission reductions by 2050 (relative to 2006). Moreover, this assessment is based on a 100-year global warming potential for methane; a 20-year warming potential, which should be considered, would point to even greater diiculties, were fracking to be started in Maryland.431 The introduction of fracking
429 Makhijani and Mills 2015430 USGS 2011 431 California has begun adopting a 20-year warming potential for methane, the main constituent of natural gas, in its energy
and climate policies. (Bloomberg BNA 2016)

233
Prosperous, Renewable Maryland
would make the transition to a low- or zero-emissions energy system more diicult and expen-sive, it would put jobs at risk when the fracking-related infrastructure is phased out, and make more communities economically vulnerable.
2. Reduction of residential fuel oil and propane use: Fuel oil and propane are expensive fu-els compared to natural gas. On a life cycle basis, they are also expensive compared to ei-cient heat pump systems. Greenhouse gas reduction policies that are in accord with economics should encourage a conversion from fuel oil and propane to eicient electric systems rather than natural gas.432 Conversions to natural gas, whether within the existing gas infrastructure or new infrastructure, only makes the transition to a low emissions system more expensive; it also needlessly delays achieving reductions in GHG emissions. 433
Besides new infrastructure, there is the issue of existing infrastructure, which in Maryland consists mainly of pipelines, including a natural gas distribution network, and one natural gas storage facility in Accident, Maryland. It is possible that some of this infrastructure could be put to other uses. For instance, we have discussed in Chapter VII, Section 3.ii, the possibility of converting natural gas storage caverns to compressed air energy storage (CAES). Besides repurposing of the cavern, more facilities, including electricity generation driven by turbines, would have to be built. This would also create more jobs than there are at present in natural gas storage in Western Maryland.
It is also possible that some of the existing natural gas pipeline infrastructure could be used for hydrogen transport. Hydrogen plays an important role in the Climate Protection Scenario as an indus-trial fuel and as a fuel for combined heat and power and peaking power plants.434 However, there is no one general approach for converting natural gas pipelines for hydrogen use; for one thing, existing infrastructure has been built up over decades; many diferent materials have been used, which may re-quire greater or lesser investment before they could be used for hydrogen.435 Nonetheless, this is worth investigating, along with the question of where the hydrogen production would be located.
Residential natural gas infrastructure would be mainly replaced by a strengthened and upgrad-ed electricity distribution system. In addition, eicient space heating electric systems require more investment compared to the natural gas systems.436
There is an infrastructure for distribution of petroleum products, notably for transportation and, in some parts of Maryland, for fuel oil. This is a dispersed infrastructure in the form of gas stations and fuel oil storage and distribution facilities and associated transportation. There will be thousands of jobs in the eicient renewable energy economy that will be similarly dispersed all over Maryland. These jobs will be far greater in number since the investments to displace fuel oil and transportation fuels will be far greater than those being made today (which are mainly out of state). However, it will still be important to inventory these jobs and businesses and put in tools such as job training for workers and inancing for businesses to help them make the transition.
432 See Makhijani and Mills 2015 for a detailed analysis of technologies, economics, and policies.433 For risks associated with large-scale natural gas investments, see UCS 2015.434 We examined the option of synthetic methane made with solar and wind energy as the primary energy resources. Hy-drogen must be made irst. Making methane adds another layer of energy losses and costs. Moreover, leaks of methane will result in greenhouse gas emissions. For these reasons we did not include synthetic methane as an energy source in the Climate Protection Scenario. 435 See the sections on “Hydrogen Production and Delivery” and “Natural Gas Production and Delivery” in the DOE’s Quadrennial Technology Review (DOE QTR 2015, Chapters 7D and 7E) 436 Makhijani and Mills 2015

234
XII. Policy considerations
4. Eicient buildingsOur recommendations for existing structures and new construction are diferent because it is
considerably more diicult and expensive to make existing buildings highly eicient than to build them right in the irst place.
It is economical to make new residential construction passive and carbon neutral. Maryland and its local jurisdictions should require all new residential construction to be carbon neutral, starting in 2020. That should be required of new commercial construction and major renovations Maryland by 2030 with the following intermediate requirements:
• 80 percent carbon reduction by 2020
• 90 percent carbon reduction by 2025
• 100 percent carbon reduction by 2030
We have made extensive provision for investment in improvement of existing building enve-lopes as well as the eiciency of the appliances within them.
Existing buildings as well as appliances should continue to be dealt with via Mary-land’s EmPOWER program, which has been very efective. The annual goal for elec-tricity use reductions, apart from conversions of fossil fuel heating to electricity and electric road transportation, should be 2 percent per year.
5. Electriication of transportation At about 35.5 million metric tons of CO
2-equivalent, transportation represented the second
largest source of Maryland’s GHG emissions in 2011, behind the electricity sector. Maryland cannot achieve its 2050 goal of 90 percent reduction in GHG emissions relative to 2006 without substantial electriication of the transportation sector, combined with making its electricity sector emissions-free.
Electric transportation is making very rapid strides in a number of arenas from buses to lawn-mowers to electric cars. Maryland has a number of incentives for promoting electric vehicles and charging infrastructure.437
The most important addition to existing electric vehicle programs is for Maryland to create a market for a variety of electric vehicles in State purchasing policies and to move away from purchasing fossil fuel vehicles whenever compatible with the purpose that the vehicles are designed to serve. The higher irst cost can be addressed by inanc-ing via a Green Bank (which Maryland should create) and/or by issuance of tax-free bonds.
For non-road transportation, Maryland should put in place incentives for battery-pow-ered equipment like leaf blowers and lawn mowers especially in those circumstanc-es where extension cords do not suice. Besides CO
2 emissions, fossil-fuel-powered
equipment creates disproportionate air pollution problems, which is the reason that many towns and cities have ordinances against their use. Maryland should move to battery-powered lawn and similar outdoor equipment for its own use and set a date by which its contractors would be required to use such equipment.
437 See the website of a non-proit promoting electric vehicles supported by State government and private entities at http://
marylandev.org/resources/incentives/# (MDEV 2016).

235
Prosperous, Renewable Maryland
The State has established an Electric Vehicle Infrastructure Council to develop recommenda-tions for statewide infrastructure.438
6. An open, equitable grid-of-the-futureMaryland should adopt the grid neutrality principles as part of the basis for creating the grid-
of-the future. We discussed them in Chapter VIII. They are: 439
Tenet I: Empower the consumer while maintaining universal access to safe, reliable electricity at reasonable cost.
Tenet II: Demarcate and protect the “commons.”
Tenet III: Align risks and rewards across the industry….Safeguard the public interest by containing the risks undertaken by private parties to those participants.
Tenet IV: Create a transparent, level playing ield. Promote and protect open standards, data access and transparency to encourage sustainable innovation on the grid. Prevent any single party -- public or private -- from abusing its inluence. Tenet V: Foster open access to the grid. Allow all parties who meet system-wide stan-dards the opportunity to add value to the grid. Apply all standards evenly and prevent any non-merit-based discrimination. We call this “The Open Access Principle.”
These principles will lay the basis for the kind of innovation, investment, and entrepreneurship that will be needed to transition to an electricity system that is democratized, afordable, resilient, and based mainly on variable renewable energy sources. The kinds of innovation and departures from the present centralized model that will be part of the grid-of-the-future are already coming into view. For instance, a New York startup company, TransActive Grid, has created a platform that allows electricity producers within a microgrid to sell electricity directly to consumers within the microgrid:440
The energy industry took a giant step towards a consumer-run future today when New York start-up TransActive Grid enabled its irst peer-to-peer paid transaction of energy in the USA.
…The historic transaction saw Eric Frumm…sell excess renewably generated electricity directly to…Bob Sauchelli. It was the irst proof of concept for the new microgrid, in which computer controlled energy measurement systems are installed in private houses and linked into a commu-nity to allow people to create, buy and sell energy to each other.
Enabling and promoting these and other types of community energy systems and microgrids will allow grid democratization, create opportunities for consumers of all income groups as well as all sizes of businesses, and promote electricity system resilience at the same time. But it also raises a host of regulatory issues involving the demarcation of the commons that the grid represents from private property, and ensuring fairness to all consumers and prosumers. The shape of the rules that will govern the grid-of-the-future will be critical to equity, reliability, democracy, and afordability in the transition to an emissions free electricity system.
438 Maryland EVIC 2016 439 Hu et al. 2015, quoting the main points of each tenet.440 PennEnergy 2016

236
XII. Policy considerations
7. An afordable and equitable transitionPutting in place an Afordable Energy Program (AEP) that limits household energy expen-
ditures to 6 percent of gross income is the most important policy that will ensure that low-income households will not be negatively afected by a transition to an emissions-free energy system. We have shown with detailed analysis that such a program is needed and would be beneicial to low-income households as well as other Marylanders.441 And it will be even more critical as we transition to a renewable grid-of-the-future (see Chapter VIII). Low-income households may face adverse efects if they do not have smart appliances, access to broadband, or the information about inancing to be able to take advantage of the opportunities that will be available in the grid-of-the-future. The AEP is a minimum and necessary safeguard against such adverse consequences that would exacerbate the dif-icult choices that low-income households are already forced to make.
Maryland should enact the Afordable Energy Program in order to ensure energy eq-uity and to protect low-income households from potential adverse efects of a transition to the grid-of-the-future.
Equity also means creating opportunity.
Community solar systems, microgrids that allow peer-to-peer renewable electricity sales in low-income areas, enforcement of building codes in rental housing, and uni-versal solar access should be part of energy equity programs in the grid-of-the future. The Maryland Public Service Commission and General Assembly should enhance Em-POWER and solar programs to enable such opportunities to low-income households in the grid-of-the-future.
It is generally acknowledged that lack of access to adequate inancing is a major obstacle faced by low- and middle-income households. A number of initiatives would help:
A Green Bank with suicient seed capital to facilitate such access.442
A community choice aggregation program that would allow cities and counties to ac-quire renewable energy for their residents and businesses in place of standard ofer service generation.
The acquisition of solar energy, at costs below standard ofer service, by the State on behalf of low-income households to structurally lower their electricity bills.
Suicient universal broadband access to enable low-income households to be able to participate in grid-of-the-future transactions as well as educational programs that ex-plain the beneits of such transactions. As noted in Chapter VIII, net metering for distributed solar, including community solar installations, should continue until equitable grid-of-the-future regulations are put into place.
Finally, it is essential that electric transportation infrastructure be put in place in areas and counties with high concentrations of low-income households.443 Personal electric vehicles are much more economical to operate; facilitating their acquisition and use by low- and medium-income households should be an important policy objective.
441 Makhijani, Mills, and Makhijani 2015442 MCEC 2015 443 The counties where more than 10 percent of the households apply for energy assistance are Garrett and Allegany.

237
Prosperous, Renewable Maryland
8. A just transition for workers and communities The transition to a renewable, distributed, and resilient system with mainly solar and wind can
be expected to create tens of thousands of steady jobs in Maryland. In general the work for most would be comparable to construction work; there would also be a few thousand utility jobs in the operation and maintenance of facilities in the renewable electricity system. About 2,000 coal and nuclear plant jobs would be afected not in terms of net losses of jobs in the state, but possible net losses in the areas where the coal and nuclear plants are located. The communities in these areas would also be expected to lose tax revenues to the tune of tens of millions of dollars a year.
A just transition requires that Maryland make a provision to create jobs proactively in the communities where job losses are expected and to provide revenues that would replace tax revenues provided by coal and nuclear plants to communities. These rev-enues can be raised in a variety of ways. We recommend a total of $200 million dollars per year be devoted to worker and community transition and for training workers and creating renewable energy and eiciency jobs in low-income communities. A charge of $2 per megawatt-hour would be suicient for this purpose in the 2040s. In the near future, a carbon tax, funds from the Regional Greenhouse Gas Initiative, and/or other revenues sources could be used.
9. Pilot and demonstration projectsThe revenue and technical structure of the grid-of-the-future will be substantially diferent
from the centralized grid of today. There is a need for pilot and demonstration projects not only for some technical aspects of the transition but also to evaluate rate structures, costs, participation rates, etc.
Maryland is already undertaking a pilot community solar program. In our energy justice report, we recommended a pilot program to, among other things, evaluate costs and participation rates that might be expected were an Afordable Energy Program to be put into place. We reiterate that recom-mendation here.
i. Renewable microgrids
Fully renewable microgrids will be needed for a resilient electricity system that is also emis-sions-free. Various combinations of solar and wind energy along with battery storage and distributed hydrogen production could fulill the requirements. Further, fuel cell or hybrid fuel cell-battery ve-hicles may be needed for some transportation applications such as long-haul trucks. Seasonal thermal storage may also play a role in reducing curtailment and making a fully renewable electricity system more economical. The various technologies that are needed are available. Putting them together, how-ever, requires location-speciic design.
Maryland should implement three renewable microgrid projects that will demonstrate various combinations of renewable supply, storage, and demand control technologies and diferent modes of interoperability with the grid. Given the potential importance of distributed hydrogen production at least one project should be along the lines of the diagram in Figure XII-1 below. This German system near Prenzlau has been operating since 2011. 444 At least one demonstration project should include seasonal thermal stor-age for both heat and coldness.
444 EC Regional Policy 2015. A pilot hydrogen illing station at the Berlin Brandenburg Airport includes solar panels to supplement the electricity supplied by an Enertrag wind farm. That station will include a “research campus” (Fuel Cell Bulletin 2013, p. 6).

238
XII. Policy considerations
Figure XII-1: An integrated electricity-heating-renewable hydrogen energy system, near Prenzlau,
Germany. Source: Courtesy of ENERTRAG AG (Enertrag 2009, Slide 6)
ii. Integrating short-term and seasonal storage
The Climate Protection Scenario has signiicant curtailed energy (which could also be energy given away free of charge). This is mainly because there are large surpluses above requirements in the spring and fall months. At the same time, there are peaks in the winter months that are accommodated by fuel cell (or turbine generation), with renewable hydrogen fuel. There is potential to reduce the cost of the system and the amount of generation needed for reliability by integrating seasonal thermal stor-age with the shorter term battery storage (and demand response).
Seasonal thermal storage is being commercially used in Britain, as noted in Chapter VII, Sec-tion 3.iii. There are a variety of approaches to seasonal thermal storage. Integrating seasonal thermal storage into microgrids could signiicantly increase the loads that could be served during outages or increase the length of time for which critical loads could be served or both.
Microgrid demonstration projects that are fully renewable and combine short-term storage, and demand response with seasonal storage are important for exploring eco-nomical ways of increasing resiliency and for reducing the curtailment that might be associated with a grid dominated by wind and solar energy.

239
Prosperous, Renewable Maryland
iii. Direct current demonstration
Solar photovoltaic systems generate direct current electricity (DC), while the grid operates on alternating current (AC) electricity. Solar PV systems therefore normally have inverters associated with them that convert DC to AC electricity. Among other things, this allows a local producer-consum-er to have solar on-site, use it locally when it is available, export it when it is in excess, and combine it with grid electricity for use when it is in deicit. Inverters are highly eicient devices, typically 96 percent eicient.
However, many consuming devices, including computers, televisions, cell phone chargers, and LED light bulbs use DC electricity. This means that every such device must have a rectiier that converts AC to DC electricity, resulting in further losses. In some situations, such as data centers there are multiple conversions, resulting in signiicant losses. In addition, if the electricity losses occur in tight spaces, additional electricity is required to run cooling equipment. Lawrence Berkeley National Laboratory estimated that data center losses are between 5 and 28 percent compared to direct use of DC power in data centers.445
Wiring homes, especially existing homes, with DC as well as AC can, however, be expensive, creating a tradeof between more eicient use of on-site solar electricity and cost. The economics are likely to be more favorable in many situations in the commercial sector, particularly in the context of distributed solar generation. Speciically, directly connecting the solar DC (via power conditioning equipment) would reduce the capacity of the solar PV installation needed to serve the site; this could result in signiicant cost reductions in some situations. One or more demonstration projects designed to provide data to compare the costs and eiciency of dual DC/AC buildings compared to AC only power supply would be useful in evaluating broader applications.
iv. Electriied bus transportElectric buses are now commercially available. For instance, buses made by BYD, a Chinese
bus company that has a factory in California, had completed 100 million revenue miles “and been evaluated by more than 150 cities in 36 countries” by March 1, 2016. The buses can be charged by of-route and on-route charging systems.446 Moreover, in the PJM system, their batteries could be used for vehicle-to-grid transactions. In June 2015, Baltimore had a major public transit project, the light rail Red Line, cancelled.447 A major electric bus initiative that would clean up the city’s air, provide experience with vehicle-to-grid operations on a signiicant scale, and connect Maryland irmly with an electric transportation future could be a critical demonstration project.
Maryland should make some bus routes in Baltimore fully electric as a demonstration for joining electric public transportation with the grid-of-the-future.
v. Residential fuel cell micro-CHP with renewable hydrogen
Residential combined heat and power systems using fuel cells have been available on a com-mercial basis in Japan since 2009. Almost 60,000 systems were sold there in 2013. These use natu-ral gas with reformers to convert it to hydrogen. 448 Of course, to be renewable, the hydrogen must come from renewable sources. Maryland should initiate and support a pilot project in which an entire residential development would have individual homes with micro-CHP fuel cell systems. There are
445 LBNL 2008446 Link Transit 2016, BYD Motors 2015, and, for more details about the technology, Field 2015 447 Dresser and Broadwater 2015448 Dodds et al. 2015, pp. 2066 and 2068

240
XII. Policy considerations
a number of ways in which the hydrogen could be produced that would be compatible with a zero carbon emissions in the long-run. It could be produced with grid electricity, which would have carbon emissions in the near future but zero emissions in the context of a fully renewable grid. It could also be produced with a local electrolyzer and a solar PV system, as has been done in the New Jersey “Hy-drogen House.”449
10. The Paris Agreement and the 1.5oC limit
The GHG concentration estimated to produce a 1.5oC temperature rise is about 430 parts per million, a level already reached in 2011 (see Chapter I).450 Thus, it is necessary to contemplate not only near-total or total elimination of GHG emissions, but also to remove CO
2 from the atmosphere.
There is extensive discussion in the literature about the use of soils, notably agricultural soils, to store increased amounts of carbon. Soils are a large reservoir of carbon – about 1,500 billion metric tons are stored as organic matter in global soils, twice the amount as in the atmosphere. Soil degradation not only results in carbon emissions but also in economic losses in the form of crop production losses.451
Many approaches to increasing soil carbon, as well as carbon stored in biomass, are avail-able. The IPCC5 Mitigation report provides an extensive catalog.452 People actually eat only about 25 percent to 30 percent the food biomass in crops. The rest is accounted for in the ineiciency of meat production and food waste.453 The issue of food quantity and quality is vast, as is the topic of GHG emissions from the food production system (including agriculture). We note it here because increasing carbon in the soil, particularly agricultural soil is now recognized as important both to food production and to climate protection. In fact, there is an international initiative inaugurated on the sidelines of the Paris Climate Change Conference by the French government that has a target of increasing carbon stored in the soil by 0.4 percent per year as part of the efort to mitigate human impact on climate.454
The efort to increase carbon stored in the soil while working to make agriculture more envi-ronmentally sound, and food healthier455 appears to be a promising complement to an emissions-free energy system for reducing GHG concentrations to conform to the 1.5oC limit. Just as an energy sys-tem designed to protect climate would produce a host of health and environmental beneits, it would appear that a food system protective of climate would also produce a number of collateral beneits, including improved health and better soil. Changes in the energy system and the food system by them-selves could probably not achieve the 1.5oC limit. Healthy energy and healthy food could be combined to protect climate as well.
449 Hydrogen House 2016450 A 1.5oC temperature rise has not yet been reached since there is a lag between the driving force, GHG concentration,
and the increase in the Earth’s average surface temperature. This is like the lag between turning on a lame under a pot of water and the actual boiling of the water in it.451 Alim’Agri 2015452 IPCC5 Mitigation 2014, Table 11.2 (pp. 830-832)453 Estimated by IEER from IPCC5 Mitigation 2014, Figure 11.9 (p. 836). Grazing-related biomass input and food output
are not included. 454 Alim’Agri 2015455 Michael Pollan’s seven word conclusion about food is relevant: “Eat food. Not too much. Mostly plants.” (Pollan 2008, p. 1)

241
Prosperous, Renewable Maryland
XIII. References
80 FR 77420-77518 (2015-12-14) U.S. Environmental Protection Agency. “40 CFR Part 80 [EPA–HQ–OAR–2015–0111; FRL–9939–72–OAR] RIN 2060–AS22. Renewable Fuel Standard Program: Standards for 2014, 2015, and 2016 and Biomass-Based Diesel Volume for 2017, Final rule,” Federal Register, v. 80, no. 239 (December 14, 2015): pp. 77420 – 77518, at https://www.gpo.gov/fdsys/pkg/FR-2015-12-14/pdf/2015-30893.pdf.
ACEEE 2008 (cited in Model) Maggie Eldridge, Neal Elliott, William Prindle, Katie Ackerly, John “Skip” Laitner, Vanessa McKinney, Steve Nadel, Max Neubauer, Alison Silverstein, Bruce Hedman, Anne Hampson, and Ken Darrow. Energy Eiciency: The First Fuel for a Clean Energy Future; Resources for Meeting Maryland’s Electricity Needs. (Report no. E082) Washington, DC: American Council for an Energy-Eicient Economy, February 2008, at http://aceee.org/research-report/e082.
ACEEE 2011 American Council or an Energy-Eicient Economy. How Does Energy Eiciency Create Jobs? Washington, DC: ACEEE, November 14, 2011, at http://aceee.org/iles/pdf/fact-sheet/ee-job-creation.pdf, from link at http://aceee.org/fact-sheet/ee-job-creation.
ACEEE 2012 (cited in Model) American Council for an Energy-Eicient Economy. Water Heating. Washington, DC: ACEEE, last updated December 2012, at http://www.aceee.org/consumer/water-heating.
ACEEE 2013a (cited in Model) Sameer Kwatra, Jennifer Amann, and Harvey Sachs. Miscellaneous Energy Loads in
Buildings. (Research Report A133) Washington, DC: American Council for an Energy-Eicient Economy, June 27, 2013, at http://www.aceee.org/sites/default/iles/publications/researchreports/a133.pdf.
ACEEE 2013b (cited in Model) Joanna Mauer, Andrew deLaski, Steven Nadel, Anthony Fryer, and Rachel Young. Better Appliances: An Analysis of Performance, Features, and Price as Eiciency Has Improved. (Research Report A132) Washington, DC: American Council for an Energy-Eicient Economy, May 20, 2013, at www.aceee.org/sites/default/iles/publications/researchreports/a132.pdf, from link at http://www.aceee.org/research-report/a132.
ACEEE 2014 Maggie Molina. The Best Value for America’s Energy Dollar: A National Review of the Cost of Utility
Energy Eiciency Programs. (Report Number U1402) Washington, DC: American Council for an Energy-Eicient Economy, March 2014, at http://aceee.org/research-report/u1402.
ACEEE Eiciency to 2050 (2012) John A. “Skip” Laitner, Steven Nadel, R. Neal Elliott, Harvey Sachs, and A. Siddiq Khan. The Long-Term Energy Eiciency Potential: What the Evidence Suggests. (Report no. E121) Washington, DC: American Council for an Energy-Eicient Economy, January 11, 2012, at http://aceee.org/sites/default/iles/publications/researchreports/e121.pdf.
Aclara 2013 (cited in Model) Aclara Technologies. Water Heating/Laundry For Your Home: Clothes Washers. Wellesley Hills, MA, Aclara, 2013, at https://www.energyguide.com/library/EnergyLibraryTopic.asp?bid=austin&prd=10&TID=17246&SubjectID=8374.
AFDC 2016 U.S. Department of Energy. Alternative Fuels Data Center. Vehicle Cost Calculator. Washington, DC: DOE, Oice of Energy Eiciency and Renewable Energy, AFDC, accessed February 16, 2016, at http://www.afdc.energy.gov/calc/.
Agenbroad and Holland 2014 Josh Agenbroad and Ben Holland. “Pulling Back the Veil on EV Charging Station Costs,” RMI Outlet (Rocky Mountain Institute), April 29, 2014, at http://blog.rmi.org/blog_2014_04_29_pulling_back_the_veil_on_ev_charging_station_costs.

242
XIII. References
AHRI 2014 (cited in Model) Air-Conditioning, Heating, and Refrigeration Institute. Certiicate of Product Ratings. [Details:] AHRI Certiied Reference Number: 5063326, Date: 1/23/2014; Product: Variable Speed Mini-Split Heat Pump, with Remote Outdoor Unit Air-Source, Free Delivery; Outdoor Unit Model Number:
AOU12RLS2; Indoor Unit Model Number: ASU12RLS2; Manufacturer: Fujitsu General America, Inc. For
Certiicate No.: 130349612020988402 veriication, go to http://www.ahridirectory.org/ahridirectory/pages/
VerifyCertiicate.aspx.
AirNow 2016 AirNow. [Website]. [Washington, DC: U.S. Environmental Protection Agency], accessed on April 18,
2016, at http://airnow.gov/.
Alim’Agri 2015 France. Ministère de l’Agriculture, agroalimentaire, et de la forêt. Join the 4‰ Initiative Soils for
food security and climate. [Paris, Ministry (Alim’Agri), September 23, 2015, at http://agriculture.gouv.fr/join-40-
initiative-soils-food-security-and-climate. French Ministry of Agriculture, Agrifood and Forestry.
AP 2008 Associated Press. “Water discharge permit for TVA reactor lapses,” Electricity Forum, June 2008, at http://
www.electricityforum.com/news/jun08/Moredatarequiredbeforepermitrenewal.html. Date from URL.
Appliance Magazine 2009 (cited in Model) Greg Sorensen and David Zabrowski. “Improving Range-Top Eiciency with Specialized Vessels,” Appliance Magazine, August 2009, at http://www.appliancemagazine.com/editorial.php?a
rticle=2257&zone=114&irst=1.
APS 2008 American Physical Society. Energy Future: Think Eiciency: How American Can look Within to Achieve Energy Security and Reduce Global Warming. College Park, MD: APS, September 2008, at http://www.aps.
org/energyeiciencyreport and http://www.aps.org/energyeiciencyreport/report/aps-energyreport.pdf
Architecture 2030 Challenge (2015) Architecture 2030. The 2030 Challenge. Santa Fe, NM: Architecture 2030,
2015, at http://architecture2030.org/2030_challenges/2030-challenge/.
ASAP 2011 (cited in Model) Appliance Standards Awareness Project. Refrigerator and Freezer standards. (Q&A:
Appliance Standards Questions and Answers). Boston, MA: ASAP, August 2011, at http://www.appliance-standards.
org/sites/default/iles/Refrigerator_Fact_Sheet_Aug_25_2011.pdf.
ASAP 2012 (cited in Model) Appliance Standard Awareness Project. Clothes Dryers. Boston: ASAP, [2012?], at
http://www.appliance-standards.org/product/clothes-dryers. Accessed 8/22/2013.
ASAP 2013 Washers (cited in Model) Appliance Standard Awareness Project. Clothes Washers. Boston: ASAP,
[2013], at http://www.appliance-standards.org/product/clothes-washers. Accessed August 29, 2013.
ASAP 2015 Graph Appliance Standard Awareness Project. Average Household Refrigerator Energy Use,
Volume, and Price Over Time. [Graph] Boston: ASAP, [November 2015], at http://www.appliance-standards.org/
sites/default/iles/Refrigerator_Graph_Nov_2015.pdf, from link at http://www.appliance-standards.org/product/
refrigerators-and-freezers.
ATSDR 2012 Agency for Toxic Substances and Disease Registry. Toxicological Proile For Carbon Monoxide.
Atlanta: U.S. Department of Health and Human Services, Public Health Service, ATSDR, June 2012, at www.atsdr.
cdc.gov/toxproiles/tp201.pdf, from link at https://www.atsdr.cdc.gov/ToxProiles/tp.asp?id=1145&tid=253.
Bade 2016 Gavin Bade. “DC consumer advocate iles to appeal Exelon-Pepco merger, Utility Dive, August 15,
2016, at http://www.utilitydive.com/news/dc-consumer-advocate-iles-to-appeal-exelon-pepco-merger/424468/.
Battery University 2016 Battery University. BU-705: How to Recycle Batteries. Vancouver: Cadex Electronics, last
updated May 5, 2016, at http://batteryuniversity.com/learn/article/recycling_batteries.
BEA 2015 (cited in Model) U.S. Bureau of Economic Analysis. National Economic Accounts. Washington, DC:
BEA, U.S. Department of Commerce, accessed January 7, 2016, at http://www.bea.gov/national, with links to http://
www.bea.gov/national/xls/gdplev.xls and http://www.bea.gov/national/xls/gdpchg.xls.
Bellona 2015 Charles Digges. Norwegian MPs push for all cars to be electric in 10 years. Oslo: Bellona, August 24,
2015, at http://bellona.org/news/climate-change/2015-08-norwegian-mps-push-for-all-cars-to-be-electric-in-10-years.

243
Prosperous, Renewable Maryland
BGE 2013-04 Michael J. Cloyd (BGE), to David J. Collins (Public Service Commission of Maryland). Re: Supplement 525 to P.S.C. Md. E-6 - Rider 25 - Monthly Rate Adjustment -Case Number 9299. Baltimore: Baltimore Gas and Electric Company, April 19, 2013, at http://webapp.psc.state.md.us/Intranet/Casenum/NewIndex3_VOpenFile.cfm?ServerFilePath=C:\Casenum\9200-9299\9299\\82.pdf. “(ML 146849)” Cover letter, page2, gives November 19, 2013, as the date.
BGE EmPOWER 2013 (cited in Model) Baltimore Gas and Electric Company. RE: BGE’s Semi-Annual Report for
First and Second Quarters January 1 through June 30, 2013 in Case No. 9154. Letter report from Kimberly A. Curry to David J. Collins (Maryland Public Service Commission). Baltimore: BGE, July 31, 2013, at http://webapp.psc.state.md.us/Intranet/casenum/NewIndex3_VOpenFile.cfm?ServerFilePath=C:\Casenum\9100-9199\9154\\420.pdf. “(ML 148812)” “The EmPOWER Maryland report.”
BGE Load Data 2013 Baltimore Gas and Electric Company. Load Proiles, PLCs & Energy Settlement. Baltimore: BGE, [undated], at https://supplier.bge.com/LoadProiles_EnergySettlement/loadproiles_energysettlement.htm. Accessed April 25, 2013. Web page banner title: Energy Choice Supplier Web. Links to: -- Historical Hourly Load Data from 6/1/07 through 12/31/12, at https://supplier.bge.com/LoadProiles_EnergySettlement/Load_Proiles_060107_12312012.xlsx.
BizNOW 2013 Business Network for Ofshore Wind. Maryland Ofshore Wind Energy Act of 2013 – Creating a Market. [Baltimore?]: BizNOW, [2013?], at http://www.bizmdosw.org/maryland-wind-energy-act-2013-legislative-history/. Accessed October 12, 2016.
BizNOW 2016 Business Network for Ofshore Wind. State of the U.S. States’ Ofshore Wind Deployment. [Baltimore?]: BizNOW, May 2016, at http://www.bizmdosw.org/ready-set-go-state-of-the-states-ofshore-wind-deployment/.
Bloomberg BNA 2016 Carolyn Whetzel. California Moves Forward With Oil, Gas Methane Rules. Arlington, VA: Bloomberg BNA, July 21, 2016, at http://www.bna.com/california-moves-forward-n73014445151/
Bolinger 2013 (cited in Model) Mark Bolinger. Revisiting the Long-Term Hedge Value of Wind Power in an Era of
Low Natural Gas Prices. (LBNL-6103E) Berkeley, CA: Lawrence Berkeley National Laboratory, Environmental Energy Technologies Division, March 2013, at https://emp.lbl.gov/sites/all/iles/lbnl-6103e.pdf.
Bombardier 2015 Bombardier. [Electric bus in Berlin, using Bombardier’s PRIMOVE technology for wirelessly
recharging battery: image]. Montreal: Bombardier, September 1, 2015. Image at http://www.bombardier.com/content/dam/Websites/bombardiercom/News/BT/BT_20150901_PRIMOVE_e-bus_Berlin_BrandenburgerTor.jpg, from link at BVG 2015 http://www.bombardier.com/en/media/newsList/details.bt_20150901_-berlin-erste-hauptstadt-mit-kabellos-geladener-e-bu.bombardiercom.html.
Bond 2013 Josh Bond. “Top 20 Lift truck suppliers, 2013,” Modern Materials Handling, August 1, 2013, at http://www.mmh.com/article/top_20_lift_truck_suppliers_2013.
Breslow 2011 Marc Breslow. Massachusetts $ Savings and Job Gains from Energy Eiciency in Buildings & Transportation. [Boston: Oice of] Transportation & Buildings Policy, Executive Oice of Energy & Environmental Afairs, Commonwealth of Massachusetts, [August 4, 2011], at https://www.epa.gov/sites/production/iles/2016-03/documents/massachusetts_savings_and_jobs_gains_from_energy_eiciency_in_buildings_and_transportation.pdf. “This is a presentation by Marc Breslow of the Massachusetts Executive Oice of Energy and Environmental Afairs from the EPA Technical Forum on the Jobs Impact of Clean Energy held on August 4, 2011.” (from “Properties”)
Brown et al. 2008 Rich Brown, Sam Borgeson, Jon Koomey, Peter Biermayer. U.S. Building-Sector Energy
Eiciency Potential. (LBNL-1096E) Berkeley: Environmental Energy Technologies Division, Lawrence Berkeley National Laboratory, University of California, September 2008, at https://buildings.lbl.gov/sites/all/iles/lbnl-1096e.pdf.
BTS Airline 2015 (cited in Model) U.S. Department of Transportation. Bureau of Transportation Statistics. Airline Fuel
Cost and Consumption (U.S. Carriers - Scheduled): January 2000 - February 2015: Annual Summary. Washington, DC: BTS, April 15, 2015, at http://www.transtats.bts.gov/fuel.asp?pn=0&display=data4. Data source: Bureau of Transportation Statistics F41 Schedule P12A as of 4/15/2015.

244
XIII. References
BTS NTS 2015 (cited in Model) U.S. Department of Transportation. Bureau of Transportation Statistics. National
Transportation Statistics: 2014. Washington, DC: BTS, January 2015, at http://www.rita.dot.gov/bts/sites/rita.dot.
gov.bts/iles/publications/national_transportation_statistics/index.html, with link to www.rita.dot.gov/bts/sites/rita.
dot.gov.bts/iles/NTS_Entire_14Q4.pdf. -- Table 1-40: U.S. Passenger-Miles (Millions), at http://www.rita.dot.gov/bts/sites/rita.dot.gov.bts/iles/publications/national_transportation_statistics/html/table_01_40.html.
Budischak et al. 2013 (cited in Model) Cory Budischak, DeAnna Sewell, Heather Thomson, Leon Mach, Dana E.
Veron, Willett Kempton. “Cost-minimized combinations of wind power, solar power and electrochemical storage,
powering the grid up to 99.9% of the time,” Journal of Power Resources, v.225 (1 March 2013): pp. 60-74, at
http://www.sciencedirect.com/science/article/pii/S0378775312014759/pdft?md5=a64966d0f6ab5b0fed909016b0fde3a2&pid=1-s2.0-S0378775312014759-main.pdf. Links at http://www.sciencedirect.com/science/article/pii/
S0378775312014759 include one to “Corrigendum.”
Buchsbaum 2016 Lee Buchsbaum. “France’s nuclear storm: Many power plants down
due to quality concerns,” Power (November 1, 2016), at http://www.powermag.com/
frances-nuclear-storm-many-power-plants-down-due-to-quality-concerns.
BVG 2015 Berlin Transport Authority. Berlin – The First Capital City with a Wirelessly-Charged E-bus Line.
(Press Release) Berlin: Berliner Verkehrsbetriebe (BVG), September 1, 2015, at http://www.bombardier.com/en/
media/newsList/details.bt_20150901_-berlin-erste-hauptstadt-mit-kabellos-geladener-e-bu.bombardiercom.html.
BYD Motors 2015 BYD Motors Inc. “BYD Motors Wins America’s Largest Electric Bus Order,” PR Newswire,
September 4, 2015, at http://www.prnewswire.com/news-releases/byd-motors-wins-americas-largest-electric-bus-
order-300138125.html.
Caiazzo et al. 2013 Fabio Caiazzo, Akshay Ashok, Ian A. Waitz, Steve H.L. Yim, Steven R.H. Barrett. “Air pollution and early deaths in the United States. Part I: Quantifying the impact of major sectors in
2005,” Atmospheric Environment, v.79 (November 2013): pp. 198-208, at http://lae.mit.edu/wordpress2/wp-
content/uploads/2013/08/US-air-pollution-paper.pdf and http://www.sciencedirect.com/science/article/pii/
S1352231013004548.
California ARB 2014 (cited in Model) California. Environmental Protection Agency. Air Resources Board.
Medium and Heavy-Duty Battery Electric Vehicles: Technology Assessment. [Slide Presentation]. Sacramento, CA:
ARB, September 2, 2014, at http://www.arb.ca.gov/msprog/tech/presentation/electrictrucks.pdf.
California Energy Almanac 2016 California Energy Commission. “Estimated 2013 Gasoline Price Breakdown &
Margins Details,” California Energy Almanac, accessed January 28, 2016, at http://energyalmanac.ca.gov/gasoline/
margins/index.php.
California Executive Order B-30-15 (2015) California. Oice of Governor. Governor Brown Establishes Most
Ambitious Greenhouse Gas Reduction Target in North America. Sacramento: Governor, April 29, 2015, at https://
www.gov.ca.gov/news.php?id=18938. Executive Order B-30-15.
Calvert County 2016 Timothy Hayden (Director, Department of Finance & Budget, Calvert County, Maryland).
Email to Lois Chalmers (and others). Subject: RE: Online Form Submittal: Contact Us [Calvert Clifs related taxes], April 18, 2016.
Cardwell 2016 Diane Cardwell. “Fight to Keep Alternative Energy Local Stymies an Industry,” New York Times,
March 23, 2016, at http://www.nytimes.com/2016/03/24/business/energy-environment/ight-to-keep-alternative-energy-local-stymies-an-industry.html?_r=2.
Carrier 2014 (cited in Model) Carrier Corporation. Split System Heat Pumps. [Farmington, Conn.]: Carrier,
accessed February 25, 2014, at http://www.carrier.com/homecomfort/en/us/products/heating-and-cooling/
heat-pumps/split-system-heat-pumps.
Casey 2015-06 Tina Casey. “Flow Battery Vs. Tesla Battery Smackdown Looming,” CleanTechnica, June 21, 2015, at
http://cleantechnica.com/2015/06/21/low-battery-vs-tesla-battery-smackdown-looming/.

245
Prosperous, Renewable Maryland
Caterpillar 2016 Caterpillar, Inc. 7,000-11,000 lb. Capacity Electric Pneumatic Tire Lift Trucks … 2EPC7000-
2EP11000. [Peoria, IL]: CAT, accessed January 21, 2016, at http://www.mcfa.com/cat/material-handling-equipment/Cat-Lift-Trucks/ClassI/LargePneumaticTrucks/2EPC7000-2EP11000. “Speciications” tab.
Ceres 2014 Ceres. Water & Climate Risks Facing U.S. Corn Production. Boston: Ceres, June 2014, at https://www.ceres.org/issues/water/agriculture/the-cost-of-corn.
Chesapeake Bay Foundation 2009 Chesapeake Bay Foundation. Making Connections: The Bay TMDL, Chesapeake
Clean Water Act and Chesapeake Executive Order. [Annapolis, MD]: CBF, [2009], at http://www.cbf.org/Document.Doc?id=446. Date from “Properties.”
Chesapeake Bay Program 2016 Chesapeake Bay Program. Facts & Figures. Annapolis, MD: The Program, accessed February 14, 2016, at http://www.chesapeakebay.net/discover/bay101/facts.
Chevrolet Bolt EV 2016 Chevrolet. Introducing the All-Electric 2017 Chevrolet Bolt EV. Detroit: Chevrolet, accessed September 29, 2016, at http://www.chevrolet.com/bolt-ev-electric-vehicle.html.
Cho 2011 Renee Cho. “Is Biomass Really Renewable?” State of the Planet (Earth Institute, Columbia University), August 18, 2011, at http://blogs.ei.columbia.edu/2011/08/18/is-biomass-really-renewable/.
Chow 2016 Lorraine Chow. “World’s First Boat Powered by 100% Renewables to Circle Globe,” EcoWatch, September 12, 2016, at http://www.ecowatch.com/energy-observer-2003152240.html.
Citi GPS 2015 Jason Channell, Heath R. Jansen, Elizabeth Curmi, Ebrahim Rahbari, Phuc Nguyen, Edward L. Morse, Elaine Prior, Seth M. Kleinman, Alastair R. Syme, and Tim Kruger. Energy Darwinism II: Why a Low Carbon
Future Doesn’t Have to Cost the Earth. [New York]: Citi GPS: Global Perspectives & Solutions, August 2015, at https://ir.citi.com/hsq32Jl1m4aIzicMqH8sBkPnbsqfnwy4Jgb1J2kIPYWIw5eM8yD3FY9VbGpK%2Baax.
Civic Works Annual Report 2014 Civic Works. 2014 Annual Report. Baltimore, Civic Works, October 14, 2015, at http://civicworks.com/wp-content/uploads/2014/08/FY14-Annual-Report-Final-for-web.pdf. Date from “Properties.”
Clark 2013 Clark Material Handling Company. GEX4050. Lexington, KY: Clark, June 21, 2013, at http://www.clarkmhc.com/PDFS/spec_lyer_pdfs/gex4050_specfeat_clark.pdf, from link at http://www.clarkmhc.com/trucks/gex4050.asp. Image is at http://www.clarkmhc.com/trucks/images/larger_view/GEX4050_LRG.jpg.
CleanTechnica 2013 (cited in Model) Joshua S Hill. “US Solar PV Pipeline Grows To 43 GW,” CleanTechnica, November 26, 2013, at http://cleantechnica.com/2013/11/26/us-solar-pv-pipeline-grows-43-gw/.
Cochran et al 2014 Jaquelin Cochran, Mackay Miller, Owen Zinaman, Michael Milligan, Doug Arent, Bryan Palmintier, Mark O’Malley, Simon Mueller, Eamonn Lannoye, Aidan Tuohy, Ben Kujala, Morten Sommer, Hannele Holttinen, Juha Kiviluoma, and S.K. Soonee. Flexibility in 21st Century Power Systems. (NREL/TP-6A20-61721) Golden, CO: National Renewable Energy Laboratory, May 2014, at http://www.nrel.gov/docs/fy14osti/61721.pdf. At head of title: 21st Century Power Partnership. Back cover: “Clean Energy Ministerial.”
Cole 2016 Jay Cole. “Netherlands Moves to Only Allow EV Sales By 2025 - End of Gas, Petrol,” Inside EVs, March 30, 2016, at http://insideevs.com/netherlands-moves-to-allow-only-all-evs-by-2025-no-more-gas-diesel-sales/.
Composites World 2014 Staf. “Carbon iber featured in new electrical transmission cable,” Composites World, June 2, 2014, at http://www.compositesworld.com/news/carbon-iber-featured-in-new-electrical-transmission-cable.
Cooke 2016 Kieran Cooke. “Ofshore wind powers ahead as prices drop 30% below nuclear,” The Ecologist, 19 July 2016, at http://www.theecologist.org/News/news_round_up/2987919/ofshore_wind_powers_ahead_as_prices_drop_30_below_nuclear.html.
Cooper 2013 Mark Cooper. Renaissance in Reverse: Competition Pushes Aging U.S. Nuclear Reactors to the Brink
of Economic Abandonment. South Royalton, VT: Institute for Energy and the Environment, Vermont Law School, July 18, 2013, at http://216.30.191.148/071713%20VLS%20Cooper%20at%20risk%20reactor%20report%20FINAL1.pdf.

246
XIII. References
Courier & Press 2013 (cited in Model) “Lower-income customers can get their homes weatherized by Vectren,
Duke Energy,” Staf Report, Evansville Courier & Press, October 14, 2013, at http://www.courierpress.com/
news/2013/oct/14/no-headline---weatherization.
CPS Energy 2016 CPS Energy. New Energy Economy: Turning innovation into economic development. San
Antonio: CPS Energy, accessed June 6, 2016, at https://www.cpsenergy.com/en/about-us/who-we-are/new-energy-
economy.html.
Cradle to Cradle 2014 Cradle to Cradle Products Innovation Institute. Beneits of the Cradle to Cradle Product Program. San Francisco: C2C, October 17, 2014, at http://s3.amazonaws.com/c2c-website/resources/impact_study_
executive_summary.pdf. Date from “Properties.”
Crane 2014 Energy Revolution: Utilities Confront the Shifting Energy Landscape. RFF Policy Leadership Forum:
A Conversation with Chris Crane, President and CEO, Exelon, May 13, 2014. Washington, DC: Resources for
the Future, 2014, at http://www.rf.org/Events/Pages/Energy-Revolution-Utilities-Confront-the-Shifting-Energy-Landscape.aspx, with audio at: http://video.rf.org:8000/~rf/140513.mp3. Conversation with RFF President Phil
Sharp.
Danfoss 2016 Danfoss. CO2. (Refrigerants and Energy Eiciency) Nordborg, Denmark: Danfoss, accessed September
29, 2016, at http://refrigerants.danfoss.com/co2/.
Daniels 2016 Steve Daniels. “As nuke closures loom, Exelon loats new rescue plan,” Crain’s Chicago
Business, May 5, 2016, at http://www.chicagobusiness.com/article/20160505/NEWS11/160509863/
as-nuke-closures-loom-exelon-loats-new-rescue-plan.
De Martini and Kristov 2015 Paul De Martini and Lorenzo Kristov. Distribution Systems in a High DER
Future: Planning, Market Design, Operation and Oversight. (Future Electric Utility Regulation, Report
No. 2) Berkeley, CA: Lawrence Berkeley National Laboratory, October 2015, at https://emp.lbl.gov/
sites/all/iles/FEUR_2%20distribution%20systems%2020151023_1.pdf, from link at https://emp.lbl.gov/
future-electric-utility-regulation-series.
DeConto and Pollard 2016 Robert M. DeConto and David Pollard. “Contribution of Antarctica to past and future
sea-level rise,” Nature, v. 531 (31 March 2016): 591-597. Published online 30 March 2016; corrected online 05 April
2016, at http://www.nature.com/nature/journal/v531/n7596/full/nature17145.html.
Deloitte 2015 (cited in Model) Deloitte. Corporate Tax Rates 2015. International Tax. [New York]: Deloitte Touche Tohmatsu Limited, August 2015, at https://www2.deloitte.com/content/dam/Deloitte/global/Documents/Tax/dttl-tax-
corporate-tax-rates-2015.pdf.
Desmond 2016 Matthew Desmond. Evicted: Poverty and Proit in the American City. New York: Crown, 2016. Information at http://www.penguinrandomhouse.com/books/247816/evicted-by-matthew-desmond/9780553447439/.
Dodds et al. 2015 Paul E. Dodds, Iain Stafell, Adam D. Hawkes, Francis Li , Philipp Grünewald, Will McDowall, Paul Ekins. “Hydrogen and fuel cell technologies for heating:
A review,” International Journal of Hydrogen Energy, v. 40, issue 5 (9 February 2015): pp.
2065-2083, at http://ac.els-cdn.com/S0360319914031383/1-s2.0-S0360319914031383-main.
pdf?_tid=0f0335f4-4514-11e6-a424-00000aab0f6c&acdnat=1467986493_e6981f2573ec2b41158786aca93a78f3.
DOE 2009 (cited in Model) U.S. Department of Energy. Refrigerator Market Proile: 2009. Washington, DC:
DOE, updated December 2009, at http://apps1.eere.energy.gov/states/pdfs/ref_market_proile.pdf. Running title:
ENERGY STAR Refrigerator Market Proile. At head of title: New Opportunities Multiply Savings.
DOE 2012 SunShot U.S. Department of Energy. SunShot Vision Study. (DOE/GO-102012-3037) [Golden,
CO]: DOE, Oice of Energy Eiciency and Renewable Energy, February 2012, at http://energy.gov/sites/prod/
iles/2014/01/f7/47927.pdf, from links at http://energy.gov/eere/sunshot/sunshot-vision-study. Prepared by the
National Renewable Energy Laboratory.

247
Prosperous, Renewable Maryland
DOE and EPA 2015 Where the Energy Goes: Gasoline Vehicles. Washington, DC: U.S. Department of Energy, Oice of Energy Eiciency and Renewable Energy; U.S. Environmental Protection Agency, Oice of Transportation and Air Quality, accessed June 1, 2015, at https://www.fueleconomy.gov/feg/atv.shtml & https://www.fueleconomy.gov/feg/images/energy_reqs_combined_030414.jpg.
DOE CHP 2015 ICF International Inc. Combined Heat and Power Installations in Maryland. (U.S. DOE Combined Heat and Power Installation Database) Washington, DC: U.S. Department of Energy, data current as of December 31, 2015, at https://doe.icfwebservices.com/chpdb/state/MD.
DOE Demand Response 2016 U.S. Department of Energy. Oice of Electricity Delivery & Energy Reliability. Demand Response. Washington, DC: DOE, accessed on March 3, 2016, at http://energy.gov/oe/technology-development/smart-grid/demand-response.
DOE EERE 2001 (cited in Model) U.S. Department of Energy. Oice of Energy Eiciency and Renewable Energy. Water Heating: Energy-eicient strategies for supplying hot water in the home. (Technology Fact Sheet; DOE/GO-102001-0785) [Washington, DC?]: Oice of Building Technology, State and Community Programs, EERE, DOE, August 2001, at http://apps1.eere.energy.gov/buildings/publications/pdfs/building_america/26465.pdf.
DOE EERE 2010 (cited in Model) McGraw-Hill Construction. Energy Eiciency Trends in Residential and Commercial Buildings. Washington, DC: U.S. Department of Energy, Oice of Energy Eiciency and Renewable Energy, August 2010, at http://apps1.eere.energy.gov/buildings/publications/pdfs/corporate/building_trends_2010.pdf.
DOE EERE 2010 House Simulation Bob Hendron and Cheryn Engebrecht. House Simulation Protocols Report. (NREL report/project no. TP-550-49426; DOE no. DOE/GO-102010-3141) Washington, DC: U.S. Department of Energy, Oice of Energy Eiciency and Renewable Energy, Building Technologies Oice, October 2010, at http://energy.gov/sites/prod/iles/2013/11/f5/house_simulation_revised.pdf, with link from http://energy.gov/eere/buildings/house-simulation-protocols-report. 2012 Addendum at http://energy.gov/eere/buildings/downloads/addendum-building-america-house-simulation-protocols.
DOE EERE 2012 BEDB D&R International, Ltd. 2011 Buildings Energy Data Book. [Washington, DC]: Buildings Technologies Program, Energy Eiciency and Renewable Energy, U.S. Department of Energy, March 2012. Links at http://buildingsdatabook.eren.doe.gov/DataBooks.aspx, with pdf at http://buildingsdatabook.eren.doe.gov/docs%5CDataBooks%5C2011_BEDB.pdf and all tables at http://buildingsdatabook.eren.doe.gov/docs/DataBooks/2011_BEDB.xlsx.
DOE EERE 2013 Analysis U.S. Department of Energy. Building Technologies Oice. Building America
Analysis Spreadsheets. Washington, DC: DOE, Oice of Energy Eiciency and Renewable Energy, updated March 21, 2013, at http://energy.gov/eere/buildings/building-america-analysis-spreadsheets (formerly at http://www1.eere.energy.gov/buildings/residential/ba_analysis_spreadsheets.html). “[C]ompanions to the House Simulation Protocols.” -- BA Analysis – New Construction (Updated 01/26/2011), at http://www1.eere.energy.gov/buildings/residential/docs/analysis_new_construction.zip. Leads to zip ile <B10 Analysis - New Construction 2011.01.26.xlsm>. -- BA Analysis – Existing Homes (Updated 01/26/2011), at http://www1.eere.energy.gov/buildings/residential/docs/analysis_existing_homes.zip. Leads to zip ile <B10 Analysis - Existing Homes 2011.01.26.xlsm>, where various locations in Maryland can be selected.
DOE EERE 2015 U.S. Department of Energy. Oice of Energy Eiciency and Renewable Energy. Fact #861 February 23, 2015 Idle Fuel Consumption for Selected Gasoline and Diesel Vehicles. Washington, DC: DOE EERE, accessed November 12, 2016, at http://energy.gov/eere/vehicles/fact-861-february-23-2015-idle-fuel-consumption-selected-gasoline-and-diesel-vehicles.
DOE EERE 2016 Water Heaters U.S. Department of Energy. Oice of Energy Eiciency and Renewable Energy. Residential Water Heaters. (Appliance and Equipment Standards Rulemakings and Notices) Washington, DC: DOE EERE, accessed February 2, 2016, at https://www1.eere.energy.gov/buildings/appliance_standards/product.aspx/productid/27.

248
XIII. References
DOE FCT 2011-2020 U.S. Department of Energy. Fuel Cell Technologies Oice. Multi-Year Research,
Development, and Demonstration Plan: Planned program activities for 2011-2020. Washington, DC: DOE, Oice of Energy Eiciency and Renewable Energy, FCT Oice, accessed December 2015. Links to all the sections are at http://energy.gov/eere/fuelcells/downloads/fuel-cell-technologies-oice-multi-year-research-development-and-22.
Each section updated at diferent times. Also referred to as MYRD&D. -- 3.1 Hydrogen Production, at http://energy.gov/sites/prod/iles/2015/06/f23/fcto_myrdd_production.pdf.
DOE Geothermal 2012 (cited in Model) U.S. Department of Energy. Geothermal Heat Pumps. Washington, DC:
DOE, Energy-Saver, June 24, 2012, at http://energy.gov/energysaver/articles/geothermal-heat-pumps.
DOE QTR 2015 U.S. Department of Energy. Quadrennial Technology Review: An Assessment of Energy Technologies
and Research Opportunities. Washington, DC: DOE, Oice of the Under Secretary for Science and Energy, September 2015, at http://energy.gov/under-secretary-science-and-energy/quadrennial-technology-review-2015 and
http://energy.gov/under-secretary-science-and-energy/quadrennial-technology-review-2015-omnibus.
-- Chapter 7: Advancing Systems and Technologies to Produce Cleaner Fuels: Technology Assessments
-- Chapter 7D: Hydrogen Production and Delivery, at http://energy.gov/sites/prod/iles/2015/11/f27/QTR2015-7D-Hydrogen-Production-and-Delivery.pdf and
-- Chapter 7E: Natural Gas Delivery Infrastructure, at http://energy.gov/sites/prod/iles/2016/04/f30/QTR2015-7E-Natural-Gas-Delivery-Infrastructure.pdf.
DOE Sunshot 2016 U.S. Department of Energy. Oice of Energy Eiciency and Renewable Energy. Sunshot
Initiative Goals. Washington, DC: DOE EERE, accessed November 15, 2016, at http://energy.gov/eere/sunshot/
sunshot-initiative-goals.
DOE Wind 2015 Jose Zayas, Michael Derby, Patrick Gilman, Shreyas Ananthan, Eric Lantz, Jason Cotrell,
Fredric Beck, and Richard Tusing. Enabling Wind Power Nationwide. (DOE/EE-1218) Washington, DC: U.S.
Department of Energy, May 2015, at http://www.energy.gov/sites/prod/iles/2015/05/f22/Enabling-Wind-Power-Nationwide_18MAY2015_FINAL.pdf.
DOE WINDExchange 2015 U.S. Department of Energy. Oice of Energy Eiciency and Renewable Energy. Wind Program. Potential Wind Capacity. (Wind and Water Power Program – WINDExchange) Washington, DC:
EERE, updated September 24, 2015, at http://apps2.eere.energy.gov/wind/windexchange/windmaps/resource_
potential.asp.
-- U.S. chart at http://apps2.eere.energy.gov/wind/windexchange/pdfs/wind_maps/us_contiguous_wind_potential_
chart.pdf.
-- Maryland at http://apps2.eere.energy.gov/wind/windexchange/wind_resource_maps.asp?stateab=md, with links
to http://apps2.eere.energy.gov/wind/windexchange/images/windmaps/md_140m_potential.jpg. (Map) and http://
apps2.eere.energy.gov/wind/windexchange/pdfs/wind_maps/md_wind_potential_chart.pdf (Chart).
-- South Dakota chart at http://apps2.eere.energy.gov/wind/windexchange/pdfs/wind_maps/sd_wind_potential_chart.
pdf.
Dominion 2016 Dominion. Virginia Wind Projects. Richmond, VA: Dominion [Resources, Inc.], 2016, at https://www.
dom.com/corporate/what-we-do/electricity/generation/wind/virginia-wind-projects.
DP 2013 Pepco Holdings Inc. Daily and Monthly Settlement Reports: Maryland, [Delmarva Power].
Washington, DC: PHI, [2013], at http://www2.conectiv.com/cpd/tps/MD/settlement_info/md_settlement_app.
cfm. Banner title: Third Party Supplier Program Information - Maryland Daily and Monthly Settlement Reports.
Accessed September 5, 2013.
Drake Landing Solar Community 2011 Bruce Sibbitt, Doug McClenahan, Reda Djebbar, Jef Thornton, Bill Wong, Jarrett Carriere and John Kokko. Measured and Simulated Performance of a High Solar Fraction District Heating
System With Seasonal Storage. [Presented at the 30th biennial ISES Solar World Congress 2011, 28 August to 2
September, Kassel, Germany.] [Okotoks, Alberta: Drake Landing Solar Community, 2011], at www.dlsc.ca/reports/
bjul15/ISES_SWC_2011_inal.pdf. Image is at http://www.dlsc.ca/how-ig1-illust.htm. Final journal paper (without
that graphic) is at www.dlsc.ca/reports/bjul15/DLSC_SHC_2012_inal.pdf.

249
Prosperous, Renewable Maryland
Drake Landing Solar Community 2016 Drake Landing Solar Community. How it Works. [Okotoks, Alberta: DLSC, accessed March 23, 2016], at http://www.dlsc.ca/how.htm.
Dresser and Broadwater 2015 Michael Dresser and Luke Broadwater. “Hogan says no to Red Line, yes to Purple,” The Baltimore Sun, June 25, 2015, at http://www.baltimoresun.com/news/opinion/editorial/bs-md-hogan-transportation-20150624-story.html.
DSIRE Federal 2016 Database of State Incentives for Renewables and Eiciency (DSIRE). Programs. Raleigh: North Carolina State University, accessed April 22, 2016, at http://programs.dsireusa.org/. Use “apply ilter” button to choose a speciic state or “federal.” -- “Business ITC”: Business Energy Investment Tax Credit (ITC), at http://programs.dsireusa.org/system/program/detail/658 (Last DSIRE Review: 12/21/2015) -- “Depreciation”: Modiied Accelerated Cost Recovery System, at http://programs.dsireusa.org/system/program/detail/676 (last DSIRE review: 1/11/2016)
Duf 2011 (cited in Model) Rebecca Duf (ICF International). ENERGY STAR® Emerging Technology Award:
Heat Pump Clothes Dryers, ENERGY STAR Partner Meeting Charlotte, NC, November 10, 2011. [Washington, DC]: EPA Energy Star, 2011, at http://www.energystar.gov/ia/partners/downloads/meetings/2011/ES%20Emerging%20Tech%20Award%20Dryers.pdf.
Earthjustice 2009 Earthjustice. Maryland: Coal Ash Disposal in Ponds and Landills. [San Francisco]: EarthJustice, [2009?], at http://earthjustice.org/documents/fact-sheet/pdf/coal-ash-fact-sheet-maryland, from link at http://earthjustice.org/features/map-coal-ash.
Earthwise 2016 Earthwise Tools. 60420 Earthwise 40 Volt Lithium Cordless 20″ Electric Mower. Shelbyville, IN: Earthwise, accessed August 4, 2016, at http://earthwisetools.com/wp-content/uploads/2016/01/20-Inch-Lithium-40V-Mower-Model-60420main.jpg, from link at http://earthwisetools.com/product/20-cordless-lithium-lawnmower.
EC Regional Policy 2015 European Commission. Directorate-General for Regional and Urban Policy. The irst hybrid electricity-fuel-heat power plant with hydrogen storage in the world. Brussels: EC Regional Policy, last update: 30 March 2015, at http://ec.europa.eu/regional_policy/en/projects/germany/the-irst-hybrid-electricity-fuel-heat-power-plant-with-hydrogen-storage-in-the-world.
Edelstein 2016 Stephen Edelstein. “Chicago Transit Authority To Add Dozens Of Electric Buses After Successful Tests,” Green Car Reports, January 31, 2016, at http://www.greencarreports.com/news/1102130_chicago-transit-authority-to-add-dozens-of-electric-buses-after-successful-tests.
EEI 2013 (cited in Model) Peter Kind (Energy Infrastructure Advocates). Disruptive Challenges: Financial Implications
and Strategic Responses to a Changing Retail Electric Business. Washington, DC: Edison Electric Institute, January 2013, at http://www.eei.org/ourissues/inance/Documents/disruptivechallenges.pdf.
EESI 2002 (cited in Model) Environmental and Energy Study Institute. Fact Sheet: Air Conditioner
Eiciency Standards: SEER 13 vs. SEER 12. Washington, DC: EESI, 2002, at http://www.eesi.org/fact-sheet-air-conditioner-eiciency-standards-seer.
EESI 2016 Environmental and Energy Study Institute. Fact Sheet: Ofshore Wind - Can the United States Catch up with Europe? Washington, DC: EESI, January 4, 2016, at http://www.eesi.org/papers/view/factsheet-ofshore-wind-2016 and www.eesi.org/iles/FactSheet_OfshoreWind_01.04.pdf.
EGO 2016 EGO Power Plus. POWER+ 480 CFM BLOWER: LB4801. Geneva, IL: EGO, accessed February 23, 2016, AT http://cdn.shopify.com/s/iles/1/0262/2513/products/EGO_Blower_large.png?v=1438782444, from link at http://egopowerplus.com/products/480-cfm-blower.
EIA 2010 Levelized Costs (cited in Model) U.S. Department of Energy. Energy Information Administration. Levelized
Cost of New Generation Resources in the Annual Energy Outlook 2011. Washington, DC: EIA, November 2010, at http://www.eia.gov/oiaf/aeo/electricity_generation.html, with link to http://www.eia.gov/oiaf/aeo/pdf/2016levelized_costs_aeo2011.pdf.

250
XIII. References
EIA AEO 2013 (cited in Model) U.S. Department of Energy. Energy Information Administration. Annual Energy
Outlook 2013, with Projections to 2040. (DOE/EIA-0383(2013)) Washington, DC: EIA, April 2015. Links at http://
www.eia.gov/forecasts/archive/aeo13/. Full report at http://www.eia.gov/forecasts/archive/aeo13/pdf/0383(2013).
pdf.
-- Table 3.2. Energy Prices by Sector and Source, Middle Atlantic, Reference case, from link at http://www.eia.gov/
forecasts/archive/aeo13/topic_prices.cfm.
EIA AEO 2015 U.S. Department of Energy. Energy Information Administration. Annual Energy Outlook 2015, with
Projections to 2040. (DOE/EIA-0383(2015)) Washington, DC: EIA, April 2015. Links at http://www.eia.gov/
forecasts/aeo and http://www.eia.gov/forecasts/aeo/tables_ref.cfm. Full report at http://www.eia.gov/forecasts/aeo/
pdf/0383(2015).pdf.
-- Table: Energy Prices by Sector and Source [Mid-Atlantic], at http://www.eia.gov/forecasts/aeo/data/
browser/#/?id=3-AEO2015®ion=1-2&cases=ref2015~lowprice&start=2012&end=2040&f=A&sourcekey=0v.
-- Levelized Cost and Levelized Avoided Cost of New Generation Resources in the Annual Energy Outlook 2015
(June 2015), at https://www.eia.gov/forecasts/aeo/pdf/electricity_generation.pdf. Running title: 2020 Levelized
Costs AEO 2015.
EIA Annual Coal Report 2015 U.S. Energy Information Administration. Annual Coal Report. Washington, DC:
Department of Energy, EIA, April 23, 2015, at http://www.eia.gov/coal/annual/. Data for 2013.
-- Table 2. Coal Production and Number of Mines by State, County, and Mine Type, 2013, at http://www.eia.gov/
coal/annual/xls/table2.xls.
EIA Corn Ethanol 2015 Corn ethanol yields continue to improve,” Today in Energy, (U.D. Energy Information
Administration) May 13, 2015, at https://www.eia.gov/todayinenergy/detail.cfm?id=21212.
EIA Crude Oil 2016 U.S. Energy Information Administration. U.S. Crude Oil First Purchase Price (Dollars
per Barrel). Washington, DC: EIA, Department of Energy, January 4, 2016, at http://www.eia.gov/dnav/pet/hist/
LeafHandler.ashx?n=PET&s=F000000__3&f=M. At head of title: Petroleum & Other Liquids.
EIA FAQ CO2 2013 (cited in Model) U.S. Department of Energy. Energy Information Administration. Frequently
Asked Questions: How much carbon dioxide (CO2) is produced per kilowatt-hour when generating electricity
with fossil fuels? Washington, DC: EIA, last updated: June 13, 2013, at http://www.eia.gov/tools/faqs/faq.
cfm?id=74&t=11.
EIA FAQ Lighting 2013 (cited in Model) U.S. Department of Energy. Energy Information Administration. Frequently
Asked Questions: How much electricity is used for lighting in the United States? Washington, DC: EIA, last updated:
January 9, 2013, at http://www.eia.gov/tools/faqs/faq.cfm?id=99&t=3.
EIA Gas Furnace Eiciency 2013 (cited in Model) U.S. Department of Energy. Energy Information Administration. “”Gas furnace eiciency has large implications for residential natural gas use,” Today in Energy, December 5, 2013.
Links at http://www.eia.gov/todayinenergy/detail.cfm?id=14051. “Principal contributor: Owen Comstock.”
EIA Natural Gas 2012 U.S. Department of Energy. Energy Information Administration. Regional Underground
Natural Gas Storage, Close of 2007. Washington, DC: EIA, April 12, 2012 (date from page info), at https://www.
eia.gov/pub/oil_gas/natural_gas/analysis_publications/ngpipeline/UGTable.html?title=&product=&submit2=A-Z+List+of+publications. At head of title: About U.S. Natural Gas Pipelines - Transporting Natural Gas based on data
through 2007/2008 with selected updates.
EIA Natural Gas 2016 U.S. Department of Energy. Energy Information Administration. Underground Natural Gas
Working Storage Capacity with Data for November 2015. Washington, DC: EIA, March 16, 2016, at http://www.
eia.gov/naturalgas/storagecapacity/, with link to 2015 map at http://www.eia.gov/cfapps/ngqs/images/storage_2015.
png. Main page superseded each year; archived, e.g., at http://www.eia.gov/naturalgas/storagecapacity/archive/2013/
index.cfm.
EIA Natural Gas Citygate 2015 U.S. Energy Information Administration. Natural Gas Citygate Price in Maryland.
Washington, DC: EIA, Department of Energy, December 31, 2015, at http://www.eia.gov/dnav/ng/hist/n3050md3m.
htm.

251
Prosperous, Renewable Maryland
EIA Natural Gas Wellhead 2016 U.S. Energy Information Administration. U.S. Natural Gas Wellhead Price. Washington, DC: EIA, Department of Energy, April 29, 2016, at https://www.eia.gov/dnav/ng/hist/n9190us3a.htm.
EIA RECS 2001 (cited in Model) U.S. Department of Energy. Energy Information Administration. End-Use
Consumption of Electricity 2001. Washington, DC: EIA, last modiied on 04/20/2009, at http://www.eia.gov/emeu/recs/recs2001/enduse2001/enduse2001.html. Based on Residential Energy Consumption Survey (RECS).
EIA RECS 2009 Data (cited in Model) U.S. Department of Energy. Energy Information Administration. Residential
Energy Consumption Survey (RECS): 2009 RECS Survey Data. Washington, DC: EIA, inal release date, May 6, 2013, at http://www.eia.gov/consumption/residential/data/2009/.
EIA RECS 2013 (cited in Model) U.S. Department of Energy. Energy Information Administration. Residential Energy
Consumption Survey (RECS). Washington, DC: DOE, [2013], at http://www.eia.gov/consumption/residential. Accessed August 28, 2013
EIA SEDS Consumption 2015 U.S. Department of Energy. Energy Information Administration. State Energy
Consumption Estimates: 1960 through 2013. (DOE/EIA-0214(2013)) Washington, DC: EIA, July 2015, at http://www.eia.gov/state/seds/sep_use/notes/use_print.pdf and http://www.eia.gov/state/seds/seds-data-complete.cfm?sid=US. Updated annually.
EIA SEDS Consumption 2016 U.S. Department of Energy. Energy Information Administration. State Energy
Consumption Estimates: 1960 Through 2014. (DOE/EIA-0214(2014)) Washington, DC: EIA, June 2016, at http://www.eia.gov/state/seds/sep_use/notes/use_print.pdf and http://www.eia.gov/state/seds/seds-data-complete.cfm?sid=US. Maryland is at http://www.eia.gov/state/seds/seds-data-complete.cfm?sid=MD. Updated annually. We used 2015 (1960-2013) version for 2013 data. -- Table CT3. Total End-Use Energy Consumption Estimates, Selected Years, 1960-2014, Maryland, at http://www.eia.gov/state/seds/data.cfm?incile=/state/seds/sep_use/tx/use_tx_MD.html&sid=MD. -- Table CT4. Residential Sector Energy Consumption Estimates, 1960-2014, Maryland, at http://www.eia.gov/state/seds/data.cfm?incile=/state/seds/sep_use/res/use_res_MD.html&sid=MD. -- Table CT5. Commercial Sector Energy Consumption Estimates, 1960-2014, Maryland, at http://www.eia.gov/state/seds/data.cfm?incile=/state/seds/sep_use/com/use_com_MD.html&sid=MD. -- Table CT6. Industrial Sector Energy Consumption Estimates, 1960-2014, Maryland, at http://www.eia.gov/state/seds/data.cfm?incile=/state/seds/sep_use/ind/use_ind_MD.html&sid=MD. -- Table CT7. Transportation Sector Energy Consumption Estimates, 1960-2013, Maryland, at http://www.eia.gov/state/seds/data.cfm?incile=/state/seds/sep_use/tra/use_tra_MD.html&sid=MD. -- Table CT8. Electric Power Sector Consumption Estimates, 1960-2013, Maryland, at http://www.eia.gov/state/seds/data.cfm?incile=/state/seds/sep_use/eu/use_eu_MD.html&sid=MD.
EIA SEDS Prices 2015 (cited in Model) U.S. Energy Information Administration. State Energy Price and
Expenditure Estimates: 1970 through 2013. (DOE/EIA-0376(2013)) Washington, DC: EIA, Department of Energy, July 2015, at http://www.eia.gov/state/seds/sep_prices/notes/pr_print.pdf, from link at http://www.eia.gov/state/seds/seds-data-complete.cfm. Updated annually. Available from IEER. -- Table E1. Primary Energy, Electricity, and Total Energy Price Estimates, 2013 -- Table E8. Primary Energy, Electricity, and Total Energy Expenditure Estimates, 2013 (Million Dollars), -- Table E10. Residential Sector Energy Expenditure Estimates, 2013 (Million Dollars). -- Table ET3. Residential Sector Energy Price and Expenditure Estimates, 1970-201x, Maryland (latest), at http://www.eia.gov/state/seds/data.cfm?incile=/state/seds/sep_prices/res/pr_res_MD.html&sid=MD). -- Table ET4. Commercial Sector Energy Price and Expenditure Estimates, 1970-2014, Maryland (latest), at http://www.eia.gov/state/seds/data.cfm?incile=/state/seds/sep_prices/com/pr_com_MD.html&sid=MD. -- Table ET5. Industrial Sector Energy Price and Expenditure Estimates, 1970-2014, Maryland (latest), at http://www.eia.gov/state/seds/data.cfm?incile=/state/seds/sep_prices/ind/pr_ind_MD.html&sid=MD.

252
XIII. References
EIA SEDS Production 2015 U.S. Energy Information Administration. State Energy Production Estimates 1960 through 2013. Washington, DC: Department of Energy, EIA, July 24, 2015, at https://www.eia.gov/state/seds/sep_
prod/SEDS_Production_Report.pdf, from link at https://www.eia.gov/state/seds/seds-data-complete.cfm. Updated
annually. . Available from IEER.
-- Table P2. Energy Production Estimates in Trillion Btu, 2013
EIA SEDS Production 2016 U.S. Energy Information Administration. State Energy Production Estimates 1960 Through 2014. Washington, DC: Department of Energy, EIA, June 24, 2016, at https://www.eia.gov/state/seds/sep_
prod/SEDS_Production_Report.pdf, from link at https://www.eia.gov/state/seds/seds-data-complete.cfm. Maryland
at https://www.eia.gov/state/seds/seds-data-complete.cfm?sid=MD. Updated annually.
-- Table PT2. Energy Production Estimates in Trillion Btu, Maryland, 1960 – 2014, at https://www.eia.gov/state/
seds/sep_prod/pdf/PT2_MD.pdf.
EIA States 2015 Maryland (cited in Model) U.S. Department of Energy. Energy Information Administration. State
Electricity Proiles: Maryland Electricity Proile 2013. Washington, DC: EIA, July 8, 2015. Links to each table on
the Web at http://www.eia.gov/electricity/state/maryland. Updated annually.
-- Table 2. Ten largest plants by generation capacity, 2013, at http://www.eia.gov/electricity/state/maryland/xls/
sept02md.xls.
-- Table 5. Electric power industry generation by primary energy source, 1990-2013, at http://www.eia.gov/
electricity/state/maryland/xls/sept05md.xls.
-- Table 8. Retail sales, revenue, and average retail price by sector, 1990-2013, at http://www.eia.gov/electricity/
state/maryland/xls/sept08md.xls.
-- Table 10. Supply and disposition of electricity, 1990-2013 (megawatthours), at http://www.eia.gov/electricity/
state/maryland/xls/sept10md.xls.
EIA Today in Energy 2013 U.S. Department of Energy. Energy Information Administration. “U.S. household
expenditures for gasoline account for nearly 4% of pretax income,” Today in Energy, February 4, 2013 (updated
Feb. 12 and 15), at http://www.eia.gov/todayinenergy/detail.cfm?id=9831.
EIA Today in Energy 2015 U.S. Department of Energy. Energy Information Administration. “EIA lowers crude
oil price forecast through 2016,” Today in Energy, August 19, 2015, at http://www.eia.gov/todayinenergy/detail.
cfm?id=22572.
EIA Today in Energy Oil 2015 U.S. Department of Energy. Energy Information Administration. “Sustained low oil
prices could reduce exploration and production investment,” Today in Energy, September 24, 2015, at http://www.
eia.gov/todayinenergy/detail.php?id=23072.
Encana 2011 Encana Corporation. Life of the Well. Calgary, Alberta: Encana, April 2011, at https://www.encana.
com/pdf/communities/usa/LifeOfTheWell2011.pdf.
Energy Democracy Alliance 2015 New York State Energy Democracy Alliance. Mission and Principles for the
Energy Democracy Alliance. “Working Draft” Adopted April 9th, 2015. [no place]: NYEDA, 2015, at http://
energydemocracyny.org/about.
Energy Eiciency Markets 2013 (cited in Model) Elisa Wood. “Why this Solar Project Is Not Like the Others: Maryland’s MicroGrid Play,” Energy Eiciency Markets, October 17, 2013, at http://www.energyeiciencymarkets.com/2013/10/17/solar-project-like-others-marylands-microgrid-play/
Energy Observer 2016 Energy Observer. Energy Observer: le premier navire hydrogène autour du monde. [St-Malo,
France]: Energy Observer, accessed September 29, 2016, at http://www.energy-observer.org/.
Energy Star GE Water Heater 2016 Energy Star. ENERGY STAR Certiied Water Heaters: GE - GeoSpring: GEH50DEEJSC. [Washington, DC: U.S. Environmental Protection; U.S. Department of Energy, accessed March 23,
2016, at http://www.energystar.gov/productinder/product/certiied-water-heaters/details/2230926.

253
Prosperous, Renewable Maryland
Energy Star Water Heaters 2016 Energy Star. ENERGY STAR Certiied Water Heaters. [Washington, DC]: U.S. Environmental Protection Agency, Energy Star, accessed February 4, 2016, at http://www.energystar.gov/productinder/product/certiied-water-heaters/. Spreadsheet at www.energystar.gov/productinder/download/certiied-water-heaters/.
Enertrag 2009 Enertrag. The ENERTRAG-Hybrid Power Plant. [Presented at 11th Steering Committee Meeting of the International Partnership for the Hydrogen Economy, Uluru, Australia, May 5-8, 2009.] [Dauerthal, Germany: Enertrag, 2009, at http://www.iphe.net/docs/Meetings/Australia_5-09/Germany%20-%20Enertrag.pdf, from link at http://www.iphe.net/events/meetings/SC_11.html.
Eos Energy Storage 2016 Eos Energy Storage. Eos Aurora: Grid-Scale Energy Storage. New York, Eos, accessed May 25, 2016, at http://www.eosenergystorage.com/products/. Brochure at www.eosenergystorage.com/wp-content/uploads/2016/05/Aegis-Brochure.pdf.
EPA 1993 (cited in Model) U.S. Environmental Protection Agency. Multiple Pathways to Super-Eicient Refrigerators. (EPA-430-R-93-008). Washington, DC: EPA, Oice of Atmospheric and Indoor Air Programs, June 1993, at http://nepis.epa.gov/Exe/ZyNET.exe/910181GB.TXT?ZyActionD=ZyDocument&Client=EPA&Index=1991+Thru+1994&Docs=&Query=&Time=&EndTime=&SearchMethod=1&TocRestrict=n&Toc=&TocEntry=&QField=&QFieldYear=&QFieldMonth=&QFieldDay=&IntQFieldOp=0&ExtQFieldOp=0&XmlQuery=&.
EPA 2004 U.S. Environmental Protection Agency. Unit Conversions, Emissions Factors, and Other Reference
Data. [Washington, DC: EPA], November 2004, at http://www.epa.gov/cpd/pdf/brochure.pdf.
EPA 2009 U.S. Environmental Protection Agency. Steam Electric Power Generating Point Source Category:
Final Detailed Study Report. (EPA 821-R-09-008) Washington, DC: EPA, October 2009, at https://www.epa.gov/sites/production/iles/2015-06/documents/steam-electric_detailed_study_report_2009.pdf.
EPA 2013 (cited in Model) U.S. Environmental Protection Agency. Proposed Eluent Guidelines for the Steam Electric Power Generating Category. [Washington, DC: EPA], last updated on September 18, 2013, at http://water.epa.gov/scitech/wastetech/guide/steam-electric/proposed.cfm.
EPA 2015 U.S. Environmental Protection Agency. Steam Electric Power Generating Eluent Guidelines - 2015 Final Rule. Washington, DC: EPA, September 2015; last updated January 29, 2016, at https://www.epa.gov/eg/steam-electric-power-generating-eluent-guidelines-2015-inal-rule, includes links to the Final Rule Federal
Register notice, at https://www.gpo.gov/fdsys/pkg/FR-2015-11-03/pdf/2015-25663.pdf.
EPA 2016 U.S. Environmental Protection Agency. Clean Air Act Overview: Air Pollution: Current and Future
Challenges. Washington, DC: EPA, last updated March 29, 2016, at https://www.epa.gov/clean-air-act-overview/air-pollution-current-and-future-challenges.
EPA Air Pollutants 2016 U.S. Environmental Protection Agency. Air Emissions Sources. Washington, DC: EPA, updated February 23, 2016, at https://www3.epa.gov/air/emissions/. -- Basic Information, at https://www3.epa.gov/air/emissions/basic.htm.
EPA AQI 2015 U.S. Environmental Protection Agency. Air Quality Index Report. Washington, DC: EPA, accessed on April 24, 2015, at http://www.epa.gov/airdata/ad_rep_aqi.html.
EPA Brandon Shores 2016 U.S. Environmental Protection Agency. Brandon Shores Power Plant: [from EPA’s
Risk Management Plan (RMP) Data]. Washington, DC: Right-To-Know Network, April 14, 2016, at http://data.rtknet.org/rmp/rmp.php?database=rmp&detail=3&datype=T&facility_id=100000175204. This search was done on April 14, 2016. It was compiled from government data last released on December 30, 2015. The data were obtained from the U.S. EPA’s Risk Management System database (RMP).
EPA CHP 2015 U.S. Environmental Protection Agency. Combined Heat and Power Partnership. Catalog of CHP
Technologies. [Washington, DC]: EPA, CHP, March 2015, at http://www.epa.gov/sites/production/iles/2015-07/documents/catalog_of_chp_technologies.pdf, from links at http://www.epa.gov/chp/chp-technologies.

254
XIII. References
EPA Climate Protection 2015 U.S. Environmental Protection Agency. Oice of Air and Radiation. Oice of Atmospheric Programs. Climate Protection Partnerships: 2013 Annual Report. Washington,
DC: EPA, OAR, January 2015, at https://www.energystar.gov/ia/partners/publications/pubdocs/
ENERGYSTAR_2013AnnualReport-508.pdf.
EPA CPP 2015 U.S. Environmental Protection Agency. “40 CFR Part 60: Carbon Pollution Emission Guidelines
for Existing Stationary Sources: Electric Utility Generating Units; Final Rule,” Federal Register, v. 80, no. 205
(October 23, 2015): pp. 64662-64964, at https://www.gpo.gov/fdsys/pkg/FR-2015-10-23/pdf/2015-22842.pdf, from
link at http://www2.epa.gov/cleanpowerplan/clean-power-plan-inal-rule. “[EPA–HQ–OAR–2013–0602; FRL–
9930–65– OAR] RIN 2060–AR33.” First issued by EPA on August 3, 2015. This rule is based on the Clean Air Act, Section 111(d).
EPA Criteria Air 2016 U.S. Environmental Protection Agency. Criteria Air Pollutants. Washington, DC: EPA, last
updated on March 30, 2016, at https://www.epa.gov/criteria-air-pollutants.
EPA GHG Data 2013 (cited in Model) U.S. Environmental Protection Agency. Global Greenhouse Gas Emissions
Data. [Washington, DC: EPA], last updated on September 09, 2013, at http://www.epa.gov/climatechange/
ghgemissions/global.html. “Climate Change”
EPA Heating 2015 U.S. Environmental Protection Agency. Renewable Industrial Process Heat.
(Renewable Heating and Cooling) Washington, DC: EPA, updated May 8, 2015, at https://www.epa.gov/rhc/
renewable-industrial-process-heat.
EPA Maryland Emissions Data 2016 U.S. Environmental Protection Agency. State and County Emission
Summaries: State Summary: Maryland. Washington, DC: EPA, accessed June 2, 2016 for 2011 data. On the Web
from links at https://www3.epa.gov/air/emissions/. Air Pollutions data.
-- CO: https://www3.epa.gov/cgi-bin/broker?_service=data&_debug=0&_program=dataprog.state_1.sas&pol=CO&stips=24
-- NOX https://www3.epa.gov/cgi-bin/broker?_service=data&_debug=0&_program=dataprog.state_1.
sas&pol=NOX&stips=24
-- PM 2.5 https://www3.epa.gov/cgi-bin/broker?_service=data&_debug=0&_program=dataprog.state_1.sas&pol=PM25_PRI&stips=24
-- SO2 https://www3.epa.gov/cgi-bin/broker?_service=data&_debug=0&_program=dataprog.state_1.
sas&pol=SO2&stips=24
-- VOCs https://www3.epa.gov/cgi-bin/broker?_service=data&_debug=0&_program=dataprog.state_1.sas&pol=VOC&stips=24.
EPA NO2 2016 U.S. Environmental Protection Agency. 2010 Primary National Ambient Air Quality Standards
(NAAQS) for Nitrogen Dioxide. Washington, DC: EPA, last updated October 5, 2016, at https://www.epa.gov/
no2-pollution/2010-primary-national-ambient-air-quality-standards-naaqs-nitrogen-dioxide.
EPA Nonroad Engines 2016 U.S. Environmental Protection Agency. Oice of Transportation and Air Quality. Nonroad Spark-Ignition Engines 19 Kilowatts and Below: Exhaust Emission Standards. (EPA-420-B-16-028)
Washington, DC: EPA, March 2016, at https://www.epa.gov/sites/production/iles/2016-03/documents/420b16028.pdf.
EPA PM 2016 U.S. Environmental Protection Agency. Particulate Matter (PM). Washington, DC: EPA, last updated
on 2/23/2016, at https://www3.epa.gov/airquality/particlepollution/.
EPA TENORM 2015 U.S. Environmental Protection Agency. TENORM: Oil and Gas Production Wastes.
Washington, DC: EPA, Oice of Radiation and Indoor Air, Radiation Protection Division, Last updated on October 29, 2015, at https://www.epa.gov/radiation/tenorm-oil-and-gas-production-wastes.
EPA Transportation 1996 U.S. Environmental Protection Agency. Oice of Mobile Sources. Nonroad Engines and
Air Pollution. (EPA 420-F-94-003; Fact Sheet OMS-20) Ann Arbor, MI: EPA National Vehicle and Fuel Emissions
Laboratory, May 1996, at https://www3.epa.gov/otaq/consumer/20-nonrd.pdf.

255
Prosperous, Renewable Maryland
EPA Transportation 2014 U.S. Environmental Protection Agency. Oice of Transportation and Air Quality. Near
Roadway Air Pollution and Health: Frequently Asked Questions. (EPA-420-F-14-044) Washington, DC: EPA, OTAQ, August 2014, at http://www3.epa.gov/otaq/documents/nearroadway/420f14044.pdf.
EPA Transportation 2015 U.S. Environmental Protection Agency. Cars, Trucks, Buses, and “Nonroad” Equipment. (The Plain English Guide to the Clean Air Act) Washington, DC: EPA, Oice of Transportation and Air Quality, last updated on 9/10/2015, at http://www.epa.gov/airquality/peg_caa/carstrucks.html.
EPA Uranium 2013 U.S. Environmental Protection Agency. Federal Actions to Address Impacts of Uranium
Contamination in the Navajo Nation: Five-Year Plan Summary Report. [Washington, DC: EPA]: January 2013, at http://www3.epa.gov/region9/superfund/navajo-nation/pdf/NavajoUraniumReport2013.pdf. “(EPA), along with the Bureau of Indian Afairs (BIA), the Nuclear Regulatory Commission (NRC), the Department of Energy (DOE), and the Indian Health Service (IHS) developed a coordinated Five-Year Plan to address uranium contamination in consultation with Navajo Nation.
EPA Water Reuse 2016 U.S. Environmental Protection Agency. Paciic Southwest, Region 9. Water Recycling and
Reuse: The Environmental Beneits. San Francisco: EPA Region 9, updated February 23, 2016, at https://www3.epa.gov/region9/water/recycling/.
Epley 2016a Cole Epley. “OPPD CEO: Shut down Fort Calhoun nuclear plant by end of the year,” Omaha World-
Herald, May 12, 2016, at http://www.omaha.com/money/oppd-ceo-shut-down-fort-calhoun-nuclear-plant-by-end/article_f8b86658-184e-11e6-b852-8f5144170b67.html.
Epley 2016b Cole Epley. “’Simply an Economic Decision’: OPPD to Close Fort Calhoun Nuclear Plant by End of 2016,” Omaha World-Herald, June 17, 2016, updated on June 22, 2016, at http://www.omaha.com/money/simply-an-economic-decision-oppd-to-close-fort-calhoun-nuclear/article_3fe6ce02-3352-11e6-a426-a7596287dd59.html.
EPRI 2011 Electric Power Research Institute. Estimating the Costs and Beneits of the Smart Grid: A Preliminary Estimate of the Investment Requirements and the Resultant Beneits of a Fully Functioning Smart Grid. (1022519) Palo Alto, CA: EPRI, March 2011, at https://www.smartgrid.gov/iles/Estimating_Costs_Beneits_Smart_Grid_Preliminary_Estimate_In_201103.pdf. “Final Report”
EPRI Cranes 2009 Electric Power Research Institute. Electric Ship to Shore Cranes: Costs and Beneits. (1020510) Palo Alto, CA: EPRI, December 2009. Abstract on the Web at http://www.epri.com/abstracts/pages/productabstract.aspx?ProductId=000000000001020510, with link to full report.
EPRI Electric Equipment 2013 Andra Rogers. EPRI Explores the Costs and Beneits of Electrifying Materials Handling Equipment (Excerpt from EPRI State of Technology 2013). Palo Alto, CA: Electric Power Research Institute, Summer 2013, at http://et.epri.com/Communications_epri-explores-the-costs-and-beneits-of-electrifying-material-handling-equipment.html.
EPRI Forklifts 2015 Electric Power Research Institute. Electric Forklifts. Palo Alto, CA: EPRI, April 2015, at http://www.epri.com/abstracts/pages/productabstract.aspx?productId=000000003002005805&Mode=download.
EV Obsession 2015 Zach. “Electric Car Sales To Hit 1 Million In September,” EV Obsession, August 7, 2015, at http://evobsession.com/electric-car-sales-to-hit-1-million-in-september/.
EWEA 2009 (cited in Model) European Wind Energy Association. The Economics of Wind Energy. Brussels: EWEA, March 2009, at http://www.ewea.org/ileadmin/ewea_documents/documents/00_POLICY_document/Economics_of_Wind_Energy__March_2009_.pdf.
Exelon About 2016 Exelon Corporation. About Exelon. Chicago: Exelon, accessed July 19, 2016, at http://www.exeloncorp.com/company/about-exelon.
Exelon Calvert Clifs 2016 Exelon Corporation. Calvert Clifs. Chicago, Exelon, accessed April 13, 2016, at http://www.exeloncorp.com/locations/power-plants/calvert-clifs.

256
XIII. References
Exelon Conowingo 2016 Exelon Corporation. Conowingo Hydroelectric Generating Station.
Chicago: Exelon, accessed February 19, 2016, at http://www.exeloncorp.com/locations/power-plants/
conowingo-hydroelectric-generating-station.
Exeter Associates 2013 (cited in Model) Exeter Associates, Inc. Avoided Energy Costs in Maryland: Assessment of
the Costs Avoided through Energy Eiciency and Conservation Measures in Maryland. Draft Report. Columbia,
MD: Exeter, November 2013. Prepared for Power Plant Research Program, Maryland Department of Natural
Resources.
Farrell et al. 2006 Alexander E. Farrell, Richard J. Plevin, Brian T. Turner, Andrew D. Jones, Michael O’Hare, and Daniel
M. Kammen. “Ethanol Can Contribute To Energy and Environmental Goals,” Science, v.311 (27 January 2006), pp.
506-508. Erratum published 23 June 2006, at http://nature.berkeley.edu/er100/readings/Farrell_2006_Ethanol.pdf.
Federal Poverty Level 2016 Parkview Medical Center. 2016 Federal Poverty Level Chart. Pueblo, CO: Parkview,
last modiied December 28, 2015, at https://www.parkviewmc.com/app/iles/public/1484/2016-Poverty-Level-Chart.pdf. Date from “Properties.” Alternate source: https://aspe.hhs.gov/computations-2016-poverty-guidelines.
Feldman 2016 Brian Feldman. “How much will the $35,000 Tesla Model 3 afect the American auto marketplace?,” Quora, April 2, [2016], at https://www.quora.com/
How-much-will-the-35-000-Tesla-Model-3-afect-the-American-auto-marketplace.
FERC 2015 Federal Energy Regulatory Commission. Oice of Energy Projects. Final Multi-Project Environmental
Impact Statement for Hydropower Licenses: Susquehanna River Hydroelectric Projects: York Haven Project—FERC
Project No. 1888-030–Pennsylvania, Muddy Run Project—FERC Project No. 2355-018–Pennsylvania, Conowingo
Project—FERC Project No. 405-106–Maryland/Pennsylvania. (FERC/FEIS-0255) Washington, DC: FERC,
OEP, Division of Hydropower Licensing, March 2015, at https://marylandassociationofcounties.iles.wordpress.com/2016/01/report-2015-03-ferc-environmental-impact-statement-for-conowingo-dam.pdf.
FERC PJM 2016 Federal Energy Regulatory Commission. Electric Power Markets: PJM. Washington, DC: FERC,
updated February 10, 2016, at http://www.ferc.gov/market-oversight/mkt-electric/pjm.asp.
Fichtner-Prognos 2013 (cited in Model) Jens Hobohm, Leonard Krampe, Frank Peter, Andree Gerken, Peter
Heinrich, and Maik Richter. Cost Reduction Potentials of Ofshore Wind Power in Germany. Short Version. Berlin:
Prognos AG; Stuttgart: The Fichtner Group, [2013], at http://www.ofshore-stiftung.com/60005/Uploaded/SOW_Download%7CEN_ShortVersion_CostReductionPotentialsofOfshoreWindPower.pdf. Commissioned by Stiftung
Ofshore-Windenergie and others.
Field 2015 Kyle Field. “A Look under the Hood at the BYD Electric Bus Factory,” Clean Technica, October 21,
2015, at http://cleantechnica.com/2015/10/21/look-hood-byd-electric-bus-factory/.
FrackCheckWV 2015 Duane Nichols. “The Accident Gas Storage Field in Western Maryland
is an Issue!” FrackCheckWV, June 18, 2015, at http://www.frackcheckwv.net/2015/06/18/
the-accident-gas-storage-ield-in-western-maryland-is-an-issue/.
Friends of the Earth (UK) 2013 Martin Attrill, et al. Marine Renewables, Biodiversity and Fisheries. London: Friends
of the Earth Trust; Plymouth: Plymouth Marine Institute, Plymouth University, June 2013, at https://www.foe.co.uk/
sites/default/iles/downloads/marine_renewables_biodiver.pdf.
Fuel Cell Bulletin 2013 “Pilot project launched for green hydrogen at BER airport in Berlin,” Fuel Cells Bulletin,
v. 2013, issue 1 (January 2013): pp. 6-7, at http://www.sciencedirect.com/science/article/pii/S1464285913700154.
News.
Fuel Cell Today 2013 “French Postal Service Testing Fuel Cell Range Extenders for Electric Delivery
Vehicles,” Fuel Cell Today, 10 December 2013, at http://www.fuelcelltoday.com/news-archive/2013/december/
french-postal-service-testing-fuel-cell-range-extenders-for-electric-delivery-vehicles.
Fujitsu 2013 (cited in Model) Fujitsu General America, Inc. Mini-Split Air Conditioners and Heat Pumps for
Residential and Light Commercial Applications. Fairield, NJ: Fujitsu, 2013, at http://www.fujitsugeneral.com/
PDF_06/halcyon06_brochure.pdf. At head of title: Halcyon. Halcyon is a trademark of Fujitsu General Limited.

257
Prosperous, Renewable Maryland
Funke, Gnann, and Plötz 2015 Simon Árpád Funke, Till Gnann, and Patrick Plötz (Fraunhofer Institute for Systems and Innovation Research). “Addressing the Diferent Needs for Charging Infrastructure: An Analysis of Some Criteria for Charging Infrastructure Set-up.” IN E-Mobility in Europe: Trends and Good Practice, Editors: Walter Leal Filho and Richard Kotter (Springer International, Basel?, Switzerland, 2015), pp. 73-90. Chapter at http://www.isi.fraunhofer.de/isi-wAssets/docs/e/de/publikationen/Funke2015_Adressing-the-diferent-needs-for-charging-infrastructure.pdf. Book available at http://www.springer.com/us/book/9783319131931?token=prtst0416p.
General Electric 2013 (cited in Model) GE Appliances. GeoSpring™ hybrid electric water heater;
GEH50DEEDSR. [Pittsburgh?]: General Electric Company, accessed December 7, 2013, at http://products.geappliances.com/ApplProducts/Dispatcher?REQUEST=SpecPage&Sku=GEH50DEEDSR.
Goldstein 2011 David Goldstein. “The Low-Hanging Fruit ... That Keeps Growing Back,” Switchboard (Natural Resources Defense Council Staf Blog), August 26, 2011, at http://switchboard.nrdc.org/blogs/dgoldstein/post_1.html.
Green Car Congress 2016 “New UMTRI paper reviews major advantages and disadvantages of battery-electric and fuel-cell vehicles,” Green Car Congress, 1 February 2016, at http://www.greencarcongress.com/2016/02/20160201-umtri.html. Cites Schoettle and Sivak 2016. Table found at http://bioage.typepad.com/.a/6a00d8341c4fbe53ef01b7c80fa7f0970b-popup.
Gregor 2015 Alison Gregor. “The Passive House in New York,” New York Times, March 27, 2015, at http://www.nytimes.com/2015/03/29/realestate/the-passive-house-in-new-york-city.html.
GRID Alternatives 2016 GRID Alternatives. Mid-Atlantic. Oakland, CA: GRID Alternatives, accessed June 29, 2016, at http://www.gridalternatives.org/midatlantic.
Guillén 2015 Alex Guillén. “Obama curbs ethanol in blow to corn growers,” Politico, 11/30/15, at http://www.politico.com/story/2015/11/breaking-news-epa-scales-back-ethanol-mandate-in-gasoline-216270.
Hamilton 2008 Tyler Hamilton. A Concrete Fix to Global Warming: A new process stores carbon dioxide in precast concrete, MIT Technology Review, July 23, 2008, at https://www.technologyreview.com/s/410499/a-concrete-ix-to-global-warming/.
Hanley 2015 Stephen Hanley. “Solar Power Windows Ready for Production,” Green Building Elements, September 5, 2015, at http://greenbuildingelements.com/2015/09/05/solar-power-windows-ready-for-production/.
Hansen et al. 2008 James Hansen, Makiko Sato, Pushker Kharecha, David Beerling, Robert Berner, Valerie Masson-Delmotte, Mak Pagani, Maureen Raymo, Dana L. Royer, and James C. Zachos. “Target Atmospheric CO
2: Where Should Humanity Aim?,” The Open Atmospheric Science Journal, v. 2 (2008): pp. 217-
231, at http://pubs.giss.nasa.gov/docs/2008/2008_Hansen_etal_1.pdf.
Hansen et al. 2016 James Hansen, Makiko Sato, Paul Hearty, Reto Ruedy, Maxwell Kelley, Valerie Masson-Delmotte, Gary Russell, George Tselioudis, Junji Cao, Eric Rignot, Isabella Velicogna, Blair Tormey, Bailey Donovan, Evgeniya Kandiano, Karina von Schuckmann, Pushker Kharecha, Allegra N. Legrande, Michael Bauer, and Kwok-Wai Lo. “Ice melt, sea level rise and superstorms: evidence from paleoclimate data, climate modeling, and modern observations that 2 oC global warming could be dangerous,” Atmospheric Chemistry and Physics, v. 16 (March 22, 2016): pp 3761-3821, at http://www.atmos-chem-phys.net/16/3761/2016/acp-16-3761-2016.pdf.
Healey 2013 James R. Healey. “Report: Average price of new car hits record in August,” USA Today, September 5, 2013, at http://www.usatoday.com/story/money/cars/2013/09/04/record-price-new-car-august/2761341.
Heaney and Keith 2016 Jim Heaney and Charlotte Keith. “SolarCity slashes Bufalo factory commitment,” Investigative Post, May 13, 2016, at http://www.investigativepost.org/2016/05/13/solarcity-slashes-bufalo-jobs-commitment/
Hernandez 2013 Mari Hernandez. Solar Power to the People: The Rise of Rooftop Solar Among the Middle Class. Washington, DC: Center for American Progress, October 21, 2013, at https://www.americanprogress.org/issues/green/report/2013/10/21/76013/solar-power-to-the-people-the-rise-of-rooftop-solar-among-the-middle-class/, with link to http://cdn.americanprogress.org/wp-content/uploads/2013/10/RooftopSolarv2.pdf.

258
XIII. References
Hirose et al. 2013 Keiichi Hirose, Toyonari Shimakage, James T. Reilly, and Hiroshi Irie. The Sendai Microgrid
Operational Experience in the Aftermath of the Tohoku Earthquake: A Case Study. Kawasaki City, Kanagawa,
Japan: New Energy and Industrial Technology Development Organization (NEDO), 2013, at https://www.smart-
japan.org/english/vcms_cf/iles/The_Operational_Experience_of_Sendai_Microgrid_in_the_Aftermath_of_the_Devastating_Earthquake_A_Case_Study.pdf. Running title: NEDO Microgrid Case Study.
Hledik, Chang, and Lueken 2016 Ryan Hledik, Judy Chang, Roger Lueken. The Hidden Battery: Opportunities
in Electric Water Heating. This report was prepared for the National Rural Electric Cooperative Association
(NRECA), the Natural Resources Defense Council (NRDC), and the Peak Load Management Alliance (PLMA).
Cambridge, MA: Brattle Group, January 2016, at http://www.nreca.coop/wp-content/uploads/2016/02/The-Hidden-
Battery-01-25-2016.pdf.
Hobohm et al. 2013 Jens Hobohm, Leonard Krampe, Frank Peter (Prognos), Andree Gerken, Peter Heinrich,
and Maik Richter (Fichtner). Cost Reduction Potentials of Ofshore Wind Power in Germany. Short Version. Varel:
German Ofshore Wind Energy Foundation, 2013, at http://www.ofshore-stiftung.com/60005/Uploaded/SOW_Download%7CEN_ShortVersion_CostReductionPotentialsofOfshoreWindPower.pdf.
Horrigan and Duggan 2015 John B. Horrigan and Maeve Duggan. Home Broadband 2015: The share of
Americans with broadband at home has plateaued and more rely only on their smartphones for online access.
Washington, DC: Pew Research Center, December 21, 2015, at http://www.pewinternet.org/iles/2015/12/Broadband-adoption-full.pdf.
Hu et al. 2015 Jenny Hu, Shayle Kann, James Tong, and Jon Wellinghof. “Grid Neutrality,” Fortnightly, October
2015, at http://mag.fortnightly.com/article/Grid+Neutrality/2291514/276011/article.html.
Huber 2012 Lisa Huber. Utility-Scale Wind and Natural Gas Volatility: Uncovering the Hedge Value of Wind For
Utilities and Their Customers. Snowmass, CO: Rocky Mountain Institute, July 2012, at http://www.rmi.org/cms/
Download.aspx?id=6485&ile=2012-07_WindNaturalGasVolatility.pdf.
Humphries 2016 Courtney Humphries. “How Afordable Housing is Driving Passive House Design.” Architect, September 14, 2016, at http://www.architectmagazine.com/practice/
how-afordable-housing-is-driving-passive-house-design_o.
Hydrogen House 2016 Hydrogen House Project. The Hydrogen House. Hopewell, NJ: The Project, last updated
January 6, 2016, at http://hydrogenhouseproject.org/the-hydrogen-house.html. Date from “Page Info.” Developed by Mike Strizki.
ICAX Projects 2016 ICAX. Solar Powered District Heating. London: ICAX Ltd, accessed March 25, 2016,
at http://www.icax.co.uk/ICAX_Projects.html, http://www.icax.co.uk/image_Renewable_Heat.html. (schematic
drawing) & http://www.icax.co.uk/images/solar_heat_transferred.jpg. Title from “page info.”
ICAX ThermalBanks 2016 ICAX. ThermalBanks™ Store Heat Between Seasons. London: ICAX Ltd, accessed
March 25, 2016, at http://www.icax.co.uk/ThermalBanks.html, with links to http://www.icax.co.uk/image_
thermalbank_installation.html or http://www.icax.co.uk/images/howesitelg.jpg (photo)
Icynene 2016 Icynene, Inc. Major Sources of Air Leaks. Mississauga, Ontario: Icynene, accessed April 29, 2016, at
http://www.insulationsmart.com/stop_major_energy_loss.htm & http://www.insulationsmart.com/images/Major_
Air_Leaks_House.gif.
ILO 2012 Karin Lundgren. The global impact of e-waste: Addressing the challenge. Geneva: International
Labour Oice, Programme on Safety and Health at Work and the Environment (SafeWork), Sectoral Activities Department (SECTOR), 2012, at http://www.ilo.org/wcmsp5/groups/public/@ed_dialogue/@sector/documents/
publication/wcms_196105.pdf.

259
Prosperous, Renewable Maryland
IPCC5 Mitigation 2014 Intergovernmental Panel on Climate Change. Climate Change 2014: Mitigation of Climate
Change. Working Group III Contribution to the Fifth Assessment Report of the Intergovernmental Panel on Climate Change. Edited by Ottmar Edenhofer, Ramón Pichs-Madruga, Youba Sokona, E. Farahani, S. Kadner, K. Seyboth, A. Adler, I. Baum, S. Brunner, P. Eickemeier, B. Kriemann, J. Savolainen, S. Schlömer, C. von Stechow, T. Zwickel, and J.C. Minx. New York: Cambridge University Press, 2014, at https://www.ipcc.ch/pdf/assessment-report/ar5/wg3/ipcc_wg3_ar5_full.pdf, from links at http://mitigation2014.org/. Includes Summary for Policymakers (SPM). -- SPM, Summary for Policymakers, at http://www.ipcc.ch/pdf/assessment-report/ar5/wg3/ipcc_wg3_ar5_summary-for-policymakers.pdf.
IPCC5 Physical Science 2013 Intergovernmental Panel on Climate Change. Climate Change 2013: The Physical
Science Basis. Working Group I Contribution to the Fifth Assessment Report of the Intergovernmental Panel on Climate Change. Edited by T.F. Stocker, D. Qin, G.-K. Plattner, M. Tignor, S.K. Allen, J. Boschung, A. Nauels, Y. Xia, V. Bex and P.M. Midgley. Cambridge; New York: Cambridge University Press, October 2013, at www.climatechange2013.org/images/report/WG1AR5_ALL_FINAL.pdf (366 MB), from link at http://www.ipcc.ch/report/ar5/wg1/. Errata at www.climatechange2013.org/images/report/WG1AR5_Errata_11122015.pdf. -- Chapter 8, at http://www.ipcc.ch/pdf/assessment-report/ar5/wg1/WG1AR5_Chapter08_FINAL.pdf.
IPCC5 Synthesis 2014 Intergovernmental Panel on Climate Change. Climate Change 2014: Synthesis Report. Contribution of Working Groups I, II and III to the Fifth Assessment Report of the Intergovernmental Panel on Climate Change Core Writing Team, R.K. Pachauri, and L.A. Meyer (eds.). Geneva, Switzerland, IPCC, 2015, at http://ar5-syr.ipcc.ch/ipcc/ipcc/resources/pdf/IPCC_SynthesisReport.pdf, from links at http://www.ipcc.ch/report/ar5/syr/. --Summary for Policymakers: https://www.ipcc.ch/pdf/assessment-report/ar5/syr/AR5_SYR_FINAL_SPM.pdf.
IRS Pub 946 (2014) (cited in Model) U.S. Department of the Treasury. Internal Revenue Service. Publication 946 (2014), How To Depreciate Property. Washington, DC: IRS, accessed December 20, 2015, at https://www.irs.gov/publications/p946/. -- 4. Figuring Depreciation Under MACRS, at https://www.irs.gov/publications/p946/ch04.html#en_US_2013_publink1000107513.
IRS Pub 946 (2015) U.S. Department of the Treasury. Internal Revenue Service. Publication 946 (2015), How To Depreciate Property. Washington, DC: IRS, accessed October 7, 2016, at https://www.irs.gov/publications/p946/. -- 4. Figuring Depreciation Under MACRS, at https://www.irs.gov/publications/p946/ch04.html.
Itron 2010 (cited in Model) Itron, Inc. Maryland Baseline Study – Commercial and Industrial Sectors. Oakland, CA: Itron, December 3, 2010.
Itron NEBs 2014 (cited in Model) Itron, Inc. Development and Application of Select Non-Energy Beneits for the EmPOWER Maryland Energy Eiciency Programs. Silver Spring, MD: Itron, August 5, 2014, at http://webapp.psc.state.md.us/newIntranet/casenum/NewIndex3_VOpenFile.cfm?ilepath=C:%5CCasenum%5C9300-9399%5C9362%5CItem_45%5C%5C9153-57-NonEnergyBeneitsReport-Itron-022415.pdf, from link at http://webapp.psc.state.md.us/newIntranet/casenum/CaseAction_new.cfm?CaseNumber=9362. Case No. 9362. Item no. 45. “ML 164454”
James, Moton, and Colella 2014 (cited in Model) Brian D. James, Jennie M. Moton, and Whitney G. Colella. Mass Production Cost Estimation of Direct H
2 PEM Fuel Cell Systems for Transportation Applications: 2013
Update. Arlington, VA: Strategic Analysis Inc., January 2014, at http://energy.gov/sites/prod/iles/2014/11/f19/fcto_sa_2013_pemfc_transportation_cost_analysis.pdf, from a link at http://energy.gov/eere/fuelcells/downloads/mass-production-cost-estimation-direct-h2-pem-fuel-cell-systems.
Jensen et al. 2015 Richard Jensen, Jason Stamp, John Eddy, Jordan Henry, Karina Munoz-Ramos, and Tarek Abdallah. Methodology for Preliminary Design Of Electrical Microgrids. (Sandia Report; SAND2015-8433) Albuquerque, NM: Sandia National Laboratories, September 30, 2015, at http://prod.sandia.gov/techlib/access-control.cgi/2015/158433.pdf.

260
XIII. References
KEMA 2011 Draft KEMA Inc. Maryland Energy Baseline Study: Residential Sector. Fairfax, VA: KEMA,
February 23, 2011, at http://webapp.psc.state.md.us/Intranet/CaseNum/NewIndex3_VOpenFile.cfm?ilepath=%5C%5CColdfusion%5CEWorkingGroups%5CDRDG%5C%5C2012%20EmPOWER%20Plans%5CBGE%20Draft%20
Plan%5C4-20-11%20Supporting%20Material%5CKEMA_ResBaseline_Draft_022311%20vf.docx. Watermark says
“Draft.”
Kenward and Raja 2014 Alyson Kenward and Urooj Raja. Blackout: Extreme Weather, Climate Change and Power
Outages. Princeton, NJ: Climate Central, April 2014, at http://assets.climatecentral.org/ pdfs/PowerOutages.pdf.
Date from “Properties.”
Kim, Baer, and Brown 2013 Gyungwon Kim, Paul Baer, and Marilyn A. Brown. The Statewide Job Generation
Impacts of Expanding Industrial CHP. Conference Paper presented at 2013 American Council for an Energy-
Eicient Economy (ACEEE), Summer Study on Energy Eiciency in Industry, July 23-26, 2013, Niagara Falls, NY. Atlanta: Climate and Energy Policy Laboratory, Georgia Institute of Technology, June 10, 2013, at http://cepl.gatech.
edu/sites/default/iles/attachments/ACEEE_Kim-Baer-Brown_061013.inal_.posting.pdf.
King 2016 Danny King. “Tesla surpasses the 300-mile single-charge range barrier,” AutoBlog, April 26, 2016, at
http://www.autoblog.com/2016/04/26/tesla-model-s-300-mile-epa-range/.
Kurtz, Sprik, and Alkire 2014 Jennifer Kurtz, Sam Sprik, and Jim Alkire. National Fuel Cell Technology
Evaluation Center (NFCTEC) [Webinar Slides]. [Washington, DC]: U.S. Department of Energy. Oice of Energy Eiciency and Renewable Energy, March 11, 2014, at http://energy.gov/sites/prod/iles/2014/04/f15/fcto_webinarslides_nfctec_031114.pdf. Date from URL.
Lazar 2014 Jim Lazar. Electric Utility Residential Customer Charges and Minimum Bills: Alternative Approaches
for Recovering Basic Distribution Costs. Montpelier, VT: Regulatory Assistance Project (RAP)™, November 2014,
at https://www.raponline.org/document/download/id/7361. Publication date from “Properties.”
Lazar Webinar 2014 Jim Lazar. Electric Rate Design: Introductory Principles, Residential Rate Design.
Montpelier, VT: Regulatory Assistance Project (RAP)™, November 2014, at https://www.raponline.org/document/
download/id/7357.
Lazard 2015 Lazard. Lazard’s Levelized Cost of Energy Analysis - Version 9.0. [New York: Lazard Ltd. Global Power, Energy & Infrastructure Group], November 2015, at https://www.lazard.com/media/2390/lazards-levelized-
cost-of-energy-analysis-90.pdf, from a link at https://www.lazard.com/perspective/levelized-cost-of-energy-
analysis-90/. Executive summary is at https://www.lazard.com/media/2392/lazard-s-levelized-cost-of-energy-
analysis-90-key-indings.pdf.
LBNL 2008 Lawrence Berkeley National Laboratory. DC Power Distribution Cuts Data Center Energy Use.
(Technical Brief; CEC-500-2008-042) Sacramento: California Energy Commission, Public Interest Energy Research
Program, PIER Buildings Program, October 2008, at http://www.energy.ca.gov/2008publications/CEC-500-2008-
042/CEC-500-2008-042-FS.PDF or https://datacenters.lbl.gov/sites/all/iles/DC%20Power_PIER%20Brief_2008.pdf.
LBNL 2010 Energy Saver (cited in Model) Lawrence Berkeley National Laboratory. Home Energy Saver:
Engineering Documentation. Appendix D - Normalized Hourly Factors. [Berkeley, CA]: LBNL, [2010?], at https://
sites.google.com/a/lbl.gov/hes-public/Home-Energy-Saver/calculation-methodology/appendices/appendix-d/
EnduseHourlyFactors.pdf, from link at https://sites.google.com/a/lbl.gov/hes-public/Home-Energy-Saver/
calculation-methodology/appendices/appendix-d. Accessed July 5, 2013. Table heading: Normalized Hourly factor
by Enduse by Daytype and Month (Normalized Hourly factor = Avg Weekday energy * Hour factor).
LBNL 2013 Washers (cited in Model) Lawrence Berkeley National Laboratory. Energy Eiciency Standards Group. Residential: Clothes Washers. Berkeley: Environmental Energy Technologies Division, LBNL, University
of California, U.S. Department of Energy, 2013, at http://ees.lbl.gov/product/clothes-washers. Accessed August 29,
2013.

261
Prosperous, Renewable Maryland
LBNL 2014 Andrew Satchwell, Andrew Mills, Galen Barbose. Financial Impacts of Net-Metered PV on Utilities
and Ratepayers: A Scoping Study of Two Prototypical U.S. Utilities. Prepared for the Oice of Energy Eiciency and Renewable Energy, Solar Energy Technologies Oice, U.S. Department of Energy. Contributing Authors: Ryan Wiser, Peter Cappers, Naїm Darghouth. Berkeley CA: Environmental Energy Technologies Division, Lawrence Berkeley National Laboratory, September 2014, at http://emp.lbl.gov/sites/all/iles/LBNL%20PV%20Business%20Models%20Report_no%20report%20number%20%28Sept%2025%20revision%29.pdf. September 25, 2014 revision.
LBNL Indoor Pollution 2015 Nasim A. Mullen, Jina Li, Marion L. Russell, Michael Spears, Brennan D. Less, and Brett C. Singer. Results of the California Healthy Homes Indoor Air Quality Study of 2011-2013: Impact of Natural
Gas Appliances on Air Pollutant Concentrations. (LBNL-185629) Berkeley, CA: Lawrence Berkeley National Laboratory, Energy Technologies Area, January 2015, at https://homes.lbl.gov/sites/all/iles/lbnl-185629.pdf. Running title: IAQ impacts of gas appliances in California homes.
LiftsRUs.com 2016 “Electric Forklift versus Internal Combustion Forklift Comparison Guide,” LiftsRUs.com, accessed January 21, 2016, at http://www.liftsrus.com/InfoDocs/Forklift_Comparison_Guide.html.
Link Transit 2016 Link Transit. “Link Transit Orders First 4 BYD Electric Buses,” Business Wire, March 22, 2016, at http://www.businesswire.com/news/home/20160322006635/en/. Press release.
Livrinc 2015 Damon Lavrinc. “Elon Musk Says Tesla Model 3 Will Cost $35,000 Before Incentives,” Jalopnik, January 13, 2015, at http://jalopnik.com/elon-musk-says-model-3-will-cost-35-000-before-incent-1679351127.
LLNL 2015 Lawrence Livermore National Laboratory. Estimated U.S. Energy Use in 2014: ~98.3 Quads. (LLNL-MI-410527) Livermore, CA: LLNL, 2015, at https://lowcharts.llnl.gov/content/assets/docs/2014_United-States_Energy.pdf.
LNS et al. 2015 Labor Network for Sustainability, 350.org, and Synapse Energy Economics. The Clean Energy Future:
Protecting the Climate, Creating Jobs, Saving Money. [Washington, DC]: LNS, 350, and Synapse, [2015?], at http://www.labor4sustainability.org/wp-content/uploads/2015/10/cleanenergy_10212015_main.pdf, from link at http://climatejobs.labor4sustainability.org/national-report/. Frank Ackerman (Synapse) led the research team. Publication date from URL.
Lochbaum 2016 David Lochbaum. “Nuclear power in the future: risks of a lifetime,” Bulletin of the Atomic Scientists, 24 February 2016, at http://thebulletin.org/nuclear-power-future-risks-lifetime9185.
Lucas 2015 Kevin Lucas. EmPOWER and RPS Progress Update. [Annapolis]: Maryland Energy Administration, May 21, 2015, at http://www.mde.state.md.us/programs/Marylander/Documents/MWGHandout3MEA05212015.pdf.
Maine PUC 2015 Clean Power Research and Sustainable Energy Advantage. Maine Distributed Solar Valuation
Study. Presented to: The Joint Standing Committee on Energy, Utilities and Technology, 127th Maine Legislature. Hallowell, ME: Maine Public Utilities Commission, March 1, 2015, at http://www.maine.gov/tools/whatsnew/attach.php?id=639056&an=1, from link at http://www.maine.gov/mpuc/legislative/archive/2014-2015ReportstoLegislature.shtml. ES, v. I & II by Clean Power Research; v. III by Sustainable Energy Advantage.
Makhijani 2001 Arjun Makhijani. Plutonium End Game: Managing Global Stocks of Separated Weapons-Usable
Commercial and Surplus Nuclear Weapons Plutonium. Takoma Park, MD: Institute for Energy and Environmental Research, January 2001, at http://ieer.org/resource/reports/plutonium-end-game/.
Makhijani 2010 Arjun Makhijani. Carbon-Free and Nuclear-Free: A Roadmap for U.S. Nuclear Policy. 3rd printing. Takoma Park, MD: IEER Press, 2010, at http://ieer.org/wp/wp-content/uploads/2007/08/CFNF.pdf, from link at http://ieer.org/projects/carbon-free-nuclear-free/. (First published in 2007. Reprinted in 2010, including the corrections made in the 2008 printing)
Makhijani 2012 Arjun Makhijani. “Opinion: May 5 could mark new beginning for Japan with reactor shutdown,” Kyodo News, May 14, 2012, at http://english.kyodonews.jp/news/2012/05/157816.html.

262
XIII. References
Makhijani 2015 Arjun Makhijani. Comments of the Institute for Energy and Environmental Research (IEER) on the
Application to the Maryland Public Service Commission regarding the Exelon Proposal to Acquire PHI (Case
Number 9361). Takoma Park, MD: IEER, February 16, 2015, at http://ieer.org/wp/wp-content/uploads/2015/02/
IEER-comments-on-Exelon-Pepco-merger-to-the-Maryland-PSC-2015-02-16-Case-9361-corrected-17-Feb.pdf,
with link from http://ieer.org/resource/testimony/comments-exelon-pepco-merger/. Reiled with minor corrections February 17, 2015.
Makhijani and Gurney 1995 Arjun Makhijani and Kevin R. Gurney. Mending the Ozone Hole: Science,
Technology, and Policy. Cambridge, MA: MIT Press, 1995.
Makhijani and Mills 2015 Arjun Makhijani and Christina Mills. Energy Eicient and Pollution-Free Space Heating and Cooling in Maryland: A report from the Renewable Maryland Project of the Institute for Energy and Environmental
Research (IEER). Takoma Park, MD: Institute for Energy and Environmental Research, February 24, 2015, at http://
ieer.org/wp/wp-content/uploads/2015/02/RenMD-Space-Conditioning-Feb2015.pdf, from a link at http://ieer.org/
resource/energy-issues/energy-eicient-pollution-free/.
Makhijani and Ramana 2014 Arjun Makhijani and M.V. Ramana. Comments by the Institute for Energy and
Environmental Research on the 2014 Proposed Clean Power Plan of the U.S. Environmental Protection Agency.
Takoma Park, MD: Institute for Energy and Environmental Research, December 1, 2014. Resubmitted, with
corrections, to the EPA on December 8, 2014, at http://ieer.org/wp/wp-content/uploads/2014/12/2014-12-01-
IEER-Comments-EPA-CPP-inal-corrections-2014-12-08.pdf, from link at http://ieer.org/resource/testimony/ieer-
comments-epa-proposed-clean/. Docket EPA-HQ-OAR-2013-0602.
Makhijani Paris Agreement blog 2015 Arjun Makhijani. “The Paris Agreement on Climate — A
Good Start, But…,” Arjun’s Science and Democracy Blog, December 14, 2015, at http://ieer.org/news/
paris-agreement-climate-good-start.
Makhijani Reprocessing 2010 Arjun Makhijani. The Mythology and Messy Reality of Nuclear Fuel Reprocessing.
Takoma Park, MD: Institute for Energy and Environmental Research, April 8, 2010, at http://ieer.org/resource/
reports/mythology-messy-reality-nuclear/.
Makhijani, Hu, and Yih 2000 Arjun Makhijani, Howard Hu, and Katherine Yih, eds. Nuclear Wastelands: A
Global Guide to Nuclear Weapons Production and Its Health and Environmental Efects. By a Special Commission
of International Physicians for the Prevention of Nuclear War and the Institute for Energy and Environmental
Research. Cambridge, MA: MIT Press, 2000. Links at https://mitpress.mit.edu/books/nuclear-wastelands.
Makhijani, Mills, and Makhijani 2015 Arjun Makhijani, Christina Mills, and Annie Makhijani. Energy Justice
in Maryland’s Residential and Renewable Energy Sectors: A report of the Renewable Maryland Project. Takoma
Park, MD: Institute for Energy and Environmental Research, October 2015, at http://ieer.org/wp/wp-content/
uploads/2015/10/RenMD-EnergyJustice-Report-Oct2015.pdf, from a link at http://ieer.org/resource/energy-issues/
energy-justice-marylands-residential/.
Makhijani, Mills, and Ramana 2012 Arjun Makhijani, Christina Mills, and M.V. Ramana. Renewable
Minnesota: A technical and economic analysis of a 100% renewable energy-based electricity system for Minnesota.
Takoma Park, Maryland: Institute for Energy and Environmental Research, March 13, 2012, at http://ieer.org/wp/
wp-content/uploads/2012/03/renewableminnesota.pdf, with a link from http://ieer.org/resource/electricity-grid/
renewable-minnesota-technical.
Malik 2015 Naureen Malik. “California Utility to Make Gas from Solar for Pipeline Storage,” Bloomberg Business,
April 13, 2015, at http://www.bloomberg.com/news/articles/2015-04-13/california-utility-to-make-gas-from-solar-
for-pipeline-storage. Journal title from “Page Info.”
Marine Insight 2016 Anish Wankhede. “Top 5 Zero Emission Ship Concepts of the Shipping World,” Marine Insight, July 21, 2016, at http://www.marineinsight.com/green-shipping/top-5-zero-emission-ship-concepts/

263
Prosperous, Renewable Maryland
Maryland AEP 2012 Maryland. Public Service Commission. Staf. Afordable Energy Program (“AEP”) Proposal. Before the Public Service Commission, In the Matter of Low-Income Energy-Related Customer Arrearages and Bill Assistance Needs of Maryland: PC 27 [Public Conference PC 27]. Baltimore: PSC, November 1, 2012, at http://webapp.psc.state.md.us/Intranet/AdminDocket/NewIndex3_VOpenFile.cfm?ServerFilePath=C%3A%5CAdminDocket%5CPublicConferences%5CPC27%5C12.pdf, from link at http://webapp.psc.state.md.us/intranet/AdminDocket/CaseAction_new.cfm?CaseNumber=PC27. Item No. 12 on the Docket of PC 27. “ML143460.”
Maryland AG Electricity 2016 Maryland. Attorney General. Choosing Your Residential Electricity Supplier. Baltimore, AG, accessed October 7, 2016, at http://www.marylandattorneygeneral.gov/Pages/CPD/energy.aspx.
Maryland at a Glance Land 2015 Maryland. State Archives. Maryland at a Glance: Land. (Maryland Manual On-Line). Annapolis: Archives, September 29, 2015, at http://msa.maryland.gov/msa/mdmanual/01glance/html/area.html.
Maryland Bureau of Mines 2014 Maryland. Department of the Environment. Ninety-Second Annual Report of the
Maryland Bureau of Mines 2013. Prepared by Land Management Administration, Mining Program. Prepared for The Maryland General Assembly. Baltimore: MDE, October 2014, at http://mde.maryland.gov/programs/Land/mining/Coal%20Mining/Documents/Bureau%20of%20Mines%20Documents/Annual%20Reports%20volume%202/2013_92nd%20Annual%20Report%20for%20the%20Maryland%20Bureau%20of%20Mines.pdf.
Maryland Bureau of Mines Coal Division 2016 Maryland. Bureau of Mines. Coal Division. Maryland Bureau of
Mines Coal Division. Baltimore: Department of the Environment, Bureau of Mines Coal Division, accessed January 26, 2016, at http://mde.maryland.gov/programs/Land/mining/Coal%20Mining/Pages/Programs/LandPrograms/mining/BOM/index.aspx. Image at http://mde.maryland.gov/programs/Land/mining/Coal%20Mining/PublishingImages/Coalields.jpg.
Maryland Clean Energy Jobs 2016 (vetoed) Maryland. General Assembly. Clean Energy Jobs – Renewable Energy
Portfolio Standard Revisions. [Annapolis, GAM], 2016, at http://mgaleg.maryland.gov/2016RS/bills/sb/sb0921T.pdf, from link at http://mgaleg.maryland.gov/webmga/frmMain.aspx?pid=billpage&stab=01&id=sb0921&tab=subject3&ys=2016RS or http://mgaleg.maryland.gov/webmga/frmMain.aspx?pid=billpage&stab=03&id=hb1106&tab=subject3&ys=2016rs. Vetoed May 27, 2016. From Senate Bill 921 and House Bill 1106.
Maryland EVIC 2016 Maryland Electric Vehicle Infrastructure Council. About the Council. Hanover, MD: EVIC, Maryland Department of Transportation, accessed on April 20, 2016, at http://www.mdot.maryland.gov/newMDOT/Planning/Electric_Vehicle/About_the_Council.html.
Maryland GGRA 2009 Maryland. Greenhouse Gas Emissions Reduction Act of 2009. Reproduced at http://www.mde.state.md.us/programs/Air/ClimateChange/Documents/2011%20Draft%20Plan/A_GGRA_Act.pdf. “Chapter 171.” Published as Appendix A to Maryland’s Plan to Reduce Greenhouse Gas Emissions (December 31, 2011).
Maryland GGRA 2016 Maryland. General Assembly. Greenhouse Gas Emissions Reduction Act – Reauthorization. In 2016 Laws of Maryland, Chapter 11 [Annapolis: GAM], 2016, at http://mgaleg.maryland.gov/2016RS/chapters_noln/Ch_11_sb0323T.pdf, from link at from link at http://mgaleg.maryland.gov/webmga/frmMain.aspx?id=SB0323&stab=01&pid=billpage&tab=subject3&ys=2016RS. From Senate Bill 323 and House Bill 610. Signed on April 4, 2016.
Maryland GHG Inventory 2001 Maryland. Department of the Environment. Air and Radiation Management Administration. Maryland Greenhouse Gas Emissions Inventory 1990. Baltimore: MDE, ARMA, April 2001, at http://www.mde.state.md.us/assets/document/Air/1990%20Greenhouse%20Gas%20Inventory.pdf. Title page reads: Maryland Greenhouse Gas Emmissions Inventory 1990.
Maryland GHG Inventory 2011 Maryland. Department of the Environment. Air and Radiation Management Administration. Maryland Greenhouse Gas Emissions Inventory Documentation: Base Year, Projection Years. Draft. Baltimore: MDE, ARMA, April 6, 2011, at http://mde.maryland.gov/programs/Air/ClimateChange/Documents/Documentation%20FINAL.pdf.

264
XIII. References
Maryland GHG Inventory 2012 Maryland. Department of the Environment. Greenhouse Gas Inventory. Baltimore,
MDE, [2012?], at http://www.mde.state.md.us/programs/Air/ClimateChange/Pages/GreenhouseGasInventory.aspx.
-- Maryland 2006 Base Year Inventory, at http://www.mde.state.md.us/programs/Air/ClimateChange/Documents/
MD_Base_Year_Inventory.xls. -- Maryland 2011 Base Year Inventory, at http://www.mde.state.md.us/programs/Air/ClimateChange/
Documents/2011%20Base%20Year%20Inventory/MD_Base_Year_Inventory%202011_MD_GHG_FINAL.xls.
Maryland Healthy Air Act (cited in Model) Maryland. Department of the Environment. The Maryland Healthy Air Act.
Baltimore: MDE, [2008?], at http://www.mde.maryland.gov/programs/air/pages/md_haa.aspx.
Maryland Ofshore Wind 2013 Maryland. General Assembly. Maryland Ofshore Wind Energy Act of 2013. In 2013
Laws of Maryland, Chapter 3. [Annapolis: GAM], 2013, at http://mgaleg.maryland.gov/2013RS/chapters_noln/
Ch_3_hb0226E.pdf. From House Bill 226. Signed on April 9, 2013.
Maryland OPC 2010 Maryland. Oice of the People’s Counsel. The Oice of People’s Counsel’s Response to the Governor’s Comments. Before The Public Service Commission Of Maryland: In The Matter Of The Commission’s
Investigation Of Investor-Owned Electric Companies’ Standard Ofer Service For Residential And Small Commercial Customers In Maryland: Case No. 9117; In The Matter Of Whether New Generating Facilities Are
Needed To Meet Long-Term Demand For Standard Ofer Service: Case No. 9214. Baltimore: OPC, January 15, 2010, at http://www.opc.state.md.us/LinkClick.aspx?ileticket=k3shESXsF4U%3D&tabid=138.
Maryland PPRP 2010 Patrick Flynn, Julie Ross, Robert Sawyer, Connie Faustini, Brandie Sebastian, Steve Harriott,
Peter Hall. Environmental Review of Morgantown Coal Blending/Gypsum Loadout Project. (PPSE-M-03; DNR
12-1132010-436) Annapolis: Maryland Department of Natural Resources, Power Plant Research Program, January
2010, at http://dlslibrary.state.md.us/publications/Exec/DNR/PPRP/ERMCBGLP_2010.pdf.
Maryland PSC 2015 Maryland. Public Service Commission. Order No. 86990. In the Matter of the Merger of Exelon Corporation and Pepco Holdings, Inc. Case Number 9361. Baltimore: PSC, May 15, 2015, at
http://webapp.psc.state.md.us/newIntranet/Casenum/NewIndex3_VOpenFile.cfm?ServerFilePath=C:\Casenum\9300-9399\9361\\271.pdf, from link at http://167.102.231.189/search-results/?keyword=9361&x.x=19&x.y=18&search=all&search=case. Item 271. (ML 168525)
Maryland PSC 2016 Maryland. Public Service Commission. Report on the Status of Net Energy Metering In the
State of Maryland. Baltimore: PSC, January 2016, at http://www.psc.state.md.us/wp-content/uploads/2015-MD-
PSC-Report-on-the-Status-of-Net-Metering-Report.pdf. Prepared for the General Assembly of Maryland Under
Public Utilities Article §7-306(h).
Maryland PSC BGE 2013 Maryland. Public Service Commission. Order No. 85374: In the Matter of the Application
of Baltimore Gas and Electric Company for Adjustment in Its Electric and Gas Base Rates. Case No. 9299.
Baltimore: PSC, February 22, 2013, at http://webapp.psc.state.md.us/Intranet/Casenum/NewIndex3_VOpenFile.
cfm?ServerFilePath=C:\Casenum\9200-9299\9299\\78.pdf, from a link at http://www.psc.state.md.us/search-
results/?keyword=9299&x.x=26&x.y=10&search=all&search=case. Item 78. (ML 145589)
Maryland PSC EmPOWER 2015 Maryland. Public Service Commission. Order No. 87082. In the Matter of the
Potomac Edison Company D/B/A Allegheny Power’s Energy Eiciency, Conservation and Demand Response Programs Pursuant to the Empower Maryland Energy Eiciency Act of 2008, [etc.]. Baltimore: PSC, July 16, 2015.
Link on the Web at http://webapp.psc.state.md.us/newIntranet/Casenum/CaseAction_new.cfm?CaseNumber=9153.
(Case Number: 9153, Item 625) leads to http://webapp.psc.state.md.us/newIntranet/Casenum/NewIndex3_
VOpenFile.cfm?ServerFilePath=C:\Casenum\9100-9199\9153\\625.pdf. Also at http://167.102.231.189/wp-content/
uploads/Order-No.-87082-Case-Nos.-9153-9157-9362-EmPOWER-MD-Energy-Eiciency-Goal-Allocating-and-Cost-Efectiveness.pdf. Case Nos. 9153-9157, 9362 – EmPOWER MD – Energy Eiciency Goal Allocating and Cost Efectiveness: Baltimore Gas And Electric Company (9154), Potomac Electric Power Company (9155), Delmarva Power & Light Company (9156), Southern Maryland Electric Cooperative, Inc. (9157), Washington Gas
Light Company (9362). (ML 171275)

265
Prosperous, Renewable Maryland
Maryland PSC EmPOWER 2016 Maryland. Public Service Commission. The EmPOWER Maryland Energy Eiciency Act Standard Report of 2016 With Data for Compliance Year 2015, In compliance with Section 7-211 of the Public Utilities Article, Annotated Code of Maryland. Baltimore, MD: PSC, April 2016, at http://www.psc.state.md.us/wp-content/uploads/2016-EmPOWER-Maryland-Energy-Eiciency-Act-Standard-Report.pdf.
Maryland PSC Fund 2013 (cited in Model) Maryland. Public Service Commission. Notice of Procedural Schedule to
Address Customer Investment Fund. In the Matter of the Merger of Exelon Corporation and Constellation Energy Group, Inc., Case No. 9271. April 12, 2012, at http://webapp.psc.state.md.us/Intranet/casenum/NewIndex3_VOpenFile.cfm?ServerFilePath=C:\Casenum\9200-9299\9271\\289.pdf, from link at http://webapp.psc.state.md.us/Intranet/casenum/CaseAction_new.cfm?CaseNumber=9271. Item 289. “(ML 138395)”
Maryland PSC Grid 2016 Maryland. Public Service Commission. Notice of Public Conference. In the Matter of Transforming Maryland’s Electric Distribution Systems to Ensure that Electric Service is Customer-Centered, Afordable, Reliable and Environmentally Sustainable in Maryland, Public Conference No. 44 (PC44). September 26, 2016, at http://webapp.psc.state.md.us/newIntranet/AdminDocket/NewIndex3_VOpenFile.cfm?ServerFilePath=C%3A%5CAdminDocket%5CPublicConferences%5CPC44%5C1%2Epdf, from link at http://www.psc.state.md.us/search-results/?keyword=PC44&x.x=22&x.y=16&search=all&search=rulemaking. Item 1.
Maryland PSC Plan 2013 Maryland. Public Service Commission. Ten-Year Plan (2011 – 2021) of Electric Companies
in Maryland. Prepared for the Maryland Department of Natural Resources In compliance with Section 7-201 of the Maryland Public Utilities Article. Baltimore, PSC, April 2013, at http://webapp.psc.state.md.us/Intranet/Reports/TYP2021.pdf from http://webapp.psc.state.md.us/Intranet/psc/Reports_new.cfm.
Maryland PSC Plan 2014 Maryland. Public Service Commission. Ten-Year Plan (2014 – 2023) of Electric Companies
in Maryland. Prepared for the Maryland Department of Natural Resources In compliance with Section 7-201 of the Maryland Public Utilities Article. Baltimore, PSC, August 2014, at http://webapp.psc.state.md.us/intranet/Reports/2014%20-%202023%20TYP%20Final.pdf, from http://webapp.psc.state.md.us/Intranet/psc/Reports_new.cfm.
Maryland PSC RM56 2015-2016 Maryland. Public Service Commission. Revisions to COMAR 20.62 - Community Solar Energy Generation Systems. (Admin Docket Number [Rulemaking] RM56) Baltimore: PSC, 2015+, at http://webapp.psc.state.md.us/intranet/AdminDocket/CaseAction_new.cfm?CaseNumber=RM56.
Maryland PSC RPS 2016 Maryland. Public Service Commission. Maryland Renewable Energy Portfolio Standard
Program – Frequently Asked Questions. Baltimore: PSC, accessed May 5, 2016, at http://www.psc.state.md.us/electricity/maryland-renewable-energy-portfolio-standard-program-frequently-asked-questions/.
Maryland Public Utilities Statute 2015 Maryland. General Assembly. Code of Maryland (Statutes): Article - Public
Utilities, at http://mgaleg.maryland.gov/2016rs/statute_google/gpu/gpu.pdf (modiied 11-13-2015, per “Properties”). --§7-701 and following sections at http://mgaleg.maryland.gov/webmga/frmStatutesText.aspx?article=gpu§ion=7-701&ext=html&session=2016RS&tab=subject5, by clicking Next. Accessed July 21, 2016.
Maryland RPS 2007 Maryland. General Assembly. Electricity – Net Energy Metering – Renewable Energy
Portfolio Standard –Solar Energy. In 2007 Laws of Maryland, Chapter 119. [Annapolis: GAM], 2007, at http://mgaleg.maryland.gov/2007RS/chapters_noln/Ch_119_sb0595E.pdf, from link at http://mgaleg.maryland.gov/webmga/frmMain.aspx?ys=2007RS%2fbillile%2fsb0595.htm. From Senate Bill 595. Signed on April 24, 2007.
Maryland Senate Bill 714 (2015) General Assembly of Maryland. GAM-SB0714 Summary 2015 Regular Session:
Maryland Electric Vehicle Infrastructure Council - Reporting and Sunset Extension. Annapolis, GAM, [as of returned pass on April 11, 2015, in the Maryland Senate], at http://mgaleg.maryland.gov/webmga/frmMain.aspx?id=sb0714&stab=01&pid=billpage&tab=subject3&ys=2015RS. Approved by the Governor: May 12, 2015.

266
XIII. References
Maryland State Data Center 2014 Maryland State Data Center. [Website]. Baltimore: Maryland Department of
Planning, MSDC, at http://www.mdp.state.md.us/msdc/.
-- Projections Tab: Projections to 2040: Population and Households (7/14): Household Projections, formerly from
link at http://www.mdp.state.md.us/msdc/S3_Projection.shtml. Links also found at -- Projections by Topics, at http://
www.mdp.state.md.us/msdc/projection/projectionsbyTopic.Shtml. Some projections revised in January 2015. Links
to www.mdp.state.md.us/msdc/popproj/HouseholdProj.pdf.
-- Historical and Projected Total Population for Maryland’s Jurisdictions - Annualized Growth Rates (Revisions,
July 2014), at http://www.mdp.state.md.us/msdc/popproj/TotalPopProj.pdf.
-- Historical and Projected Households for Maryland’s Jurisdictions (Revisions, July 2014), at http://planning.
maryland.gov/msdc/popproj/HouseholdProj.xlsx.
Maryland StateStat 2013 (Ctied in Model) Maryland StateStat. 2012 Electricity Generation by Source in Maryland.
Annapolis, Oice of the Governor, StateStat, [2013], at https://data.maryland.gov/Energy-and-Environment/2012-
Electricity-Generation-by-Source-in-Maryland/3gfp-ncwp. Accessed November 20, 2013. “The energy source for all
electricity generated in Maryland from 1990 through 2012. Numbers are in megawatt-hours (MWh).”
Mathew et al. 2016 Roy Mathew, Sheila Ray, Swagata Som, Gurcharan Singh Matharu, Tania Martinez
Navedo, Thomas Koshy, and Kenneth Miller. 2.206 Petition on Current Operating Nuclear Power Plants - Open Phase Conditions in Electronic Power System which Lead to Loss of Safety Functions of Both Ofsite and Onsite Power Systems (NRC Bulletin 2012-01). Addressed to Executive Director of Operations, United States Nuclear
Regulatory Commission. [February 19, 2016, per NRC ADAMS database], at http://static1.squarespace.com/
static/54aac5e4e4b0b6dc3e1f6866/t/56d74f0104426214f2d2a2de/1456951044331/20160200-2-206-petition-open-
phase-conditions-ML16050A223.pdf. A variant, addressed to Annette L. Vietti-Cook, Secretary of the Commission,
is at http://www.nrc.gov/docs/ML1605/ML16050A223.pdf.
Matocha 2011 gmatochautube. “GE Geospring hybrid hot water heater review - in depth,” YouTube, December 8,
2011, at https://www.youtube.com/watch?v=vKCsvRxpj2g. Video
McCabe 2013 (cited in Model) Joseph McCabe. “First Solar Won the Race; The Environment Lost, Alternative
Energy Stocks (aka Alt Energy Stocks), August 25, 2013, at http://www.altenergystocks.com/archives/2013/08/
irst_solar_won_the_race_the_environment_lost_1.html.
MCCC 2015 Maryland Commission on Climate Change. Maryland Commission on Climate Change. Prepared for
Larry Hogan, Governor, State of Maryland and the Maryland General Assembly. [Baltimore?]: MCCC, December
2015, at http://www.mde.state.md.us/programs/Marylander/Documents/MCCC2015FinalReport.pdf.
MCEC 2015 Coalition for Green Capital. Growing the Maryland Clean Energy Economy: Green Bank Study. Final
Report. Delivered to the Maryland General Assembly. Annapolis: Maryland Clean Energy Center, December 1,
2015, at http://mdcleanenergy.org/sites/default/iles/Report%20-%20Draft%20FINAL%203%20PM%2011.30.pdf.
McKinsey 2009 Hannah Choi Granade, Jon Creyts, Anton Derkach, Philip Farese, Scott Nyquist, and Ken Ostrowski.
Unlocking Energy Eiciency in the U.S. Economy. [U.S.]: McKinsey&Company, McKinsey Global Energy and
Materials, July 2009, at https://buildinginformationmanagement.iles.wordpress.com/2009/08/us_energy_eiciency_full_report.pdf.
McMahon 2012 (cited in Model) James E. McMahon (Better Climate Research & Policy Analysis). “Energy
Eiciency is a Renewable Resource,” IN Fueling Our Future with Eiciency, [Proceedings of the] 2012 ACEEE
Summer Study on Energy Eiciency in Buildings, Asilomar Conference Center, Paciic Grove, CA, August 12, 2012 - August 17, 2012, pp. 13-227 to 13-235. Washington, DC: American Council or an Energy-Eicient Economy, 2012, at http://www.aceee.org/iles/proceedings/2012/data/papers/0193-000411.pdf, from link at http://aceee.org/
iles/proceedings/2012/start.htm.
McMahon 2013 Jef McMahon. “New-Build Nuclear Is Dead: Morningstar,” Forbes, November 10, 2016, at http://
www.forbes.com/sites/jefmcmahon/2013/11/10/new-build-nuclear-is-dead-morningstar/#78aa38327fe4.
MDEV 2016 Maryland Electric Vehicle. Incentives. [Baltimore?]: MDEV, accessed April 20, 2016, at http://
marylandev.org/resources/incentives/#.

267
Prosperous, Renewable Maryland
Meyers et al. 2010 (cited in Model) Steve Meyers, Victor H. Franco, Alex B. Lekov, Lisa Thompson, and Andy Sturges. Do Heat Pump Clothes Dryers Make Sense for the U.S. Market? Presented at 2010 ACEEE Summer Study on Energy Eiciency in Buildings. Berkeley, CA: Lawrence Berkeley National Laboratory, Environmental Energy Technologies Division, August 2010, at http://www.aceee.org/iles/proceedings/2010/data/papers/2224.pdf & at http://eetd.lbl.gov/sites/all/iles/do_heat_pump_clothes_dryers_make_sense_for_the_us_market.pdf.
Miller et al. 2013 (cited in Model) Scot M. Miller, Steven C. Wofsy, Anna M. Michalak, Eric A. Kort, Arlyn E. Andrews, Sebastien C. Biraud, Edward J. Dlugokencky, Janusz Eluszkiewicz, Marc L. Fischer, Greet Janssens-Maenhout, Ben R. Miller, John B. Miller, Stephen A. Montzka, Thomas Nehrkorn, and Colm Sweeney. “Anthropogenic emissions of methane in the United States,” PNAS Early Edition, November 2013. Links at http://www.pnas.org/content/early/2013/11/20/1314392110.abstract. “Proceedings of the National Academy of Sciences”
Mirant Chalk Point 2009 Mirant Corporation. Chalk Point Generating Plant. [Atlanta, GA]: Mirant, accessed December 16, 2009, at http://pbadupws.nrc.gov/docs/ML1004/ML100481066.pdf. PDF created from html ile in 2009.
Mirant Morgantown 2009 Mirant Corporation. Morgantown Generating Plant. [Atlanta, GA]: Mirant, accessed December 28, 2009, at http://pbadupws.nrc.gov/docs/ML1004/ML100481086.pdf. PDF created from html ile in 2009.
Mittal 2015 Smiti Mittal. “3 Solar Cell Eiciency Records In Just 4 Days,” Clean Technica, May 1, 2015, at http://cleantechnica.com/2015/05/01/3-solar-cell-eiciency-records-just-4-days/.
Monitoring Analytics 2015 (2016) Monitoring Analytics. State of the Market Report for PJM: 2015. Eagleville, PA: MA, March 10, 2016, at http://www.monitoringanalytics.com/reports/PJM_State_of_the_Market/2015.shtml. --v. 2: Detailed Analysis, at http://www.monitoringanalytics.com/reports/PJM_State_of_the_Market/2015/2015-som-pjm-volume2.pdf.
Monitoring Analytics 2016 Monitoring Analytics. State of the Market Report for PJM: January through June
[2016]. Eagleville, PA: MA, August 11, 2016, at http://www.monitoringanalytics.com/reports/PJM_State_of_the_Market/2016/2016q2-som-pjm.pdf.
Multpl.com 2013 (cited in Model) “US Real GDP by Year,” multpl.com, accessed November 26, 2013, at http://www.multpl.com/us-gdp-inlation-adjusted/table.
Multpl.com 2016 “GDP Delator,” multpl.com, accessed October 16, 2016, at http://www.multpl.com/gdp-delator/.
Naam Solar 2015 Ramez Naam. How Cheap Can Solar Get? Very Cheap Indeed. [Seattle?]: Naam, August 10, 2015, at http://rameznaam.com/2015/08/10/how-cheap-can-solar-get-very-cheap-indeed/.
Naam Storage 2015 Ramez Naam. How Cheap Can Energy Storage Get? Pretty Darn Cheap. [Seattle?]: Naam, October 14, 2015, at http://rameznaam.com/2015/10/14/how-cheap-can-energy-storage-get/.
Nace 2010 Ted Nace. “Which has a bigger footprint, a coal plant or a solar farm?,” Grist, November 18, 2010, at http://grist.org/article/2010-11-17-which-has-bigger-footprint-coal-plant-or-solar-farm/.
NASA 2015 Peter Merlin. LEAPTech to Demonstrate Electric Propulsion Technologies. Washington, DC: National Aeronautics and Space Administration. March 16, 2015, at http://www.nasa.gov/centers/armstrong/Features/leaptech.html.
NASA 2016 Jay Levine. Piloted, Electric Propulsion-Powered Experimental Aircraft Underway. [Edwards, CA]: National Aeronautics and Space Administration, Armstrong Flight Research Center, February 8, 2016; last updated March 15, 2016, at http://www.nasa.gov/centers/armstrong/features/sceptor.html.
Navigant 2009 (cited in Model) Navigant Consulting, Inc. Energy Savings Potential and R&D Opportunities for Commercial Refrigeration: Final Report. Submitted to U.S. Department of Energy, Energy Eiciency and Renewable Energy, Building Technologies Program. Chicago: Navigant, September 23, 2009, at http://apps1.eere.energy.gov/buildings/publications/pdfs/corporate/commercial_refrig_report_10-09.pdf.

268
XIII. References
NCSG 2016 National Center for Smart Growth Research & Education. Maryland Statewide Transportation Model.
College Park: NCSG, University of Maryland, accessed February 112, 2016, at http://www.smartgrowth.umd.edu/
statetransportationmodel.html.
NEI 2014 Nuclear Energy Institute. Nuclear Energy 2014: Status and Outlook: Annual Brieing for the Financial Community. Washington, DC: NEI, February 13, 2014, at http://www.nei.org/CorporateSite/media/ilefolder/Policy/Wall%20Street/WallStreetBrief2014slides.pdf.
NEI 2016 Nuclear Energy Institute. Nuclear Energy 2016: Status and Outlook: Annual Brieing for the Financial Community. Washington, DC: NEI, February 11, 2016, at http://www.nei.org/CorporateSite/media/ilefolder/Policy/Wall%20Street/WallStreetBrieing2016Slides.pdf?ext=.pdf.
NOAA 2013 National Oceanic and Atmospheric Administration. National Climatic Data Center. Quality Controlled
Local Climatological Data. QCLCD (2.5.4) [cdo_prod]. Asheville, NC: NOAA, NCDC, [2013], at http://cdo.ncdc.
noaa.gov/qclcd/QCLCD?prior=N, from link at http://www.ncdc.noaa.gov/data-access/land-based-station-data/land-
based-datasets/quality-controlled-local-climatological-data-qclcd. Accessed August 2013.
NOAA 2016 James H. Butler and Stephen A. Montzka. The NOAA Annual Greenhouse Gas Index (AGGI). Boulder,
CO: U.S. Department of Commerce, National Oceanic and Atmospheric Administration, Earth System Research
Laboratory, Global Monitoring Division, updated Spring 2016, at http://www.esrl.noaa.gov/gmd/aggi/aggi.html.
Noel and McCormack 2014 Lance Noel and Regina McCormack. “A Cost Beneit Analysis of a V2G-Capable Electric School Bus Compared to a Traditional Diesel School Bus,” Applied Energy, v. 126 (August 2014): pp. 246-
265, at http://www.udel.edu/V2G/resources/V2G-Cost-Beneit-Analysis-Noel-McCormack-Applied-Energy-As-Accepted.pdf and http://www.sciencedirect.com/science/article/pii/S0306261914003420.
Norway Oil Fund 2016 Norges Bank Investment Management. About the Fund. Oslo: NBIM, October 10, 2011, at
http://www.nbim.no/en/the-fund/about-the-fund/.
NRC 2016 U.S. Nuclear Regulatory Commission. Open Phase Conditions in Electric Power Systems. Washington,
DC: NRC, last reviewed/updated April 15, 2016, at http://www.nrc.gov/reactors/operating/ops-experience/open-
phase-electric-systems.html.
NRC Information Digest 2015 U.S. Nuclear Regulatory Commission. 2015-2016 Information Digest. (NUREG-1350, Volume 27) Washington, DC: NRC Oice of Public Afairs, August 2015, at http://www.nrc.gov/
reading-rm/doc-collections/nuregs/staf/sr1350.
NRC PWR 2015 U.S. Nuclear Regulatory Commission. Pressurized Water Reactor (PWR) Schematic. Washington, DC:
NRC, last updated on September 8, 2015, at http://www.nrc.gov/reading-rm/basic-ref/students/for-educators/pwr-
schematic.html.
NRDC 2011 (cited in Model) David Denkenberger, Serena Mau, Chris Calwell, and Eric Wanless (Ecova,
Durango, CO). Residential Clothes Dryers: A Closer Look at Energy Eiciency Test Procedures and Savings Opportunities. [San Francisco]: Natural Resources Defense Council, November 9, 2011, at http://www.appliance-
standards.org/sites/default/iles/NRDC_Ecova_dryer_study_0.PDF. Running title: A Further Investigation of Dryer
Energy Test Procedures & Savings.
NRDC 2013 (cited in Model) Natural Resources Defense Council. NRDC’s Response to CEC’s Invitation
to Participate in the Development of Appliance Energy Eiciency Measures: 2013 Appliance Eiciency Pre-Rulemaking on Appliance Eiciency Regulations: Docket Number 12‐AAER‐2D ‐ Commercial Clothes Dryers. Submitted by: Meg Waltner. San Francisco: NRDC, May 9, 2013, at http://www.energy.ca.gov/
appliances/2013rulemaking/documents/responses/Commercial_Clothes_Dryers_12-AAER-2D/NRDC_Comments_
in_Response_to_CEC_Invitation_to_Participate_2013-05-09_TN-70722.pdf. Includes: Appendix A = Paul Bendt, Chris Calwell, and Laura Mooreield. Residential Clothes Dryers: An Investigation of Energy Eiciency Test Procedures and Savings Opportunities, Final Draft, [Portland, OR.]: Ecos [now Ecova], November 6, 2009.

269
Prosperous, Renewable Maryland
NRDC 2016 Alexandra Zissu. How to Tackle Fracking in Your Community: Stand up to oil and natural gas
companies using this three-pronged approach. New York: Natural Resources Defense Council, January 27, 2016, at https://www.nrdc.org/stories/how-tackle-fracking-your-community.
NREL 2006 (cited in Model) Paul Denholm. Creating Baseload Wind Power Systems Using Advanced
Compressed Air Energy Storage Concepts. CU Energy Initiative/NREL Symposium, University of Colorado, Boulder. (NREL/PO-640-40674) Golden, CO: National Renewable Energy Laboratory, October 3, 2006, at www.nukefreetexas.org/downloads/nrel_baseload_wind_100306.pdf.
NREL 2008 Paul Denholm and Robert Margolis. Supply Curves for Rooftop Solar PV-Generated Electricity for
the United States. (Technical Report NREL/TP-6A0-44073) Golden, CO: National Renewable Energy Laboratory, November 2008, at www.nrel.gov/docs/fy09osti/44073.pdf.
NREL 2009 Paul Denholm, Maureen Hand, Maddalena Jackson, and Sean Ong. Land-Use Requirements of
Modern Wind Power Plants in the United States. (Technical Report; NREL/TP-6A2-45834) Golden, CO: National Renewable Energy Laboratory, August 2009, at http://www.nrel.gov/docs/fy09osti/45834.pdf.
NREL 2011 Jordan Macknick, Robin Newmark, Garvin Heath, and K.C. Hallett. A Review of Operational Water
Consumption and Withdrawal Factors for Electricity Generating Technologies. (Technical Report NREL/TP-6A20-50900) Golden, CO: National Renewable Energy Laboratory, March 2011, at http://www.nrel.gov/docs/fy11osti/50900.pdf.
NREL 2013 Sean Ong, Clinton Campbell, Paul Denholm, Robert Margolis, and Garvin Heath. Land-Use
Requirements for Solar Power Plants in the United States. (Technical Report; NREL/TP-6A20-56290) Golden, CO: National Renewable Energy Laboratory, June 2013, at http://www.nrel.gov/docs/fy13osti/56290.pdf.
NREL and AWS Truepower 2015 National Renewable Energy Laboratory and AWS Truepower. Estimates of Land
Area and Wind Energy Potential, by State, for areas >= 35% Capacity Factor at 80, 110, and 140m. [Golden, CO: NREL], February 2015, at http://apps2.eere.energy.gov/wind/windexchange/docs/wind_potential_80m_110m_140m_35percent.xlsx.
NREL Eastern Wind 2015 National Renewable Energy Laboratory. Transmission Grid Integration. Obtaining the Eastern
Wind Dataset. Golden, CO: NREL, last updated May 6, 2015, at http://www.nrel.gov/electricity/transmission/eastern_wind_dataset.html, with link to http://www.nrel.gov/electricity/transmission/docs/eastern_wind_dataset_site_summary.xlsx (including 9 onshore Maryland sites). Main page formerly at http://www.nrel.gov/electricity/transmission/eastern_wind_dataset.html. -- Eastern Wind Integration Data Set (accessed on 2016-09-30). Latest is at http://www.nrel.gov/grid/eastern-wind-data.html. (Which says the data is as of 2012. Links here to reports. -- 2009, Development of Eastern Regional Wind Resource and Wind Plant Output Datasets: March 3, 2008 — March 31, 2010. Michael Brower, www.nrel.gov/docs/fy10osti/46764.pdf. -- 2011, Eastern Wind Integration and Transmission Study, www.nrel.gov/docs/fy11osti/47078.pdf. -- Data Sets, at https://maps.nrel.gov/wind-prospector/#/?aL=1N8iNG%255Bv%255D%3Dt&bL=groad&cE=0&lR=0&mC=41.80407814427234%2C-95.361328125&zL=4.
NREL Hydropower 2004 National Renewable Energy Laboratory. Hydropower: Setting a Course for our Energy
Future. (DOE/GO-102004-1981) Golden, CO: NREL for DOE EERE, July 2004, at http://www.nrel.gov/docs/fy04osti/34916.pdf. Produced for the Oice of Wind and Hydropower Technologies, Oice of Energy Eiciency and Renewable Energy, U.S. Department of Energy.
NREL Jobs 2012 Daniel Steinberg, Gian Porro, and Marshall Goldberg. Preliminary Analysis of the Jobs and Economic
Impacts of Renewable Energy Projects Supported by the §1603 Treasury Grant Program. (Technical Report; NREL/TP-6A20-52739) Golden, CO: National Renewable Energy Laboratory, April 2012, at http://www.nrel.gov/docs/fy12osti/52739.pdf.
NREL Load Data 2012 Paul Denholm, Sean Ong, and Chuck Booten. Using Utility Load Data to Estimate Demand
for Space Cooling and Potential for Shiftable Loads. (Technical Report; NREL/TP-6A20-54509) Golden, CO: National Renewable Energy Laboratory, May 2012, at http://www.nrel.gov/docs/fy12osti/54509.pdf.

270
XIII. References
NREL Ofshore 2015 S. Tegen, D. Keyser, F. Flores-Espino, J. Miles, D. Zammit, and D. Loomis. Ofshore Wind Jobs and Economic Development Impacts in the United States: Four Regional Scenarios. (Technical Report NREL/
TP-5000-61315) Golden, CO: National Renewable Energy Laboratory, February 2015, at http://www.nrel.gov/docs/
fy15osti/61315.pdf.
NREL Potentials 2012 Anthony Lopez, Billy Roberts, Donna Heimiller, Nate Blair, and Gian Porro. U.S. Renewable
Energy Technical Potentials: A GIS-Based Analysis. (Technical Report; NREL/TP-6A20-51946). Golden, CO:
National Renewable Energy Laboratory, July 2012, at www.nrel.gov/docs/fy12osti/51946.pdf.
NREL Resiliency 2014 National Renewable Energy Laboratory. Distributed Solar PV for Electricity System
Resiliency: Policy and Regulatory Considerations. (NREL/BR-6A20-62631) Golden, CO: NREL, November 2014,
at http://www.nrel.gov/docs/fy15osti/62631.pdf.
NREL Retroits 2013 (cited in Model) National Renewable Energy Laboratory. National Residential Eiciency Measures Database: Retroit Measures for Air Leakage. Version: v3.0.0. [Golden, CO]: NREL, March 21, 2013, at
http://www.nrel.gov/ap/retroits/measures.cfm?gId=10&ctId=376.
NREL Rooftop 2016 Pieter Gagnon, Robert Margolis, Jennifer Melius, Caleb Phillips, and Ryan Elmore. Rooftop
Solar Photovoltaic Technical Potential in the United States: A Detailed Assessment. (Technical Report; NREL/
TP-6A20-65298) Golden, CO: National Renewable Energy Laboratory, January 2016, at www.nrel.gov/docs/
fy16osti/65298.pdf.
NSRDB 1991-2005 National Renewable Energy Laboratory. National Solar Radiation Data Base 1991-2005
Update: Typical Meteorological Year 3. Golden, CO: NREL, [2006?], at http://rredc.nrel.gov/solar/old_data/
nsrdb/1991-2005/tmy3/by_state_and_city.html#M.
Nutty Birdwatcher 2016 Nutty Birdwatcher. Spring & Fall Migration Timetable. [U.S.]: Nutty Birdwatcher, accessed
June 9, 2016, at http://www.birdnature.com/timetable.html.
NYS PSC Afordability Order 2016 New York Public Service Commission. Order Adopting Low Income
Program Modiications and Directing Utility Findings, at a session of the Public Service Commission held in
the City of Albany on May 19, 2016, Case 14-M-0565 - Proceeding on Motion of the Commission to Examine
Programs to Address Energy Afordability for Low Income Utility Customers. Albany, PSC, issued and efective May 20, 2016, at http://documents.dps.ny.gov/public/Common/ViewDoc.aspx?DocRefId={BC2F31C9-B563-4DD6-B1EA-81A830B77276}, from link at http://documents.dps.ny.gov/public/MatterManagement/CaseMaster.
aspx?MatterCaseNo=14-m-0565&submit=Search+by+Case+Number. Filing number 75. Matter Number: 14-02621.
NYS PSC CES Order 2016 New York State. Public Service Commission. Order Adopting a Clean Energy
Standard. Case 15-E-0302 - Proceeding on Motion of the Commission to Implement a Large-Scale Renewable
Program and a Clean Energy Standard. Case 16-E-0270 - Petition of Constellation Energy Nuclear Group LLC;
R.E. Ginna Nuclear Power Plant, LLC; and Nine Mile Point Nuclear Station, LLC to Initiate a Proceeding to
Establish the Facility Costs for the R.E. Ginna and Nine Mile Point Nuclear Power Plants. Albany: PSC, August 1,
2016, at http://documents.dps.ny.gov/public/Common/ViewDoc.aspx?DocRefId={44C5D5B8-14C3-4F32-8399-F5487D6D8FE8}.
-- Appendices A through G, at http://documents.dps.ny.gov/public/Common/ViewDoc.aspx?DocRefId={B3777382-228F-4268-A674-6B5B93B8614B}. Both from links at http://documents.dps.ny.gov/public/MatterManagement/
CaseMaster.aspx?MatterCaseNo=15-e-0302. Filing number 352.
NYSERDA 2016 New York State. Energy Research and Development Authority. Governor Cuomo Announces
New Energy Afordability Policy to Deliver Relief to Nearly 2 Million Low-Income New Yorkers: NYS Public Service Commission Expands Energy Discount Programs to Provide More Than $248 Million in Savings to
Households Statewide. Albany: NYSERDA, May 19, 2016, at https://www.nyserda.ny.gov/About/Newsroom/2016-
Announcements/2016-05-19-Governor-Cuomo-Announces-New-Energy-Afordability-Policy. Press release.
OCI Solar Power 2014 OCI Solar Power. OCI Solar Power iring up three new Texas solar projects: OCI Solar Power and EPC partner Mortenson Construction switch on 39 megawatts and begin construction of an additional
105 MW for Texas. (News) San Antonio, TX: OCI, September 4, 2014, at http://www.ocisolarpower.com/news.html.

271
Prosperous, Renewable Maryland
Oge 2015 Margo T. Oge. Driving the Future: Combating Climate Change with Cleaner, Smarter Car. New York: Arcade Publishing, 2015.
Osborne 2014 Mark Osborne. “Polysilicon demand outpacing silicon per-watt reduction strategies,” PV Tech, 10 February 2014, at http://www.pv-tech.org/news/polysilicon_demand_outpacing_silicon_per_watt_reduction_strategies.
OSHA 2013 U.S. Department of Labor. Occupational Safety and Health Administration. Types & Fundamentals: Forklift Classiications. Washington, DC, OSHA, [February 11, 2013], at https://www.osha.gov/SLTC/etools/pit/forklift/types/classes.html. “Powered Industrial Trucks”
Paris Agreement 2015 United Nations. Framework Convention on Climate Change. Adoption of the Paris
Agreement. Conference of the Parties Twenty-irst session Paris, 30 November to 11 December 2015. Agenda item 4(b). Durban Platform for Enhanced Action (decision 1/CP.17). Adoption of a protocol, another legal instrument, or an agreed outcome with legal force under the Convention applicable to all Parties. (FCCC/CP/2015/L.9/Rev.1 English). [Bonn, Germany]: UNFCCC, 12 December 2015, at http://unfccc.int/resource/docs/2015/cop21/eng/l09r01.pdf.
Partlow and Warrick 2016 Joshua Partlow and Joby Warrick. “A dangerous export: America’s car-battery waste is making Mexican communities sick,” Washington Post, February 26, 2016, at http://www.washingtonpost.com/sf/national/2016/02/26/a-dangerous-export-americas-car-battery-waste-is-making-mexican-communities-sick.
Passive House Institute 2016 Passive House Institute. [Home page]. Chicago: PHIUS, accessed February 2, 2016, at http://www.phius.org/home-page.
Passive House Institute FAQ 2016 Passive House Institute US. Frequently Asked Questions. Chicago, PHIUS, 2016, at http://www.phius.org/what-is-passive-building-/faq.
Pasternak 2010 Judy Pasternak. Yellow Dirt: An American Story of a Poisoned Land and a People Betrayed. New York: Free Press, 2010.
PennEnergy 2016 PennEnergy Editorial Staf. “The world’s irst consumer blockchain energy transaction begins “power to the people” revolution in New York,” PennEnergy, April 11, 2016, at http://www.pennenergy.com/articles/pennenergy/2016/04/transmission-distribution-the-world-s-irst-consumer-blockchain-energy-transaction-begins-power-to-the-people-revolution-in-new-york.html?cmpid=EnlDailyPowerApril122016&eid=288213396&bid=1367704. “Source: TransActive Grid.”
Pepco 2013 Potomac Electric Power Company. Class Average Load Proiles. Washington, DC: Pepco, [2013], at https://suppliersupport.pepco.com/suppliersupport/suppliersupportframe.htm. [URL unsecure = blocked by browsers June 28, 2016] Click on “Load Proiles.” Accessed August 2013.
Pepco 2016 Potomac Electric Power Company. Maryland: Residential Time Metered Service, Schedule RTM. [Washington, DC: updated July 22, 2016, at http://www.pepco.com/uploadedFiles/wwwpepcocom/Content/Page_Content/my-home/Efective%20Usage%20on%20and%20after%20July%2022%202016%20-%20%20RTM.pdf.
Pepco Holdings Grid 2016 Pepco Holdings. Initial Considerations for Grid Modernization in Maryland. Washington, D.C.: PHI, June 30, 2016, at http://webapp.psc.state.md.us/newIntranet/casenum/NewIndex3_VOpenFile.cfm?ServerFilePath=C:\Casenum\9300-9399\9361\\294.pdf, from link at http://webapp.psc.state.md.us/newIntranet/casenum/CaseAction_new.cfm?CaseNumber=9361. Item 294. ML 194301. Cover letter subject: Case No. 9361- Merger Condition 14.
Peters 2014 Adele Peters. These Cheap, Invisible Solar Cells Can Be Spray-Painted on Anything, FastCo.Exist, December 19, 2014, at http://www.fastcoexist.com/3039981/these-cheap-invisible-solar-cells-can-be-spray-painted-on-anything.
PG&E CAES 2016 Paciic Gas and Electric Company. Compressed Air Energy Storage (CAES). San Francisco, PG&E, accessed March 9, 2016, at https://www.pge.com/en/about/environment/pge/cleanenergy/caes/index.page. Image at https://www.pge.com/web/includes/images/about/environment/pge/cleanenergy/caes.jpg.

272
XIII. References
PG&E Diablo Canyon 2016 Paciic Gas and Electric Company. In Step With California’s Evolving Energy
Policy, PG&E, Labor and Environmental Groups Announce Proposal to Increase Energy Eiciency, Renewables and Storage While Phasing Out Nuclear Power Over the Next Decade. (News Releases) San Francisco: PG&E
External Communications, June 21, 2016, at https://www.pge.com/en/about/newsroom/newsdetails/index.
page?title=20160621_in_step_with_californias_evolving_energy_policy_pge_labor_and_environmental_groups_announce_proposal_to_increase_energy_eiciency_renewables_and_storage_while_phasing_out_nuclear_power_over_the_next_decade.
PG&E, SCGC, and SDG&E 2013 Paciic Gas and Electric Company (PG&E), Southern California Gas Company (SCGC), and San Diego Gas and Electric (SDG&E). ENERGY STAR® Clothes Dryers Draft 1 Version 1.0
Speciication. [Letter / comments to] Abigail Daken, U.S. Environmental Protection Agency, January 25, 2013, at
https://www.energystar.gov/products/specs/sites/products/iles/ENERGY%20STAR%20Draft%201%20V1.0%20Dryers%20CA%20IOU%20Comments%20with%20Amended%20NEEA%20data.pdf.
PJM 2015 PJM Interconnection. Resource Adequacy Planning Department. PJM Load Forecast Report.
Audubon, PA: Department, January 2015, at https://www.pjm.com/~/media/documents/reports/2015-load-forecast-
report.ashx.
PJM 2015 Annual Report (2016) PJM Interconnection. PJM 2015 Annual Report. Audubon, PA: PJM, May 2016, at
www.pjm.com/~/media/about-pjm/newsroom/annual-reports/2015-annual-report.ashx. Date from “Properties.”
PJM 2016 PJM Interconnection. Who We Are. Audubon, PA, PJM, accessed February 19, 2016, at http://pjm.com/
about-pjm/who-we-are.aspx.
PJM Demand Response PJM Interconnection. Demand Response. Audubon, PA: PJM, accessed October 7, 2016, at
http://www.pjm.com/markets-and-operations/demand-response.aspx.
PJM Markets 2016 PJM Interconnection. Resource Investment in Competitive Markets. Audubon, PA, PJM, May
5, 2016, at http://www.pjm.com/~/media/768E4AC9442A428AA83776AFDBF48929.ashx.
PJM Peaks 2015 PJM Interconnection. Summer 2015 Weather Normalized RTO Coincident Peaks (MW). Audubon, PA,
PJM, October 20, 2015, at http://www.pjm.com/~/media/planning/res-adeq/load-forecast/summer-2015-pjm-5cps-
and-w-n-zonal-peaks.ashx.
PJM Queues 2016 PJM Interconnection. Generation Queues: Active (ISA, WMPA, etc.). Audubon, PA: PJM
Interconnection, accessed March 23, 2016, at http://pjm.com/planning/generation-interconnection/generation-queue-
active.aspx. Search for Wind and All.
PJM Settlement 2016 PJM Interconnection. PJM Settlement Administrative Cost Rates. Audubon, PA: PJM,
accessed October 7, 2016, at http://www.pjm.com/committees-and-groups/committees/fc/pjm-settlement-admin-
cost-rates.aspx.
Pollan 2008 Michael Pollan. In Defense of Food: An Eater’s Manifesto. New York: Penguin, 2008.
Portnoy 2015 Jenna Portnoy. “After coal, Appalachia to wind farm proposal: ‘It is insulting, really,’” Washington
Post, August 20, 2015, at https://www.washingtonpost.com/local/virginia-politics/after-coal-appalachia-to-wind-
farm-proposal-its-insulting-really/2015/08/20/68349002-3091-11e5-8f36-18d1d501920d_story.html.
Pratt 2016 David M. Pratt. Selecting Energy Eicient Building Envelope Retroits to Existing Department of Defense Buildings Using Value Focused Thinking. Thesis. (AFIT/GEM/ENV/06M-14) Presented to the Faculty,
Department of Systems and Engineering Management, Graduate School of Engineering and Management, Air
Force Institute of Technology, Air University, Air Education and Training Command, In Partial Fulillment of the Requirements for the Degree of Master of Science in Engineering and Environmental Management. Wright-
Patterson Air Force Base, Ohio, March 2006, at http://www.dtic.mil/dtic/tr/fulltext/u2/a446354.pdf.
Product-Life Institute 2016 Product-Life Institute. Cradle to Cradle. Geneva: Institute, accessed October 12,
2016, at http://www.product-life.org/en/cradle-to-cradle.

273
Prosperous, Renewable Maryland
PSE Healthy Energy Survey 2016 Jake Hays and Seth B. C. Shonkof. “Toward an Understanding of the Environmental and Public Health Impacts of Unconventional Natural Gas Development: A Categorical Assessment of the Peer-Reviewed Scientiic Literature, 2009-2015,” PLoS One, April 20, 2016, at http://journals.plos.org/plosone/article/asset?id=10.1371/journal.pone.0154164.PDF, from link at http://www.psehealthyenergy.org/site/view/1233.
PVWatts 2016 National Renewable Energy Laboratory. NREL’s PVWatts® Calculator. Golden, CO: NREL, accessed January 13, 2016, at http://pvwatts.nrel.gov/index.php. “PVWatts® is a registered trademark by Alliance for Sustainable Energy, LLC.” To see values used in PV Watts click on Help. Navigate to System Info then to System Losses and Inverter Eiciency.
Pyper 2015 Julia Pyper. “Nevada Regulators Eliminate Retail Rate Net Metering for New and Existing Solar Customers,” Greentech Media, December 23, 2015, at http://www.greentechmedia.com/articles/read/Nevada-Regulators-Eliminate-Retail-Rate-Net-Metering-for-New-and-Existing-S.
Pyper Nevada 2016 Julia Pyper. “Does Nevada’s Controversial Net Metering Decision Set a Precedent for the Nation?” Greentech Media, February 4, 2016, at http://www.greentechmedia.com/articles/read/nevada-net-metering-decision.
Pyper SolPad 2016 Julia Pyper. “Meet SolPad, an Integrated Solar-Plus-Storage Solution Fresh Out of Stealth Mode,” Greentech Media, September 22, 2016, at http://www.greentechmedia.com/articles/read/meet-solpad-a-truly-integrated-solar-plus-storage-solution-fresh-out.
Quora 2013 “What is the average life of a shale oil well in the Bakken formation?,” Quora, answers dated July 27, 2013; accessed October 11, 2016, at https://www.quora.com/What-is-the-average-life-of-a-shale-oil-well-in-the-Bakken-formation.
Randall 2016 Tom Randall. “Here’s How Electric Cars Will Cause the Next Oil Crisis: A shift is under way that will lead to widespread adoption of EVs in the next decade,” Bloomberg, Feb. 25, 2016, at http://www.bloomberg.com/features/2016-ev-oil-crisis/.
RAP 2011 Jim Lazar and Xavier Baldwin. Valuing the Contribution of Energy Eiciency to Avoided Marginal Line Losses and Reserve Requirements. Montpelier, VT: RAP, August 2011, at http://www.raponline.org/wp-content/uploads/2016/05/rap-lazar-eeandlinelosses-2011-08-17.pdf.
Renewables International 2013 (cited in Model) Craig Morris. Negative power prices on the weekend, Renewables International, 17.06.2013, at http://www.renewablesinternational.net/negative-power-prices-on-the-weekend/150/537/67152/.
Resource Media 2015 Resource Media. Food or Fuel?: U.S. corn harvested for ethanol in ‘12 could feed 412 million people. Seattle, WA, Resource Media, accessed 2015-12-08, at http://foodorfuel.weebly.com. Graphic at http://foodorfuel.weebly.com/uploads/3/1/8/3/3183142/rm_food_fuel_diagram_120711.pdf.
RGGI 2016 Regional Greenhouse Gas Initiative. [Home page]. New York, RGGI, accessed April 13, 2016, at http://rggi.org/.
RMI Blog 2013 (cited in Model) Bodhi Rader and Dan Wetzel. “Batteries Included: Maryland’s irst commercial solar PV and battery storage microgrid improves resiliency and enhances the grid,” RMI Outlet (Rocky Mountain Institute’s blog), November 13, 2013, at http://blog.rmi.org/blog_2013_11_13_batteries_included.
Rockett and Scott 2006 Angus Rockett and Robert W. Scott. Evaluation of the Potential for Photovoltaic Power
Generation in Illinois. (Informational/Educational Material 2006-05) Springield: Illinois State Water Survey, July 2006, at http://www.isws.illinois.edu/pubdoc/IEM/ISWSIEM2006-05.pdf.
Roselund 2016 Christian Roselund. “GTM Research: US energy storage BOS costs to fall 41% by 2020,” PV Magazine, January 4, 2016, at http://www.pv-magazine.com/news/details/beitrag/gtm-research--us-energy-storage-bos-costs-to-fall-41-by-2020_100022617/#axzz3xdbL4QYB.
RT News 2014 “New aviation age: Commercial electric aircraft nearing reality,” RT News, 9 November 2014, at https://www.rt.com/news/203687-electric-aircraft-commercial-stage/.

274
XIII. References
RT USA 2016 “Electric skies: NASA claims progress on hybrid plane engine,” RT USA, 7 January 2016, at https://
www.rt.com/usa/328220-nasa-electric-plane-future/.
Ruggles et al. 2014 Rebecca Ruggles and Karin Gunther Russ, with Katie Simon Mowatt and Allison Rich.
Energy & Health in Maryland: A Brieing for Health Advocates. Baltimore: Maryland Environmental Health
Network, November 2014, at http://mdehn.org/wp-content/uploads/2014/11/mdehn_energyhealth_md.pdf.
Sanchez 2012 Ivette Sanchez. Microgrid Technology: Enabling Energy Reliability and Security – Opportunities
in Campus, Commercial & Industrial Communities. [Presented at IDEA’s 103rd Annual Conference & Trade
Show, District Energy/CHP “Cooler, Cleaner Cities”, June 29 – July 2, 2012, Chicago, Illinois.] Westborough, MA: International District Energy Association, July 2, 2012, at http://www.districtenergy.org/assets/
pdfs/03AnnualConference/Monday-A/A5.2SANCHEZIvette-Sanchez-IDEA.pdf, from link at http://www.
districtenergy.org/103rd-annual-conference-and-trade-show/.
Sandia 2001 Sandia National Laboratory. Sandia assists with mine assessment: Solution to some of country’s energy
woes might be little more than hot air. (News Releases) Albuquerque, NM: Sandia, April 24, 2001, at http://www.
sandia.gov/media/NewsRel/NR2001/norton.htm.
Schoen 2012 Philip Schoen. Geothermal Heat Pumps: Harnessing On-Site Renewable Energy to Meet Energy-
Eiciency and Climate Change Goals. Geoexchange.org Tribal Community. [Presented at August 2012 Renewable
Energy for Tribal Community Development Workshop—Milwaukee, Wisconsin.] Springield, IL: Geothermal Exchange Organization, August 2012, at http://apps1.eere.energy.gov/tribalenergy/pdfs/201208_wi/28_geothermal_
heat_pumps_schoen_0812.pdf, from link at http://apps1.eere.energy.gov/tribalenergy/course_082012_wi.cfm.
Schoettle and Sivak 2016 Brandon Schoettle and Michael Sivak. The Relative Merits of Battery-Electric Vehicles and
Fuel-Cell Vehicles. Abstract. (Report No. UMTRI-2016-5) Ann Arbor, University of Michigan, Transportation
Research Institute, February 2016. Abstract is at http://www.umich.edu/~umtriswt/PDF/UMTRI-2016-5_Abstract_
English.pdf, from a link at http://www.umtri.umich.edu/sustainable-worldwide-transportation/swt-publications.
Scott and Simon 2015 Paul B. Scott and Michael Simon (Transportation Power, Inc.) Utility Scale Energy
Storage, Grid-Saver™ Fast Energy Storage. (Final Project Report; CEC-500-2015-020) Sacramento: California
Energy Commission, Energy Research and Development Division, February 2015, at http://www.energy.
ca.gov/2015publications/CEC-500-2015-020/CEC-500-2015-020.pdf.
SEIA 2013 Solar Energy Industries Association. Net Energy Metering Guiding Principles: Fact Sheet.
Washington, DC: SEIA, [2013], at http://www.seia.org/research-resources/net-energy-metering-guiding-principles.
Accessed August 30, 2013.
SEIA 2016 Solar Energy Industries Association. Solar Investment Tax Credit (ITC). Washington, DC: SEIA,
accessed October 7, 2016, at http://www.seia.org/policy/inance-tax/solar-investment-tax-credit.
SEIA Maryland 2016 Solar Energy Industries Association. Solar Spotlight: Maryland. Washington, DC: SEIA, June
15, 2016, at http://www.seia.org/sites/default/iles/MD%20State%20Factsheet_6.15.2016.pdf#overlay-context=state-solar-policy/maryland, from link at http://www.seia.org/state-solar-policy/maryland. Or later, see: www.seia.org/
sites/default/iles/MD%20State%20Fact%20Sheet_9.9.2016.pdf.
Seltzer 2016 Rick Seltzer. “People’s Counsel appeals approval of $6.8 billion Exelon-Pepco deal,” Baltimore
Business Journal, June 11, 2016, at http://www.bizjournals.com/baltimore/news/2015/06/11/peoples-counsel-
appeals-approval-of-6-8-billion.html.
Shahan 2015 Zachary Shahan. “Which Solar Panels Are Most Eicient?” CleanTechnica, February 2, 2014; last
updated March 21, 2015, at http://cleantechnica.com/2014/02/02/which-solar-panels-most-eicient.
Shallenberger 2016 Krysti Shallenberger. “Nevada PUC denies request to stay solar
net metering reforms,” Utility Dive, January 14, 2016, at http://www.utilitydive.com/news/
nevada-puc-denies-request-to-stay-solar-net-metering-reforms/412140/.

275
Prosperous, Renewable Maryland
Siemens 2015 Andreas Wenleder. “Electric Mobility: Silence at Sea,” Pictures of the Future (Siemens), 25 August 2015, at http://www.siemens.com/innovation/en/home/pictures-of-the-future/mobility-and-motors/electric-mobility-hybrid-electric-ships.html.
Siler-Evans et al. 2013 (cited in Model) Kyle Siler-Evans, Inês Lima Azevedo, M. Granger Morgan, and Jay Apt. “Regional variations in the health, environmental, and climate beneits of wind and solar generation,”
PNAS Early Edition, later published in PNAS, v. 110 (29) (2013): p.11768, at http://www.pnas.org/content/early/2013/06/19/1221978110.full.pdf+html. Proceedings of the National Academy of Sciences of the United States of America.
Sioshansi 2013 (cited in Model) Perry Sioshansi. “How Much Should Self-Generators Pay For The Grid?,” Breaking Energy, November 26, 2013, at http://breakingenergy.com/2013/11/26/how-much-should-self-generators-pay-for-the-grid/.
Skidmore 2015 Skidmore College. Skidmore to host Geopalooza March 17-18. Saratoga Springs, NY: Skidmore, March 12, 2015, at http://www.skidmore.edu/news/2015/0312-skidmore-to-host-geopalooza.php.
SMECO 2013 Southern Maryland Electric Cooperative. Class Average Load Proiles. Hughesville, MD: SMECO, [2013?], at https://www.smeco.coop/energy-supplier-support/class-average-load-proiles. Accessed August 5, 2016. Formerly at http://retailsupplier.smeco.com/energySupplierSupport/loadProiles.aspx. Accessed September 5, 2013.
Smelof 2016 Ed Smelof. “The End of the Era of Baseload Power Plants,” Greentech Media, June 29, 2016, at http://www.greentechmedia.com/articles/read/the-end-of-the-era-of-baseload-power-plants.
Smith 2006 Brice Smith. Insurmountable Risks: The Dangers of Using Nuclear Power to Combat Global Climate
Change. Takoma Park, MD: IEER Press; Muskegon, MI: RDR Books, 2006, at http://ieer.org/resource/books/insurmountable-risks-dangers-nuclear/.
Solar Foundation 2015 Solar Foundation. National Solar Jobs Census 2014. Washington, DC: TSF, February 2015, at http://www.thesolarfoundation.org/wp-content/uploads/2015/01/TSF-National-Census-2014-Report_web.pdf. Publication date from “Properties.”
Solar Foundation 2016 Solar Foundation. National Solar Jobs Census 2015. Washington, DC: TSF, January 2016, at http://www.thesolarfoundation.org/wp-content/uploads/2016/01/TSF-2015-National-Solar-Jobs-Census.pdf.
SolarCity 2015 (cited in Model) SolarCity. Solar Bonds & Investing - Clean Renewable Energy Bonds. [San Mateo, CA]: SolarCity Corporation, viewed December 21, 2015, at https://solarbonds.solarcity.com. Title from “Page Info.”
SolPad 2016 SunCulture Solar Inc. SolPad™: The Future of Sustainable Personalized Energy Has Arrived. Mountain View, CA: SunCulture, September 22, 2016, at http://solpad.com/. Press release, accessed on October 4, 2016.
Spectra Energy 2016 Spectra Energy Group. Accident Storage Field. Houston: Spectra Energy, accessed on March 13, 2016, at http://www.spectraenergy.com/Operations/US-Natural-Gas-Operations/Storage/Accident-Storage-Field/.
St. Louis Federal Reserve 2016 Federal Reserve Bank of St. Louis. Gross Domestic Product: Implicit Price Delator. St. Louis, MO: Bank, updated September 29, 2016, at https://fred.stlouisfed.org/series/GDPDEF. Accessed on Oct. 25, 2016.
Stadler 2014 Michael Stadler. Microgrid Planning and Operations for Critical Facilities Considering Outages due
to Natural Disasters. Berkeley, CA: Lawrence Berkeley National, Laboratory, August 2014, at https://building-microgrid.lbl.gov/sites/all/iles/DER-CAM%20-%20microgrid%20resilience_V7.pdf.
State of the Air 2013 American Lung Association. State of the Air 2013. Washington, DC, ALA, 2013, at http://www.stateoftheair.org/2013/assets/ala-sota-2013.pdf.
Stern Review 2006 Nicholas Stern. The Economics of Climate Change: The Stern Review. Cambridge, UK: Cambridge University Press, 2006, at http://mudancasclimaticas.cptec.inpe.br/~rmclima/pdfs/destaques/sternreview_report_complete.pdf. Several prefatory sections appear before the main text on pdf page 46. Title page missing from this ile.

276
XIII. References
Structured Expert Dialog 4 (2015) United Nations. Framework Convention on Climate Change. Summary report on the
fourth session of the structured expert dialogue, Lima, Peru, 2 and 3 December 2014 and Geneva, Switzerland, 8
and 9 February. 2015. Note by the co-facilitators. [Bonn, Germany]: UNFCCC, 7 April 2015, at https://unfccc.int/
iles/science/workstreams/application/pdf/structuredexpertdialogue.2015.1.summaryreport.pdf, from link at http://
unfccc.int/science/workstreams/the_2013-2015_review/items/7578.php. Running title: The 2013–2015 review.
SunPump 2016 SunPump Solar Inc. [Home page]: Solar Water Heater, Solar Hot Water Heater, Radiant Heating
System. Abbotsford, BC: SunPump, accessed October 25, 2016, at https://www.sunpump.solar/. Title from “page
info.”
Susquehanna Comprehensive Plan 2015 Susquehanna River Basin Commission. Comprehensive Plan for the Water
Resources of the Susquehanna River Basin. Harrisburg, PA: SRBC, December 2013, as amended, September
2015, at www.srbc.net/planning/assets/documents/CompPlan2013withoutAppendicesAmendedSept_2015_
FINAL_08_13_15_284298_1.pdf, from link at http://www.srbc.net/planning/comprehensiveplan.htm.
Taylor 2015 Heather Taylor. Cost of Constructing a Home. (HousingEconomics.com Special Studies) Washington,
DC: National Association of Home Builders, November 2, 2015, at http://www.nahbclassic.org/generic.aspx?sectio
nID=734&genericContentID=248306&channelID=3118&_ga=1.176914085.1438988363.1458836821. Links to a
pdf.
Tesla 2014 Tesla Motors. Tesla Gigafactory. Palo Alto, CA: Tesla, [2014], at https://www.teslamotors.com/
gigafactory.
Tesla Energy Press Kit 2016 Tesla Motors. Tesla Press Information. Palo Alto, CA: Tesla, accessed August 12,
2016, at http://www.teslamotors.com/presskit.
Thiesse 2014 Kent Thiesse. “USDA projects record 2014 crop production,” Corn & Soybean Digest: Focus on Ag,
September 16, 2014, at http://cornandsoybeandigest.com/blog/usda-projects-record-2014-crop-production.
TransPower 2015 Transportation Power, Inc. $16 million in New Orders for TransPower Trucks and Tractors: TransPower Announces New Heavy-Duty Electric Vehicle Achievements. Press Release. Poway, CA; TransPower,
March 26, 2015, at http://www.transpowerusa.com/press-releases/16-million-in-new-orders-for-transpower-trucks-
and-tractors. Speciically the image at http://www.transpowerusa.com/wp-content/uploads/2015/03/EDD-1-thru-4-
at-TTSI-3-1024x478.jpg.
Tschakert 2015 Petra Tschakert. “1.5°C or 2°C: a conduit’s view from the science-policy interface at COP20 in Lima,
Peru,” Climate Change Responses, v. 2, no. 3 (March 2015), at http://www.climateemergencyinstitute.com/uploads/
Petra_1_5_not_2C_March_2015.pdf.
U.S. Census 2015 United States Census Bureau. Population Division. Table 1. Annual Estimates of the Resident
Population for the United States, Regions, States, and Puerto Rico: April 1, 2010 to July 1, 2015. Washington, DC:
Bureau, December 2015, at www.census.gov/popest/data/state/totals/2015/tables/NST-EST2015-01.xlsx, from link
at http://www.census.gov/popest/data/state/totals/2015.
UCS 2012 Union of Concerned Scientists. Environmental Impacts of Geothermal Energy. Cambridge, MA:
UCS, [2012], at http://www.ucsusa.org/clean_energy/our-energy-choices/renewable-energy/environmental-impacts-
geothermal-energy.html#.Vy0Rw-TqX0V. Date deduced from references.
UCS 2013 Union of Concerned Scientists. Palm Oil and Global Warming. (Fact Sheet) Cambridge, MA: UCS,
[2013], at http://www.ucsusa.org/sites/default/iles/legacy/assets/documents/global_warming/palm-oil-and-global-warming.pdf. Date from “Properties.”
UCS 2015 Jef Deyette, Steven Clemmer, Rachel Cleetus, Sandra Sattler, Alison Bailie, and Megan Rising. The Natural Gas Gamble: A Risky Bet on America’s Clean Energy Future. Cambridge, MA: Union of Concerned
Scientists, March 2015, at http://www.ucsusa.org/sites/default/iles/attach/2015/03/natural-gas-gamble-full-report.pdf.

277
Prosperous, Renewable Maryland
UCS EW3 2012 Union of Concerned Scientists. UCS EW3 Energy-Water Database V.1.3. Cambridge, MA: UCS, 2012,
at http://www.ucsusa.org/ew3database, with link to http://www.ucsusa.org/sites/default/iles/attach/2016/03/UCS-EW3-Energy-Water-Database.xlsx.
UMD 2013 (cited in Model) University of Maryland. Department of Mechanical Engineering. UMDDryer Team. Two-Stage Heat Pump Clothes Dryers. Max Tech Appliance Design Competition Final Report: Max Tech and
Beyond Appliance Design Competition for Ultra-Low-Energy-Use Appliances and Equipment for AY 2012-2013. College Park, MD: Center for Environmental Energy Engineering in the A. James Clark School of Engineering at UMD, June 24, 2013, at http://maxtechandbeyond.lbl.gov/sites/all/iles/attachments/MaxTech_FinalReport_TeamUMDDryer-062413.docx, from link at http://maxtechandbeyond.lbl.gov/team/umd-dryer.
UNFCCC 2009 United Nations. Framework Convention on Climate Change. Conference of the Parties. Report of the
Conference of the Parties on its ifteenth session, held in Copenhagen from 7 to 19 December 2009. Addendum. Part Two: Action taken by the Conference of the Parties at its ifteenth session. (FCCC/CP/2009/11/Add.1) [Bonn, Germany]: UNFCCC, 30 March 2010, at http://unfccc.int/resource/docs/2009/cop15/eng/11a01.pdf.
US Census Maryland 2016 U.S. Census Bureau. QuickFacts: Maryland. Washington, DC: Bureau, accessed April 5, 2016, at http://www.cnsus.gov/quickfacts/table/PST045215/24.
US PREF 2013 (cited in Model) U.S. Partnership for Renewable Energy Finance. MACRS Depreciation and
Renewable Energy Finance. Washington, DC: US PREF, December 2013, at http://refwallstreet.com/us-pref/images/docs/MACRSwhitepaper.pdf and from link at http://uspref.org/white-papers.
US Statistical Abstract (cited in Model) U.S. Census Bureau. Statistical Abstract of the United States, at http://www.census.gov/compendia/statab.
USDA 2016 U.S. Department of Agriculture. National Agricultural Statistics Service. Crop Production: 2015
Summary. Washington, DC: USDA NASS, January 2016, at http://www.usda.gov/nass/PUBS/TODAYRPT/cropan16.pdf.
USDA and USAID 2014 U.S. Department of Agriculture and U.S. Agency for International Development. U.S.
International Food Assistance Report: Fiscal Year 2013. Washington, DC: USDA and USAID, [September 24, 2014], at https://www.usaid.gov/sites/default/iles/documents/1866/FY%202013%20report%20FINAL%209-24-14.pdf. Publication date from URL.
USDA ERS 2015 Glenn Schaible and Marcel Aillery. Irrigation & Water Use: Background. Washington, DC: U.S. Department of Agriculture, Economic Research Service, updated October 8, 2015, at http://www.ers.usda.gov/topics/farm-practices-management/irrigation-water-use/background.aspx.
USGS 2011 U.S. Geological Survey. National Assessment of Oil and Gas Assessment of Undiscovered Oil and
Gas Resources of the Devonian Marcellus Shale of the Appalachian Basin Province, 2011. (Fact Sheet 2011–3092) Reston, VA: USGS, August 2011, at http://pubs.usgs.gov/fs/2011/3092/pdf/fs2011-3092.pdf.
USGS Circular 1405 (2014) Molly A. Maupin, Joan F. Kenny, Susan S. Hutson, John K. Lovelace, Nancy L. Barber, and Kristin S. Linsey. Estimated Water Use in the United States in 2010. (Circular 1405) Reston, VA: U.S. Geological Survey, Dept. of the Interior, 2014, at http://pubs.usgs.gov/circ/1405/pdf/circ1405.pdf, from link at http://pubs.usgs.gov/circ/1405/.
USGS Fact sheet 2014-3109 U.S. Geological Survey. Summary of Estimated Water Use in the United States in
2010. (Fact Sheet 2014-3109) Reston, VA: USGS, Dept. of the Interior, November 2014, at http://pubs.usgs.gov/fs/2014/3109/pdf/fs2014-3109.pdf, from link at http://pubs.usgs.gov/circ/1405/.
VDMA 2016 Verband Deutscher Maschinen- und Anlagenbau. International Technology Roadmap for
Photovoltaics. 7th ed. Frankfort am Main: VDMA, 2016, at http://www.itrpv.net/Reports/Downloads/: www.itrpv.net/.cm4all/iproc.php/ITRPV%20Seventh%20Edition%20Vers%202.pdf?cdp=a & www.itrpv.net/.cm4all/iproc.php/ITRPV_seventh_edition_presentation_20160317.pdf?cdp=a.

278
XIII. References
Voelcker 2016 John Voelcker. “Electric-car battery costs: Tesla $190 per kwh for pack, GM
$145 for cells,” Green Car Reports, April 28, 2016, at http://www.greencarreports.com/
news/1103667_electric-car-battery-costs-tesla-190-per-kwh-for-pack-gm-145-for-cells.
Washington Post 2013 (cited in Model) Kenneth R. Harney. “Energy-conserving homes may soon get rewards
from a major mortgage insurer,” Washington Post, November 21, 2013, updated: November 22, at http://www.
washingtonpost.com/realestate/energy-conserving-homes-may-soon-get-rewards-from-a-major-mortgage-
insurer/2013/11/21/5ea0d17a-508e-11e3-a7f0-b790929232e1_story.html.
Watkins 2015 Derek Watkins. “China’s Coastal Cities, Underwater,” New York Times, December 11, 2015, at http://
www.nytimes.com/interactive/2015/12/11/world/asia/Chinas-Coastal-Cities-Underwater.html.
Weber et al. 2015 Andrew Weber, Girish Ghatikar, Dale Sartor, and Steven Lanzisera. Design and Development of an
Integrated Workstation Automation Hub. (LBNL-175486) Berkeley, Lawrence Berkeley National Laboratory,
Environmental Technologies Area, March 30, 2015, at http://eetd.lbl.gov/sites/all/iles/design_and_development_workstation.pdf, from link at http://eetd.lbl.gov/publications/design-and-development-of-an-integrat.
Wei et al. 2014 (cited in Model) Max Wei, Timothy Lipman, Ahmad Mayyas1, Joshua Chien, Shuk Han Chan, David
Gosselin, Hanna Breunig, Michael Stadler, Thomas McKone, Paul Beattie, Patricia Chong, Whitney G. Colella, and
Brian D. James. A Total Cost of Ownership Model for Low Temperature PEM Fuel Cells in Combined Heat and
Power and Backup Power Applications. (LBNL-6772E) Berkeley, CA: Lawrence Berkeley National Laboratory,
Environmental Energy Technologies Division, October 2014, at http://energy.gov/sites/prod/iles/2014/11/f19/fcto_tco_model_low_temp_pem_fc.pdf.
Welch 2013 (cited in Model) Timothy F. Welch. Climate Action Plans – Fact or Fiction? Evidence from Maryland. Dissertation submitted to the Faculty of the Graduate School of the University of Maryland, College Park
in partial fulillment of the requirements for the degree of Doctor of Philosophy, 2013. Links at http://drum.lib.umd.
edu/handle/1903/14270.
Wesof Panels 2015 Eric Wesof. “‘World’s Most Eicient Rooftop Solar Panel’ Revisited,” GreenTech Media, October 13, 2015, at http://www.greentechmedia.com/articles/read/
Worlds-Most-Eicient-Rooftop-Solar-Panel-Revisited.
Wikimedia NERC Map 2006 Fjbfour. “File:Nercmap.JPG,” Wikimedia Commons, last modiied 12 March 2016. Image uploaded in 2006, at https://commons.wikimedia.org/wiki/File:Nercmap.JPG.
Wikimedia Nokia 2013 Villeke1. “Nokia E7-00 mobile phone.JPG,” Wikimedia Commons, 17 March 2013, at https://
commons.wikimedia.org/wiki/File:Nokia_E7-00_mobile_phone.JPG.
Wikimedia PEV Sales 2016 Mariordo (Mario Roberto Durán Ortiz), “US PEV Sales.png,” Wikmedia Commons,
21 January 2016, at https://commons.wikimedia.org/wiki/File:US_PEV_Sales.png.
Wikimedia Rotary Phone 2011 Nition1. “New Zealand Rotary Telephone.jpg,” Wikimedia Commons, 12 November
2011, at https://commons.wikimedia.org/wiki/File:New_Zealand_Rotary_Telephone.jpg.
Wikipedia Brandon Shores 2016 “Brandon Shores Generating Station,” Wikipedia, modiied 29 March 2016, at https://en.wikipedia.org/wiki/Brandon_Shores_Generating_Station.
Wikipedia Chevrolet Bolt 2016 “Chevrolet Bolt,” Wikipedia, last modiied 13 October 2016, at https://en.wikipedia.
org/wiki/Chevrolet_Bolt#Speciications.
Wikipedia Corn 2015 “Corn production in the United States,” Wikipedia, modiied November 11, 2015, at https://
en.wikipedia.org/wiki/Corn_production_in_the_United_States.
Wikipedia Cradle to Cradle 2016 “Cradle-to-cradle design,” Wikipedia, modiied 16 May 2016, at https://en.wikipedia.
org/wiki/Cradle-to-cradle_design.
Wilder 2016 Clint Wilder. “Baseload vs. Flexibility: Standing the Traditional Generation Model on its Head,” Renewable Energy World, October 10, 2016, at http://www.renewableenergyworld.com/articles/2016/10/baseload-
vs-lexibility-standing-the-traditional-generation-model-on-its-head.html.

279
Prosperous, Renewable Maryland
Wind Energy Update 2016 “Tender design, output gains key to DONG’s record-low Borssele 1&2 ofshore bid price,” Wind Energy Update, August 17, 2016, at http://analysis.windenergyupdate.com/ofshore/tender-design-output-gains-key-dongsrecord-low-borssele-12-ofshore-bid-price.
Wind, Güthe, and Syed 2014 (cited in Model) Torsten Wind, Felix Güthe, and Khawar Syed. “Co-iring of Hydrogen and Natural Gases in Lean Premixed Conventional and Reheat Burners (Alstom GT26),” [paper included in the] Proceedings of ASME Turbo Expo 2014: Turbine Technical Conference and Exposition, GT2014, June 16 – 20, 2014, Düsseldorf, Germany. (GT2014-25813) New York: American Society of Mechanical Engineers, 2014, at http://www.chemie.unibas.ch/~guethe/pub/pap/GT2014-25813_Coiring_Alstom.pdf.
Wise 2012 Timothy A. Wise. The Cost to Developing Countries of U.S. Corn Ethanol Expansion (Global Development and Environment Institute Working Paper 12-02) Medford, MA: GDAE, Tufts University, October 2012, at www.ase.tufts.edu/gdae/Pubs/wp/12-02WiseGlobalBiofuels.pdf, from link at http://www.ase.tufts.edu/gdae/policy_research/GlobalEthanolCosts.html.
Wiser and Bolinger 2015 (cited in Model) Ryan Wiser and Mark Bolinger, with Galen Barbose, Naïm Darghouth, Ben Hoen, Andrew Mills, Kristina Hamachi LaCommare, Dev Millstein, Dana Hansen, Kevin Porter, Rebecca Widiss, Michael Buckley, Frank Oteri, Aaron Smith, and Suzanne Tegen. 2014 Wind Technologies Market Report. (DOE/GO-102015-4702; LBNL-188167). [Washington, DC]: U.S. Department of Energy, Oice of Energy Eiciency & Renewable Energy, August 2015, at https://emp.lbl.gov/sites/all/iles/lbnl-188167.pdf.
Wood 2015 Pamela Wood. “Sign of the times: Sparrows Point blast furnace demolished,” Baltimore Sun, January 28, 2015, at http://www.baltimoresun.com/news/maryland/baltimore-county/dundalk/bs-md-co-sparrows-point-implosion-20150128-story.html.
Worldwatch 2009 Ben Block. Capturing Carbon Emissions…in Cement? Washington, DC: Worldwatch Institute, [2009], at http://www.worldwatch.org/node/5996. Date from context.
Yale 2010 Yale Materials Handling Corporation. The Truth About Electric Lift Trucks: Environmental
and Economic Beneits. Greenville, NC: Yale, 2010, at http://www.yale.com/WorkArea/DownloadAsset.aspx?id=4294967722.

280
Attachment A: Method
Attachment A: Method
1. Overview
The following set of notes provides background and details on the methodology used to cre-ate the Climate Protection Scenario for the Renewable Energy Roadmap. We did not do a detailed business-as-usual analysis; rather, we escalated the business-as-usual electricity use according to the estimated growth of Maryland households. This builds in existing and ongoing eiciency improve-ments, such as those induced by federal appliance standards and vehicle eiciency standards (aka CAFE standards). Recent trends indicate that increases in energy use that might have been occasioned by growth of per capita or per household income are approximately ofset by the normal improvement of eiciency created by building, appliance, and vehicle eiciency standards. We used the Reference Scenario in EIA’s Annual Energy Outlook for prices of fuels and electricity in the BAU scenario.
Maryland’s main energy resources are solar and wind energy. Both are variable; while they can be forecast to a large extent, creating a reliable and resilient electricity system requires other elements such as demand response, storage, and some dispatchable electricity supply resources. It was there-fore necessary to make an hourly model of the electricity system proposed in the Climate Protection Scenario to ensure that the combination of resources would be both reliable and resilient (in the sense of essential loads being met during grid outages). Such modeling was not necessary for the business-as-usual scenario because we assumed that the electricity resources would continue to be dominated by the kind of centralized generating stations that characterize the system today.
References are included in Chapter XIII. The proile was created with Microsoft Excel 2010. The general approach to developing the hourly proile was as follows:
281
Prosperous, Renewable Maryland
In an efort to be as detailed as possible, we evaluated and included analysis of a variety of components of the residential electricity and non-electricity fuel consumption proiles. We looked at the expected improvements in eiciency, rates of replacement of various appliances, impact of new home construction compared to existing homes in terms of space heating and cooling needs, the im-pact of existing homes having energy eicient retroits, and the impact of switching homes from oil and propane fuels to electricity.
The commercial and industrial sector demand presented speciic and unique challenges with developing an hourly proile. No detailed report speciic to Maryland comparable to the residential sector report (KEMA 2011 Draft) was available for the commercial and industrial sector. Moreover, a part of these sectors get their electricity supply at high voltage, presenting additional complications for a disaggregated study. We approximated the hourly commercial and industrial sector proile by hav-ing it correspond to the PJM hourly proile, adjusted to yield the known 2011 total electricity use for these sectors. The business-as-usual scenario was developed overall to correspond to a BAU growth rate. The Climate Protection Scenario was created by adding eiciency measures, combined heat and power, and the conversion of 70 percent of the remaining direct fossil fuel heating to eicient electric systems (compared to 90 percent for the residential sector) by 2050. Conversion of the vast majority of direct fossil fuel use in buildings is essential if the goal of 90 percent GHG emission reductions relative to 2006 is to be achieved by 2050.
2. Details and Methodology – Residential SectorBelow are detailed descriptions of our approach to incorporating or analyzing each key com-
ponent of the residential proile.
i. Residential customer growth
We utilized the oicial projections for household growth for Maryland provided by the state Department of Planning.456 For our analysis we assume that one household equals one electricity cus-tomer. This may not relect the entire building stock, in particular multi-family dwellings with a single electric meter rather than one meter per unit. However, given the limitations in parsing the residential data into single family and multi-family dwellings, we believe this to be a reasonable approximation for our purposes.
ii. Hourly electricity load proile – 2011 total loadWe downloaded hourly load proile datasets from four Maryland utilities: Baltimore Gas and
Electric (BGE), Delmarva Power (DP), Potomac Edison Power Company (PEPCO), and Southern Maryland Electric Cooperative (SMECO). Two utilities (BGE and SMECO) provided proiles for the year 2011, while the other two (PEPCO and DP) were only available for the previous 13 months.457 The utility proiles were divided by either customer type or annual usage.
456 Maryland State Data Center 2014 (Household Projections) 457 The data available was provided for dates June 1, 2012 through May 31, 2013.

282
Attachment A: Method
Each hourly load proi le represents an average customer of that type for that specii c utility. We obtained the total number of residential customers from oi cial utility annual i lings, the Maryland Public Service Commission Ten-Year Plan reports, and rate adjustment i lings (for BGE only).458 Us-ing this information and the historical household growth rates from the Department of Planning we were able to back calculate the number of residential customers for PEPCO and DP from 2012 to 2011.
For each utility we calculated an average hourly load proi le, weighted by the number of cus-tomers of each customer type proi led. Multiplying the number of customers by the average hourly load value provided an estimated total hourly load for all residential customers for each utility for 2011.
We then calculated a combined average hourly load using the data from each utility, weighted by the total number of residential customers per utility. This result was multiplied by an escalation factor so as to account for the residential sector across the state. The escalation factor was calculated by comparing the total number of residential electric customers in Maryland with the number of resi-dential customers for the four utilities with hourly proi les.459
458 Maryland PSC Plan 2013 Appendix Table 1(b)(i) (p. 47); BGE 2013-04, pdf p. 52 (December 2011 data) 459 KEMA 2011 Draft, Table 3-2 (p. 24)

283
Prosperous, Renewable Maryland
iii. Hourly electricity load proile – 2011 Heating and Cooling LoadsWe used the approach developed by the National Renewable Energy Laboratory (NREL) to
estimate the cooling load per hour.460 The NREL process involves averaging the hourly load in each hour of the 3-5 days with the lowest total daily loads for each day type (weekdays, Saturdays, and Sundays). That average 24-hour load proile becomes the “low” or “baseline” consumption proile. Then, for every date in the proile data year that had an average daily temperature461 higher than 65°F we subtracted the average low, or baseline, load for that hour from the proiled hourly load value for that date and hour. The result of that calculation is considered to be the electric load required for space cooling. If that calculation resulted in a negative number, a zero was entered in its place. This was repeated for each hour of the year, creating an average residential cooling load per utility.
This calculation was performed for an individual residential customer for the four utilities with load proiles, using the weighted average hourly load proile for a given utility. The result, an average cooling load, was also multiplied by the number of customers to provide the utility-wide residential cooling load hourly proile, then multiplied by the escalation factor to generate a state-wide total resi-dential cooling load proile for 2011.
Each utility has a cooling load for all residential customers that can be expressed as:
Then the statewide heating load at a given hour can be expressed as:
where EF is the escalation factor that yields a statewide total from the four-utility total.
Because a portion of residential customers use electric heating, we applied this same approach to estimating heating loads, using the threshold of average daily temperature lower than 65°F. For any days where the average temperature was exactly 65°F, we did not calculate either a heating or cooling load.
iv. Hourly electricity load proile – 2011 appliance loadsWe retained a consultant to develop a separate appliance model which would look at the distri-
bution of appliance vintage, replacement rates, current and future eiciency standards, and calculate an average annual kWh consumption per appliance unit in 2011 and future years. We included ive speciic appliances: refrigerators, freezers, dishwashers, clothes washers, and clothes dryers.
We used the hourly proiles for these appliances in the U.S. Department of Energy B10 Analy-sis spreadsheet, part of the Building America program.462 These proiles provide a fraction of total
460 NREL Load Data 2012, p. 6461 Average daily temperatures were compiled from the National Oceanic and Atmospheric Administration (NOAA) for the corresponding dates selected from the utility hourly load proiles. See NOAA 2013, with data from Baltimore Washington International Airport location.462 DOE EERE 2013 Analysis, and DOE EERE 2010 House Simulation and its 2012 Addendum

284
Attachment A: Method
daily load for each hour in a 24-hour period. We used the same proile for all days in the year for the ive appliances analyzed.
Applying this to the hourly proiles we divided the annual kWh consumption per unit by 365 to get the average daily consumption per unit. This was multiplied by the fraction of total daily load for each hour in a 24 hour period to get the hourly load for each appliance.
Using data provided in KEMA,463 we calculated the saturation of each appliance for each util-ity (the number of units per residential customer). We then calculated a statewide average saturation for each appliance, weighted by the number of residential customers per utility.
To generate the statewide hourly load for each appliance, we calculated the number of state-wide residential customers with each appliance (total customers * average saturation of appliance) to get the total number of units in the state. That number was multiplied by the hourly load for a single unit for each hour of the year, giving a statewide load proile of all units of each appliance.
v. Hourly lighting load proilesWe obtained seasonal lighting 24-hour proiles for ive locations in Maryland: Andrews Air
Force Base, Baltimore-Washington International Airport, Hagerstown, Patuxent, and Salisbury.464 For each location we have a diferent 24-hour proile for each month of the year. Using the number of households, by county, we created a weighted average hourly proile for a 24-hour period for each month of the year. These proiles are used in the 2011, 2020, and 2030 hourly proiles.
To account for the diference in lighting needs from one month to the next (for instance, more lighting needs in winter when there are fewer daylight hours than in summer), we used the U.S. annual seasonal fraction of lighting load in the DOE B10 analysis spreadsheet.465 We assume all lighting load is indoor lighting.
2011 lighting loads
For 2011 lighting load, we used the annual kWh of lighting per customer information available in the KEMA report for 2009.466 We then adjusted that number to account for a greater presence of CFL bulbs in homes during the two year period 2009-2011. For the 2011 hourly proile, we took the annual consumption, multiplied by the fraction of annual seasonal lighting load (U.S. average) to get the total kWh lighting load for that particular month. The monthly consumption was then divided by the number of days in the month and multiplied by the fraction of daily load for that month. This was done for all hours of the year.
2020 and 2030 lighting loads
For both scenarios, we used the same approach as for 2011 to calculate the lighting loads. For the Climate Protection Scenario, the annual total lighting loads were modiied for 2020 and 2030 using assumptions regarding the future penetration of CFL and LED bulbs and replacements of incandescent bulbs.
463 KEMA 2011 Draft, Table 6-21 464 DOE EERE 2013 Analysis, BA Analysis – Existing homes. Select the Maryland locations in the interactive spreadsheet.465 DOE EERE 2013 Analysis, BA Analysis – Existing homes. The spreadsheet contains daily lighting patterns by month
of the year.466 KEMA 2011 Draft, Table 4-5

285
Prosperous, Renewable Maryland
vi. Hourly water heating load proilesThe water heating consumption in the hourly proiles refers only to electric water heating
technology. We obtained seasonal hourly proiles for water heating consumption from the DOE B10 analysis spreadsheet. These proiles are divided between summer (April – September) and winter (Oc-tober – March). The proiles are not speciic to Maryland. Each proile (summer / winter) provided a 24-hour proile of the fraction of total daily use, for each month of the year.
2011 water heating loads
We used the data from KEMA to estimate the 2011 kWh consumption of electric water heat-ers.467 We divided the annual kWh by 365 to get the average daily water heating consumption. For each hour of the year, we multiplied the daily average kWh by the appropriate fraction of total daily load (winter vs. summer) depending on the month to give the average hourly kWh consumption for a single electric water heating unit.
We used KEMA to determine the saturation of residential customers who have electric water heating, as opposed to other fuels (natural gas, propane, heating oil). Using this information, we could determine the number of electric water heating units in 2011 across the state (saturation of electric water heaters * total number of residential electric customers in Maryland). We multiplied this by the average hourly kWh consumption for each hour of the year to get the statewide hourly proile.
2020 and 2030 water heating loads
For the Climate Protection Scenario, we had to account for two variables in looking forward to estimating kWh consumption of electric water heaters in the future. First, the improvement in COP of the technology itself, and second the impact on increasing space heating needs as electric heat pump technology pulls heat from the surrounding environment. We entered assumptions based on the heat pulled from the surrounding environment (such as the utility room) and electricity energy input. The net eiciency of a heat pump water heater is greater in the summer, because it cools down the sur-rounding air. In the winter, this same phenomenon increases the heating load. The water heat perfor-mance factor we used took both these efects into account. In the Maryland climate, the net efect is a slightly lower coeicient of performance compared to the name plate rating.
We used this information to calculate the kWh consumption of an electric water heating unit in 2050 and then calculated the rate of growth in kWh consumption from 2015 to 2050. Because of increasing COP eiciency, the growth rate is negative, resulting in a lower annual kWh consumption in 2050 compared to 2015. We used this rate in calculating the annual kWh consumption, divided that by 365 for the daily annual kWh, then multiplied that by the fraction of total daily load for the given season (winter vs. summer). For every hour of the year in the 2020 and 2030 proiles we multiplied this hourly kWh load per unit by the total number of units in the state. We assume that the saturation of electric water heating increases in the Climate Protection Scenario due to homes switching from oil/propane heating fuels to electric heating. We also assumed conversions of natural gas to heat pump water heaters in the 2030 to 2050 period.
3. Solar and wind energy dataWe used hourly solar and wind energy data as provided by the National Renewable Energy
Laboratory.
For solar energy, we used hourly data from ive stations around Maryland and weighted the data according to the regional population. The use of this data set involves the following assumptions:
467 KEMA 2011 Draft, Table 4-5 and Table 6-14

286
Attachment A: Method
• Maryland’s solar electricity capacity will be entirely within the state
• Solar capacity will be distributed in the various regions approximately according to the pattern of present population distribution (the result is not very sensitive to this assumption).
For generation patterns of rooftop, ixed-tilt ground-mount, and single-axis ground-mount sys-tems we used the PVWatts calculator to get the annual generation per kilowatt (http://pvwatts.nrel.gov). The hourly generation for each type – rooftop (5 percent of capacity), ixed-tilt ground-mount (15 percent of capacity), and single-axis ground-mount (80 percent of capacity) – were then obtained from the normalized weighted pattern of insolation for the ive Maryland solar data stations.
Ofshore wind data are for Maryland, also on the assumption that all capacity would be in the seas of Maryland’s shores. In contrast, we assumed that only 1,000 megawatts of a total of 7,000 megawatts of onshore wind would be in Maryland. The rest of the 6,000 megawatts would be some-where in the PJM and MISO regions, with appropriate transmission infrastructure. The reasons for assuming that most onshore wind capacity will be out-of-state is discussed in Chapter XI. Onshore wind resources are widely distributed in the PJM and MISO grid operator regions. For simplicity we used data from a single station in South Dakota to model the mix. In actual practice, there would be a wide mix of stations, providing a greater consistency of supply due to the larger geographic diversity of the areas where the wind farms would be built.
The mix of solar and wind resources used is such that annual solar generation is about equal to annual wind generation by 2050. This provides seasonal balance since solar dominates in the summer and wind in the winter. There are surplus resources in the spring and fall months leading to some cur-tailment in those seasons, unless seasonal energy storage is developed. In that case the total capacity needed will be less than that postulated here.
4. Dispatchable resources
Evidently, variable wind and solar energy cannot by themselves provide a reliable electricity supply, though it must be noted that a remarkably large fraction of total demand (more than 85 per-cent) is met directly by solar and wind, plus a small amount (less than 3 percent of total generation) of combined heat and power plant generation. The balance of the demand must be met by a combination of resources:
• Intra-day demand response: Some fraction of certain types of demand can be met when elec-tricity supply is available, rather than the time when the appliance is switched on. For instance, a certain fraction of dishwashers and clothes washers can be run within the day but not neces-sarily at the time when the consumer pushes the “run” button.
• Hydrogen production: Surplus electricity can be used to produce hydrogen by electrolysis. This can provide fuel for combined heat and power plants as well as for meeting the relational peak when supply and storage of other kinds is not available. In this approach, the electrolysis plant capacity factor will tend to be considerably below the 98 percent assumed in typical hy-drogen cost calculations. In the speciic case of the Climate Protection Scenario, the modelled capacity factor is about 33 percent. The capital cost and ixed operations and maintenance cost of a kilogram of hydrogen has been proportionately increased.
• Battery storage: Surplus electricity is used to charge batteries, which then meet demand when suicient solar and wind generation is not available.Reserve capacity, which ensures reliability is provided by a mix of generation and demand
response resources.

287
Prosperous, Renewable Maryland
Finally, there will be a large reduction in the use of Susquehanna River water for thermal gen-eration. We have assumed that the added lows will provide considerable lexibility in the operation of the Conowingo dam generation to complement solar and wind generation. This assumption is not essential to the model and does not signiicantly afect the overall cost of the system since the total generation involved is small (less than 2 percent).

288
Attachment B: Land requirements for corn ethanol compared to solar electricity and some related issues
The land requirements of wind and solar energy have been a concern in creating an energy sys-tem based mainly on these two sources. Fossil fuels, notably coal, but also oil and gas require increas-ing amounts of land as the fuel produced is consumed. Solar and wind require no fuel and therefore the land requirements are ixed for a given amount of energy – or declining if technology improves.
The largest land use in the present energy system is, however, for a minor contributor to overall energy supply. That is ethanol made from corn. The current U.S. corn ethanol mandate of 14.5 billion gallons468 will take up around 30.3 million acres of land.469 Maryland share of the U.S. population in 2015 was about 1.87 percent.470 When calculated on a person basis, this gives an estimate of the ag-ricultural land that Marylanders use for corn ethanol of 566,000 acres. Since a per-person estimate is approximate, we have rounded it down to 500,000 acres for the purposes of this report.
Converting sunshine on land to corn to produce an ethanol supplement for gasoline-fueled vehicles is one of the most ineicient processes in the energy economy. The annual insolation on an acre of land near Springield, Illinois, averages 4.22 kWh per square meter per day,471 which is 6.23 million kWh per year. The energy content of the ethanol per acre (at 478.8 gallons per acre) is about 11,862 kWh, which gives a gross eiciency of just 0.19 percent for the conversion of solar energy to ethanol. Of course, it takes energy to produce the corn and convert it to ethanol. The net energy yield – that is the net output after the energy inputs for farm machines, fertilizers, etc., have been taken into account – has been variously estimated. A careful assessment of the literature indicates that it takes 79 units of energy input to grow corn and convert it to ethanol containing 100 units energy472 – an ef-iciency of 21 percent on the energy inputs, excluding the solar energy input. Thus the net eiciency of solar energy conversion to fuel is about 0.04 percent. In other words, the process yields just 1 unit of ethanol energy output for every 2,500 units of energy input (including solar energy and inputs to corn and ethanol production).
Finally, gasoline vehicles only convert about 20 percent of the energy in the tank. This means that the net eiciency of solar energy conversion to useful energy at the wheels of the vehicle is just
468 Guillén 2015 (Full references for Attachment B are included in Chapter XIII)469 Calculated as follows: Corn ethanol requirement at Guillén 2015; Ethanol yield: 2.80 gallons per bushel of corn at EIA
Corn Ethanol 2015; Yield per acre in 2014: 171 bushels, which was the highest of the three year period 2013-2015 (inclu-
sive), at USDA 2016, p. 9. These two data points combine to give a yield of 478.8 gallons per acre of corn. The requirement
of 14.5 billion gallons therefore translates into a land area requirement of about 30.3 million acres. The area for a given
amount of ethanol would vary by year according to the average yield of corn per acre. 470 Calculated from the U.S. Census spreadsheet (U.S. Census 2015), the U.S. population as of July 1, 2015 was estimated
at 321.42 million; Maryland population on the same date was estimated at 6.01 million (both rounded).471 Value for a horizontal solar receipt like a leveled ield in Springield, Illinois. Calculated by IEER from Rockett and Scott 2006, Tables 1 (p. 3) and 2 (p. 6.)472 Calculated by summing the inputs for “Ethanol Today” shown in Farrell et al. 2006, Figure 2 (p. 507).
Attatchment B: Land requirements for corn ethanol compared to solar electricity...

289
Prosperous, Renewable Maryland
0.008 percent. Only about one part in 12,000 of the energy inputs (mainly solar energy) gets converted to useful energy at the wheels.
The ineiciency of the process is indicated by the fact that the same land, if used for solar elec-tricity production, could produce roughly 3 times as much electricity as is used in the United States for all purposes. Yet another way to look at it is that just 8 percent of the land could power all the personal cars and light trucks in the United States, if it were used to generate solar electricity for powering elec-tric vehicles.473 Currently available electric cars would be roughly 500 times more eicient in using land for transportation than corn ethanol.
We are not advocating any particular policy relating to land use here. The use of land, espe-cially agricultural land, is a complex issue and requires a detailed evaluation in regard to food, fuel, fertility, soil carbon, water use, employment, and other criteria. The main purpose of these calculations is to show that the current energy system takes up a lot more land, including agricultural land, than a solar energy system would.
Another purpose is to briely point to the other ill-efects of using a large amount of corn for fuel production. They include the following:
• Increasing poverty and hunger abroad: The Global Development and Environment Insti-tute at Tufts University has estimated that the corn ethanol mandate costs people in develop-ing countries $6.6 billion between 2006 and 2011.474 At an individual level, this translates into widespread sufering and hunger. In 2013, U.S. foreign food aid helped about 46 million people.475 The land devoted to growing corn for ethanol in the United States, if applied to food production, could feed more than 400 million people.476
• Use of water resources: About one-sixth of the land used for corn is irrigated.477 It takes hun-dreds of gallons of irrigation water to convert corn grown on irrigated land into a single gallon of ethanol. Climate change means that droughts and loods are likely to be more severe. Corn ethanol therefore produces a simultaneous reduction in resilience on three fronts: water, food, and energy.
• Nutrient pollution: Conventionally grown corn uses large amounts of artiicial fertilizers. These have ill-efects far beyond the energy it takes to make them, including water pollution.478
473 We conservatively assume 3 miles per kWh. The GM EV “Bolt” has a 60 kWh battery and is rated at 238 miles by the EPA (Wikipedia Chevrolet Bolt 2016). This gives almost 4 miles per kWh. However, this does not count losses in getting the electricity into the battery from the power station (on the order of 10 percent) or the lower mileage in the winter and summer when heating and air-conditioning are typically used (respectively). We assume a solar electricity output of about 400 MWh (AC) per acre (about 3.5 acres per MWdc and 1,420 MWh AC per MWdc). The output per MW was calculated from the NREL PVWatts calculator (PVWatts 2016) for Springield, Illinois (39 degree ground mount, ixed tilt), with premium panels. The land area for ixed tilt varies a great deal. The range for panels with ~15% eiciency was measured by NREL to be between 2 and 8 acres per megawatt, clustered between 2 and 5 acres per MWdc for most projects. See NREL 2013, Figure D-3 (p. 35).474 Wise 2012, p. 2 475 USDA and USAID 2014, p. 7 476 Resource Media 2015477 For total acres of land irrigated and fraction of that which is corn, see USDA ERS 2015; for total acres of corn: see Wikipedia Corn 215 478 Ceres 2014

290
• Against the spirit of the Paris Agreement of 2015: Article 2 of the December 2015 Paris
Agreement on climate change states, in part, that the Parties’ actions should be “in the context
of sustainable development and eforts to eradicate poverty” and that greenhouse gas emis-
sions should be reduced “in a manner that does not threaten food production.” 479
479 Paris Agreement 2015
Attatchment B: Land requirements for corn ethanol compared to solar electricity...

291
Prosperous, Renewable Maryland
Attachment C: Joint Labor Network for Sustainability — IEER Discussion Paper
Beyond a Band-AidA Discussion Paper on Protecting Workers and Communities in the Great
Energy Transition1
Arjun Makhijani, Ph.D. June 10, 2016
1. IntroductionThis discussion paper2 presents a strategy for protecting workers and communities that may be
threatened by the current and future transformation of the U.S. energy system. It is derived from the recognition that recent technological developments have made solar and wind energy, in combination with eiciency, cheaper than continued reliance on fossil fuels.3 An economical transition to an energy system that is nearly emissions-free is possible. The transition will provide enormous beneits, both in terms of climate protection and to workers and communities. The new energy system will be cleaner, and more resilient. Air pollution will decline. Solar and wind energy require essentially no water at a time when stress on water resources is becoming an ever larger economic and ecological issue.4
Notwithstanding these beneits, signiicant issues of justice will be raised by the transition to a clean energy future. Even though large numbers of new jobs will be created, there is no guarantee that workers and communities which lose existing jobs will have them replaced by new ones. Indeed, unless proactive policies are in place, many current workers in fossil fuel industries will become un-employed. The communities they live in will be disrupted by loss of tax revenues.
Too often these downsides are disregarded because they seem insigniicant compared to the beneits of energy transition and climate protection. But no job is insigniicant if it is your job; and it will be of little comfort to low-income households if utility bills go down on average, but theirs do not.
Some proposals for transitioning to clean energy include assistance programs for workers who lose their jobs. But often these are little more than extended unemployment compensation and training for jobs that may or may not exist. Often they would be both too little and too late – more like putting a Band-Aid on an accident victim than a well-considered plan to keep people from getting run over. And they disregard some of the most devastating impacts of energy system change, like the loss of the local tax base that often funds critical community services like libraries and parks and provides supplemental money for schools and for ire and police departments.
“Beyond a Band-Aid: A Discussion Paper on Protecting Workers and Communities in the Great Energy Transition” proposes direct investments in local economies dependent on fossil fuel

292
Attachment C: Joint Labor Network for Sustainability — IEER Discussion Paper
jobs before devastating economic disruption begins. And it proposes a strategy to protect low-income consumers from the efects of that tax increase. However, this discussion paper does not cover the more general longstanding problem of energy afordability for low-income households. Tens of mil-lions of households face high home energy bills, often exceeding 10 or even 20 percent of income. IEER has examined this issue in detail in an energy justice study speciic to Maryland and proposed a three-pronged solution that is broadly applicable: limiting bills of low-income households to 6 percent of gross income, increasing energy eiciency, and providing universal solar access to low-income households.5
This paper presents three proposals for dealing with the downsides of transition to climate-safe energy.
• A community and worker protection fund (CWP Fund). The fund would collect money in
advance to replaces taxes and fees paid by fossil fuel facilities and to invest in good jobs in
afected communities.
• Advance investment in job creation. The CWP Fund, in cooperation with other private and
public sources, would make targeted investments in fossil fuel energy communities designed
to create jobs before or at the pace that fossil fuel jobs are declining. Examples would include:
o Exporting renewable energy
o HVAC conversion
o Decommissioning facilities
o Economic diversiicationThe paper also lays out a variety of ways to pay for these proposals. They include:
• Levying a modest carbon fee or tax.
• Eliminating fossil fuel subsidies and tax breaks.
• Setting aside funds for decommissioning facilities.
• Leveraging other investments with the CWP Fund
Policies to protect those who might be adversely afected by the transition to a climate-safe economy are necessary as a matter of elementary justice. It is not fair that a small proportion of work-ers and communities should be left as economic road-kill by policies adopted to beneit society as a whole. But they are also essential because workers who face job losses are understandably nervous, since they have no assurance that once their jobs are gone there will be good ones to replace them. Advocates of fossil fuel energy often use loss of jobs and burdens on the poor as pretexts for oppos-ing climate protection and energy system transformation. This paper shows how, with proper policy planning and implementation, the transition to a climate-safe economy can beneit even those whom it might otherwise threaten.
This paper is focused on energy policy. The transition to a just and worker-friendly society will involve far more than energy policy. But in fact a transformation of our energy system is already under way, and it must accelerate even more if we are to protect against the most devastating forms of climate change. To be successful – and just -- that transformation must ensure that fossil fuel com-munities, like all others, share equitably in the economic beneits.

293
Prosperous, Renewable Maryland
2. The problem: Protecting fossil fuel workers and communities
About a million workers in the fossil fuel industry are in communities that are likely to be severely impacted by a transition to renewable energy. There is no guarantee that dispersed jobs in ef-iciency and renewable energy will be available in time or in the quantity and quality needed to avert severe economic disruption for them. Therefore it is necessary to make direct investments proactively in communities where the local economy is dominated by fossil fuels. That way jobs will be created and training provided, including in renewable energy, in these communities before they are economi-cally disrupted.
Table 1 below shows the number of jobs in various parts of the fossil fuel sector (2014 data). I have put them in two categories: jobs concentrated in communities where the loss of the industry would have high or even devastating impact and jobs that are highly dispersed – mainly gas stations and, secondarily, petroleum supply.
Table 1: Jobs in the United States fossil fuel sector, 2014
Oil and natural gas extraction 211,500Coal extraction 76,600Oil and natural gas support 312,400Coal mining support 157,500Oil and natural gas pipeline construction 140,300Oil, natural gas, and mining ield machinery 94,800Petroleum and coal products manufacturing 113,100Subtotal: jobs with high impact on communities 1,106,200Petroleum supply 98,300Gas stations 876,800Subtotal: dispersed jobs 975,100Total, direct jobs in fossil fuel industries 2,081,300
Source: Adapted from Martin Tillier, “The Fossil Fuel Industry May Not Help the Planet, But It Employs Millions,” Oilprice.com, July 9, 2014, at http://oilprice.com/Energy/Energy-General/The-Fossil-Fuel-Industry-May-Not-Help-the-Planet-But-It-Employs-Millions.html
The paper examines the high impact direct fossil fuel jobs – that is, jobs in the industries themselves -- on the thesis that the dispersed jobs, can, with appropriate policies and investments in renewable energy, eiciency, smart grid, etc., be replaced as they are lost. (A better safety net, univer-sal health insurance on the Medicare principle, for instance, would also help immensely.) Since, the proposal here is to proactively invest in communities that are likely to be signiicantly impacted, it follows that suicient job creation would protect the indirect jobs (schools, grocery stores and farmers markets, libraries, shops, restaurants, etc.).
The problem of a just transition for the afected communities and workers will be diicult, complicated and big, but the needs of a just transition and climate protection are bigger than that:
• We have a deadline to accomplish the transition. The world passed, in 2011, the greenhouse gas (GHG) CO
2-equivalent concentration limit of 430 ppm required to limit temperature rise to
1.5oC. It is therefore imperative to phase out fossil fuel use (and reduce or phase out emissions from other sources) as rapidly as possible.

294
Attachment C: Joint Labor Network for Sustainability — IEER Discussion Paper
• It is necessary to make provision for the U.S. share of the $100 billion per year promised by
2020 to developing countries (about $20 billion to $25 billion per year), without which reduc-
ing emissions globally may become diicult or impossible.
• Since the GHG concentration for limiting temperature rise to 1.5oC has already been exceeded,
climate protection will require increased storage of carbon in the soil.6 One answer is a trans-
formation of the food system. Like the energy sector, a food sector transformation can produce
immense beneits, not least of which would be better health. And like the energy sector, it will involve large numbers of workers and communities. We should aim for healthy energy and
healthy food to achieve net zero CO2 emissions as soon as possible, with net negative emis-
sions after that.
3. The opportunity
The technical key to getting the resources for a just energy transition is to recognize that re-newable energy plus eiciency is now economical. The combination makes energy services (heat, light, motive power, energy for vehicles) less expensive as a fraction of income than fossil fuels or new nuclear energy. As a result we do not need a carbon tax to make fossil fuels more expensive and renewable energy more afordable. The combination of solar, onshore wind, and eiciency is already more afordable than new fossil fuels and new nuclear.7 Ofshore wind is a nascent industry and needs policies to promote it. But a variety of combinations of solar, onshore wind, ofshore wind, and ef-iciency are more economical than nuclear and fossil fuel business-as-usual.
We need suitable mandates (like renewable portfolio standards) and regulations (like appliance and building eiciency standards) and a timetable to get the energy transition done. We will also need to convert direct fossil fuel use in buildings and vehicles to electricity. Such a large-scale conversion can, with the right policies and incentives, create a large number of manufacturing jobs in the United States. An overall manufacturing strategy is needed; renewable energy sector manufacturing and ap-pliance and electric vehicle component manufacturing are potentially very important components for achieving the goal of “making a living on a living plant.”8
Revenues are needed for creating a just and equitable transition, which has three aspects:
• Protection of community resources and services due to the closure of fossil fuel facilities when these are major employers or taxpayers;
• Creation of good jobs in a diversiied economy in communities now heavily dependent on fos-sil fuel jobs, which in Maryland means coal mining and fossil fuel electricity generation plants.
• Creation of good jobs related to the energy transition in underserved communities, such as those with high poverty and unemployment rates.
In the short term a carbon tax would be the simplest means to raise revenues. While not needed to achieve a renewable electricity system, it can accelerate the transition by making investments in eiciency and renewables more attractive. There are also other potential revenue streams (see Section 5).
4. A community and worker protection fund
A targeted approach is needed to protect communities and workers directly afected by an en-ergy transition before the damage occurs. The creation of a Community and Worker Protection Fund (CWP Fund) would accomplish that purpose.

295
Prosperous, Renewable Maryland
The CWP Fund would be in two parts. One part would replace taxes or fees paid by fossil fuel plants and perhaps also by nuclear and ethanol plants, since they are shutting down with some regular-ity. The other part would proactively create good jobs in afected communities.
Consider the state of Maryland, which IEER has studied extensively.9 The taxes and fees paid by the two-reactor Calvert Clifs nuclear plant in Maryland amount to $23.5 million per year; 10 almost all of the revenues accrue to the local government. Revenues of this magnitude from a carbon tax set aside for 10 to 15 years would enable schools, libraries, police and ire departments, and other public services now inanced partly by plant fees to continue after the plant is shut (now scheduled for the mid-2030s). A similar concept would apply to Maryland’s fossil fuel power plants and to the two counties where coal mining takes place. Total revenue requirements to replace such taxes and fees are probably on the order of $50 million to $60 million per year, statewide. Such a community protection fund represents only a fraction of the funds needed for a just transition, but it is critical to support government services in the afected communities.
In Maryland, about 2,000 utility workers in fossil fuel and nuclear plants would be afected by plant closures in the transition to a renewable grid. There are no petroleum and natural gas production facilities in Maryland.11 Transmission and distribution utility jobs as well as jobs in the gas industry would increase, though the latter would be hydrogen- and possibly biogas-related rather than natural gas-related. Overall, a transition may require revenues on the order $200 million per year for 15 or 20 years to create jobs proactively and to protect community services and facilities in the event of closure of fossil fuel plants, and, as per the current schedule, the nuclear plant (in the mid-2030s).
5. Creating jobs prospectivelyThe worker part of the CWP Fund would create jobs and training prospectively, before or ap-
proximately at the pace that fossil fuel jobs decline. The training would be for the jobs that are being created, not some hypothetical jobs that may or may not materialize. If they do, as is happening in Texas, they may not be suicient in number and compensation may not be comparable.12 This prospec-tive and concurrent creation of good jobs in fossil fuel-dependent communities is essential to prevent widespread disruption; it could also increase support for keeping fossil fuels in the ground. These are targeted investments, made in addition to general investments in renewable energy and eiciency which are necessary but may occur elsewhere in the country.
Here are some examples of jobs that can be created in fossil fuel energy communities:
• Exporting renewable energy: Communities that now export fossil fuels or generate electricity from fossil fuels could export renewable energy. The CWP Fund can leverage such invest-ments. If such investments are not forthcoming, the Fund can make the investments itself. The most important oil and gas production areas are also rich in renewable energy, notably onshore and ofshore wind. These areas include Texas, Louisiana, Oklahoma, Wyoming, and North Dakota. This is not a new idea. Scotland is using ofshore oil infrastructure and expertise for developing ofshore wind.13 Another possibility is converting caverns now used to store natural gas to store compressed air, one of the more economical forms of energy storage, if a pre-existing site is available.14 Exporting renewable energy would be a key objective of Fund investments, since that would keep external revenues lowing into the communities.
• HVAC conversion: Conversion from fossil fuel space heating and conventional air-conditioning to advanced heat pumps can be mandated in construction regulations and eiciency programs, along with existing and new incentives. This can open the door for negotiations to promote
296
Attachment C: Joint Labor Network for Sustainability — IEER Discussion Paper
manufacturing of these devices in afected communities. San Antonio negotiated solar module and tracker manufacturing by tying it to a large order for a solar PV plant by the city-owned
utility, CPS Energy.15 San Antonio’s increased emphasis on renewables followed the collapse
of a proposal for two new nuclear reactors, one of which would have been owned by CPS
Energy. The central reason for the collapse was the high and escalating estimated cost, which
approximately tripled even before construction had begun or the license to build the reactors
had been secured.16
• Decommissioning facilities: Decommissioning nuclear and coal plants and fossil fuel produc-
tion facilities can involve many jobs. Nuclear plants are required to have decommissioning
funds; all of them do. Just transition strategies should include advocacy for increasing these
funds, since they are often inadequate. A quick start to decommissioning can result in the
maintenance of many or most of the jobs at these sites, although plant workers may not be the
ones who get the decommissioning jobs. Adequate funds for decommissioning coal plants can
be mandated by Public Service Commissions in regulated areas. The problem is more complex
where generation is deregulated as in the mid-Atlantic and Northeastern regions.
• Investment in economic diversiication: This is desirable for many reasons, including coupling
training to jobs that are going to be created because the investments are already planned.
Many other examples could be added.
6. Revenues
To protect threatened workers and communities in advance requires raising funds in advance. Funds are necessary for investments to create jobs and reserve funds to protect communities. Many streams of revenues can be considered:
i. A carbon fee or tax for creating jobs prospectively in communities we know will be afected adversely if we keep fossil fuels in the ground.
ii. Eliminating fossil fuel subsidies and tax breaks.
iii. Decommissioning funds.
iv. Using the Community and Worker Protection Fund to leverage other investments.
v. A possible charge on electricity supply after renewables become 50 or 60 percent of the energy
system.
vi. General funds from income taxes.
We dicuss the irst four here.
i. A carbon tax
A carbon tax suicient to inluence market behavior for reducing greenhouse gas emissions is estimated to be on the order of tens of dollars per metric ton of CO
2-equivalent, approaching a hundred
dollars a metric ton or more.17 Such high levels of taxes would signiicantly increase the cost of energy during the transition. Fortunately, a carbon tax to make renewables competitive relative to fossil fuels is not needed; the transition can be accomplished in various ways, including by mandating renew-able energy and eiciency targets. This means that a high carbon tax is not needed for the transition.

297
Prosperous, Renewable Maryland
A more modest tax could be used for a just transition and for an afordable energy program to protect low-income households.
For instance, ten dollars per metric ton of energy-related CO2 emissions would amount to
about $50 billion per year initially. This level of tax would correspond to about a 4 percent increase in the inal cost of energy. Another $2 to $3 per metric ton would provide monies to be refunded to low-income households to ofset the efects of the tax on them. It is possible that a smaller tax could be used to leverage much larger investments. This is routinely done in energy eiciency, where public (ratepayer) funds are used to leverage larger private investments in energy eicient lighting and ap-pliances. Private manufacturing investment leveraged by the decision of a city-owned utility in San Antonio to invest in solar energy, cited above, provides another example.
As investments are made they would generate jobs; therefore the need for additional revenues would decline over time. So in contrast to carbon taxes proposed for stimulating a fossil fuel phase out, the carbon tax for the CWP Fund can be reduced; it can go to zero, as fossil fuels are phased out. This is because the CWP Fund would be used speciically to create jobs for workers in the communities afected by that phase-out before or concomitantly with the end of fossil fuel production.
The indirect jobs would still be there if the jobs for workers in fossil fuels and related indus-tries are created prospectively or concurrently and if the pay in the new jobs is comparable to the ones phased out.
ii. Ending oil and gas subsidies
Ending governmental subsidies and tax breaks to the coal, oil, and gas industries would gener-ate about $20 billion per year, initially.18 This is approximately the amount needed to make good on the U.S. share of the $100 billion per year promised to developing countries as part of the Paris Agree-ment. Another revenue source, potentially general tax revenues, would be needed over time as fossil fuel use declined. Potentially, the initial funds could be used to leverage investments and speed the transition in developing countries.
iii. Decommissioning funds
Decommissioning funds would be available in many areas (nuclear plants, many coal plants, and some fossil fuel production areas). The amounts over time could be very substantial. The devel-opment of a just transition plan should include careful consideration of decommissioning funds and related jobs.
iv. CWP Fund leverage
The CWP Fund can be used to leverage other investments, including private and public capital, in a variety of ways. For instance, some of the funds could be used to seed a Green Bank in afected communities. It could provide assistance for converting fossil fuel heating to eicient electric sys-tems on a large scale and leverage that to bring manufacturing to fossil-fuel-dependent communities. Creating targets for exports of renewable electricity could also leverage manufacturing investment in solar- and wind-energy-related manufacturing. The CWP Fund should be large enough to create such leverage.
7. ConclusionOverall, the above indicates that a modest carbon tax declining to zero over time, plus decom-
missioning funds and ending fossil fuel subsidies should provide a very solid foundation for a just

298
Attachment C: Joint Labor Network for Sustainability — IEER Discussion Paper
transition in the energy sector in the United States, while enabling the United States to meet its inter-national climate obligations. These funds should be used to create jobs prospectively in communities likely to be severely impacted and to ensure that low-income households are not adversely afected by the carbon tax.
8. References for Beyond a Band-Aid
Calvert County
2016
Timothy Hayden (Director, Department of Finance & Budget, Calvert County, Maryland). Email to
Lois Chalmers (IEER) and others. Subject: RE: Online Form Submittal: Contact Us [Calvert Clifs related taxes], April 18, 2016.
Cook 2016 Lynn Cook. “As Oil Jobs Dry Up, Workers Turn to Solar,” Wall Street
Journal, April 21, 2016. On the Web at http://www.wsj.com/articles/
as-oil-jobs-dry-up-workers-turn-to-solar-sector-1461280612.
CPS Energy 2014 Scott Wudel. “Mission Solar Energy creates ‘made-in-San Antonio’ panels,” Energized (CPS Energy Blog), September 18, 2014. On the Web at http://newsroom.cpsenergy.com/made-san-antonio-solar-panels/.
CPS Energy 2016 CPS Energy. New Energy Economy: Turning innovation into economic development. San Antonio:
CPS, accessed June 6, 2016. On the Web at https://www.cpsenergy.com/en/about-us/who-we-are/
new-energy-economy.html.
DOE 2012
SunShot
Executive
Summary
United States. Department of Energy. SunShot Vision Study: Executive. (DOE/GO-102012-3037)
[Golden, CO]: DOE, Oice of Energy Eiciency and Renewable Energy, February 2012. On the web at http://www1.eere.energy.gov/solar/pdfs/47927_executive_summary.pdf, from links at
http://energy.gov/eere/sunshot/sunshot-vision-study. Prepared by the National Renewable Energy
Laboratory.
EIA AEO 2013
CO2 Supplement
United States. Department of Energy. Energy Information Administration. Further Sensitivity Analysis of Hypothetical Policies to Limit Energy-Related Carbon Dioxide Emissions. Supplement to the Annual Energy Outlook 2013. Washington, DC: EIA, July 2013. On the Web at https://www.eia.gov/forecasts/aeo/supplement/co2/pdf/aeo2013_supplement.pdf, from link at https://www.eia.gov/forecasts/aeo/supplement/co2/.
EIA Natural Gas
2016
U.S. Department of Energy. Energy Information Administration. Underground Natural Gas Work-
ing Storage Capacity With Data for November 2015. Washington, DC: EIA, March 16, 2016. On
the Web at http://www.eia.gov/naturalgas/storagecapacity/, with link to 2015 map at http://www.
eia.gov/cfapps/ngqs/images/storage_2015.png.
Hendricks 2016 David Hendricks. “CPS Energy writes of $391.4 million from South Texas Project nuclear expan-
sion,” San Antonio Express-News, February 24, 2016, updated: February 26, 2016. On the Web at
http://www.expressnews.com/business/local/article/CPS-Energy-writes-of-391-4-million-from-South-6852804.php.
Lazard 2015 Lazard. Lazard’s Levelized Cost of Energy Analysis - Version 9.0. [New York: Lazard Ltd. Global Power, Energy & Infrastructure Group], November 2015. On the Web at https://www.lazard.com/
media/2390/lazards-levelized-cost-of-energy-analysis-90.pdf, from a link at https://www.lazard.
com/perspective/levelized-cost-of-energy-analysis-90/.
LNS et al. 2015 Labor Network For Sustainability, 350.org, and Synapse Energy Economics. The Clean Energy
Future: Protecting the Climate, Creating Jobs, Saving Money. [Washington, DC]: LNS, 350, and
Synapse, 2015. On the Web at http://www.labor4sustainability.org/wp-content/uploads/2015/10/
cleanenergy_10212015_main.pdf, from link at http://climatejobs.labor4sustainability.org/national-
report/. Frank Ackerman (Synapse) led the research team. Publication date from URL
LNS Project Labor Network for Sustainability. “Making a Living on a Living Planet,” [LNS Project]. Wash-
ington, DC: LNS, accessed June 2, 2016. On the Web at http://www.labor4sustainability.org/
making-a-living-on-a-living-planet-2/.

299
Prosperous, Renewable Maryland
Makhijani and Mills 2016
Arjun Makhijani and Christina Mills. Prosperous, Renewable, Maryland: A Roadmap for a
Healthy, Economical, and Equitable Energy Future for Maryland, (tentative title). Takoma Park, MD: Institute for Energy and Environmental Research, forthcoming 2016. Links will be on the Web at http://ieer.org/projects/renewable-maryland/.
Makhijani et al. 2014
Shakuntala Makhijani, Stephen Kretzmann, and Elizabeth Bast. Cashing in on All of the Above: U.S. Fossil Fuel Production Subsidies under Obama. Washington DC: Oil Change International, July 2014. On the Web at http://priceofoil.org/content/uploads/2014/07/OCI_US_FF_Subsidies_Final_Screen.pdf. Researched and written by Shakuntala Makhijani, with assistance and contribu-tions from Stephen Kretzmann and Elizabeth Bast.
Makhijani, Mills, and Makhijani 2016
Arjun Makhijani, Christina Mills, and Annie Makhijani. Energy Justice in Maryland’s Residential
and Renewable Energy Sectors: A report of the Renewable Maryland Project. Takoma Park, MD: Institute for Energy and Environmental Research, October 2015. On the Web at http://ieer.org/wp/wp-content/uploads/2015/10/RenMD-EnergyJustice-Report-Oct2015.pdf, from a link at http://ieer.org/resource/energy-issues/energy-justice-marylands-residential/.
NYS PSC 2016 New York Public Service Commission. Order Adopting Low Income Program Modiications and Directing Utility Findings, at a session of the Public Service Commission held in the City of Al-bany on May 19, 2016, Case 14-M-0565 - Proceeding on Motion of the Commission to Examine Programs to Address Energy Afordability for Low Income Utility Customers. Albany, PSC, Issued and Efective May 20, 2016. On the Web at http://documents.dps.ny.gov/public/Common/View-Doc.aspx?DocRefId=%7BBC2F31C9-B563-4DD6-B1EA-81A830B77276%7D.
OCI Solar 2016 OCI Solar Power. OCI History. San Antonio: OCI Solar, accessed June 2, 2016. On the Web at http://www.ocisolarpower.com/about/company-history/.
Scottish Enterprise 2016
Scottish Enterprise. Oil and Gas ‘Seize the Opportunity’ Guides: Ofshore Wind. (SE/4504) Glasgow: SE, May 2016. On the Web at www.ofshorewindscotland.org.uk/media/1116/sesdi-oil-and-gas-div-guide-ofshore-wind.pdf.
Tillier 2014 Martin Tillier. “The Fossil Fuel Industry May Not Help the Planet, But It Employs Millions,” Oilprice.com, July 9, 2014. On the Web at http://oilprice.com/Energy/Energy-General/The-Fossil-Fuel-Industry-May-Not-Help-the-Planet-But-It-Employs-Millions.html.
9. Endnotes for Beyond a Band-Aid
(Endnotes)
1 This paper is being jointly published by the Institute for Energy and Environmental Research (IEER) and the Labor Network for Sustainability (LNS). On the IEER side, it emerged from the Renewable Maryland Project, funded by the Town Creek Foundation. On the LNS side, it is part of the Climate, Jobs, and Justice Project. The core idea in this paper goes back to my analysis, over 25 years ago, on the efects of the mobility of capital and, among other things, what communities and workers might do to protect themselves in that context. More recently, the ideas in this paper were part of the equity considerations in the Renewable Maryland Project, funded by the Town Creek Foundation. They were developed with input from Joe Uehlein of LNS in that context in 2015. He is part of the Advisory Board of the Renewable Maryland Project. They were further developed fol-lowing the discussions on diiculties of a just transition at the LNS-organized meeting on “Mak-ing a Living on a Living Planet” at Georgetown University on April 20, 2016. I would like to thank Joe Uehlein (LNS), Becky Glass (LNS), Jeremy Brecher (LNS), and Jim Hare (Wisconsin Farmers Union) for their comments on an earlier draft of this paper. As part of his review, Jeremy Brecher drafted a portion of the introduction to clearly summarize the proposals and their motivation.

300
Attachment C: Joint Labor Network for Sustainability — IEER Discussion Paper
2 We have chosen to call this a “discussion paper” rather than a “report” because we see this as the start of a new conversation about how to ensure a just transition. In particular, the means of fund-
ing the just transition need to be further explored as it is likely to be diicult to get a national carbon tax and there is a need to create jobs in many fossil-fuel centered areas in the near term.
3 See, for instance, Lazard’s Levelized Cost of Energy Analysis – version 9.0 (Lazard, New
York, November 2015, slide 2, at https://www.lazard.com/media/2390/lazards-levelized-cost-of-en-
ergy-analysis-90.pdf) which shows that wind and utility-scale solar are cheaper than coal and nucle-
ar; wind is cheaper than natural gas combined cycle plants; and solar is projected to be cost-compet-
itive in a couple of years, even without factoring in natural gas price volatility risk. When wind and
solar are combined with eiciency, the overall costs are considerably lower than fossil fuels or new nuclear. Distributed solar costs are declining. The Department of Energy’s SunShot initiative aims
for low costs by the year 2020. See SunShot Vision Study (DOE, Washington, DC, 2012, Executive
Summary, p. xix, at http://www1.eere.energy.gov/solar/pdfs/47927_executive_summary.pdf (DOE
2012 SunShot)). The program appears to be on track.
4 A number of studies have come to such conclusions, including The Clean Energy Future:
Protecting the Climate, Creating Jobs, Saving Money (Labor Network for Sustainability; 350.org,
and Synapse Energy Economics, Washington, DC, 2015, at http://www.labor4sustainability.org/
wp-content/uploads/2015/10/cleanenergy_10212015_main.pdf (LNS et al. 2015)). The “research
[was] conducted by a team led by economist Frank Ackerman of Synapse Energy Economics” (p. 2) IEER’s comprehensive roadmap for a renewable energy future in Maryland, including a zero-emis-
sions electricity sector and a detailed economic assessment, will be published in 2016. See Makhi-
jani and Mills 2016.
5 Arjun Makhijani, Christina Mills, and Annie Makhijani. Energy Justice in Maryland’s Resi-
dential and Renewable Energy Sectors: A report of the Renewable Maryland Project. Takoma Park,
MD: Institute for Energy and Environmental Research, October 2015. On the Web at http://ieer.org/
wp/wp-content/uploads/2015/10/RenMD-EnergyJustice-Report-Oct2015.pdf
6 I exclude geoengineering solutions from consideration as too risky.
7 IEER’s detailed analysis of Maryland’s energy sector indicates that baseload electric power
plants will not be needed in the smart, renewable grid-of-the-future. Moreover nuclear and coal pow-
er plants are not lexible enough to complement variable wind and solar. Indeed, nuclear and coal plants can become a hindrance at high levels of wind and solar penetration because their response
time (known technically as “ramp rate”) is too slow for the needs of such a grid. The resources that it a renewable energy future include demand response, batteries, vehicle-to-grid technology, mi-crogrids, and strategic eiciency investments.
8 “Making a Living on a Living Planet” is a project of the Labor Network for Sustainability – for details see http://www.labor4sustainability.org/making-a-living-on-a-living-planet-2/.
9 Arjun Makhijani and Christina Mills, Prosperous, Renewable, Maryland: A Roadmap for a
Healthy, Economical, and Equitable Energy Future for Maryland (tentative title). (Institute for En-
ergy and Environmental Research, Takoma Park, MD, forthcoming 2016, at http://ieer.org/projects/
renewable-maryland/.
301
Prosperous, Renewable Maryland
10 Timothy Hayden (Director, Department of Finance & Budget, Calvert County, Maryland), Email to Lois Chalmers (IEER) and others, Subject: RE: Online Form Submittal: Contact Us [Cal-
vert Clifs related taxes], April 18, 2016 (Calvert County 2016).
11 There are natural gas-related pipelines and a major storage facility (in Western Maryland). A liqueied natural gas export terminal has also been licensed. The transition discussed in this paper would cover the jobs in such centralized fossil fuel facilities.
12 Lynn Cook, “As Oil Jobs Dry Up, Workers Turn to Solar,” Wall Street Journal, April 21, 2016, at http://www.wsj.com/articles/as-oil-jobs-dry-up-workers-turn-to-solar-sector-1461280612.
13 Scottish Enterprise, Oil and Gas ‘Seize the Opportunity’ Guides: Ofshore Wind (SE, Glasgow, May 2016, at www.ofshorewindscotland.org.uk/media/1116/sesdi-oil-and-gas-div-guide-ofshore-wind.pdf).
14 Site-speciic studies are needed to establish feasibility. Natural gas storage caverns are com-mon in the Appalachian region. See the Energy Information Administration map of underground natural gas storage facilities (Underground Natural Gas Working Storage Capacity with Data for November 2015, EIA, Washington, DC, March 16, 2016, at http://www.eia.gov/naturalgas/storage-capacity/, with link to 2015 map at http://www.eia.gov/cfapps/ngqs/images/storage_2015.png (EIA Natural Gas 2016)).
15 The manufacturing project was launched in 2015. See OCI Solar Power, OCI History (OCI, San Antonio, accessed June 2, 2016, at http://www.ocisolarpower.com/about/company-history/) and Scott Wudel, “Mission Solar Energy creates ‘made-in-San Antonio’ panels,” Energized (CPS Energy Blog), September 18, 2014, at http://newsroom.cpsenergy.com/made-san-antonio-solar-panels/ (CPS Energy 2014).
16 David Hendricks, “CPS Energy writes of $391.4 million from South Texas Project nu-clear expansion,” San Antonio Express-News, February 24, 2016, updated February 26, 2016, at http://www.expressnews.com/business/local/article/CPS-Energy-writes-of-391-4-million-from-South-6852804.php.
17 For instance, the Energy Information Administration has estimated that a CO2 fee starting at
$30 per metric ton and rising to about $107 per metric ton by 2040 (in constant 2011 dollars) would reduce CO
2 emissions by about 89 percent by 2040 relative to 2005. See the EIA’s analysis (Further
Sensitivity Analysis of Hypothetical Policies to Limit Energy-Related Carbon Dioxide Emissions. Supplement to the Annual Energy Outlook 2013, EIA, Washington, DC, July 2013, Figure 3, at https://www.eia.gov/forecasts/aeo/supplement/co2/. (EIA AEO 2013 CO
2 Supplement)
18 Shakuntala Makhijani et al., Cashing in on All of the Above: U.S. Fossil Fuel Production
Subsidies under Obama (Oil Change International, Washington DC, July 2014, p. 4, at http://priceo-foil.org/content/uploads/2014/07/OCI_US_FF_Subsidies_Final_Screen.pdf).


The Renewable Maryland Project is funded by the Town Creek Foundation
Find more information online at www.ieer.org/projects/renewable-maryland
IEER Press