road safety in 170 low-, middle-, and high-income - deep blue
TRANSCRIPT
UMTRI-2013-37 OCTOBER 2013
ROAD SAFETY IN 170 LOW-, MIDDLE-, AND HIGH-INCOME COUNTRIES
MICHAEL SIVAK BRANDON SCHOETTLE

ROAD SAFETY IN 170 LOW-, MIDDLE-, AND HIGH-INCOME COUNTRIES
Michael Sivak Brandon Schoettle
The University of Michigan Transportation Research Institute
Ann Arbor, Michigan 48109-2150 U.S.A.
Report No. UMTRI-2013-37 October 2013
i
Technical Report Documentation Page 1. Report No.
UMTRI-2013-37 2. Government Accession No.
3. Recipientʼs Catalog No.
4. Title and Subtitle Road Safety in 170 Low-, Middle-, and High-Income Countries
5. Report Date
October 2013
6. Performing Organization Code
383818 7. Author(s) Michael Sivak and Brandon Schoettle
8. Performing Organization Report No. UMTRI-2013-27
9. Performing Organization Name and Address The University of Michigan Transportation Research Institute 2901 Baxter Road Ann Arbor, Michigan 48109-2150 U.S.A.
10. Work Unit no. (TRAIS)
11. Contract or Grant No.
12. Sponsoring Agency Name and Address The University of Michigan Sustainable Worldwide Transportation http://www.umich.edu/~umtriswt
13. Type of Report and Period Covered 14. Sponsoring Agency Code
15. Supplementary Notes 16. Abstract
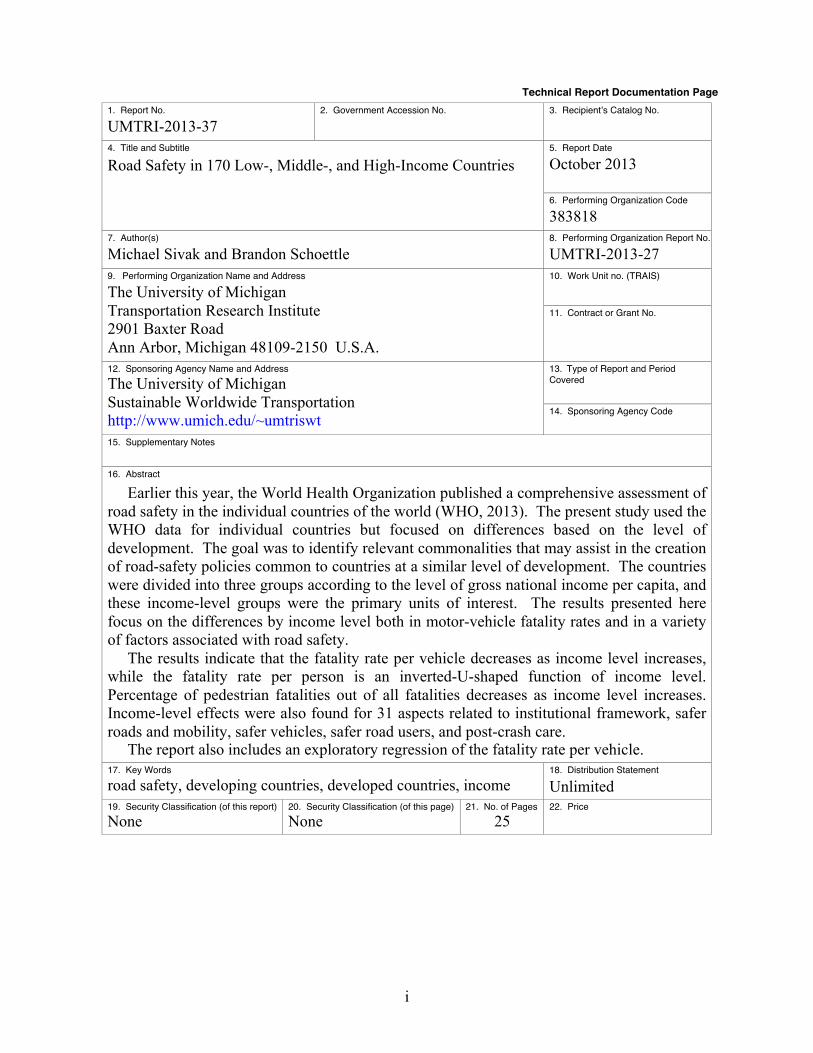
Earlier this year, the World Health Organization published a comprehensive assessment of road safety in the individual countries of the world (WHO, 2013). The present study used the WHO data for individual countries but focused on differences based on the level of development. The goal was to identify relevant commonalities that may assist in the creation of road-safety policies common to countries at a similar level of development. The countries were divided into three groups according to the level of gross national income per capita, and these income-level groups were the primary units of interest. The results presented here focus on the differences by income level both in motor-vehicle fatality rates and in a variety of factors associated with road safety. The results indicate that the fatality rate per vehicle decreases as income level increases, while the fatality rate per person is an inverted-U-shaped function of income level. Percentage of pedestrian fatalities out of all fatalities decreases as income level increases. Income-level effects were also found for 31 aspects related to institutional framework, safer roads and mobility, safer vehicles, safer road users, and post-crash care. The report also includes an exploratory regression of the fatality rate per vehicle. 17. Key Words road safety, developing countries, developed countries, income
18. Distribution Statement Unlimited
19. Security Classification (of this report) None
20. Security Classification (of this page) None
21. No. of Pages 25
22. Price

ii
Contents
Introduction ..........................................................................................................................1
Method .................................................................................................................................2
Results ..................................................................................................................................3
Basic rates .......................................................................................................................3
Institutional framework ...................................................................................................5
Safer vehicles ..................................................................................................................5
Safer road users ...............................................................................................................7
Safer roads and mobility ...............................................................................................14
Post-crash care ..............................................................................................................15
Discussion and Conclusions ..............................................................................................18
References ..........................................................................................................................22

iii
Acknowledgment
Appreciation is extended to WHO for providing the raw data for individual
countries in digital form. However, the authors are solely responsible for this report.
1
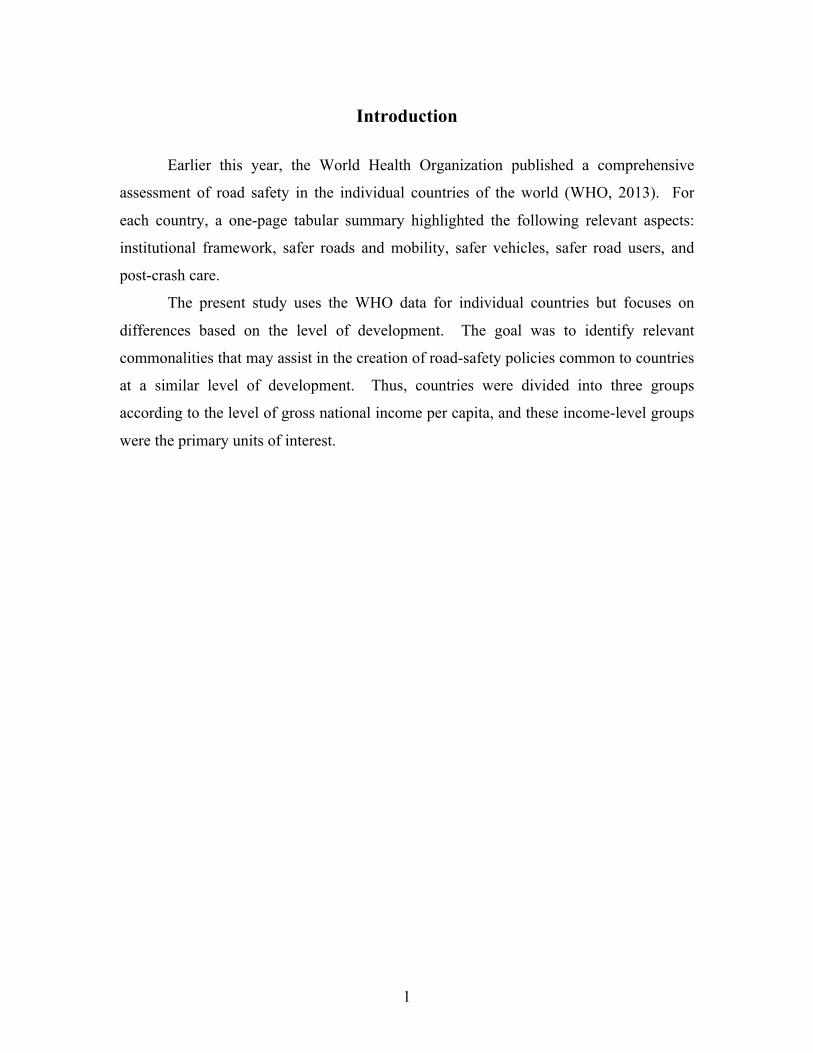
Introduction Earlier this year, the World Health Organization published a comprehensive
assessment of road safety in the individual countries of the world (WHO, 2013). For
each country, a one-page tabular summary highlighted the following relevant aspects:
institutional framework, safer roads and mobility, safer vehicles, safer road users, and
post-crash care.
The present study uses the WHO data for individual countries but focuses on
differences based on the level of development. The goal was to identify relevant
commonalities that may assist in the creation of road-safety policies common to countries
at a similar level of development. Thus, countries were divided into three groups
according to the level of gross national income per capita, and these income-level groups
were the primary units of interest.

2
Method Data for individual countries in digital form was obtained directly from WHO.
Most of the data were for 2010. Two inclusion criteria were imposed on the countries: a
nonzero number of fatalities in the reporting year (so that fatality rates could be
calculated), and a population of at least 100,000 (to avoid large year-to-year deviations
possible with small numbers of fatalities). As a result, the analysis was based on 170
countries.
All road safety aspects in the WHO publication that appeared to be consistently
reported for all countries were examined for differences between income-level categories.
(An example of a variable that was not consistently reported by all countries is the
breakdown of all vehicles into vehicle groups.)
The three income levels employed followed the WHO categorization by gross
national income per person (WHO, 2013): low (less than $1,006), middle ($1,006 to
$12,275), and high (more than $12,275).
The Results section will focus on significant differences by income level. The
exposition will use the same categorization of relevant aspects as in the original WHO
publication: institutional framework, safer roads and mobility, safer vehicles, safer road
users, and post-crash care. A total of 31 significant differences for aspects in these
categories will be presented.
An additional category, basic rates, will present a motorization rate and three
basic fatality rates that were calculated using the WHO data. The fatality rates are based
on the reported fatalities that WHO adjusted for the 30-day definition of road traffic death
(not on the modeled deaths that WHO also provides based on a regression model).
The WHO publication includes a variety of estimates (including estimates of
effectiveness of several laws related to road safety). These estimates were made by
safety experts in the respective countries.
3
Results
Basic rates
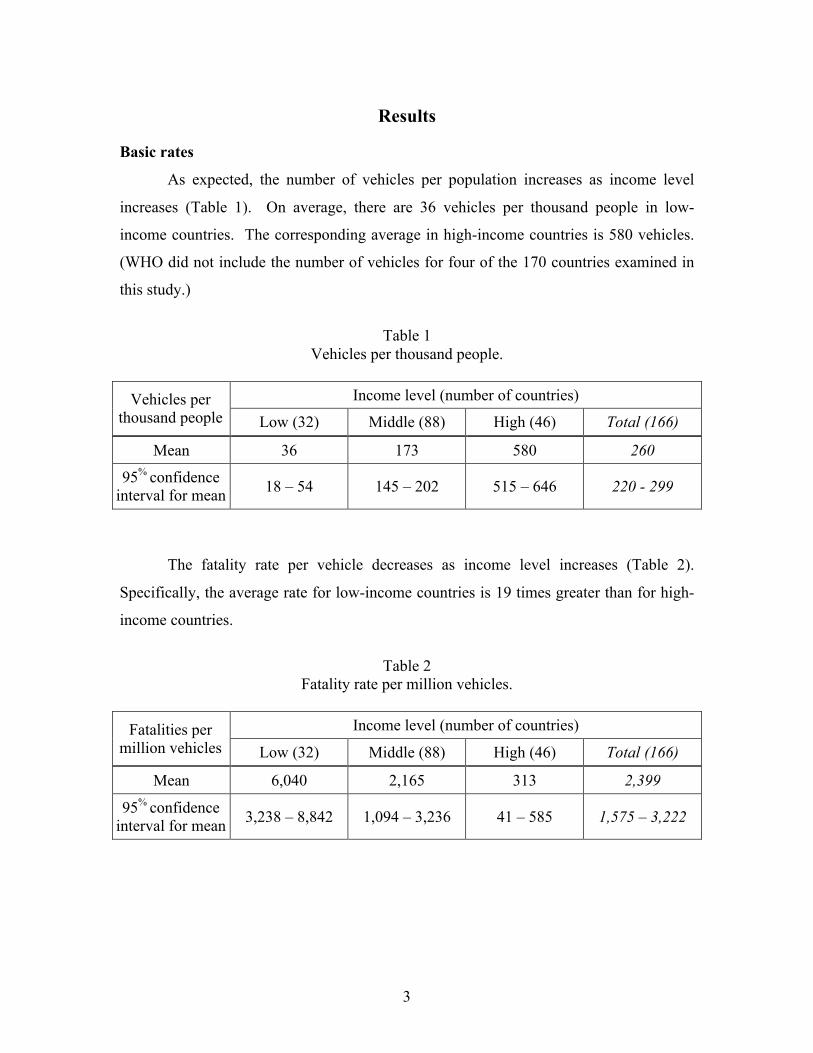
As expected, the number of vehicles per population increases as income level
increases (Table 1). On average, there are 36 vehicles per thousand people in low-
income countries. The corresponding average in high-income countries is 580 vehicles.
(WHO did not include the number of vehicles for four of the 170 countries examined in
this study.)
Table 1
Vehicles per thousand people.
Vehicles per thousand people
Income level (number of countries)
Low (32) Middle (88) High (46) Total (166)
Mean 36 173 580 260
95% confidence interval for mean 18 – 54 145 – 202 515 – 646 220 - 299
The fatality rate per vehicle decreases as income level increases (Table 2).
Specifically, the average rate for low-income countries is 19 times greater than for high-
income countries.
Table 2
Fatality rate per million vehicles.
Fatalities per million vehicles
Income level (number of countries)
Low (32) Middle (88) High (46) Total (166)
Mean 6,040 2,165 313 2,399
95% confidence interval for mean 3,238 – 8,842 1,094 – 3,236 41 – 585 1,575 – 3,222
4
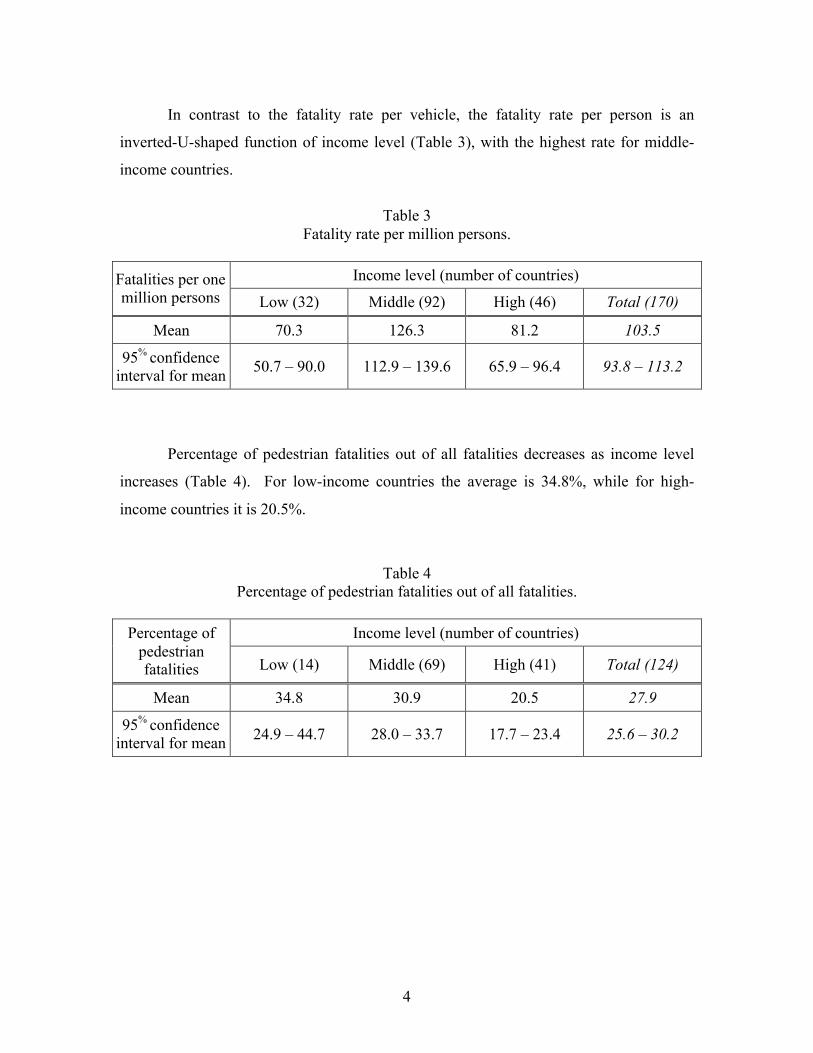
In contrast to the fatality rate per vehicle, the fatality rate per person is an
inverted-U-shaped function of income level (Table 3), with the highest rate for middle-
income countries.
Table 3
Fatality rate per million persons.
Fatalities per one million persons
Income level (number of countries)
Low (32) Middle (92) High (46) Total (170)
Mean 70.3 126.3 81.2 103.5
95% confidence interval for mean 50.7 – 90.0 112.9 – 139.6 65.9 – 96.4 93.8 – 113.2
Percentage of pedestrian fatalities out of all fatalities decreases as income level
increases (Table 4). For low-income countries the average is 34.8%, while for high-
income countries it is 20.5%.
Table 4 Percentage of pedestrian fatalities out of all fatalities.
Percentage of
pedestrian fatalities
Income level (number of countries)
Low (14) Middle (69) High (41) Total (124)
Mean 34.8 30.9 20.5 27.9
95% confidence interval for mean 24.9 – 44.7 28.0 – 33.7 17.7 – 23.4 25.6 – 30.2

5
Institutional framework
The likelihood of having a national road-safety strategy increases with income
level (Table 5). Such a strategy exists in 59.4% of low-income countries and 91.3% of
high-income countries.
Table 5
National road-safety strategy.
National road-safety strategy
Income level (number of countries)
Low (32) Middle (92) High (46) Total (170)
Yes 59.4 80.4 91.3 79.4
No 40.6 19.6 8.7 20.6
Safer vehicles
The probability that a country applies the UN World Forum for Harmonization of
Vehicle Regulations increases with income level (Table 6). Only 3.6% of low-income
countries apply these regulations, compared to 68.3% of high-income countries.
Table 6
The UN World Forum for Harmonization of Vehicle Regulations.
UN World Forum applied
Income level (number of countries)
Low (28) Middle (78) High (41) Total (147)
Yes 3.6 28.2 68.3 34.7
No 96.4 71.8 31.7 65.3
6
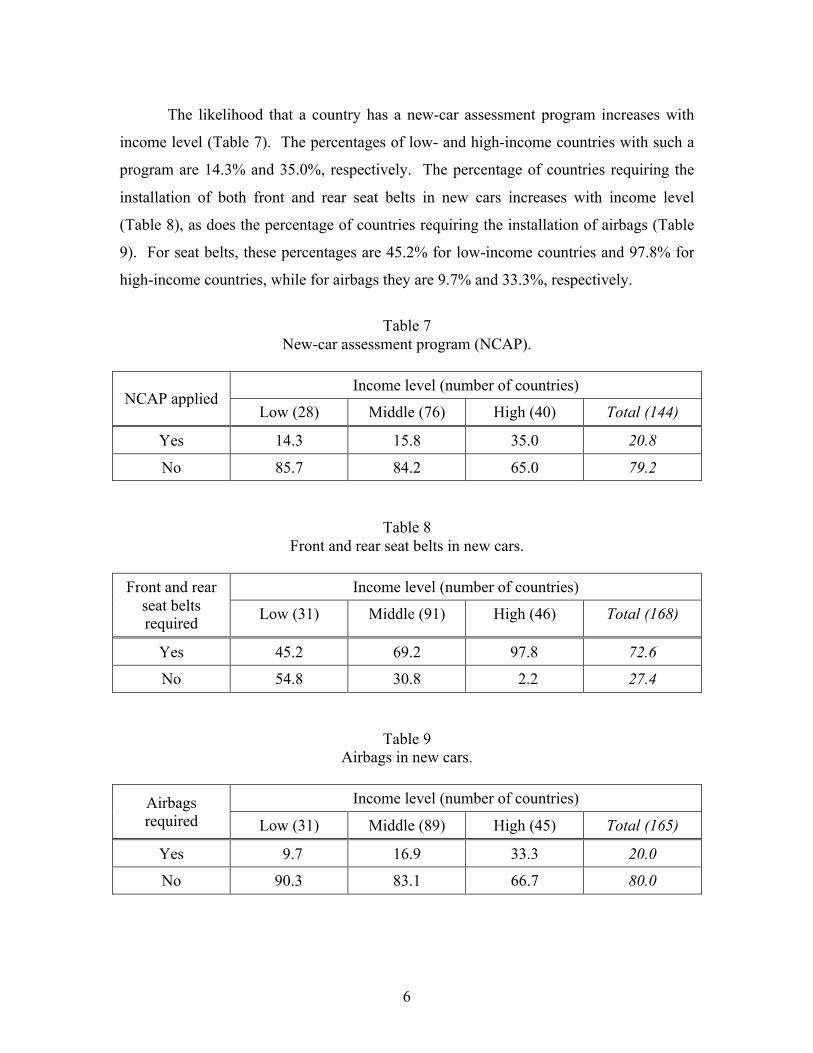
The likelihood that a country has a new-car assessment program increases with
income level (Table 7). The percentages of low- and high-income countries with such a
program are 14.3% and 35.0%, respectively. The percentage of countries requiring the
installation of both front and rear seat belts in new cars increases with income level
(Table 8), as does the percentage of countries requiring the installation of airbags (Table
9). For seat belts, these percentages are 45.2% for low-income countries and 97.8% for
high-income countries, while for airbags they are 9.7% and 33.3%, respectively.
Table 7
New-car assessment program (NCAP).
NCAP applied Income level (number of countries)
Low (28) Middle (76) High (40) Total (144)
Yes 14.3 15.8 35.0 20.8
No 85.7 84.2 65.0 79.2
Table 8 Front and rear seat belts in new cars.
Front and rear
seat belts required
Income level (number of countries)
Low (31) Middle (91) High (46) Total (168)
Yes 45.2 69.2 97.8 72.6
No 54.8 30.8 2.2 27.4
Table 9 Airbags in new cars.
Airbags required
Income level (number of countries)
Low (31) Middle (89) High (45) Total (165)
Yes 9.7 16.9 33.3 20.0
No 90.3 83.1 66.7 80.0

7
For electronic stability control, low-income countries have similar installation
rates as middle-income countries (6.5% vs. 5.9%), with both of these groups having
lower rates than high-income countries (21.7%) (Table 10).
Table 10
Electronic stability control (ESC) in new cars.
ESC required Income level (number of countries)
Low (31) Middle (85) High (46) Total (162)
Yes 6.5 5.9 21.7 10.5
No 93.5 94.1 78.3 89.5
Safer road users
The percentage of countries with a national demerit/points penalty system in place
increases with income level (Table 11). The average percentages for low- and high-
income countries are 31.3% and 73.9%, respectively.
Table 11
Demerit/points penalty system.
Penalty system in place
Income level (number of countries)
Low (32) Middle (91) High (46) Total (169)
Yes, national 31.3 50.5 73.9 53.3
Yes, subnational 0 0 2.2 0.6
No 68.8 49.5 23.9 46.2

8
Maximum speed limits on rural roads (Table 12) tend to be lower in low- and
middle-income countries (averaging 67 km/h and 69 km/h, respectively) than in high-
income countries (81 km/h). Analogously, maximum speed limits near schools
(Table 13) tend to be lower in low- and middle-income countries (averaging 34 km/h in
both) than in high-income countries (41 km/h).
The estimated effectiveness of speed-limit enforcement increases with increasing
income level (Table 14).
Table 12 Maximum speed limit on rural roads (km/h).
Speed limit on rural roads
Income level (number of countries)
Low (26) Middle (79) High (41) Total (146)
Mean 67 69 81 72
95% confidence interval for mean 59 – 75 65 – 74 76 – 87 69 - 76
Table 13 Maximum speed limit near schools (km/h).
Speed limit near schools
Income level (number of countries)
Low (24) Middle (72) High (29) Total (125)
Mean 34 34 41 36
95% confidence interval for mean 29 – 39 31 – 37 37 – 45 33 - 38
Table 14 Effectiveness of speed-limit enforcement (0 = lowest, 10 = highest).
Effectiveness of speed-limit enforcement
Income level (number of countries)
Low (32) Middle (91) High (42) Total (165)
Mean 3.8 4.9 6.4 5.1
95% confidence interval for mean 3.1 – 4.5 4.5 – 5.4 5.8 – 6.9 4.7 – 5.4
9
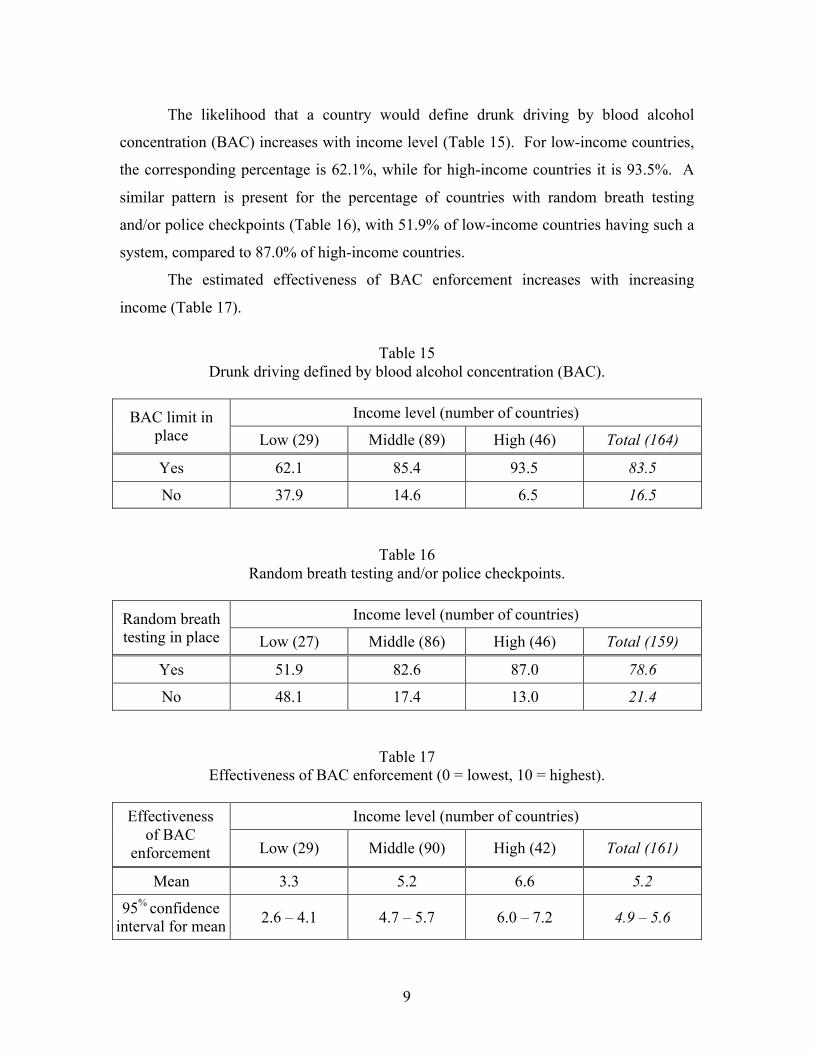
The likelihood that a country would define drunk driving by blood alcohol
concentration (BAC) increases with income level (Table 15). For low-income countries,
the corresponding percentage is 62.1%, while for high-income countries it is 93.5%. A
similar pattern is present for the percentage of countries with random breath testing
and/or police checkpoints (Table 16), with 51.9% of low-income countries having such a
system, compared to 87.0% of high-income countries.
The estimated effectiveness of BAC enforcement increases with increasing
income (Table 17).
Table 15
Drunk driving defined by blood alcohol concentration (BAC).
BAC limit in place
Income level (number of countries)
Low (29) Middle (89) High (46) Total (164)
Yes 62.1 85.4 93.5 83.5
No 37.9 14.6 6.5 16.5
Table 16 Random breath testing and/or police checkpoints.
Random breath testing in place
Income level (number of countries)
Low (27) Middle (86) High (46) Total (159)
Yes 51.9 82.6 87.0 78.6
No 48.1 17.4 13.0 21.4
Table 17 Effectiveness of BAC enforcement (0 = lowest, 10 = highest).
Effectiveness
of BAC enforcement
Income level (number of countries)
Low (29) Middle (90) High (42) Total (161)
Mean 3.3 5.2 6.6 5.2
95% confidence interval for mean 2.6 – 4.1 4.7 – 5.7 6.0 – 7.2 4.9 – 5.6

10
As is evident from Table 18, a lower percentage of low-income countries have
national seat-belt laws than middle- or high-income countries (68.8% vs. 95.7% and
93.5%). The likelihood that such a law applies to all occupants increases with income
level (Table 19), as does the estimated effectiveness of its enforcement (Table 20).
Table 18
National seat-belt law.
National seat-belt law
Income level (number of countries)
Low (32) Middle (92) High (46) Total (170)
Yes, national 68.8 95.7 93.5 90.0
Yes, subnational 0 0 6.5 1.8
No 31.3 4.3 0 8.2
Table 19
Applicability of seat-belt law.
Law applies to all occupants
Income level (number of countries)
Low (22) Middle (88) High (45) Total (155)
Yes 54.5 63.6 84.4 68.4
No 45.5 36.4 15.6 31.6
Table 20 Effectiveness of seat-belt-law enforcement (0 = lowest, 10 = highest).
Effectiveness
of seat-belt-law enforcement
Income level (number of countries)
Low (22) Middle (87) High (42) Total (151)
Mean 4.8 5.8 6.8 5.9
95% confidence interval for mean 3.6 – 5.9 5.3 – 6.2 6.2 – 7.4 5.6 – 6.3

11
The data in Table 21 indicate that the percentage of countries with a national
child-restraint law increases with increasing income level. There are 29.0% of low-
income countries with such a law, in contrast to 80.4% of high-income countries. The
estimated effectiveness of enforcement of such laws increases with increasing income
level (Table 22).
Table 21
National child-restraint law.
Child-restraint law
Income level (number of countries)
Low (31) Middle (88) High (46) Total (165)
Yes, national 29.0 44.3 80.4 51.5
Yes, subnational 3.2 2.3 6.5 3.6
No 67.7 53.4 13.0 44.8
Table 22
Effectiveness of child-restraint-law enforcement (0 = lowest, 10 = highest).
Effectiveness of child-restraint-law enforcement
Income level (number of countries)
Low (8) Middle (37) High (36) Total (81)
Mean 1.1 3.8 6.4 4.7
95% confidence interval for mean 0.1 – 2.2 2.9 – 4.8 5.7 – 7.0 4.1 – 5.2

12
National helmet laws exist in fewer low-income countries (87.5%) than in middle-
or high-income countries (96.7% and 93.5%) (Table 23). The estimated effectiveness of
enforcement of such laws increases with increasing income level (Table 24). The
existence of helmet-performance standards (Table 25) increases as income level increases
(35.7% in low-income countries vs. 88.6% in high-income countries).
Table 23
National helmet law.
National helmet law
Income level (number of countries)
Low (32) Middle (92) High (46) Total (170)
Yes, national 87.5 96.7 93.5 94.1
Yes, subnational 0 2.2 6.5 2.9
No 12.5 1.1 0 2.9
Table 24
Effectiveness of helmet-wearing-law enforcement (0 = lowest, 10 = highest).
Effectiveness of helmet-wearing
law
Income level (number of countries)
Low (28) Middle (90) High (42) Total (160)
Mean 3.8 5.7 7.8 5.9
95% confidence interval for mean 2.9 – 4.6 5.3 – 6.2 7.3 – 8.3 5.5 – 6.3
Table 25 Helmet-performance standard.
Helmet-
performance standard
Income level (number of countries)
Low (28) Middle (86) High (44) Total (158)
Yes 35.7 50.0 88.6 58.2
No 64.3 50.0 11.4 41.8

13
The percentage of countries with a national law on mobile-phone use while
driving increases with income level (Table 26). The corresponding percentages for low-
and high-income countries are 56.3% and 87.0%, respectively. Availability of data on
mobile-phone use while driving increases with income level (Table 27). For low-income
countries, this percentage is 23.3%, while for high-income countries it is 63.6%.
Table 26 Law on mobile phone use while driving.
Mobile-phone law
Income level (number of countries)
Low (32) Middle (91) High (46) Total (169)
Yes, national 56.3 78.0 87.0 76.3
Yes, subnational 3.1 4.4 6.5 4.7
No 40.6 17.6 6.5 18.9
Table 27 Data on mobile-phone use while driving.
Availability of mobile-phone
data
Income level (number of countries)
Low (30) Middle (90) High (44) Total (164)
Yes 23.3 33.3 63.6 39.6
No 76.7 66.7 36.4 60.4

14
Safer roads and mobility
The percentage of countries with a national policy to promote walking or cycling
increases with income level (Table 28). The corresponding percentages for low- and
high-income countries are 6.3% and 60.0%, respectively. A similar trend is present for
the existence of a national policy to encourage investment in public transport (Table 29).
The corresponding percentages for low- and high-income countries are 31.3% and 71.7%,
respectively.
Table 28 National policy to promote walking or cycling.
Existence of policy
Income level (number of countries)
Low (32) Middle (89) High (45) Total (166)
Yes, national 6.3 13.5 60.0 24.7
Yes, subnational 0 21.3 11.1 14.5
No 93.8 65.2 28.9 60.8
Table 29 National policy to encourage investment in public transport.
Existence of policy
Income level (number of countries)
Low (32) Middle (86) High (46) Total (164)
Yes, national 31.3 48.8 71.7 51.8
Yes, subnational 12.5 11.6 15.2 12.8
No 56.3 39.5 13.0 35.4

15
Low- and middle-income countries have a lower likelihood of having a national
policy to separate road users to protect vulnerable road users (22.6% and 16.9%) than
high-income countries (46.7%) (Table 30).
Table 30 National policy to separate road users to protect vulnerable road users.
Existence of policy
Income level (number of countries)
Low (31) Middle (89) High (45) Total (165)
Yes, national 22.6 16.9 46.7 26.1
Yes, subnational 9.7 21.3 24.4 20.0
No 67.7 61.8 28.9 53.9
Post-crash care
The probability of having a vital registration system increases with income level
(Table 31). Such systems are present in 59.4% of low-income countries and 100% of
high-income countries.
Table 31 Vital registration system.
Vital
registration system
Income level (number of countries)
Low (32) Middle (92) High (45) Total (169)
Yes 59.4 91.3 100.0 87.6
No 40.6 8.7 0 12.4

16
Availability of a universal emergency telephone number increases with income
level (Table 32). Such access numbers (either single or multiple) are available in 46.7%
of low-income countries and 100% of high-income countries.
Table 32 Universal emergency access telephone number.
Emergency access number
Income level (number of countries)
Low (30) Middle (92) High (46) Total (168)
Yes, national 30.0 57.6 87.0 60.7
Yes, multiple 16.7 30.4 13.0 23.2
Yes, subnational 13.3 5.4 0 5.4
None 40.0 6.5 0 10.7
The estimated percentage of seriously injured patients transported by ambulance
increases with income level (Table 33). No ambulance service is available in 12.9% of
low-income countries; in contrast, 100% of high-income countries have such service.
Furthermore, in 6.5% of low-income countries at least 75% of seriously injured patients
are transported by ambulance, while the corresponding percentage in high-income
countries is 50.0%.
Table 33 Percentage of seriously injured patents transported by ambulance.
Percentage transported
Income level (number of countries)
Low (31) Middle (84) High (42) Total (157)
≤10 61.3 26.2 7.1 28.0
11-49 19.4 20.2 19.0 19.7
50-74 0 15.5 23.8 14.6
≥75 6.5 34.5 50.0 33.1
No service 12.9 3.6 0 4.5

17
The availability of training for emergency medicine for both doctors and nurses
increases with income level. Such training for doctors is present for 51.9% of low-
income countries and 82.2% of high-income countries (Table 34). The corresponding
percentages for training for nurses are 26.7% and 76.1% (Table 35).
Table 34 Training for emergency medicine for doctors.
Training available
Income level (number of countries)
Low (27) Middle (89) High (45) Total (161)
Yes 51.9 75.3 82.2 73.2
No 48.1 24.7 17.8 26.7
Table 35 Training for emergency medicine for nurses.
Training available
Income level (number of countries)
Low (30) Middle (88) High (46) Total (164)
Yes 26.7 53.4 76.1 54.9
No 73.3 46.6 23.9 45.1

18
Discussion and Conclusions
Basic rates
Three expected patterns were obtained as a function of increasing income level:
increasing number of vehicles per population (Table 1), decreasing number of fatalities
per vehicle (Table 2), and an inverted-U-shaped function of fatalities per population
(Table 3).
The latter finding—a non-monotonic Kuznets curve of fatalities per population as
a function of income level—is consistent with other studies (e.g., McManus, 2007). The
reason for the non-monotonic aspect of this relationship becomes evident when fatalities
per population (F/P) are decomposed into vehicles per population (V/P) multiplied by
fatalities per vehicle (F/V). The reason for the initial increase of F/P with income is that,
at lower income levels, the increase in V/P is steeper than the decrease in F/V. However,
at higher income levels, the increase in V/P is shallower than the decrease in F/V.
Another way of restating the above is that, at low-income levels, the increase in
motorization is steeper than the improvements in road safety per vehicle. Conversely, at
high-income levels, the increase in motorization is shallower (approaching saturation)
than the improvements in road safety per vehicle.
Percentage of pedestrian fatalities out of all fatalities decreases as income level
increases (Table 4). This trend is consistent with previous findings (e.g., Downing,
Sayer, and Zaher-ul-Islam, 1993).
Institutional framework
Low-income countries are less likely to have a national road-safety strategy than
middle- and high-income countries (Table 5).
Safer vehicles
In comparison to middle- and high-income countries, low-income countries are
less likely to do the following: apply the UN Forum for Harmonization of Vehicle
Regulations (Table 6), have a new-car assessment program (Table 7), and require that
new cars have front and rear seat belts (Table 8), airbags (Table 9), and electronic
stability control (Table 10). (For electronic stability control—a relatively new

19
technology—low-income countries have similar installation rates as middle-income
countries, with both of these groups having lower rates than high-income countries.)
Safer road users
Fewer low-income countries have a demerit/points penalty system in place than
middle- and high-income countries (Table 11).
Low- and middle-income countries tend to have lower maximum speed limits
both on rural roads (Table 12) and near schools (Table 13). However, the estimated
effectiveness of speed-limit enforcement increases with increasing income-level (Table
14).
The likelihood that a country defines drunk driving by BAC increases with
income level (Table 15), as does the use of random breath testing and/or police check
points (Table 16). The estimated effectiveness of BAC enforcement increases with
increasing income level (Table 17).
Fewer low-income countries have a national seat-belt law than do middle- and
high-income countries (Table 18). The likelihood that such a law applies to all occupants
and its estimated effectiveness of enforcement both increase with increasing income level
(Tables 19 and 20).
The likelihood that a low-income country has a national child-restraint law
increases with income level (Table 21), as does the estimated effectiveness of its
enforcement (Table 22).
Fewer low-income countries have a national helmet law than do middle- and
high-income countries (Table 23). The estimated effectiveness of enforcement of such
laws increases with income level (Table 24), as does the existence of a helmet-
performance standard (Table 25).
The probability of having a law concerning mobile-phone use while driving
increases with income level (Table 26). The availability of data on mobile-phone use
while driving increases with income level (Table 27).

20
Safer roads and mobility
The likelihood that a country has a national policy to promote walking and
cycling increases with income level (Table 28), as does the likelihood of having a
national policy to encourage investment in public transport (Table 29). Low- and middle-
income countries are less likely than high-income countries to have a national policy to
separate road users to protect vulnerable road users (Table 30).
Post-crash care
As income level increases, so does the probability of having a vital registration
system (Table 31) and a universal emergency access phone number (Table 32).
The estimated percentage of seriously injured patients transported by ambulance
increases with income level (Table 33).
The availability of training for emergency medicine for doctors and nurses
increases with income level (Table 34 and 35).
Predicting the fatality rate per vehicle
Correlational analysis. Pairwise correlations were computed between the fatality
rate per vehicle and 30 variables that varied significantly as a function of income level.
These variables are described in Tables 5 through 32, and Tables 34 and 35. (Percentage
of seriously injured patients transported by ambulance [Table 33] was not included
because the way this variable was coded precluded its use in a correlational analysis.)
Nineteen pairwise correlation coefficients (out of 30) were statistically significant, with
the highest coefficient for the existence of a vital registration system (r = .35).
Factor analysis. To reduce the number of variables to be entered in a regression
analysis to follow, a factor analysis was performed on the variables that were
significantly correlated with the fatality rate per vehicle (from the above correlational
analysis) and that had data for at least 160 countries. (The fatality rate per vehicle—the
dependent variable in the regression to follow—was available for 166 countries.)
Because of these two constraints, only 14 variables (out of the original 30 candidate
variables) were entered into this factor analysis. The analysis yielded three factors,
which accounted for a total of 50.0% of the variance.

21
Regression analysis. This analysis was performed as an illustration of an
approach to guide future research. In this regression, the dependent variable was the
fatality rate per vehicle. There were three predictor variables, one each from the three
factors in the above factor analysis. For each factor, the variable that was entered into the
regression was the one with the highest loading (positive or negative). The selected
variables were: effectiveness of speed-limit enforcement, existence of training in
emergency medicine for doctors, and existence of a national seat-belt law. A total of 153
countries had data for all three of these variables.
The results indicate that the regression model was statistically significant (F2,152 =
9.0, p < .001). The model accounted for 11% of the variance in the fatality rate per
vehicle. Two of the three predictor variables entered into the regression were significant:
effectiveness of speed-limit enforcement and existence of a national seat-belt law. Both
effects were in the expected directions.
Important note. The specific results of this regression are of a limited value and
need to be interpreted with great caution. The reasons for the caution are as follows:
Several variables (5 out of 19) that differed significantly by income level and were
correlated to the fatality rate per vehicle were not among the possible candidates for the
regression because the data for these variables were available for fewer countries than our
arbitrary minimum of 160 countries. Furthermore, even with this minimum, only 153
countries (of the 170 countries examined) had data for all entered variables. (These
concerns are in addition to the fact that regression analysis can be used only to explore
associations, as opposed to causal links.) Consequently, the primary value of this
regression (and of the associated correlational analysis and factor analysis) is in providing
a conceptual framework to be considered for use in future research once a larger set of
potentially relevant data is available for more countries.
22
References Downing, A.J., Sayer, I.A. and Zaher-ul-Islam, M. (1993). Pedestrian safety in the
developing world. Crowthorn, United Kingdom: Transport Research laboratory.
McManus, W. (2007). The economics of road safety (Technical Report No. UMTRI-
2007-47). Ann Arbor: The University of Michigan Transportation Research
Institute.
WHO [World Health Organization]. (2013). Global status report on road safety 2013.
Geneva: Author.