road injury prevention western cape health and w ellness summit
DESCRIPTION
ROAD INJURY PREVENTION Western Cape Health and W ellness Summit. Outline of presentation. Road traffic injuries as contributor to the burden of disease: Cost of crashes Link to Provincial Strategic Objective 3 Projects Decade of action Desired outcomes. Cost of crashes. - PowerPoint PPT PresentationTRANSCRIPT

ROAD INJURY PREVENTION
Western Cape Health and Wellness Summit

Outline of presentation
• Road traffic injuries as contributor to the burden of disease: Cost of crashes
• Link to Provincial Strategic Objective 3• Projects• Decade of action• Desired outcomes
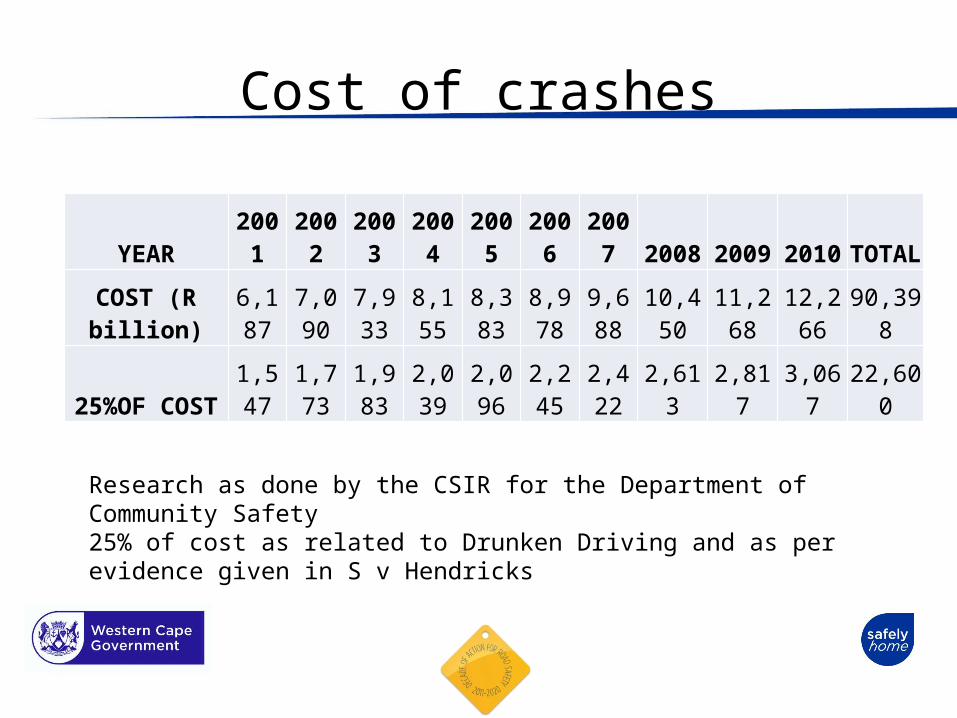
Cost of crashes
YEAR 2001 2002 2003 2004 2005 2006 2007 2008 2009 2010 TOTAL
COST (R billion) 6,187 7,090 7,933 8,155 8,383 8,978 9,688 10,450 11,268 12,266 90,398
25%OF COST 1,547 1,773 1,983 2,039 2,096 2,245 2,422 2,613 2,817 3,067 22,600
Research as done by the CSIR for the Department of Community Safety25% of cost as related to Drunken Driving and as per evidence given in S v Hendricks

Provincial Strategic Objective 3• Outcome 1: 13% modal shift, private to public
transport by 2014,
• Outcome 2: Shift in freight haulage from road to rail
increasing by 10% by 2014
• Outcome 3: Reducing road fatalities by 50% by 2014
• Outcome 4: Reduce the transport infrastructure
backlog by 16% by 2014

Projects
• Average speed over distance• Shadow Centres (Alcohol Evidence Centres)• Digital communication platform (website)• Intelligence and data centre (crash statistical analysis)
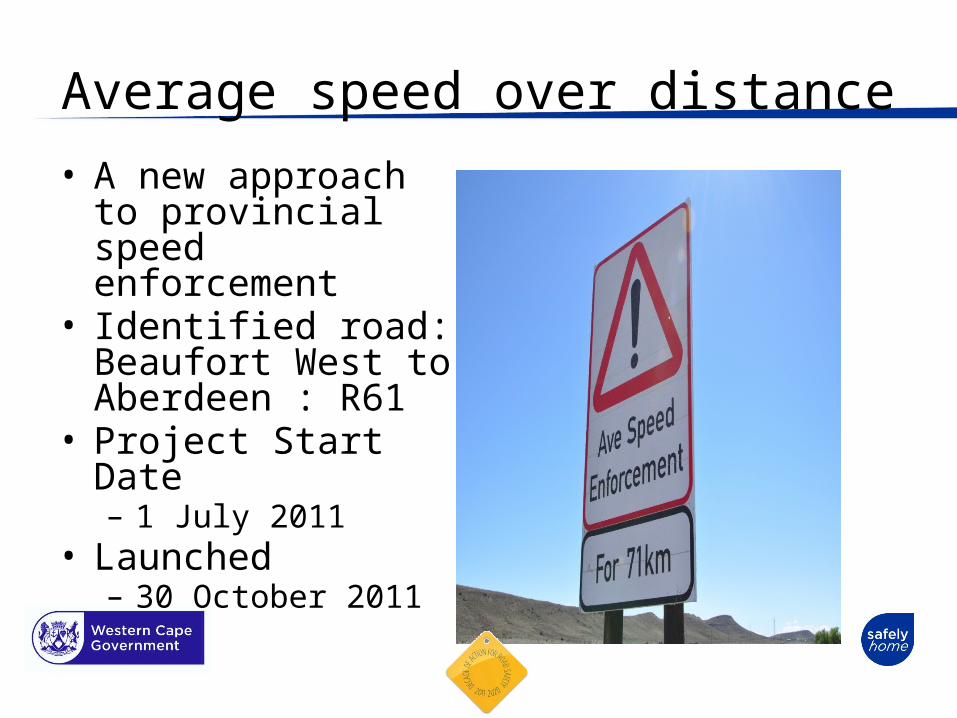
Average speed over distance
• A new approach to provincial speed enforcement
• Identified road: Beaufort West to Aberdeen : R61
• Project Start Date – 1 July 2011
• Launched– 30 October 2011

ASOD: location

ASOD: the sites

ASOD: intended outcome

ASOD: Italian outcome
• Fewer Accidents = Fewer Injuries + Deaths• Survey Italy– Source: Autostrade– Operational since 2009 on 2,220 km of roads• Statistics:• Accidents dropped 19%• Injuries dropped 27%• Deaths dropped 51%

ASOD: impact

Shadow Centres
• PPP with SAB Miller to establish Alcohol Evidence Centres (Safely Home Anti Drunk Driving Operational War Rooms: contributing a maximum of R1 000 000 per centre)– Athlone
• Opened December 2009– George
• opened December 2010– Worcester
• completed and to open soon– West Coast
• in planning process of site identification
Impact of S v Hendricks
• Major findings– Breath alcohol testing is Constitutional– State must use all means at disposal to fight the scourge of drinking
and driving, inclusive of Breath Alcohol Testing devices– The Dräger machine can be reliable if used in basic specification form
(problems with type endorsement, accreditation, regulations, calibration, servicing, standard operating procedures and training)
• Way forward– Task team has been created to address all issues and good progress is
being made

Website development
Digital Communications Platform
• The development and implementation of a fully fledged platform that will incorporate all aspects of modern electronic media
• www.safelyhome.co.za

Intelligence and data
• Need for – Interaction with all role players• Forensic Pathology Service• Freeway Management System• All local authorities and South African Police
– Availability and sharing of up to date statistical information
– Study of trends and management of outcomes

Fatalities: monthly comparison
Apr May Jun Jul Aug Sep Oct0
20
40
60
80
100
120
140
160
115
148
122128
108
125
108102
112
102 103111
83
61
2010/112011/12

Crash deaths projection
Jan-09
Mar-09
May-09
Jul-09
Sep-09
Nov-09Jan
-10
Mar-10
May-10
Jul-10
Sep-10
Nov-10Jan
-11
Mar-11
May-11
Jul-11
Sep-11
Nov-11Jan
-12
Mar-12
May-12
Jul-12
Sep-12
Nov-12Jan
-13
Mar-13
May-13
Jul-13
Sep-13
Nov-13Jan
-14
Mar-14
May-14
Jul-14
Sep-14
Nov-14
0
200
400
600
800
1000
1200
1400
1600
1800
2000
Projected
Actual
January 2009: Forensic Pathology Services report 1739 RTC deaths
September 2011: Forensic Pathology Services report 1335 RTC deaths
December 2014: Projected total of 874 RTC deaths in the last year

Decade of Action
• Pillar 1- Road safety management PLTF, ITSG and WG’s
• Pillar 2- Safer roads and mobility Engineering• Pillar 3- Safer vehicles Rolling
Enforcement Plan and VTS
Liaison with Vehicle manufacturers
• Pillar 4- Safer road users Awareness and education
• Pillar 5- Post-crash response EMS/Trauma Society
right patientright hospital right time

Halving death by 2014?
• Annual Death Toll At Jan 2009: 1739
• Projected Death Toll At Dec 2014: 874
• Death Toll Reduction: 49.75%

Contact Details
• Yasir [email protected] 021- 483-2317083-646-8100
• David [email protected]
• Kenneth [email protected] 021-483-7823084-562-4574
• Kevin [email protected] 021-483-7882083-393-1669