road-crossing assistance by tra c flow analysis
TRANSCRIPT

Road-Crossing Assistance by Traffic FlowAnalysis
Adi Perry and Nahum Kiryati
School of Electrical EngineeringTel Aviv University
Ramat Aviv 69978, Israel
Abstract. We present a system to alert visually impaired pedestriansof vehicles approaching a road-crossing without traffic control. The sys-tem is computationally efficient, requires low-cost hardware, and can bemounted on existing street infrastructure, such as sign or lighting poles.The incoming video stream, showing the approaching traffic, is trans-formed to a one-dimensional signal, that is forwarded to a decision mod-ule. Preliminary experimental results indicate promising probability-of-detection and false alarm rates, while providing sufficiently early warningto the pedestrian. The planned target hardware is a solar-charged lowcost Android device.
Keywords: road crossing assistance, approaching traffic analysis, opticflow, blind, visually impaired, resource-limited system
1 Introduction
For visually impaired pedestrians, crossing a street in the absence of traffic con-trol is a challenge. Drivers do not reliably yield to pedestrians, even those whoare clearly visual impaired (holding a white cane), requiring pedestrians to crossin traffic gaps [6]. To identify traffic gaps, visually impaired pedestrians rely onhearing. The common strategy is “cross when quiet” [14]. However, relying onearly detection of vehicle noise is risky, especially since the low noise level ofmodern cars can easily be masked by background noise. Furthermore, pedestri-ans with less than perfect hearing cannot follow the “cross when quiet” rule.
US data [2] indicates that the average crossing speed is 4 feet (about 1.2m)per second. A standard urban one-way single-lane street with two shoulders is18 feet (5.5m) wide and takes 4.5 seconds to cross. A standard two-way streetor one-way with two lanes is 28 feet (8.5m) wide, taking 7 seconds to cross. Thetraffic gap must be longer than these figures, and for safe crossing an advancewarning of at least 7 seconds is necessary.
Pun et al [13] reviewed the field of assistive devices, especially those thatuse image and video processing to convert visual data to another modality, suchas auditory or haptic, which can be delivered to the blind person. Several sys-tems help locating and identifying points of interest [5] and road crossings [16,9]. Other devices provide auditory or other indications regarding traffic light

2 Adi Perry and Nahum Kiryati
status [3, 4]. “Smart canes”, employing various types of sensors, have been sug-gested [10, 1, 7], but are intended primarily for short-range obstacle detectionand navigation. All these systems do not address the fundamental difficulty ofcrossing a road in the absence of traffic control.
An ideal solution to the road-crossing problem must reliably analyze trafficflow, detect traffic gaps, and be sufficiently robust to operate at a variety ofweather conditions, day and night. Moreover, it has to be easy and cheap toinstall, operate and maintain. This work is intended to be a first step towardsmeeting this challenge.
We present a low-cost system to detect and alert pedestrians of vehiclesapproaching a crosswalk. When fully developed, it will be possible to mount thesystem on existing street infrastructure, such as traffic signs or illumination poles.The system adapts to the scene, thus minimizing installation and maintenanceeffort. It can detect approaching vehicles well before they reach the road crossing,thus indicating traffic gaps that are sufficient for safe crossing.
2 Hardware Platform & Installation
The input device is a video camera, capturing the incoming traffic, as illustratedin Fig. 1. The video signal is processed by low cost, lightweight computing hard-ware, that eventually generates the indication signal.
The hardware platform can include a compact solar panel and a rechargeablebattery, to allow autonomous operation without reliance on the electric powergrid. This can enhance the applicability of the system, and reduce its installationand maintenance costs. A block diagram of the system is shown in Fig. 2.
Indication of incoming traffic, or lack thereof, can be delivered to the user asan audio or tactile signal, or via a local networking interface (such as Bluetoothor WLAN) to a smartphone or a dedicated receiver.
We developed the system on a standard laptop PC, with a modified LogitechQuickCam 9000 WebCam. Targeting a low-cost solution, we implemented thealgorithm as a cross-platform code, and tested it on BeagleBoard xM hardware,an open-source platform consisting of TI’s OMAP 3530 (ARM processor + DSP),
Fig. 1: Mounting the system on a sign or lighting pole near a road crossing, withthe camera facing the approaching traffic.

Road-Crossing Assistance by Traffic Flow Analysis 3
Fig. 2: The system consists of a low cost camera, streaming video to a computingdevice, possibly powered by a compact solar panel. User interaction options rangefrom an auditory or visual alert to communication via a local area or cellularnetwork. A narrow field of view lens can be used to improve the observability ofdistant vehicles.
suitable for rapid prototyping. With the proliferation of low-cost Android deviceswith built-in cameras, we are currently porting the system to Android OS.
3 Algorithm
We examined various approaches for efficient detection and evaluation of ap-proaching traffic on a resource-limited platform. A generic approach that comesto mind is detecting any new object appearing in the field of view, tracking it,analyzing its motion and estimating its Time to Contact (TTC) as the basis forissuing an alert. Lee [11] observed that in a simple but typical case, the TTCcan be estimated based on the incoming object’s expansion rate, measured in theimage plane. A newer approach for TTC estimation [8] treats the approachingvehicle as a moving plane.
In our application, the field of view (FOV) of the camera should be sufficientlywide to capture nearby vehicles (possibly leaving a parking spot). However, mostapproaching vehicles first appear as tiny spots near the vanishing point (VP)1
Given the limited pixel-count of low cost video cameras, the wide FOV impliesthat the spatial resolution near the vanishing point is quite low. These constraintsimply that the main challenge is early detection of the incoming vehicle, meetingthe advance warning time requirement. Therefore, in most cases precise TTCestimation is not the issue. Also note that the approximations on which TTCalgorithms rely do not hold at the most significant moment, when the vehicle isseen as a tiny, far-away spot.
We convert the space-time video processing problem to a 1-D signal analysisproblem, by computing a scalar motion measure, referred to as Activity, reflectingthe entire relevant motion in the scene. Objects moving along the road towardsthe camera induce pulses in the Activity signal, such that a significant risingActivity slope suggests an approaching vehicle. Early detection of approachingvehicles with few false alarms amounts to discrimination between a true risingActivity slope and random noise and clutter in the Activity signal.
1 We use the term vanishing point in a loose sense, including the case of a curved road.

4 Adi Perry and Nahum Kiryati
3.1 Activity Estimation
Brightness patterns in the image move as the objects that give rise to themmove in the scene, leading to optical flow. We estimate the optical flow usinga computationally-efficient version of a non-iterative sparse Lucas-Kanade [12]algorithm. The estimation errors typical to the Lucas-Kanade method can betolerated in our application; as will be seen, the activity signal, derived from theoptical flow, is an integral measure in which these errors are spatially averagedover parts of the image domain.
We employ integral images to improve the efficiency of the algorithm, asproposed by Senst et al [15], calculating integral versions of the gradient productsof the image Ix ·Ix, Ix ·Iy, Iy ·Iy and Ix ·It, Iy ·It. Evaluating a structure tensor(or a covariance matrix) is required for estimating each flow vector in the Lucas-Kanade algorithm, and each of its matrix elements can be efficiently evaluatedusing four simple arithmetic operations, regardless of the neighborhood size thatis taken into account.
Parts of the optical flow field are associated with risk-posing approachingvehicles. Other parts might reflect distancing traffic on another lane, pedestri-ans crossing the road, and movements due to wind or camera vibrations. Theproposed activity measure A(t) is obtained by projecting the optical flow fieldu(x, y; t) onto a projection map. The projection map m(x, y) is a vector fieldsupported on image regions corresponding to lanes carrying traffic towards thecamera, each vector representing the local direction of approaching traffic. For-mally,
A(t) =∑x,y
m(x, y) · u(x, y; t). (1)
The scalar, time-dependent Activity is fast to compute, and quantifies the entirerisk-inducing motion in the scene.
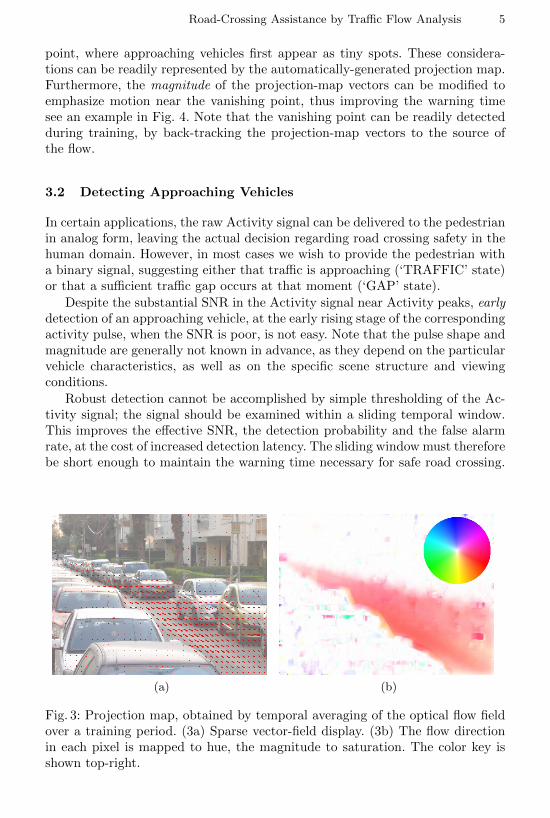
Assuming a one-way road, the projection map can be automatically generatedby temporal averaging of the optical flow over a training period, see Fig. 3.The averaging process cancels the randomly oriented contributions that are dueto vibrations, wind and similar phenomena, while highlighting the consistent,dominant, risk-inducing traffic motion directions in the road area alone. Slightadaptation of this procedure is necessary for dealing with two-way roads, whereconsistent distancing traffic is also expected within the visual field of the camera.
Variable density & spatially weighted optical flow computation: Main-taining minimal system cost calls for resource-limited hardware. Since opticalflow computation is the most demanding element in the proposed algorithm, itis most lucrative for streamlining and optimization. Typically, large parts of thefield of view, such as sidewalks and background structures, do not hold risk-posing motion. These regions, once determined, might be excluded from opticalflow estimation altogether. In image regions corresponding to nearby parts ofthe scene, where vehicles appear quite large and expand substantially, spatially-sparse optical flow computation might be sufficient. Conversely, high density op-tical flow computation can be called for just where necessary, near the vanishing
Road-Crossing Assistance by Traffic Flow Analysis 5
point, where approaching vehicles first appear as tiny spots. These considera-tions can be readily represented by the automatically-generated projection map.Furthermore, the magnitude of the projection-map vectors can be modified toemphasize motion near the vanishing point, thus improving the warning timesee an example in Fig. 4. Note that the vanishing point can be readily detectedduring training, by back-tracking the projection-map vectors to the source ofthe flow.
3.2 Detecting Approaching Vehicles
In certain applications, the raw Activity signal can be delivered to the pedestrianin analog form, leaving the actual decision regarding road crossing safety in thehuman domain. However, in most cases we wish to provide the pedestrian witha binary signal, suggesting either that traffic is approaching (‘TRAFFIC’ state)or that a sufficient traffic gap occurs at that moment (‘GAP’ state).
Despite the substantial SNR in the Activity signal near Activity peaks, earlydetection of an approaching vehicle, at the early rising stage of the correspondingactivity pulse, when the SNR is poor, is not easy. Note that the pulse shape andmagnitude are generally not known in advance, as they depend on the particularvehicle characteristics, as well as on the specific scene structure and viewingconditions.
Robust detection cannot be accomplished by simple thresholding of the Ac-tivity signal; the signal should be examined within a sliding temporal window.This improves the effective SNR, the detection probability and the false alarmrate, at the cost of increased detection latency. The sliding window must thereforebe short enough to maintain the warning time necessary for safe road crossing.
(a) (b)
Fig. 3: Projection map, obtained by temporal averaging of the optical flow fieldover a training period. (3a) Sparse vector-field display. (3b) The flow directionin each pixel is mapped to hue, the magnitude to saturation. The color key isshown top-right.

6 Adi Perry and Nahum Kiryati
Fig. 4: Activity signal corresponding to an approaching vehicle, with (blue) andwithout (red) emphasizing the projection map magnitude near the vanishingpoint.
Assume that the complete Activity pulse length is L; we wish to detect the pres-ence of the pulse after N ≤ L samples are acquired. The warning is thereforedelayed by N samples with respect to the first appearance of the approachingvehicle.
Within the temporal window of size N , suppose that there is either a trafficgap, such that the Activity is A(n) = v(n), where v(n) is a random noise process,or a vehicle initially appears, so A(n) = s(n)+v(n), where s(n) is the pulse shapecorresponding to the specific vehicle and viewing conditions, referred to as therising pulse. Temporal windows corresponding to earlier or later appearance ofa vehicle are discussed in the sequel.
We formulate the ‘TRAFFIC’ and ‘GAP’ state hypotheses as follows:
H1 : A(n) = s(n) + v(n) A(n) ∼ N(s(n), σ2
)H0 : A(n) = v(n) A(n) ∼ N
(0, σ2
) (2)
where A(n) is the Activity measurement and v(n) is modelled as zero-meanadditive white Gaussian noise (AWGN): v(n) ∼ N
(0, σ2
).
The samples A(n) inside a sliding window of length N can be represented asa Gaussian random vector y, with the following likelihood functions:
fy(y|θ1) = 1(2π)N/2σN
N−1∏n=0
exp(− (an−sn)2
2σ2
)fy(y|θ0) = 1
(2π)N/2σN
N−1∏n=0
exp(− a2n
2σ2
) (3)

Road-Crossing Assistance by Traffic Flow Analysis 7
where we replaced the notations A(n), S(n) by an, sn. Applying a LikelihoodRatio Test for discriminating between the two hypotheses
LRT =
1(2π)N/2σN
N−1∏n=0
exp(− (an−sn)2
2σ2
)1
(2π)N/2σN
N−1∏n=0
exp(− a2n
2σ2
) ≷ λ (4)
where λ is a discriminative threshold, leads to the detection rule:
N−1∑n=0
ansn ≷1
2
(2σ2 lnλ+
N−1∑n=0
s2n
). (5)
The left hand side describes a correlator of the input Activity with the risingpulse template, and the right hand side is an application-dependent threshold.For determining the threshold, we apply the Neyman-Pearson criterion, whichsets the threshold to maintain a given false-alarm probability.
The left hand side is a random Gaussian variable with variance σ2N−1∑n=0
s2n,
that we denote as y. The false-alarm probability is given by the tail distributionof the ‘GAP’ (θ0) hypothesis:
PFA =
∞∫γ
fy(z|θ0)dz = Pr (y > γ|θ0) =
Pr
(y
σ√∑
s2n> γ
1
σ√∑
s2n
)= Q
(γ
σ√∑
s2n
)= 1− φ
(γ
σ√∑
s2n
)(6)
where φ(x) is the cumulative distribution function of the standard normal dis-tribution and Q(x) is its tail probability: Q(x) = 1−Q(−x) = 1− φ(x).
This yields a threshold γ = Q−1 (PFA)σ√∑
s2n which can be determined bythe SNR and the acceptable false-alarm rate. The detector can be described as
D(a0, ..., aN−1) ≡
N−1∑n=0
ansn
N−1∑n=0
s2n
≷ Q−1 (PFA)σ (7)
which is familiar as the result of applying a matched filter, correlating the inputmeasurements with the known signal that we wish to detect. The correspondingprobability of detection is:
PD = Pr (y > γ|θ1) = ... = Q
(Q−1 (PFA)−
√∑s2n
σ
)(8)

8 Adi Perry and Nahum Kiryati
So far, we discussed the most challenging aspect of detection, the initialdetection of an approaching vehicle. The detector is causal, hence the warningis delayed by N samples. Since the rising pulse typically increases as the vehicleapproaches, once the correlator crosses the threshold, it remains above it aslong as the pulse rises. To maintain continuous detection of vehicles until theyreach the crossing, we extend the correlator window size beyond N as long as’TRAFFIC’ classifications are acquired, up to a maximal size not exceeding L.When vehicles appear late (e.g. leaving a parking spot close to the crossing), therising pulse takes off at a rather high magnitude and the correlator immediatelycrosses the threshold.
3.3 Estimating Detector Parameters
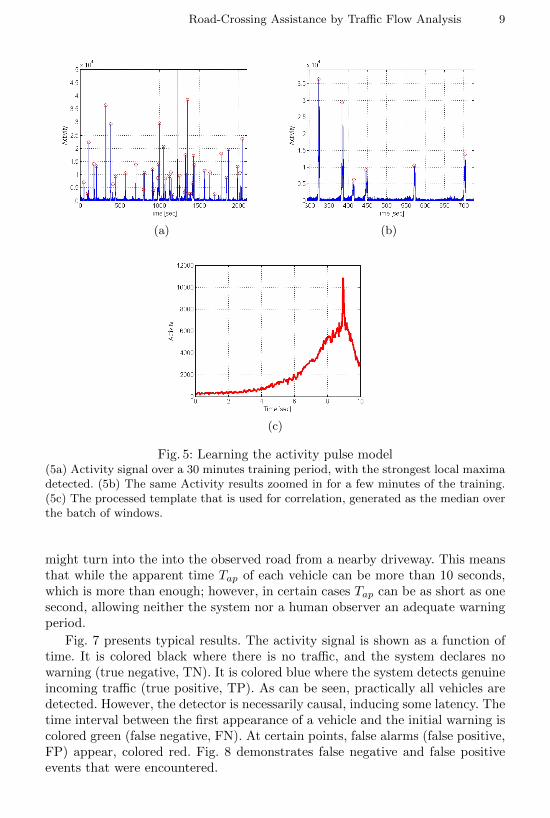
The detector is parameterized by the noise variance (that can be estimated), andthe expected shape of the activity pulse. During a training period, by the timethe Projection Map is generated, the system produces Activity measurements.After sufficient training, the measurements are used to automatically generatethe activity pulse model and estimate the noise variance.
The system scans the input signal acquired during training to locate itsstrongest local maxima, and crops a window of 10 seconds around each max-imum, where most of the samples precede the maximum. The windows arebatched together, and used to estimate the noise variance and activity pulsetemplate. In practice, we model the rising pulse as the median of the croppedtemporal windows. Fig. 5 illustrates the process.
4 Results
Fig. 6c shows snapshots from a day-time video sequence obtained by the systemcamera in a single-lane one-way street. Fig. 6a is the Activity signal correspond-ing to the same experimental session. Fig. 6b zooms on the time interval inwhich the snapshots shown in Fig. 6c were taken. The coloring of the graphs inFigs. 6a and 6b present the indication provided to the pedestrian, red meaningTRAFFIC and blue corresponding to GAP. As can be seen, TRAFFIC is de-clared 8-10 seconds before the vehicle reaches the camera, i.e., before the peakof the Activity signal, allowing safe crossing with substantial margin.
We recorded and annotated video taken from the system camera. For eachvehicle, we noted its time of appearance tA and its time of disappearance tD,and calculated its apparent time interval Tap = tD − tA. Obviously, Tap setsan upper bound on the feasible warning time. The results were recorded witha modified USB camera and with an equivalent Point-and-Shoot camera. TheUSB camera is a standard webcam with its lens replaced to slightly narrow thefield of view.
Ideally, a vehicle appears near the vanishing point, maximizing the feasiblewarning time. Note however that in certain urban or suburban scenes a vehiclecan leave a parking spot within the field of view and close to the crossing, or
Road-Crossing Assistance by Traffic Flow Analysis 9
(a) (b)
(c)
Fig. 5: Learning the activity pulse model(5a) Activity signal over a 30 minutes training period, with the strongest local maximadetected. (5b) The same Activity results zoomed in for a few minutes of the training.(5c) The processed template that is used for correlation, generated as the median overthe batch of windows.
might turn into the into the observed road from a nearby driveway. This meansthat while the apparent time Tap of each vehicle can be more than 10 seconds,which is more than enough; however, in certain cases Tap can be as short as onesecond, allowing neither the system nor a human observer an adequate warningperiod.
Fig. 7 presents typical results. The activity signal is shown as a function oftime. It is colored black where there is no traffic, and the system declares nowarning (true negative, TN). It is colored blue where the system detects genuineincoming traffic (true positive, TP). As can be seen, practically all vehicles aredetected. However, the detector is necessarily causal, inducing some latency. Thetime interval between the first appearance of a vehicle and the initial warning iscolored green (false negative, FN). At certain points, false alarms (false positive,FP) appear, colored red. Fig. 8 demonstrates false negative and false positiveevents that were encountered.

10 Adi Perry and Nahum Kiryati
(a) (b)
(c)
Fig. 6: Activity classification(6a) Activity results for a typical scenario classified to TRAFFIC and GAP, coloredred and blue respectively. (6b) The same Activity results expanded for a couple ofapproaching vehicles. (6c) Snapshots of the original video with time tags. The readercan observe that the TRAFFIC indication is declared very early, as soon as a vehicleappears.

Road-Crossing Assistance by Traffic Flow Analysis 11
Fig. 7: Typical activity signal and classification of resultsThe plots describe the activity signal within four time intervals; time is labeled inseconds along the horizontal axis. The signal is colored according to the output of thesystem and the ground truth (true negative: black; true positive: blue; false negative:green; false positive: red).
For analysis, we executed the algorithm offline, on the recorded video, withvarious detector thresholds and settings. We register a single success per vehiclein case the detector issues a sufficiently early warning, meaning at most τmaxseconds after initial appearance or at least 7 seconds before reaching the crossing.The value τmax corresponds to the window size N (the minimal feasible warningtime delay).
We constructed per-vehicle ROC curves based on comparison with the groundtruth data. We calculate the True Positive Rate as the fraction of successes outof the total number of incoming vehicles:
TPR =TP
TP + FN=
NsNtot
(9)
where Ns is the number of successes and Ntot is the total number of vehicles.We calculate the False Positive Rate as
FPR =FP
FP + TN(10)
where the values are previously defined and taken per-sample from the fullrecording. Note that defining the false positive rate per-sample is very severe,since even an isolated outlying false positive reading, that can easily be detectedand eliminated without significant effect on the true positive rate, is registered.

12 Adi Perry and Nahum Kiryati
(a) (b) (c)
Fig. 8: Events giving rise to false positives (false alarms) and false negatives(8a) False negative corresponding to a slow, distant bicyclist. (8b) False positive in-duced by a person suddenly appearing in the road. (8c) False negative associated witha vehicle that appeared, stopped, and eventually turned right into a side street.
Fig. 9 presents a sample of analysis results. Fig. 9a shows the per-vehicleROC curves for a few window sizes N , corresponding to 1 to 3 second durations.Fig. 9b is the histogram (distribution) of the advance warning times over 1 hourin a single-lane one-way street. The per-sample false positive level was set to0.01 and only vehicles with Tap greater than 7 seconds are taken into account.Short warning times corresponded to slowly driving vehicles, including bicycles.By allowing a higher per-sample false positive level, most of the slow vehiclescan be detected substantially earlier.
(a) (b)
Fig. 9: Analysis results(9a) Per-vehicle ROC curves for a few window sizes N , corresponding to intervalsbetween 1 second to 3 seconds. (9b) Warning times histogram covering 1 hour in asingle-lane one-way street.

Road-Crossing Assistance by Traffic Flow Analysis 13
5 Discussion
We presented a computationally-lean system to detect and alert pedestrians ofvehicles approaching a road-crossing. The system automatically adapts to thescene, and can be mounted on existing street infrastructure, facilitating simpleinstallation. The system is designed primarily for blind and visually impairedpeople, but can potentially assist the young and the old, people with cognitiveimpairments, and others.
We implemented the system on a standard laptop PC, and also ported it onBeagleBoard xM hardware running Linux. An Android version using low-costsmartphone/tablet-like hardware is planned.
We tested the system at several locations, and achieved advance warningtimes approaching 9 seconds at typical day conditions with a rather wide field ofview lens, slightly less at night scenarios. These results are promising, becausea standard US two-lane street takes only about 7 seconds to cross. Night andpoor weather conditions were examined succinctly and further experiments andanalysis need to be conducted.
A single instance of the system is capable of detecting traffic approachingfrom a given direction and ignore distancing traffic. Full support of two-waytraffic requires two instances of the system, mounted in opposite directions,preferably with a unified decision and pedestrian interface module.
Time to Contact (TTC) estimation, based on Horn et al [8], was also tested.As in our approach, it processes entire frames and yields a scalar signal, thatcould be considered as an alternative to the proposed Activity signal. The resultswere noisy and unstable compared to the results obtained using the suggestedActivity measure.
Learning is an essential aspect of the system, including the generation of theprojection map and the activity pulse model. The straightforward training andlearning solutions employed in the current design leave room for sophisticatedimprovements.
The suggested approach is unique in being stationary and location-specific.The absence of ego-motion leads to a solution that is both robust and low-cost.Any person approaching the road crossing can take advantage of the system,with no need for a personally owned device such as a smartphone or a smartcane. This widens the potential reach of the system to weak parts of the society.
References
1. Amedi, A.: Virtual cane for the visually impaired, presented at the inter-national presidential conference. http://blog.imric.org/blog/sidney/virtual-cane-visually-impaired-presented-international-presidential-conference (June 2011)
2. American Association of State Highway and Transportation Officials: A Policy ongeometric design of highways and streets. Washington, D.C. (2004)
3. Barlow, J., Bentzen, B., Tabor, L.: Accessible Pedestrian Signals: Synthesis andGuide to Best Practice. National Cooperative Highway Research Program (2003)

14 Adi Perry and Nahum Kiryati
4. Bohonos, S., Lee, A., Malik, A., Thai, C., Manduchi, R.: Universal real-time naviga-tional assistance (URNA): an urban bluetooth beacon for the blind. In: Proceedingsof the 1st ACM SIGMOBILE international workshop on Systems and networkingsupport for healthcare and assisted living environments. pp. 83–88. HealthNet ’07,ACM, New York, NY, USA (2007)
5. Crandall, W., Bentzen, B., Myerss, L., Brabyn, J.: New orientation and accessibilityoption for persons with visual impairment: transportation applications for remoteinfrared audible signage. Clinical and Experimental Optometry 84, 120–131 (2001)
6. Emerson, R., Sauerburger, D.: Detecting approaching vehicles at streets with notraffic control. Journal of Visual Impairment & Blindness 102(12), 747 (2008)
7. Fallon, J.: Systems and methods for laser radar imaging for the blind and visuallyimpaired (2008)
8. Horn, B., Fang, Y., Masaki, I.: Time to contact relative to a planar surface. In:Intelligent Vehicles Symposium, 2007 IEEE. pp. 68 –74 (June 2007)
9. Ivanchenko, V., Coughlan, J., Shen, H.: Crosswatch: A camera phone system fororienting visually impaired pedestrians at traffic intersections. In: Proceedings ofthe 11th international conference on Computers Helping People with Special Needs.pp. 1122–1128. ICCHP ’08, Springer-Verlag, Berlin, Heidelberg (2008)
10. Kay, L.: A sonar aid to enhance spatial perception of the blind: engineering designand evaluation. Radio and Electronic Engineer 44 (1974)
11. Lee, D.: A theory of visual control of braking based on information about time-to-collision. Perception 5(4), 437–459 (1976)
12. Lucas, B., Kanade, T.: An iterative image registration technique with an applica-tion to stereo vision. In: Proceedings of the 7th International Joint Conference onArtificial Intelligence - Volume 2. pp. 674–679. Morgan Kaufmann Publishers Inc.,San Francisco, CA, USA (1981)
13. Pun, T., Roth, P., Bologna, G., Moustakas, K., Tzovaras, D.: Image and videoprocessing for visually handicapped people. J. Image Video Process. 2007, 4:1–4:12 (January 2007)
14. Sauerburger, D.: Developing criteria and judgment of safety for crossing streetswith gaps in traffic. Journal of Visual Impairment & Blindness 93(7), 447–450(1999)
15. Senst, T., Eiselein, V., Sikora, T.: II-LK - a real-time implementation for sparseoptical flow. In: Proceedings of the 7th International Conference on Image Analysisand Recognition - Volume Part I. pp. 240–249. ICIAR’10, Springer-Verlag, Berlin,Heidelberg (2010)
16. Shioyama, T., Uddin, M.: Detection of pedestrian crossings with projective invari-ants from image data. Measurement Science and Technology 15(12), 2400 (2004)