rn mr rrt - canada mortgage and housing corporation · pdf filehousing market nforation rn mr...
TRANSCRIPT
H o u s i n g M a r k e t I n f o r m a t i o n
RENTAL MARKET REPORT
Date Released:
C a n a d a M o r t g a g e a n d H o u s i n g C o r p o r a t i o n
Housing market intelligence you can count on
Nova Scotia Highlights*
Spring 2015
0 1 2 3 4 5 6 7 8 9 10
Truro CA
New Glasgow CA
Kings, Subd. A SC
Kentville CA
Cape Breton CA
Halifax CMA
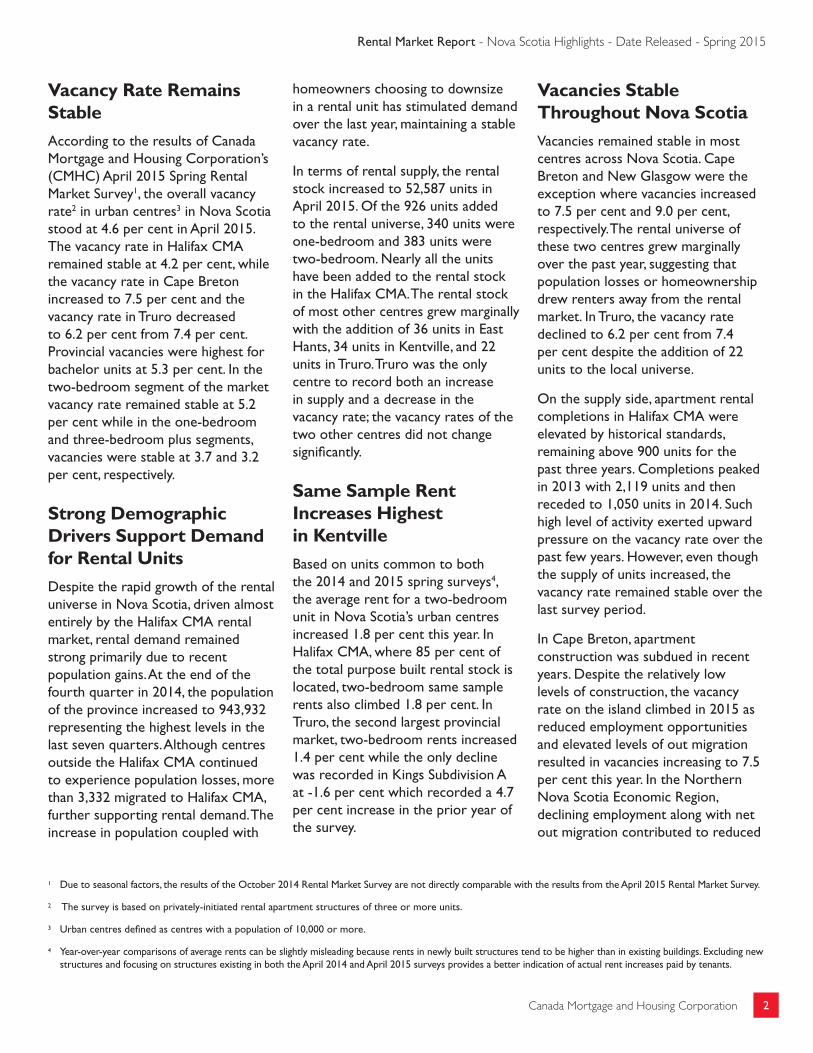
Vacancy Rates (%) Private Structures with 3 or more apartments
Apr-15 Apr-14
Figure 1 Provincial Vacancy Rates Remain Stable�� The purpose-built private
apartment vacancy rate in Nova Scotia’s urban centres remained stable in April 2015 at 4.6 per cent. The vacancy rate ranged from 1.5 per cent in Kings Subdivision A to 9.0 per cent in New Glasgow.
�� In Cape Breton, the vacancy rate climbed to 7.5 per cent from 4.7 per cent.
�� The provincial vacancy rate for a two-bedroom apartment was 5.2 per cent in April and the average rent was $980.
�� The vacancy rate in Halifax CMA was 4.2 per cent.
0 200 400 600 800 1000 1200
Truro CA
New Glasgow CA
Kings, Subd. A SC
Kentville CA
Cape Breton CA
Halifax CMA
Average Rent -Two-Bedroom ($) Private Structures with 3 or more apartments
Apr-15 Apr-14
Figure 2
Source: CMHC Rental Market Survey
Source: CMHC Rental Market Survey
*Urban centres with a population of 10,000 + are included in the survey.
2Canada Mortgage and Housing Corporation
Rental Market Report - Nova Scotia Highlights - Date Released - Spring 2015
Vacancy Rate Remains StableAccording to the results of Canada Mortgage and Housing Corporation’s (CMHC) April 2015 Spring Rental Market Survey1, the overall vacancy rate2 in urban centres3 in Nova Scotia stood at 4.6 per cent in April 2015. The vacancy rate in Halifax CMA remained stable at 4.2 per cent, while the vacancy rate in Cape Breton increased to 7.5 per cent and the vacancy rate in Truro decreased to 6.2 per cent from 7.4 per cent. Provincial vacancies were highest for bachelor units at 5.3 per cent. In the two-bedroom segment of the market vacancy rate remained stable at 5.2 per cent while in the one-bedroom and three-bedroom plus segments, vacancies were stable at 3.7 and 3.2 per cent, respectively.
Strong Demographic Drivers Support Demand for Rental UnitsDespite the rapid growth of the rental universe in Nova Scotia, driven almost entirely by the Halifax CMA rental market, rental demand remained strong primarily due to recent population gains. At the end of the fourth quarter in 2014, the population of the province increased to 943,932 representing the highest levels in the last seven quarters. Although centres outside the Halifax CMA continued to experience population losses, more than 3,332 migrated to Halifax CMA, further supporting rental demand. The increase in population coupled with
homeowners choosing to downsize in a rental unit has stimulated demand over the last year, maintaining a stable vacancy rate.
In terms of rental supply, the rental stock increased to 52,587 units in April 2015. Of the 926 units added to the rental universe, 340 units were one-bedroom and 383 units were two-bedroom. Nearly all the units have been added to the rental stock in the Halifax CMA. The rental stock of most other centres grew marginally with the addition of 36 units in East Hants, 34 units in Kentville, and 22 units in Truro. Truro was the only centre to record both an increase in supply and a decrease in the vacancy rate; the vacancy rates of the two other centres did not change significantly.
Same Sample Rent Increases Highest in KentvilleBased on units common to both the 2014 and 2015 spring surveys4, the average rent for a two-bedroom unit in Nova Scotia’s urban centres increased 1.8 per cent this year. In Halifax CMA, where 85 per cent of the total purpose built rental stock is located, two-bedroom same sample rents also climbed 1.8 per cent. In Truro, the second largest provincial market, two-bedroom rents increased 1.4 per cent while the only decline was recorded in Kings Subdivision A at -1.6 per cent which recorded a 4.7 per cent increase in the prior year of the survey.
Vacancies Stable Throughout Nova ScotiaVacancies remained stable in most centres across Nova Scotia. Cape Breton and New Glasgow were the exception where vacancies increased to 7.5 per cent and 9.0 per cent, respectively. The rental universe of these two centres grew marginally over the past year, suggesting that population losses or homeownership drew renters away from the rental market. In Truro, the vacancy rate declined to 6.2 per cent from 7.4 per cent despite the addition of 22 units to the local universe.
On the supply side, apartment rental completions in Halifax CMA were elevated by historical standards, remaining above 900 units for the past three years. Completions peaked in 2013 with 2,119 units and then receded to 1,050 units in 2014. Such high level of activity exerted upward pressure on the vacancy rate over the past few years. However, even though the supply of units increased, the vacancy rate remained stable over the last survey period.
In Cape Breton, apartment construction was subdued in recent years. Despite the relatively low levels of construction, the vacancy rate on the island climbed in 2015 as reduced employment opportunities and elevated levels of out migration resulted in vacancies increasing to 7.5 per cent this year. In the Northern Nova Scotia Economic Region, declining employment along with net out migration contributed to reduced
1 Due to seasonal factors, the results of the October 2014 Rental Market Survey are not directly comparable with the results from the April 2015 Rental Market Survey.
2 The survey is based on privately-initiated rental apartment structures of three or more units.
3 Urban centres defined as centres with a population of 10,000 or more.
4 Year-over-year comparisons of average rents can be slightly misleading because rents in newly built structures tend to be higher than in existing buildings. Excluding new structures and focusing on structures existing in both the April 2014 and April 2015 surveys provides a better indication of actual rent increases paid by tenants.

3Canada Mortgage and Housing Corporation
Rental Market Report - Nova Scotia Highlights - Date Released - Spring 2015
demand for all types of housing including rental. In New Glasgow, even though little construction took place, the vacancy rate increased in 2015 to 9.0 per cent. Lower employment opportunities and a relatively affordable homeownership market kept people away from the rental market. Notably, the vacancy rate was highest for a two-bedroom unit at 10.1 per cent up from 5.9 per cent.
Average Rents Highest in HalifaxThe overall average monthly rent for a two-bedroom unit in Nova Scotia’s urban centres as of the April 2015 survey was $980. Halifax CMA was the only centre to report an above average two-bedroom rent at $1,035. Rents were next highest in East Hants at $846 followed by Truro at $789. In the Cape Breton CA, the average rent for a two-bedroom unit was $739 while in New Glasgow rents stood at $664. In Kentville and Kings Subd. A. two-bedroom rents in the April 2015 survey were $677 and $720, respectively.
Provincial Availability Rates Up in 2015The availability rate5 in the province’s urban centres was 6.0 per cent in April 2015. Both one-bedroom and two-bedroom unit types recorded no change at 5.2 per cent and 6.6 per cent, respectively. The availability of bachelor units increased to 7.3 per cent from 4.4 per cent last year, and the availability rate of three-bedroom units decreased to 4.8 per cent from 6.7 per cent.
In Cape Breton, the availability rate climbed from 5.2 per cent to 8.0 per cent last year. In New Glasgow, the availability rate increased from 6.1 per cent to 9.0 per cent while the rate remained statistically unchanged in other centres.
5 A rental unit is considered available if the unit is vacant, or the existing tenant has given or received official notice to move and a new tenant has not signed a lease. As the definition of availability includes vacancy, the availability rate will always be equal to or greater than the vacancy rate.

4Canada Mortgage and Housing Corporation
Rental Market Report - Nova Scotia Highlights - Date Released - Spring 2015
"
"
"
"
"
Hal
ifax
4.2%
Ken
tvill
e5.
6%
Trur
o6.
2%
Cap
e B
reto
n7.
5%
New
Gla
sgow
9.0%
Nov
a S
cotia
Apa
rtmen
t Vac
ancy
Rat
esN
030
6090
15
Km
Leg
end
2015
vac
ancy
rat
e fo
r H
alifa
x
çVa
canc
y ra
te in
201
5 th
e sa
me
as 2
014
Va
canc
y ra
te in
201
5 hi
gher
tha
n 20
14
Vaca
ncy
rate
in 2
015
low
er t
han
2014
4.2%
5Canada Mortgage and Housing Corporation
Rental Market Report - Nova Scotia Highlights - Date Released - Spring 2015
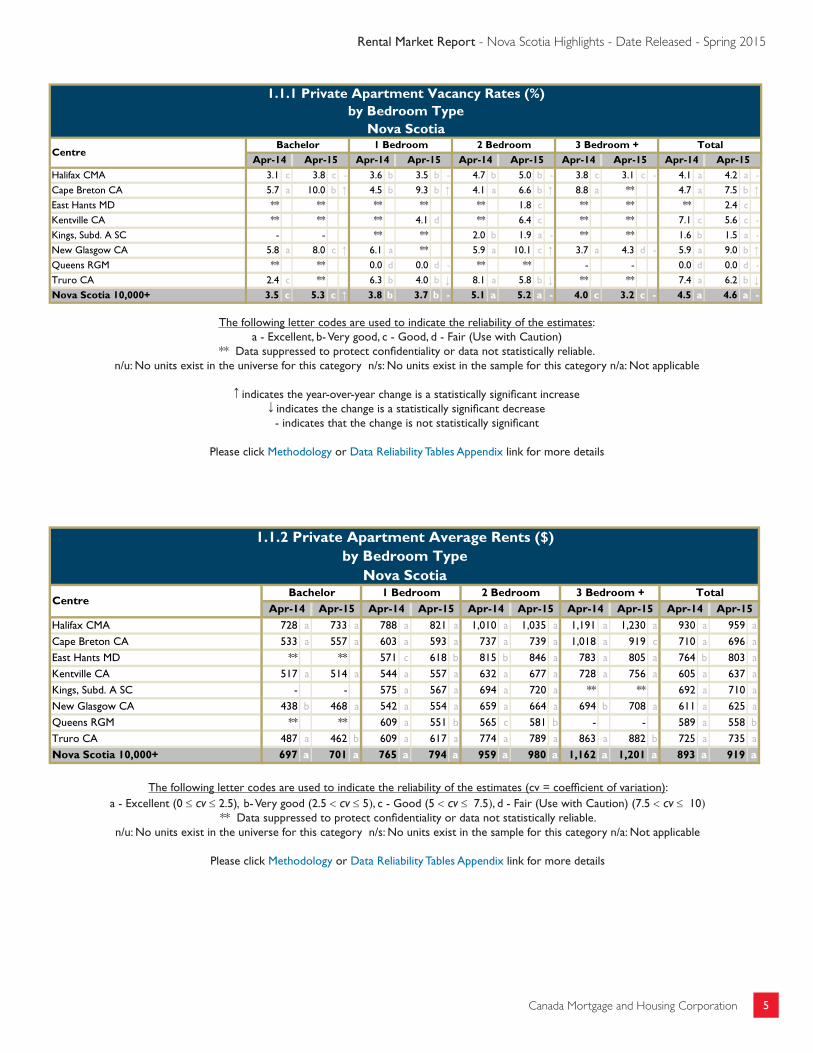
1.1.2 Private Apartment Average Rents ($)by Bedroom Type
Nova Scotia
Halifax CMA 728 a 733 a 788 a 821 a 1,010 a 1,035 a 1,191 a 1,230 a 930 a 959 a
Cape Breton CA 533 a 557 a 603 a 593 a 737 a 739 a 1,018 a 919 c 710 a 696 a
East Hants MD ** ** 571 c 618 b 815 b 846 a 783 a 805 a 764 b 803 a
Kentville CA 517 a 514 a 544 a 557 a 632 a 677 a 728 a 756 a 605 a 637 a
Kings, Subd. A SC - - 575 a 567 a 694 a 720 a ** ** 692 a 710 a
New Glasgow CA 438 b 468 a 542 a 554 a 659 a 664 a 694 b 708 a 611 a 625 a
Queens RGM ** ** 609 a 551 b 565 c 581 b - - 589 a 558 b
Truro CA 487 a 462 b 609 a 617 a 774 a 789 a 863 a 882 b 725 a 735 a
Nova Scotia 10,000+ 697 a 701 a 765 a 794 a 959 a 980 a 1,162 a 1,201 a 893 a 919 a
TotalCentre
Bachelor 1 Bedroom 2 Bedroom 3 Bedroom +Apr-14 Apr-15 Apr-14 Apr-15 Apr-14 Apr-15Apr-14 Apr-15 Apr-14 Apr-15
1.1.1 Private Apartment Vacancy Rates (%)by Bedroom Type
Nova Scotia
Halifax CMA 3.1 c 3.8 c - 3.6 b 3.5 b - 4.7 b 5.0 b - 3.8 c 3.1 c - 4.1 a 4.2 a -
Cape Breton CA 5.7 a 10.0 b ↑ 4.5 b 9.3 b ↑ 4.1 a 6.6 b ↑ 8.8 a ** 4.7 a 7.5 b ↑East Hants MD ** ** ** ** ** 1.8 c ** ** ** 2.4 c
Kentville CA ** ** ** 4.1 d ** 6.4 c ** ** 7.1 c 5.6 c -
Kings, Subd. A SC - - ** ** 2.0 b 1.9 a - ** ** 1.6 b 1.5 a -
New Glasgow CA 5.8 a 8.0 c ↑ 6.1 a ** 5.9 a 10.1 c ↑ 3.7 a 4.3 d - 5.9 a 9.0 b ↑Queens RGM ** ** 0.0 d 0.0 d - ** ** - - 0.0 d 0.0 d -
Truro CA 2.4 c ** 6.3 b 4.0 b ↓ 8.1 a 5.8 b ↓ ** ** 7.4 a 6.2 b ↓Nova Scotia 10,000+ 3.5 c 5.3 c ↑ 3.8 b 3.7 b - 5.1 a 5.2 a - 4.0 c 3.2 c - 4.5 a 4.6 a -
3 Bedroom + TotalCentre
Bachelor 1 Bedroom 2 BedroomApr-14 Apr-15 Apr-14 Apr-15 Apr-14 Apr-15Apr-14 Apr-15 Apr-14 Apr-15
The following letter codes are used to indicate the reliability of the estimates:a - Excellent, b- Very good, c - Good, d - Fair (Use with Caution)
** Data suppressed to protect confidentiality or data not statistically reliable.n/u: No units exist in the universe for this category n/s: No units exist in the sample for this category n/a: Not applicable
indicates the year-over-year change is a statistically significant increase indicates the change is a statistically significant decrease- indicates that the change is not statistically significant
Please click Methodology or Data Reliability Tables Appendix link for more details
The following letter codes are used to indicate the reliability of the estimates (cv = coefficient of variation):a - Excellent (0 £ cv £ 2.5), b- Very good (2.5 < cv £ 5), c - Good (5 < cv £ 7.5), d - Fair (Use with Caution) (7.5 < cv £ 10)
** Data suppressed to protect confidentiality or data not statistically reliable.n/u: No units exist in the universe for this category n/s: No units exist in the sample for this category n/a: Not applicable
Please click Methodology or Data Reliability Tables Appendix link for more details
6Canada Mortgage and Housing Corporation
Rental Market Report - Nova Scotia Highlights - Date Released - Spring 2015
** Data supresses to protect confidentiality or data not statistically reliable.n/u: No units exist in the universe for this category n/s: No units exist in the sample for this category n/a: Not applicable
Please click Methodology or Data Reliability Tables Appendix link for more details
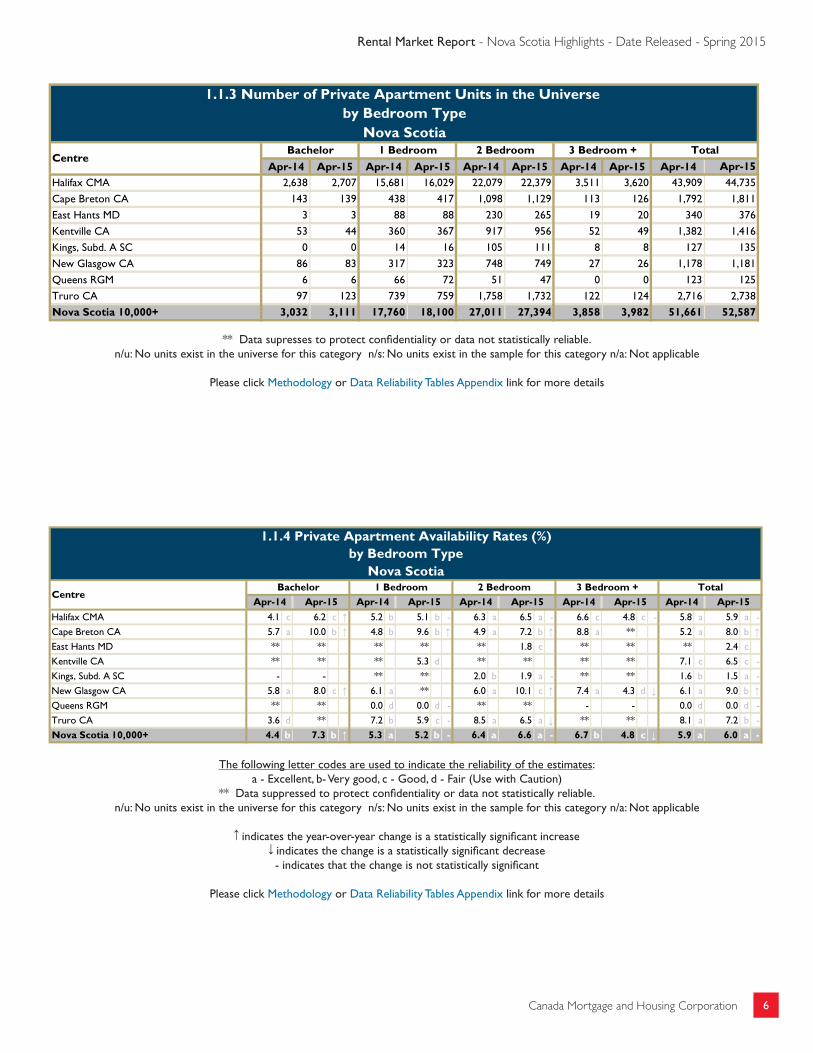
1.1.3 Number of Private Apartment Units in the Universe by Bedroom Type
Nova Scotia
Apr-14 Apr-15 Apr-14 Apr-15 Apr-14 Apr-15 Apr-14 Apr-15 Apr-14 Apr-15Halifax CMA 2,638 2,707 15,681 16,029 22,079 22,379 3,511 3,620 43,909 44,735
Cape Breton CA 143 139 438 417 1,098 1,129 113 126 1,792 1,811
East Hants MD 3 3 88 88 230 265 19 20 340 376
Kentville CA 53 44 360 367 917 956 52 49 1,382 1,416
Kings, Subd. A SC 0 0 14 16 105 111 8 8 127 135
New Glasgow CA 86 83 317 323 748 749 27 26 1,178 1,181
Queens RGM 6 6 66 72 51 47 0 0 123 125
Truro CA 97 123 739 759 1,758 1,732 122 124 2,716 2,738
Nova Scotia 10,000+ 3,032 3,111 17,760 18,100 27,011 27,394 3,858 3,982 51,661 52,587
3 Bedroom + TotalCentre
Bachelor 1 Bedroom 2 Bedroom
1.1.4 Private Apartment Availability Rates (%)by Bedroom Type
Nova Scotia
Halifax CMA 4.1 c 6.2 c ↑ 5.2 b 5.1 b - 6.3 a 6.5 a - 6.6 c 4.8 c - 5.8 a 5.9 a -
Cape Breton CA 5.7 a 10.0 b ↑ 4.8 b 9.6 b ↑ 4.9 a 7.2 b ↑ 8.8 a ** 5.2 a 8.0 b ↑East Hants MD ** ** ** ** ** 1.8 c ** ** ** 2.4 c
Kentville CA ** ** ** 5.3 d ** ** ** ** 7.1 c 6.5 c -
Kings, Subd. A SC - - ** ** 2.0 b 1.9 a - ** ** 1.6 b 1.5 a -
New Glasgow CA 5.8 a 8.0 c ↑ 6.1 a ** 6.0 a 10.1 c ↑ 7.4 a 4.3 d ↓ 6.1 a 9.0 b ↑Queens RGM ** ** 0.0 d 0.0 d - ** ** - - 0.0 d 0.0 d -
Truro CA 3.6 d ** 7.2 b 5.9 c - 8.5 a 6.5 a ↓ ** ** 8.1 a 7.2 b -
Nova Scotia 10,000+ 4.4 b 7.3 b ↑ 5.3 a 5.2 b - 6.4 a 6.6 a - 6.7 b 4.8 c ↓ 5.9 a 6.0 a -
3 Bedroom + TotalCentre
Bachelor 1 Bedroom 2 BedroomApr-14 Apr-15 Apr-14 Apr-15 Apr-14 Apr-15Apr-14 Apr-15 Apr-14 Apr-15
The following letter codes are used to indicate the reliability of the estimates:a - Excellent, b- Very good, c - Good, d - Fair (Use with Caution)
** Data suppressed to protect confidentiality or data not statistically reliable.n/u: No units exist in the universe for this category n/s: No units exist in the sample for this category n/a: Not applicable
indicates the year-over-year change is a statistically significant increase indicates the change is a statistically significant decrease- indicates that the change is not statistically significant
Please click Methodology or Data Reliability Tables Appendix link for more details
7Canada Mortgage and Housing Corporation
Rental Market Report - Nova Scotia Highlights - Date Released - Spring 2015
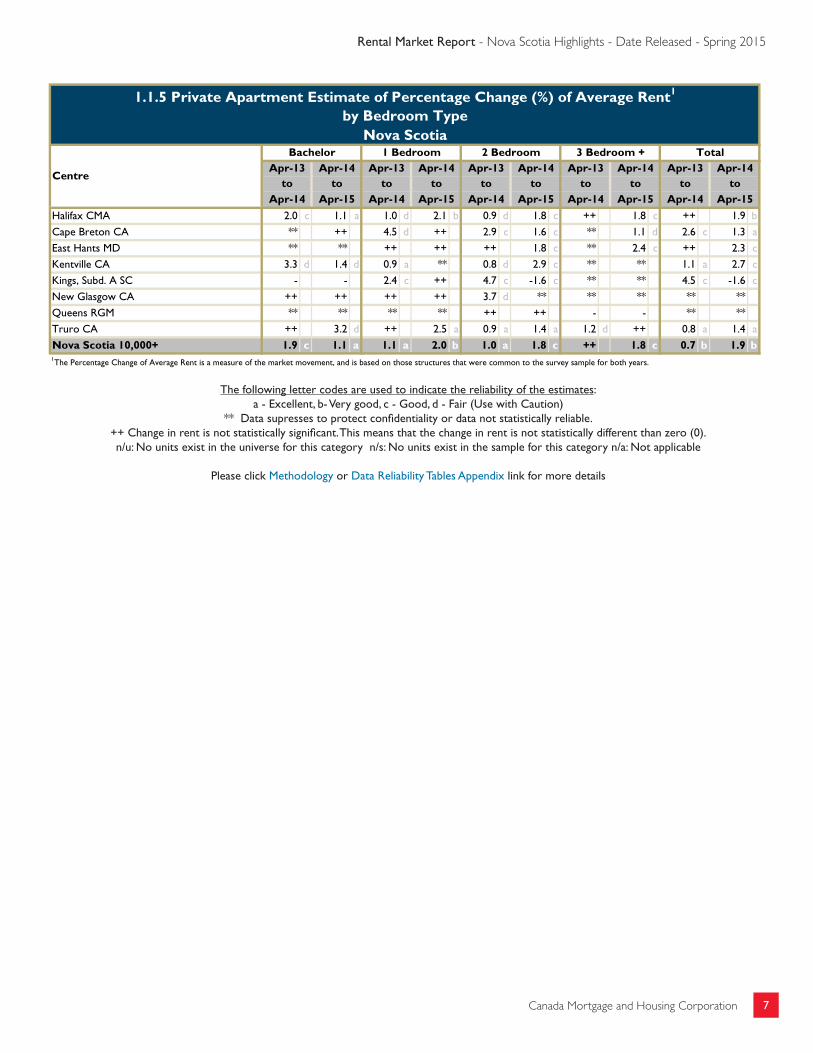
1.1.5 Private Apartment Estimate of Percentage Change (%) of Average Rent1
by Bedroom TypeNova Scotia
Halifax CMA 2.0 c 1.1 a 1.0 d 2.1 b 0.9 d 1.8 c ++ 1.8 c ++ 1.9 b
Cape Breton CA ** ++ 4.5 d ++ 2.9 c 1.6 c ** 1.1 d 2.6 c 1.3 a
East Hants MD ** ** ++ ++ ++ 1.8 c ** 2.4 c ++ 2.3 c
Kentville CA 3.3 d 1.4 d 0.9 a ** 0.8 d 2.9 c ** ** 1.1 a 2.7 c
Kings, Subd. A SC - - 2.4 c ++ 4.7 c -1.6 c ** ** 4.5 c -1.6 c
New Glasgow CA ++ ++ ++ ++ 3.7 d ** ** ** ** **
Queens RGM ** ** ** ** ++ ++ - - ** **
Truro CA ++ 3.2 d ++ 2.5 a 0.9 a 1.4 a 1.2 d ++ 0.8 a 1.4 a
Nova Scotia 10,000+ 1.9 c 1.1 a 1.1 a 2.0 b 1.0 a 1.8 c ++ 1.8 c 0.7 b 1.9 b1The Percentage Change of Average Rent is a measure of the market movement, and is based on those structures that were common to the survey sample for both years.
Apr-14Apr-13 Apr-14 Apr-13 Apr-14to to
Apr-15 Apr-14
3 Bedroom + TotalBachelor 1 Bedroom 2 Bedroom
Apr-14to to to to
Apr-15
Apr-13Apr-14 Apr-13 Apr-14to to
Apr-13
Apr-14 Apr-15 Apr-15
Centreto to
Apr-14 Apr-15 Apr-14
The following letter codes are used to indicate the reliability of the estimates:a - Excellent, b- Very good, c - Good, d - Fair (Use with Caution)
** Data supresses to protect confidentiality or data not statistically reliable.++ Change in rent is not statistically significant. This means that the change in rent is not statistically different than zero (0).n/u: No units exist in the universe for this category n/s: No units exist in the sample for this category n/a: Not applicable
Please click Methodology or Data Reliability Tables Appendix link for more details
8Canada Mortgage and Housing Corporation
Rental Market Report - Nova Scotia Highlights - Date Released - Spring 2015
Technical note: Difference between Percentage Change of Average Rents (Existing and New Structures) AND Percentage Change of Average Rents from Fixed Sample (Existing Structures Only):
Percentage Change of Average Rents (New and Existing Structures): The increase/decrease obtained from the calculation of percentage change of average rents between two years (example: $500 in the previous year vs. $550 in current survey represents an increase of 10 percent) is impacted by changes in the composition of the rental universe (e.g. the inclusion of newly built luxury rental buildings in the survey, rental units renovated/upgraded or changing tenants could put upward pressure on average rents in comparison to the previous year) as well as by the rent level movement (e.g. increase/decrease in the level of rents that landlords charge their tenants).
Percentage Change of Average Rents from Fixed Sample (Existing Structures Only): This is a measure that estimates the rent level movement. The estimate is based on structures that were common to the survey sample for both the previous year and the current Rental Market Surveys. However, some composition effects still remain e.g. rental units renovated/upgraded or changing tenants because the survey does not collect data to such level of details.

9Canada Mortgage and Housing Corporation
Rental Market Report - Nova Scotia Highlights - Date Released - Spring 2015
METHODOLOGY FOR RENTAL MARKET SURVEY Canada Mortgage and Housing Corporation (CMHC) conducts the Rental Market Survey (RMS) every year in April and October to estimate the relative strengths in the rental market. The survey is conducted on a sample basis in all urban areas with populations of 10,000 and more. The survey targets only privately initiated structures with at least three rental units, which have been on the market for at least three months. The survey collects market rent, available and vacant unit data for all sampled structures. The survey is conducted by a combination of telephone interviews and site visits, and information is obtained from the owner, manager, or building superintendent. The survey is conducted during the first two weeks of April/October, and the results reflect market conditions at that time. CMHC’s Rental Market Survey provides a snapshot of vacancy and availability rates, and average rents in both new and existing structures. There also exists a measure for the change in rent that is calculated based on existing structures only. The estimate is based on structures that were common to the survey sample for both the previous year and the current Rental Market Surveys. The change in rent in existing structures is an estimate of the change in rent that the landlords charge and removes compositional effects on the rent level movement due to new buildings, conversions, and survey sample rotation. The estimate of per cent change in rent is available in all Canada and Provincial Highlights publications, and also in the CMA reports (fall survey only). The rent levels in new and existing structures are also published. While the per cent change in rents in existing structures published in the reports are statistically significant, changes in rents that one might calculate based on rent levels in new and existing structures may or may not be statistically significant. Use caution when comparing changes in statistics from one year to the next. Even if there is a year over year change, it is not necessarily a statistically significant change. These tables include indicators to help interpret changes. ↑ indicates the year-over-year change is a statistically significant increase, ↓ indicates the year-over-year change is a statistically significant decrease, while – indicates that the effective sample does not allow one to interpret any year-over-year change as being statistically significant.
Definitions Availability: A rental unit is considered available if the existing tenant has given, or has received, notice to move, and a new tenant has not signed a lease; or the unit is vacant (see definition of vacancy below). Rent: The rent refers to the actual amount tenants pay for their unit. No adjustments are made for the inclusion or exclusion of amenities and services such as heat, hydro, parking, and hot water. For available and vacant units, the rent is the amount the owner is asking for the unit. It should be noted that the average rents reported in this publication provide a sound indication of the amounts paid by unit size and geographical sector. Utilities such as heating, electricity and hot water may or may not be included in the rent. Rental Apartment Structure: Any building containing three or more rental units, of which at least one unit is not ground oriented. Owner-occupied units are not included in the rental building unit count. Rental Row (Townhouse) Structure: Any building containing three or more rental units, all of which are ground oriented with vertical divisions. Owner-occupied units are not included in the rental building unit count. These row units in some centres are commonly referred to as townhouses. Vacancy: A unit is considered vacant if, at the time of the survey, it is physically unoccupied and available for immediate rental. Definitions of Census Areas referred to in this publication are as follows: A census metropolitan area (CMA) or a census agglomeration (CA) is formed by one or more adjacent municipalities centred on a large urban area (known as the urban core). The census population count of the urban core is at least 10,000 to form a census agglomeration and at least 100,000 to form a census metropolitan area. To be included in the CMA or CA, other adjacent municipalities must have a high degree of integration with the central urban area, as measured by commuting flows derived from census place of work data. CMAs and CAs contain whole municipalities or Census Subdivisions. Data presented in this publication is based on Statistics Canada’s 2011 Census area definitions. Acknowledgement The Rental Market Survey could not have been conducted without the cooperation of the rental property owners, managers, and building superintendents throughout Canada. CMHC acknowledges their hard work and assistance in providing timely and accurate information. As a result of their contribution, CMHC is able to provide information that benefits the entire housing industry.
10Canada Mortgage and Housing Corporation
Rental Market Report - Nova Scotia Highlights - Date Released - Spring 2015
CMHC—Home to Canadians
Canada Mortgage and Housing Corporation (CMHC) has been Canada's national housing agency for more than 65 years.
Together with other housing stakeholders, we help ensure that the Canadian housing system remains one of the best in the world. We are committed to helping Canadians access a wide choice of quality, environmentally sustainable and affordable housing solutions that will continue to create vibrant and healthy communities and cities across the country.
For more information, visit our website at www.cmhc.ca or follow us on Twitter, YouTube and Flickr.
You can also reach us by phone at 1-800-668-2642 or by fax at 1-800-245-9274.
Outside Canada call 613-748-2003 or fax to 613-748-2016.
Canada Mortgage and Housing Corporation supports the Government of Canada policy on access to information for people with disabilities. If you wish to obtain this publication in alternative formats, call 1-800-668-2642.
The Market Analysis Centre’s (MAC) electronic suite of national standardized products is available for free on CMHC’s website. You can view, print, download or subscribe to future editions and get market information e-mailed automatically to you the same day it is released. It’s quick and convenient! Go to www.cmhc.ca/housingmarketinformation
For more information on MAC and the wealth of housing market information available to you, visit us today at www.cmhc.ca/housingmarketinformation
To subscribe to priced, printed editions of MAC publications, call 1-800-668-2642.
©2015 Canada Mortgage and Housing Corporation. All rights reserved. CMHC grants reasonable rights of use of this publication’s content solely for personal, corporate or public policy research, and educational purposes. This permission consists of the right to use the content for general reference purposes in written analyses and in the reporting of results, conclusions, and forecasts including the citation of limited amounts of supporting data extracted from this publication. Reasonable and limited rights of use are also permitted in commercial publications subject to the above criteria, and CMHC’s right to request that such use be discontinued for any reason.
Any use of the publication’s content must include the source of the information, including statistical data, acknowledged as follows:
Source: CMHC (or “Adapted from CMHC,” if appropriate), name of product, year and date of publication issue.
Other than as outlined above, the content of the publication cannot be reproduced or transmitted to any person or, if acquired by an organization, to users outside the organization. Placing the publication, in whole or part, on a website accessible to the public or on any website accessible to persons not directly employed by the organization is not permitted. To use the content of any CMHC Market Analysis publication for any purpose other than the general reference purposes set out above or to request permission to reproduce large portions of, or entire CMHC Market Analysis publications, please contact: the Canadian Housing Information Centre (CHIC) at [email protected]; 613-748-2367 or 1-800-668-2642.
For permission, please provide CHIC with the following information: Publication’s name, year and date of issue.
Without limiting the generality of the foregoing, no portion of the content may be translated from English or French into any other language without the prior written permission of Canada Mortgage and Housing Corporation.
The information, analyses and opinions contained in this publication are based on various sources believed to be reliable, but their accuracy cannot be guaranteed. The information, analyses and opinions shall not be taken as representations for which Canada Mortgage and Housing Corporation or any of its employees shall incur responsibility.
CMHC’s Market Analysis Centre e-reports provide a wealth of detailed local, provincial, regional and national market information.
Forecasts and Analysis – Future-oriented information about local, regional and national housing trends.
Statistics and Data – Information on current housing market activities – starts, rents, vacancy rates and much more.
FREE REPORTS AVAILABLE ON-LINE
n Canadian Housing Statistics
n Condominium Owners Report
n Housing Information Monthly
n Housing Market Outlook, Canada
n Housing Market Outlook, Highlight Reports – Canada and Regional
n Housing Market Outlook, Major Centres
n Housing Market Tables: Selected South Central Ontario Centres
n Housing Now, Canada
n Housing Now, Major Centres
n Housing Now, Regional
n Monthly Housing Statistics
n Northern Housing Outlook Report
n Preliminary Housing Start Data
n Rental Market Provincial Highlight Reports
n Rental Market Reports, Major Centres
n Rental Market Statistics
n Residential Construction Digest, Prairie Centres
n Seniors’ Housing Reports
Get the market intelligence you need today!Click www.cmhc.ca/housingmarketinformation to view, download or subscribe.
Housing market intelligence you can count on
Quick and easy access.
Information in one central location.
The housing data you want, the way you want it
HOUSING MARKET INFORMATION PORTAL
Neighbourhood level data.
cmhc.ca/hmiportal