rmra: high speed rail feasibility study for...
TRANSCRIPT

•1
RMRA: RMRA: High Speed Rail Feasibility Study for ColoradoHigh Speed Rail Feasibility Study for Colorado
•2


Alternatives at a Glance
6 technology categories6 technology categories 79 MPH Diesel
110 MPH Diesel
120-150 MPH Electric
150-220 MPH Electric
125 MPH Maglev
250-300 MPH Maglev
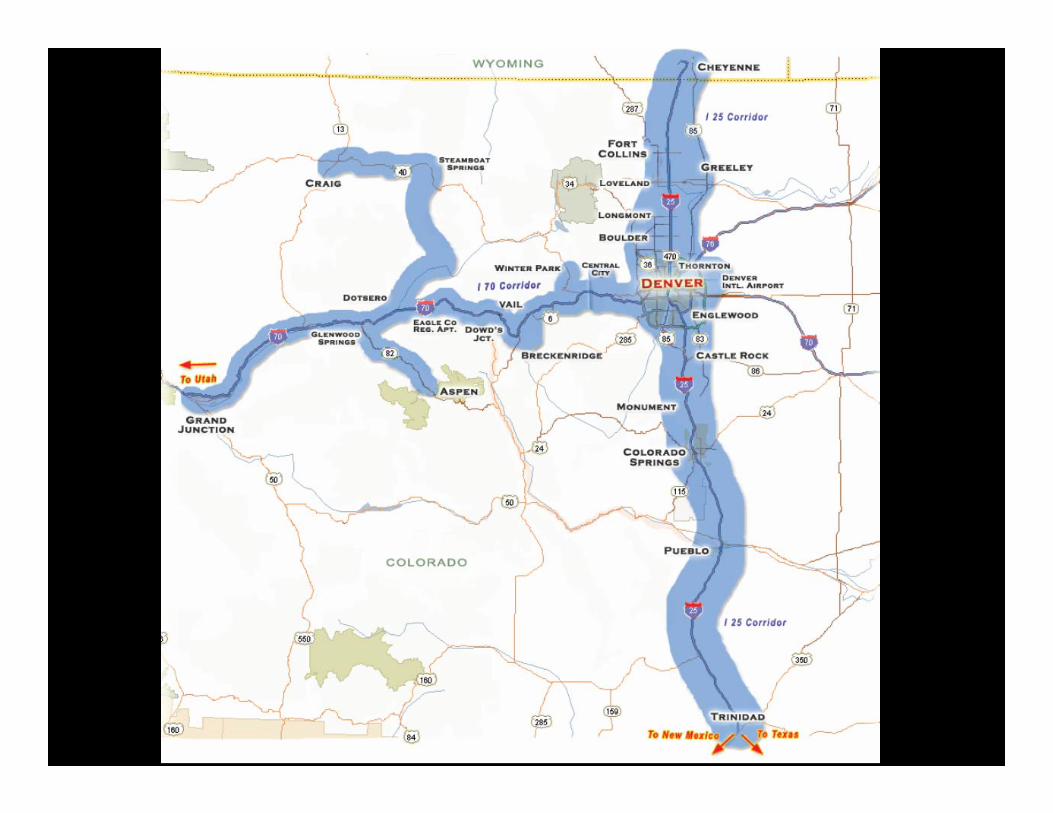
4 route types4 route typesHighway Right of WayHighway Corridor/ValleyUnconstrainedFreight Lines (with and without
freight rail relocation – R2C2)
2 station types2 station typesPrimarySecondary

Conventional Rail in Freight Railroad Corridors and 4 Percent Grade I-70 Unconstrained Route
#1 – I-70 Unconstrained (4%) with Existing Rail I-25
••Allows Mix and MatchAllows Mix and Match••Diesels evaluated only for IDiesels evaluated only for I--2525
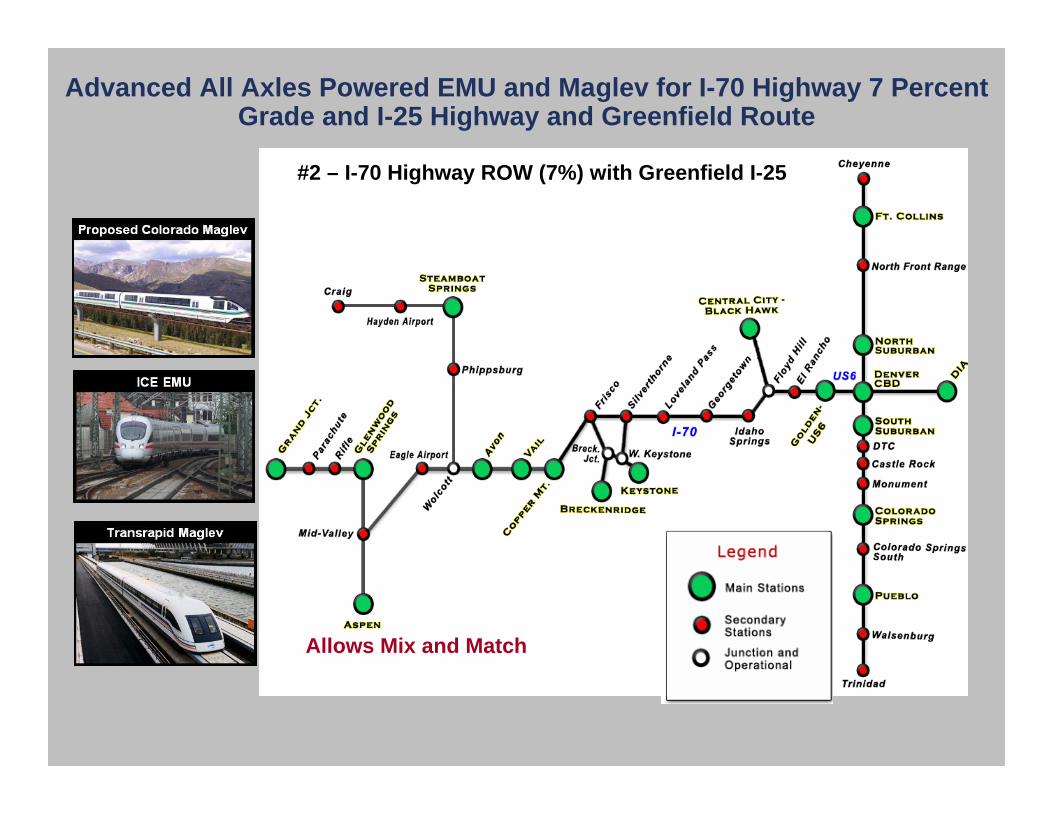
Advanced All Axles Powered EMU and Maglev for I-70 Highway 7 Percent Grade and I-25 Highway and Greenfield Route
#2 – I-70 Highway ROW (7%) with Greenfield I-25
Allows Mix and MatchAllows Mix and Match

Technology
Description79-mph
Existing Rail Non tilting
110-mphExisting Rail
Tilting
150-mphExisting Rail
Tilting
220-mphHWY ROW/GF
Tilting
300-mphHWY ROW/GF
Denver- to -
Colo Springs
Joint Line 72 mi
1:4541 mph$23 fare
1:0566 mph$23 fare
0:5874 mph$23 fare
- -
Greenfield 97 mi
- - -0:44
132 mph$25 fare
0:40145 mph$25 fare
Colo Springs
- to -Pueblo
Joint Line 46 mi
1:0046 mph$15 fare
0:3579 mph$15 fare
0:3286 mph$15 fare
- -
Greenfield 48 mi
- - -0:27
107 mph$15 fare
0:25115 mph$15 fare
I-25 South – Preliminary Operational Assessment: Time, Average Speed and
One Way Fare @ $.32 per mile

I-70 East of Avon – Preliminary Operational Assessment: Time, Average Speed and One Way Fare @ $.32 per mile
Technology
Description220-mph
4% Unconstrainedw/o Clear Creek
Canyon
220-mph7% HWY ROW w/Vail Pass
300-mph7% HWY ROWw/Vail Pass
SUMMARY DIA- to -
Avon
I-70 130 mi
2:13 142 mi
64 mph$42 fare
2:0662 mph$42 fare
1:5170 mph$42 fare
DIA- to -
DenverBNSF 23 mi
0:12115 mph$10 fare
0:12115 mph$10 fare
0:12115 mph$10 fare
Denver- to -
CopperI-70 79 mi
1:22 80 mi58 mph$25 fare
1:2556 mph$25 fare
1:1563 mph$25 fare
Copper- to -
MinturnI-70 23 mi
0:32 34 mi64 mph$7 fare
0:2263 mph$7 fare
0:1973 mph$7 fare
Minturn- to -
AvonUP RR 5 mi
0:0743 mph$3 fare
0:0743 mph$3 fare
0:0550 mph$3 fare
Denver- to -
Black HawkUS-6 35 mi
0:5439 mph$11 fare
0:5439 mph$11 fare
0:5340 mph$11 fare
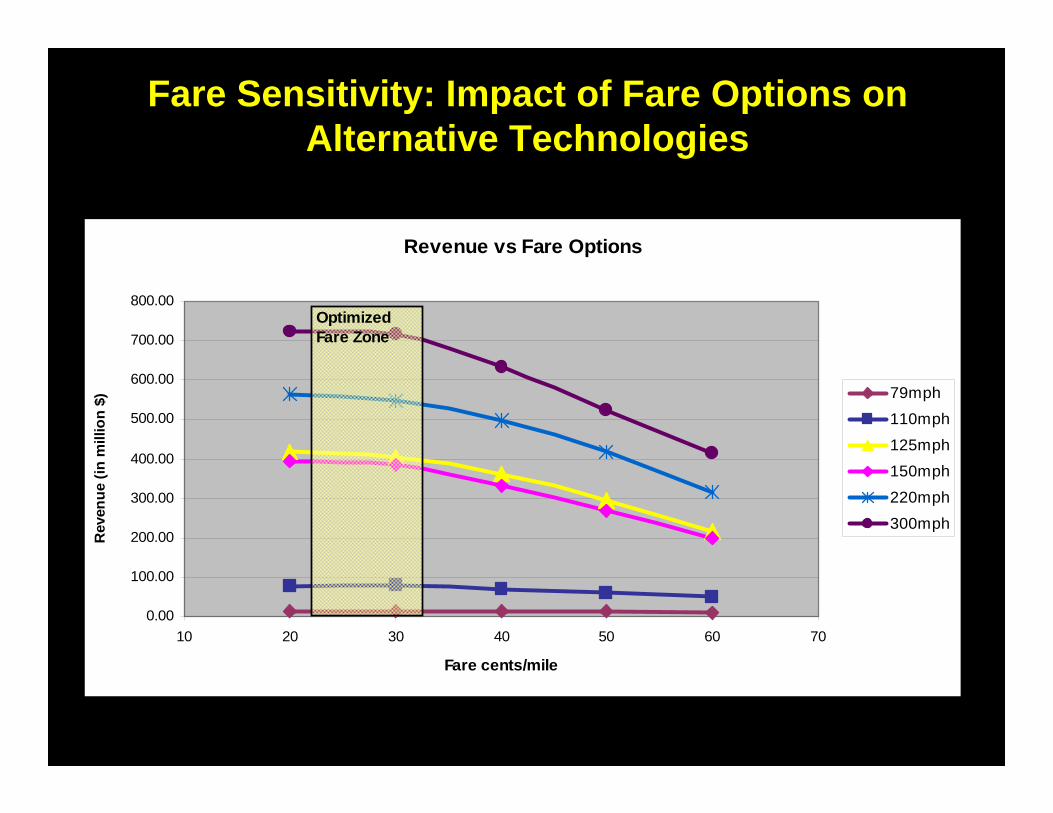
Fare Sensitivity: Impact of Fare Options on Alternative Technologies
(Central Demographic/Low Gas Case, 2025)
Revenue vs Fare Options
0.00
100.00
200.00
300.00
400.00
500.00
600.00
700.00
800.00
10 20 30 40 50 60 70
Fare cents/mile
Rev
enue
(in
mill
ion
$) 79mph110mph
125mph150mph
220mph
300mph
Optimized Fare Zone

Market Shares(Low Gas Price Scenario for 2025)
(Central Demographic/Low Gas, 2025; for 79, 110, 125-mph)
214 Million Total Trips
79 mph Market Shares (2025)
0.2%3.0%
96.0%
0.8%
2.8%
94.2%
2.8% 0.2%
0.2%
2.4%
87.9%
9.5%
AutoBusRailAir
110 mph Market Shares (2025)125 mph Market Shares (2025)
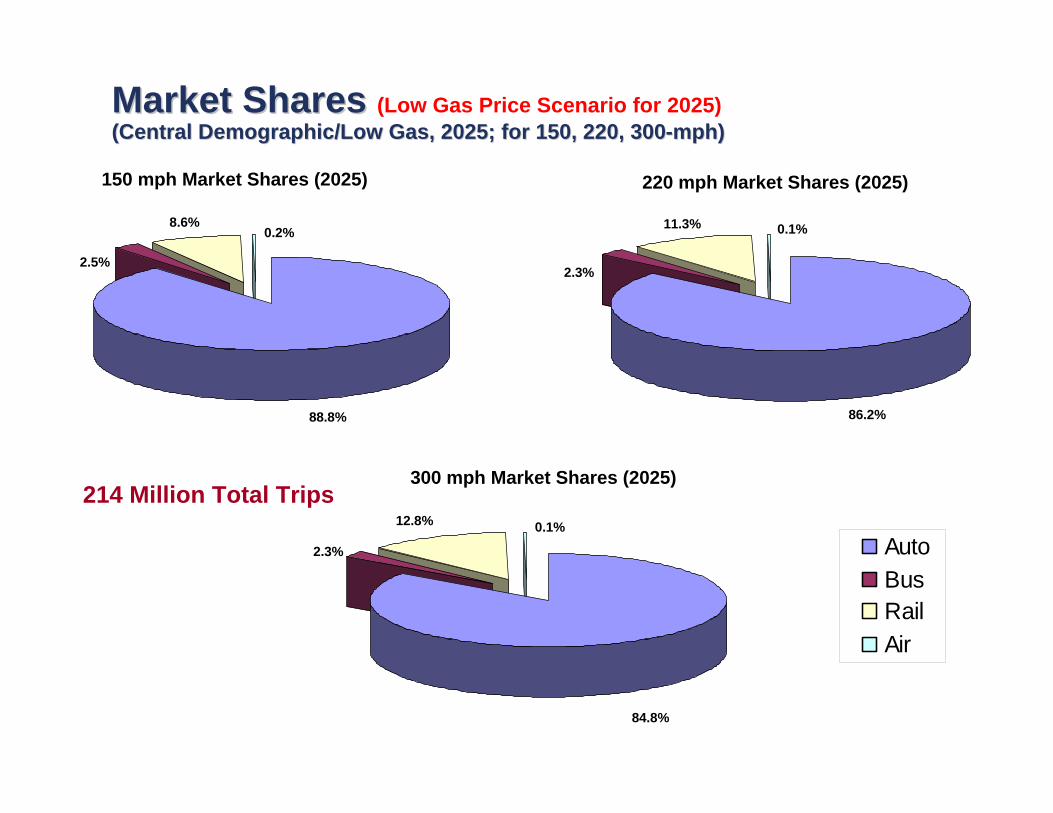
Market Shares Market Shares (Low Gas Price Scenario for 2025) (Central Demographic/Low Gas, 2025; for 150, 220, 300(Central Demographic/Low Gas, 2025; for 150, 220, 300--mph)mph)
8.6%
88.8%
2.5%
0.2% 0.1%
2.3%
86.2%
11.3%
12.8%
84.8%
2.3%
0.1%
150 mph Market Shares (2025) 220 mph Market Shares (2025)
300 mph Market Shares (2025)
AutoBusRailAir
214 Million Total Trips

4 % Grade Capable Electric Locomotive w/ 24 % Grade Capable Electric Locomotive w/ 2ndnd Car AssistCar Assist

Ridership: Millions of RidersRidership: Millions of Riders150150--mph Electric Railmph Electric Rail(Central Demographic/Low Gas, 2025)(Central Demographic/Low Gas, 2025)
I-25 – Existing Rail; I-70 – Unconstrained (4%)
* Selected Stations and Routes are for Analysis Purposes Only
150-mph: 15.53 Million per year
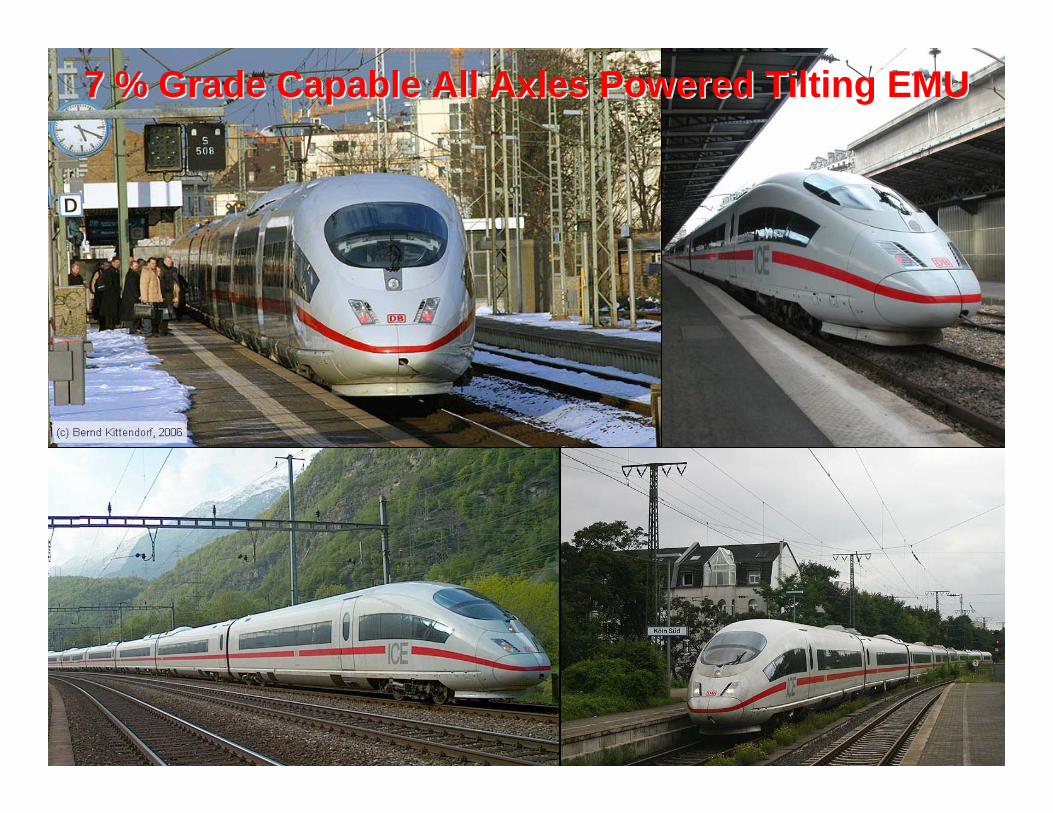
7 % Grade Capable All Axles Powered Tilting EMU7 % Grade Capable All Axles Powered Tilting EMU

Ridership: Millions of RidersRidership: Millions of Riders220220--mph Electric Railmph Electric Rail(Central Demographic/Low Gas, 2025)(Central Demographic/Low Gas, 2025)
I-25 – Greenfield; I-70 – ROW (7%)
* Selected Stations and Routes are for Analysis Purposes Only
220-mph: 20.69 Million per year
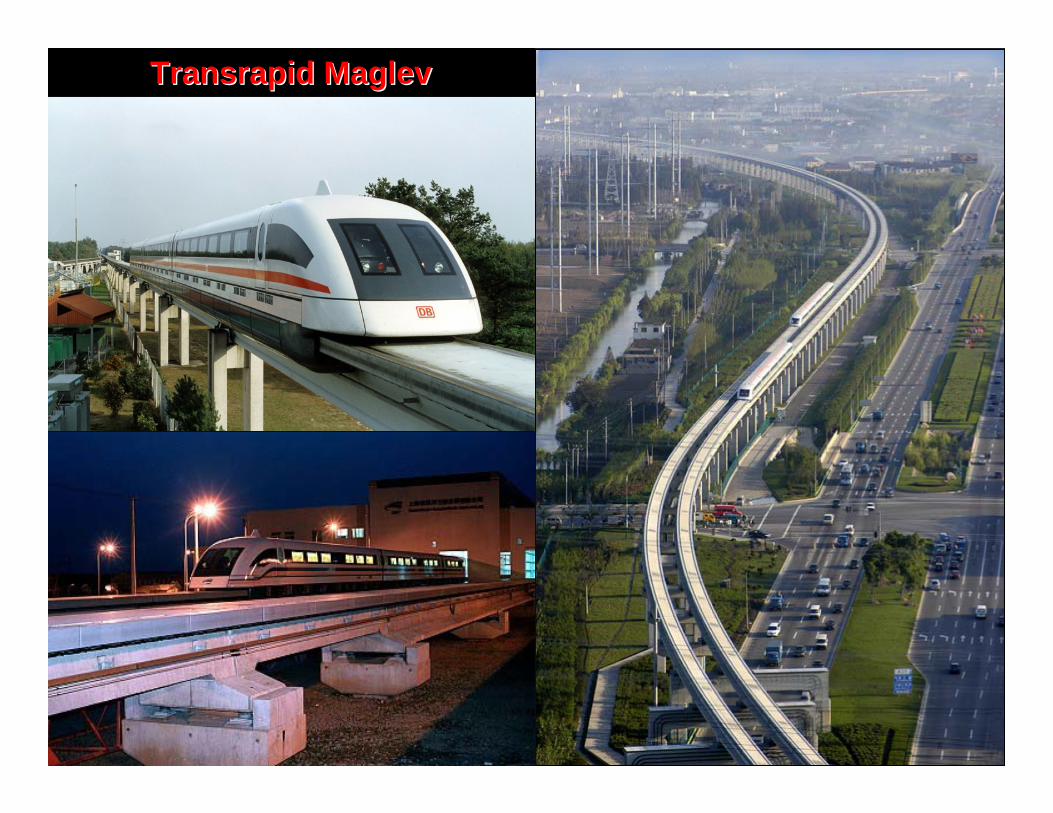
Transrapid MaglevTransrapid Maglev

Ridership: Millions of RidersRidership: Millions of Riders300300--mph Maglevmph Maglev(Central Demographic/Low Gas, 2025)(Central Demographic/Low Gas, 2025)
I-25 – Greenfield; I-70 – ROW (7%)
300-mph::23.65 Million per year
* Selected Stations and Routes are for Analysis Purposes Only

212 Million Total Trips 4.4%
93.5%
1.8% 0.3%79 mph Market Shares (2035)
0.3% 4.2%
90.7%
4.8%
110 mph Market Shares (2035)
Air
Bus
CarRail
0.3% 3.6%
83.2%
13.0%
125 mph Market Shares (2025)
Market Shares(Central Gas Price Scenario for 2035)
(Central Demographic/Central Gas, 2035; for 79, 110, 125-mph)
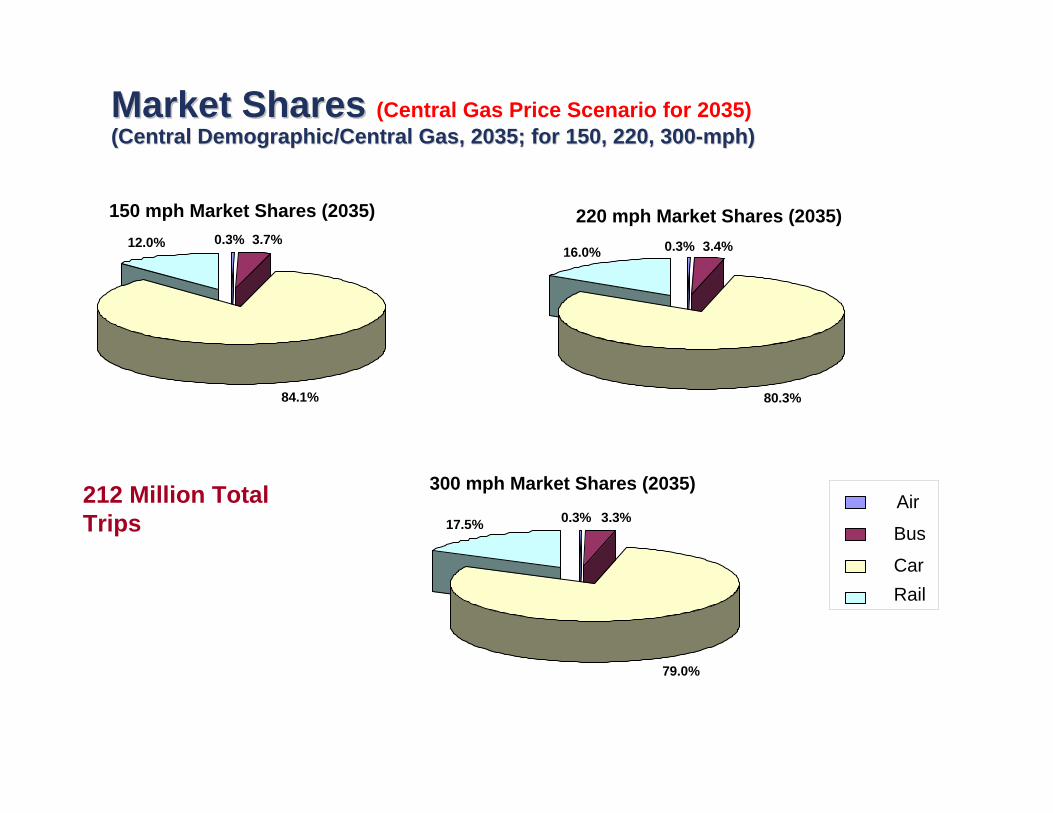
Market Shares Market Shares (Central Gas Price Scenario for 2035) (Central Demographic/Central Gas, 2035; for 150, 220, 300(Central Demographic/Central Gas, 2035; for 150, 220, 300--mph)mph)
212 Million Total Trips
0.3% 3.7%
84.1%
12.0%
150 mph Market Shares (2035)
0.3% 3.4%
80.3%
16.0%
220 mph Market Shares (2035)
0.3% 3.3%
79.0%
17.5%
300 mph Market Shares (2035)Air
Bus
CarRail

Financial Analysis(for Federal Funding Participation)
FRA requires a Positive Operating Ratio > 1.00
Operating Revenue
Operating CostOperating Ratio =
Means the system can run without an operating subsidy.

Economic Analysis
FRA Requires a Positive Cost Benefit Ratio > 1.00
Cost Benefit Analysis =Economic Benefit
Economic Cost
Means the system produces a positive net contribution to the economic well-being of the Country.
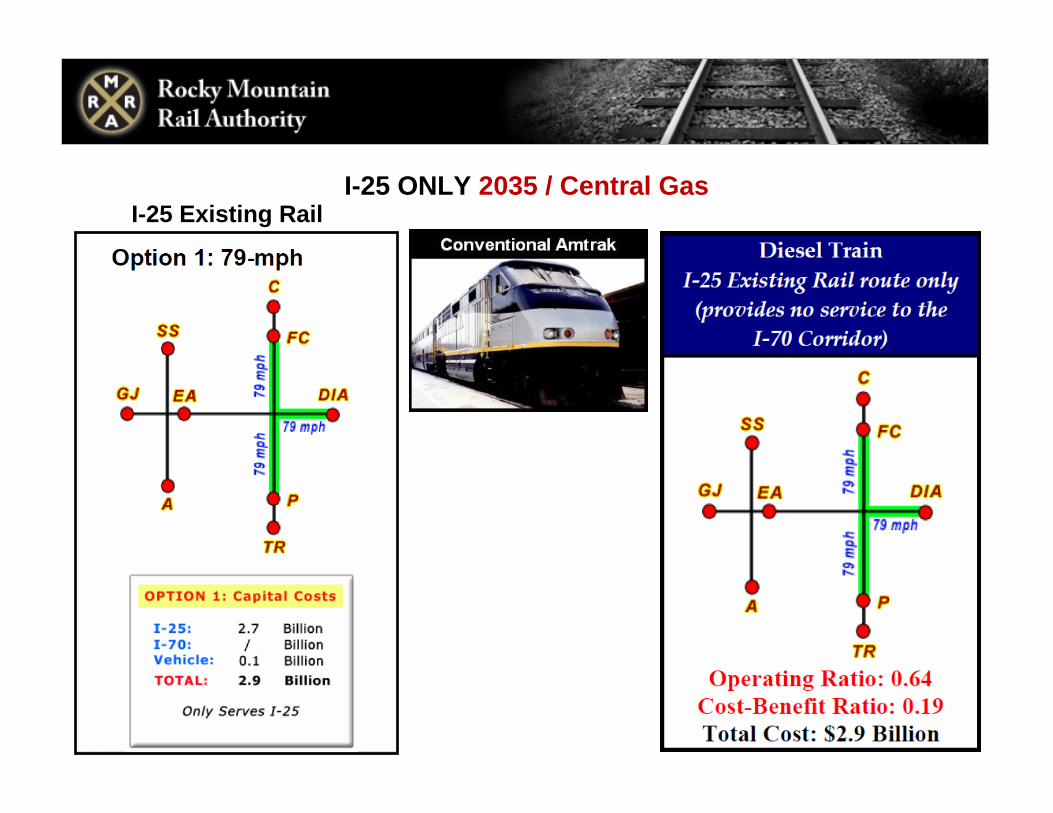
I-25 ONLY 2035 / Central GasI-25 Existing Rail

I-25 ONLY 2035 / Central Gas110-mph
I-25 Existing Rail

I-25 & I-70 2035 / Central Gas150-mph, 4% Grade I-70 Unconstrained & I-25 Existing Rail

I-25 & I-70 2035 / Central Gas220-mph, 7% Grade
I-70 ROW & I-25 Greenfield

I-25 & I-70 2035 / Central Gas7% Grade, I-70 ROW & I-25 Greenfield

I-25 & I-70 2035 / Central Gas
220-mph, 7% Grade, I-70 ROW & 110 mph I-25 Existing Rail
I-70
I-25

I-25 & I-70 2035 / Central Gas
220-mph, 7% Grade, I-70 ROW & 150 mph I-25 Existing Rail
I-70
I-25

I-25 & I-70 2035 / Central Gas
300-mph, 7% Grade, I-70 ROW & 110 mph I-25 Existing Rail
I-70
I-25
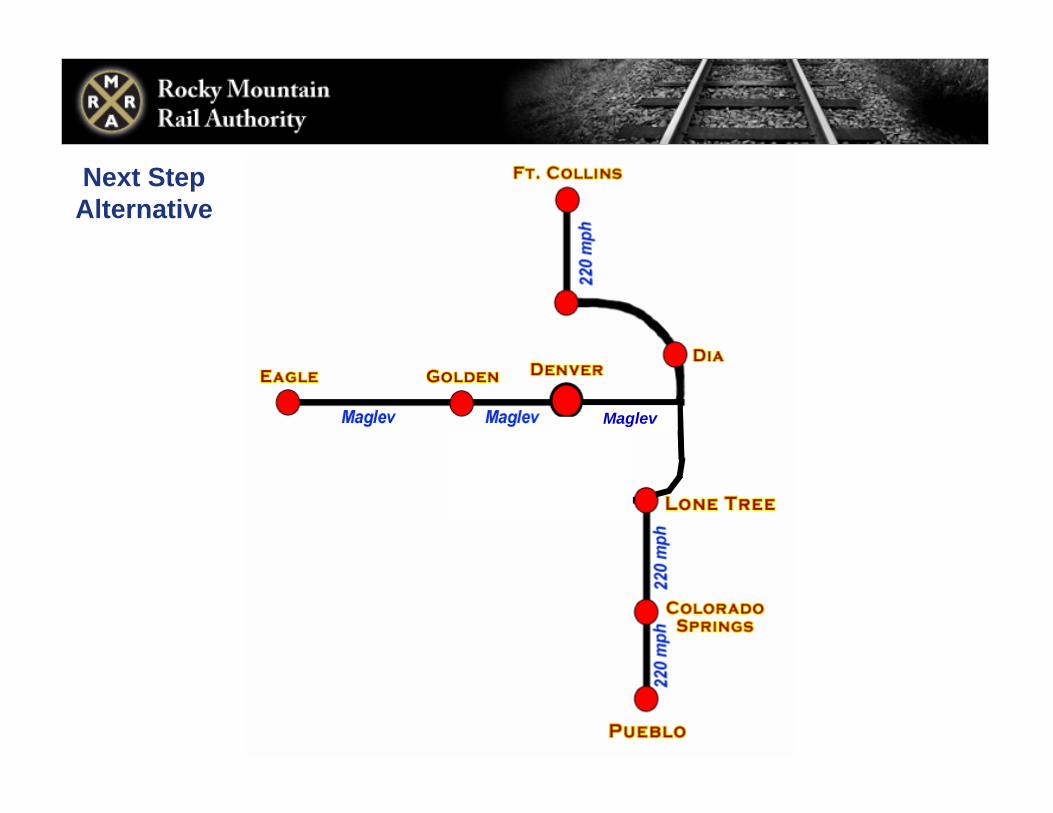
Next Step Alternative
Maglev
$8 Billion in ARRA and PRIIA Federal Grant Funding to states for improvements to Freight Railroad infrastructure and the purchase of heavy, slow, rigid, conventional rail vehicles for passenger operation in Amtrak Corridors
FRA Intercity Passenger Rail Service must use heavy, slow, loud, rigid, conventional rail vehicles on Freight Railroad tracks due to the potential of collisions with Freight Trains
No current FRA Policy for building unique, dedicated, completely grade separated, SAFE, electric powered, true high speed rail guideways required for Bullet Trains and Ultra High Speed Maglev Vehicles
No National HSR Passenger Standard Developed by the FRA –Every state creates their own Intercity Passenger Rail Network with no guarantee of Interoperability between states
FRA Intercity Passenger service to follow Freight Railroad Tracks which were designed to move very heavy loads at low speeds through industrial corridors. Passengers want to move at high speeds along highway corridors where the West has grown over the past 50 years.
Federal Railroad Administration Policy Disconnects