rmr bikes llc
TRANSCRIPT

Team Members: Ranee Pornbowornkiat, Matt Maze,
Rich Elles

Initial Strategy Low price and high volume strategy
Increase brand awareness through
appropriate divided advertising, public relation
and product distribution (retailer margin and
sale promotion)
Advertising heavily in magazine for mountain
bike; Advertising only focus on TV for youth
bike
Control capacity depend on market share,
estimated lost sale, sale units, and idle
capacity
Decrease wastages and debt; Lower the
expenses and idle; Maintain a good level of
efficiency and quality

Advertising
The data (left) shows
why we chose to
increase magazine
for mount bike and
TV for youth bike
50% of mountain bike
customers could be
reached from
magazines
70% of youth bike
customers could be
reached from TV
TV Internet Magazines
Road 10% 40% 60%
Mountain 40% 30% 50%
Youth 70% 20% 20%
Max
Advertising $3,000,000 $3,000,000 $3,000,000
Max PR $3,000,000 $3,000,000 $3,000,000

Result of our Advertising decision
In the above graph it displays the brand awareness for all the firms in
our world. Our brand awareness rose steadily each year and during the
final year our brand was the most recognized.

Decision 1
Established a price of $650 for our bike
Estimated sales to be around 21,000 and had a production of around 22,000
The most important part of this decision was gaining a foot in the market and accurate predictions
Our SHV increased to $13.08
Our only mistake was our estimate was to low
Decision 2
We kept the price the same but increased estimated sales and produced more bikes.
We increased our brand advertising to $500,000 to make people more aware of our brand.
We gave extra support to sport stores as that is where most customers bought mountain bikes from.
Our SHV dropped to $12.02 and our mistake for this decision was too much of an increase on production.
Decision 3
We kept all decisions the same, except
cut back considerably on capacity.
We also raised our price to $675.
After this decision our SHV rose to
$13.22.
Nothing went wrong with this decision
and our forecast was very accurate.

Decision 4
We added a new line of product and that was the youth bike with a starting price of $395.
We chose youth bike because it matches our target market and our aim: lower cost with high volume
Our forecasted sales for this new product was only at 25,0000.
We only advertised on the TV for this product as that would reach 70% of potential customers.
We upped the price of the mountain bike to $685.
Result of Decision 4
Our SHV rose once again, ending at $14.46.
First major problem with this decision was that
we overestimated sales in the mountain bike
line, thus we had a large ending inventory.
Second major problem with this decision was
that our forecasted sales for the youth bike
was very low and thus we had an estimated
loss of sales at 50,000.

Decision 5
We lowered the price of our mountain bike to $680 and lowered our forecasted sales for this line.
For the youth bike we redeveloped it and increased the forecasted sales up to 35,000.
We spent $1.5 million to better our efficiency in the plants and increased our capacity.
We paid off $200,000 of our debt and paid a cash dividend of $0.50.

Results of Decision 5
With this decision our SHV jumped up to
a whopping $23.02.
The only downside to this decision was
once again, our forecasted sales for the
youth bike was to low. We had an
estimated loss of sales of only 9,000 this
time but that’s because other companies
started to offer this line of bikes.

Decision 6
For this decision the only thing changed for the mountain bike was a slight increase in forecasted sales.
For the youth bike we increased the price up to $399 and our forecasted sales up to 47,750. We also redeveloped this bike again.
Once again we had to increase capacity.
We paid another $175,000 of our debt off to decrease our D/E ratio and increased our cash dividend to $0.70.
Results of Decision 6
With this decision our SHV
increased more than it had ever
done in the past and jumped up
to $38.08.
The only setback with this
decision is that our capacity was
still too low so we missed our on
a total loss of sales for both
bikes equaling 6,000.

Decision 7
The only changes for this decision came with
a large increase in capacity and we had to
raise our forecasted sales for both bikes.
We made this bold decision because we had
a pretty high estimated loss of sales in our
last period for both bikes equaling 6,000.
Estimated sales: Youth - 60,500; Mountain -
28,000
We paid off another $325,000 of our debt and
increased the cash dividends issued to $1.25.

Results of Decision 7
With this decision we kept our hot streak going of increasing our SHV dramatically. Our SHV grew to $48.15.
The major setback for this decision is that our sales of youth bikes actually contracted resulting in an excess of youth bikes at the end of the year.
Our sales for the youth bike dropped to only 44,000.
Our sales for the mountain bike remained the same as in our last decision. We thought it could have run into a maturity stage.
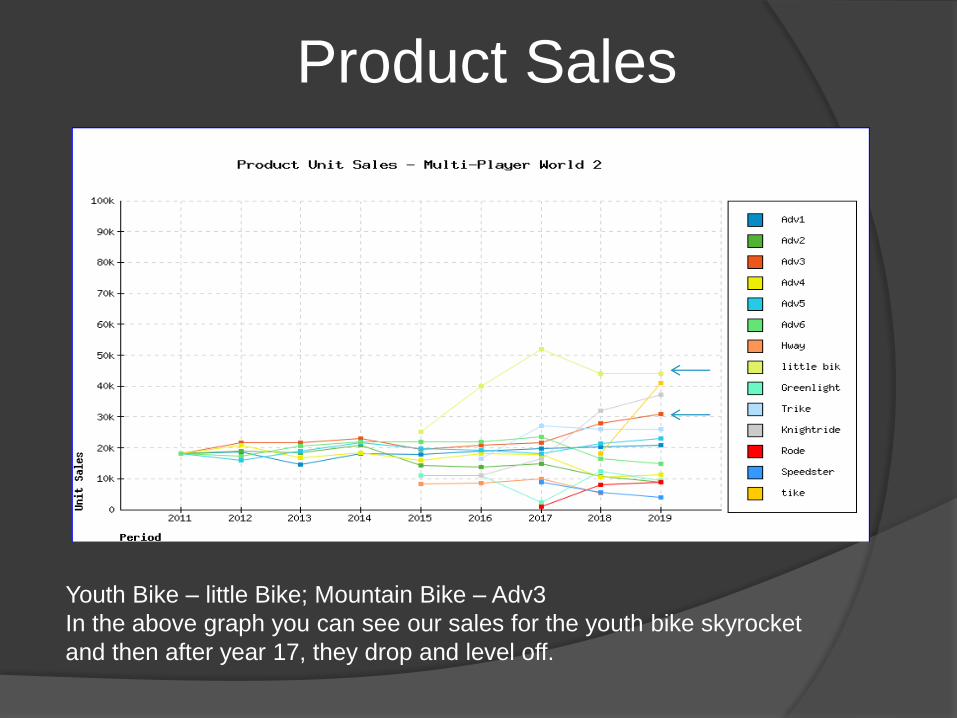
Product Sales
Youth Bike – little Bike; Mountain Bike – Adv3
In the above graph you can see our sales for the youth bike skyrocket
and then after year 17, they drop and level off.

Decision 8
With this decision we redeveloped our
mountain bike instead of our youth bike.
We decreased our capacity as we didn’t need
so much anymore as we had a large portion of
idle capacity.
Our forecasted sales were: Youth – 45,100;
Mountain – 29,750
We increased the cash dividend issued to
$1.35.

Results of Decision 8
With this final decision our SHV ended at
an impressive $60.04. This was a 453%
increase over the initial SHV.
We successfully redeveloped our
mountain bike, and as the result, we got a
7,368 estimated lost sales units
With this decision, after gaining so much
experience, our only mistake was too low
of production on the mountain bike.
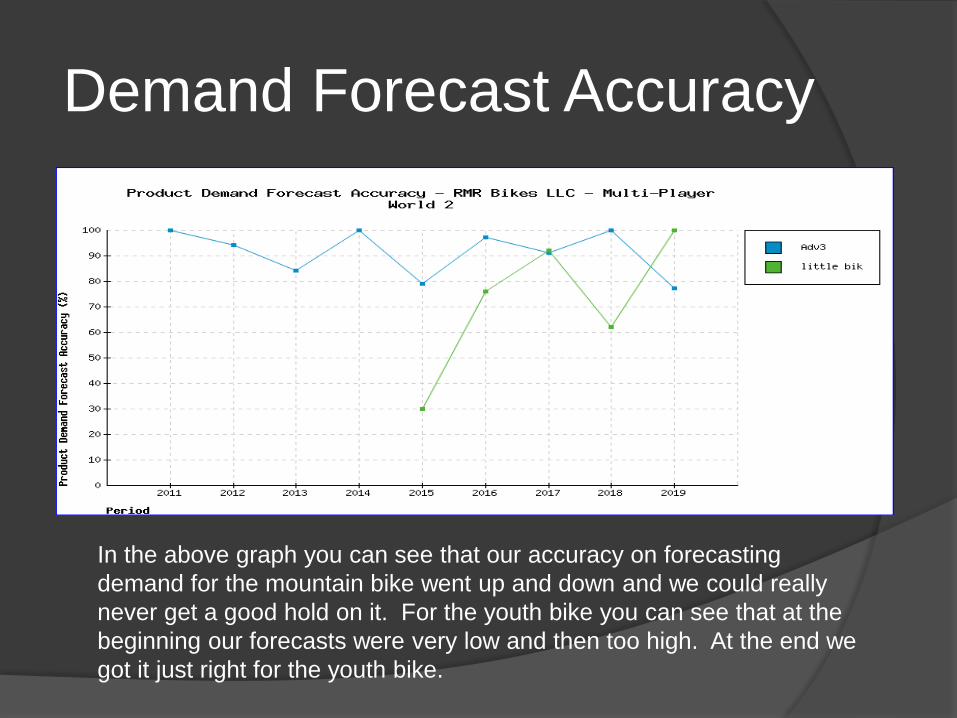
Demand Forecast Accuracy
In the above graph you can see that our accuracy on forecasting
demand for the mountain bike went up and down and we could really
never get a good hold on it. For the youth bike you can see that at the
beginning our forecasts were very low and then too high. At the end we
got it just right for the youth bike.

Profit
In the above graph it shows all the firms in our world profits. Our profits at
the start of the simulation are pretty consistent and than after the youth bike
is introduced in year 2015, our profits start to shoot up and then start to even
off once demand for the youth bike drops off a little.
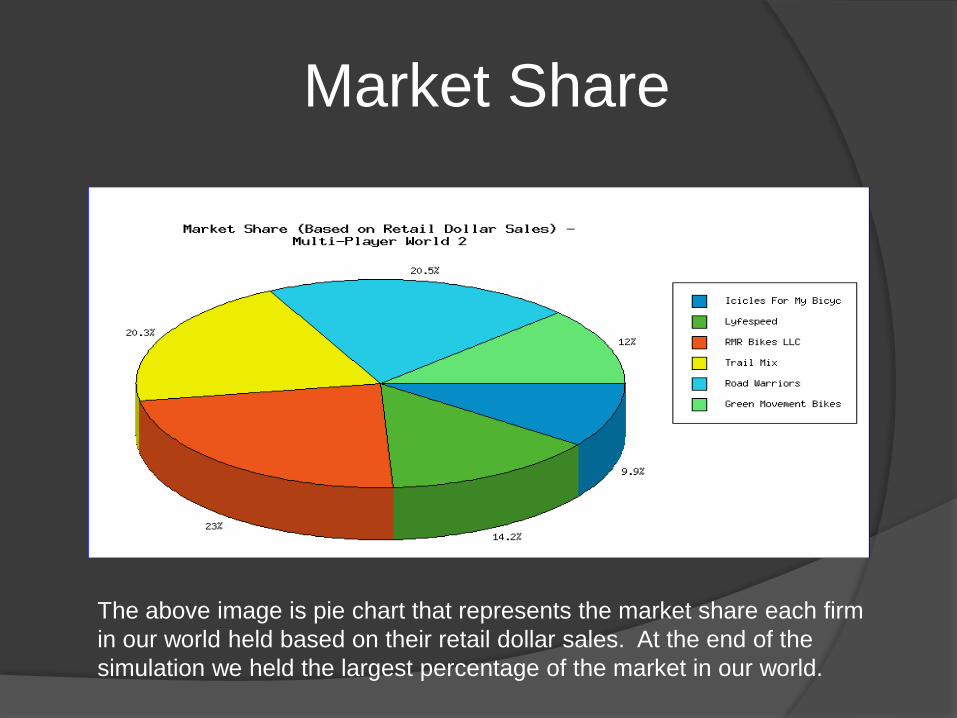
Market Share
The above image is pie chart that represents the market share each firm
in our world held based on their retail dollar sales. At the end of the
simulation we held the largest percentage of the market in our world.
What would you have done differently if you
went through the simulation again?
Better control in production
For Little Bike, we should have produced a larger
quantity when this new product came out. If we did
that, we would not have a 52,061 units profit foregone.
Same idea for the redeveloped Adv3, we should not
have decreased the total capacity; instead, we should
have put more production in the Adv3, and so we
would not have lost 7,368 sale units, which was the
highest sale lost through out the years for this line.
We would also liked to have increased our quality
index, and we could have had a better distribution.
What were your key takeaways?
Importance of Demand Forecasting
Crucial to maximizing profit
Find your entry advantage
RMR used low price for early differentiation
Conservative pricing gives flexibility
Began low, leaving room to capitalize on demand

Other Takeaways?
Do not stockpile cash – utilize profit
Redevelop products, issue dividends, pay LT debt
Manage inventory – be mindful of storage
No need to waste funding to create stockpile
Backlog greatly limits profit
Stay aggressive in the market!
Rework products and improve the business