rmed services t. h i al o - defense technical information center · rmed services t. h i al o do...
TRANSCRIPT

U a
rmed Services T. h i al o
DO UMENT SERVICE CENTER E RKNOTT BUILDING, DAYTON, 2, OHIO
Because of our limited supply you ar- requested toRETURN THIS COPY WHEN IT HSbVED YORPURPOSE
so that it may be made available to other requesters.Your cooperation will be appreciated.
DTICZ: WHIM OOVEVEM3NT OR OTHER DRAWINOS, SPECIFICATIONS OR OTHER DATAfE-U5ED FOR ANY PURPOS- OTR THAN IN CONNECTION WITH A DEFINITELY RELA-OVERNMENT PROCUREKENT OPERATION, THE U. S. GOVERNMENT THEREBY INCURS,) RESPONSIBILITY, NOR ANT OBLIGATION WHATSOEVER; AND THE FACT THAT THE
C)VERNMZNT MAY HAVE FORMULATED, FURNISHED , OR IN ANY WAY SUPPLIED THEkID DRAWINGS, SPECIFICATIONS OR OTIHER DATA IS NOT TO BE REGARDED BY9PLICATION CA% OTHERWISE AS iNY MANNER LICENSING THE HOLDER OR ANY OTHIf5RrON OR CORPORAUION, OR CONVEING ANY RIGHTS OR PERMI ON TO MANUFACT-1rEl OR SELL ANY PATENTMD INVENTION THAT MAY IN ANY WAY BE RELATED THERET
K F! F\ 1f

REPRODUCTION QUALITY NOTICE
This document is the best quality available. The copy furnishedto DTIC contained pages that may have the following qualityproblems:
"* Pages smaller or larger than normal.
"* Pages with background color or light colored printing.
"* Pages with small type or poor printing; and or
"* Pages with continuous tone material or colorphotographs.
Due to various output media available these conditions may ormay not cause poor legibility in the microfiche or hardcopy outputyou receive.
L. If this block is checked, the copy furnished to DTICcontained pages with color printing, that when reproduced inBlack and White, may change detail of the original copy.

BRfELL' AEBROflUTICAL LABORRTORY, InCO.
Cm)4
~t1~L 0'A 11/24& WAUZ mm)-AI NDPP'~dgl `PADOM AND TOMR
5058LIZD*1puint ou~r
__'It 30(609)" 76CpNo
R U F F A LO 0 r W Y 0 P~ K

CORNELL AERONAUTICAL LABORATORY, INC.BUFFALO, N. Y.
REPORT NO. UB-909-D-1
WIND TUNNEL TESTSOF A
1/24-SCAIE MCDEL AIR SUPPOIrED RDOME AND TOWER
CONTRACT NO. AF 30,602)-976
U. S. AIR FORCEROME AIR DEVELOPMENT CENTER
GRIFFISS AIR FORCE BASEROME, NEW YORK
Byt Industrial Division Prepared by: _________
"Murraf Kamras sDate: Sept. 2h, 1954
Approved by: K- ,Walter W. iLrd, Asst,.1forfIIndustrial Division

VA!3ll" 0- COPUEN2TS
Page
PARM I
A. Purpoise1
1. Introduc tion1
2. Problem Breakdown 1
B. General Factual Data 2
1. Identifi cation'of Technicians 2
2. Patent$ 2
3. 9eferences .3
1~*F6Mulae
5o MNamirement Procedures 1
G. Deta~il Factual Data 15
1.6 odel 15
2. Data -Comptrison of Measured and Theoretical 19
3 t ff ict of Terrain 31
a~ ffect of bwnolds' Number 31.,
5. affect of Binfterl Pressure 33
6. ftind Buw2lockage Correction 33
PA1M It ftSoommodationin
A, Aerodynamic Loadiag of fladome 38
B. Tower Loading *38
Is Lift Loads 38
2. Drag Loads (Shear) .39.
3.* Radovm Attadhment Loads 40
C. P.nvelorA Stresses Ito
1). Rnquirod 'nflxtion Presmxire h
LIST OF ILLUSTRATIONS
No. Page
Frontispiece ii
1. Radome Geometry 4
2. Resolution of Forces 5
3. Tangent Diagrams 5
4. Mean Pressure Distributions 7 •
5. Lift Elements 8
6. Lift Distribution 9
7. 'Aadome Side Elevation 10
8. Lift and Shear Beals 13
9. Sohematio Diagram of Strain Gage Installation 114
10. Model Tower 16
1o. Model Tower and Wedge 17
12. Balance Systm 18
23 Caloulated Lift Loads 20
14a. Base Lift Loads 22
14b. ase Lift Loads 23*
21. Base Shear Loads 25
16. Baie Shear Distribution 26
17o, Drag Distribution 28
18. Variation of Lift with Angle of Tilt 30
19. Effect of Reynolds' Number 32
iv

PA RT I
A. PURPOSE
A-1. Introduction
A-la. For the past six years., the design of air supported radomesand their supporting towers has been based on the recommendations outlinedin the Design Manual for Spherical Air Supported Radomes (Ref. 1). ThisManual was prepared using the classical pressure distrlbution around a sphereas a basis for the aerodynamic loading on the radome. This distribution wasmodified to take into accomat the effbct of the ba~e tower on the airf lowacross the radome. The the oretical calculations were also correlated withthe limited amount of wind tunnel test data available in o 'rder to arrive atreasonablo design valuess Design recommendations based on these data werebelieved to bp conservative and suffitbiently accur'atie for design purposes,provided that recommewnded factors of safety were maintained.
A-lb. Recently,, howeVer, a need has arisen for radomes suitable''o ue in ar~eas'where wind velocities of 150 mph are likely to be encount-
ered., The ftrcesi which such winds would impose on the radome envelope andtower are 'over 40% -greater $thaz thoe aresulting from the 325 mph winds con-sidered naximum at the time thp.Manual was prepared. More accurate data areýthus required to ineure an ecoionicall yet adequate, stmictiral design.
A-la6 it was decided tchat a wind tunnel program would be the op-tA om metbod of obtaining tower load~ing and other data required for designpurposes. 1h order to obtain maximum value f'vom the program it was decidedthat the stf.6t of the following parameters sh'"l be investigateds
~, Wnd seed up to 200 mph)(2 Zt~rnal inflation pressure
(3) Angle of attadc (simulating a hilltop installation with'wind sweeping up over the radome)
(1) eynolds' anumbr (to determine, if possible, variationin lift or drag coefficient with Hey-nolds' number)
A-2* Probimi Breakdown
A-fte Design wAd Pabriation-of-Wind Tunnel-Models A V/21-scalewind tunnel model was designed and fabricated, using a light weight two-ply,1450 bias constiucted neoprerse coated z~lon envelope and a rigid plywood towerhaving a shape siatlr to the AN/VPS-6 &artic tower* ýThe radome envelope was-attached to a base afgle, inetrmunted so that shear and tension loads actingon the tower could be amasured. Pressure taps were installed in the radomeenvelope and towrx so that pressure data could be obtained. Provision wasiriido for controlUrig inflation pressure inside the reuiomir. A m~ore det~ailed
d"r.ipttinn of thew model in given in Part C of this report.

A-2b. Wind Tumnel Tests: The model was installed ini Uic Gor,-l ýIIAeronautical Laboratory twelve toot variable density wind tumnel. All pres-.sure and electrical lines were connected and checked out. Five wind tunnel'runs were made as followss
(1) Tower level, 2/2 atmosphere, velocity 50-200 miles per hour(2) Tower level, 1 atmosphere, velocity 50-200 miles per hour(3) Tower tilted 15 degrees, 1 atmosphere, velocity 50-200 miles
per hour
(4) Tower tilted 30 degrees, 1 atmosphere, velocity 50-20o milesper hour
()Tower level,, 1-2/9 atmospheres, velocity 50-175 miles per hour,.
A-2c. Calculation of Data and Final eport Following the windtunnel tests t lneoessar7 to redice the test data to a form suitablefor comparison and presentation. This work included the calculation of straingage loads, pressure coefficients, tunnel parameters, plotting of pressure '.
data, calculation of theoretical loads to compare with strain gage data' etc.The restlts of these calculations are presented in Section C of this report.,
:L-, :-1mtIf.icad nof Technicians .
T...folli.."•if dividuals were the major technical contributors tothiprogft• •rom time to time other engineers spent small amounts of time.,,,on the project, but these are not 4ncluded below. Also not identified are
,the electronic and mehanical technicians and shop personnel whose work aS.dorn under the mspervision of the listed personnel.
i t oP.L, B.8. in Aeronautical fntineer••w3^6-497 Engneer, Aircraft laboratory, Wrigbht Fige.l1947-I195 Ungneer, Applied PhWsics Lab., Johns Hopkins Univ. .1951-Prei. loead Operating Section, Wind Tunnel Dept., Cornell
Aeronautical Laboratry
2. Bird, .. 3M.I.T., B.. in Aeronautical EngineeringM.X.T.j Fellow in Business and Engineering Administration3934-12939, E oeer, Pul2nam Standard Car Mfg. Co.1939-1945P lead of ftg*.Lab.,q Curtiss Wright Corp.194!-194 6 , Chief Test Engineer, Columbia Aircraft Corp.19•6-Pros. k ,st. Dept. Bead, Industrial Division, Comell Aero-
nautical laboratoryNov 3!w on this progrom - 5
3. Czeck, 3. A.Aeronautical University (Chicago)195l-1953 U. B. Navy, Aviation MetalsB4th, 3rd clAin, andr
Airframe Evineer at Corpus Ch•ristie1953-1911 Assistant Aeronautical Enrine er, Wind Tunne.1 Dropt.,
Cornell Aeronaitical Labormtorynour'm cm t.his rrn m - 8
2'

4~. Kamras s, It.Univ. of Mich.,* B.S. in Aeronautical EngineeringUniv. of Buffalo, M.S. in Mechanical Engineering1942-19144,0 Aerodynamicist, Stinson Division, Consolidated
Vultee Aircraft Corp.19144-1946o U. S. Amyl946-.Prer;. Research Engineer., Industrial Divis ion,, Cornell
Aeronautical LaboratoryHours Co.this program - 460.
Clarkson College of Tehdiology, Bachelor of Mechanical Eug.l9143-195O, Flight Test Instninntation Ingineer., Curtiss
'Wright Corp*195o-pres, Research Engineer, IndUstrial Division, Cornell
Aeronauti cal laboratory
-ni.of Florida, -1308 in Mechanical Engineering19142-946,0ý U 6 S.6 wav1946..Pres i. A8eAA6aitt Research Sagineer, Industrial Division,,
Coftell Aezomutical laboratoryifou"rs an 'thit program* 123
52.Patet
S-adNoe~ting piatn a are applicable to the pr'oblem at hand.
34b.No pten1 irae pendig or iinveiations being considered for
B-3 b bfraces
1. 1wod waltera 1ei Manual for Spherical Air Supportedhsdons s Cornell, Aeronsautical laboratory Report No, MB- 66 4449-12 October 2950.
2. Dodgo, RAs ankd Thompsons, M.J,q Fluid Nechanics, McGzaw gillSock 0o.# 1937.m
*3* Brnd, L., Vector aid Tom or Analysis, John Wiley & Sons, Inc.,
4. Streeter# V.?.., Fluid Dynamics, McGraw gill Book Co., Inc.,p1948.
5. Nerriotp John 0.# blockage Corrections for Three DimansicoIn~Plow Closed Throat Wind Tunnels,, with Consideration of theItf~at of Couprossibility, NACA Report 995, 1950.

B-4~. for=ulae
B-J4a. Geoimetrical Symbols
WIND
Siekievation View A-A
1?1. .1. ftdome Geometry lfVw
'b3/2 luigth o6f, intersection of base with plane of latita dn
a ftdiiaaa-fb si" l'135 inches.
i~ ~*eOf latitWiinala circle.-4:Asimith a*41e (from relative wind).
B ase Antle'Angle btwnei 6her component and Ne.. (see Fig. 2).* A *gl from horizont. plane throug -center of sphere.
%Anglo' from stagnation point on s;.%sreWL~ AnglU between tugit to the crowin great circle and the
'atltuidinaa1 circle at the base (See Fig. 2).17Direction angle-of tingent'to radoam surface (See Fig.*) 2
A AraiD Dragd Drag of elemnatal AreaI Pressure o~efficients1D Drag coeftiaient
Lift coefticieubL Lift~j Fabric lead along great circle through North PoleI MFaric load In latituxdinal. direction
T~ abric load in longitudinal direcotion?. ree strean static pressuire
q Dynwa~i pressire =,A(/2/2S hocr foree
x Ordintnire. in wind ctiraetion

Subscripts
u Upper hemisphere of radome1 Lower hemisphere
B-4tc. Resolution of Forcest To compare theory and experiment it isnecessary to resolve force components. The theory of Ref. 1 calculates N0 andN, whereas the experiment measured integrated values of N0G andi S, The re-M~ionship between these components is showni In Fig. 2 below:
10At
Pig* Uto 4Yr~
tirg. ta crewoutiondi-vl c i rcles noma to
direoteo" !he'Angle b~t*wa ~hs tWwpofdro)es (or their tangents) varies *ithamimith
40
A< aM.00 /
010,rWTLW / -
Too
Tangen~t to CrMw Circle Tangetit to Latitudinal Circle
Pis. 3Tangent Diagrams
Fi&. 3 shown diagms~ of the trio tangents separately to improve clarity. We
ha"v the following swxpression (a -f Ret. 3):1
I.,T~ 1 im &Mx n are (d~rection cosinles of the tiro tangentB and the suhmcriptn

For the asall circle tangent
A~900 and ml Wcos X1 -o
Hence we don't need m2 orA 2
From the geometry of the figure we have
ZO OC 00inO. AO cosod sine(OA2 AO iAO AO AO
12 = ooste sin o(
'A2 "90 n- , ron (90 -1
a 90.');3.1 0089 (90 ..V1)
n11 *cooVI
Hence
COB �W 0 (90 -sV1) 0064 Bin 4 0 1 co (90 -+ C) c (go
But~))is aconstant -tan71 h -tan- 1 40
4 is a ooretat = 670401
-. 925., oo=.8 .380
Fina.37 then
Cos W= 0.380 sin Etat-il AM ~sin e .925 con)'1
B-4d, Calculation of Lift from Pressure Distribution
B-40(1). Theoretioal Lift Distributions The pressure dis tribu-tion over a classical sphere i3 viscous flow was-assumed as shown in Fig. 4,which was taken from Ref. 1, This distribution was assumed to be symmetricAbcit the wind axis, For a omuplete sphere no vertical force would exist,but for tho truneated radome sphere a vertical force is obtained. This lift

ran be e~prA:ý,3sd .asi d~il~riiija.l io by the Cquation
dL" 2 -Kb dx
9-2KW 7 dx
where L is lift
I is local pressure coefficient
wI'~io
Fige. Lift 3lements
The total lift in'the integral of the lift over each strip.
For the upstream part of the sphere the pressure coefficientoou2d be eipressed by the equAtion
K ain.~.12% Rf
Because of visoseity, however, the pressure over the dawnstreampart of the sphere does not follow this law. To Oalcu!Ate the total liftthen, the expresuion for dW/q was plotted as in Fig. 6, and a planimeteruped to obtain ths integated value of the lift coefficient.
B-)d(2). Lift Calculation Based on Measured Pressuret The cal-culAtion of UJtt fro ýMured pressure is simiIar in principle to that oftho th nretlwxl oslculated heretofore. However, the meamired prcrmirn ov'!r

. .* .i . J .....
t2 i - -
Lt' T!M t
F4i. .
H4* tit ;'~ o t4-.
o. 44
1-4 A i
17,4 A t 4. 4 144fit1 _ .±.~ 'LL.. 1 4 4 .~~6 T -i l " ~ * ~
lo!
4' r

t.h1ie xpper hem PiV-,r of We r Lar. d'fei-tnt from that over Uvi :heisphere. TMerefore, it was necessary to calculate the lift contribu-tion of the upper and lower parts of the sphere separately. For the upperhemisphere we have
A -2K 1 ar dx a2KR2 x dq,
For the lower part we have
dL? A 2 (r - b) dx -2K ( 2 \B2 dx
where
For', lXi /1.* X2- a-Z dx
then the' total Lift
q
'\ RýzZdx I.R2 d
This eipMession isa also plotted in Fig. 6
B-.Ie, Clo ,ation of Dre_ from Pressure Dise, bution
B-441&e(l) _• •• l DMs The hemisphere can be divided intoeleimnts normal to flow directon Fig. 7)."
Fig. 7 Radome Side Elevation
10?

A .WrRde 1TR 2 sine0 d eThe drag force on each element of the uppe'r hemisphere can be expressed
d(Dj, u KirR2 sin ecose9de9
and the total drag is then
-R2 siarK4 un8cos ede9
But
Ro 666 0 dz -R 1in 0d 0
therefore
on the looe~r is urfc te ir a is a functioni of z. Ec lun atotal Aira
-A7 2 (1 L is 2R2 sin 9(I 2 d9
-Where
d~;).~ 2R2 In 9 oo 0 de 0f
Mabtitating asabove for the furnotiozis of e
R
Note tat for
/XI >/The total drag can then be expressed
9-14.(2). ThorticalDrejm The theoretical drag can boe calcu-lsitr~d uri1ng thm IýAnnl equation of paragraph B-.he(l) above. In theory how-.
K( K

4L~
R~mmJ K( 2rT x dx
B-4f. Envelope stresses: The calculation of envelope stresses isdone according to the methods of Ref. I.
Ps + Pe a (No + NO R
where PT is the total pressure differential across the envelope and P$ and Peare coqnnts of PT in Whe • and e directions respectively.
B-5. Measurement Procedures
B-5a. Pressures
B- 1(1). Generals Sixty eight pressure taps were installed in theradome and tower for sensing local pressure during tests, The taps were fab-rioated of steel hypodermio tubing intalled carefully so as not to projectbeyond the local surface of radome or tower. Inside the radome the tubes wereconnectedto Cannon connectors by means of f lexible plastic tubing. Thus, itwas possible t toonnect and disconnect the pressure lines quickly during modelshangos. All pressure leads were checked for leaks and blockage$ all defectsin the syste were corrected Iefore the tst•.t Pressures were recorded byphatogftphin a backli&ted manoeter board.
~ ~ torty-ni resr taps were install-
od in the radomein elopeo Rach tap consisted of an .065 inch outside daU-wtez tube with an .0.3, inch inside diamster.• : The tubing was inserted intoa plastio button ihich was oeented to the indide surface of the radome.The pressure tape were installed on one side of the radome only, but effect-Ie47 covered tie area from top to bottom and front tv rear.
5-%a(3). Tower Presisress Eighteen pressure taps were installedon the tower. three on eah .of six faces fro& front to rear. The taps wereInstalled in the center of each face and spaced equally frqm top to bottom.The tub"e were oemnted in place in holes drilled in the wood..
3-•aO•). Pressure Inside Rnvelope: Air was supplied to the enve-lope fro a high pressure =e. A oontLnuous supply was required becausethere "a some leakage. Pressure Inside the envelope was controlled by aneedle valve in the line. A U-tube containing Wrrian unity oil (specificgravity of 1) was used to wamre the internal pressure. One side of theU-tub was oonnerted to the tannel stagnation pressure, the other side tothe imiida of the envelope.
B-'•o. Forces •
P-5Kb(i). Force moamu"r~mnnte were lade di.ring thn model tont' wi-th,tf-n rO JiMtfll#'d on tbp lift, mhtar and pedestal bnam. (I't. L• ). ViTher--i'ulh~yg st~raxn pnr et*na1nI rm, tm'orlr'd by an ~iorril;',trli n-rt cocl-

f44
.1 ýN4
QJ` <'-'
LILL
FI~c~OK
Li t ~v ~ F-r 'ý
V~C"

Isignal wires Oscillograpi1. Oscillograph
Amplifiers 14 chennal
soe Osciliator
Not*e power wires
T2 C20 . GC
(IT G
ai (1) A ll, siet~x a gagI e 1 trid ges to edi g ea ch am plif- ie. •u ni. are poweir ed
WSthe
ina
wiree.
(2) U hstrain ag e boaed to the easuring beams with Woo cement&M molitue proofed with petrosene wax.
() 1 wiring is shielded from the model to the oscillograph amplifier
*C -strain pp In eepression (normal lokding)
f strain Pae in teasion (nonal loading)
% strain sgae d~mmr
SMM4/TIC DIMAG!W OP WMRIN GAGE INSTALLATION
FIGURE 9.
-'4-

poied of a 211 channel Consolidated Engineering oscillograph and aocl-ated amplifiers and galvanometers. This basic system uses a 3KC ca'rre rand has an overall frequency response of 500 cps. Since the measuringequipmerwr was capable of high gain, the measuring beams were designed foroperation with low stresses. This was done to limit the amount of relativemotion between the tower and the radome and thus minimize the possibilityof model flutter. A two-active-arm strain gage bridge was used on eachmeasuring beam in a manner that would produce tension in one gage and com-pression in the other' when the beam was loaded. To prevent temperature ef-fects and "cross talk" the damny gages were mounted on the beam base tocomplete the bridge. "Petrosene" was applied over the completed assemblyto affix the small wires and provide moisture reslstance.
As an additional precaution against "cross-talk" and heterodyn-lUg or "beating' of the strain gage signals, the oscillators supplyingbridge voltage to the strain gages were synchronized together. In thiswqp all carrier voltages to and .from the bridges were in phase.
B-5b(2). Since it was necessary to support the pedestal platewith three beams for the measurement of pedestal reaction, a sunmationstrain gage circuit was required as shown in Fig. 9.
B-5b(3). The complete recording system was installed and pre-pared for use before the calibration was made. The model was installed inthe test area and a dead weight calibration 6f each load beam was performed.
0. DETAIL FACTUAL DATA
C-i. Nadel
0-2a(l). The envelope was fabricoted/from a two-ply, 4.50 biasoonstz-ctedp neoprene coated nylon ballonet material, weighing a total of6.60 ounces per square yard. It was obtained through the Airship Develop-unt -Deparbmun of the OoodyeAr Tire and Rubber Company, Akron, Ohio.
O-la(2). The envelope was fabricated of 24 gores, plus a five-Inch diateUr rown. 'A flat template was made for the gores, the templatebeing calculated to provide a sector of a 27-inch diameter sphere with aout-off at a base angle of 670 4O'. An overlap of 1/2 inch was allowed oneach oint., The gores were arrged *•th alternate right and left bias toavoid possible twist due to uneven tension in the plies. Goodyear type1822-0 Neoprene cement with Type 983 Accelerator was used to coeint thefabri•.
C-1b. Corstructiono Tower S.e Figs. 10 and 11): The towrowas 12 Imches higRiin- V:-eidod to sinnilate the A ,/FPS-aretic tower. Theiwvit teiwmr wom 25 inches across tho vertices. It wn! corintrunted of 1/2PrA 3/4 &nch fir plywood, gusmeted for rigidity. Two wedf-ni wore ninflarlyoo't-rIix' ted to provido for t•..lti, thn ,owor 15 and 30 dsr,-(,n to u1.•t,tOh effoet of a hiltop instAllation (Fi.gll). Attanhmrwnt of tbhf tc"-.r toUho wlp•mm 07 d to th.- tunnnl floor vnr mrnde by bolts , Thr 1ir+c.woi of t ht'
1, r h~dsor1i m hol o to r'rmi~t. a rfo!irn to i nnt 2imr'T1i. ~t~1

...... ....
MU 3I ¶0

Inn

A -Yi
MLOP7-. SYj: M

C-ic. Balance System: The balance system is shown in Fig. 1.2.The system was designed to indicate lift and shear forces at 12 evenlyspaced positions around the radome, thus simulating the load distributioninto the 12 columns of the fall-scale tower. Actually, forces were measuredon only one side of the radome because of physical and aerodynamic symmetry.Nevertheless, the dummy beams and supports were identical to those in the"live" side except for the ladc of strain gages. The entire system wasmounted on a 14 inch steel plate containing necessary cpenings for instru-mentation leads.
The forcep frim the envelope were introduced into the measuringbeams through a 12-sector ring at the base of the radome. The shearload on each 30-degree sector was measured by one beam. The lift beamswere located at the ends of the sectors so that each lift gage measuredpart of the load from each of the two sectors. Each lift beam was orientedto measure loads tangent to the surface of the radome. Although the forceand reaction were applied as close to the surface as possible, a small coupleactually existed. The effect of this couple was to increase the measuredlift. Slzce the error was sliht' and in the conservative direction, no cor-rection for it has been made in this report.
Each sector of the base ring was connected by a metal channel toa circular plate at the center of the radome. The plate was supported by ashaft but could move laterall so as to indicate horizontal forces on threebeagu. -These be a-leasured that part of the drag resulting from enveloped.istortbin, v•qh• s~ot measured 'by the shear gages. The lift was measured,by s~nbevs antthe shea. by six oth.c. The circuitry and instrumenta-tion associated with this system are described in para. B-.cb.
0-id. Pressure Tapes The pressure taps• are described in paragraphB-ga. . :,
0-21 Data - Comparison of Measured and Theoretical
C-2a. Genesrl, For design purposes there are a number of loadswh met be dot;1%00. These are,
Is Lift distribution2# Over-all litt3. Shear distribution4. Oyer-all drag
I. nvelope stresses
There are seiveral possible ways of arriving at these valnem forthe model# including both experimiental as well as theoretical considerations.The two experijmntal methods serve as a check on the accuracy of the test datasince th#V are directly oomparable. In the following paragraphn a dincutinsonof theso ssthads will be given along with a chart comparison of thi- varicisreul.ta. It will be noted that the experimental dnta gvIv gen'rn.ly h.•ghfr rlofdt than the theoretical clou]ationn. An e.iplastrd in mon.,rrnr~ph C--6, thr"in•r inr's i duq to the. differA.noe betxwnnn tho tia.l nnd acmtmm, TMA'e.mc' dOln--trIATitlonr which arn. shown in Fig. Ii.

77"
AAII~rW, r~~l44
4t Ii .
F.. ~Jl - ± 1 .
1,1N-V.V
41~
J9 .'' A

T ABLE I
Comp]rison of Measured and.Theoretical Data
MaxiamumLift Over-all Haximum Over-all Envelope
Distri- Lift Shear Drag StressesLoading butioon (lbs.) (Ibs./.) (Ibs.) (lbs.!i.)
Experimental, Fig.' 4 180 0.9 51.2" ebased on bal- 39.8ance system
Experimental, Fig. 6 186 52.1* 9.00based on prep- 40.5sure measure-ments
Based on Fig. 6 142 30 8.48classicalsphere Jýres-sure diet.
Based on - 128.5 1.0 54.e 8.48Radome 1.2 46.8
Ex htrapolated values based on full scale Reynolds'
number (See para. C-4).
,C-2b. Lift Distribution
O-2b(l). The ý&Ianoe system' measured forc's imposed by 30-degreesectors corresponding to column spacing in the AN/FPS-6 tower. These forcesthus represent a column loading imposed by the radome envelope loads. Inorder to compare the measured forces with theory, the theoretical load dis-tributionp based on the data of Mef. 1, was calculated. This method providesthe magnitudes of forces along latitudes and longitudes of the sphere, where-an the forces measured by tbe model balance were those along great circlespassing through the crown (top of vertical center line of the radome). Asindicated in paragraph B, it was recessary, therefore, to resolve No and Nointo the direction of XG and S. The equations and methods of calculationare discussed in paragraph B-ho of this report.
C-2b(2). Fig. 13 is a plot of theoretical No as a function ofthe azimtith angle 8. In order to obtain the theoretical loading of thestrain gapes the over-a4U contribution of thn various sectorn w-nn detenninr,,dby graphical integration using a planimfiter. The plinmtor wrs olt-.o u1sfdto dotormiinm thn centroid of the load areas. The load on each ) itt Ia•',',gth~n connIsted of cont.ributions from the two roctors on r'.ti i1e• of it.F.Irb nr'ctnr 3eIC' wpr apTorti1oiied anvorli n! to IUe ccrntrcl-d of Il~ :ieiinfl-

4- a4
j 7 ..7.1.~~L~~~I j.1 ,4O~4
.1., it.
"4-L~
4.~ Li 44I, L1
AL .- . .-"To 't~.L . - 4
-L+....i 4L ~ ~i ~A9
1~ 34L77 77'L..
7i r.1-..- .. - - 1*k :7AkT~- 77 *~~~.!~v.
1
¶ ~ W:p*r-7 7 -
T7.*
4*4

-7 7 .4.~-
r.. ....... ..
Is' 7~AS
T I.:.
i~ j77 ~MN{4--4-a4* 1; 6,4
* .e .. *-IT
mm ~ ~Vj 0!,
r.t.! 1---- if 7P .1
~t.-.44.I:Ii jf r;.
- .1. OoOF*~
I II..
-xi - ~ -~ t
IFI * '.9- -~ ~4-1
10 MA ESTt7 Ar? .A~ ~ ~ 2 ,L~ 271!z7-~ :~
-4.
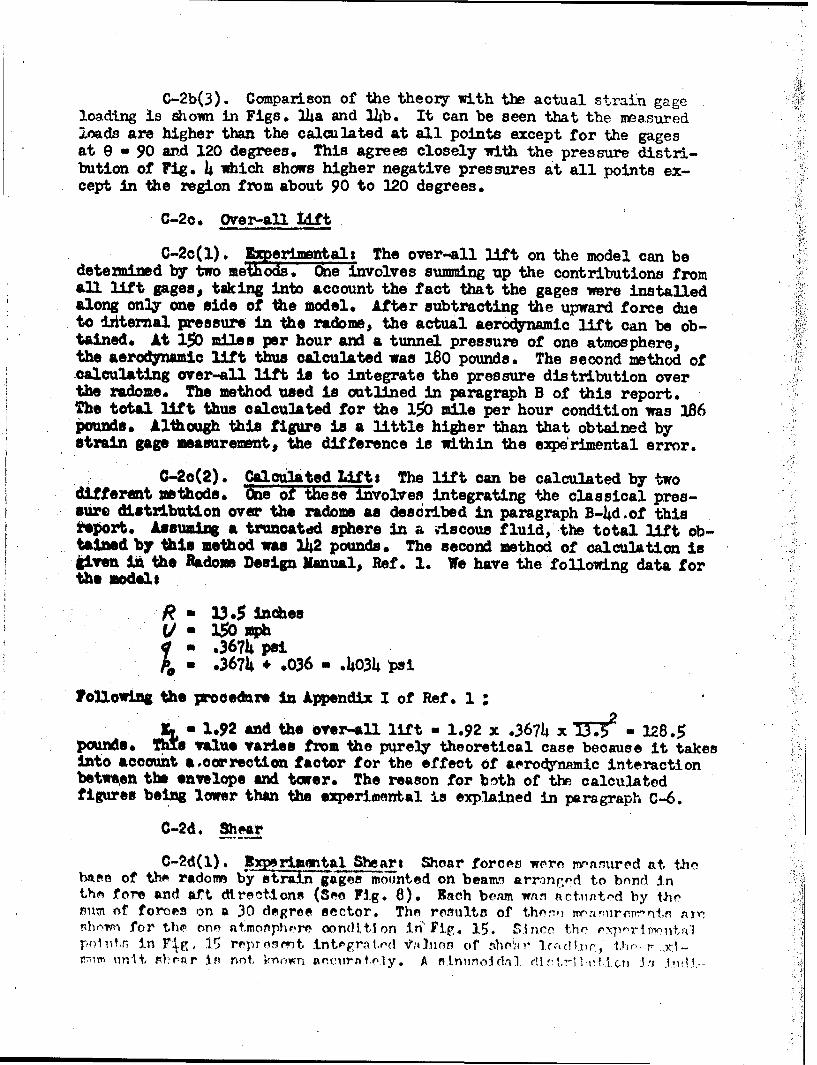
C-2b(3). Comparison of the theory with the actual strain gageloading is shown in Figs. 14a and 14b. It can be seen that the measuredloads are higher than the calculated at all points except for the gagesat e a 90 and 120 degrees. This agrees closely with the pressure distri-bution of Fig. 4 which shows higher negative pressures at all points ex-cept in the region from about 90 to 120 degrees.
C-2c. Over-all Lift
C-2c(l). !Uer ntals The over-all lift on the model can bedetermined by two methods. Oe involves summing up the contributions fromall lift gages, taking into account the fact that the gages were installedalong only one side of the model. After subtracting the upward force dueto ifternal pressure in the radome, the actual aerodynamic lift can be ob-tained. At 150 miles per hour and a tunnel pressure of one atmosphere,the aerodynamic lift thus calculated was 180 pounds. The second method ofcalculating over-all Lift is to integrate the pressure distribution overthe radome. The method used is outlined in paragraph B of this report.The total lift thus calculated for the 150 mile per hour condition was i86pounds. Although this figure is a little higher than that obtained bystrain gage measurement, the difference is within the experimental error.
C-2o(2). Calculated Lift: The lift can be calculated by twodifferent lnthods. Wne of these involves integrating the classical pres-sure distribution over the radome as described in paragraph B-4d.of thisreport. Assuml a truncatdd sphere in a ,ascous fluid, the total lift ob-tained by this method was 142 pounds. The second method of calculation istiven i1 the Radoi. Design Manual, Ref. 1. We have the following data forthe models
S 3.5 inchesLi. 1 mph
.36714 psio .3674 4 .036 = .4034 psi
Following the procedure in Appendix I of Ref. 1:
ZrA 1.92 and the over-all lift = 1.92 x .3674 x 1 =28.5pous. Thi value varies from the pure3y theoretical case because it takesInto account acorrection factor for the effect of aerodynamic interactionbetween the envelope and tower. The reason for both of the calculatedfigures being lower than the experimental is explained in paragraph C-6.
C-2d. Shear
C-2d(l). Exporimental Shear: Shear forces worn rrantured at thebaimo of tho. radomr b~yei-Riim-n-a mouiinted on beamn arrin~red to bond inthm fore and aft direndtons (Soo Fig. 8). Bach beim wnn Actint'-d by thesuin of foroee on a 30 degree sector. The results of the.f! naý;rerr.'ntn i.' n"nh~vn for tho ono atmoriphere oon(dtlon In" Fity Since th,pol ii.n in .... h, -o into ,gra trd rVo. uyi ofr-,'.P init P)t1r-fr Is not. 1•hwn ancurnt,f y. A ti.nlu iojda ch(1 ,.-d •t1.j - ,,1 1!'0.-

7. 7
A~ A-
_ X,~7Mt~bpb/Mrt 77
fat. I 01F-- 4- . J
-ft4 4 .
-4t
4 -+7 --- 7
II~.WO
w~+ypp _70Vy AI-5 v

-
-4
7 f
ý -IT
S, 1 I•! ... .
" I I .41,tl
1 " , ,..•.N4 . - - n ' :
.Lr. t| :
>..tj - V4 {•4'
7,
SAl
f4 +1. j ti
I T
1
LII4 V! rr.f
I 17AT PU ]. .. ,al. ois
Ii,.4 44 4 . ,

cated however, since the general 4Lstribution of the loading is quitesimilar to that of a sinusoidal distribution as can be seen in Fig. 16.In the region of maximum shear the distribution appears fairly flat.Therefore., it -would be reasonable to cý,4culate the approximate maximum shearload simply by dividing the faired value in Fig. 16 by the length of are.This gives a maximum shpar value of approximately 0.9 pounds per inch.
C-2d(2) Calculated Shear:, The shear can be calculated from theresolution of the forces Noand No as described in paragraph B-Iso. However,this calculation does not account for the redistribution of load in thefabric and base so that a misleading indication of the true shear its ob-tained by this nothod. The Radoume,Design Manual (Rlef. 1) recommends the.use of a sinusoidal shear distribution which seems: to indicate reasonablywell the general shape of the measured shear distribution. Comparisons be-tween the measured and calculated shear loadings is given in Fig. 16. The
~dmulm'unit, shear load predicted by this method can be calculated fromthes equation (according to Appendix Is Ref. 1).
S3 .18 KVq It/sin Athere is the corrected drag coefficient
t4 is the base angle
In the 3.50 mioo per hour test we obtained
Sa.318 x .7 Y.36714 z 13.5~/.925 1.2 pounds per Inch
It the wda~mo~ated drag coefficient (Fig. 19) is used
$m1.14 pounds per inch
0-20(4). Nmienas Two methods exist !or calculating thetotal drag ffcm wheind tunneil test data. 04s method is'to sum up allthe - earward compowto of the shear gage loads taking into account thefact that the gages were mounted on enly one side of the radome. If thetom measuared by a strain gage is called F, then the contribution of thegage to drag is 7 sin oC. , The total of all the rearward forces thus oilmiedfor the 150 miles per hours one atmosphere tests gives a total drag of 39.8pourds. fTb second method of calculating the drag is to sum up the rear-ward components of the prsessure forces. This method of calculatio~n in de-tailed irk paragraph B-.49, Figo 17 in a graph of the drag forces on a func-tion of fore and aft location. Integration of these forces by w'nnn or a4planimeter results in a drag of 4I0.5 pounds from the en~eerinwital pressuretdistribution %hich agrees closely with the strain gage romult.
0-2e2).Theoretioals The theoretical drag cnrn be calcul~tod. by-I¶nL'~At4.ng the forces resulting fnmm thn ilaamica1 prenimwro di!;tribui-donon~ d(%Ukilhd In paragraph B-lie. Th-,e result or this ca).ciu3.-Uon in a totA,.dTrz of 30 pcwrvir at 153 miiivn Pnr hour. This figure Is lor-rr tlhnn ti-, rx

It i-- 1. ~ ';;P~ -'*
71 7~
II
la.lI> I 77. '
*1 - - - -77-

perimental drag because the assumed pressure distribution is lower, asis discussed in paragraph C-6. Another calculation is recommended inthe Design Manual (Ref. 1). We have the equation
D =KD q R2
where KD is the drag coefficient. Appendix I of Ref. 1 recommends a valueof * -. 7 ihidh takes into account the interference between the tower andthe envelope. Calculating for the 150 miles per hour test
D 0 .7 x .3674 x'-. 2 - 46.8 pounds
This result is somewhat higher than the experimental drag. However, thetests show that the effect of increasing Reynolds' number is to increasethe drag coefficient (See para. C-4). If this increase is taken into ac-count a drag coefficient of about 0.81 is indicated. Then
D . 0.81 x .36714 x b79 - 54.2 pounds
C-2f. EnvelOpe Stresses
C-2f(1) !perimentalt In accordance with Ref. 1, the envelopestresses are divided into two perpendicular components, Nd and No, which 4can be considered as acting Llong lines -'nclogous to latitudes and longi-tudes on the earth. On the radome the longitudes all pass through thestagnation point which thus is analogous to the North Pole. No representsthe force per unit length along a longitudinal line while Ne representsthe latitudinal force. The region of maximum fabric loading occurs some-where in the region between the maximum dia:, iter and the point whero thenet drag force is zero (approximately c( - 60 degrees). The calculationis made by considering that N at any point must balance the sum of alldrag components plus the intXeýal pressure to that point. The sum of thedrag components is determined by integrating -the area under the drag dis-tribution curve, Fig. 17, from the stagnation point to the point under con-sideration. In these calculations, redistribution of drag load throughthe envelope to the base is neglected. This results in a slightly conser-.vative value for No. In determining values for design, the calculatedvalue of Nd (at the base) is corrected to include a term based on dragdistributitn (Ref. 1, Appendix I).
The following are the equations used:
whrro I, is the, fahrlc load due to intr-rnal pres m-re and iTn UI, the load
N0 ,r r P0 - r(PT -rP) ,(p

4 !!d , i 4 ' ' ' •
I,.... . _ . L.. .L . . 4J 4:..i ...:- • - -t- : 1 ......... I----' " " ......
- ---- . - 7.1- ,. -
"4! ' "1 **S:_,L•11. ........... ......
t
-. IT :, -.
4 . .,tIXr. ..... I.
* 1j, . . 4TI T .
4.,....
,I
-. 4.,- 4I
44 .4 4. .. . . ..1- 4 -
1 ~ f1 u,:
S.. ... .. . .'.
-t 4 4
4 4!I ! " ~
L I 4iI
S. . ..
.. . . .. . . .
-

PT is the total pressure difference across the radome surface at the pointin question as determined by subtracting the external from the internalpressure. The following table is a summary of the results for severalpoints in the region in question:
No* No
S60.7 2.91 8.03 Uncorrected for rcdis-75 3.85 9.00 tribution of drag.
90 h.40 8.51
It is apparent that the maximum fabric load ocmcrs at about the 75 degreeposition.
C-2f(2) Calculated: The maximum envelope stress can be calcu-lated by using the formula given in Appendix I of Ref. 1. The stress atthe base is given by
"Ne - (1.16q + .5P)R
= (1.16 x .3674 + .2017)13.5
w 8.48 pounds/inch
No m(193q + .5a )R + .635 KD qR
w (.193 x .3674 + .2017)1.3.5 + .685 x .7 x .3674 x 13.5
- 5.88 pounds/inch
It can be seen that the maiimm fabric stress as calculated from the e'.-perimental data is slightly higher than the calculated.
0-3. Effect of Terraini A likely choice for a radome installationmite would be ahiittTop-. n order to investigate the effect of such ter-rain on the radons aerodynamic forces, two wedges were fabricated. Thesewedges, which were 12-sided like the tower, tilted the tower back 15 and 30degrees respectively to simulate the effect of winds sweeping up a hill.The results of these tests on the lift gages are shown in Fig. 18. It canbe seen that no substantial change in loadirn, occurs with angle of tilt.The maximm loads ai shown by the gages at 60 and 90 degrees rhow a roduc-tion of load as the twer is tilted.
C-*.. Effect of t nolds' Numbor: Rnynblds' Inumber ts kfown to afffectthe point o-f-bo•-r-5-• layor transition. At very low Rynoldsl' nuornmrs ty:ho
mItYP- layrr itI laminar and s1pAratlon of flow occursi co:f to tho rnwixIn'nmHow-vrs, dl r tt. lk',w" r, whrn 9'iv, P?'.n ',nold1-i? n u r r I n a o'.- c r1i f, ,c:4 1,
/~~~ F. F-. . ..
I tI,
- , .. .. ....... .. . _. . . . . -'. .. ... + *-: !: i
......- . ... .<1_14.4# -, t#
J i ll'
,I -. . . . ..
_4 -.4 4 . +.: §. -.-.-
-.. . ... .I - 4 . ..
I- *-j-.... . . , .... tI4 .. 4 -.
I .o . . . -+ 4,. .• +, + .
II li i . -*. . ... .I ~ - t i I71,I , .......... _ _-' _
.- +..:_ -- + . . + -......- - -
• --- -+. " -+ - -_i: . 4---
- • .'--'--'L" •. + ..... .- - -- I4+'
S. . .. 4-".. t.. . ...
ft _ _ - -,-.,+--+S. ......... j
4'..• j p I.. . 4 p 1
- •.. . + _ + -.. . ... ...
S+ -+ , .... .. ....4- 4 - *.j.. 2: .. .. .2 + " : ....
S•.&. t + - -" - r
2 .' .. . .Lh .:.:L ... I +-++ - ""°
S. , 4 4 -
7r-
! |_7 7 .,"I'"--' ' . -- " - "
-, *-?, 44.., 4.
4I.• +•+. , 1 4 , 4 ,.+. -+.
SL L ,
+• . - .'J -. .. .. ' .: • .
- ..... . .... " •- _______
7++ ++ -. 4 - +. -, , -.. . , 4 ..
4 I. ... .. _
4 ... .- 4 , ... ,- - - - --'- - --- --. i
1 . . : , ., .4 , 4 4
-+. ... 2 ,, .. . ... . , • . ... l.
+- I 1 -| + •
4 - . I4, II
. . .. . . ++l ..... +.~ +. 4

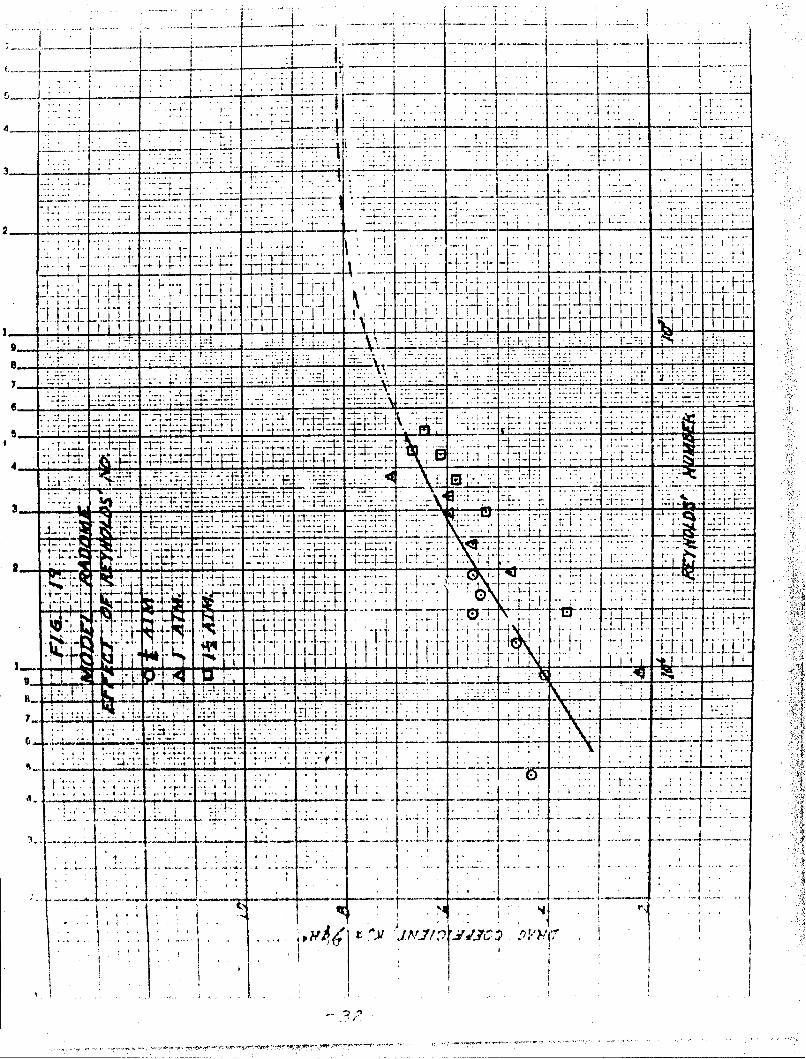
the boundary layer is turbulent and separation is delayed until the flow isw311 back along the sphere. Thus the wake and, therefore, the drag is re-duced. For a sphere, the critical Reynolds' number is in the range ofabout 220,000 to 280,000, (Ref. 2). The Reynolds' numbers of the tests re-ported herein ranged from about 500,000 to 5,000,000, which is well abovethe critical, although below the full scale value of over 100,000,000.
Early test results with the radome had indicated an upward trendin drag coefficient with Reynolds' number above critical. Therefore, higherdrag values than those measured were recommended in Ref. 1. In order to ob-tain further information on this point, the more recent wind tunnel testswere run at the widest possible range o? Reynolds' numbers. In Fig. 19, themeasured drag coefficient for the various wind tunnel tests with the towerlevel are plotted as a function of Reynolds' nutber. A definite upward trendappears in the data. A curve drawn through the data is extrapolated to aboutthe full scale radome Reynolds' number. The shape of this curve was chosento be roughly similar to the usual asymptotic shapes found in such curves.See, for example, Ref. 2. Unfortunately, there are no other data for suchlarge Reynolds' numbers so that the accuracy of the extrapolation cannot bechecked. In view of the scatter of the data, high accuracy is not claimedfor this curve, but the maximum vallie is believed to be conservative. Nolarge change in pressure distribution would be expected to occur at sich ahigh range of Reynolds' numbers because the effect of viscous forces wouldbe vanishingly small.
C-5. Effect of Internal Pressure: During the wind tunnel tests the in-ternal pressure of the radome was usually kept at one inch of water pressureabove stagnation pressure. In some of the tests, however, the internal pres-sure was varied over a range of plus or minus two inches of water from thestagnation pressure. No change in radome bx',avior was noted except for someflattening of the envelope in the stagnation region. Examination of thepressure data indicated a small change in pressure distribution, particularlyat the lowest Internal pressure. The change was email, however, so that thetolerance for internal pressure can be increased.
0-6. Wind Tunnel Blockage Correction: Because the maximum Mach numberof t1e test waa fairly low and the tunnel large compared to the model, windtunnel blockage corrections were expected to be small. The correction willbe calculated here by the method of Ref. 5, to show that such is the case.
The corrections to Mach number and dynamic pressures are as fol-
V - M" - C(l 0.2 M 2)
q q" El C(2 -UC2~j
pr

where s uncorrected Mach number
is uncorrected dynamic pressure
C is blockage correction factor
Ccw + Ck + Cwk
0w is the wing (tower) blockage correction - C KI7AV~I
0k is the body (sphere) blockage correction - 2 VA
Cwk is the wake blockage correction - .. "-----
The various terms of the corrections are defined below. For pur-poses of computation, the highest speed will be assumed so as to obtain themaxim= correction. The radome and tower will be assumed to approximate theshape of a prolate spheroid plus an elliptical wing, each having a thicknessratio of unity.
The terms in the equations are evaluated as follows: iJ
F _1-2 0 .964...
,where N. .27
X1 , shape factor for tower .̀ ,772
X3 * shape factor for sphere 1.329
W configuration factor for tower - .855
71 configuration factor for sphere .859
C 0 tunnel cross-sectional area a 96 ft.2
Vw volume of tower a .852 ft. 3
VB volume of sphere - .745 ft.3
CD drag coefficient - 0.25 (anmed)
S - model area 26.00 ft 2
~' b

Noff inserting these values into the equations
a .001~
Kb - .00101
Kw a .(oo433Wk
K - .00688
Substituting K into the corrections for M and q we get
= 1.007
2.1.0314Since the maximum co: rection is less than one per cent in Macl
number and less than 1-1/2 per cent in dynamic pressure, wind tunnel cor-rections have been neglected for these tests.
C-7. Discussion
C-7a. Gereral: The discussion and comments below are based pri- kmarl3y on the tept results at 150 mph anc& one atmosphere, since this wasthe ouly condition for which the test data were extensively analyzed. How-ever, exmmination of the unccrrected test data indicated relatively uniformcharacteristics and it is believed that the 15) mph. condition is repre-sentative of other test conditions. The test results are discussed in de-tail below. Design recommendations, based on the results of these tests,are given in Part II.
O-7b. Pressure Distribution: Of major interest is the differencein the pressure dis bution over the-surface of the radome. It is evidentfrom the results of these tests that the tower base he~s a greater influenceon tS ±irflow over the radome than indicated by Ref. 1. Whereas it wasoriginally expected that the influence on the airflow would be limited tothe lower part of the radome, these tests show the influence to extend overthe entire surface. The maximum negative pressures are higher than thosepredicted by potential flow around a sphere and peak pressures occur approxi-mately 75 degrees aft of the stagnation point rather than 90 degrees. Also,the pressures on the lower part o the radome, where the influence of air-flow around the base would be expected to be greatest, are lower. rnthnrthan higher, as Originally estimated. Although these changes are relativelysmall they have a significant influence on the overall lift, drag and, en-pecially on the distribution of load and stress in the envelope. These con-ditions are discussed in detail below,
C-7o. Lifts Lift load& were caleulated unirw, both ntrain rg,vwbj#,ti and prens'xre tap results obtained during tests. Oood ofrrcenmnt wvaobt-Jnod betwoen ttiv two methods for brthi the total lift sand for disrt,rnlu-ti ln nf lift lmo(i. Both the mrxliyrn arnd thfr total Jft ):uh rcd tl b'f"2" to 30 Tvr',n , hli her thnn tharino •ar~llbintd I i nt' t)h, c],'I "o;,i

distribution around a sphere (see Table I, page 21). The difference betweenthe measured total lift and that calculated by the method recommended in Ref.1 is even greater. The reason for this is that the Manual recommends a cor-rection to account for higher negative pressure distribution over the bottompart of the envelope, whereas the wind tunnel test indicated lower values.The higher values shown in these tests appear to be reasonable and should beused 4s a basis for future designs.
C-7d. Drag; Similarly, the measurements of drag by pressuretaps and strain gages showed good agreement and are about one-third higherthan the drag predicted by the classical pressure distribution. However,the measured drag values are approximately 15 percent less than those basedon the Manual (Ref. 1), as a correction had been included to account foradded drag due to tower interference.
Even higher drag loads are predicted for the full scale radomebased on the apparent increase in drag coefficient with Reynolds' number.This investigation is discussed more fully in p&ragraph C-4, but extrapo-lation of the test data indicates a drag coefficient of 0.81 as comparedto .7., if based on Ref. 1. This 16 percent increase in drag load is prob-ably conservative but, as this increase in drag coefficient at higherReynolds' number is indicated by test, it is recommended that higher dragvalues be used in the design of large radomes.
C-7e. Shears Ref. 1 Manual recommends that drag loads be trans-ferred to the base as shear, using a siru -idal distribution of shear loadwith the maximum value occurring at the 90 degree point. A sinusoidalshear distribution, using the total drag load based on classical pressuredistribution over a sphere, is shown on Fig. 16. Shears measured on the30 degree segments during wind tunnel tests closely approximate the sinus-oidal distribution previously assumed, but %re somewhat higher due to thehigher drag loads* The exact distribution of shear load cannot be readilymeasured but, because of the close agreement indicated in Fig. 16, use ofa sinusoldal distribution is recommended.
C-7f. Envelope Stresss The calculations based on wind tunneltest results i ute apprximatelty a 6 percent increase in the maximumenvelope stress I@ over values calculated as recommended in the Manual,Ref. 1. Hemwver, because of the generally higher negative pressures actingon the surface of the radome and the higher drag loads, the calculatedmaximum ralue of Nd Is approximtely 12 percent higher than the value asdetermined by the Manual.
It is interesting to note that the value of N9 (repre.nerting thelift component of load) increased only 6 percent, while t1hý total lift loadincreasied approximately 45$ percent. T'iis differenne is dun to the chang:ein preoire digtrihution which indicated that the peak loads ar• spread outover a aich larger part of the radomm, ranulting in hfgher total. IM&dI witha reýlatively swall increase in peak valne,. Althouh the No in incracind bya lurgo percertage, this value it not critical for dsnijgn. 'Thn r.'rilltintfferAt of the chue in pi'nirur di• tri• ijtInrn on env1lopo rtrr':ir,, In Vif
r~~rn "i

C-7g. Effect of Terrain: The effect of installing the radomeon a hilltop is to increase certain stresses in the envelope and attach-ment. However, the effect is small and does not apply to the maximumloads. Therefore, it is believed that this factor can be neglected indesign.
S- C-7h. Effect of Reynolds' Number: Test results indicate a de-finite increase in drag coefficient at higher Reynolds' number. Althoughit is believed that the values obtained by extrapolating the test dataare conservative, the higher values should be used in calculating maximumdrag loads for large radomes.

P A R T II
HECOMMENDATICNS
A. AeroqEnaic Loading of Radome
The pressure distribution determined in the wind tunnel testscarried out on this program is believed to represent more accurately theaerodynamic loading of a radome-'ower unit similar to the AN/FPS-6 in-stallation than the theoretical distribution given in Ref. 1 Manual.Therefore, it is recommended that the design loads for both the radomeand tower be based on this new distribution. It is beyond the scope ofthis program to make corrections to the Manual to account fully for theinfluence of the modified pressure distribution on the radome and towerloads. It is ref-ommended that a revised Radome Design Manual be issuedto incorporate these modifications. However, in order to provide an in-terim basis for design of new equipment, correction factors are recom-mended herein.
S. Tower Loading
The tower loading from the radome results from both the aero-dynamic loading on the radome envelope and the radome inflation pressure.The distribution of these loads depends primarily on the tower platformdesign. For example, if the tower platform is supported entirely fromthe outer columns of the tower, the platform loading due to dead weightand inflation pressure would be reacted at the sides of the platform Andthe resultant of aerodynamic and pressure loads on the columns would bereduced. On the other hand, with a platform design such as that employedon the FPS-6, which uses interior supporting" columns in addition to theexterior columns, the majority of the dead weight and pressure loadingmy be supported br the interior columns and the re~miltant loading on theexterior columns would be increased. As the Ptructural design of thetowers varies widely between the different installations, no attempt hasbeen made to suggest a detailed loading schedule. However, in order toprovide data that will be helpful to the design engineer, maximum designload values are recommended and methods of applying these loads to thestructure are suggested.
Another point of interest in the design of radome towers isthat the peAk lift and drag (shear) forces occur simultaneously in thesame general area (75 to 90 degrees from stagnation point). Hownver,as the stagnation point shifts with the wind and may occur at any pointaround the radome, the tower structure munt be derigned to support thesepeAk loads with winds from any direction.
P-I. Lift LCdU ,
.-I-•. Th.p totnl lift, i (iote'n mioued fromn witnr t-i nt-' 1 1vo d: w:tn11
4!

Raf. 1 Manual. It is recommended that, in calculating the loading for aradome of new design in accordance with the methods outlined in the Maua.al,values of KL, given in Fig. 19, be increased by a factor of 1.45.
B-lb. The total lift load thus determined will be appreciablyhigher than that previously recommended. However, this value cannot beused directly in design as the distribution of load is not uniform aroundthe periphery of the tower. The important design value is the maximum columnloading. Based on the values determined with the balance system (Figs. 14aand 14b), it is recommended that each column be designed to support a loadequal to 25 percent of the maximum lift load as calculated above. For de-sign purposes, this load can be considered uniformly distributed over the30 degree segment between columns or as a concentrated load for the designof the columns and their attachment to the platform.
B-2. Drag Loads (Shear):
B-2a. In order to account for the indicated increase in drag co-efficient at higher Reynolds' number, it is recommended that, in calculatingtotal drag load for new radar tower designs, the value of KD (Ref. l, Fig.24) be increased by a factor of 1.16.
B-2b. Drag load is transferred into the tower as shear. Maximumshear values wil.l, therefore, increase directly with the value of KD (above).MaWdzmw shear values at the base may therefore be calculated as recommendedin Appendix I, Ref. 1, using the corrected value of %. The sinusoidal dis-tribution of shear load recommended in Re.2. I is believed to be representa-tive of actual loading conditions.
B-2c. Because of the shear resistance of the tower platform, peakshear loads at the radome attachment can generally be considered to be dis-tributed by the tower platform floor plates ý',%d reacted by the exteriorcolumn shear bracing or side panels in proportion to the relative stiffnessof these members. (lf interior column shear bracing is used, these memberswill also help oariy drag load to the base of tower). This redistributionof load should be taken into account in designLng the tower structure.Based on a sinusoidal distribution, it is recommended that the tower piat-form be designed so that a 30 degree segment of the tower structure cansupport approximately 15 percent of the total shear load.
B-2d. As the overturning moment at the tower platform is a di-rect function of the drag load, for design purposes the values of Km(Rnf. I, Fig. 19) should also be increased by a factor of 1.16.
Note,Whe-se values must be corrected by the reaction to dendweight and inflation prosmire developed at thn outeroolhmns. This reaction will dnpond on the trwer dnerd1.,nan ditnmcusd in paragraph B, Part I.

B-3. Radome Attachment Loads
B-3a. As peak lift and shear loads occur simultaneously and atapproximately the same point, the radome attachment must be designed towithstand these peak loads. The maximum vertical fabric load (pounds perinch - tangential to surface of envelope) is given by Ne at the base (seePara. C, Part II).
B-3b. The peak shear value S is calculated as recommended inAppendix I, Ref. 1, using modified values of KD (see Para. B-2a, Part II).
B-3c. The tower platform must be designed locally to resist
and redistribute these peak attachment loads.
I C. Envelope Stresses
Wind tunnel tests indicate a peak stress (N ) only 6% higher thso'that calculated, as recommended in the Manual (Ref. i•, However, high strO,occurs over a wider area of the radome. Peak longitudinal loads increase '
a larger percentage but are not critical for design. It is therefore reco01Omended that, for new designs, the maximum fabric load N , calculated as re-
I commended in the Manual (Ref. 1), be increased by a factor of 1.06. As tkb.Ochange is small, and as the Manual recommends a minimum factor of safety of/
three (3), no change is recommended in the material specification for radoOylnow in production, unless service experience indicates that a higher strengl ,
material is required*
D. Rquired Inflation Pressure
Wind tunnel tests indicate that inflation pressure is not criticalwith regard to pressure distribution ',r stability (for radome-tower configulrations similar to the AN/FPS-6, using a two-ply, 45 degree bias constructedradome envelope). In order to keep envelope stresses to a minimum, it istherefore recommended that a minimum inflation pressure equal to "q" be usedas a basis for ciesign of the pressurizu~tion equipment,, and that the maximumpressure be kept as low as possible. These values will permit a pressurevariation of at least two inches of water, due to operational tolerances,without adversely affecting the stability of the radomes.
1. Effect of Terrain
As critical envelope stresses and tower loads are not increasedvihen airflow is directed up over thn radome at angles up to 30 drgrc• i(simulating hilltop locations), this condition need not be considered in
the demign of thA radome or tower.
$1!:i