rm plcrm plcpshop.rm.com/.../downloads/rm_interim_results_announcement_may_… · rm plcrm plcp six...
TRANSCRIPT

RM plcRM plcpSix months to 31 March 2010
Terry Sweeney Chief ExecutiveIain McIntosh CFO

Agendag
HeadlinesStrategygyFinancial reviewOperating review
Learning TechnologiesLearning TechnologiesEducation ResourcesAssessment and Data Services
Looking aheadoo g a eadQuestions
2

HeadlinesC ti i t t t tContinuing to execute our strategy
Good resultsG 10%Group revenue up 10%
Strong growth Ed i REducation ResourcesAssessment and Data ServicesLearning Technologies – BSF (Building Schools for the Future) and US
Excellent contract win rateCommitted revenues at May 2010: £505m (May 2009: £425m)Seven new BSF contracts year-to-date
Investment in business developmentRM US – sales teamEducation Resources – people, facilities
Dividend per share up 5%
3
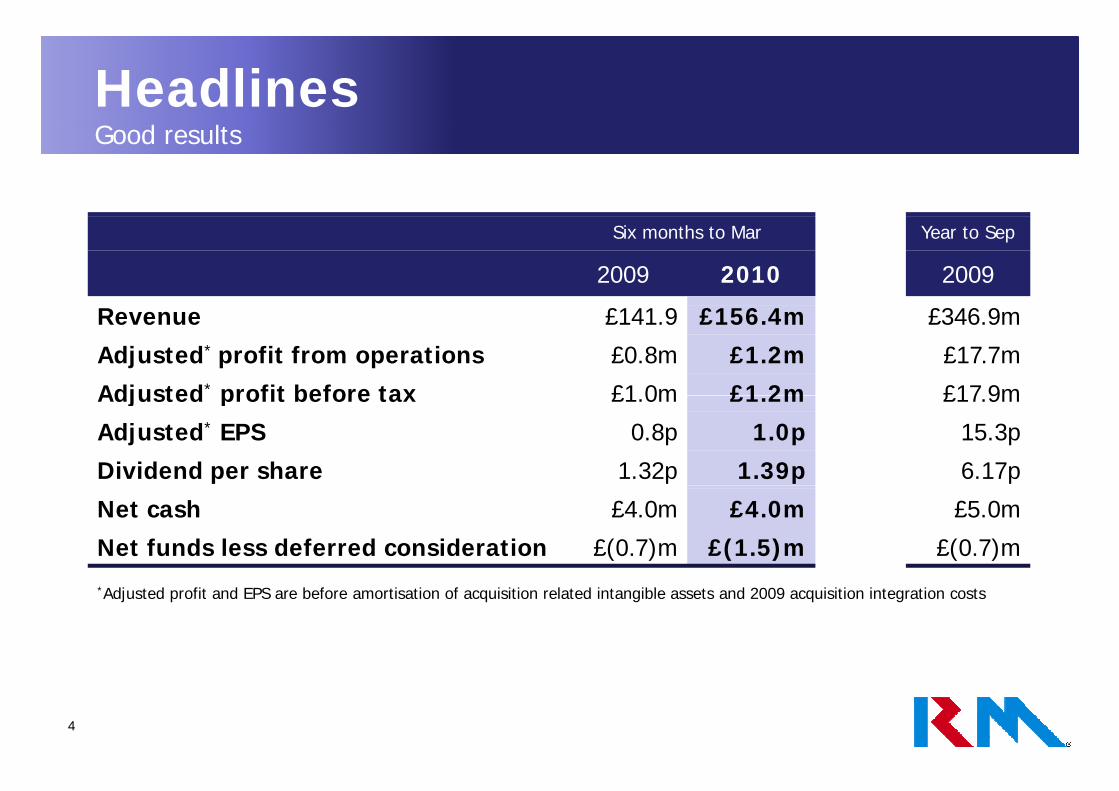
HeadlinesG d ltGood results
Six months to Mar Year to Sep
2009 2010 2009
Revenue £141.9 £156.4m £346.9m
Adjusted* profit from operations £0.8m £1.2m £17.7m
Adjusted* profit before tax £1 0m £1 2m £17 9mAdjusted profit before tax £1.0m £1.2m £17.9m
Adjusted* EPS 0.8p 1.0p 15.3p
Dividend per share 1.32p 1.39p 6.17p
Net cash £4.0m £4.0m £5.0m
Net funds less deferred consideration £(0.7)m £(1.5)m £(0.7)m
*Adjusted profit and EPS are before amortisation of acquisition related intangible assets and 2009 acquisition integration costs
4

Our strategyAdd i th l b l d f d ti d t d iAddressing the global need for education products and services
Assessment PlatformsProcess management and outsourcing forProcess management and outsourcing for testing and qualifications.Data analysis and dissemination services for teachers, parents and policy makers.
Further build on leading UK position
LearningAssessment d
g pGrow in US
Expand UK market Learning Technologiesand Data
Services
21st Century Learning Spaces Technology products and services – including
Establish international business
Education
Technology products and services including managed services, interactive classroom equipment, learning platforms, computer systems, connectivity and support.
Education Resources
Classroom ResourcesCurriculum-focused products – including teaching equipment & materials, furniture
5
g q p ,and software.
Grow UK market penetrationGrow internationally through channel partners

Revenue by territoryI i i t ti lIncreasing international revenue
8%
3% 2%
87%99%
UKUSEurope
f ld
H1-2010£156m
H1-2006£114m
Rest of World
6
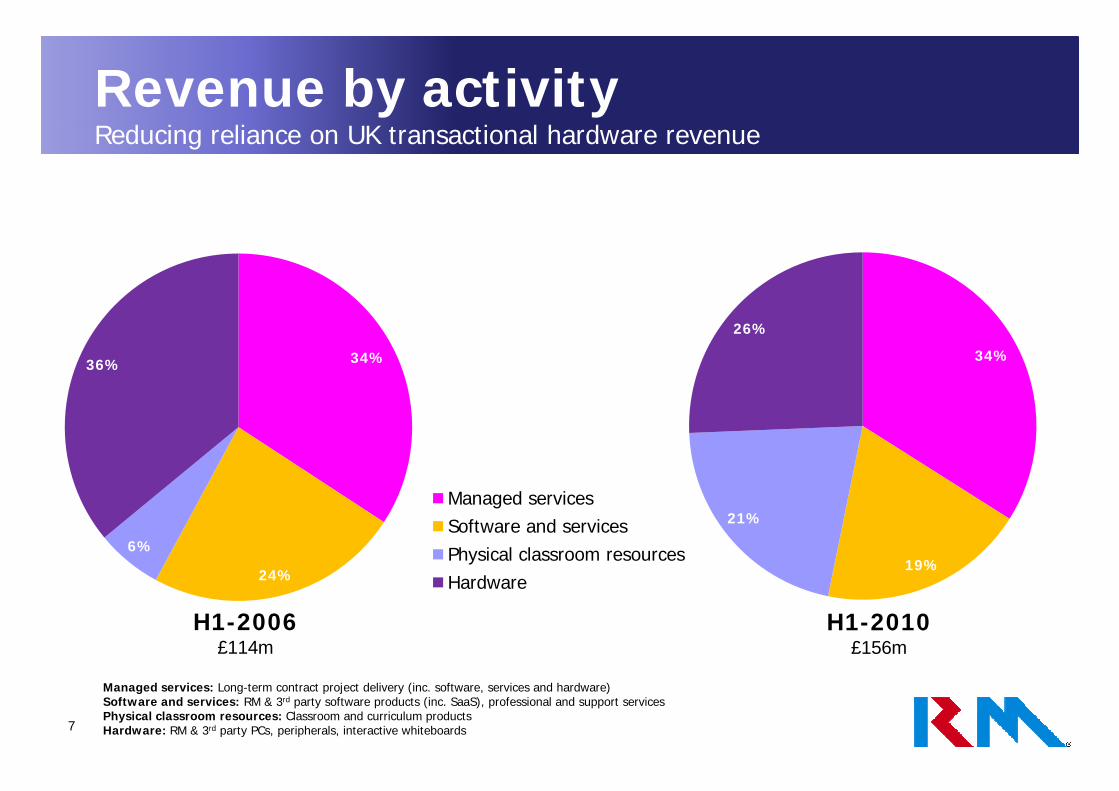
Revenue by activityR d i li UK t ti l h dReducing reliance on UK transactional hardware revenue
34%
26%
34%36%
19%
21%
24%
6%
Managed servicesSoftware and servicesPhysical classroom resources
d
H1-2010£156m
24%
H1-2006£114m
Hardware
7
Managed services: Long-term contract project delivery (inc. software, services and hardware)Software and services: RM & 3rd party software products (inc. SaaS), professional and support servicesPhysical classroom resources: Classroom and curriculum productsHardware: RM & 3rd party PCs, peripherals, interactive whiteboards

Financial review
Iain McIntosh CFO

Group revenue and profitp pAssessment and Data Services
Education Resources*£156 4m
38.3
7.9
10.3
Learning Technologies*
+45%+11%
+30%
£17.7m£117.7m
£141.9m£156.4m
+21%
+10% First half profitability is not a good indicator of full-year outcome
25.0
26.57.1
+45%
£14.6m+6%
85.6
107.5 107.8
H1FY
+26% +0%
-£0.5m£0.8m £1.2m
H1-2008 H1-2009 H1-2010
Revenue
2008 2009 2010
Adjusted operating profit
9
*H1-2008 and H1-2009 restated with US operations included in Learning Technologiesreflecting FY-2009 full-year treatment

Revenue visibilityy
Education projects won since period end
115
> 2 years1 - 2 years< 1 year
£380m
£425m
£505m
7 5%
80 72
145
144117£300m
£380m5.4%
7.5%
144201 201
91
Learning Technologies
Ed ti R
H1-2007 H1-2008 H1-2009 H1-2010
87.1%Education Resources
Assessment and Data Services
Committed revenue Committed revenue by division£390m at March 2010
10
Committed revenue: order book; deferred income; contracts at preferred bidder, selected bidder, or equivalent

Customer loyaltyy y
66% of Learning Technologies (UK) transactional revenue comes from customers who purchased in every one of the last five years
45% of TTS customers purchased in every one of the last five years
every one of the last five years
66%
7% 7% 9% 11% 15% 12% 12% 16%
45%
One Two Three Four Five
Learning Technologies (UK)FY 2009 t ti l
One Two Three Four Five
TTSFY 2009 t
11
FY-2009 transactional revenueby how many of last five years customer has purchased from RM
FY-2009 customersby how many of last five years customer has purchased from TTS
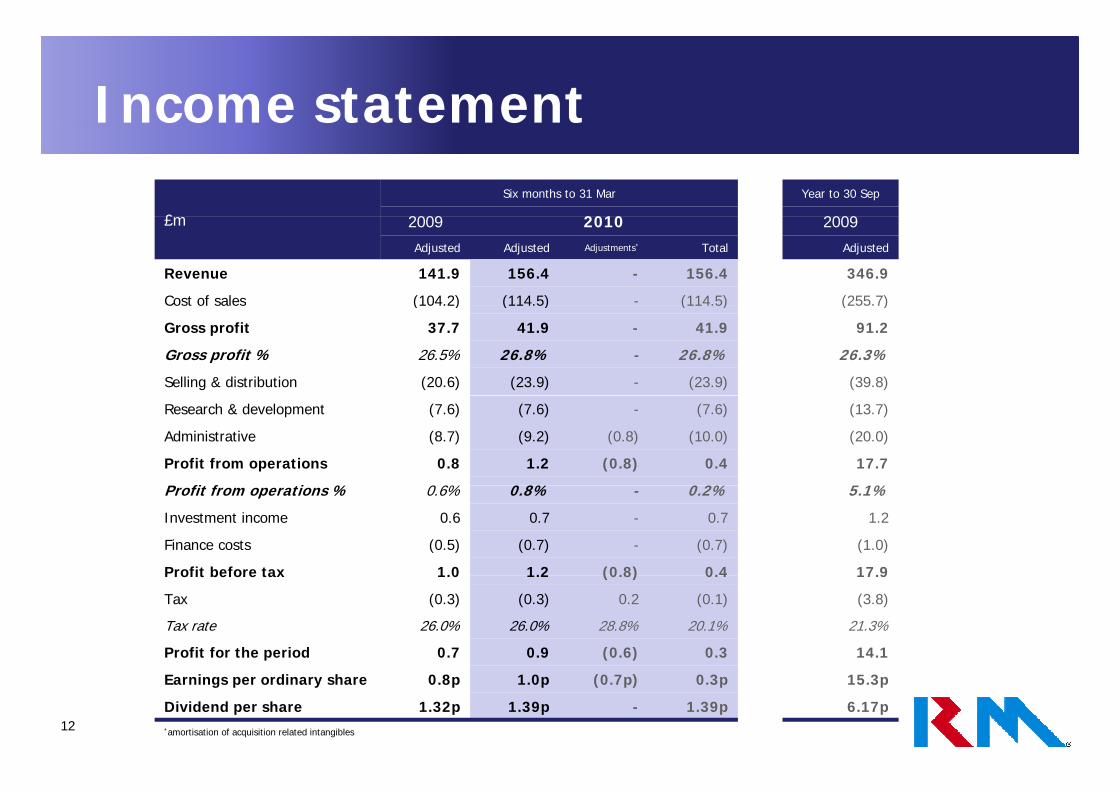
Income statement
£
Six months to 31 Mar Year to 30 Sep
2009 2010 2009£m 2009 2010 2009Adjusted Adjusted Adjustments* Total Adjusted
Revenue 141.9 156.4 - 156.4 346.9
Cost of sales (104.2) (114.5) - (114.5) (255.7)Cos o sa es ( 0 ) ( 5) ( 5) ( 55 )
Gross profit 37.7 41.9 - 41.9 91.2
Gross profit % 26.5% 26.8% - 26.8% 26.3%
Selling & distribution (20.6) (23.9) - (23.9) (39.8)
Research & development (7.6) (7.6) - (7.6) (13.7)
Administrative (8.7) (9.2) (0.8) (10.0) (20.0)
Profit from operations 0.8 1.2 (0.8) 0.4 17.7
P fit f ti % 0 6% 0 8% 0 2% 5 1%Profit from operations % 0.6% 0.8% - 0.2% 5.1%
Investment income 0.6 0.7 - 0.7 1.2
Finance costs (0.5) (0.7) - (0.7) (1.0)
Profit before tax 1.0 1.2 (0.8) 0.4 17.9Profit before tax 1.0 1.2 (0.8) 0.4 17.9
Tax (0.3) (0.3) 0.2 (0.1) (3.8)
Tax rate 26.0% 26.0% 28.8% 20.1% 21.3%
Profit for the period 0.7 0.9 (0.6) 0.3 14.1
12
Earnings per ordinary share 0.8p 1.0p (0.7p) 0.3p 15.3p
Dividend per share 1.32p 1.39p - 1.39p 6.17p*amortisation of acquisition related intangibles

Cash flow
Cash flow£m
H1-2009 H1-2010
Profit from operations 0 1 0 4Profit from operations 0.1 0.4
Amortisation 1.2 1.4
Depreciation 4.5 3.9
Share-based payments 0.2 0.5
Other adjustments (0.1) (0.6)
Operating cash flows before movements in working capital 5.9 5.6
(Increase)/decrease in inventories 2.0 (2.0)
Decrease in receivables 13.1 15.0
Decrease in payables (18.1) (7.3)
Cash generated by operations 2.9 11.3
13

Balance sheetBalance sheet£m
31 Mar2009
31 Mar2010
30 Sep2009
Bank facilities
Goodwill and acquisition intangibles 36.8 38.5 38.8
Property, plant & equipment and software intangibles 22.8 23.7 23.9
Interest in associates 1 0 1 0 1 0£25m facility with HSBC committed to July 2013
£8.6m drawn at period-endProvides flexibility and finance for acquisitions
Annual working capital facilities
Interest in associates 1.0 1.0 1.0
Deferred tax assets 3.6 6.6 5.2
Total non current assets 64.2 69.8 68.9
Inventories 18.4 21.9 19.9£38m and agreed for FY-2010
Trade & other receivables 59.6 71.6 86.2
Tax asset 0.8 0.2 -
Cash & cash equivalents 12.0 12.7 13.3
Defined benefit pension scheme
Total current assets 90.8 106.4 119.4
Total assets 155.0 176.2 188.3
Current liabilities (76.8) (91.6) (98.1)Defined benefit pension scheme deficitIncrease primarily due to market-derived inflation assumptions
Retirement benefit obligation (8.3) (15.7) (12.8)
Other non current liabilities (17.1) (14.2) (16.6)
Total liabilities (102.2) (121.5) (127.5)
Net assets 52 8 54 7 60 8
14
Net assets 52.8 54.7 60.8
Total equity 52.8 54.7 60.8

Operating review
Terry Sweeney Chief ExecutiveIain McIntosh CFO

RM Learning TechnologiesU d tUpdate
UKE ll t j t i t
UK – Contract wins in H1-2010
Customer Activity Term Value Award DateExcellent project win rate
Three BSF projects (plus four since period end)Progress in Academies / One-School PathfindersLong-term contract extensions
Date
Hull BSF 5-year £16m (term) Nov 2009
Essex BSF 5-year £8m (term) Feb 2010
Somerset BSF 5-year £8m (term) Feb 2010
H i F d ti A d i 3 £5 (FY 2010) F b 2010Long term contract extensions
Innovative productsCC4 Anywhere (remote network access)Three million learning platform users
Harris Federation Academies 3-year £5m (FY-2010) Feb 2010
UK – Contract wins since period end
Customer Activity Term Value Award Date
B df d Ph 3 BSF 5 £13 (t ) A 2010g p
Continued successful operational delivery
USA
Bradford Phase 3 BSF 5-year £13m (term) Apr 2010
Ealing BSF 5-year £39m (term) Apr 2010
Stoke BSF 6.5-year £33m (term) May 2010
Camden BSF 6-year £28m (term) May 2010USARevenue growth:
+30% (year-on-year)+26% (organic at constant currency)
UK – Contract extensions in H1-2010
Customer Activity Term Value Award Date
Glow Learning platform 2-year £10m (term) Oct 2009( g y)
Middle EastAbu Dhabi office established
SWGfL Web services 8-year £10m (pa) Mar 2010
Abu Dhabi office established
16

Learning TechnologiesP fPerformance
First half profitability is not a good indicator of full-year outcome
2.0
11.8 14.21.0
8.7 11.3
£85.6m
£107.5m £107.8m+26%
+0%
+30%
+20%
£6 0m
£8.0mH1
FY82.6 87.0 82.3-5%+5%
-£4.0m -£1.3m -£0.9m
£6.0m82.6 82.35%+5%
2008 2009 2010
Adjusted operating profit
H1-2008 H1-2009 H1-2010
Revenue*USBSFUK and RoW
17
*H1-2008 and H1-2009 restated with US operations included in Learning Technologiesreflecting FY-2009 full-year treatment

Learning TechnologiesBSF (B ildi S h l f th F t )BSF (Building Schools for the Future)
Underpinning medium-term growthBSF Contracted Future
Selected ICT supplier to 19 local authorities (out of 47 awarded)
BSF Contracted phasesSchools opening in year
Authority
FY06
FY07
FY08
FY09
FY10
FY11
FY12
FY13
FY14
FY15
Tota
l
£m
Scho
ols
£m
Total value: £364mTotal number of schools: 20144 schools to be delivered in H2-2010
Solihull 1 - 1 3 - - - - - - 5 8 - -Stoke - 1 1 - - - - - - - 2 5 - -Knowsley - - - 5 2 - - - - - 7 18 - -Lambeth - 1 1 9 - - - - - - 11 11 - -Leeds - - 7 2 5 1 5 - - - 20 31 - -Hackney - - - 2 1 - - - - - 3 7 6 9
vs. 23 in H2-2009
BSF programme still moving rapidly
Islington - - - 1 3 - - - - - 4 6 4 5Sunderland - - - 6 2 - - - - - 8 16 11 22Middlesbrough - - - - 4 3 1 - - - 8 10 - -Newham - - - - 4 6 3 - 1 2 16 53 - -Haringey - - - - 11 1 - - - - 12 25 - -Southwark - - - - 1 1 2 7 3 - 14 4 - -p g g p y
Currently working on 13 bids (pre-PB)Further decisions anticipated in H2-2010
Salford and Wigan - - - - 15 - - - - - 15 25 18 36Hull - - - - 1 7 1 - - - 9 16 14 21Essex - - - - - 1 3 - - - 4 8 24 39Somerset* - - - - - - 6 4 - - 10 8 - -
at 31 March 2010 1 2 10 28 49 20 21 11 4 2 148 251 77 132
On track for small positive contribution from BSF in FY-2010
Bradford* - - - - - 4 2 - - - 6 13 14 39Ealing* - - - - - - 5 3 6 2 16 39 - -Stoke* - - - - - - 4 9 4 - 17 33 - -Camden* - - - - - 11 2 0 1 14 28 - -
Total 1 2 10 28 49 24 43 25 14 5 201 364 91 171
18
*Preferred bidder (PB)Since period end

Education ResourcesU d tUpdate
Strong revenue growth in a flat marketO i 33%Organic: +33%
Excellent performance in TTS
Acquisitions: +12%Isis Concepts and Pisces ArtIsis Concepts and Pisces Art
UK curriculum software business stabilised
First half profit reflects:Planned investment in capacity to support further growth
Average H1 headcount up 41% on last year (19% from acquisitions)Strengthened leadership teamIncreased sales and marketing spend: £2.0m (£1.0m from acquisitions)
Property rationalisation one off cost: £0 2mProperty rationalisation – one-off cost: £0.2mFrom 13 warehouses to 8Pisces integrated into TTS operations
19

Education ResourcesP fPerformance
£38.3m
£25.0m£26.5m
£38.3m
+6%
+45%First half profitability is not a good indicator of full-year outcome
£6.4m£7.1m H1
FY
£3.1m
£1.6m£0.9m
H1-2008 H1-2009 H1-2010
Revenue*
2008 2009 2010
Adjusted operating profit
20
*H1-2008 and H1-2009 restated with US operations included in Learning Technologiesreflecting FY-2009 full-year treatment

Education ResourcesG th d iGrowth drivers
Further market penetrationE h d d tEnhanced product rangeEarly years and pre-school growthNew catalogue areas – furniture, arts and craftsCh l d l di li i i l dChannel development – direct, online, international, trade
EMEA
Curriculum softwareCreating internationally-exploitable IPEasiteach Next Generation
321424
510 572
AsiaAmericas
946
1,1701,352
1,433
Interactive whole-class teaching software toolOEM deals signed with Panasonic (Europe), Epson (US), Easisoft (Europe)
451 503 515 454
174243 327 407
321
2010 2011 2012 2013
Whiteboard Volumes (‘000)Source: Futuresource Consulting
21

Education ResourcesLEGO Ed ti ELEGO Education Europe
Letter of intent signed to create joint venture with LEGO51% LEGO 49% RM51% LEGO; 49% RM
Focus on growing LEGO Education product sales in EuropeDistribution of LEGO Education products through channel partnersDevelopment of online LEGO Education communityIncreased education value through support materials and specialist backup
European education distribution rights for LEGO for ten years86% of UK teachers agree that LEGO Education products have curriculum relevance*86% of UK teachers agree that LEGO Education products have curriculum relevance
22
*source: RM research

Assessment and Data ServicesU d tUpdate
Revenue growthACCA kiACCA on-screen markingInitial activity for International Baccalaureate
Contract winsGood period for contract winsOn-screen marking relationships with two new strategic partners
QCDA (Qualifications and Curriculum Development Agency)
Contract wins
Customer Activity Term Award Date
IB On-screen marking 5-year Jan 2010
International Baccalaureate
Data analysis contract with TSAQCDA On-screen
marking 5-year Feb 2010
TSA Data Analysis 4-year Dec 2010
International activityPilot activity in Slovenia and Poland
23

Assessment and Data ServicesP fPerformance
£10.3m+30%
First half profitability is not a good indicator of full-year outcome
£7.1m£7.9m+11%
£2.1m
£2.6m H1
FY
£0.5m £0.6m
£1.2m
H1-2008 H1-2009 H1-2010
Revenue
2008 2009 2010
Adjusted operating profit
24

Assessment and Data ServicesG th d iGrowth drivers
Strategic partnersSt i d l b l t t i t bStrong, growing and global strategic customer base
Examination boards, other qualification providers, government agencies
Market expansionAssessment
c.50% of UK schools scripts marked on lineh lMove to on-screen testing in schools
Non-schools qualifications providers
DataGrowing demand for accountability in education based on meaningful performance data
National Pupil DatabaseAchievement and Attainment
Tables
8 million pupils
25 000 schoolsGrowing demand for accountability in education based on meaningful performance data
International opportunities
25,000 schools
12 million exam results annually
50 awarding bodies
RAISEonline
UK data and assessment capabilities well-regarded 1 million reports annually
25

Looking ahead
Terry Sweeney Chief Executive

UK market landscapepMarch 2010 Budget Ed ti di ll ti fi d
Common Conservative / Liberal DemocratEducation spending allocations confirmed
1.3% spending increase in year to April 2011
Focus on efficiency improvements and reducing central costs
Liberal Democrat manifesto themes
Maintaining ‘frontline’ education
Pupil premium
New GovernmentEducation high priority for Conservative / Liberal Democrat coalition
Focus on performance data
School renewal: ‘Free’ schools / alternative school providers
I d h l tCommon policy themes Increased school autonomy
Standards
Parent power
Conservative manifestoI t t ff ll h l th h Conservative manifestoWe will improve standards for all pupils and close the attainment gap between the richest and poorest.
We will enhance the prestige and quality of the teaching profession and
I want us to offer all schools the chance to enjoy academy-style freedoms so that heads and teachers across the country can be liberated quality of the teaching profession, and
give heads and teachers tough new powers of discipline.
We will restore rigour to the curriculum and exam system and give every parent access to a good school.
can be liberated.
Michael GoveSecretary of State for Education
27

US market landscapepObama proposed education budget increase of 8%
Technology key to Obama’s education plansOffice of Educational Technology formedNational Education Technology Plan published: Learning Powered by Technology
Five key focus areas: Learning, Assessment, Teaching, Infrastructure, Productivity
d h llGrand challenge: “Establishing an integrated end-to-end real-time system for managing learning outcomes and costs across our entire education system at all levels.”
Continuing interest in interactive classroom technology
28

OutlookC ti i t t t tContinuing to execute our strategy
Highly seasonal business
Extremely busy summer aheadSchool commissioning – BSF and AcademiesLargest ever on-screen marking programmeContinued high demand for education resources productsUS classroom technology installations
Full-year revenue growth in all three divisions
29

iQuestions

diAppendices

Investment propositionp pSuperior education solutions
Strong UK market positionsUK Learning TechnologiesU ea g ec o og esUK Assessment and DataUK Education Resources
Rapidly developing international channels150% growth in international sales in FY-2009
Growing visibilityCommitted revenues: £505m at May 2010
Financially secureStrong balance sheet and committed bank facilities
32

35 years of superior solutionsy pFirst in innovation
Fi t Wi d PC f UK d ti
DataServices
LearningSpaces
First Windows PC for UK education
First PC networks for UK education
First UK education Internet service
First UK education Internet content service
LearningPlatforms
On-ScreenMarking
First UK education Internet content service
First non-proprietary whiteboard software
First national e-testing environment
First low-cost floor robotGeneral ClassroomResources
Large-Scale Educational ICT Projects
First low cost floor robot
First national Learning Platform implementation
Educational SoftwarePublisher
Education InternetProvider
Hardware Supplierto Schools
IT SystemsIntegrator for Education
33
1975 1980 1985 1990 1995 2000 20102005

Learning TechnologiesUK d R W
UK Market Snapshot
£1.0bnUK and RoW
RM Education – UK
Product Customer Funding source Competition
£1.0bnUK schools ICT spendSource; Atkins / Kable
g p
Classroom technology Individual schools Individual school budgets Local dealersGeneric technology suppliers
Managed services New school build programmes Central capital budgets Civica / Capita / Northgate
Web services Local authorities Aggregated school budgets Capita / BT
Schools MIS Local authorities Aggregated school budgets Capita / Pearson / Serco
AMI EducationProduct Customer Funding source Competition
Card and biometric solutions New school build programmes Central capital budgets Gladstone / Cunningham /
Nationwide
Network management tools Individual schools Individual school budgets Generic technology suppliers
RM Asia Pacific
Product Customer Funding source Competition
Schools MIS State education departments Central education departments
Classroom technology Individual schools Individual school budgets Generic technology suppliers
34

A UK secondary schoolyEducation delivered through ICT
across all curriculum subjects
Dimensions
Ann al b dget £5 2m…across all curriculum subjectsInteractive classroom technologyHigh computer:pupil ratioLearning platforms
Annual budget: £5.2m
1,000 pupils
165 staff (100 teachers)
3 ICT staffLearning platformsHome access and parental reporting
School operations depend on ICT
800 computers
200 applications
60 whiteboardsSchool operations depend on ICTExtensive fixed and mobile networkManagement information systemsAttendance management
Source: Becta / RM
1966-197623%1944-1966
33%g
Access control and securityCashless catering
Post-1976Post-197614%
Temporary2%
Inter-War14%
35
Pre-191914%
Age of English Secondary Schools

BSFT i l j tTypical project
Allocation of spend – typical BSF project
Central systems and software 15%Recognised on acceptance*
Data centre
Learning Platform
In-school systems and software 40%Recognised on acceptance*
User equipment (inc. PC hardware)
Network equipmentg p
Software
Initial services 10%Recognised on acceptance*
Implementation and integration
Training
Managed service delivery 35%d
Managed Service g yRecognised over term
g
*30-day payment terms: 70% on acceptance; 25% two months later; 5% on completion of group of schools
Timeline – typical BSF projectTimeline typical BSF project
MilestoneSummer 09 Summer 10 Spring 11 Summer 12 Summer 13 Summer 13 Summer 14 Summer 15
Procurement starts
Preferred bidder
Contract award
1st schools complete
2nd schools complete
Bid costs expensed
S h l t tiSchool construction
Central systems and software
In-school systems and software
Services
36

BSFC t t dContract awards
RMAuthority Consortium Wave
Other ICT suppliersAuthority ICT Supplier Wave
Bradford – Phase 3 ICT only 6Camden BAM 5Ealing Balfour Beatty 5Essex Skanska 4/5/6Hackney Mouchel /Babcock 2
Manchester Ramesys (Capita) 1Nottingham Ramesys (Capita) 2Tameside Ramesys (Capita) 3Tower Hamlets Ramesys (Capita) 2Waltham Forest Ramesys (Capita) 1W t i t R (C it ) 3Hackney Mouchel /Babcock 2
Haringey ICT only 2Hull Morgan Sindall 2Islington Balfour Beatty 2Knowsley ICT only 1Lambeth ICT onl 2
Westminster Ramesys (Capita) 3Wolverhampton Capita 5Blackburn and Darwen Northgate 4Bristol Northgate Pathfinder Hartlepool Northgate 5Kent (LEP 1) Northgate 3Lambeth ICT only 2
Leeds ICT only 1Middlesbrough ICT only 2Newham Laing O’Rourke 1Salford and Wigan Hochtief/Laing O’Rourke 3
( ) gLeicester City Northgate 1Barnsley Civica 3Luton Civica 3Sheffield Civica Pathfinder Cambridgeshire Dell 4De b shi e Dell 3Solihull ICT Only 1
Somerset BAM 4Southwark Balfour Beatty 3Stoke-on-Trent ICT only 1Sunderland ICT only 1
Derbyshire Dell 3Birmingham Redstone 2Lancashire Redstone 1Liverpool In-house 2Newcastle In-house 1Durham Carillion 3yRochdale Carillion 4Bradford – Phases 1/2 Sun Pathfinder Lewisham VT Pathfinder North Lincolnshire MASS 3Sandwell Agilisys 3South Tyneside & Gateshead Morse 1
37
South Tyneside & Gateshead Morse 1Greenwich - 1

Accounting treatmentP j tProjects
Pre-contract costs not taken to the balance sheet unless contract award virtually certainvirtually certain
In practice appointment as selected bidder
Separable elementsSeparable elements Accounted for using relevant Group accounting policy for that elementRevenue and profit recognised as the goods and services are delivered
Bundled elements Accounted for as long-term contracts
Revenue recognition based upon proportion of fair value of contract delivered to dateAny expected contract loss recognised as soon as foreseenAny expected contract loss recognised as soon as foreseen Profit only recognised when outcome of contract can be assessed with reasonable certaintyThereafter profit recognised proportional to revenue based upon expected outcome
Consequently revenue recognised but typically traded at low margins in early phases until contingent risks are mitigatedmitigated
38

Learning TechnologiesUS
US Market Snapshot
$17.5bnUS
RM USA
Product Customer Funding source Competition
$17.5bnK-12 schools ICT spendSource: Compass Intelligence
Product Customer Funding source Competition
Classroom technology School Districts District budgets Generic technology suppliers
Learning platform School Districts District budgets -
Curriculum software School Districts District budgets Education publishers
Interactive teaching tools Whiteboard vendors District budgets Promethean / Smart
39

Education ResourcesUK Market Snapshot
£1.5bnTTS
Product Customer Funding source Competition
I di id l t bli h t
£1.5bnIndividual schools resources spend – EnglandSource: DCSF Consistent Financial Reporting
Curriculum resources Individual schools Individual establishment budgets Findel / small specialists
Furniture Individual schools Individual establishment budgets Findel / specialists
DACTADACTAProduct Customer Funding source Competition
LEGO Education Individual schools Individual school budgets -
Branded products Individual schools Individual school budgets Retail / small specialists
SpaceKraftProduct Customer Funding source Competition
SEN installations New school build programmes Central capital budgets / individual school budgets Specialistsg
Multi-sensory and SEN products Individual schools Individual school budgets Small specialists
Isis ConceptsP od ct C stome F nding so ce CompetitionProduct Customer Funding source Competition
Education interiors New school build programmes Central capital budgets Specialists
Lightbox EducationProduct Customer Funding source CompetitionProduct Customer Funding source Competition
Curriculum software Individual schools Individual school budgets Promethean / Smart / education publishers
40

Assessment and DataStrategic Partners
Cambridge Assessment
RM Assessment
Product Customer Funding source Competition
International Baccalaureate
ACCA
DCSFProduct Customer Funding source Competition
On-screen marking Qualification providers Customers’ operating costs DRS / Pearson
E-Testing Qualification providers Customers’ operating costs Pearson / ETS
QCDA
Ofsted
RM Data Solutions
Product Customer Funding source Competition
Data analysis Government and Agencies Government
Data presentation Government and Agencies GovernmentData presentation Government and Agencies Government
41

AwardsLearning Impact Awards 2009 PfS Awards 2008
Glow
Education Resources Awards
Leeds – Innovation in ICT
ICT Excellence Awards 2009TTS Activity TreeTTS Easi-SpeakPodium
ICT Excellence Awards 2009
Support for Schools
BETT Awards
Inclusive TechnologyPodium
Ten Best Web Support Sites
2004/2005/2006
techMARK Awards 2008
Achievement in Sustainability
Help Desk Institute Awards 2007
Support Excellence Team
UK’s Top Employers 2010
Top IT employer
Big Chip Awards 2009
Teacher Training Resource BankLicence to Cook
42
Licence to Cook

Market landscapep
Proportion of GDP spent on education1995 2000 2006
Primary /Secondary
All education
Primary /Secondary
All education
Primary /Secondary
All education
UK 3.6% 5.2% 3.5% 4.9% 4.3% 5.9%
United States 3.8% 6.6% 3.9% 7.0% 4.0% 7.4%
Australia 3.6% 5.3% 4.0% 5.6% 4.0% 5.7%
OECD average 3.7% 5.4% 3.5% 5.2% 3.6% 5.5%Source: OECD
43

UK market landscapep
3 8%
3.1% 3.2%
3.8%
0.8%
-0 2%
0.8%
-0.8% -0.9%
0.2%
Central Government
Local Government
Education Police Health Defence Total Public Sector SITS
UK public sector software and IT services marketUK public sector software and IT services marketCumulative Annual Growth Rate 2009-2013
Assumptions: Conservative Government implementing cutsSource: TechMarketView44

UK market landscapep
School spend on resources and ICT
UK Education Budget £88bn*School
NDPBs
School staff salariesSchool staff salaries
45
*Government funding for 2009/10source: Budget 2009

AcquisitionsqBusiness Activities Date Net cost
3T Productions Interactive design and development Mar 2000 £5 5m3T Productions Interactive design and development Mar 2000 £5.5m
Softease Educational software Oct 2001 £4.8m
Helicon Educational content Feb 2002 £0.7m
Forvus Data analysis Jul 2003 £4.0my
peakschoolhaus Education inspection services Oct 2003 £1.6m
Sentinel Network management software Feb 2004 £6.1m
TTS Education resources Sep 2004 £12.0m
Caz Software Education management software (Australia) Jun 2006 £1.6m
MES Education resources Aug 2006 £1.0m
DACTA Education resources (Europe) May 2007 £4.2m
SERAP Data analysis Aug 2007 £0.7m
SpaceKraft Education resources (SEN) Oct 2007 £4.6m
Inclusive (25%) Education resources (SEN) Apr 2008 £1.0m
EasyTrace Identity management July 2008 £2.8m
Computrac Learning technologies (USA) Nov 2008 £5.0m
Pisces Education resources Apr 2009 £0.4m
46
ISIS Concepts Education resources May 2009 £2.6m

PensionsDefined Benefit Pension Scheme
2002: retirement age increased to 65
2003: closed to new members
IAS 19 deficitM 2010 £15 7 (S 2009 £12 8 M 2009 £8 3 )
2005: increase in employee contributions
2007: 5% cap on pensionable salary increase
2007/08: £3.5m special company contribution
Mar 2010:£15.7m (Sep 2009: £12.8m; Mar 2009: £8.3m) 2009: increase in employee contributions
£2.1m increase in post-tax deficit attributable to: Changes in market derived liability assumptions: £(6.9)m
Inflation expectation up 0.5%
DB pension£m
31 Mar 2009
31 Mar 2010
30 Sep 2009
Assets 73.0 97.6 89.9
Asset return in excess of long-term expectations: £3.4mCash payment in excess of service cost: £0.9mIncome statement finance cost: £(0.3)m
Liabilities (81.3) (113.3) (102.7)
Deficit (8.3) (15.7) (12.8)
Deferred tax asset 2.4 4.4 3.6
Deficit post-tax (5 9) (11 3) (9 2)Tax: £0.8m
Deficit post tax (5.9) (11.3) (9.2)
Triennial valuation as at 31 May 2009 due in H2
47

Investment income/finance costs/
Investment income£’000 H1-2009 H1-2010 FY-2009
Bank interest 122 202 226
Income from sale of finance lease debt 338 417 622
Other finance income 172 102 344
632 721 1,192
Finance costs£’000 H1-2009 H1-2010 FY-2009£ 000 H1 2009 H1 2010 FY 2009
Interest on bank overdrafts and loans 246 359 464
Interest on loan notes 34 35 67
Net finance costs on defined benefit pension scheme 200 319 416
480 713 947
48

Working capitalg pWorking capital£m
31 Mar2009
31 Mar2010
30 Sep2009£m
Inventories 18.4 21.9 19.9
Trade receivables 41.4 47.3 64.8
Long-term contract balances 10.3 14.0 13.2
Other receivablesPrepayments / accrued income / other receivables
8.0 10.3 8.1
Trade payables (21.3) (29.2) (27.2)
Other taxation and social security (6.8) (9.1) (10.2)y ( ) ( ) ( )
Accruals and other payables (25.1) (29.5) (32.4)
Deferred income / long-term contract payments on account (27.2) (23.2) (28.9)
(2.3) 2.5 7.3
Growth in Education Resources businessTrade receivable days 47 (2009: 46)Trade receivable days 47 (2009: 46)Continued investment in long-term contracts (inc. BSF)Trade payable days 48 (2009: 42)S l b i b b ki it l i th d h lfSeasonal business absorbs working capital in the second half
49