river ice data instrumentation · depalnnent of defense pesonrä cndcaitradas rrcyacb" repcrls...
TRANSCRIPT

CRREL
River Ice Data Instrumentation Roger L. Kay and Kathleen D. White June 1997

Extract: Ice processes aecqxüeof ecusingefcm- CDetoGcrps of Engneers floodocntrd, WDteracntrd, end novigciicn prqeds exh yecr. IVbnifcring of ice cndolhe physicd pcrcmstes is cbrebyinslrumerilo 1icninscmeins1cnce3 but is usudlycbnemcnudly IVBCBurenents thd" rexire pasemä to go en en ice cove: ocn be risky cr imposside cepsndng en theice cover's s1cäli1ycndtheindvicLid's trdning This stud/ seeks to identify end renk the field measurements
neecbdcLringv^nteccndticns cndtheinstruTenitdicn required to moke the measurements. Existing end cBvelcpinginstrumeTtoticnv^s edudedfain-situend remote sensing ccpcälities. Methods of Ironsmitting storing end retrieving vaious types of ice cbta were e<plcred fa fecsiblrty end prcdicdily. Rexmmsncb- tiens aeicbntifiedregcrdngthelypes of instrumenta ticn, cbtatrcnsiTissicn, cxdstaqx^ method; thotneed to be improved a de/deped
Cover Icecordtions, RedRivacftheNorth iron stem, lodldrgrcrthecBtbslwsaiGcndFcrks, North Dckoto, cndCslo, Minnesota en 17/all 1997. Rerotectta cdledicnwrs exterräyirrportcntcUringfis odrere tlccd event. (Photo courtesy of St. PaJ D'stict, U.S. Airy Corps cf Engneers.)
Hew to get copies of CRREL technicd publications:
Depalnnent of Defense pesonrä cndcaitradas rrcyacB" repcrls lacughlheDefenseTechricd Infarrdicn Carte: DTIC-BR SUITE 0944 8725 JOHN JKINGVWJRD FTBELVORVA22060-6218 Teephcne 1 800 225 3842 E-rrril häp@dicnnil
rr6acB"s@dicnril WWW http/AMMA/cScdarril/
Al alhas rrcy ace repcrls lacughlheNalicnd Technicd Infarrdicn Sevice NTIS 5285 PCRT RCYA. RD SPRING:IELDVA22161 Telephone 1 703 487 4650
1 703 487 4639 (TDDIalheheainginrpdrec!) E-rrril ace"[email protected]/valdg>/ WWW http/AAAAAA/fedACTldcpv'/htis/ritishcrinehW
Accrrrdetelistofdl CRREL technicd pudicalicns is a/dlctiefrcm USACRREL (CECRL-LP) 72 LYIVE RD HANCVERNH 03755-1290 Täephcne 1 603 646 4338 E-rrril [email protected]
Fa informctionondl aspects of theCddRegens Research cndEng'neeringLoborcfay, visit our WcrldWicte Website http/Avww.arel .uscoeamym I

CRREL Report 97-2
US Army Corps of Engineers® Cold Regions Research & Engineering Laboratory
River Ice Data Instrumentation Roger L. Kay and Kathleen D. White June 1997
Prepared for OFFICE OF THE CHIEF OF ENGINEERS
Approved for public release; distribution is unlimited.

PREFACE
This report was prepared by Roger L. Kay, Hydraulic Engineer, Hydraulics Sec- tion, Hydrologie Engineering Branch, Engineering Division, Omaha District, U.S. Army Corps of Engineers, and Kathleen D. White, Research Hydraulic Engineer, Ice Engineering Research Division, U.S. Army Cold Regions Research and Engi- neering Laboratory. This report was funded by CWIS Work Unit 32774, Field Moni- toring for Ice Jams, in response to a request by the 1994 Ice Engineering Research Program Field Review Group.
Review of the report was provided by Scott E. Acone, New England Division, U.S. Army Corps of Engineers; Richard T Pomerleau, St. Paul District, U.S. Army Corps of Engineers; and Robert J. Buchholz, Omaha District, U.S. Army Corps of Engineers. Portions of this report were also reviewed by Wayne G. Dorough of the Omaha District. The authors wish to thank all the researchers and staff at CRREL who shared information and provided insight into various instrumentation.
The contents of this report are not to be used for advertising or promotional purposes. Citation of brand names does not constitute an official endorsement or approval of the use of such commercial products.
CONTENTS Page
Preface ii Introduction 1 Survey of present methods 2
Survey results 2 Ice parameter monitoring and importance 4 Data collection methods and sources 6 Instrumentation in use 8 Ice impacts 8 Data storage and retrieval 9 Summary of survey results 11
Instrumentation evaluation 11 Capabilities of existing instrumentation and observation methods 11 Stage 12 Discharge 13 Air and water temperature 14 Ice thickness 15 Water velocity 15 Ice movement and velocity 16 Ice coverage and ice concentration 17 Developing or future instrumentation 18 Stage and discharge 18 Air and water temperature 21 Ice thickness 21 Ice movement and velocity 23 Ice coverage and concentration 23 Other parameters/instrumentation 24 Additional instrumentation configurations to consider 25
Evaluate systems for transmitting, displaying, evaluating, and storing river ice data 27
Transmitting data 27 Displaying and evaluating data 30 Storage and retrieval of data 30 Summary of data systems 31
Recommendations 32 Literature cited 33 Appendix A: Additional survey results 37 Abstract 39
ILLUSTRATIONS
Figure 1. Map of USACE Divisions susceptible to ice problems in
the continental U.S 2 2. Ice data instrumentation survey 3 3. Number of respondents desiring monitoring capability not
currently monitoring 6 4. Rating of ice parameter monitoring importance, overall and
by Division (as of 1995) 6 5. Ice impacts by Division (as of 1995) 9 6. Timing of reported ice impacts 10 7. Chain gage used to measure stage 13 8. Schematic of ice motion detector connected to DCP 16
Page
9. Photographic grid method for determining ice velocity and concentration 17
10. Section view of ultrasonic stage recorder 19 11. Schematic of MMW FM-CW used for velocity determination 19 12. USGS crest stage used to measure peak stage 20 13. Conceptual view of maximum stage gage 21
TABLES
Table 1. Districts with potentially ice-affected projects and number of
survey responses received 4 2. Ice parameters currently monitored, by Divisions 5 3. Ice conditions currently monitored and desired to be
monitored ranked in order of relative importance 5 4. Survey results on data collection methodology in use by
USACE Divisions 7 5. Survey results on use of various instruments 8 6. Survey results on ice observation data storage media 10 7. Survey results on types of computer storage formats used 11 8. Summary of instrumentation investigated 28 9. Internet addresses of selected water control sites in the U.S.
Army Corps of Engineers and others of interest 31

River Ice Data Instrumentation
ROGER L. KAY AND KATHLEEN D. WHITE
INTRODUCTION
Ice jams cause approximately $125 million in damages annually in the United States alone, in- cluding $50 million in personal property damage and $25 million in operation and maintenance costs to U.S. Army Corps of Engineers (USACE) projects and structures (USACE 1994a). There are 11 USACE Divisions, of which nine reside at least within climates that can potentially experience ice jam flooding (see Fig. 1). The Corps of Engineers must deal with ice problems affecting operations at Corps projects and at other locations for which the Corps is responsible primarily for emergency response.
Monitoring of river ice can help to alleviate some damages, but monitoring procedures and re- sources are not uniform between, or even within, USACE Divisions affected by ice problems. Per- sonnel within the Corps of Engineers have differ- ent needs and uses for ice-related data. Operations personnel may be most concerned with current ice conditions and how the operation of various projects may be impacted by ice. Hydraulic engi- neers may be most concerned with collecting pre- vious ice data, such as ice thickness and high wa- ter marks, for designing flood control projects. Emergency management personnel may be most concerned about whether ice jams could aggra- vate an existing or potential flood threat, and wa- ter control personnel may be most concerned with collecting river stages as affected by ice and dis- seminating that information to those most im- pacted.
Each District has established its own methods and priorities of collecting information or making observations to meet their needs, including those listed above. The Ice Engineering Research Divi- sion (IERD) at the U.S. Army Cold Regions Re- search and Engineering Laboratory (CRREL) has worked closely with a number of Districts in iden- tifying or recommending procedures for obtain- ing ice observations on an individual, generally site-specific basis. Manually collected ice observa- tions are manpower intensive, costly, and hazard- ous. They also provide only discrete or spot mea- surements of a generally dynamic process.
Automatic data collection can be performed around the clock, providing a continuous source of data while at the same time decreasing bud- geted manpower and freeing personnel for other work. In remote sites, automated data collection allows the collection of data that might otherwise be unavailable.
CRREL has also researched and developed a number of instruments for making both manual and automated ice observations. Many of these in- struments are used primarily for research pur- poses, but some have been used in the field by various Districts. Some Districts have indepen- dently developed their own methods of field data collection (e.g., Pomerleau 1992). However, little direct coordination has taken place between Dis- tricts in identifying instrumentation that could automate or simplify ice data collection, storage, and retrieval.
The 1994 Ice Engineering Research Program Field Review Group recognized that ice data col- lection could be improved with the aid of more communication between IERD and the Districts, and between the Districts themselves. Use of ap- propriate instruments was also seen as a way to increase the quality and quantity of ice monitor- ing in an economical, safe, and efficient manner. The Field Review Group recommended that IERD conduct a survey of USACE Districts to identify instrumentation used by the various Districts. IERD was also directed to develop prioritized list of data collection needs to direct future research efforts in enhancing or developing instrumentation.
This report presents the results of a survey of the present and potential use of instrumentation within the Corps of Engineers, as well as the means by which the collected data are used and stored. The survey of currently used data collection meth- ods is presented first, along with a brief discus- sion of ice impacts experienced by the various Divisions and current data storage and transmis- sion methods. Existing data collection methods and potential methods available in the future are then evaluated, followed by an evaluation of meth- ods for the transmission and storage of data. Fi- nally, recommendations are made for further work in the field of ice data collection.
North Atlantic
\N f Lower Mississippi Valley
Figure 1. Map of USACE Divisions susceptible to ice problems in the continental U.S. Each square represents one to nine ice events, and each circle represents an additional one to nine events.
SURVEY OF PRESENT METHODS
A survey designed to identify existing and de- sired ice data collection methods and instrumen- tation at USACE Districts was prepared by Omaha District personnel in conjunction with IERD re- search engineers (Fig. 2). The main purpose of the survey was to determine where future efforts in instrumentation and in data storage, display and retrieval may be most beneficial to the greatest number of users. The survey had three main query areas, each with several questions. Part 1 dealt with data collection: which ice parameters are being monitored, their relative importance to users, and how data are currently being collected. Part 2 dealt with the frequency of ice impacts to structures and operations and the timing of ice impacts. Part 3 dealt with methods and format for data storage and retrieval. Data from the surveys were tabu- lated in a database for querying and evaluation. A literature review was also conducted to investi- gate existing ice data collection methods and new uses for other types of instrumentation.
Survey results The survey was sent to the 24 Districts in eight
divisions and one Division that is not divided into Districts. These were identified by IERD as hav- ing at least occasional river ice problems, either
through entries in the CRREL Ice Jam Database (White 1996), or through a review of the HEC Res- ervoir Database (HEC 1994). Nearly 100 responses were received; Table 1 identifies the responding Districts, their acronyms, and the number of sur- vey responses from each. Table 1 also contains the estimated number of USACE projects in ice-af- fected areas. These projects (reservoirs, locks, and dams) were identified by comparing ice-affected hydrologic unit boundary areas identified in the CRREL Ice Jam Database with the locations of USACE projects in the HEC Reservoir Database. Districts without these types of USACE projects (e.g., Sacramento District) may be involved in emergency response to ice jam flooding or may have riverine structures, such as levees, that are ice affected, and thus would also have a need for ice monitoring.
The number of surveys returned by each Dis- trict corresponds relatively well to the number of projects in ice-affected areas. However, several Districts had a low number of responses relative to the number of potentially ice-affected projects during part of the winter season, particularly Huntington (ORH), Louisville (ORL), Pittsburgh (ORP), and Rock Island (NCR) Districts, and New England Division (NED). The low response rate from these four Districts may slightly skew sur- vey results away from navigation-related ice moni-

43 £
j2 ">
>, 43 T3
ra Ja PHPH
c 0 a ■43 to
n 0 cu c J3 a c^- o co o
T3 a ra C 0 3 S-H QJ 44 QJ 9 T3 tu
cj o 9 o 0 JC
tj 0 13
c 3 o- 3 tj
tj |
3 QJ N
3 Is Cj JH x Cj
X S3 cj bC '-+
3 0
9 .s % 3 s '—'
CO > O
co C
CJ CU 01
cu rC3 X, tu
cj rj "** S3
ft 0
Cj a co
c X
0 43 u CU
13 3 co
£X O S3 c^> c 0
43 co
3
cu
bC C
0
co cj
CU
tu
>> cu
>
cu
H
to [j
c QJ CJ
c o u
3 cr bC .9 s
S3 01
o s 0
N
be f-H 0 H 3 0 >,
oi
C QJ
cj •5 3 "co £■
DD DD D D □
DD DD D D □
an an a a a
DD DD D a □
an an a a a
DD DD D a □
■5 ä M 3 lock
s st
ruct
ck
s)
_CU
co « CD %
u 3
-^ ^H O h a ^ 10 10 —i (5 (5 S3 i € J-,
1 4s .£ 0 a
O O to •43 '43 43 .2 4» .2 13
PH ■BH c o
avig
a av
iga
thert
> "0 to >,
QJ
s 'D '3 3
■*^ SH
3 O en PH
Cj 44 to
T3 0
Z2Ä Z ffi bC s .s E
X c CO = o QJ
a; ■r. 3
0 V
QJ ^ .9
a; a tH Ü 3
3
•5 bC c >
1 a O O
5^ °
OJ o
•5 ^ an 2 g c cn ^H o cfl ^
o Ü 3 *
0
cn
3 cr
C
bC .s C
op o
r no
r
tin?
■r. 1^ cO
O <fi
s 5 0 to ±; "
■r. j2 x s s
43 C QJ CO
ü ß
g 43 *j ■d cn —H
O .S
2 S co .2 cu C
43 °
3
»J o
an cu —
S <
T3 gf be O
3 o
o .S
M a CO OJ cu +-■ D Z
a» □ PH
CO PH
a» '
§ ° CT3 c
■is
DD
4=
<u \p
C
"ti cn
c3n
O cu X rv PH to
J3 co
■a ° o 43
9 -a S S o 5 u S
QJ CO +J CO OJ
CO 43
T3 cO
DD
„ 3
o O
O o
CJ
§ DD | 3
?,2 co 6 & 0
■= "3 ö
s-i cu cn
<^ * 'S <L> >^ co CO 01 CO CO > _,
Ä 3 C C^ co co
Si ^Q W B o o <
2 E O S < E ac 2 z o £ w
s
o
5-
g ■§ •J3 T3
P SÜ PH M o 9
43 .9 O J5 '
n S O PH •
■^ CO ■a <3
o
o PH H 3 PH
H 3 O >,
4J "+3 O
9 ^ •a be
3 o >>
43 to S-H
'co
co o
.2 o CO el) > 43
<" SJ
II _ cn
V <u <u 7^ <J PH
>, cn HH <U
OJ 5H
11
O T3
■r. SH OJ
OJ
9 « ^ .... »H j-T^ co T; co
OJ 43
O
0 7! E O PH SH
CO B O)
•a -s 9 cn r- frt •|,H5
CO
IM
•ß = ,- PHIO PH
ÖC v bC
S 9 1 3 ^ H2
& Ol
»H41»H . o o o
■6 S^ 2 ■oi
ST.
.9 4<
3 O >,
CO CD
a .9 ?- Xt a* <-* a.
S « MH f- o o 0) 4^ U SH
C <S S 9 JH -—'
9H (3 S .2
CJ
t-H CD CO p _P
^■co 'S
J-l SH co a o
39 «a -a
^ I I CO [V CD
w U O
S3
43
ä 0 I—1
hJ
OJ QJ SH ■r.
'cn =3 QJ
0 C
i-T1
c QJ CJ ■r.
=3 =3 u
DDDDDDDDDDDD =S
DDDDDDDDDDDD fr
QJ :H
5 cu CO S
cn a* -a
S g PH bo S — a S s a » g cu J« .S S J« cu
c .2 ^ .«
s* "3 c c
fi S 8 8 S s o o <u <u 8 S ^ ^
0> 0> (Ö CO j_ -^ _ -,
a^DDftU ^33
PH O 3 -a CU -tn N 13 a <3
o
DDDDDDDDDDDD
DDDDDDDDDDDD
DDDDDDDDDDDD
DDDDDDDDDDDD
DDDDDDDDDDDD
3 iX ■^ CO
.9 43 CO 6 a 8
33 43 O SP n o
3 33
^ O 9 i».
co cj T3 CU o .a CU SH 13 cu 5 43 60 S .9 Ä * 9 o g a a -9 o
o « ■S O
co cn E S — cn 5 "3 O - cn
•JH HM JH
5 >^ 3 > -H -H £? cn J-i OJ
r^ & >, S 5 w cö cj HQ Q
co g C ° « 4J S QJ JH JH ctf ÖT) QJ QJ Q QJ ffl QJ QH
' »H C S QJ 3 OH X fi H
o^2(3 PH "3
P cn
DDDDD
> +H
S 2 CO
co 3 - to
CJ
5 C i il .Ü
9 9 9 9 9 o o o o o
3 o >> c
ST. S3
s o
cu cu cu cu <D cu CO CO CO CO CO rH X X X X X 33 O O O O O O
DDDDDD
cu a
s i S co
2 T3
DD
4? S co «
o u DD
43 O
3 44
Ü 43 cu "S 33 3 £ O DDD
•3 CJ

Table 1. Districts with potentially ice-affected projects and number of survey responses received.
District Acronym
Total number of reservoirs, locks, and dams in ice
areas
Total number of survey responses
Lower Mississippi Valley Division (LMV) St. Louis LMS 9 0
Missouri River Division (MRD) Kansas City Omaha
MRK MRO
7 32
20 11
North Atlantic Division (NAD) Baltimore New York Norfolk Philadelphia
NAB NAN NAO NAP
14 0 0 5
7 2 1 2
North Central Division (NCD) Buffalo Chicago Detroit Rock Island St. Paul
NCB NCC NCE NCR NCS
1 1 9
24 29
7 0 0 1
24
New England Division (no districts) NED 30 1
North Pacific Division (NPD) Alaska Portland Seattle Walla Walla
NPA NPP NPS NPW
1 4 2 3
2 4 5 0
Ohio River Division (ORD) Huntington Louisville Pittsburgh
ORH ORL ORP
37 37 40
1 2 1
South Pacific Division (SPD) Sacramento Los Angeles San Francisco
SPK SPL SPN
0 0 0
4 1 1
Southwestern Division (SWD) Fort Worth Albuquerque
SWF SWL
0 0
1 1
toring, as each of these Districts has a number of navigation projects.
Ice parameter monitoring and importance The first part of the survey (Fig. 2) was divided
into five questions (la-le), with the first three deal- ing with ice-related data currently being collected or desired to be collected and the relative impor- tance of measuring these parameters. Twelve ice- related parameters were presented for evaluation (question lc). Tables 2 and 3 summarize the re- sponses received to these three questions, and Fig- ures 3 and 4 present the results graphically. Some
caution is required when interpreting Table 3, however, since the perceived importance of dif- ferent parameters is constantly changing as knowl- edge in the field of ice engineering expands. For example, ice concentration and freezeup stage are not considered by the survey respondents to be important parameters to monitor (Fig. 3), but fu- ture monitoring is of interest, as evidenced by the ratio of respondents who want to measure these parameters to those currently measuring them (Fig. 4). Both of these parameters are important in ice jam formation: ice concentration directly im- pacts both freezeup and breakup jam formation

Table 2. Ice parameters currently monitored, by Divisions (as of 1995).
Ice parameters currently monitored, by Divisions
Ice parameter MRD NAD NCD NED NPD ORD SPD
V V V V V V V Water stage V V V V V V V Air temperature V V V V V V V Water temperature V V V V V V Ice thickness V V V V V V Condition of ice V V V V V V Date of ice out V V V V Ice areal coverage V V V V V Ice movement V V V V V V Date of ice in V V V V Ice concentration V V V V Freezeup stage V V V V V
Note: Southwestern Division does not currently monitor ice conditions.
and progression, and knowledge of freezeup stage is increasing in importance as a predictor of later ice cover breakup.
Clearly, the parameters deemed by survey re- spondents to be the most important parameters to monitor are discharge and water stage (Table 3 and Fig. 4). Instrumentation for measuring these parameters both in the field and remotely has been widely available, so it is not surprising that they are also the two most frequently monitored pa- rameters. Air and water temperature are the next most commonly monitored parameters, but their rated importance relative to discharge and stage
is somewhat diminished. The only other two pa- rameters that were assigned some degree of im- portance by the respondents are ice thickness and the condition of the ice.
The responses shown in Table 3 indicate that most respondents desire the development of in- struments to measure ice thickness and ice move- ment. Instrumentation for detecting ice movement (described later) has been developed and field tested and could be readily adapted by Districts for field use. Experimental remote ice thickness measuring devices have also been laboratory or field tested. Stage, discharge, and air and water
Table 3. Ice conditions currently monitored and desired to be monitored ranked in order of relative importance.
Number of positive responses
Parameter a) Currently use b) Desire to use* c) Relative importance^
Discharge 78 (1) 79 (1) 3.86 (1) Water stage 77 (2) 78 (2) 3.82 (2) Air temperature 75 (3) 75 (3) 2.99 (3) Water temperature 66 (4) 69 (4) 2.89 (4) Ice thickness 43 (5)** 54 (5) 2.42 (5) Condition of ice 39 (6) 46 (6) 2.21 (6) Date of ice out 35 (7) 41 (7) 2.01 (7) Ice areal coverage 32 (9) 37 (9) 1.99 (8) Ice movement 26 (10) 36 (10) 1.96 (9) Date of ice in 35 (7) 41 (7) 1.95 (10) Ice concentration 18 (11) 26 (11) 1.79 (11) Freezeup stage 12 (12) 21 (12) 1.68 (12)
* The number of responses includes those who only marked the "currently use." t Items left blank by respondents who otherwise completed the question were assigned a value of 1. ** Number in parenthesis indicates relative rank of surveyed parameter in each column.

Ice Thickness
Water Temperature
Air Temperature
Discharge
Water Stage
Ice Areal Coverage
Ice Concentration
Ice Movement
Date of Ice In
Date of Ice Out
Freezeup Stage
Condition of Ice
Ratio of No. Desiring to No. Currently Monitoring 0.4 0.8 1.2 1.6
I I I I I 1 1 ,*l I ^_J-.
1 1 / •
• I 1 H
1 i I •«. I
■v_
1 i
1 ^» 1 •—. 1
I 1
1 1 .-
1 • 1 1 1 ®-
I 1 ■- 1 •
I I 1 1 1
Desire Capability
20 40 60 Number of Positive Responses
Currently Monitor • Ratio Desire to Currently Monitor
80
Figure 3. Number of respondents desiring monitoring capability not currently monitoring.
temperature can be, and often are, monitored re- motely, while ice thickness and condition of ice are not typically monitored remotely, indicating a need for further research.
Data collection methods and sources In the question dealing with data collection
methodology, respondents were asked to identify currently used data collection methods or sources
of information from a choice of 10 methods and sources. A space was provided to write in any ad- ditional method or source used but not listed. Five of the choices presented dealt with the location from which data are collected or conditions are monitored (i.e., from shore, structure, motor ve- hicle, boat, aircraft, or ice surface). Two choices dealt with remote data collection methods (data collection platforms [DCPs] and satellites). Three
| | Average • Missouri River o North Atlantic ▲ North Central A New England ■ North Pacific □ South Pacific ♦ South Western
1 r~ T T
Ice Thickness U
Water Temperature < >
Air Temperature i ►
Discharge < |
Water Stage < [
Ice Areal Coverage a
Ice Concentration J
Ice Movement
Date of Ice In
Date of Ice Out
Freezeup Stage
Condition of Ice
3> 3A
US
}• ▲
3-
e o
0
O A
_L
T
A
■ A O
A
A
_l_
A
A
12 3 4 5 Rating: Low (1) to High (5)
Figure 4. Rating of ice parameter monitoring importance, overall and by Division (as of 1995).
Table 4. Survey results on data collection methodology in use by USACE Divisions. Survey results on data collection methodology.
Method 'Number of data of positive
collection responses MRD NAD NCD NED NPD ORD SPD
Corps personnel 76 V V V V V V V Observe from shore or structure 72 V V V V V V V Observe from motor vehicle 43 V V V V V V Other agency (such as USGS) 27 V V V V V V Observe from ice surface 26 V V V V DCP (data collection platform) 26 V V V V V V Observe from aircraft 13 V V V V V V Other 13 V V Volunteer observers 9 V V V V V Observe from boat 4 V V V V Satellite imagery 3 V V V
choices dealt with the types of personnel making the observations.
The survey results for this question, shown in Table 4, indicate that most ice observations are made by USACE personnel from the shore or from a structure such as a bridge, levee, lock, or dam. Reliance upon, or cooperative agreements with national, state and local agencies is quite common in the water control arena, but apparently not so for ice-related measurements according to these survey results. The use of volunteers for ice-related observations does not appear to be common yet. A recent ice observation program involving vol- unteers as well as cooperation with the Omaha District, USGS, NWS, and state agencies has been quite successful in Nebraska (White and Kay 1996). The ice observations can be input and viewed in almost real time on a World Wide Web site (ad- dress http://cavent.nrc.state.ne.us/cgi-win/ icejam.exe). Plans are underway for a similar ef- fort in Pennsylvania following widespread ice jam flooding and damage in 1996.
It is not surprising that most ice observations are made from shore or from a structure, consid- ering the relative levels of effort, safety, and ex- pense in making such observations. Viewing ice and river conditions from the shore or a structure such as a bridge, lock, or dam is easy and safe, but these observations allow only a single view of the river at a particular location at a particular time. Even if an individual makes several observations throughout the day or from several locations, the observations may not be representative of the to- tal river reach in question. Observations from a motor vehicle are similarly limited in scope, but do allow an observer to cover more territory,
although more time may be involved. Observations from the ice surface are less com-
monly made and have the same disadvantage of being at a single observation point, but do allow for close examination of the ice. Ice observations made manually can be manpower-intensive and thus costly. Walking and carrying heavy equip- ment onto an ice cover is not without risk, how- ever, and the instability of an ice cover or jam of- ten prohibits observations from its surface. In ad- dition, few personnel are trained in ice surface observations and rescue techniques.
Observations from a boat or aircraft do allow the observer to cover the entire river reach in de- tail, if that is desired. Observations from aircraft may not allow for close examination of the ice sur- face, and differences in the ice surface may be in- distinguishable without some form of ground truth. The use of aircraft can also be rather costly if used on a frequent basis, but does allow for wide areal coverage in a short period of time. Observa- tions from a boat may allow for close examination of the ice, but examination of a wide or shallow river maybe difficult, and some ice conditions that are of most interest to observe, such as heavy frazil runs, thick ice covers, or breakup jams, may make light boat operation impossible. The survey shows that most observations from boats were provided by towboat or other towing industry personnel.
The survey showed that two types of remote observational methods are being used, although to a smaller degree than direct observation meth- ods. The use of DCPs was reported by about only one-fourth of the respondents, which is smaller than might be expected given the extent of gen- eral use of DCPs by USACE Districts in the water

control arena. However, five other respondents indicated the use of some type of computer or elec- tronics under "other" (e.g., NWS instruments, elec- tronic instruments through computer). It could be assumed that some of these five responses were referring to DCPs. The reported use of satellite im- agery is very light, as might be expected given the present limitations on its use, but continuing ad- vances in technology may make the use of satel- lite imagery more important and commonplace.
All of the observation methods shown in Table 4 are limited by weather and light conditions. The potential for instrumentation designed to reduce the reliance on human observers and increase the span of conditions under which observations can be made is great, but may be limited by budget- ary and other concerns.
Instrumentation in use The final question in the first part of the survey
explored the instrumentation currently in use to collect ice data. The respondents were asked to select among the following choices: ice thickness kit, glass-bead thermistor, thermometer, velocity meter/probe, still camera, video camera, and other. The results (Table 5) indicate that cameras are used in all of the Divisions that make ice ob- servations, but that ice thickness kits are used most to obtain data. Glass-bead thermistors are used to measure air or water temperature in only one Di- vision (Missouri River), and velocity probes are used in only one Division (as of 1995).
It should be noted that the number of responses to various types of instruments did not agree well with the number of individuals making observa- tions that would be expected to rely on those par- ticular instruments. For instance, 75 and 66 respon- dents reported the use of air and water tempera- tures, respectively, but only 24 reported the use of
a thermistor or thermometer to obtain these mea- surements. Some of those individuals are possi- bly getting results from other agencies or did not know how temperatures were being measured, but it does raise questions about the completeness of some survey respondents' replies.
On the other hand, 26 respondents indicated the use of an ice thickness kit, but an additional six individuals indicated the use of an ice auger or ice auger and tape under the "other" category, making the total number of respondents using an ice thickness kit or ice auger equal to the number who actually indicated observing ice thickness. Eight responses under the "other" category indi- cated measurements were made visually, but it is likely, based on the previous question, that many more people make visual observations but did not report them under "other."
Ice impacts The second part of the survey deals with the
impact of ice on various structures or operations in terms of frequency and timing. The structures and operations included for rating were naviga- tional locks, navigational structures other than locks, navigation traffic, hydroelectric power gen- eration, municipal water supply intakes, power plant water intakes, and flood control structures (levees, fainter gates, drainage structures, etc.). Questions on frequency that were left blank were assigned to the "never" category, and some re- spondents who indicated some frequency of oc- currence did not indicate timing of occurrence (Fig. 5 and 6). The closure of some navigation projects during the ice-affected season may be a factor in the large number of "no impact" responses. Flood control structures are the type of USACE struc- ture most impacted by ice (Fig. 5).
Ice impacts were reported with equal frequency
Table 5. Survey results on use of various instruments. Survey results on use of various instruments.
Positive Observation responses instrument (no.) MRD NAD NCD NED NPD ORD
Ice thickness kit 26 V V V V V Thermometer 23 V V V V V Others 19 V V V V V Camera 17 V V V V V V Video camera 11 V V V V V Velocity meter/probe 2 V V Glass-bead thermistor 1 V
Note: South Pacific Division did not respond to this question.

Every Year \J Mar
Missouri River Division
Flood Control Structures
Powerplant Water Intakes
Municipal Water Intakes
Hydropower
Navigation Traffic
Navigational Structures
Navigational Locks
g
0 20 40
North Central Division
60
Flood Control Strructures
Powerplant Water Intakes
Municipal Water Intakes
Hydropower
Navigation Traffic
Navigational Structures
Navigational Locks
u
TL
n r
0 20 40
North Pacific Division
60
80
80
Flood Control Strructures I
Figure 5. Ice impacts by Division (as of 1995).
during freezeup alone (38%) and during both freezeup and breakup (39%), and less frequently during breakup alone (23%). Of the three most fre- quently affected operations or structures (flood control structures, navigation traffic, and naviga- tion locks [Fig. 5]), navigation traffic and locks are impacted more often during freezeup periods, while flood control structures are impacted by freezeup and breakup conditions about equally. Two Divisions (as of 1995) reported that power plant water intakes are impacted by ice every year, during freezeup in the Missouri River Division and during both freezeup and breakup in the North Central Division. Although breakup ice
jams are often more spectacular than freezeup jams, ice data collection instruments should clearly be developed for both freezeup and breakup con- ditions.
Data storage and retrieval The last part of the survey concerned the meth-
ods used by various USACE offices to store ice data. Apparently, most data storage is still in pa- per form, and relatively few users store informa- tion in digital form on computers. This can be at- tributed largely to the needs of the data collector. For instance, a lock operator may have little use for rapid access to information on previous years'
7.5% 5.1%
Freezeup
28.4%
11.9%
12.8%
14.9%
Both 26.9% 27.0%
9.0%
22.4%
| Flood Control Structures
| | Navigation Locks
| | Navigation Structures
| | Navigation Traffic
| | Hydropower
| 1\ Municipal Water Intakes
| | Powerplant Water Intakes
Figure 6. Timing of reported ice impacts: freezeup only, breakup only, or both.
ice conditions at the lock, while an operations en- gineer may be very interested in obtaining that information to develop a predictive model that could aid the lock operator in decision-making processes that can reduce icing problems.
The relatively low number of respondents uti- lizing computers (Table 6) indicates potential for automation of data storage and retrieval. However, the use of computer-aided ice data collection and storage is increasing in a number of Districts. The Ohio River and North Central Divisions already have automated ice collection systems in opera- tion, but other Divisions have less organized data systems. All interested parties within a District or Division (e.g., Operations, Engineering, Water Control, Emergency Management, etc.) will ben- efit in discussing data and data storage needs to reduce redundant efforts and to be certain that all parties have access to any collected data that may be of importance to them.
A number of Districts are currently using the CRREL Ice Jam Database (White 1996) for both emergency response and planning and design purposes. Several Districts forward information
on ice jams to CRREL for inclusion in the Data- base at the end of each winter season. Similarly, the North Central Division is currently forward- ing all SITREPS (Emergency Operations Situation Reports) to CRREL so that information on ice-re- lated events can be added to the Database. The latter is particularly important because SITREPS often contain damage estimates that are not found in other sources. This practice should become stan- dard for all Districts and Divisions so that the Ice
Table 6. Survey results on ice observation data storage media.
Positive Storage media
responses (%)
Mainframe computer Desktop computer Laptop or notebook computer Workstation Files (paper) Files (non-paper items) Other
9.3 12.4
0 5.2
56.7 7.2 9.3
10

Table 7. Survey results on types of computer storage formats used.
Positive Computer file responses
format (%)
DSS database 24 Commercial database 12 CIS 8 Spreadsheet 8 Word processor 28 Other 20
Jam Database can be updated annually. Among those using a computer to store ice data,
word processing programs and HECDSS, the time series data storage system developed by the Hy- drologie Engineering Center (HEC 1990), are the most common storage formats (Table 7). As noted previously, the need for a centralized data storage system is important, so Districts should strive for software uniformity as much as possible to avoid data translation problems. It is envisioned that future storage requirements will require a fairly robust database system and that GIS querying of that data will be performed as computer systems evolve.
Summary of survey results A survey designed to identify existing and de-
sired ice data collection instrumentation, methods, data storage, and type of ice impacts was sent to 24 Corps of Engineers Districts (in eight Divisions) and the New England Division. Ninety-nine sur- vey responses were received from eight Divisions. The number of surveys returned from each Dis- trict corresponds fairly well to the number of USACE projects in ice-affected areas, except that the low response rate from a few Districts with a number of navigation projects may skew the sur- vey results away from navigation-related ice moni- toring and impacts.
Based on survey responses, the parameters rated highest for importance are stage and dis- charge, followed by air and water temperature, ice thickness and condition of ice. As pointed out pre- viously, however, the relative importance of col- lecting other parameters, particularly ice concen- tration and freezeup stage, may increase as the knowledge of ice processes increases.
The vast majority of ice observations are cur- rently being made by USACE personnel observ- ing from the shore or a nearby structure such as a
bridge, dam, lock, or levee. Visual observations using still and video cameras are the most com- mon type of data collection method. Some instru- ments or methods to collect data from the ice sur- face (e.g., ice thickness kit) are used by a number of Districts, but require intensive human effort. The use of DCPs is fairly common, but they are typi- cally used to measure stage, discharge, and a few meteorological conditions.
The three types of USACE projects most often impacted by ice are flood control structures, navi- gation traffic, and locks. Freezeup problems alone predominate over breakup problems alone for all operations and structures included in the survey except flood control structures. The number of projects impacted by both freezeup and breakup is equal to the number affected by freezeup alone.
Currently, ice data are predominantly stored in paper form. The information being stored digitally on computer is being stored in several different formats. The survey results indicate much poten- tial for automating the storage and retrieval of ice data, but the willingness of observers to convert to computer storage was not gauged.
The survey results are useful in identifying gen- eral trends in collection of ice-related data by the USACE, and provides some guidance for future instrumentation development. More quantitative analysis and interpretation is limited by missing data and some conflicting responses. Overall, how- ever, the survey results do indicate there is poten- tial for increased use of existing instrumentation and that some new types of instrumentation are desired.
INSTRUMENTATION EVALUATION
Capabilities of existing instrumentation and observation methods
All USACE Districts maintain some level of in- strumentation to observe various hydraulic and hydrologic parameters, but the quantity and types of ice observations vary greatly between Districts. This may be a reflection of the severity of ice prob- lems experienced or of knowledge of the impor- tance of ice data collection. The end use of the measurement data appears to affect how "high-" or "low-tech" the measurement devices are. For example, stage may be visually inspected and re- corded once a day in a log book by personnel at one project location, while another individual may be interested in continuously monitoring the rise and fall of stage at multiple locations during
11

freezeup and breakup periods. The instrumentation survey results indicate that
observations of various hydraulic and ice param- eters are being made visually on-site, and the ob- servers seem to be generally satisfied with current practices. The responses to the survey do not gen- erally indicate much desire to make measurements of more parameters, but unfortunately the survey did not gauge how willing personnel would be to automate those observations already being made in lieu of performing on site observations. The more commonly used instruments and observa- tion methods employed by responding Districts are listed below along with some of the advan- tages and disadvantages of these instruments. A good reference for ice data collection is White and Zufelt (1994).
Stage As the survey indicated, the hydraulic param-
eters most commonly measured by Corps of En- gineers Districts are stage and discharge. For open water conditions, discharge is usually determined from a rating curve that relates a specific discharge to a specific stage. The stage-discharge relation- ship for ice-affected flows is often far more com- plex and depends greatly upon ice conditions (Rantz et al. 1982b). Some of the most commonly used measurement means used in USACE Dis- tricts are described below.
Stage can be measured either visually or re- motely. One of the easiest means of obtaining stage is to use a staff gage that is installed either perma- nently or temporarily, depending on needs of the users. Staff gages vary from the standard USGS porcelain-enameled iron gage with markings ev- ery 0.02 ft (0.6 cm) (Rantz et al. 1982a) to a two-by- four with markings every 6 in. (15 cm). Perma- nent gages should be attached to (or painted on) permanent structures such as bridges or drainage structures, or located in sheltered areas, such as an area of heavy vegetation, to protect against ice and debris action. Permanent gages can be in- stalled along a river bank, but they may be sub- ject to heavy ice damage. Temporary gages can be installed during flood emergencies to monitor stages in areas not otherwise monitored. These gages can be subsequently reclaimed and reused, but must be installed in the water, or an area ex- pected to be underwater, to be effective. This could pose a very serious threat to installation person- nel during an ice jam flood event as water tem- peratures will be very low.
The greatest advantage to the use of a staff gage
is that virtually anyone can make a reading with very little training. The other advantage of staff gages is that they can be installed virtually any- where for relatively little cost and usually require little maintenance. However, there are several dis- advantages to the use of a staff gage. Stage can only be measured at the time of observation, which often means that the peak stage at a location is not measured. Measurements are limited to daylight hours, unless the gage is in a well-lit area. Flood- ing or poor weather conditions may make access to the gage impossible or make the gage difficult to read accurately, even with binoculars. Often, personnel requirements make frequent gage read- ings impossible, especially if gages are spread over a wide area.
Wire weight gages (Rantz et al. 1982a) consist of a weight attached to a cable wound in a single layer around a drum (Fig. 7). The gage is contained in an aluminum box that is mounted on a bridge. Inside the box are a calibrated disk that the cable passes over when it is lowered to the water sur- face, and a counter that records the distance the calibrated disk moves. Stage is calculated from the counter value when the box is placed a known height above the streambed. A chain gage is simi- lar to a wire weight gage except that the weight is attached to a chain which passes over a pulley. As the weight is lowered to the stream surface, the chain moves along a marked horizontal gage from which the distance moved is calculated (Bureau of Reclamation 1984). Wire weight gages and chain gages have virtually the same disadvantages as for staff gages, with the additional disadvantage that relatively few individuals have the training or access required to make such measurements, and the wind can blow the weights, causing the reading to be larger than actual (Bureau of Recla- mation 1984).
High water marks can be determined follow- ing a flood event, either by examination of a verti- cal or near-vertical surfaces for evidence of the waterline, or by looking for ice scars on trees (White and Zufelt 1994). Ice scars are areas of damage to a tree trunk, usually caused by mov- ing ice. The disadvantages of high water marks are that funding may not always be available to do the required surveys, rainfall following a high water event can obliterate high water marks be- fore they can be set, and additional flooding can obliterate high water marks before they can be surveyed.
One means of automating the collection of stage information is the use of a water-stage recorder.
12
Chain Index Mark (M)
Weight
Figure 7. Chain gage used to measure stage (after Rantz et al. 1982).
Various types of stage recorders have been used for a number of years (Rantz et al. 1982a). One of the most commonly used recorders is a pen re- corder with rotating drum. These instruments are reliable and accurate for recording stage and are relatively inexpensive to install and operate. How- ever, they can suffer a number of mechanical prob- lems that require relatively frequent checks. For example, the clock mechanism for driving the drum may not operate at the proper speed, the pen may run out of ink, or the float system may freeze in place during cold weather. The strip charts require regular visits to replace, and stor- age requirements for several years' worth of strip charts may become cumbersome. Stage must be read directly from the strip chart and can be read incorrectly, especially from charts with reversing pen mechanisms.
Another means of automating the collection of stage is through the use of recorders equipped with digital record and readout. The use of such instru- ments for measuring stage is quite common in the USACE, especially at sites with DCPs, and they are often connected to a pen recorder. Stage is fre- quently determined by converting the hydrostatic head on a submerged orifice line to a specific stage. Mercury manometers were frequently used until recently; most of these have been replaced due to environmental health concerns relating to poten-
tial mercury exposure. Pressure transducers now routinely used are capable of measuring stage to within 0.01 ft (3 mm). Pressure transducers are very versatile as they can be installed in a variety of situations. They have no mechanical parts, so they do not suffer from as many breakdowns. One disadvantage is that the orifice lines can clog, par- ticularly on streams with a high silt and clay load, causing readings to be in error until the lines can be backflushed to clear the obstruction. Telemark systems are still used at some remote sites, but the advent of DCPs has reduced the use of this remote monitoring querying method.
Discharge Direct discharge measurements are generally
made by the USGS (Rantz et al. 1982a), although some Districts maintain the capability to make discharge measurements at selected locations. The USGS uses Price-type vertical shaft meters to mea- sure discharge. One of the disadvantages of this type of meter is that a discharge measurement at one location on a large stream can be very time- consuming; unsteady flow can introduce error. Another disadvantage is that the measurement provides only an instantaneous measurement of discharge; a sharp peak during an ice-event might be missed entirely. Price meters may also be af- fected by ice or cold water, reducing the accuracy
13

of the measurements, as the metal rotor tends to catch floating slush, or frazil, ice (Crantz et al. 1982a). However, since 1988, the USGS has used the modified yoke Price-type winter meter as the standard meter for discharge measurement through an ice cover, allowing the use of solid plas- tic rotors during slush ice conditions to reduce rotor plugging (Wagner 1994).
The current USGS standard method of dis- charge measurement of ice-covered streams (Rantz et al. 1982a) requires the drilling of holes in the ice through which the current meter is immersed (un- less open water exists relatively near the gaging station). The use of the ice surface as a working platform can lead to concerns for personnel safety and cause some unique problems. Discharge mea- surements collected under ice cover conditions are generally considered to have greater uncertainty than discharge measurements made under open- water conditions at the same location (Cobb and Latkovich 1986). Ice does not even have to be present to affect the stage-discharge relationship; it has been demonstrated that decreases in water temperature have an apparent impact on bed roughness (Colby and Scott 1965, USAED, Omaha 1969). Discharges during an ice jam can create stages vastly different than from a stage-discharge curve; some type of on-site observation is almost always needed to verify if stages at a gaging loca- tion are being affected by ice during a freezeup or breakup event.
Most reported discharges are determined from a stage-discharge curve. Some USGS offices main- tain separate rating curves for open-water and ice- covered flow, but typically the USGS has not cor- rected the daily discharges for ice effects until af- ter ice out, using the hydrographic and climatic comparison (Walker 1991). Walker (1991) con- cluded that analytical methods could be better than the subjective hydrographic and climatic comparison, but recommended further refinement and investigation. Further work by Walker (1994) suggests nationwide implementation of a method he calls the "first-visit complete-profile" for use in improving the accuracy of discharge measure- ments under ice covered conditions. Wagner (1994) notes that during the work of Mel eher and Walker (1992) in Iowa in the 1987-88 season a computer program was developed that allowed for daily discharge adjustments via computer monitor, based on other nearby weather data and discharge hydrographs. Wagner further states that this ca- pability is being incorporated into USGS nation- wide streamflow computer programs.
Air and water temperature Air and water temperature are relatively easy
to collect remotely, but some difficulties are still encountered. Air temperature is almost always col- lected at project sites using a mercury thermom- eter or some type of digital thermometer, or tem- peratures are collected from the nearest National Weather Service site. As with any other type of instrument, a thermometer must be placed cor- rectly in order to obtain a good reading. Accuracy to the nearest degree is often all that is desired (and needed) for air temperature.
Such is not always the case with water tempera- ture measurements. Frazil ice forms when water supercools below the freezing point by only a few hundredths of a degree (Ashton 1986). However, if the temperature measurement device is only accurate to the nearest degree, water temperatures of nearly 0.5°C (warm enough to melt ice) and -0.01°C (supercooled) will both register as 0°C. When estimates of frazil ice production are needed (e.g., estimating when heavy frazil ice production may begin to impact navigation traffic, or when river intake structures might be affected), an in- strument capable of reading to the nearest 0.01°C may be needed. Typically, a glass-bead thermistor is used in such situations. Generally, these ther- mistors are used in conjunction with a digital multimeter for determining temperatures. They can be permanently installed and connected to a data logger or DCP for recording temperature data. When connected to a DCP, a voltage divider circuit that converts resistance to voltage is needed. A good reference for permanent thermistor instal- lation guidelines can be found in EM 1110-8-l(FR) (USACE1990). Each thermistor is hand-made and must be individually calibrated. The resistance of the calibrated thermistor is used in the Steinhart- Hart equation, usually with three terms, to deter- mine temperature.
Thermistors are theoretically capable of a tem- perature accuracy within ±0.01-0.02°C, but exami- nation of water temperature records at a specific DCP site can reveal variations of several degrees one day, consistent readings the next day, and missing records the day after. It may seem when going back over temperature records that such problems occur most frequently during the most crucial freezing periods, but this may seem so only because they are the periods of most interest (and most scrutinized). Possibly this problem is not with the thermistor itself, but with other components in the DCP system being adversely affected by cold air temperatures.
14
Ice thickness The standard CRREL ice thickness kit contains
a two-part iron bar used to test the ice for safety, an auger with carbide-tipped bit and bit brace for drilling holes, extension rods to increase the depth to which holes can be drilled, and a de- vice to measure ice thickness (White and Zufelt 1994). A small diameter auger is preferred because holes can be drilled faster, but a minimum diam- eter of 2 in. (5 cm) is recommended if velocity mea- surements are desired. Thickness is measured us- ing a tape equipped with a hinged weight at the end (Ueda 1983). The weight and tape is lowered through the hole, usually until the weight hits bottom so that total depth of flow is known. The tape is then pulled upward until the weight en- counters the ice bottom and catches on the ice. It is then read so that the thickness is known. The measurement can be complicated if frazil is present underneath the ice surface, but with a little prac- tice the observer can differentiate between the frazil and solid ice. If frazil is present, both the depth to bottom of frazil and bottom of solid ice should be recorded. After the tape is read, the weight is hinged, or folded, and pulled back up through the hole. This method is relatively quick and accurate. One disadvantage of this method of measuring ice thickness is that of safety for indi- viduals going on the ice cover. Another disadvan- tage is that only a solid ice cover strong enough to support the weight of the observers can be mea- sured; floating frazil or very thin ice cannot be measured. The thickness of an ice jam could be measured in this manner, but unless the jam is grounded and/or frozen in place, it would be highly inadvisable to attempt such a task due to safety reasons.
Sherstone et al. (1986) report on the use of "hot- wire" resistance gages to measure ice thickness in the MacKenzie Delta. The gages are installed af- ter the initial formation of the ice cover. An 18- gauge chrome A resistance wire of known length is suspended from a platform above the ice sur- face through a hole drilled in the ice. The resis- tance wire is weighted on the bottom. A second, insulated, wire is connected to the bottom of the resistance wire. Once the hole refreezes, ice thick- ness can be measured by applying a current to the resistance wire, heating it, and raising the wire until the weight hits the bottom of the ice thick- ness. The ice thickness can then be determined by measuring the amount of resistance wire remain- ing above the surface. This method has the same disadvantages as the drilling method described
above, with the added disadvantage that the wires can break.
The USGS, in making discharge measurements through an ice cover, measures the distance from water surface to the bottom of the ice cover, so that the total ice thickness is not readily known. Some- times, the total thickness will be noted, but not often. Moreover, the thickness is not normally published, but is noted only on the discharge mea- surement notes. If ice thickness measurements at a particular USGS gaging site are desired, a search through the original measurement notes stored at the State or appropriate field office will be neces- sary. This task can be time consuming, but if con- ditions warrant, the average ice thickness can be reported. As an example, the State of Nebraska has set up an ice data collection program (USAED, Omaha 1994) for which the USGS has agreed to report the average ice thickness measured at each gaging location of interest. The thickness is re- ported to the state for inclusion in its database, and is also included in computer files that the Dis- trict Water Control personnel can retrieve.
Visual estimates of an in-place ice thickness are highly subjective and subject to error. An indirect measurement of ice thickness can be made after the ice cover has broken up, when pieces of the broken ice cover that remain on shore can be mea- sured. Observation must take place shortly after breakup, before warmer temperatures or rain can significantly reduce thickness. Ice jam thickness is often estimated based on observation of height of ice shear walls, if they remain, after an ice jam releases. While these indirect methods of thickness measurement are helpful for future use, they are not applicable for making real-time measurements of thickness.
Water velocity Water velocity is usually measured for the pur-
pose of determining stream flow, or determining the effects of ice roughness on flow. Normally, the velocity measurement would be done using a Price-type current meter. This type of meter must be used with care, as it often freezes up, either from contact with frazil ice or when removed from the water. A few Districts do have electromagnetic velocity probes, which have the advantage over Price-type meters in that there are no moving parts to freeze and ice accumulations may be easily re- moved (White and Zufelt 1994). However, Yamaguchi and Hirayama (1990) report the use of an electromagnetic probe as being unsuitable for velocity measurement in frazil-laden flow due to
15

a disturbance of the electromagnetic field by ice. Surface water velocity or ice velocity may be esti- mated by measuring the period of time an ice piece or other small particle takes to traverse a given length in the river.
Ice movement and velocity Ice movement is normally monitored visually
by USACE personnel, usually from a bridge or other structure or from shore but is only moder- ately important judging by survey results. Ice movement may be monitored to determine when and where breakup may be occurring or where moving ice may affect navigation traffic or lock operation. Often ice movement is monitored by local interests or Civil Defense personnel con- cerned about the potential of flooding, but little automation of ice movement monitoring exists at the District level at this time.
A remote means of monitoring ice movement has recently been developed by CRREL research- ers and has been used in the field (Zufeit et al. 1995). A schematic of the ice motion detector is shown in Figure 8. Wires imbedded in the ice are connected to the detector unit, which is then con- nected to a DCP, phone, or some other device ca- pable of transmitting a signal. When the ice cover begins to break up and move, the wires are bro- ken. The detector transmits one signal when the wires are whole, and different levels as each wire is broken. The multiple wire configuration pro-
vides redundancy to reduce the likelihood of a false alarm and to monitor more width of the river against breakup. The detector unit can be set up to handle complex situations as described in Zuf elt et al. (1995), or it can be as simple as a burglar alarm with built-in dialer attached to a telephone. The greatest advantages of the ice motion detector sys- tem are that it is capable of monitoring around the clock at a minimal cost, typically only takes a few hours to install, and is simple to operate. One dis- advantage is that the wires must be installed in the ice every year. The other disadvantage is that the system can only be used for the breakup pe- riod; a stable ice is required to form before the wires can be installed. Rachuk and Rickert (1986) describe the use of a similar concept in Canada on the Athabasca River, using an array of sensors embedded in the ice.
Ice velocity, while not typically monitored, has been measured by a variety of remote methods. It can be estimated by measuring the period of time an ice piece or other small particle takes to traverse a given length of river using a stopwatch and taped distance along the bank. Prowse et al. (1986) re- port a similar method used by the Hungarian Water Conservation Bureau in a reference grid is set up at a particular location in the river through the use of temporary markers in the water and fixed markers on land. Time-lapse photography obtained during freezeup and breakup is com- pared to the reference grid to estimate surface ice
Data Control Platform (DCP)
Detector Unit
Ice Cover
Sensor Wires
River Flow
1 Figure 8. Schematic of ice motion detector connected to DCP (from Zufelt 1993). The detector unit returns different levels of response depending on whether wires a,b,c,d (or various combinations) are intact, allowing the user to determine the extent of ice cover breakup and movement.
16

velocities and ice concentration (Fig. 9). Prowse et al. also tested the use of false-parallax and image- digitizing photogrammatic techniques with large format cameras to determine ice velocities and found them to be quite accurate for surface veloc- ity determination, but limited in value for conver- sion to ice discharge estimates. Images from 35- mm cameras were found to be adequate and much less expensive. Prowse and Demuth (1991) used a theodolite to track the movement of ice pieces to measure velocity. Ferrick et al. (1991) videotaped markers on an ice cover before and during breakup to obtain information on ice velocities.
Ice coverage and ice concentration The areal coverage of ice and the concentration
of moving ice are two parameters that are not of- ten systematically monitored and, according to the survey results, are not considered important pa- rameters to measure perhaps because of the diffi- culty in obtaining accurate information. Areal ice coverage may be monitored from a single vantage point or series of vantage points, but the accuracy of observer estimation decreases with increasing
distance from the observer. Areal coverage of ice is also observed from aircraft. The extent of ice cover can then be documented by 35-mm camera, video camera, or by an individual marking on a map the ice cover locations. The best positioning for a 35-mm camera or video camera to document the ice from aircraft is straight down, as is done for aerial photographs made for mapping pur- poses. Oblique views are also very useful but do not readily allow for scaling of features from the film. The use of aircraft to view ice extent can be beneficial under favorable conditions, but suffers several drawbacks, including high cost and weather conditions that can ground the plane or cause poor visibility for viewing at an adequate altitude. The pilot must follow a suitable flight path at the appropriate altitude to obtain complete coverage. If film or video is used to capture ice coverage, then personnel will view the film or tape to transfer the ice extent to a suitable map. Differ- ent types of ice may be difficult to differentiate from the aircraft or film records. The pros and cons of camera use are discussed further in USACE (1990).
B Targets
Figure 9. Photographic grid method for determining ice velocity and concentration (after Prowse et al. 1986).
17
Ice concentration (i.e., how much of the chan- nel is covered by floating ice pieces) is estimated from visual observations from a structure, shore, or aircraft. Estimating an ice concentration suffers from the same disadvantages as estimation of ar- eal ice coverage. An additional disadvantage is that the estimation is highly subjective. Two indi- viduals viewing the same flow may interpret the concentration of ice pieces as being quite differ- ent, even if given guides demonstrating the dif- ferences between different levels of concentration. Bjerke (1991) reported using a "frame-grabber" to capture and digitize videotaped images of mov- ing ice. The digitized image was rotated through the use of a computer algorithm to provide a ver- tical view, from which ice piece size and concen- tration can be determined. He found fairly reason- able results using this method, although the smaller flow could be discerned.
Developing or future instrumentation Many of the methods of data collection cur-
rently used by USACE Districts rely upon visual observations. Visual observations are inexpensive and easy to make but are highly dependent upon weather and lighting conditions, as well as access. Some of the collection methods require personnel to be exposed to dangerous elements, including cold air temperatures, low wind chill, and ice. Other methods require higher maintenance re- quirements or suffer from more breakdowns or periods of in operation. The observation of some parameters is not deemed to be very important, but this may be due in part to lack of inexpensive, proven observational techniques or instruments.
The survey results support the need for con- tinuing development or refinement of observation techniques or instruments, especially for those parameters that have been identified as most im- portant by District personnel. The use of instru- mentation to remotely monitor ice-related param- eters is not very high in importance in the Corps of Engineers District offices. This can be attributed to several reasons, including high cost, low reli- ability, lack of need or perceived need, and resis- tance to change. Development of future instrumen- tation for field use will require that these issues be addressed. Some codevelopment of instrumen- tation with other agencies, such as the USGS, may be necessary. Continued support by District offices will also be necessary. This section, instrumenta- tion that has been developed to measure various parameters but is not yet ready for widespread field use. The feasibility of implementing such in-
strumentation in the field is assessed, and some ideas for future instrumentation research are pre- sented.
Stage and discharge Stage and discharge were rated the two most
important parameters to measure by survey re- spondents. Stage and discharge are also very com- monly monitored remotely, mostly through the use of a stage recorder connected to a DCP. However, there is potential for development of some por- table or temporary instruments that could be used at various sites with little user interface other than to set up the unit and collect the data.
Ultrasonic instruments have been used for a number of years with varying levels of success. They have the advantage over traditional water level recorders that direct contact with the water is avoided, thus decreasing the incidence of freez- ing and damage by water-borne debris. Ultrasonic instruments are susceptible to rapid changes in air temperature, and wind can disturb the water sur- face enough to cause loss of return signal (Abraham and Hall 1994). The absolute accuracy of the ultrasonic sensor is relative to its range, al- though resolution maybe to 0.01 ft (3 mm). In other words, two sensors with the same range may not have the same accuracy if their relative accuracy varies, or two sensors with the same relative ac- curacy will not have the same absolute accuracy if their ranges differ. Capabilities of individual sensors will vary with manufacturer and cost. It is not known how an ultrasonic sensor would per- form over an ice surface.
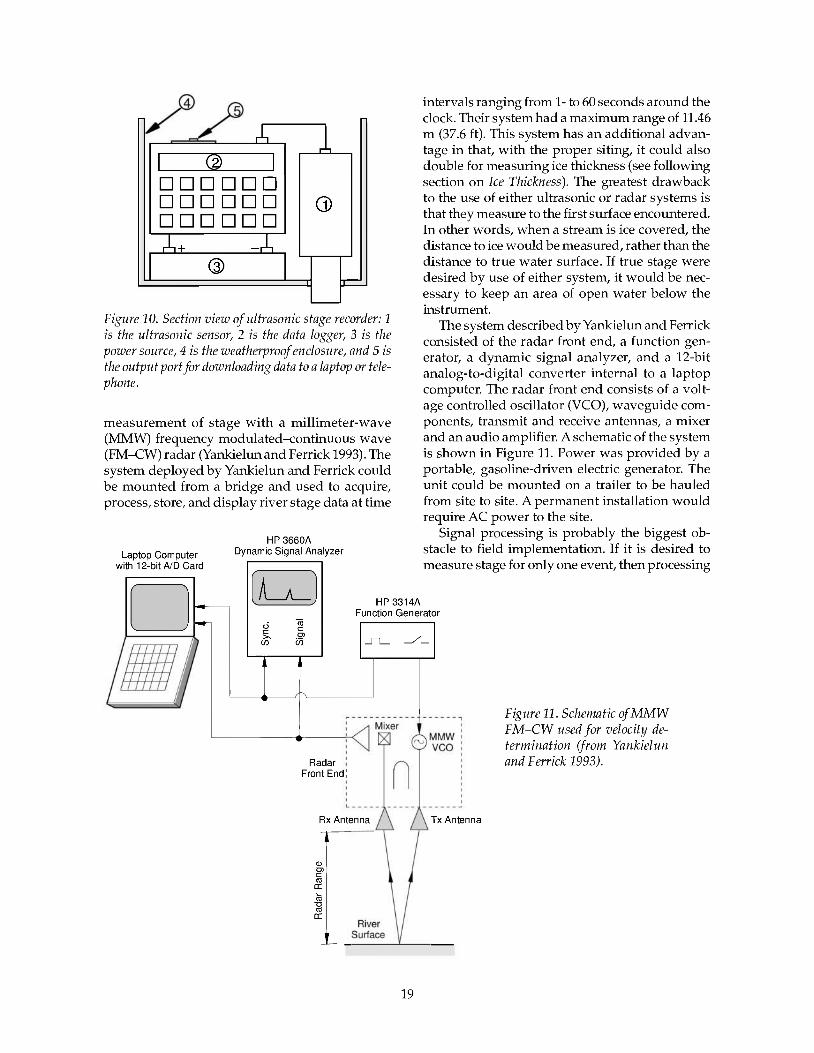
In order to be a truly portable unit, the sensor and its recorder and power source must be self- contained in a small, lightweight package. Such a conceptual package is demonstrated in Figure 10. The unit would need to be contained in a weather- tight box that could either be permanently mounted on a surface such as the side of a bridge or could be temporarily hung over the side of a bridge. If the housing were permanently installed, the components within could be removed and used between various locations. Selection of a data logger and ultrasonic sensor must consider ex- pected operating climate, data requirements and operating parameters. A power source would need to be provided; either a dry-cell battery or a solar cell would probably be adequate.
Radar systems have been used to attempt ice thickness measurements for a number of years. Re- cently, several other potential uses of radar have been explored in research work, including the
18
i I£
DDDDDD DDDDDD DDDDDD
Q)
Figure 10. Section view of ultrasonic stage recorder: 1 is the ultrasonic sensor, 2 is the data logger, 3 is the power source, 4 is the weatherproof enclosure, and 5 is the output port for downloading data to a laptop or tele- phone.
measurement of stage with a millimeter-wave (MMW) frequency modulated-continuous wave (FM-CW) radar (Yankielun and Ferrick 1993). The system deployed by Yankielun and Ferrick could be mounted from a bridge and used to acquire, process, store, and display river stage data at time
Laptop Computer with 12-bit A/D Card
HP 3660A Dynamic Signal Analyzer
A^_
intervals ranging from 1- to 60 seconds around the clock. Their system had a maximum range of 11.46 m (37.6 ft). This system has an additional advan- tage in that, with the proper siting, it could also double for measuring ice thickness (see following section on Ice Thickness). The greatest drawback to the use of either ultrasonic or radar systems is that they measure to the first surface encountered. In other words, when a stream is ice covered, the distance to ice would be measured, rather than the distance to true water surface. If true stage were desired by use of either system, it would be nec- essary to keep an area of open water below the instrument.
The system described by Yankielun and Ferrick consisted of the radar front end, a function gen- erator, a dynamic signal analyzer, and a 12-bit analog-to-digital converter internal to a laptop computer. The radar front end consists of a volt- age controlled oscillator (VCO), waveguide com- ponents, transmit and receive antennas, a mixer and an audio amplifier. A schematic of the system is shown in Figure 11. Power was provided by a portable, gasoline-driven electric generator. The unit could be mounted on a trailer to be hauled from site to site. A permanent installation would require AC power to the site.
Signal processing is probably the biggest ob- stacle to field implementation. If it is desired to measure stage for only one event, then processing
HP3314A Function Generator
Radar Front End I
Rx Antenna Tx Antenna
CO cc 5
cc
Figure 11. Schematic of MMW FM-CW used for velocity de- termination (from Yankielun and Ferrick 1993).
19

could likely wait until after the entire event has been recorded. For random or regular querying of stage, however, some modifications would be required. An instantaneous value of stage could be substantially in error if waves, ice, or debris happen to be passing through the radar scan at that particular moment. Assuming the device is connected to a DCP, a stage value will be queried at the given time interval for the gage (generally every 15 minutes to four hours). A typical proce- dure would be to sample stage for the period of time necessary for adequate accuracy, processing the data, time-averaging the stage values, and transmitting the computed value. This would re- quire the radar to be "told" ahead of time when to sample, which may be difficult if the DCP is in a random report mode. Another option would be to sample stage continuously between DCP que- ries, processing stage data and continuously up- dating the time-averaged stage. The average stage and maximum and minimum stage could then be transmitted (provided the DCP has enough free
channels) and the whole cycle would start over again.
Signal processing requires a fairly robust sys- tem to process and continuously update values, and a fairly decent signal-processing algorithm needs to be developed to account for false values (e.g. if a bird or large debris passed through the radar beam). The unit used by Yankielun and Ferrick was composed of individual components, which is adequate for research instruments, but a field unit would need to be more compact and self- contained. The unit would need careful siting to operate within its operating parameters.
There are occasions when only the peak stage associated with an ice jam event is desired at a remote location. The USGS frequently uses crest- stage gages (Rantz et al. 1982a) in flood flow fre- quency studies to record maximum peak stages in known jam locations. These gages (Fig. 12) con- sist of a galvanized pipe with holes drilled near the bottom that is installed in the streambed. A graduated rod or staff is placed within the pipe at
PI I
2-in. Pipe
3/4-in. by 1/2-in. Measuring Stick
^H
Perforated Tin Cup For Regranulated
Cork
di
3/16-in. Vent Hole
1/4-in. Intake Holes
Section A - A'
1 A A'
Figure 12. USGS crest stage used to measure peak stage (after Rantz et al. 1982).
20

Ice :—[
Stream Bed
Graduated Rod
Figure 13. Conceptual view of maximum stage gage.
a known datum. A perforated cup or cone filled with regranulated cork or similar substance is at- tached to the lower end of the staff. As the water level rises within the pipe, the cork is floated out of the cup, and it will adhere to the walls of the pipe and the staff at the highest level that the wa- ter reaches. The staff is removed from the gage and read as soon as the water level drops to safe lev- els. These gages are low-cost, with reportedly good reliability and low maintenance. Keeping the wa- ter within the pipe liquid is important during win- ter operation, perhaps by heating the pipe or in- stalling a solar cell at the top of the pipe to power heating coils or a small bulb.
Another possible maximum stage recorder would be an adaptation of a maximum-minimum stage gage described by Zabilansky et al. (1992), in which a float of some type is fitted between two washers over a 3/4-in. (19-mm) pipe that is in- stalled in the streambed. During the winter, ice attaches to the float and, as the float is moved up and down by ice action or waves, the washers are pushed up and down on the pipe, recording wave maxima and minima. A similar device could be used to record maximum stage during an ice (or open-water) event. A conceptual drawing of such a device is shown in Figure 13. The greatest chal- lenges to implementing such a device is to design the rod to withstand the lateral and uplift forces exerted by ice and keep the float from freezing to the rod. The use of a dark material for the float and rod would help avoid freezing of the float to the rod. The float would require some type of spring mechanism that would prevent it from slid- ing down the rod when stage recedes, but allows the observer to release the spring to reset the float every year (or every flood event if desired). A so- lar collector panel could be mounted to the top of
the rod, and heating coils could be put inside the rod to help keep ice from forming on the rod.
With either of these devices, the stage could be read at a later date as time and weather conditions permit, as long as a flow with higher stages does not occur in the interim. One drawback is that the date and time of the peak must be estimated. Sev- eral such devices could be put into place along a relatively short stretch of river to obtain jam pro- files, or a network of such devices could be used to supplement USGS gaging locations for record- ing the peak stages associated with ice jams at known jam locations, since USGS gages are not always located near a jam. The gages would need to be accessible on foot.
Air and water temperature Air and water temperature were the next two
most commonly desired parameters for monitor- ing. Remote monitoring of each is already quite readily done at DCP sites. In the survey, the in- strumentation already in use appears to be accept- able. There are reported occasional problems with thermistors used in conjunction with DCPs. It is unknown whether these problems are with the thermistors themselves, with the associated equip- ment at the DCP site, or due to other factors such as poor or improper maintenance of the equip- ment.
Ice thickness Ice thickness is currently most frequently mea-
sured either by drilling through the ice cover and measuring the thickness or by visual inspection from the shore or other vantage point. The short- comings of both methods were pointed out ear- lier. Several other techniques have been used in this and other countries (Adams et al. 1986) that
21
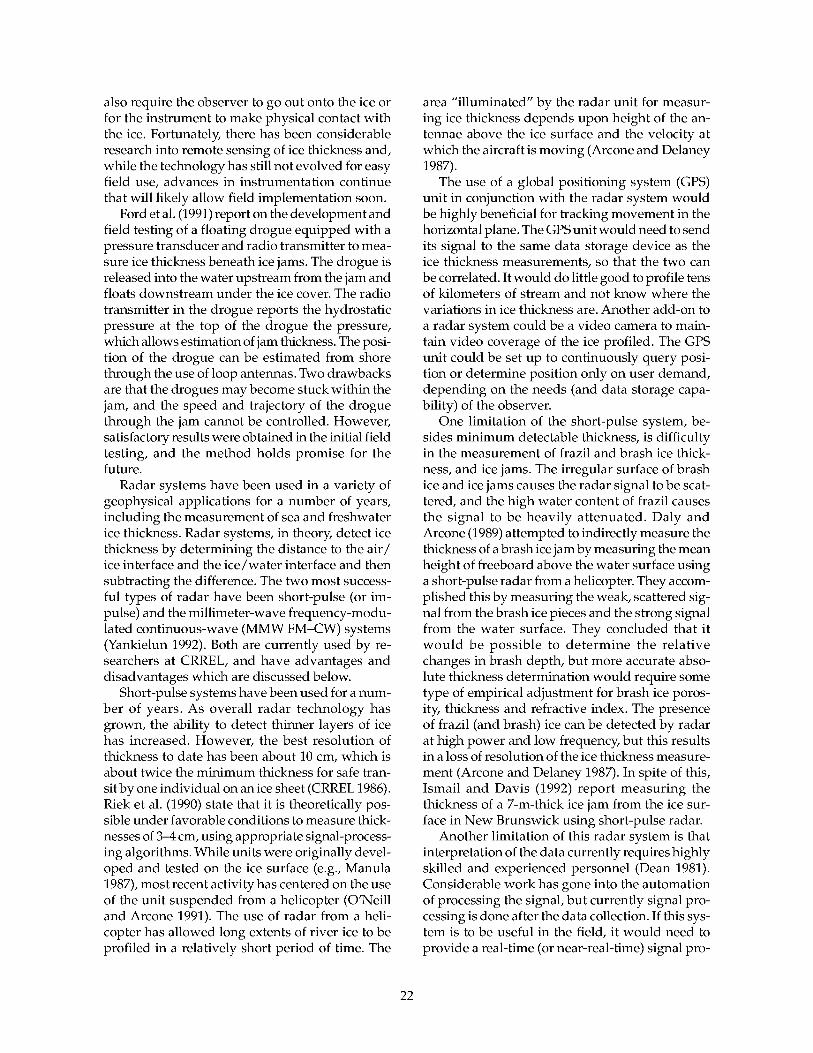
also require the observer to go out onto the ice or for the instrument to make physical contact with the ice. Fortunately, there has been considerable research into remote sensing of ice thickness and, while the technology has still not evolved for easy field use, advances in instrumentation continue that will likely allow field implementation soon.
Ford et al. (1991) report on the development and field testing of a floating drogue equipped with a pressure transducer and radio transmitter to mea- sure ice thickness beneath ice jams. The drogue is released into the water upstream from the jam and floats downstream under the ice cover. The radio transmitter in the drogue reports the hydrostatic pressure at the top of the drogue the pressure, which allows estimation of jam thickness. The posi- tion of the drogue can be estimated from shore through the use of loop antennas. Two drawbacks are that the drogues may become stuck within the jam, and the speed and trajectory of the drogue through the jam cannot be controlled. However, satisfactory results were obtained in the initial field testing, and the method holds promise for the future.
Radar systems have been used in a variety of geophysical applications for a number of years, including the measurement of sea and freshwater ice thickness. Radar systems, in theory, detect ice thickness by determining the distance to the air/ ice interface and the ice/water interface and then subtracting the difference. The two most success- ful types of radar have been short-pulse (or im- pulse) and the millimeter-wave frequency-modu- lated continuous-wave (MMW FM-CW) systems (Yankielun 1992). Both are currently used by re- searchers at CRREL, and have advantages and disadvantages which are discussed below.
Short-pulse systems have been used for a num- ber of years. As overall radar technology has grown, the ability to detect thinner layers of ice has increased. However, the best resolution of thickness to date has been about 10 cm, which is about twice the minimum thickness for safe tran- sit by one individual on an ice sheet (CRREL 1986). Riek et al. (1990) state that it is theoretically pos- sible under favorable conditions to measure thick- nesses of 3-4 cm, using appropriate signal-process- ing algorithms. While units were originally devel- oped and tested on the ice surface (e.g., Manula 1987), most recent activity has centered on the use of the unit suspended from a helicopter (O'Neill and Arcone 1991). The use of radar from a heli- copter has allowed long extents of river ice to be profiled in a relatively short period of time. The
area "illuminated" by the radar unit for measur- ing ice thickness depends upon height of the an- tennae above the ice surface and the velocity at which the aircraft is moving (Arcone and Delaney 1987).
The use of a global positioning system (GPS) unit in conjunction with the radar system would be highly beneficial for tracking movement in the horizontal plane. The GPS unit would need to send its signal to the same data storage device as the ice thickness measurements, so that the two can be correlated. It would do little good to profile tens of kilometers of stream and not know where the variations in ice thickness are. Another add-on to a radar system could be a video camera to main- tain video coverage of the ice profiled. The GPS unit could be set up to continuously query posi- tion or determine position only on user demand, depending on the needs (and data storage capa- bility) of the observer.
One limitation of the short-pulse system, be- sides minimum detectable thickness, is difficulty in the measurement of frazil and brash ice thick- ness, and ice jams. The irregular surface of brash ice and ice jams causes the radar signal to be scat- tered, and the high water content of frazil causes the signal to be heavily attenuated. Daly and Arcone (1989) attempted to indirectly measure the thickness of a brash ice jam by measuring the mean height of freeboard above the water surface using a short-pulse radar from a helicopter. They accom- plished this by measuring the weak, scattered sig- nal from the brash ice pieces and the strong signal from the water surface. They concluded that it would be possible to determine the relative changes in brash depth, but more accurate abso- lute thickness determination would require some type of empirical adjustment for brash ice poros- ity, thickness and refractive index. The presence of frazil (and brash) ice can be detected by radar at high power and low frequency, but this results in a loss of resolution of the ice thickness measure- ment (Arcone and Delaney 1987). In spite of this, Ismail and Davis (1992) report measuring the thickness of a 7-m-thick ice jam from the ice sur- face in New Brunswick using short-pulse radar.
Another limitation of this radar system is that interpretation of the data currently requires highly skilled and experienced personnel (Dean 1981). Considerable work has gone into the automation of processing the signal, but currently signal pro- cessing is done after the data collection. If this sys- tem is to be useful in the field, it would need to provide a real-time (or near-real-time) signal pro-
22
cessing and display of ice thickness, as well as the capability to store the collected information for later use. The collection of data requires a great deal of storage; as an example, O'Neill and Arcone (1991) point out that with a helicopter speed of 2 m/s and a digitization rate of 25,000 samples/sec- ond, approximately 12.5 MB of data are produced per kilometer of survey.
The MMW FM-CW radar system suffers from most of the disadvantages of the short-pulse ra- dar, but it is capable of doing things that the short- pulse radar unit is not. The FM-CW system is not capable of penetrating water; thus, once the ice surface begins to melt and water begins to pool on the surface, the system would lose ability to determine ice thickness. However, this could be used to advantage if it was used to determine when a previously stable ice cover is nearing breakup conditions. Due to its shorter wavelength, the MMW FM-CW system has been capable of profiling much thinner ice than the impulse radar system has. It can be mounted from a helicopter for ice thickness profiling (Yankielun et al. 1993), and research continues on mounting the radar system from a fixed wing aircraft. This system is likely to be less expensive than the impulse radar system, as the radar front end can be found at most well-supplied electronics stores for under a few hundred dollars. Toikka (1987) also discusses the use of an FM-CW radar for measuring ice thickness.
Rossiter and Crissman (1994) mention the pos- sibility of using upward-looking sonar to deter- mine ice thickness. The sonar sensor would need to be anchored to the river bed below a level which ice could not cause damage. This system would only be capable of point measurements and thus could also be used to estimate ice speed (but not direction).
Cost is likely to be a major factor in implemen- tation of any radar system in the near future. Re- cently, a commercially produced radar unit has been made available from Dedicated Electronics of Chester, New Hampshire, that is capable of point measurements of ice thickness and costs about $20,000. The unit is unproved in the field as of yet and Yufit (1990) report the manufacture of a vehicle-mounted radar unit by the State Hydro- logical Institute in the former USSR, but do not provide details on cost. Yankielun (1992) estimates the cost of his FM-CW radar system at approxi- mately $57,000 if all new components were pur- chased off-the-shelf. Even if the radar front end can be purchased for a few hundred dollars,
there is still a need for a signal processing unit that costs several thousand dollars.
Another method by which ice thickness mea- surements have been made are electromagnetic in- duction methods. CANPOLAR Consultants (1985) reports on several manufacturers with electromag- netic induction instruments used for measuring ice thickness from the ice surface. They also state that electromagnetic induction methods appear to be the most promising technology for remote mea- surement of ice thickness, although a great deal of work is needed for a usable device. Arcone et al. (1987) report on the use of magnetic induction (MI) to detect frazil deposits. They report that the MI method would work best on frazil with low water content and work less well on shallow streams with bottom sediments, such as gravel or gravelly sand, that could be confused for frazil. So far, the use of magnetic induction instruments from an airborne platform does not appear to have been done.
Ice movement and velocity Although ice movement scored comparatively
low in the survey, a recent ice motion detector de- veloped at CRREL (Zufelt 1993) shows great prom- ise for simple and inexpensive monitoring. This unit has been successfully field tested and is prob- ably capable of being installed in the field by ca- pable technicians in each District, although CRREL personnel may be requested to assist on a first in- stallation. Rachuk and Rickert (1986) describe the use of a similar concept in Canada on the Athabasca River, using an array of sensors embed- ded in the ice. The MMW FM-CW radar system described earlier is also capable of detecting ice motion as well as ice velocity with slight modifi- cation (Ferrick et al. 1995). This system has the capability of detecting ice movement in the period before a stable ice cover forms, unlike the unit developed by Zufelt (1993), which requires a stable ice cover or ice jam for installation.
Ice coverage and concentration Rossiter and Crissman (1994) describe the use
of low-light-level television (LLLT) video cameras and marine radar for measuring ice concentration on the Upper Niagara River for the New York Power Authority and Ontario Hydro. Each method had a limited range of observation (less than 3 km). The LLLT cannot be used in dark or snowy conditions and the imagery is subjective to interpretation. Software must be developed to allow the marine radar to differentiate between moving and stationary ice, and the system was
23
described as being more expensive than alterna- tive methods. They also state that systems capable of observing an ice cover can also be used to esti- mate ice speed, if properly calibrated and if trackable ice features are present. The method de- scribed by Bjerke (1991) previously also shows promise for daylight measurements of ice concen- tration, particularly if more sophisticated cameras and computer techniques can be utilized.
Areal ice coverage also was given low ranking in the survey. Typically, as presented earlier, areal ice coverage is currently most commonly observed from an elevated vantage point or from an aircraft. Toikka (1987) describes the use of an impulse radar to measure distribution of frazil under the ice cover using a radar unit towed by a snowmobile. The sig- nal processor and video display used were devel- oped in the Radio Laboratory of the Helsinki Uni- versity of Technology. It seems plausible that if the system could be used to assess distribution of frazil below an ice cover that it could also be adapted for assessing floating frazil distribution, although it is unknown how reliable or accurate this system would be for determining moving ice coverage.
Another method of ice concentration monitor- ing, satellite imagery, currently has limited poten- tial, but as satellite systems capabilities improve, so will the potential for monitoring ice conditions. Gatto (1988a, 1988b, 1989) describes efforts to post- monitor ice conditions on the Ohio, Allegheny, and Monongahela Rivers and Illinois Waterway over a 13-year period using available Landsat images. Gatto notes several disadvantages to the use of Landsat imagery: the number of usable images is limited due to long satellite repeat cycle and fre- quent cloud cover, river ice is not always appar- ent because the instantaneous field of view of the satellite sensors are sometimes insufficient to de- tect the amount and type of ice present, and pho- tographic images do not show all the detail col- lected by Landsat sensors, but computer analysis would be necessary to evaluate the additional in- formation.
McGinnis and Schneider (1978) discuss the use of Landsat, NOAA, and GOES satellites. NOAA and GOES provide much coarser resolution but offer daily coverage, compared to 18-day cover- age by Landsat. However, geostationary satellite imagery is not of much use above 50° latitude, owing to distortion. The authors conclude that op- erational environmental satellites could be used to create an early warning monitoring system.
Gatto (1993) suggests that the synthetic aper- ture radar (SAR) aboard the European Remote
Sensing (ERS) satellite will be capable of provid- ing data on river ice conditions that are necessary for navigating through ice and evaluating the po- tential for river ice jams and ice erosion along shorelines. He notes two limitations on the use of SAR: resolution prevents showing distinct images on rivers narrower than 30-35 m and on shallow streams with boulders above the water level, and the single band and polarization may limit the differences in ice it can detect. Shokr et al. (1996) report the use of ERS-1 SAR images to monitor sea ice conditions along the east coast of Canada and in the Gulf of St. Lawrence. They found that the images were useful in detecting the differ- ence between ice and open water, but that rough- ness and other structural information about the ice was not consistent. Further investigation is needed to more fully develop the potential of SAR imagery.
ASCE (1995) reports that EarthWatch, Inc. plans to launch a system capable of 3- m resolution (pan- chromatic), while systems capable of 1-m resolu- tion will fly by 1997. If this type of resolution will truly be available, remote monitoring of ice cov- erage would be greatly enhanced, even if imag- ery would be available on a 2- or 3-week cycle. Computer analysis of this satellite imagery could be highly beneficial, but it is unknown what the processing requirements or acquisition costs may be for such fine resolution. The processed infor- mation would need to be stored in a format that could be read by CADD or GIS users.
Other parameters/instrumentation Researchers have pursued a number of other
instruments that measure parameters other than those mentioned above, or feature configurations not found in present instrumentation. Some of these systems may merit future consideration, but may or may not be very feasible. A few are pre- sented below.
Hanagud and Craig (1974) describe monitor- ing the underwater acoustics of an ice cover as it is subjected to temperature changes, and trying to develop a correlation between the two as a means of predicting ice breakup. They concluded that for such a system to be effective, measurements would have to be made at several locations, rather than at one location. They also concluded that it would not be good for a general survey, but rather serve as an indicator at critical portions. One applica- tion might be in monitoring or forewarning of unusual or severe ice forces on various hydraulic structures. Bogorodskii et al. (1978) also discusses this concept.
24
A few researchers have developed means of measuring frazil ice at low concentrations in the laboratory (e.g. Lever et al. 1992), but none of the instruments appear promising for field use. As ice concentration measurements were rated very low in the survey this type of instrument would see limited demand until field users have a need to measure frazil mass concentrations.
A method that may be capable of interpreting ice conditions is that of monitoring active and pas- sive microwaves from an ice surface. Melloh and Gatto (1990a) and Melloh et al. (1991) describe the use of passive microwave imagery to monitor river and lake ice conditions near Fairbanks, Alaska. The imagery was obtained from a Ka-band radiomet- ric mapping system (KRMS) mounted from the bomb bay of an RP-3 aircraft. The KRMS differen- tiates between wet and dry snow conditions, and open water areas within ice covered rivers and lakes (Melloh and Gatto 1992). Although the KRMS was not able to readily distinguish f reezeup ice jams from smooth ice, it could be useful for determining large-scale areal ice coverage. The KRMS also appeared capable of imaging fractures in the ice cover of a lake. Active microwave imag- ery was obtained with synthetic aperture radar (C-, L-, and P-band) aboard a DC-8 aircraft. Melloh and Gatto (1992, 1990a, 1990b) report that active microwave imagery can distinguish between rough and smooth ice covers and of detect open water areas within an ice cover. They conclude the C- and L-bands were better at determining sur- face roughness. In both instances, the systems tested by Melloh and Gatto were in development states. Each system may be potentially useful in the future, but further refinement of the instrumen- tation and further investigation into usability in other regions is needed. Additionally, a more con- venient and less expensive platform than the RP- 3 and DC-8 aircraft is needed.
Wagner (1994) states that the U.S. Geological Survey and Environment Canada have both dem- onstrated that acoustic velocity meters (AVM) have potential for collection of stream flow data. AVMs have been successfully used to collect line velocity between transducers, and both agencies plan to continue evaluation of AVMs. Acoustic flow meters are already in fairly widespread use; one example of their use in the USACE would be for discharge measurement in a power plant pen- stock to detect decreases in flow due frazil buildup on trash racks. However, implementation of AVM in the field for stream flow measurement needs a great deal more work, especially in adjusting line
velocity to average channel velocity. Another ex- isting problem with AVMs in stream flow mea- surement that must be corrected is the disruption of the acoustic signal during periods of slush-ice flow. The instrumentation would also need to be installed and protected to reduce equipment losses during ice breakup. If the problems with this in- strument can be worked out, and it can be perma- nently installed at a site, it holds great potential for allowing (if desired) continuous real-time stream flow gaging measurements.
Tsang (1974) proposes a multipurpose instru- ment for winter stream metering, including col- lection of flow velocity at a point, concentration of frazil ice at a point, and velocity of the frazil ice at that point. Flow velocity would be measured by releasing a small volume of conductive solu- tion into the stream and measuring the conduc- tivity between two consecutive pairs of electrical poles. As frazil ice causes a decrease in current between two electrical poles, the instantaneous concentration of frazil could be measured as well. Average velocity of the frazil could be determined by measuring the time displacement of recordings at two points. No development of an instrument prototype appears to have been carried out.
GPS units could be used in the field in conjunc- tion with portable instruments for obtaining posi- tioning in the absence of other information. Use of a single unit yields a horizontal accuracy as poor as 100 m. However, the use of two units, or differ- ential GPS (DGPS), with one unit stationary at a known location, can yield horizontal accuracy as small as a few centimeters. The U.S. Coast Guard is establishing a network of DGPS stations to aid navigation along coastal areas and the Mississippi River. If a user is within range of one of these DGPS stations, then horizontal position can be deter- mined with the use of a single GPS unit in the field. Vertical position can be determined within a few centimeters as well, but the unit must be station- ary for as long as 45-120 minutes. A major draw- back is that the GPS unit must have a clear line of sight to the orbiting satellites; trees may block the signal.
Additional instrumentation configurations to consider
Discharge There are a few instrumentation configurations
not mentioned above that appear technically fea- sible. One would be to combine a short-pulse ra- dar and MMW FM-CW radar to make a discharge
25

measurement device. It has been demonstrated that the MMW FM-CW radar is capable of mea- suring ice velocity, while the short-pulse radar can profile the channel bed if operated at low enough of a frequency. If ice velocity could be correlated to the average stream velocity below it, discharge could be determined by taking the point measure- ments of depth multiplied by ice velocity corrected to an average velocity. This instrument could be mounted on a vehicle and driven over bridges, or it could be mounted on an aircraft flying sections across the river. Some type of GPS unit could be used to determine cumulative distance across the stream as the units collect data. Two constraints of this conceptual system are operating within the range of the radar units and whether the FM-CW system can accurately determine ice velocity while in motion itself. Data processing would be the other constraint of such a system. Several years of work would probably be required to make such a system workable.
Ice volume Another possible use of radar would involve
estimation of ice volume. If the ice cover could be profiled for thickness from an aircraft, it would be possible to estimate volume using average chan- nel widths and open areas. A more precise way to get channel width and open area measurements would be with the use of videography A video camera could be used to capture the river below, and computer processing could be used to pro- cess which areas are covered by ice and which are not. The ice thickness measurement could be in- corporated into this to obtain a cumulative total of ice volume over the reach desired. A drawback to such a system is the range of radar; all airborne radar systems have flown at relatively low alti- tude, while the use of video would require a com- paratively high flight altitude. A radar system could possibly be substituted for the video, but the ice would probably need to be relatively smooth, and it is unknown how accurately radar could measure ice coverage on a wide river if at a low altitude. Such a system is not highly likely to be implemented in the field soon.
Ice velocity It has been suggested* that a radar gun such as
is used for measuring the velocity of a thrown
^Personal communication with Richard T. Pomerleau, Senior Hydraulic Engineer, St. Paul District, U.S. Army Corps of Engineers, 1996.
baseball could be adapted for measuring ice ve- locity. Since these units cost only a few hundred dollars or less, it may be worth investigating its applicability for measuring ice velocity. This would provide a very portable unit for field esti- mation of ice velocity during an ice run, for in- stance. These would only provide an instanta- neous value of velocity at a single point, but still may be useful for random, rather than continu- ous, monitoring.
Stage, ice thickness A commercially available depth finder or fish
finder could potentially be used for measuring stage, ice thickness, or even ice movement. The sensor unit could be positioned on the bottom of the bed and pointed upwards, as suggested in Rossiter and Crissman (1994). The sensor would be able to detect the bottom of the ice cover; if the elevation of the sensor was known and stage mea- sured with another instrument, then the ice thick- ness of a floating ice cover could be approximated. The sensor may possibly be able to detect the wa- ter surface if free of ice; if so, then stage could be determined for open water conditions. The sen- sor may be able to be used to estimate the under surface roughness of an ice run or ice jam, if these events take place above the sensor. Most units have visual display capability; this would make the unit easy to use and best suited for making random measurements. The sensor would need to be per- manently mounted or placed before the ice sea- son to be effective, but the remainder of the depth finder unit could be carried between sensor sites as a portable unit or could possibly be connected to a DCP for a permanent installation. Use with a DCP would require some modification of the unit to convert the signal normally fed to the display screen to a value the DCP could transmit. The rela- tively low cost of a depth finder unit may make it possible to investigate its potential for making these measurements. It may even be possible for biologists to use the depth finder in this configu- ration for detecting fish movement under an ice cover, if desired.
Ice coverage, ice velocity, stage Lasers maybe useful for obtaining measurements
such as ice coverage, ice velocity, and stage, but the ability of laser to make any of these types of mea- surements is unknown. The use of laser, as well as all other optical means, will be limited by particu- late conditions that affect visibility, such as fog, snow, rain, etc.; lasers would not be affected by darkness,
26
however. Lasers can be quite small and inexpensive, and if lasers would be capable of measuring vari- ous parameters, then an inexpensive, compact por- table instrument could be developed.
Summary of instruments The Water Resources Division of the U.S. Geo-
logical Survey has principal responsibility within the Federal government for collecting hydrologic information and appraising the Nation's water re- sources. In order to better serve their field offices, a Hydrologic Instrumentation Facility (HIF) was established in 1980 to centralize (and standardize) instrumentation research, development, testing, evaluation, procurement, warehousing, distribu- tion, repair, and calibration services for USGS in- strumentation. The HIF is located in the National Space Technology Laboratories (NSTL) northeast of New Orleans on the Mississippi Gulf Coast (Wagner 1986). Future budget constraints may re- quire more cooperative effort between Federal agencies, and the HIF would be a good agency to cooperate with in developing instrumentation for certain ice-related measurements.
Table 8 summarizes some of the advantages and disadvantages of different methods and instru- ments. As can be seen, some instrumentation rates highly in terms of ready implementation and low cost, but are in areas that not many users rate high. On the other hand, some of the more promising instrumentation for areas highly rated by users are a few years away from being field-ready and will likely be expensive.
EVALUATE SYSTEMS FOR TRANSMITTING, DISPLAYING, EVALUATING, AND STORING RIVER ICE DATA
An important aspect of data collection that may often be overlooked is the storage and retrieval of data. This section provides a cursory overview of what happens to data once it is collected, includ- ing transmission, display, evaluation and storage. Existing systems are generally adequate for stor- age needs and will continue to be as computer systems evolve.
Transmitting data The first step in storing data involves the trans-
mission of that data once it is collected, whether it be sent from a DCP site hundreds of miles away or recorded in the observer's notebook across town. The trend is toward remote collection of data
in order to reduce personnel costs and safety haz- ards. If data are to be remotely collected, this in- formation needs to be transmitted to a central lo- cation for storage (and processing). A number of sites are already equipped to do this through the use of DCPs. The use of DCPs in the USACE is cov- ered by policy contained in ER 1110-2-248 (USACE 1981) and ER 1125-2-308 (USACE 1986). Data col- lected at a DCP are transmitted via the Geostation- ary Operational Environmental Satellite (GOES) Data Collection System (DCS) operated by the Na- tional Earth Satellite Service (NESS) of the National Oceanic and Atmospheric Administration (NOA A). The USACE is limited to specific channels for data transmission and all data transmitters must be cer- tified by NOAA/NESS prior to implementation. All transmission frequencies must be requested first through the Water Resources Support Center, Data Collection and Management Division (WRSC-C). Obviously, a data site cannot be selected and set up overnight if data are to be transmitted from the site via DCP. The use of the GOES/DCS also requires that only environmental data be transmitted; trans- mission of operational data, such as gate opening, is not allowed.
Remote sites may be queried by phone or radio instead of DCP transmission. Information could be downloaded from the on-site data storage de- vice (e.g., a data logger) to a central computer through a modem. This technology has been com- mercially available for a number of years and may prove more feasible and cost-effective, as modem speeds continue to increase and phone transmis- sion lines improve in quality. The use of cellular phones could allow data collection at sites with portable instrumentation or where telephone lines are unavailable. A cellular phone will only be ef- fective, however, where there is adequate cellular coverage; many sparsely populated or rugged ter- rain areas will not have adequate coverage. Ra- dios can be used at remote sites for transmitting a warning signal, but radio signals may be suscep- tible to disruption in heavily populated areas or during severe weather.
Data collected manually could be sent to a cen- tral site via fax. Processing of the fax on the re- ceiving end would likely entail use of optical char- acter recognition (OCR) software in conjunction with a scanner (software does exist that allows a fax to be used as a scanner, but OCR-capability is unknown). While OCR software is quite good at reading typed pages, it fares more poorly with fax documents and even worse with handwritten documents. Eventually OCR software will be able
27

Instrument
Table 8. Summary of instrumentation investigated.
Application Advantages Disadvantages Time Frame Cost
Staff gage
Stage recorder
Price-type meter
Thermometer
Glass-bead thermistor
Ice thickness kit
Hot-wire gauge
Electromagnetic velocity probes
Aerial observations
Ultrasonic sensor
Radar, short-pulse
Stage
Stage
Discharge
Air/water temperature
Air/water temperature
Ice thickness
Ice thickness
Water velocity
Ice areal coverage
Stage
Ice thickness
Radar, MMW FM-CW Ice thickness
Inexpensive Easy to read Easy to install
Cannot read in dark Can be damaged by floating ice
Commonly used in Maintenance conjunction with DCPs Freezeup during cold Easy to monitor weather remotely
Standard USGS measurement method
Very common use
Measurements during slush ice runs Measurements under ice cover May miss peak
Proper siting Accuracy may not be adequate for frazil ice periods
Highly precise reading Occasional malfunction Easily used in conjunc- or failure tion with DCP's
Standardized Quick measurement possible
No moving parts to freeze
Cover large areas in short time Can use 35-mm camera or video camera in one-person operation Use with GPS unit to gain horizontal position
Highly precise
Accuracy ±10% Profile remotely from aircraft
Safety concerns on ice Cannot go on frazil
Safety concerns on ice Loose frazil deposits may not be detected
Possibly unsuitable in heavy frazil
Transfer observations to map Cost of frequent observations Weather may impede flight and visibility
Accuracy ±10% Profile remotely from aircraft Multipurpose instru- ment potential
Temperature sensitive
Cost Interpretation requires highly skilled personnel Signal processing
Interpretation requires highly skilled personnel Signal processing Inability to penetrate thin water layers on top of ice
A \ A
Radar, MMW FM-CW Stage (cont.)
Multipurpose Spot observations instrument potential
1 A'
28

Table 8 (cont'd). Summary of instrumentation investigated.
Instrument Application Advantages Disadvantages Time Frame Cost
Ice velocity
Ice movement
Maximum stage gage/ crest-stage gage
Stage
Upward-looking sonar Ice thickness
Floating drogue
Ice motion detector
Satellite
Ice jam thickness
Ice movement
Ice coverage
Underwater acoustics
Microwaves
Acoustic velocity meters
Ice movement (breakup)
Ice conditions
Discharge
Electromagnetic induction
Lasers
Ice thickness
Multiple
Multipurpose instrument potential
Multipurpose instrument potential
Allow accurate readings after flood
Also usable to estimate ice speed
Safe remote method
Interpretation requires highly skilled personnel
Need to eliminate chance for false alarms
Must resist ice forces Unknown reliability
Point measurement Unknown reliability
Speed/trajectory not controlled
Inexpensive Reliable Around-the-clock monitoring
Cover very large area
Shows potential for some monitoring
Being tested by USGS Shows promise of unattended, continu- ous discharge measure- ment Could be used in conjunction with DCP
Can be installed only after ice cover forms
Resolution of present sensors Timeliness of data Clouds /darkness impede some sensors Cannot distinguish some ice types
Not widely tested
Needs more testing Convenient platform needed
Susceptible to ice damage Slush-ice run disrupts signal Needs more work and field testing
Needs more field testing
a\ A'
1 A'
A 1 A'
e\ \ A
A 1 A"
A VVVV
AAA'AA'
A A VA
Potentially low-cost Unknown applications
A ::A W
A ;A VA'
Key: Time Frame:
Cost:
r) v i^AAAAA'
Already in use.
Field tested, probably could be made field-ready within five years.
) Requires more research for field use, or not yet tested.
Relatively low cost Moderate cost High cost
29
to handle fax and handwritten documents as well as typed documents.
Another possible method of data transmission that has exploded in usage recently is electronic mail, or e-mail. Most e-mail systems allow the sender to attach a file to a transmitted message. The sender and receiver must either use compat- ible e-mail systems or the sender must be certain that the e-mail system allows the file format in- tegrity to be preserved as it passes through the gateway router. Nonetheless, e-mail allows for simple data transmission, and if a standard form were used, easy data reduction could be attained.
Data can also be transmitted through the World Wide Web. A password-protected web site can be developed that will allow ice observations to be input directly into a database. The observations are then available to any who query the site. This system is currently used in Nebraska by ice ob- servers (address http://cavent.nrc.state.ne.us/ cgi-win/icejam.exe). It is expected that this type of data transmission will increase due to its rela- tively low cost and high transmission speed.
Displaying and evaluating data Systems for displaying and evaluating data
have changed tremendously, and will continue to change, as computer systems become more and more powerful. Computer industry standards for graphics display are commonplace and should remain so. Development of software capable of data evaluation or editing is likely to be much more fluid. More and more programs are turning to graphical user interfaces (GUIs). GUIs provide a user-friendly front-end for otherwise complex models or databases. Any future software devel- opment by the USACE should take advantage of GUI's, as the number of computer users well- versed in DOS and UNIX commands continues to decline. Future software developed should allow on-screen data manipulation with the data input device (e.g., mouse) as well. While the DOS oper- ating system on IBM-compatible platforms has dominated the market (numbers-wise) over the past 10 or 15 years, the continuing emergence of the Windows system has driven DOS further and further from the ordinary user. More programs will be developed that are Windows-compatible only, leaving DOS-only users with fewer choices for up- to-date software. Users of Apple and UNIX plat- forms also have fewer commercial software pack- ages available, although each of these platforms offers certain advantages over the IBM-compat- ible platform.
Storage and retrieval of data Data storage and retrieval are vital to any data
collection effort. Over the years, a tremendous wealth of data has been collected in numerous for- mats by many individuals. The preponderance of data can be overwhelming if stored on paper or maintained in multiple formats (e.g., multiple years of hourly release data from a reservoir project). Rapid increases in computer power per- mits enhanced levels of detail in collected data. While it might be cost-prohibitive to transfer large amounts of existing data on paper into a usable digital format (at least for now), the need for a corporate database usable by all individuals is es- sential to the future retrieval of information cur- rently being collected and stored.
Although there are many commercially avail- able databases available to choose from, the HECDSS database system developed by HEC (1990) is widely used within the USACE because it was specifically developed for water resource studies. It is especially well-suited to storage and retrieval of time-series data sets, but at this time DSS is used primarily within the Water Control and Hydraulics and Hydrology arenas. This is largely due to the development of DSS as a water resources database, but could also be attributed to the user-unfriendly interface of DSS. There is probably little need for everyone to be a DSS-user, but some type of interface, either GUI or GIS, could be developed that could import and export data from DSS, as well as allow querying for casual users.
A GIS interface is currently under development by the Remote Sensing Lab at CRREL for the Omaha District and Missouri River Division. Cur- rently, the system is set up to allow querying of DCP data (stored in DSS) through an Arcinfo/ Arcview interface. It is also set up to allow dis- play of selected satellite images and NWS NEXRAD radar images. The graphical display shows the Missouri River basin and magnified views of areas selected on the display. The ability to highlight all stations above flood stage will be added. The user is allowed to query the selected gage site and have the area displayed. Develop- ers report that, once the basic interface is running correctly, it will be relatively easy to adapt to other Districts or Divisions. A little modification is prob- ably required to export in a user-specified format, but this should be possible. Importing data may be more difficult into the DSS database through this interface, but it would not be wise to allow users to import data or otherwise edit data with- out specific privileges.
30
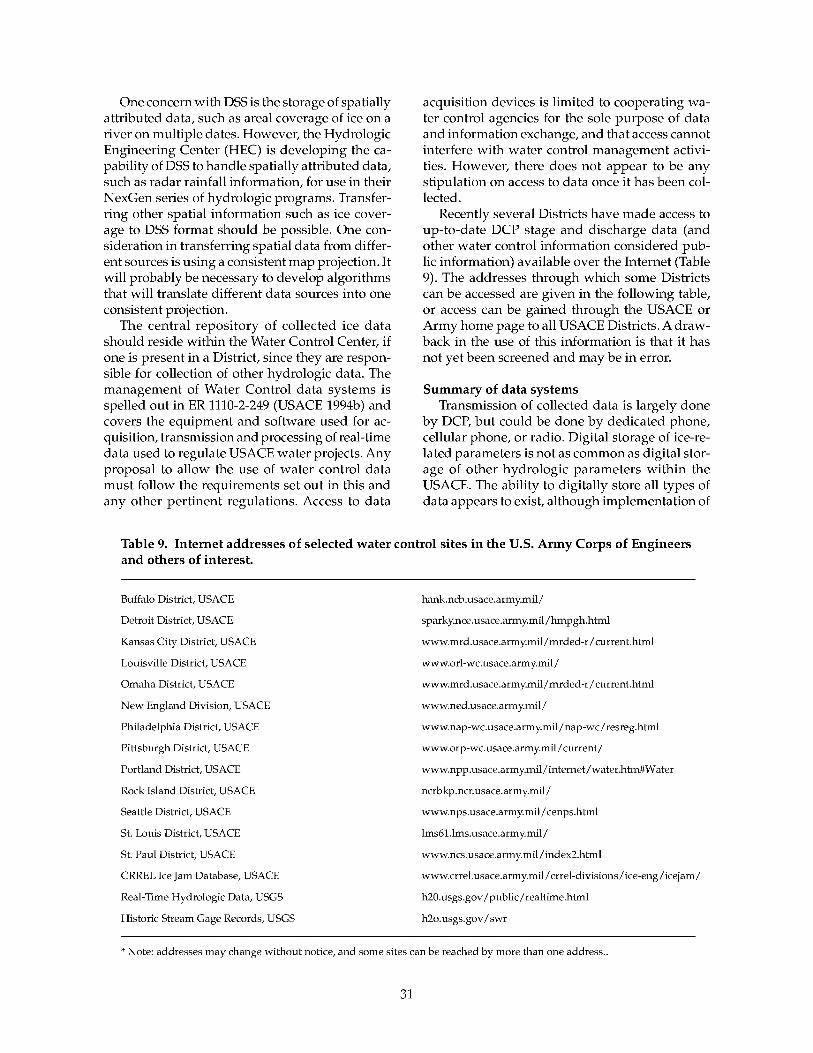
One concern with DSS is the storage of spatially attributed data, such as areal coverage of ice on a river on multiple dates. However, the Hydrologie Engineering Center (HEC) is developing the ca- pability of DSS to handle spatially attributed data, such as radar rainfall information, for use in their NexGen series of hydrologic programs. Transfer- ring other spatial information such as ice cover- age to DSS format should be possible. One con- sideration in transferring spatial data from differ- ent sources is using a consistent map projection. It will probably be necessary to develop algorithms that will translate different data sources into one consistent projection.
The central repository of collected ice data should reside within the Water Control Center, if one is present in a District, since they are respon- sible for collection of other hydrologic data. The management of Water Control data systems is spelled out in ER 1110-2-249 (USACE 1994b) and covers the equipment and software used for ac- quisition, transmission and processing of real-time data used to regulate USACE water projects. Any proposal to allow the use of water control data must follow the requirements set out in this and any other pertinent regulations. Access to data
acquisition devices is limited to cooperating wa- ter control agencies for the sole purpose of data and information exchange, and that access cannot interfere with water control management activi- ties. However, there does not appear to be any stipulation on access to data once it has been col- lected.
Recently several Districts have made access to up-to-date DCP stage and discharge data (and other water control information considered pub- lic information) available over the Internet (Table 9). The addresses through which some Districts can be accessed are given in the following table, or access can be gained through the USACE or Army home page to all USACE Districts. A draw- back in the use of this information is that it has not yet been screened and may be in error.
Summary of data systems Transmission of collected data is largely done
by DCP, but could be done by dedicated phone, cellular phone, or radio. Digital storage of ice-re- lated parameters is not as common as digital stor- age of other hydrologic parameters within the USACE. The ability to digitally store all types of data appears to exist, although implementation of
Table 9. Internet addresses of selected water control sites in the U.S. Army Corps of Engineers and others of interest.
Buffalo District, USACE
Detroit District, USACE
Kansas City District, USACE
Louisville District, USACE
Omaha District, USACE
New England Division, USACE
Philadelphia District, USACE
Pittsburgh District, USACE
Portland District, USACE
Rock Island District, USACE
Seattle District, USACE
St. Louis District, USACE
St. Paul District, USACE
CRREL Ice Jam Database, USACE
Real-Time Hydrologic Data, USGS
Historic Stream Gage Records, USGS
hank.ncb.usace.army.mil/
sparky.nce.usace.army.mil/hmpgh.html
www.mrd.usace.army.mil/mrded-r/current.html
www.orl-wc.usace.army.mil/
www.mrd.usace.army.mil/mrded-r/current.html
www.ned.usace.army.mil/
www.nap-wc.usace.army.mil/nap-wc/resreg.html
www.orp-wc. usace. army.mil / current /
www.npp.usace.armymil/internet/water.htm#Water
ncrbkp.ncr.usace.army.mil/
www.nps.usace.army.mil/cenps.html
lms61.lms.usace.army.mil/
www.ncs.usace.army.mil/index2.html
www.crrel.usace.army.mil/crrel-divisions/ice-eng/icejam/
h20.usgs.gov/public/realtime.html
h2o.usgs.gov/swr
:" Note: addresses may change without notice, and some sites can be reached by more than one address..
31
these means maybe time-consuming or expensive. The continuing evolution of computer systems re- quires that any system developed today for the transmission, display evaluation, and storage of data be fluid enough to be adaptable in the future so that users are not required to learn a new pro- gram every few years.
RECOMMENDATIONS
The results of the survey, combined with an in- vestigation and evaluation of ice data collection instrumentation and data transmission and stor- age systems, provides some idea of the current state of the art in ice data instrumentation and can be used to direct future research. The authors rec- ommend the following:
1. Remote monitoring of ice parameters in USACE Districts is still in the early stages of de- velopment. A few parameters, such as stage and temperature, use equipment that appears ad- equate for present needs. Most other ice-related observations are made manually but can provide excellent information. Continued development of remote monitoring instruments that lessen the dependence on field observers should be pursued. While emphasis should be given to developing in- strumentation that benefits the greatest number of users, other technologies that appear promis- ing and are low-cost should not be overlooked.
2. Although no one system will work for all types of ice, radar systems appear the most prom- ising for remote measurement of ice thickness. One aspect of the radar systems that needs further work before field implementation is signal processing. The final output from a radar system needs to be in a digital format that is user-readable, rather than the graphical output currently used, which is very difficult to interpret for most people. The radar system that appears best suited for field use is the MMW FM-CW radar, as it has demonstrated abili- ties to measure parameters other than ice thick- ness. A compact, self-contained unit with digital readout that can be operated permanently or aeri- ally is feasible and should be developed. Such a unit, if permanently installed, could also be used for measuring stage year-round.
3. The same radar, with slight modification, has also been used to measure ice velocity, which would also make it suitable for detecting ice mo- tion. Additionally, the ice motion detector devel- oped at CRREL (Zuf elt 1993) is an instrument that has been field-proven and is low-cost. Additional
work on making either unit able to transmit warn- ing through a DCP, dedicated phone line, cellular phone, or radio would make each an excellent device for providing warning of ice movement.
4. Aerial photography and videography are used in several Districts, but can require a great deal of time to transfer information to a map. Use of aerial videography and photography could be made much more attractive by use of image pro- cessing software that could automate mapping of ice coverage and ice types. The software must be able to translate each image pixel to a real-world coordinate as well, so that results could be mapped to a CADD or GIS system. Development of such software should be pursued. Unless a digital cam- era were used, photographs would need to be scanned after being printed in order to get into a digital format.
5. The ability to track position concurrently with image procurement or with portable instruments will be necessary in the future, as observations will require a spatial attribute to be used with a GIS system. GPS units are currently the best device available for tracking position, and development of portable instruments, whether for measuring ice thickness, ice coverage, etc., should take into account using GPS units for obtaining position. As GPS has many uses beyond ice instrumenta- tion, other USACE labs could be consulted in de- veloping the proper instrument interface.
6. The use of existing inexpensive devices not typically used for ice measurements, such as a ra- dar gun or depth finder, should be briefly explored in the laboratory for accuracy and feasibility be- fore initiating further study of their potential use. The adaptation of existing low-cost devices should be highly encouraged when possible. More re- search and brainstorming is needed in investigat- ing existing devices that could be adapted for mea- suring ice parameters
7. Information, once collected, needs to be stored in a central repository to be of future value. It is recommended that the Water Control Section of each District maintain ice records, as they main- tain all other hydrologic information. The use of HECDSS should be encouraged for data storage. Development of HECDSS to handle spatially and temporally attributed data should be pursued. The development of a GIS-based interface for query- ing and displaying data should be continued.
8. There are a number of existing and promis- ing technologies that may prove useful for moni- toring ice in the future, given enough resources and time. As funding for instrumentation devel-
32
opment is likely to not be increased in the future, some prioritization of instrumentation develop- ment needs to be established by researchers and users alike. According to Wagner (1986), the USGS already follows such an approach in developing instrumentation needs. An instrumentation devel- opment committee composed of people from dif- ferent USACE Districts and various disciplines should be established to provide guidance to CRREL researchers in instrumentation develop- ment and research for both short-term and long- term needs for District needs. Another function of this committee would be one of technical transfer by making District personnel aware of new instru- mentation development and improvement. The best designed instrument in the world cannot be considered a successful instrument if there are no users interested in the instrument. On the other hand, use of new instruments can only occur when potential users are aware of their existence and capabilities.
LITERATURE CITED
Abraham, D.D., and B.R. Hall (1994) Ultrasonic sensors viable option for water surface measure- ments. USA Engineer Waterways Experiment Sta- tion, Wetlands Research Program Bulletin, 4(2). Adams, W.P., T.D. Prowse, M.A. Bilello, E. Eliassen, S. Freysteinsson, O. Laasanen, T. Pangburn, B. Raab, E. Tesaker, and A. Tvede (1986) Techniques for measurement of snow and ice on freshwater in Nordic countries. In Proceedings, International Northern Research Basins Workshop/Sym- posium, 26-30 January, Michigan Technological Uni- versity, Houghton, Michigan, p. 133-182. American Society of Civil Engineers (1995) Land data satellites improved for engineering survey use. ASCE News, 20(7): 13. Arcone, S.A., and A.J. Delaney (1987) Airborne river-ice thickness profiling with helicopter-bome UHF short-pulse radar. Journal of Glaciology, 33(115): Arcone, S.A., B.E. Brockett, D.E. Lawson, and E.F. Chacho, Jr. (1987) Evaluation of the magnetic in- duction conductivity method for detecting frazil ice deposits. USA Cold Regions Research and En- gineering Laboratory, CRREL Report 87-17. Ashton, G.D., ed. (1986). River and Lake Ice En- gineering, Water Resources Publications, Littleton, Colorado. Bjerke, P. L. (1991) Automatic analysis of floe size distribution during an ice run. In Proceedings, 6th
Workshop on the Hydraulics of River Ice, Ottawa, Ontario, 23-25 October, 1991, p. 297-312. Bogorodskii, V.V., V.P. Gavrilo, V.A. Nikitin, and K.K. Sukhorukov (1978) Feasibility of the radiohydroacoustic method for investigation of ice processes in rivers. Soviet Meteorology and Hy- drology, February 1978, No. 2, p. 47-51. Bureau of Reclamation (1984) Water Measure- ment Manual. Revised Reprint. U.S. Government Printing Office, Denver. Cobb, E.D., and V.J. Latkovich (1986) A summary of methods used by the U.S. Geological Survey for the measurement of streamflow under ice cover. In Proceedings, International Northern Research Ba- sins Workshop/Symposium, 26-30 January 1986, Michigan Technological University, Houghton, Michigan, p. 1-9. Colby, B.R., and C.H. Scott (1965) Effects of wa- ter temperature on the discharge of bed material. Professional United States Geological Survey, Pa- per 462-G. Cold Regions Research and Engineering Labo- ratory (1986) Field guide: freshwater ice crossings. USA Cold Regions Research and Engineering Laboratory, Hanover, New Hampshire. CANPOLAR Consultants Ltd. (1985) Review of floating ice thickness measurement capability, technologies and opportunities. CANPOLAR Consultants Ltd., Toronto, Ontario, Canada. Daly, S.F., and S.A. Arcone (1989) Airborne radar survey of a brash ice jam in the St. Clair River. USA Cold Regions Research and Engineering Labora- tory, CRREL Report 89-2. Dean, A.M. (1981) Electromagnetic subsurface measurements. USA Cold Regions Research and Engineering Laboratory, Special Report 81-23. Ferrick, M.G., P.B. Weyrick, and S.T. Hunnewell (1991) Analysis of river ice motion near a break- ing front. USA Cold Regions Research and Engi- neering Laboratory, CRREL Report 91-18. Ferrick, M.G., N.E. Yankielun, and D.F. Nelson (1995) A Doppler radar for continuous remote measurement of river ice velocity. USA Cold Re- gions Research and Engineering Laboratory, CRREL Report 95-21. Ford, J.S., S. Beltaos, W.J. Moody, and N.K. Madsen (1991) Remote measurement of ice jam thickness. In Proceedings, 6th Workshop on the Hy- draulics of River Ice, Ottawa, Ontario, 23-25 Octo- ber, 1991, p. 269-296. Gatto, L.W. (1988a) Ice conditions along the Ohio River as observed on Landsat images, 1972-1985. USA Cold Regions Research and Engineering Laboratory, Special Report 88-1.
33
Gatto, L.W. (1988b) Ice conditions along the Al- legheny and Monongahela Rivers as observed on Landsat images, 1972-1985. USA Cold Regions Re- search and Engineering Laboratory, Special Report 88-6. Gatto, L.W. (1989) Ice conditions along the Illi- nois Waterway as observed on Landsat images, 1972-1985. USA Cold Regions Research and Engi- neering Laboratory, CRREL Report 89-20. Gatto, L.W. (1993) River ice conditions determined from ERS-1 SAR. In Proceedings Eastern Snow Con- ference and Western Snow Conference, Quebec City, Quebec, p. 113-122. Hanagud, S., and J.I. Craig (1974). Use of acous- tic emission in forecasting ice breakup and ice jams. In Proceedings, International Symposium on River and Ice, Budapest, 14-18 January 1974, p. 115-122. Hydrologie Engineering Center (1990) HECDSS User's Guide and Utility Program Manuals. HEC CPD-45, Hydrologie Engineering Center, Davis, California. Hydrologie Engineering Center (1994) HEC res- ervoir-database network. HEC Training Document 35, Hydrologie Engineering Center, Davis, Cali- fornia. Ismail, S., and J.L. Davis (1992) Ice jam thickness profiling on the Saint John River, New Brunswick. In Proceedings IAHR Symposium on Ice, Banff, Alberta, 15-19 June 1992. Klein, G.S., and G.A. Yufit (1990) Method of ra- dar fresh-water ice measurements from a moving vehicle. In Proceedings IAHR Symposium on Ice, Espoo, Finland, 20-23 August 1990, pp. 1144-1154. Lever, J.H., S.F. Daly, J.H. Rand, and D. Furey (1992) A frazil ice concentration meter. In Proceed- ings IAHR Symposium on Ice, Banff, Alberta, 15-19 June 1992, Vol. 3, p. 1362-1376. Manula, M. (1987) Some new technics in river ice measuring. In Proceedings, Nordic Expert Meeting on River Ice, Espoo, Finland, 2-4 November, 1987, p. 87-93. McGinnis, D.F., Jr. and S.R. Schneider (1978) Monitoring river ice break-up from space. Photo- grammetric Engineering and Remote Sensing, 44(1): 57-68. Melcher, N.B., and J.F. Walker (1992) Evaluation of selected methods for determining streamflow during periods of ice effect, U.S. Geological Sur- vey Water Supply Paper 2378, U.S. Geological Sur- vey, Washington, D.C. Mellon, R.A., D.T. Eppler, L.D. Farmer, L.W. Gatto, and E.F. Chacho (1991) Interpretation of passive microwave imagery of surface snow and ice. USA Cold Regions Research and Engineering
Laboratory, CRREL Report 91-11. Mellon, R.A., and L.W. Gatto (1992) River and lake ice conditions as interpreted from microwave imagery. Presented at Army Science: The New Frontiers, Military and Civilian Applications, Kissamee, Florida (unpublished). Mellon, R.A., and L.W. Gatto (1990a) Interpreta- tion of passive and active microwave imagery over snow-covered lakes and rivers near Fairbanks, Alaska. In Proceedings, Workshop on Applications of Remote Sensing in Hydrology, Saskatoon, Saskatchewan, 13-14 February 1990, pp. 259-278. Mellon, R.A., and L.W. Gatto (1990b) River and lake ice conditions as determined from AIRSAR imagery. In Proceedings of the Airborne Geoscience Workshop, jet Propulsion Laboratory, Pasadena, Cali- fornia, 4-8 June, 1990, p. 37-42. O'Neill, K., and S.A. Arcone (1991). Investigations of freshwater and ice surveying using short-pulse radar. USA Cold Regions Research and Engineer- ing Laboratory, CRREL Report 91-15. Pomerleau, R.T. (1992) Field ice measurements for emergency and project operations: Multi-objective approaches to floodplain management. In Proceed- ings of the 16th Annual Conference, Association of State Floodplain Managers, pp. 246-249. Prowse, T.D., J.C. Anderson, and R.L. Smith (1986) Discharge measurement during river ice break-up. In Proceedings, 1986 Eastern Snow Con- ference. Prowse, T.D., and M.N. Demuth (1991) Measure- ment of freeze-up and break-up ice velocities. In Proceedings, Eastern Snow Conference, p. 325-331. Rachuk, T., and H. Rickert (1986) Real time de- termination of ice breakup. In Proceedings, Inter- national Northern Research Basins Workshop/Sympo- sium, 26-30 January 1986, Michigan Technological University, Houghton, Michigan, p. 83-103. Rantz, S.E. et al. (1982a) Measurement and com- putation of streamflow: Volume 1. Measurement of stage and discharge. U.S. Government Printing Office, USGS Water-Supply Paper 2175. Rantz, S.E. et al. (1982b) Measurement and com- putation of streamflow: Volume 2. Computation of discharge. U.S. Government Printing Office, USGS Water-Supply Paper 2175. Reik, L., R.K. Crane, and K. O'Neill (1990) A sig- nal-processing algorithm for the extraction of thin freshwater-ice thickness from short pulse radar data. IEEE Transactions on Geoscience and Remote Sensing, 28(1): 137-145. Rossiter, J.R., and R.D. Crissman (1994) Assess- ment of instrumentation for application to winter hydropower operations on the Upper Niagara
34
River. In Proceedings, IAHR Symposium on Ice, Trondheim, Norway, p. 744-751. Sherstone, D.A., T.D. Prowse, and H. Gross (1986) The development and use of "hot-wire" and con- ductivity type ice measurement gauges for deter- mination of ice thickness in arctic rivers. In Pro- ceedings, Cold Regions Hydrology Symposium, Ameri- can Water Resources Association, Fairbanks, Alaska, p. 121-129. Shokr, M.E., B. Ramsay, and J.C. Falkingham (1996) Operational use of ERS-1 SAR images in the Canadian ice monitoring programme. International Journal of Remote Sensing, 17(4): 667-682. Toikka, M. (1987) The use of radars to measure the distribution of ice and frazil in rivers. In Pro- ceedings, IGARSS '87 Symposium, Ann Arbor, Michigan, p. 1407-1408. Tsang, G. (1974) Conceptual design of a multipur- pose instrument for winter stream metering. In- terdisciplinary Symposium on Advanced Con- cepts and Techniques in the Study of Snow and Ice Resources, Monterey, Calif., 1973, National Acad- emy of Sciences, Washington, D.C., p. 688-698. Ueda, H.T. (1983) Collapsible restraint for mea- suring tapes. Patent Document, Patent No. 4,375,721. U.S. Army Corps of Engineers (1981) Requirements for water data transmission using GOES/DCS. En- gineer Regulation 1110-2-248, Washington, D.C. U.S. Army Corps of Engineers (1986) Radio fre- quency and call sign assignments. Engineer Regu- lation 1125-2-308, Washington, D.C. U.S. Army Corps of Engineers (1990) Winter Navigation on Inland Waterways. Engineer Manual 1110-8-l(FR), Washington, D.C. U.S. Army Corps of Engineers (1994a) Ice jam flooding; causes and possible solutions. Engineer Pamphlet 1110-2-11, Washington, D.C. U.S. Army Corps of Engineers (1994b) Manage- ment of water control data systems. Engineer Regulation 1110-2-249, Washington, D.C. U.S. Army Engineer District, Omaha (1969) Mis- souri River channel regime studies, Omaha Dis- trict. MRD Sediment Series No. 13B, U.S. Army Corps of Engineers, Omaha, Nov. 1969. U.S. Army Engineer District, Omaha (1994) Lower Platte River ice jam flooding, Section 22 report. U.S. Army Engineer District, Omaha, and USA Cold Regions Research and Engineering Laboratory, Hanover, New Hampshire, Corps of Engineers. Wagner, C.R. (1986) Overview of the U.S. Geologi- cal Survey's Hydrologie Instrumentation Facility. In Proceedings, International Northern Research Ba-
sins Workshop/Symposium, 26-30 January 1986, Michigan Technological University, Houghton, Mich., p. 209-218. Wagner, C.R. (1994). Measurement of streamflow under ice cover in North America. In Proceedings, IAHR Symposium on Ice, Trondheim, Norway, 23- 26 August, 1994, Vol. 2, p. 524-529. Walker, J.F. (1991) Accuracy of selected techniques for estimating ice-affected streamflow. Journal of Hydraulic Engineering, 117(6): 697-712. Walker, J.F. (1994) Methods for measuring dis- charge under ice cover. Journal of Hydraulic Engi- neering, 120(11): 1327-1336. White, K.D. (1996) A new ice jam database. Jour- nal of the American Water Resources Association, 32(2): 341-348. White, K. D., and R. L. Kay (1996) Ice jam flood- ing and mitigation: Lower Platte River Basin, Ne- braska. USA Cold Regions Research and Engineer- ing Laboratory, Special Report 96-1. White, K.D., and J.E. Zufelt (1994) Ice jam data collection. USA Cold Regions Research and Engi- neering Laboratory, Special Report 94-7. Yamaguchi, H., and K. Hirayama (1990) Measure- ments of flow velocity under the ice cover. In Pro- ceedings, IAHR Symposium on Ice, Espoo, Finland, 20-23 August 1990, Vol. 2, p. 1155-1170. Yankielun, N.E. (1992) An airborne millimeter- wave FM-CW radar for thickness profiling of freshwater ice. USA Cold Regions Research and Engineering Laboratory, CRREL Report 92-20. Yankielun, N.E., and M.G. Ferrick (1993) Auto- matic, continuous river stage measurement with a millimeter-wave FM-CW radar. USA Cold Re- gions Research and Engineering Laboratory, CRREL Report 93-24. Yankielun, N.E., M.G. Ferrick, and P.B. Weyrick (1993) Development of an airborne MMW FM-CW radar for mapping river ice. USA Cold Regions Research and Engineering Laboratory, CRREL Re- port 93-1. Zabilansky, L.J., G.E. Frankenstein, and A.M. Tuthill (1992) Observation and measurement of ice movement and sediment transport on the St. Marys River during early opening of navigation, 15-31 March 1992. USA Cold Regions Research and Engi- neering Laboratory, Report to the Detroit District. Zufelt, J.E. (1993) Ice motion detector system. USA Cold Regions Research and Engineering Labora- tory, Ice Engineering Information Exchange Bul- letin, No. 4, September 1993. Zufelt, J.E., C.C. Clark, and D.S. Deck (1995) River ice motion detector. U.S. Patent Document, Patent No. 5,446,448.
35

APPENDIX A: ADDITIONAL SURVEY RESULTS
Table Al. Number of respondents monitoring ice parameters, by Division (as of 1995).
Missouri North North New North Ohio South South- River Atlantic Central England Pacific River Pacific western Total
Ice thickness 12 4 22 1 1 3 0 0 43 Water temperature 27 7 18 0 8 4 2 0 66 Air temperature 27 7 27 1 8 4 1 0 75 Discharge 28 9 26 1 9 3 2 0 78 Water stage 24 10 28 1 8 4 2 0 77 Ice areal coverage 19 2910100 32 Ice concentration 24 11 00100 18 Ice movement 56 10 11300 26 Date of ice in 15 2 17 1 0 0 0 0 35 Date of ice out 14 2 18 1 0 0 0 0 35 Freezeup stage 52311000 12 Condition of ice 10 5 19 1 1 3 0 0 39
Table A2. Number of respondents desiring monitoring of ice parameters, by Division (as of 1995).
Missouri North North New North River Atlantic Central England Pacific
Ice thickness 16 6 25 1 3 Water temperature 28 7 20 0 8 Air temperature 27 7 27 18 Discharge 28 9 27 19 Water stage 24 10 29 18 Ice areal coverage 19 4 11 11 Ice concentration 4 6 12 12 Ice movement 8 9 13 1 2 Date of ice in 15 5 19 11 Date of ice out 14 5 20 11 Freezeup stage 8 4 5 13 Condition of ice 13 7 20 12
Ohio South South- River Pacific western Tot
3 0 0 54 4 2 0 69 4 1 0 75 3 2 0 79 4 2 0 78 1 0 0 37 1 0 0 26 3 0 0 36 0 0 0 41 0 0 0 41 0 0 0 21 3 0 0 46
36

Table A3. Number of respondents selecting specific rating value for ice-related parameters, by Division (as of 1995).
Missouri North North New North Ohio South South- Parameter Rating River Atlantic Central England Pacific River Pacific western Totals
Ice thickness 1 15 4 9 0 8 1 2 1 40 2 7 2 2 0 1 1 0 0 13 3 1 2 9 0 0 1 0 0 13 4 4 2 5 0 0 1 0 0 12 5 4 1 7 1 1 0 0 0 14
Water temperature 1 10 3 14 0 2 1 0 1 31 2 3 2 2 0 1 0 0 0 8 3 1 1 4 1 0 1 1 0 9 4 11 3 6 0 5 2 1 0 28 5 6 2 6 0 2 0 0 0 16
Air temperature 1 11 2 7 0 3 1 1 1 26 2 1 2 3 0 1 0 0 0 7 3 1 3 6 0 2 1 0 0 13 4 14 3 9 1 4 2 1 0 34 5 4 1 7 0 0 0 0 0 12
Discharge 1 9 0 4 0 1 2 0 1 17 2 1 0 1 0 1 0 0 0 3 3 1 3 2 0 1 0 0 0 7 4 5 1 5 0 1 2 0 0 14 5 15 7 20 1 6 0 2 0 51
Water stage 1 10 0 3 0 1 1 0 1 16 2 2 0 0 0 2 0 0 0 4 3 2 1 4 0 2 0 0 0 9 4 5 2 4 0 2 2 2 0 17 5 12 8 21 1 3 1 2 0 48
Ice areal coverage 1 17 5 20 0 10 1 2 1 56 2 3 0 1 0 0 2 0 0 6 3 4 2 4 0 0 1 0 0 11 4 4 3 5 1 0 0 0 0 13 5 3 1 2 0 0 0 0 0 6
Ice concentration 1 7 4 17 0 9 1 2 1 61 2 2 1 2 0 0 2 0 0 7 3 1 1 7 0 0 0 0 0 9 4 0 4 5 1 1 1 0 0 12 5 1 1 1 0 0 0 0 0 3
Ice movement 1 26 1 18 0 9 1 2 1 58 2 0 1 3 0 0 1 0 0 5 3 2 3 4 0 1 0 0 0 10 4 1 4 6 0 0 2 0 0 13 5 2 2 1 1 0 0 0 0 6
Date of ice in 1 19 5 16 0 10 2 2 1 55 2 3 0 3 0 0 2 0 0 8 3 5 3 7 0 0 0 0 0 15 4 1 0 6 0 0 0 0 0 7 5 3 3 0 1 0 0 0 0 7
Date of ice out 1 20 5 15 0 10 2 2 1 55 2 3 0 3 0 0 2 0 0 8 3 5 2 4 0 0 0 0 0 11 4 1 0 8 0 0 0 0 0 9 5 2 4 2 1 0 0 0 0 9
Freezeup stage 1 25 5 23 0 7 2 2 1 65 2 3 0 2 0 0 2 0 0 7 3 1 2 2 1 2 0 0 0 8 4 1 2 4 0 1 0 0 0 8 5 1 2 1 0 0 0 0 0 4
Condition of ice 1 23 3 13 0 10 1 2 1 53 2 2 0 1 0 0 1 0 0 4 3 1 1 5 0 0 0 0 0 7 4 3 5 9 0 0 2 0 0 19 5 2 2 4 1 0 0 0 0 9
37
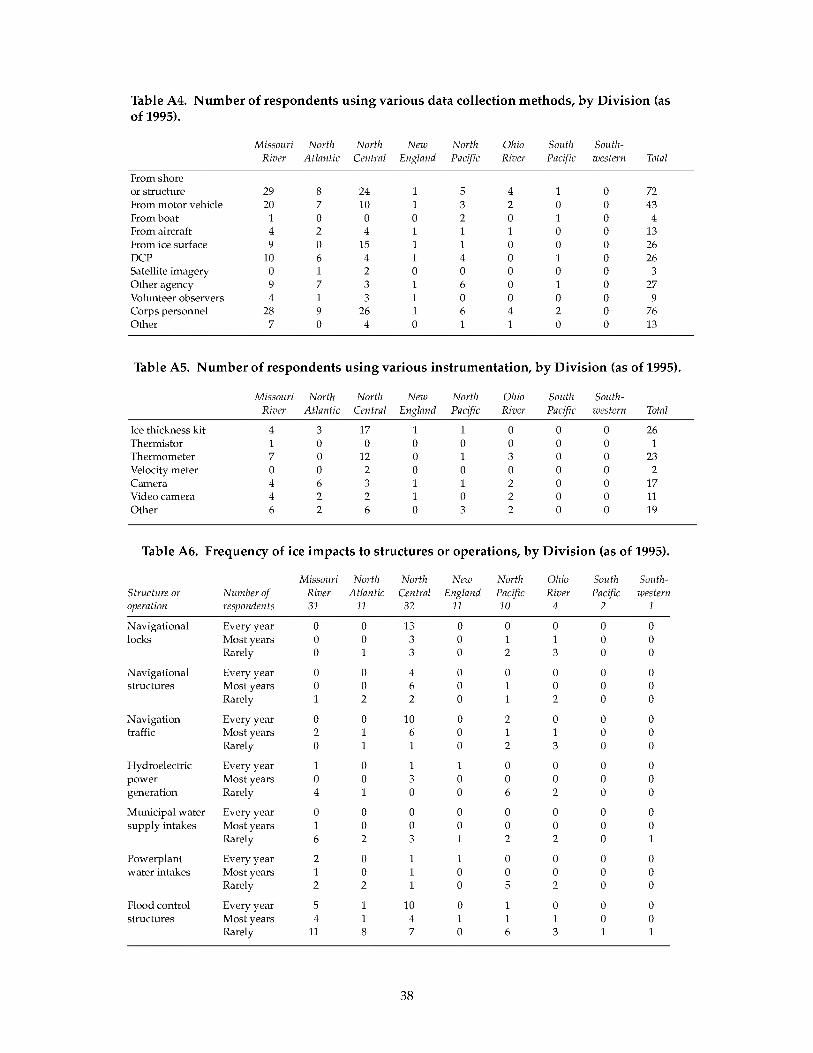
Table A4. Number of respondents using various data collection methods, by Division (as of 1995).
Missouri North North New North Ohio South South- River Atlantic Central England Pacific River Pacific western Total
From shore or structure 29 8 24 1 5 4 1 0 72 From motor vehicle 20 7 10 1 3 2 0 0 43 From boat 1 0 0 0 2 0 1 0 4 From aircraft 4 2 4 1 1 1 0 0 13 From ice surface 9 0 15 1 1 0 0 0 26 DCP 10 6 4 1 4 0 1 0 26 Satellite imagery 0 1 2 0 0 0 0 0 3 Other agency 9 7 3 1 6 0 1 0 27 Volunteer observers 4 1 3 1 0 0 0 0 9 Corps personnel 28 9 26 1 6 4 2 0 76 Other 7 0 4 0 1 1 0 0 13
Table A5. Number of respondents using various instrumentation, by Division (as of 1995).
Missouri North North New North Ohio South South- River Atlantic Central England Pacific River Pacific western Total
Ice thickness kit 4 3 17 1 1 0 0 0 26 Thermistor 1 0 0 0 0 0 0 0 1 Thermometer 7 0 12 0 1 3 0 0 23 Velocity meter 0 0 2 0 0 0 0 0 2 Camera 4 6 3 1 1 2 0 0 17 Video camera 4 2 2 1 0 2 0 0 11 Other 6 2 6 0 3 2 0 0 19
Table A6. Frequency of ice impacts to structures i or operat ions, by Division (as of 1995).
Missouri North North New North Ohio South South- Structure or Number of River Atlantic Central England Pacific River Pacific western operation respondents 31 11 32 11 10 4 2 1
Navigational Every year 0 0 13 0 0 0 0 0 locks Most years 0 0 3 0 1 1 0 0
Rarely 0 1 3 0 2 3 0 0
Navigational Every year 0 0 4 0 0 0 0 0 structures Most years 0 0 6 0 1 0 0 0
Rarely 1 2 2 0 1 2 0 0
Navigation Every year 0 0 10 0 2 0 0 0 traffic Most years 2 1 6 0 1 1 0 0
Rarely 0 1 1 0 2 3 0 0
Hydroelectric Every year 1 0 1 1 0 0 0 0 power Most years 0 0 3 0 0 0 0 0 generation Rarely 4 1 0 0 6 2 0 0
Municipal water Every year 0 0 0 0 0 0 0 0 supply intakes Most years 1 0 0 0 0 0 0 0
Rarely 6 2 3 1 2 2 0 1
Powerplant Every year 2 0 1 1 0 0 0 0 water intakes Most years 1 0 1 0 0 0 0 0
Rarely 2 2 1 0 5 2 0 0
Flood control Every year 5 1 10 0 1 0 0 0 structures Most years 4 1 4 1 1 1 0 0
Rarely 11 8 7 0 6 3 1 1
38

Table A7. Timing of ice impacts to structures or operations, by Division (as of 1995).
Structure or Missouri North North New North Ohio South South- operation River Atlantic Central England Pacific River Pacific western
Navigational Freezeup 0 0 3 0 2 0 0 0 locks Breakup 0 0 0 0 0 2 0 0
Both 0 1 15 0 0 2 0 0 N/A 31 10 14 1 8 0 2 1
Navigational Freezeup 0 1 4 0 2 0 0 0 structures Breakup 1 1 0 0 0 1 0 0
Both 0 0 5 0 0 1 0 0 N/A 30 9 23 1 8 2 2 1
Navigation Freezeup 2 1 6 0 1 1 0 0 traffic Breakup 0 0 1 0 1 0 0 0
Both 0 1 10 0 2 2 0 0 N/A 29 9 15 1 6 1 2 1
Hydroelectric Freezeup 2 1 0 0 3 1 0 0 power Breakup 1 1 2 0 1 0 0 0 generation Both 1 0 2 1 0 0 0 0
N/A 27 9 28 0 6 3 2 1
Municipal Freezeup 5 1 1 0 2 1 0 0 water supply Breakup 0 1 0 1 0 0 0 0 intakes Both 1 0 1 0 0 0 0 0
N/A 25 9 30 0 8 3 2 1
Powerplant water Freezeup 4 1 0 0 2 1 0 0 intakes Breakup 0 1 0 0 1 0 0 0
Both 0 0 2 1 1 0 0 0 N/A 27 9 30 0 6 3 2 1
Flood control Freezeup 7 1 4 0 5 2 0 0 structures Breakup 6 5 9 0 1 2 0 0
Both 5 3 8 1 0 0 1 0 N/A 13 2 11 0 4 0 1 1
39

REPORT DOCUMENTATION PAGE Form Approved OMB No. 0704-0188
Public reporting burden for this collection of information is estimated to average 1 hour per response, including the time for reviewing instructions, searching existing data sources, gathering and maintaining the data needed, and completing and reviewing the collection of information. Send comments regarding this burden estimate or any other aspect of this collection of information, including suggestion for reducing this burden, to Washington Headquarters Services, Directorate for Information Operations and Reports, 1215 Jefferson Davis Highway, Suite 1204, Arlington, VA 22202-4302, and to the Office of Management and Budget, Paperwork Reduction Project (0704-0188), Washington, DC 20503.
1. AGENCY USE ONLY (Leave blank) 2. REPORT DATE
June 1997 3. REPORT TYPE AND DATES COVERED
4. TITLE AND SUBTITLE
River Ice Data Instrumentation
6. AUTHORS
Roger L. Kay and Kathleen D. White
5. FUNDING NUMBERS
CWIS 32774
7. PERFORMING ORGANIZATION NAME(S) AND ADDRESS(ES)
U.S. Army Engineer District, Omaha U.S. Army Cold Regions Research and 215 North 17 St. Engineering Laboratory Omaha, NE 68102-4978 72 Lyme Road
Hanover, N.H. 03755-1250
PERFORMING ORGANIZATION REPORT NUMBER
CRREL Report 97-2
9. SPONSORING/MONITORING AGENCY NAME(S) AND ADDRESS(ES) 10. SPONSORING/MONITORING AGENCY REPORT NUMBER
Office of the Chief of Engineers Washington, D.C. 20314-1000
11. SUPPLEMENTARY NOTES
12a. DISTRIBUTION/AVAILABILITY STATEMENT
Approved for public release; distribution is unlimited. Available from NTIS, Springfield, Virginia 22161
12b. DISTRIBUTION CODE
13. ABSTRACT (Maximum 200 words)
Ice processes are capable of causing damage to Corps of Engineers flood control, water control, and navigation projects each year. Monitoring of ice and other physical parameters is done by instrumentation in some instances but is usually done manually. Measurements that require personnel to go on an ice cover can be risky or impos- sible, depending on the ice cover's stability and the individual's training. This study seeks to identify and rank the field measurements needed during winter conditions and the instrumentation required to make the measurements. Existing and developing instrumentation was evaluated for in-situ and remote sensing capabilities. Methods of transmitting, storing, and retrieving various types of ice data were explored for feasibility and practicality. Recom- mendations are identified regarding the types of instrumentation, data transmission, and storage methods that need to be improved or developed.
14. SUBJECT TERMS Data transmission Monitoring instrumentation River ice Ice data Remote sensing
15. NUMBER OF PAGES 47
16. PRICE CODE
17. SECURITY CLASSIFICATION OF REPORT
UNCLASSIFIED
18. SECURITY CLASSIFICATION OF THIS PAGE
UNCLASSIFIED
19. SECURITY CLASSIFICATION OF ABSTRACT
UNCLASSIFIED
20. LIMITATION OF ABSTRACT
UL NSN 7540-01-280-5500 Standard Form 298 (Rev. 2-89)
Prescribed by ANSI Std. Z39-18 298-102