risq: recognizing smoking gestures with inertial …cs752/papers/analy-010.pdf · risq: recognizing...
TRANSCRIPT

RisQ: Recognizing Smoking Gestures with Inertial Sensorson a Wristband
Abhinav Parate Meng-Chieh Chiu Chaniel Chadowitz Deepak GanesanEvangelos Kalogerakis
University of Massachusetts, Amherst{aparate,joechiu,cheni,dganesan,kalo}@cs.umass.edu
ABSTRACTSmoking-induced diseases are known to be the leading causeof death in the United States. In this work, we design RisQ,a mobile solution that leverages a wristband containing a 9-axis inertial measurement unit to capture changes in the ori-entation of a person’s arm, and a machine learning pipelinethat processes this data to accurately detect smoking ges-tures and sessions in real-time. Our key innovations are four-fold: a) an arm trajectory-based method that extracts candi-date hand-to-mouth gestures, b) a set of trajectory-based fea-tures to distinguish smoking gestures from confounding ges-tures including eating and drinking, c) a probabilistic modelthat analyzes sequences of hand-to-mouth gestures and in-fers which gestures are part of individual smoking sessions,and d) a method that leverages multiple IMUs placed ona person’s body together with 3D animation of a person’sarm to reduce burden of self-reports for labeled data col-lection. Our experiments show that our gesture recognitionalgorithm can detect smoking gestures with high accuracy(95.7%), precision (91%) and recall (81%). We also reporta user study that demonstrates that we can accurately detectthe number of smoking sessions with very few false positivesover the period of a day, and that we can reliably extract thebeginning and end of smoking session periods.
1. INTRODUCTIONTobacco use remains the single largest preventable cause
of death and disease in the United States and worldwide.According to CDC estimates, cigarette smoking kills morethan 440,000 Americans each year, either through cancer,heart disease, stroke, or lung diseases. It also increases thechances of other serious illnesses, such as diabetes [2]. Inaddition, smoking-related illness in the United States costs$96 billion in medical costs and $97 billion in lost produc-tivity each year. The numbers are more alarming worldwide,where tobacco use is increasing rapidly in low- and middle-income countries. In fact, it is estimated that there are abouta billion smokers worldwide, with more than 80% in the lowand middle-income countries. Of these, about 6 million diethrough smoking-related causes each year.
At the heart of addressing this scourge is early detection
and timely treatment. Several smoking cessation programshave been developed that show that intervening at opportunemoments can help a person quit smoking. In theory, contin-uous sensing using the mobile phone and wearables has thepotential to enable such informed and timely interventionsboth by observing the evolution of a patient’s smoking pat-tern over time, as well as measuring contextual factors thatinfluence smoking (environment, social interactions, stress,etc). However, the first step towards such methods is theability to detect smoking events in real-world settings, a goalthat has proven elusive.
We argue that there is a dire need for a simple and re-liable smoking detector that has high sensitivity and speci-ficity, and is easy to wear on a day-to-day basis. Existingmethods fall short on one or more of these axes. A sensitivedetector for smoking is a tomography meter (e.g. CReSSmonitor [1]). However, the user needs to attach the tomog-raphy device to the cigarette prior to smoking. This is bothburdensome and can change the underlying smoking behav-ior. A recent alternative is to use the deep respiration cyclesassociated with inhalation and exhalation of smoke, whichcan be detected by a respiration chest band (mPuff [4] andSazonov et al [16]). Unfortunately chest bands are cum-bersome to wear for long periods and therefore have lim-ited appeal beyond clinical trials. Other wearables that havebeen previously proposed include RF-based proximity sen-sors worn on the collar and wrist to detect when the handis in the vicinity of the mouth, but this is not robust to con-founders [17]. One promising approach is to embed a sensorin a cigarette lighter which detects whenever the lighter is lit[18]. Unfortunately this does not provide information aboutindividual puffs, which is particularly useful for determiningthe degree of nicotine intake across subjects [11].
Our work relies on a wristband embedded with a single,low-power 9-axis inertial measurement unit (IMU) that fusesinformation from an accelerometer, gyroscope, and compassto provide 3D orientation of the wrist. IMUs are easy to in-tegrate with wrist-worn wearables, many of which alreadyhave accelerometers embedded for calorie or activity track-ing. However, there are many challenges in robustly recog-nizing smoking gestures from orientation data.
1
-1
-0.5
0
0.5
1
0 1 2 3 4 5 6 7 8 9
Time (in secs)
Angle about rotation axisX-component of rotation axis
(a) Smoking when standing still
-1
-0.5
0
0.5
1
0 1 2 3 4 5 6 7 8 9
Time (in secs)
Angle about rotation axisX-component of rotation axis
(b) Smoking when walking
-1
-0.5
0
0.5
1
0 1 2 3 4 5 6 7 8 9
Time (in secs)
Angle about rotation axisX-component of rotation axis
(c) Eating with a spoon
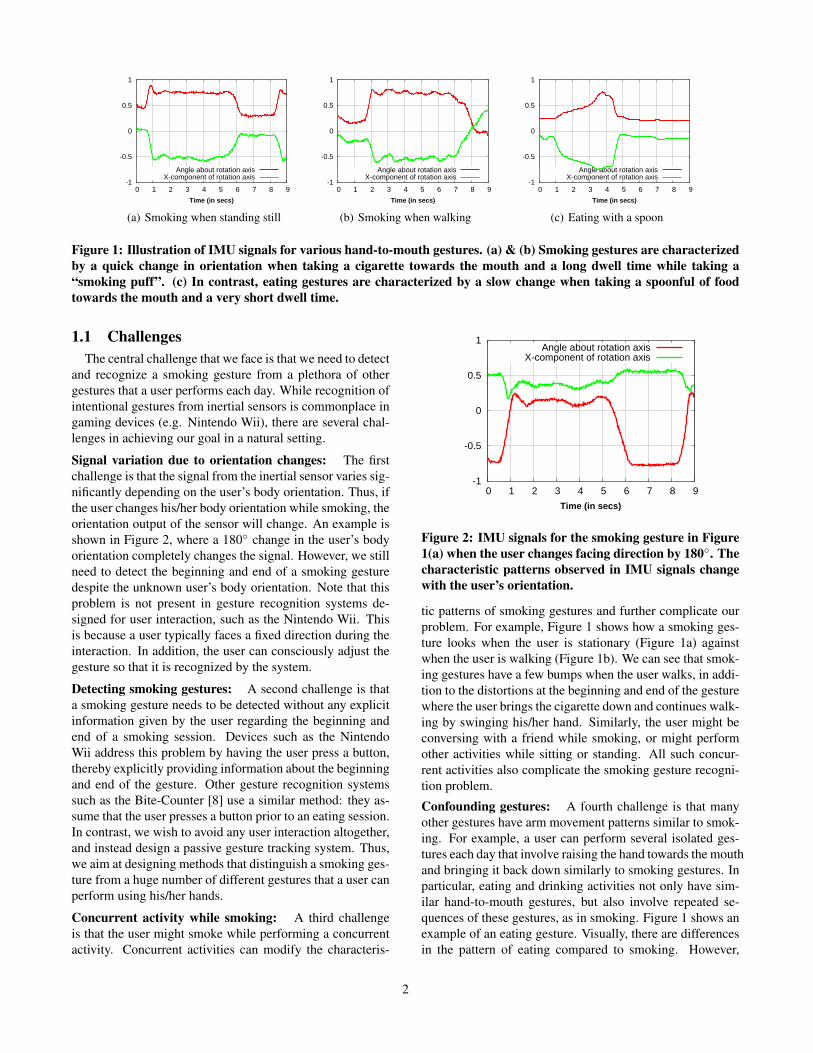
Figure 1: Illustration of IMU signals for various hand-to-mouth gestures. (a) & (b) Smoking gestures are characterizedby a quick change in orientation when taking a cigarette towards the mouth and a long dwell time while taking a“smoking puff”. (c) In contrast, eating gestures are characterized by a slow change when taking a spoonful of foodtowards the mouth and a very short dwell time.
1.1 ChallengesThe central challenge that we face is that we need to detect
and recognize a smoking gesture from a plethora of othergestures that a user performs each day. While recognition ofintentional gestures from inertial sensors is commonplace ingaming devices (e.g. Nintendo Wii), there are several chal-lenges in achieving our goal in a natural setting.
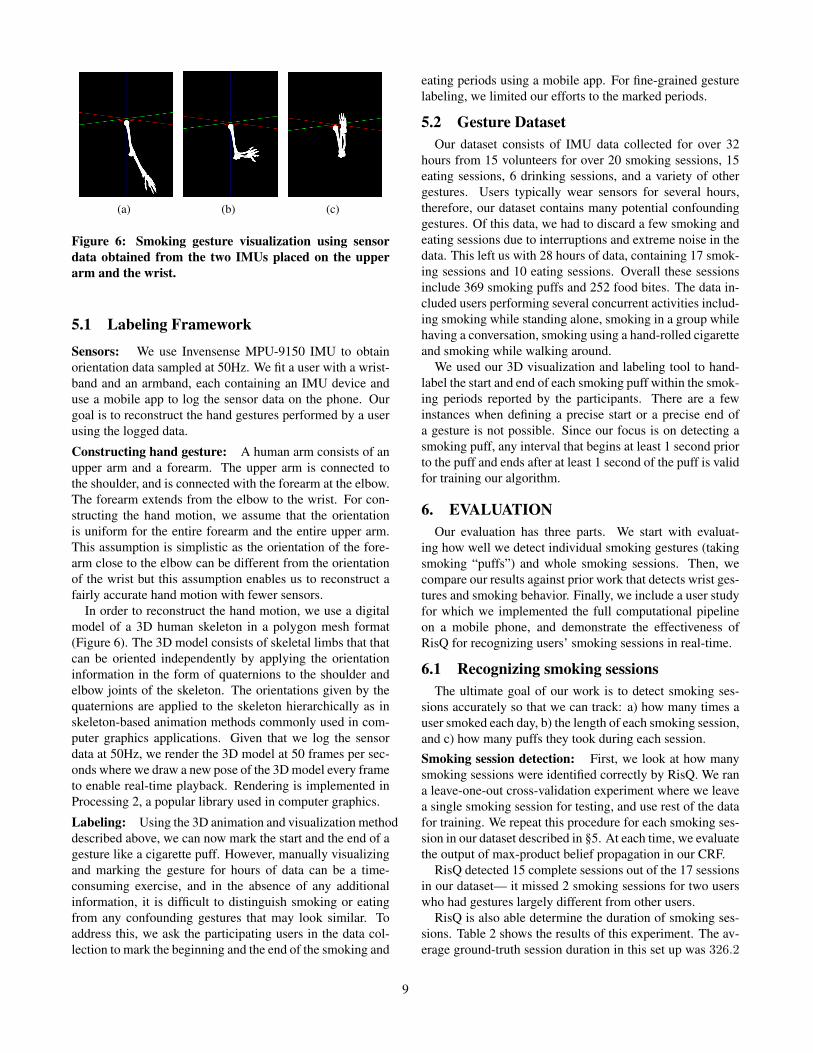
Signal variation due to orientation changes: The firstchallenge is that the signal from the inertial sensor varies sig-nificantly depending on the user’s body orientation. Thus, ifthe user changes his/her body orientation while smoking, theorientation output of the sensor will change. An example isshown in Figure 2, where a 180◦ change in the user’s bodyorientation completely changes the signal. However, we stillneed to detect the beginning and end of a smoking gesturedespite the unknown user’s body orientation. Note that thisproblem is not present in gesture recognition systems de-signed for user interaction, such as the Nintendo Wii. Thisis because a user typically faces a fixed direction during theinteraction. In addition, the user can consciously adjust thegesture so that it is recognized by the system.
Detecting smoking gestures: A second challenge is thata smoking gesture needs to be detected without any explicitinformation given by the user regarding the beginning andend of a smoking session. Devices such as the NintendoWii address this problem by having the user press a button,thereby explicitly providing information about the beginningand end of the gesture. Other gesture recognition systemssuch as the Bite-Counter [8] use a similar method: they as-sume that the user presses a button prior to an eating session.In contrast, we wish to avoid any user interaction altogether,and instead design a passive gesture tracking system. Thus,we aim at designing methods that distinguish a smoking ges-ture from a huge number of different gestures that a user canperform using his/her hands.
Concurrent activity while smoking: A third challengeis that the user might smoke while performing a concurrentactivity. Concurrent activities can modify the characteris-
-1
-0.5
0
0.5
1
0 1 2 3 4 5 6 7 8 9
Time (in secs)
Angle about rotation axisX-component of rotation axis
Figure 2: IMU signals for the smoking gesture in Figure1(a) when the user changes facing direction by 180◦. Thecharacteristic patterns observed in IMU signals changewith the user’s orientation.
tic patterns of smoking gestures and further complicate ourproblem. For example, Figure 1 shows how a smoking ges-ture looks when the user is stationary (Figure 1a) againstwhen the user is walking (Figure 1b). We can see that smok-ing gestures have a few bumps when the user walks, in addi-tion to the distortions at the beginning and end of the gesturewhere the user brings the cigarette down and continues walk-ing by swinging his/her hand. Similarly, the user might beconversing with a friend while smoking, or might performother activities while sitting or standing. All such concur-rent activities also complicate the smoking gesture recogni-tion problem.
Confounding gestures: A fourth challenge is that manyother gestures have arm movement patterns similar to smok-ing. For example, a user can perform several isolated ges-tures each day that involve raising the hand towards the mouthand bringing it back down similarly to smoking gestures. Inparticular, eating and drinking activities not only have sim-ilar hand-to-mouth gestures, but also involve repeated se-quences of these gestures, as in smoking. Figure 1 shows anexample of an eating gesture. Visually, there are differencesin the pattern of eating compared to smoking. However,
2

designing an algorithm that robustly distinguishes smokingfrom other confounding gestures across different users isparticularly challenging.
Labeling smoking puffs: In order to recognize smokinggestures robustly, we design a method based on supervisedclassification. However, to train such a classifier, we needtraining data in the form of fine-grained labels for the begin-ning and end of each gesture. Many existing approaches forobtaining such labeled data are not feasible or have draw-backs: a) requesting self-reports from the users is imprac-tical, since users cannot possibly label each smoking puffmanually while smoking: such an approach would force theusers to change their gestures from smoking to interactingwith a device to create these self-reports, b) video captureof the smoking session for post-facto annotation is restric-tive, since it requires the user to always face the camera, andc) having an observer annotate each smoking puff is cumber-some and not scalable. Thus, one particular challenge is howto enable fine-grained labeled data collection while limitingthe burden on participants.
1.2 ContributionsThe key innovation of our work is the ability to recognize
sequences of hand gestures that correspond to smoking ses-sions “in the wild”. This involves a sensing pipeline withseveral important aspects: a) we detect candidate hand-to-mouth gestures by continuously tracking and segmenting the3D trajectory of a user’s hand, b) we extract discriminativetrajectory-based features that can distinguish a smoking ges-ture from a variety of other confounding gestures like eatingand drinking, c) we design a probabilistic model based ona random forest classifier and a Conditional Random Fieldthat analyze sequences of hand-to-mouth gestures based ontheir extracted features, and accurately outputs the beginningand end of smoking sessions. Finally, (d) in order to trainthe classifier and Conditional Random Field, we also pro-pose a simple method to gather training labeled data “in thewild”: we ask subjects to wear two IMUs, one on the elbowand one on the wrist, which allows us to build 3D anima-tions of arm movements that can be easily labeled by a thirdparty without compromising the subject’s privacy. The onlylimited burden on the subject is to specify coarse time win-dows where smoking occurred to verify that we detect ges-tures within the correct periods of time. Each module in thiswhole pipeline addresses challenges specific to our problemdomain, and we present several new ideas and algorithms.
Our results show that we can detect smoking gestures with95.7% accuracy and 91% precision. In addition, we can de-tect smoking session time boundaries reliably: the error inthe estimated duration of a smoking session is less than aminute. Finally, we demonstrate with a user study that wecan accurately detect the number of users’ smoking sessionsin the period of a day with only few false positives (less thantwo in our study). In all, we think that RisQ is a very promis-ing approach for use in smoking cessation and intervention.
2. BACKGROUND
Inertial Measurement Unit: The Inertial MeasurementUnit (IMU) is an electronic device consisting of 3-axis ac-celerometer, 3-axis gyroscope and 3-axis magnetometer. IMUhas an on-board processor that fuses the output of these threesensors to compute the orientation of the device in a 3Dworld (absolute) coordinate system defined by y-axis point-ing towards the magnetic north, z-axis pointing perpendic-ular to the ground in the direction opposite to the earth’sgravity and x-axis pointing to the geographical east. We usethe Invensense MPU-9150 IMU for our experimental study.This sensor outputs the 3D orientation of a device in the formof a quaternion.
Quaternions: Quaternions are convenient mathematicalentities for representing orientations and rotations of objectsin three dimensions. Quaternions have found a great appli-cability in robotics, computer graphics, and computer visioncommunities due to the ease in calculations for performingrotations of objects in 3D space.
Figure 3: Top: 3D armand its initial referenceframe. A quaternionrotates the arm abouta rotation axis (shownin cyan). Bottom: ro-tated arm and its up-dated reference frame.
Formally, a quaternion is de-fined using a scalar componentqs and a 3D vector (qx, qy, qz).We write a quaternion q as fol-lows:
q = qs + qxi+ qy j + qz k
where i, j and k are imaginarybasis elements, each of whichsquares to −1. A quaternionq is said to be a unit quater-nion if its magnitude |q| givenby√
(q2s + q2x + q2y + q2z) isequal to one. 3D rotations can becompactly represented with unitquaternions. Given a 3D rota-tion defined through a unit vec-tor 〈x, y, z〉 representing the axisof rotation, and an angle θ rep-
resenting the amount of rotation about the axis, the corre-sponding quaternion representing this rotation is defined as:
q = cos θ2 + x sin θ2 i+ y sin θ
2 j + z sin θ2 k
It can be shown that a point p in 3D space with coordinates{px, py, pz} can be rotated using a quaternion with the fol-lowing formula:
p′ = q · p · q−1
where p is written as pxi + py j + pz k, and q−1 is the so-called conjugate quaternion of q, which is expressed as:
q = cos θ2 − x sin θ2 i− y sin θ
2 j − z sin θ2 k
It is straightforward to see that a quaternion not only repre-sents a 3D rotation, but can also represent the 3D orientationof an object. Given an initial orientation of a 3D object de-
3

fined by its initial frame of reference, the quaternion q rotatesthe object yielding a new orientation (see Figure 3).
3. SYSTEM OVERVIEW
Segmentation Layer SegmentSegmentSegment
Session Detection LayerSessionSegment N-1 Segment N+1
Segment N features
Gesture Recognition Layer
Sensing Layer Raw Quaternion
Data
Wrist Trajectory computed
from quaternions
Rest point Tracking
Distance from Rest Point
Peak detectionon DistanceTime-series
Average Speed
Vertical Displacement
Angular twist
Gesture duration
Feature Extraction
Supervised GestureClassification
Conditional Random Field
Model
Figure 4: RisQ: Quaternion data processing pipeline
In this section, we provide an overview of the RisQ com-putational pipeline that recognizes smoking gestures and ses-sions. We also overview the training data collection method-ology we used to obtain fine-grained labeled data for the pur-pose of training our supervised classification method.Computational pipeline: Figure 4 gives an overview ofthe computational pipeline that we use for detecting smokinggestures and sessions. At the lowest layer of the pipeline isthe extraction of quaternion data from the single wrist-worn9-axis IMU.
The second layer in the pipeline is the segmentation layerthat extracts segments containing candidate gestures fromthe raw sensor data and filters out extraneous data. The in-tuition behind the segmentation process is that, while per-forming a hand gesture, humans start from “a rest position”in which the arm is relaxed, then move their arm, and finallythe arm falls back to another, possibly different rest position.Thus, the gestures tend to lie in segments between these rest-ing positions. The segmentation layer accomplishes the seg-ment extraction by computing the spatio-temporal trajectorytaken by the wrist using quaternion data and tracking rest po-sitions. Based on the computed trajectory, at each time step
it computes the distance of the wrist from rest positions, andidentifies segments using a peak-valley detection algorithm.The output of this layer are the extracted segments contain-ing candidate hand gestures.
In the third layer of our pipeline, our method computes afeature vector for each segment, consisting of features thatcan discriminate hand-to-mouth gestures corresponding tosmoking from a large number of other hand-to-mouth ges-ture candidates. We then use a supervised classifier, calledRandom Forests [5, 7], that outputs the probability for thetype of gesture (“smoking”, “eating” or “other” gesture) basedon the extracted features for each segment individually.
The top-most layer in the processing pipeline is a sessiondetection layer that identifies whole sessions (“smoking”,“eating”, or “other”) based on the Random Forest classifieroutputs and the segment features. The key intuition behindthis layer is that each smoking session involves a continu-ous sequence of smoking gestures, and is unlikely to con-tain gestures from other activities. We use a probabilisticmodel based on a Conditional Random Field (CRF) [13] thatcaptures probabilistic dependencies between the type of ges-tures contained in consecutive segments. In particular, it hasthe advantage of filtering out spurious classification outputsof the lower layer and robustly detecting the beginning andend of smoking sessions.
While the focus of this paper is on recognizing smokinggestures and sessions, our approach can be tailored to otherinstances of repetitive gestures. In §6.3, we use eating ses-sions to train our method, and we find that it performs con-siderably better than state-of-art eating detectors that use in-ertial sensors.
Labeled data collection: We use a novel data collectionmethodology to obtain fine-grained gesture labeled data fromparticipants for training our method. Our data collectionframework consists of two tools: (i) a logging applicationand (ii) a 3D visualization and labeling tool. The loggingapplication collects data from on-body IMU sensors placedon the user’s wrist and upper arm. Since our goal is to re-duce the burden of labeling for the user and avoid interferingwith his gestures, our logging application provides a simpleuser-interface to log events on his mobile phone. This helpsus identify time windows that require fine-grained labelingof the smoking or eating gestures. The 3D visualization andlabeling tool produces 3D hand animations from the loggedsensor data and provides an interface for fine-grained label-ing of the gestures, such as “smoking a puff” or “taking abite of food”. The type of gestures can be easily labeledby other users in these animated sequences. Unlike videorecording, our visualization tool allows users to see and la-bel gestures from any viewing angle they prefer.
4. GESTURE DETECTION & RECOGNITIONIn this section, we describe how we detect and label hand-
to-mouth gestures when the user wears the single IMU onhis wristband. The first step in our data processing pipeline
4

is to partition the quaternion time-series obtained from theIMU into segments such that each segment contains a ges-ture (§4.1). The second step is to extract some features thatcan be used to discriminate different types of gestures (§4.2).The last step is to recognize the detected gestures and extractsmoking sessions (§4.3).
4.1 Gesture detectionIn order to detect a gesture, it is essential that we segment
the time series of quaternions into segments, such that eachsegment contains a complete gesture. The problem of cor-rectly segmenting sequences of quaternions presents a num-ber of challenges. First, the segmentation should extract seg-ments representing the entire gesture duration. Otherwisecharacteristic features that are useful in classifying a gesturewill be lost. Moreover, the extracted segments should notbe much longer than the gesture, otherwise the computedfeatures related to the gesture will be inaccurate. Anotherfundamental challenge is that the characteristic patterns ob-served in a time series of quaternions are dependent on theorientation of the person’s body performing the gesture. Forexample, the pattern observed for a gesture when the personis lying on a bed is very different from the pattern observedwhen he is standing. The problem gets further complicateddue to the large number of variations in the gestures ob-served for the same activity, within and across users, makingthe variability of characteristic patterns extremely high. Anadditional challenge comes from the huge number of all pos-sible gestures and possibly confounding gestures performedby humans throughout their daily life.
The intuition behind our segmentation approach is the ob-servation that the humans tend to perform a gesture startingfrom an initial rest body pose, and then ending the gesture inanother, possibly different, rest pose. This observation holdstrue for the hand-to-mouth gestures we intend to identify.For example, a person may start a smoking gesture by hav-ing his hand lie on an armrest of a chair, then move his handstowards his mouth, then back to the armrest of the chair orthe top of a table. Alternatively, the arm might end up beingstraight, hanging from the body. In general, the beginningand end rest poses are not necessarily stationary and are notnecessarily identical. In the following sections, we describeour segmentation approach based on continuous tracking ofthe rest positions of the fore-arm and computing the spatio-temporal trajectory of the wrist in 3D space.
Relative trajectory computation: Our first step towardsidentifying hand-to-mouth gestures is computing the spatio-temporal trajectory of the hand from the stream of quater-nion data. The main challenge here is that trajectory is af-fected by body motion and orientation. For example, a smok-ing gesture when a person is walking takes a much longerpath in 3D space compared to the same gesture performedwhen the person stands at one place. Similarly, a smokinggesture could be affected by any changes to the pose of theuser’s body while smoking.
The key insight in our approach is that we care less aboutthe absolute trajectory of the hand in 3D space. We caremore about the trajectory of the hand relative to a body joint,such as the shoulder joint. Such a relative trajectory wouldnot depend on the orientation of the person’s body, and everysmoking gesture should result in roughly isomorphic trajec-tories with similar shape characteristics.
While such a relative trajectory would be easy to com-pute if the individual also had an IMU close to the shoulder,the fact that we only have a single wrist-worn IMU compli-cates the problem. To address this, we make a simplifyingassumption that the position of the elbow remains stationary(the shoulder joint does not rotate) while the gesture is be-ing performed. Specifically we compute the trajectory of thewrist relative to a stationary elbow, assuming that the wrist isin a fixed, unit distance away from it. We find that the aboveassumptions have little influence in our trajectory computa-tion, since hand-to-mouth gestures primarily involve rotatingthe elbow and not moving the upper arm.
More formally, given a time sequence of quaternions (q1,q2, . . . , qn), we can compute the trajectory taken by thewrist by computing the position of the wrist for each timestep t (t = 1...n). The position of the wrist w at time t in theelbow’s frame of reference F can be computed as follows:
w = qt ·w0 · q−1t (1)
where w0 = 0i+ 1j + 0k (i.e., has coordinates[0 1 0
])
represents the position of the wrist in the device’s local coor-dinates based on the assumption that the length of the fore-arm of person has unit length. This assumption also works inour favor as the computed trajectories are independent of theparticular variations of the arm length across the population.
Due to this approximating nature of the computed trajec-tory and the continuous shifts in the elbow position, the wristtrajectory does not always appear smooth. Thus, we smooththe trajectory by fitting a curve using cubic B-splines. Fig-ure 5(a) shows a sample trajectory for a smoking puff gesturebefore and after the smoothing operation.
IMU vs Accelerometer: One question that is worth ask-ing at this point is whether we really need a 9-axis IMU thatprovides quaternion data (by fusing information from the ac-celerometer, gyroscope, and compass) to compute trajecto-ries, or whether we can do the same with a single accelerom-eter. Figure 5(b) shows two smoothed sample trajectoriestaken for two consecutive cigarette puffs while standing still.These trajectories are computed relative to the elbow andalign well as the gestures are isomorphic. In Figure 5(c),we show the accelerometer-based and quaternion-based tra-jectories for the smoking gesture when the user is walking.We see that the accelerometer-based trajectory in this caseappears longer. This is because it is relative to the startingpoint in world coordinates. On the other hand, the trajec-tory computed using quaternions is relative to the elbow hassimilar characteristics to trajectories observed when stand-ing still.
5

−0.5
0
0.5
1
−1.5
−1
−0.5
0
0.5
1−0.8
−0.6
−0.4
−0.2
0
0.2
0.4
0.6
0.8
1
(a) Trajectory smoothing using curve-fitting
−0.4−0.2
00.2
0.40.6
−0.8
−0.6
−0.4
−0.2
0−0.8
−0.6
−0.4
−0.2
0
0.2
0.4
0.6
0.8
1
(b) Trajectories for two consecutivesmoking puff gestures
−1
−0.5
0
0.5
1
−202468101214
−0.5
0
0.5
1
1.5
Acceleration
Quaternion
(c) Quaternion and Acceleration-basedtrajectories for the same gesture when theuser is walking
Figure 5: Figure (a) shows a noisy trajectory for a smoking puff gesture and the smooth trajectory (green curve) ob-tained after curve-fitting. Figure (b) shows trajectories for two consecutive puffs while standing still. These two trajec-tories are well-aligned for the isomorphic gestures. Figure (c) shows the trajectory for a smoking puff gesture when theuser is walking, computed from acceleration data (blue curve) and quaternion data (brown curve). The acceleration-based trajectory is significantly elongated and distorted when the user is walking, while holding the cigarette in hismouth. The quaternion-based trajectory instead is computed relatively to the elbow and is free of such motion artifacts.
Segment Extraction: Our segmentation procedure is basedon the observation that humans tend to keep their hands inrest positions and any gesture starts from one rest positionand terminates at another rest position. The key challengeis determining these rest positions in a continuous stream ofwrist movement. The rest positions need not be the sameacross gestures (e.g. rest position while sitting and smok-ing would be different from standing and smoking). Eventhe beginning rest position for a single smoking puff mightbe different from the final rest position, since there can bemany positions where the human arm is “relaxed”.
Our segment extraction method involves four stages:I First, our segment extraction method continuously tracks
the rest position from which a current hand gesturestarted. To detect the rest position, the trajectory istraced according to short sliding time windows (e.g.10 seconds). Within each window, positions where thewrist velocity is very low are computed. If one or morecandidates exist, then we compute the centroid of theselow velocity points as the “rest point”. Thus, we cannow annotate each point in each trajectory trace withthe most recent point corresponding to the rest posi-tion for which the hand gesture started.
I Second, we compute the spatial distance of each pointin the trajectory from the most recent rest point. Forany hand-to-mouth gesture, we expect that the distancefrom the rest point should increase rapidly, plateau fora short period, and then return to the next rest point.
I Third, we use a peak detector to detect peaks and troughsin the distance time series obtained from the previousstage, and look for a tell-tale trough-peak-trough pat-tern that is typical of a hand-to-mouth gesture. To fil-ter false positives from either tiny hand movements orvery long gestures, we use a relatively loose thresh-old for distance separation between trough and peak,
as well as the expected duration of a typical smokingpuff. At this point, the segment extraction pipeline pro-vides the trough-peak-trough segment to the next levelof the classification pipeline.
4.2 Segment Feature ExtractionIn order to recognize the type of gesture in each segment,
we need to compute features that can discriminate differenttypes of gestures. The feature extraction procedure is basedon the observation that a hand-to-mouth gesture can be di-vided into three stages: i) an “ascending” stage that corre-sponds to the trough to peak movement when the hand goestowards the mouth, ii) a “stationary” stage that correspondsto the period where the hand stays near the peak (close tomouth), and iii) a “descending” stage where the hand goesfrom peak to trough i.e. back to the rest position. Thesethree sub-segments are useful for extracting features as wedescribe below.
Table 1 shows the set of features computed for each seg-ment. The following paragraphs describe the features wecompute from the smoothed spatio-temporal trajectory andthe quaternion information:
I Duration features. These features measure the timeduration of the segment containing the gesture and thedurations of the three stages within the segment: as-cending, descending and stationary.
I Velocity features. Second, we use the computed po-sitions of the wrist at each time step to compute theinstantaneous velocity of the wrist for the ascendingand the descending stages. We compute the averagespeed, the maximum speed and the variance in speedfor both ascending and the descending stages giving ussix features.
I Displacement features. These features measure thedisplacement of the wrist during the ascending and the
6

Feature SetDuration Features
Duration 4 Total gesture duration, and duration for the ascending, descending, and the stationary stage.Velocity Features
Speed 6 Mean, max and variance of the wrist speed. We compute these for the ascending and the descending stages.Displacement Features
distZ 2 Vertical displacement of the wrist during the ascending and descending stage.
distXY 2 Horizontal displacement of the wrist during the ascending and descending stage. This is computed on a planeparallel to the ground.
dist 2 Net displacement between the rest position and the peak position. This is computed for the ascending andthe descending stage.
Angle Features
roll velocity 4 Median and maximum angular velocity about the axis of the arm. We compute 2 features each for theascending and the descending stage.
roll 2 Net angular change about the axis of the arm during the ascending and the descending stage.
pitch 12
Angle between the arm and the direction of the gravity (pitch angle). We compute the pitch angle atthe peak during the ascending and descending stage. Also, we obtain 9 decile features from the pitchpitch distribution for the ascending stage. We compute the median pitch angle for the descending stage.
Table 1: Feature set extracted for a segment containing a gesture. The table describes each feature type and gives thecount of features used for each type.
descending stages of the wrist motion. We measurethe vertical displacement, displacement on the planeparallel to the ground and the net displacement at theend of each stage as features.
I Angle features. From the orientation information, wecan compute the roll component of the rotation aboutthe axis of the arm. This is computed by convertingthe quaternions into Tait-Bryan angles. We call therate of change in the angle of the rotation along theaxis of the arm “roll velocity". We compute the me-dian and the maximum of instantaneous roll velocitiesand use them as features. Also, we compute the netroll angle as the feature. We extract these 3 featuresfor the ascending and the descending stage. Next, wecompute “pitch” that measures the angle between thevector along the arm and the direction of the gravity.We use pitch angle at the peak point of the ascendingand the descending stages as features. Next, using thedistribution of pitch angles observed at each time stepfor the ascending stage, we compute 9 values that givethe 10th, 20th, ..., 100th percentile values as the fea-tures. For the descending stage, we use median pitchas a feature.
4.3 Gesture recognitionAfter extracting segments that contain individual gestures,
the next step in our pipeline is to recognize each gesture con-tained in each segment. The input to this step is a set ofsegments with their features and the output is a set of labelsrepresenting the type of gesture (e.g. “smoking”, “eating",or “other” depending on available labels).
Labeling segments poses a number of challenges. First,there is no simple mapping between the duration, velocity,displacement and angular features and the labels. For ex-ample, if the duration of the gesture is more than a particu-lar threshold, we cannot infer that the gesture is a “smoking
puff” with total certainty. It might be the case that the userinstead drinks slowly from a cup. Therefore, we have to alsoconsider other features: for example, smoking is likely toalso be strongly correlated with certain ranges of arm twist-ing angles, wrist velocities, horizontal and vertical displace-ments and so on. Manually constructing a mathematicalformula that detects all smoking gestures based on featuresis very hard. Noise in the trajectory features make thingsworse, thus we need to adopt a probabilistic method that out-puts the probability of assigning each label to each segment.In the following paragraph, we describe a probabilistic clas-sifier for recognizing each individual gesture. Unfortunately,classifying each gesture independently from all the others ina sequence of segments does not seem to work very well.For example, a sequence of gestures might be labeled as{smoking, smoking, eating, smoking, smoking}. How-ever, it is very unlikely that the user interrupts and intermixesgestures in a small period of time. Such noisy labelings caneasily occur due to feature noise and large deviation of wristtrajectories from the ones in our training data. Thus, we em-ploy a probabilistic model that takes as input the probabilis-tic output of the classifier for each individual segment, andadditionally examines how likely is for successive segmentsto have the same or different label. Based on this proba-bilistic model, we estimate the most likely joint labeling ofall segments together. We describe this probabilistic modellater in this section.
Individual classification of gestures: To build a mappingfrom segment features to segment labels, we observe thatthe type of gestures is likely to be correlated with certainvalue ranges of segment features extracted in the previoussection. For this reason, we use a classifier that has a formof a decision tree. A decision tree contains a set of nodes andat each node, the value of an individual feature is comparedto a threshold. Then depending on whether the feature of thesegment has a smaller or larger value than the threshold, the
7

classifier examines the left or right child node, which in turnexamines the value of another feature. When a leaf node isreached, the decision tree outputs a probability based on howmany segments in our training data had the same set of splitswhile traversing the tree.
The thresholds and feature choices at each node of the treeare automatically constructed from the training data duringan offline stage. The best choice of features and thresholdsare selected to maximize the confidence of predictions [7].
Unfortunately, fitting a single decision tree in the train-ing data results in poor performance. The reason is that asingle set of splits yields predictions that are suited only forsegments whose features are very similar to the ones of thetraining segments. A popular alternative is to build an en-semble of decision trees: each decision tree is fitted to smalldifferent random subsets of the training data. This leads todecorrelating the individual tree predictions and, in turn, re-sults in improved generalization and robustness [7]. Thisensemble of decision trees is called random forest classifier.The output of the random classifier is the probability of as-signing a label to each segment, computed as the average ofthe probabilities outputted by the individual decision trees.
Joint classification of gestures: As we explained in thebeginning of the section, classifying each segment indepen-dently from all the others in a sequence of segments yieldsnoisy label predictions. Instead, we classify all segmentsjointly by using the output of the random forest and also con-sidering that consecutive segments in a sequence are morelikely to have the same rather than different label.
Given a sequence of k = 1...K segments, we introduce arandom variable Ck for each segment representing the typeof gesture contained in the segment. We express the jointprobability of assigning a sequence of labels to all the ran-dom variables C = {C1, C2, ..., CK} of the segments giventheir features x = {x1,x2, ...,xK} as follows:
P (C|x) =1
Z(x)
∏k
φ(Ck,xk)∏k,k+1
ψ(Ck, Ck+1)
The unary factors φ(Ck, Xk) assess the consistency of eachindividual segment to each label based on the random forestclassifier. The pairwise factors ψ(Ck, Ck+1) assess the con-sistency of each pair of consecutive segments to their labels.The denominator Z(x) serves as a normalization constantfor each input sequence to ensure that the sum of probabil-ities over all possible label assignments is equal to 1. Thetype of this model is known as Conditional Random Field[13] in the literature of machine learning.
In our implementation, the unary factors have the follow-ing form:
φ(Ck = l,xk) = exp(θlfl(xk) + θl0)
where fl(xk) are the probabilistic outputs of the random for-est classifier for each label l = {smoking, eating, other}.The parameters {θl, θl,0} re-scale the probabilities of therandom forest classifier, and are learned from the training
data. The exp function ensures that the final result will lie inthe interval [0, 1] (i.e., will also be a probability) after apply-ing the normalization constant, as typically done in logisticregression and log-linear CRF models [19].
The pairwise factors evaluate how likely is to assign pairsof labels in consecutive segments and are expressed as:
ψ(Ck = l, Ck+1 = l′) = exp(θl,l′)
The parameters θl,l′ are also learned from the training data.The learned parameters turn out to favor the same label forconsecutive segments, as expected.Parameter learning: It is extremely hard to hand-tunethe parameters θ = {θl, θl,0, θl,l′} in the above probabilis-tic model. Instead, the model parameters are learned suchthat they maximize the likelihood of the training sequences.Specifically, the parameters are estimated to maximize thefollowing objective function [12]:
L({λk}) =N∑n=1
log(P (C[n] | x[n]))− µ||θ||2
where the first term expresses the log likelihood of the train-ing sequences given their features. The second term is a reg-ularization term that penalizes large values in the parameters.Such large values would favor over-fitting of the parametersto the training dataset, and are less likely to generalize to newdata. The parameter µ is selected through cross-validation.
The objective function is maximized using the L-BFGSmethod [14] which is a popular optimization method forsolving unconstrained optimization problems. The objectivefunction is convex function, thus, a unique maximum exists[12].Inference: Given a sequence of segments, we estimate themost likely joint assignment of labels to the segments basedon the above model. From the assigned labels, we can sim-ply extract the different gesture sessions by tracking whenthe label changes in the sequence of segments.
Inference is performed with the technique known as max-product belief propagation [12], which yields the most likelysequence labeling in this type of model. The complexity ofthe evaluating the unary and pairwise terms, as well as ex-ecuting belief propagation is linear in the number of seg-ments, thus the labelings can be predicted very efficiently.
5. LABELED DATA COLLECTIONIn this section, we describe the framework used to capture
ground truth data in uncontrolled environment settings witha low labeling overhead for the user, and the dataset that weobtained through this approach. The main idea is to havethe subject wear two inertial sensors, one at the wrist, andone at the elbow, and segment the data post-facto through a3D visualization tool. We note that the use of two sensorsis used only for gathering training data. During actual usageof RisQ (i.e., during testing), the user always wear a singleIMU on a wristband, which is more practical, user-friendly,and less costly.
8
(a) (b) (c)
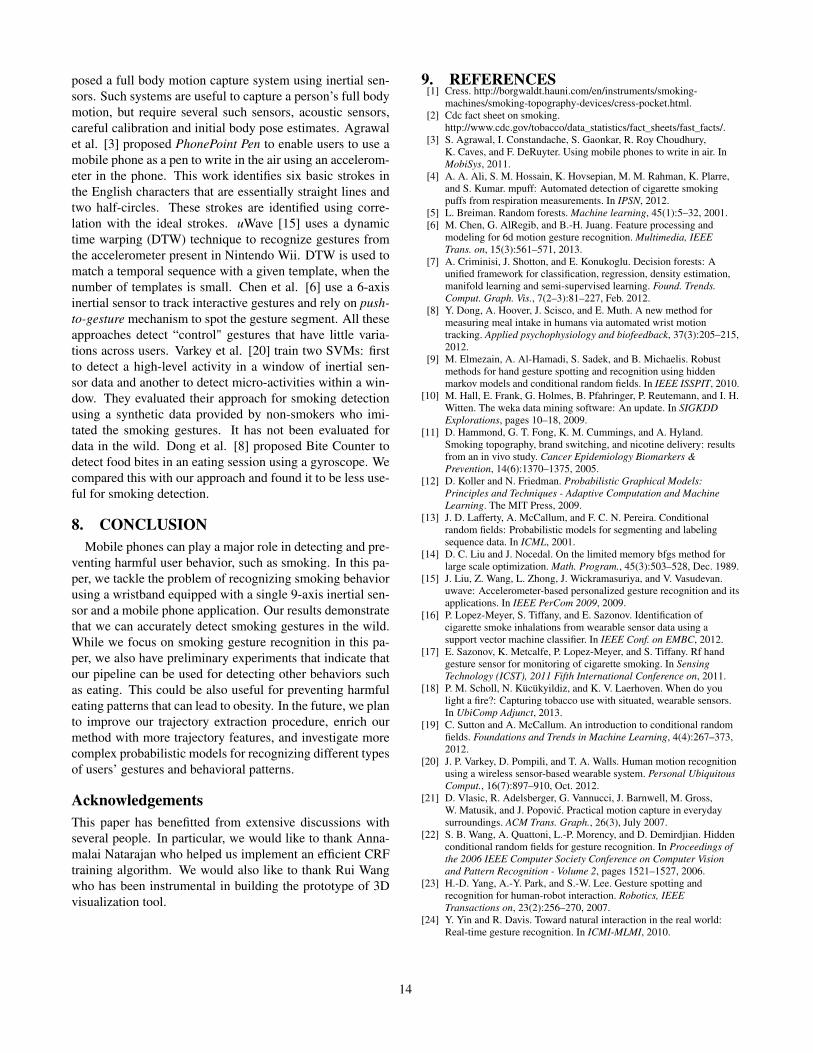
Figure 6: Smoking gesture visualization using sensordata obtained from the two IMUs placed on the upperarm and the wrist.
5.1 Labeling Framework
Sensors: We use Invensense MPU-9150 IMU to obtainorientation data sampled at 50Hz. We fit a user with a wrist-band and an armband, each containing an IMU device anduse a mobile app to log the sensor data on the phone. Ourgoal is to reconstruct the hand gestures performed by a userusing the logged data.
Constructing hand gesture: A human arm consists of anupper arm and a forearm. The upper arm is connected tothe shoulder, and is connected with the forearm at the elbow.The forearm extends from the elbow to the wrist. For con-structing the hand motion, we assume that the orientationis uniform for the entire forearm and the entire upper arm.This assumption is simplistic as the orientation of the fore-arm close to the elbow can be different from the orientationof the wrist but this assumption enables us to reconstruct afairly accurate hand motion with fewer sensors.
In order to reconstruct the hand motion, we use a digitalmodel of a 3D human skeleton in a polygon mesh format(Figure 6). The 3D model consists of skeletal limbs that thatcan be oriented independently by applying the orientationinformation in the form of quaternions to the shoulder andelbow joints of the skeleton. The orientations given by thequaternions are applied to the skeleton hierarchically as inskeleton-based animation methods commonly used in com-puter graphics applications. Given that we log the sensordata at 50Hz, we render the 3D model at 50 frames per sec-onds where we draw a new pose of the 3D model every frameto enable real-time playback. Rendering is implemented inProcessing 2, a popular library used in computer graphics.
Labeling: Using the 3D animation and visualization methoddescribed above, we can now mark the start and the end of agesture like a cigarette puff. However, manually visualizingand marking the gesture for hours of data can be a time-consuming exercise, and in the absence of any additionalinformation, it is difficult to distinguish smoking or eatingfrom any confounding gestures that may look similar. Toaddress this, we ask the participating users in the data col-lection to mark the beginning and the end of the smoking and
eating periods using a mobile app. For fine-grained gesturelabeling, we limited our efforts to the marked periods.
5.2 Gesture DatasetOur dataset consists of IMU data collected for over 32
hours from 15 volunteers for over 20 smoking sessions, 15eating sessions, 6 drinking sessions, and a variety of othergestures. Users typically wear sensors for several hours,therefore, our dataset contains many potential confoundinggestures. Of this data, we had to discard a few smoking andeating sessions due to interruptions and extreme noise in thedata. This left us with 28 hours of data, containing 17 smok-ing sessions and 10 eating sessions. Overall these sessionsinclude 369 smoking puffs and 252 food bites. The data in-cluded users performing several concurrent activities includ-ing smoking while standing alone, smoking in a group whilehaving a conversation, smoking using a hand-rolled cigaretteand smoking while walking around.
We used our 3D visualization and labeling tool to hand-label the start and end of each smoking puff within the smok-ing periods reported by the participants. There are a fewinstances when defining a precise start or a precise end ofa gesture is not possible. Since our focus is on detecting asmoking puff, any interval that begins at least 1 second priorto the puff and ends after at least 1 second of the puff is validfor training our algorithm.
6. EVALUATIONOur evaluation has three parts. We start with evaluat-
ing how well we detect individual smoking gestures (takingsmoking “puffs”) and whole smoking sessions. Then, wecompare our results against prior work that detects wrist ges-tures and smoking behavior. Finally, we include a user studyfor which we implemented the full computational pipelineon a mobile phone, and demonstrate the effectiveness ofRisQ for recognizing users’ smoking sessions in real-time.
6.1 Recognizing smoking sessionsThe ultimate goal of our work is to detect smoking ses-
sions accurately so that we can track: a) how many times auser smoked each day, b) the length of each smoking session,and c) how many puffs they took during each session.
Smoking session detection: First, we look at how manysmoking sessions were identified correctly by RisQ. We rana leave-one-out cross-validation experiment where we leavea single smoking session for testing, and use rest of the datafor training. We repeat this procedure for each smoking ses-sion in our dataset described in §5. At each time, we evaluatethe output of max-product belief propagation in our CRF.
RisQ detected 15 complete sessions out of the 17 sessionsin our dataset— it missed 2 smoking sessions for two userswho had gestures largely different from other users.
RisQ is also able determine the duration of smoking ses-sions. Table 2 shows the results of this experiment. The av-erage ground-truth session duration in this set up was 326.2
9

seconds. We observe an average error of 65.7 seconds inour session duration estimate for the 17 smoking sessions inour leave-one-out cross-validation experiment. We note thatwhen we exclude the two undetected sessions, the averageerror is reduced to 26.22 seconds. The errors are caused dueto the approximate estimates of the beginning and end time-stamps of each session.
Statistic Avg ± Std. Dev.Duration of smoking sessions 326.21±19.65 s
Error in estimation 65.7±30.6 s
Table 2: Errors in session duration estimates using ourCRF.
6.2 Recognizing smoking gesturesWe examine now how well we can recognize individual
hand-to-mouth smoking gestures that correspond to each smok-ing puff in a session. Since the total number of smokinggestures is large in our dataset (369 “smoking puffs”, 252“food bites” and 4976 other gestures), we perform a 10-foldcross-validation experiment here: we split the gestures into10 groups (folds), and of the 10 folds, a single fold is re-tained for testing, and the remaining 9 are used for training.Then we repeat for each test fold.
First, we evaluate how well individual smoking gesturescan be detected by the Random Forest (RF) classifier whichexamines each segment independently of the others. Thenwe evaluate the performance of the CRF that infers the typeof gesture for each segment by considering the probabilisticdependencies of the segment labels in a sequence.Gesture detection performance: Table 3 shows the per-formance metrics for 10-fold cross-validation for smokingpuff gesture detection using i) the RF classifier , and ii) CRF.We see that the RF classifier gives 93% accuracy in gesturerecognition, and a moderate precision value of 0.72 in de-tecting smoking gestures. The CRF significantly improvesthe performance by reducing the number of false positivesby 75.83%. This results in a much higher precision value of0.91 in detecting smoking gestures, and overall 95.74% ac-curacy in overall gesture recognition. The CRF only causesa slight decrease in recall from 0.85 to 0.81.Optimizing performance: We now examine how we canoptimize the precision and recall for smoking gesture detec-tion by tuning our method. While training the RF classi-fier, we use a cost function that adds a penalty for missinga training smoking gesture. When this penalty is increased,it increases recall for the smoking gestures, although it alsoincreases the number of false positives. Figure 7 shows thechange in precision and recall obtained using RF versus CRFas this penalty increases. We can make two observationshere: first, a false positive rate as small as 0.05 results in asignificant drop in precision (0.6) of the RF classifier. Thisis because of the large number of non-smoking hand ges-tures. Second, the CRF cleans up the mis-classifications of
the RF classifier to improve precision. Figure 7 shows thatthis improvement can be as high as 0.53. However, this im-provement comes at a cost of drop in recall, as CRF smoothsout some of the true gestures. We can see that the best per-formance is achieved for a false positive rate of 0.023.
0 0.1 0.2 0.3 0.4 0.5 0.6 0.7 0.8 0.9
1
0.003 0.01 0.023 0.1 1
False-positive Rate(RF)
Precision(RF)Recall(RF)
Precision(CRF)Recall(CRF)
Figure 7: Precision & Recall versus False Positive rate,while adjusting the cost function of the Random Forest(RF) classifier during training. A small increase in falsepositive rate reduces precision of the RF classifier but theCRF improves the precision dramatically.
Generalization across subjects: We now examine whetherour method can successfully detect gestures for a user by us-ing training data only from other users. In other words, weexamine how well our method generalizes to new users’ datanot included during training. For this experiment, we testthe smoking gesture detection for each of 14 smokers, giventraining data from the other 13 in our dataset. Figure 8 showsprecision and recall in this “leave-one-user-out” scenario us-ing the Random Forest classifier and the CRF. The precisionand recall of our method are high on average which indicatesthat our method is able to generalize to new users. In partic-ular, the CRF improves precision, but it may occasionallyfilter out correctly detected puffs. This happens if the user’sgestures and their temporal distribution is largely differentfrom what is observed in the training. This suggests the it isbetter to acquire training data from a variety of users.
6.3 Comparison #1: Bite CounterOur first comparison examines a different IMU-based ges-
ture recognition technique, and the benefits of using our com-putational pipeline.
Bite-Counter [8] is a state-of-art method to detect eatingbites while having a meal using angular velocity from a gy-roscope worn on the wrist. The intuition is that the angu-lar velocity about the axis along the wrist increases abovean empirically observed threshold (T1) while taking a biteand drops below another threshold (T2) after taking the bite.Also, there is a minimum time-lapsed (T3) between thesetwo threshold-crossing events while eating food, and a thresh-
10

Performance MetricsAccuracy Recall Precision False-positive rate
Random Forests 93.00% 0.85 0.72 0.023CRF 95.74% 0.81 0.91 0.005
Table 3: Performance metrics for smoking puff detection obtained using 10-fold cross-validation evaluation with i)Random Forests classifier (RF), ii) Conditional Random Fields (CRF) with Random Forests. CRF reduces 75.83% ofthe number of false positives generated by RF, thus improving precision.
0 0.1 0.2 0.3 0.4 0.5 0.6 0.7 0.8 0.9
1
1 2 3 4 5 6 7 8 9 10 11 12 13 14
User
Precision Recall
(a) Random Forests
0 0.1 0.2 0.3 0.4 0.5 0.6 0.7 0.8 0.9
1
1 2 3 4 5 6 7 8 9 10 11 12 13 14
User
Precision Recall
(b) CRF
Figure 8: “Leave-one-user-out” evaluation results. The CRF improves precision over the RF classifier. Occasionally theCRF smooths out puffs correctly detected by the RF classifier resulting in a slightly lower recall.
Eating Sessions All dataRecall Precision Recall Precision
Bite-Counter 0.60 0.57 0.65 0.03RF 0.92 0.78 0.69 0.64
CRF N/A N/A 0.64 0.78
Table 4: Eating gesture detection using Bite-counter [8]for cases: i) within eating sessions when it is known thatuser is having a meal, and ii) when session information isnot available.
old on the time interval between two consecutive bites (T4).Thus, this algorithm requires searching for the values of thesefour parameters: {T1, T2, T3, T4} that have the best score.The score is given by 4
7× precision+ 37×recall. One caveat
is that the Bite-Counter algorithm knows when an eating ses-sion is in progress since the user presses a button, whereasRisQ requires no such information.
Eating gesture detection: For a fair comparison, we firstlook exclusively at eating sessions in our dataset, and trainRisQ to detect eating gestures using the same feature set andapproach that we used for smoking. For this purpose, welabeled the bite gestures in 10 of the eating sessions in ourdataset. Table 4 shows the results for two cases — one wherewe examine eating gesture detection within known eatingsessions (case for which Bite-Counter is optimized), and onewhere we look across the entire data that includes all typesof gestures. For evaluation limited to eating sessions, weonly use the Random Forest classifier, and excluded CRF as
In-Sessions All dataRecall Precision Recall Precision
Bite-Counter 0.60 0.71 0.73 0.05RF 0.97 0.95 0.85 0.72
CRF N/A N/A 0.81 0.91
Table 5: Smoking gesture detection using Bite-counter[8] for cases: i) within smoking sessions when it is knownthat user is smoking, and ii) when session information isnot available.
we do not need to detect sessions. Even when only lookingwithin the eating sessions, we see that RisQ has substantiallyhigher precision and recall (21% improvement in precisionand 32% improvement in recall). We suspect that our ben-efits are primarily due to the use of more robust trajectory-based features rather than just the wrist rotation, and the useof the Random Forest classifier as opposed to simple thresh-olds. As might be expected, when the eating sessions are notknown a priori, the performance of Bite-Counter drops sub-stantially. Bite-Counter still has good recall, but the preci-sion is extremely low (0.03) i.e., the algorithm is generatinga huge number of mis-classifications since it is picking up asubstantial fraction of cases where the wrist is rotated, anddetecting them as a bite.
We must note here that RisQ was not designed to de-tect eating behavior in the first place. Thus, it is possiblethat with more careful exploration of features, the detectionof eating gestures can improve. However, the fact that it
11

performs better even without such tuning demonstrates thebroader potential of our approach for gestures other thansmoking.
Smoking gesture detection: Just as RisQ can be re-trainedto detect eating gestures, Bite-Counter can be re-trained todetect smoking gestures by looking for wrist rotations thatare representative of smoking. We use the methodology in[8] to learn appropriate parameters for Bite-Counter if it wereused for detection smoking gestures. Table 5 shows the com-parative results. The results clearly show that RisQ performmuch better than Bite-counter.
6.4 Comparison #2: mPuffWe now turn to an alternate approach for detecting smok-
ing gestures using a respiration chest band: mPuff [4]. Al-though the results are on different datasets, mPuff reportsprecision of 91%, true positive rate of 83% and false pos-itive rate of 8%. Our results are similar for precision, andbetter for other metrics.
To directly compare these methods, we collected severalhours of data from the Zephyr Bioharness Chestband for res-piration data and the wrist-worn IMUs. Our dataset was cap-tured in the wild, and has several smoking sessions in addi-tion to other activities such as drinking, driving, walking,working on a computer, and so on.
We used the approach suggested in mPuff, which suggestsa list of features and the use of an SVM classifier for trainingthe parameters. However, there was substantial noise in thebreathing dataset due to other concurrent activities (walking,driving, etc), as a result of which many breathing waveformshad to be discarded prior to training the classifier. The re-sults of training using the clean breathing waveforms wereunsuccessful, and we got low precision/recall numbers us-ing mPuff. The results using RisQ instead were similar tothose shown earlier.
While further exploration is needed for a quantitative com-parison, we highlight that dealing with noise and confoundersis a challenge no matter what sensor modality is used for de-tecting behaviors such as smoking. The fact that RisQ workswell despite the confounders is one of its major strengths.
6.5 User Study in the WildOur final study looks at the entire computational pipeline
learnt using the dataset described in §5, and executed in realtime for new users.
Android-based Implementation: Our Android-based im-plementation for the user study comprises of a wearable wrist-band with an IMU and bluetooth that continuously streamsquaternions at a rate of 50 Hz to an Android phone. TheRisQ computational pipeline for real-time smoking sessiondetection is executed on the phone. Our application gener-ates notifications when it detects that a smoking session is inprogress and prompts the user to confirm if the detection iscorrect. Apart from smoking detection, our application alsoacts as a logging app to record data from the IMU worn by
Figure 10: Smoking monitor mobile app and an IMU-equipped wristband.
a user and to record ground truth events like the beginningand the end of a smoking session.
The complete UI of the mobile application and an IMUequipped wristband are shown in Figure 10. The main inter-face of the app has a set of UI buttons that can be used by auser to report smoking events as well as confounding eventslike drinking and eating. A user can use this to report thesession boundaries using before, during and after the ses-sion events. In addition, the UI has a tab to view the eventspreviously reported by the user. A user can use this inter-face to correct the reported event times or to delete a reportif there was an error in submitting reports.
The complete gesture recognition pipeline has been im-plemented in Java. This pipeline detects smoking gesturesevery 20 seconds in the the buffered sensor data. The classi-fication is done using a Random Forest classification model,learnt using the Weka data mining software [10]. The clas-sification outputs are then buffered for a minute and used informing a CRF model to detect a smoking session in progress.The inference using CRF is done every minute, thus there isan average latency of 30 seconds in detecting the start of asmoking session.
User study: We recruited 4 users for this study. The userswore the IMU-fitted wristband for four hours per day forthree days. We asked these users to always carry the phonewith our mobile application installed. To record the groundtruth information, we ask users to report the rough start andthe end time for their smoking sessions using our app. Also,our app prompted these users whenever it detected smokingand the users could respond by confirming yes or no. Ourgoal was to check how well our algorithm would work if itwere integrated into a real-world intervention algorithm thata therapist might use, such as a phone call or text message.
How well can RisQ deliver real-time interventions?: Fig-ure 9 shows the actual number of sessions, number of ses-sions detected by the mobile app correctly and the number
12

0
1
2
3
4
5
S1 S2 S3 S4
Nu
mb
er o
f S
essi
on
s
User
True CountTrue Positives
False Positives
(a) Day 1
0
1
2
3
4
5
S1 S2 S3 S4
Nu
mb
er o
f S
essi
on
s
User
True CountTrue Positives
False Positives
(b) Day 2
0
1
2
3
4
5
S1 S2 S3 S4
Nu
mb
er o
f S
essi
on
s
User
True CountTrue Positives
False Positives
(c) Day 3
Figure 9: User study results for 4 subjects for 3 days. Figures show the following information for each subject and eachday: i) ground-truth count of the smoking sessions, ii) number of sessions detected correctly i.e. true positives, and iii)number of falsely detected sessions i.e. false positives. The results show that we rarely missed a session and had only afew false detections (0-2) per day.
of sessions falsely detected for the four users. We see thatthe number of sessions varied between 1 to 5 in a day forthe period that the mobile app was running. Of all the 30reported smoking sessions, we missed only 3 sessions. Thenumber of false session detections was low and less than orequal to 2 per day. In our informal exit interviews with theusers, they reported no discomfort from the small number offalse alarms that was raised by RisQ. In summary, the userstudy provides strong evidence of the effectiveness of ourtechnique in recognizing smoking sessions across users inreal-world scenarios.
Statistic ValueTime for segmentation 92.34±6.85 ms (52-134ms)Time for feature extraction 79.88±5.30 ms (9-227ms)Time for CRF Inference 5.89±2.50 ms (1-23ms)Memory 12-20 MBBinary Size 1.7 MB
Table 6: System overhead measured on a Galaxy Nexusphone
Operating Voltage 2.4-3.6 VOperating Current 4.25 mAStreaming Data rate 1150 bytes/s
Table 7: Specifications for Invensense MPU-9150 IMU
RisQ Implementation benchmarks: We finalized our eval-uation with a brief benchmark of our real-time implementa-tion of RisQ. We first demonstrate that our mobile app has alow system overhead. Table 6 shows the summary of the exe-cution overhead of the smoking detection pipeline measuredon Samsung Galaxy Nexus device running Android 4.3 OS.The execution of the three stages in the pipeline: segment ex-traction, feature vector extraction and session detection us-ing the CRF take an average time of 92.34 ms, 79.88 ms and6 ms respectively. These overheads are incurred every 20
seconds for segmentation and feature extraction and once ina minute for the CRF inference. The memory requirementto execute our app is modest and varies between 12-20 MB.Users running our application for the user study did not findour app to impact the performance of their phones in theirdaily usage.
Table 7 gives the performance metrics for the operation ofInvensense MPU-9150 IMU that we used in our user study.
7. RELATED WORKIn this section, we describe the two areas of related work
— gesture recognition in computer vision as well as gesturerecognition and motion capture using wearable inertial sen-sors.Computer Vision: This line of research deal with the prob-lem of gesture detection and recognition using a camera. Thecamera is used to track a person and the motion of the arm.This gives the coordinates of various points on the body thatcan be used as features for gesture recognition. Yang et al.[23] used Hidden Markov Models (HMM) for segmentingand identifying the set of gestures for human-robot interac-tion. Elmezain et al. [9] proposed a method to use Condi-tional Random Fields to separate gestures from non-gestureswithout needing to train for non-gestures. Wang et al. [22]combined HMMs with CRFs in a Hidden Conditional Ran-dom Field that can be used as a single gesture class detectoror a multi-way gesture classifier. All these methods employsimilar machine learning formulations, however, recogniz-ing arms accurately in images or video is prone to errorsdue to occlusions, clothing, illumination changes and othererrors in pose tracking from 2D images. These computer vi-sion methods also assume that the user is always expectedto turn towards the camera. Yin et al. [24] use HMMs forgesture recognition but it requires a use of special glove toenable the tracking of the arm in a cluttered background.Wearable sensors: The advances in wearable sensors tech-nology has generated a lot of interest in gesture recognitionand other novel uses of these sensors. Vlasic et al. [21] pro-
13
posed a full body motion capture system using inertial sen-sors. Such systems are useful to capture a person’s full bodymotion, but require several such sensors, acoustic sensors,careful calibration and initial body pose estimates. Agrawalet al. [3] proposed PhonePoint Pen to enable users to use amobile phone as a pen to write in the air using an accelerom-eter in the phone. This work identifies six basic strokes inthe English characters that are essentially straight lines andtwo half-circles. These strokes are identified using corre-lation with the ideal strokes. uWave [15] uses a dynamictime warping (DTW) technique to recognize gestures fromthe accelerometer present in Nintendo Wii. DTW is used tomatch a temporal sequence with a given template, when thenumber of templates is small. Chen et al. [6] use a 6-axisinertial sensor to track interactive gestures and rely on push-to-gesture mechanism to spot the gesture segment. All theseapproaches detect “control" gestures that have little varia-tions across users. Varkey et al. [20] train two SVMs: firstto detect a high-level activity in a window of inertial sen-sor data and another to detect micro-activities within a win-dow. They evaluated their approach for smoking detectionusing a synthetic data provided by non-smokers who imi-tated the smoking gestures. It has not been evaluated fordata in the wild. Dong et al. [8] proposed Bite Counter todetect food bites in an eating session using a gyroscope. Wecompared this with our approach and found it to be less use-ful for smoking detection.
8. CONCLUSIONMobile phones can play a major role in detecting and pre-
venting harmful user behavior, such as smoking. In this pa-per, we tackle the problem of recognizing smoking behaviorusing a wristband equipped with a single 9-axis inertial sen-sor and a mobile phone application. Our results demonstratethat we can accurately detect smoking gestures in the wild.While we focus on smoking gesture recognition in this pa-per, we also have preliminary experiments that indicate thatour pipeline can be used for detecting other behaviors suchas eating. This could be also useful for preventing harmfuleating patterns that can lead to obesity. In the future, we planto improve our trajectory extraction procedure, enrich ourmethod with more trajectory features, and investigate morecomplex probabilistic models for recognizing different typesof users’ gestures and behavioral patterns.
AcknowledgementsThis paper has benefitted from extensive discussions withseveral people. In particular, we would like to thank Anna-malai Natarajan who helped us implement an efficient CRFtraining algorithm. We would also like to thank Rui Wangwho has been instrumental in building the prototype of 3Dvisualization tool.
9. REFERENCES[1] Cress. http://borgwaldt.hauni.com/en/instruments/smoking-
machines/smoking-topography-devices/cress-pocket.html.[2] Cdc fact sheet on smoking.
http://www.cdc.gov/tobacco/data_statistics/fact_sheets/fast_facts/.[3] S. Agrawal, I. Constandache, S. Gaonkar, R. Roy Choudhury,
K. Caves, and F. DeRuyter. Using mobile phones to write in air. InMobiSys, 2011.
[4] A. A. Ali, S. M. Hossain, K. Hovsepian, M. M. Rahman, K. Plarre,and S. Kumar. mpuff: Automated detection of cigarette smokingpuffs from respiration measurements. In IPSN, 2012.
[5] L. Breiman. Random forests. Machine learning, 45(1):5–32, 2001.[6] M. Chen, G. AlRegib, and B.-H. Juang. Feature processing and
modeling for 6d motion gesture recognition. Multimedia, IEEETrans. on, 15(3):561–571, 2013.
[7] A. Criminisi, J. Shotton, and E. Konukoglu. Decision forests: Aunified framework for classification, regression, density estimation,manifold learning and semi-supervised learning. Found. Trends.Comput. Graph. Vis., 7(2–3):81–227, Feb. 2012.
[8] Y. Dong, A. Hoover, J. Scisco, and E. Muth. A new method formeasuring meal intake in humans via automated wrist motiontracking. Applied psychophysiology and biofeedback, 37(3):205–215,2012.
[9] M. Elmezain, A. Al-Hamadi, S. Sadek, and B. Michaelis. Robustmethods for hand gesture spotting and recognition using hiddenmarkov models and conditional random fields. In IEEE ISSPIT, 2010.
[10] M. Hall, E. Frank, G. Holmes, B. Pfahringer, P. Reutemann, and I. H.Witten. The weka data mining software: An update. In SIGKDDExplorations, pages 10–18, 2009.
[11] D. Hammond, G. T. Fong, K. M. Cummings, and A. Hyland.Smoking topography, brand switching, and nicotine delivery: resultsfrom an in vivo study. Cancer Epidemiology Biomarkers &Prevention, 14(6):1370–1375, 2005.
[12] D. Koller and N. Friedman. Probabilistic Graphical Models:Principles and Techniques - Adaptive Computation and MachineLearning. The MIT Press, 2009.
[13] J. D. Lafferty, A. McCallum, and F. C. N. Pereira. Conditionalrandom fields: Probabilistic models for segmenting and labelingsequence data. In ICML, 2001.
[14] D. C. Liu and J. Nocedal. On the limited memory bfgs method forlarge scale optimization. Math. Program., 45(3):503–528, Dec. 1989.
[15] J. Liu, Z. Wang, L. Zhong, J. Wickramasuriya, and V. Vasudevan.uwave: Accelerometer-based personalized gesture recognition and itsapplications. In IEEE PerCom 2009, 2009.
[16] P. Lopez-Meyer, S. Tiffany, and E. Sazonov. Identification ofcigarette smoke inhalations from wearable sensor data using asupport vector machine classifier. In IEEE Conf. on EMBC, 2012.
[17] E. Sazonov, K. Metcalfe, P. Lopez-Meyer, and S. Tiffany. Rf handgesture sensor for monitoring of cigarette smoking. In SensingTechnology (ICST), 2011 Fifth International Conference on, 2011.
[18] P. M. Scholl, N. Kücükyildiz, and K. V. Laerhoven. When do youlight a fire?: Capturing tobacco use with situated, wearable sensors.In UbiComp Adjunct, 2013.
[19] C. Sutton and A. McCallum. An introduction to conditional randomfields. Foundations and Trends in Machine Learning, 4(4):267–373,2012.
[20] J. P. Varkey, D. Pompili, and T. A. Walls. Human motion recognitionusing a wireless sensor-based wearable system. Personal UbiquitousComput., 16(7):897–910, Oct. 2012.
[21] D. Vlasic, R. Adelsberger, G. Vannucci, J. Barnwell, M. Gross,W. Matusik, and J. Popovic. Practical motion capture in everydaysurroundings. ACM Trans. Graph., 26(3), July 2007.
[22] S. B. Wang, A. Quattoni, L.-P. Morency, and D. Demirdjian. Hiddenconditional random fields for gesture recognition. In Proceedings ofthe 2006 IEEE Computer Society Conference on Computer Visionand Pattern Recognition - Volume 2, pages 1521–1527, 2006.
[23] H.-D. Yang, A.-Y. Park, and S.-W. Lee. Gesture spotting andrecognition for human-robot interaction. Robotics, IEEETransactions on, 23(2):256–270, 2007.
[24] Y. Yin and R. Davis. Toward natural interaction in the real world:Real-time gesture recognition. In ICMI-MLMI, 2010.
14