risks in china's financial system - wei xiongwxiong.mycpanel.princeton.edu/papers/risk.pdf ·...
TRANSCRIPT

FE10CH12_Xiong ARI 11 October 2018 13:52
Annual Review of Financial Economics
Risks in China’s FinancialSystemZheng (Michael) Song1 and Wei Xiong2,3,4
1Department of Economics, Chinese University of Hong Kong, Shatin, New Territories,Hong Kong; email: [email protected] of Economics and Bendheim Center for Finance, Princeton University, Princeton,New Jersey 08540, USA; email: [email protected] of Management and Economics and Shenzhen Finance Institute, Chinese University ofHong Kong, Shenzhen 518100, China4National Bureau of Economic Research, Cambridge, Massachusetts 01238, USA
Annu. Rev. Financ. Econ. 2018. 10:261–86
First published as a Review in Advance onOctober 1, 2018
The Annual Review of Financial Economics is onlineat financial.annualreviews.org
https://doi.org/10.1146/annurev-financial-110716-032402
Copyright c© 2018 by Annual Reviews.All rights reserved
JEL codes: E02, G01
Keywords
Chinese economy, debt risk, housing risk, policy risk, productivity
Abstract
Motivated by growing concerns about the risks and instability of China’sfinancial system, this article reviews several commonly perceived financialrisks and discusses their roots in China’s politico-economic institutions. Weemphasize the need to evaluate these risks within China’s unique economicand financial systems, in which the state and nonstate sectors coexist and thefinancial system serves as a key tool of the government to fund its economicpolicies. Overall, we argue that (a) a financial crisis is unlikely to happen inthe near future and (b) the ultimate risk lies with China’s economic growth,as a vicious circle of distortions in the financial system lowers the efficiencyof capital allocation and economic growth and will eventually exacerbatefinancial risks in the long run.
261
Ann
u. R
ev. F
inan
c. E
con.
201
8.10
:261
-286
. Dow
nloa
ded
from
ww
w.a
nnua
lrev
iew
s.or
g A
cces
s pr
ovid
ed b
y 72
.82.
224.
177
on 0
1/01
/19.
For
per
sona
l use
onl
y.
FE10CH12_Xiong ARI 11 October 2018 13:52
1. INTRODUCTION
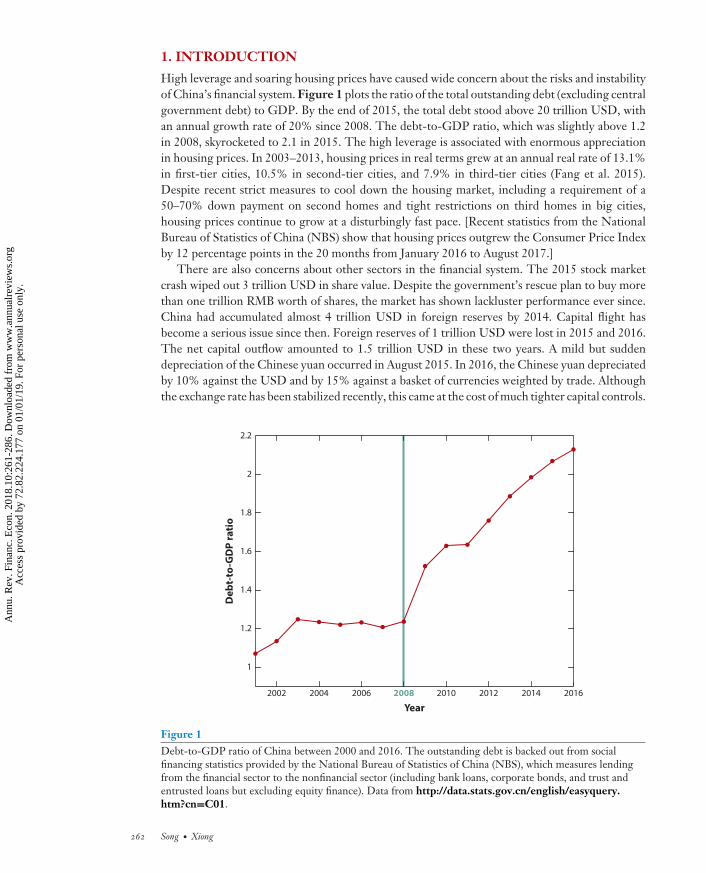
High leverage and soaring housing prices have caused wide concern about the risks and instabilityof China’s financial system. Figure 1 plots the ratio of the total outstanding debt (excluding centralgovernment debt) to GDP. By the end of 2015, the total debt stood above 20 trillion USD, withan annual growth rate of 20% since 2008. The debt-to-GDP ratio, which was slightly above 1.2in 2008, skyrocketed to 2.1 in 2015. The high leverage is associated with enormous appreciationin housing prices. In 2003–2013, housing prices in real terms grew at an annual real rate of 13.1%in first-tier cities, 10.5% in second-tier cities, and 7.9% in third-tier cities (Fang et al. 2015).Despite recent strict measures to cool down the housing market, including a requirement of a50–70% down payment on second homes and tight restrictions on third homes in big cities,housing prices continue to grow at a disturbingly fast pace. [Recent statistics from the NationalBureau of Statistics of China (NBS) show that housing prices outgrew the Consumer Price Indexby 12 percentage points in the 20 months from January 2016 to August 2017.]
There are also concerns about other sectors in the financial system. The 2015 stock marketcrash wiped out 3 trillion USD in share value. Despite the government’s rescue plan to buy morethan one trillion RMB worth of shares, the market has shown lackluster performance ever since.China had accumulated almost 4 trillion USD in foreign reserves by 2014. Capital flight hasbecome a serious issue since then. Foreign reserves of 1 trillion USD were lost in 2015 and 2016.The net capital outflow amounted to 1.5 trillion USD in these two years. A mild but suddendepreciation of the Chinese yuan occurred in August 2015. In 2016, the Chinese yuan depreciatedby 10% against the USD and by 15% against a basket of currencies weighted by trade. Althoughthe exchange rate has been stabilized recently, this came at the cost of much tighter capital controls.
2002 2004 2006 2008 2010 2012 2014 2016
1
1.2
1.4
1.6
1.8
2
2.2
Year
Deb
t-to
-GD
P ra
tio
Figure 1Debt-to-GDP ratio of China between 2000 and 2016. The outstanding debt is backed out from socialfinancing statistics provided by the National Bureau of Statistics of China (NBS), which measures lendingfrom the financial sector to the nonfinancial sector (including bank loans, corporate bonds, and trust andentrusted loans but excluding equity finance). Data from http://data.stats.gov.cn/english/easyquery.htm?cn=C01.
262 Song · Xiong
Ann
u. R
ev. F
inan
c. E
con.
201
8.10
:261
-286
. Dow
nloa
ded
from
ww
w.a
nnua
lrev
iew
s.or
g A
cces
s pr
ovid
ed b
y 72
.82.
224.
177
on 0
1/01
/19.
For
per
sona
l use
onl
y.

FE10CH12_Xiong ARI 11 October 2018 13:52
To systematically assess these financial risks, it is necessary to anchor the assessment on China’sunique economic structure that led to the current financial system. China started its economictransition in the late 1970s. A dual-track or gradualist approach has been adopted to tackle thefundamental issues inherited from the central planning regime, such as the soft budget constraintsyndrome as described by Kornai (1979, 1980), that go hand in hand with a large but inefficientstate sector. Although these problems have never been fully solved, they were greatly mitigateduntil 2008. Economic liberalization in the 1980s led to a booming private sector. The state sectorwas consolidated by the “grasp the large, let go of the small” policy started in the mid-1990s. Localgovernment budgets were tightened by the 1994 tax sharing reform and the 1995 Budget Law. A setof new rules and regulations were introduced to make commercial banks more independent afterthe 1997 Asian financial crisis. Consequently, investment went up, resource allocation improved,and growth took off (see, e.g., Zhu 2012, Zilibotti 2017).
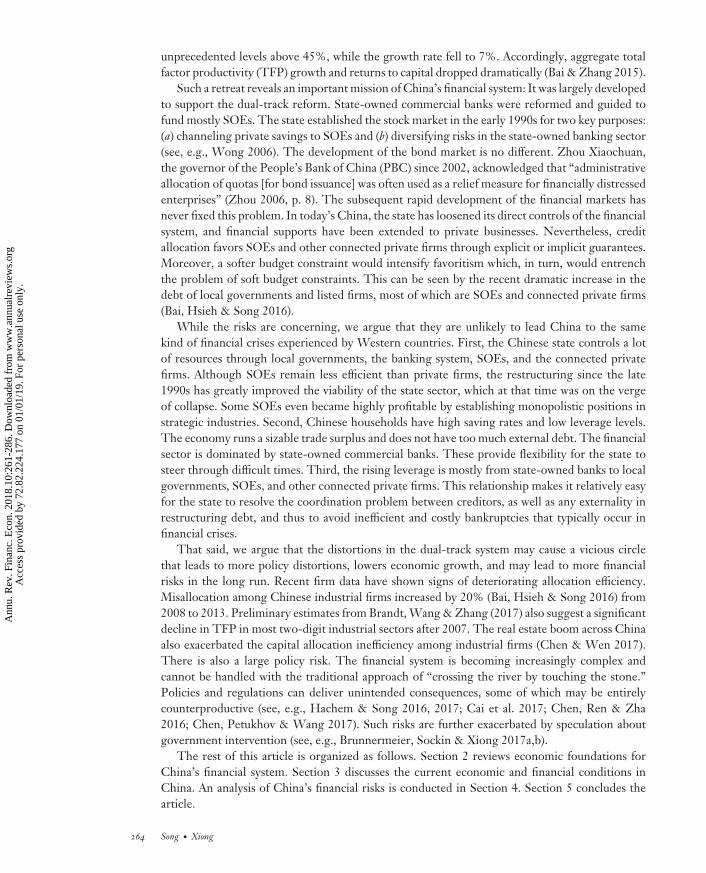
Unfortunately, the trend was reversed in the post-2008 period. China was hit hard by the 2008world financial crisis: GDP growth decreased from 15% in 2007 to 10% in 2008 and then 8% in2009 (see Figure 2). In response, the state launched a massive 4-trillion-yuan stimulus plan in late2008. While the stimulus boosted investment (see Figure 2), it came at the cost of compromisingsome fiscal and financial institutional arrangements that were established to contain problems, suchas soft budget constraints, that originated from the dual-track reform (Bai, Hsieh & Song 2016). Aswe elaborate below, the economic stimulus worsened the problem of soft budget constraints andreversed the flow of resources between the state and private sectors. Local government financingvehicles (LGFVs) and state-owned enterprises (SOEs) increased their investment but crowdedout more efficient private investment. While aggregate investment did increase, misallocationworsened and growth slowed. Figure 2 shows that investment and growth used to comove closelybefore 2008. After 2008, they started to depart from each other. The investment rate increased to
1980 1985 1990 1995 2000 2005
20082008
2010 201530
35
40
45
50
Inve
stm
ent r
ate
(%)
Investment rate
GDP growth
0
5
10
15
20G
DP
grow
th (%
)
Year
Figure 2Investment rate and GDP growth in China from 1978 to 2016. Data from China Statistical Yearbook 2017(Nat. Bur. Stat. China 2017).
www.annualreviews.org • Risks in China’s Financial System 263
Ann
u. R
ev. F
inan
c. E
con.
201
8.10
:261
-286
. Dow
nloa
ded
from
ww
w.a
nnua
lrev
iew
s.or
g A
cces
s pr
ovid
ed b
y 72
.82.
224.
177
on 0
1/01
/19.
For
per
sona
l use
onl
y.
FE10CH12_Xiong ARI 11 October 2018 13:52
unprecedented levels above 45%, while the growth rate fell to 7%. Accordingly, aggregate totalfactor productivity (TFP) growth and returns to capital dropped dramatically (Bai & Zhang 2015).
Such a retreat reveals an important mission of China’s financial system: It was largely developedto support the dual-track reform. State-owned commercial banks were reformed and guided tofund mostly SOEs. The state established the stock market in the early 1990s for two key purposes:(a) channeling private savings to SOEs and (b) diversifying risks in the state-owned banking sector(see, e.g., Wong 2006). The development of the bond market is no different. Zhou Xiaochuan,the governor of the People’s Bank of China (PBC) since 2002, acknowledged that “administrativeallocation of quotas [for bond issuance] was often used as a relief measure for financially distressedenterprises” (Zhou 2006, p. 8). The subsequent rapid development of the financial markets hasnever fixed this problem. In today’s China, the state has loosened its direct controls of the financialsystem, and financial supports have been extended to private businesses. Nevertheless, creditallocation favors SOEs and other connected private firms through explicit or implicit guarantees.Moreover, a softer budget constraint would intensify favoritism which, in turn, would entrenchthe problem of soft budget constraints. This can be seen by the recent dramatic increase in thedebt of local governments and listed firms, most of which are SOEs and connected private firms(Bai, Hsieh & Song 2016).
While the risks are concerning, we argue that they are unlikely to lead China to the samekind of financial crises experienced by Western countries. First, the Chinese state controls a lotof resources through local governments, the banking system, SOEs, and the connected privatefirms. Although SOEs remain less efficient than private firms, the restructuring since the late1990s has greatly improved the viability of the state sector, which at that time was on the vergeof collapse. Some SOEs even became highly profitable by establishing monopolistic positions instrategic industries. Second, Chinese households have high saving rates and low leverage levels.The economy runs a sizable trade surplus and does not have too much external debt. The financialsector is dominated by state-owned commercial banks. These provide flexibility for the state tosteer through difficult times. Third, the rising leverage is mostly from state-owned banks to localgovernments, SOEs, and other connected private firms. This relationship makes it relatively easyfor the state to resolve the coordination problem between creditors, as well as any externality inrestructuring debt, and thus to avoid inefficient and costly bankruptcies that typically occur infinancial crises.
That said, we argue that the distortions in the dual-track system may cause a vicious circlethat leads to more policy distortions, lowers economic growth, and may lead to more financialrisks in the long run. Recent firm data have shown signs of deteriorating allocation efficiency.Misallocation among Chinese industrial firms increased by 20% (Bai, Hsieh & Song 2016) from2008 to 2013. Preliminary estimates from Brandt, Wang & Zhang (2017) also suggest a significantdecline in TFP in most two-digit industrial sectors after 2007. The real estate boom across Chinaalso exacerbated the capital allocation inefficiency among industrial firms (Chen & Wen 2017).There is also a large policy risk. The financial system is becoming increasingly complex andcannot be handled with the traditional approach of “crossing the river by touching the stone.”Policies and regulations can deliver unintended consequences, some of which may be entirelycounterproductive (see, e.g., Hachem & Song 2016, 2017; Cai et al. 2017; Chen, Ren & Zha2016; Chen, Petukhov & Wang 2017). Such risks are further exacerbated by speculation aboutgovernment intervention (see, e.g., Brunnermeier, Sockin & Xiong 2017a,b).
The rest of this article is organized as follows. Section 2 reviews economic foundations forChina’s financial system. Section 3 discusses the current economic and financial conditions inChina. An analysis of China’s financial risks is conducted in Section 4. Section 5 concludes thearticle.
264 Song · Xiong
Ann
u. R
ev. F
inan
c. E
con.
201
8.10
:261
-286
. Dow
nloa
ded
from
ww
w.a
nnua
lrev
iew
s.or
g A
cces
s pr
ovid
ed b
y 72
.82.
224.
177
on 0
1/01
/19.
For
per
sona
l use
onl
y.
FE10CH12_Xiong ARI 11 October 2018 13:52
2. ECONOMIC FOUNDATIONS
The Chinese government developed the financial system with a mission to finance China’s eco-nomic reform. This mission has so far dictated many aspects of China’s financial system, such as itsownership structure, its development path, and the models it takes to finance different firms in theeconomy, which ultimately determine the risks and stability of the financial system itself. In thissection, we briefly review China’s economic reform and the roles played by the financial system.
2.1. Dual-Track Liberalization
The economic reform that the Chinese government started in the early 1980s has led to spectaculareconomic growth during the past 35 years; the average annual growth rate has been nearly 10%,and hundreds of millions of people have been lifted out of poverty. At the core of the reform wasa dual-track approach that allows the coexistence of SOEs and private businesses. The successof the economic reform has proved several important advantages of this dual-track approach.First, it supports gradualism. As we elaborate below, by continuing to support SOEs, the dual-track approach avoided a sudden collapse of the state sector and the likely consequence of massiveunemployment and social instability. (For a theoretical framework on the dynamic sustainability ofChina’s politico-economic regime, see Wang 2016.) For this reason, the dual-track approach is alsoreferred to as a “reform without losers”; Lau, Qian & Roland (2000) establish the conditions underwhich dual-track price liberalization is Pareto-improving. By minimizing the political resistance toprivate business, the dual-track approach has given birth to more than 20 million private firms. Inaddition, the dual-track approach nurtured “crony capitalism with Chinese characteristics” (Bai,Hsieh & Song 2018). Many private firms are closely connected with local governments, whichhelp remove entry barriers, cut red tape, and offer financial support. In fact, China’s phenomenalgrowth largely has been driven by the growth of private businesses (see, e.g., Song, Storesletten& Zilibotti 2011; Brandt, Van Biesebroeck & Zhang 2012).
Second, the boom of the private sector forced the state to improve the efficiency of SOEs and totighten their soft budget constraints. The restructuring of the state sector was conducted under theslogan “grasp the large, let go of the small,” i.e., shut down or privatize small SOEs and corporatizebig SOEs. The specific measures of corporatization included, for example, establishing corporategovernance, introducing a profit-based evaluation system, and rescinding administrative orderson daily operation. The transformation was successful to the extent that big SOEs improved theirproductivity relative to their private counterparts (Hsieh & Song 2015). More important, fiscaldecentralization was replaced with centralization by the 1994 tax sharing reform, the Budget Law,and other policies and regulations. [This can be viewed as a turning point of decentralization or aseconomic liberalization started in the 1980s; see Huang (2008).] The central government is ableto effectively control and allocate key resources in the economy, such as natural resources, publicutilities, transportation, telecommunication, and finance, through the SOEs (Lin, Cai & Li 1998).With its ability to mobilize these important resources, the Chinese government has an unparalleledcapacity to implement its economic policies, such as investment in large, capital-intensive infra-structure projects to upgrade roads, bridges, highways, airports, and ports throughout the country.
Nevertheless, the dual-track approach also comes with remarkable downsides. A key concernis that the protection of SOEs nurtures vested interests, which, in turn, blocks further reforms.Since 2008, the size of the state sector has stabilized at about 30% of the industrial sector, and theTFP convergence between SOEs and private firms has also stopped, with the capital productivityof SOEs remaining at about half of that of private firms (Hsieh & Song 2015). The state sectoris even bigger in service industries, where misallocation is also significantly more severe (see Geet al. 2017).
www.annualreviews.org • Risks in China’s Financial System 265
Ann
u. R
ev. F
inan
c. E
con.
201
8.10
:261
-286
. Dow
nloa
ded
from
ww
w.a
nnua
lrev
iew
s.or
g A
cces
s pr
ovid
ed b
y 72
.82.
224.
177
on 0
1/01
/19.
For
per
sona
l use
onl
y.

FE10CH12_Xiong ARI 11 October 2018 13:52
In contrast to what one would have expected, the financial system served mainly to supportthe inefficient state sector rather than funding the booming private sector. The banking systemwas developed in the late 1970s and early 1980s by splitting the commercial banking businessesof the PBC into four state-owned commercial banks (the Big Four): Agricultural Bank of China,Bank of China, Construction Bank of China, and Industrial and Commercial Bank of China.These state banks provided disproportional amounts of bank loans to support ailing SOEs andsuffered enormous capital losses in the 1990s and the early 2000s.1 With the banking systemsubstantially limited by its bad loans, the stock market was created in the early 1990s to provideanother funding source for the SOEs as well as a mechanism to reform their governance (see, e.g.,Allen & Shen 2012; Allen, Qian & Gu 2017). The two stock exchanges in Shanghai and Shenzhenprimarily listed SOEs in the early years; they started to list private firms only recently. The twobond markets, one an interbank market established in 1996 and the other an exchange marketestablished in 2007, also favor bonds issued by local governments and SOEs (see, e.g., Borst &Lardy 2015). As we elaborate below, the special mission of the financial system to support SOEshas had profound impacts on both the efficiency and risks of the financial system. In particular, itmade the financial system heavily exposed to the problems of SOEs.
2.2. Soft Budget Constraint
Soft budget constraint is a term originating from Kornai’s study of centrally planned and transitioneconomies. Such a constraint can arise in many circumstances due to the lack of commitment not tosupport a BC-organization (i.e., an organization that has a budget constraint) by an S-organization(i.e., an organization ready to cover deficits of the BC-organization) (see, e.g., Dewatripont &Maskin 1995; Kornai, Maskin & Roland 2003). In the context of China, SOEs enjoy a soft budgetconstraint, as the government lacks the commitment to liquidate losing SOEs. The soft budgetconstraint per se is a powerful explanation for the low efficiency of the state sector. The softbudget constraint, provided by the government through explicit and implicit subsidies, is also acornerstone for the asymmetry in access to financial resources between SOEs and private firms,which has been vital to the survival of SOEs.
The favoritism for SOEs is ubiquitous in China’s financial system. For instance, SOEs canborrow at regulated interest rates and go public with priority, while most private firms have to relyon internal financing or borrow from informal channels at much higher interest rates (Allen, Qian& Qian 2005). The responsibility of state banks to support the soft budget constraint of the SOEshas also been a key source of bad loans for state banks in the 1990s and the early 2000s (for themandate of the stock market to fund SOEs as a reason for the lack of efficiency of China’s stockmarket, see Allen & Qian 2014). Consequently, there is a large and persistent gap of returns tocapital between SOEs and private firms. Capital allocation is severely distorted (Hsieh & Klenow2009, Hsieh & Song 2015, Song & Wu 2015).
All the major commercial banks are state owned and enjoy a soft budget constraint themselves.Their profits are protected by the spread between the benchmark bank deposit rates and lend-ing rates, which are set by the PBC (for a discussion of China’s interest rate liberalization, seeSection 3). This spread has remained about 3% in the past 20 years. When this spread was insuf-ficient to cover the bad loans of these banks in the 1990s and early 2000s, the government twice
1See, e.g., Allen et al. (2012) and Walter & Howie (2012). In the 1980s and 1990s, nonperforming loans were typicallyabsorbed by money creation that led to chronic high inflation (Brandt & Zhu 2000).
266 Song · Xiong
Ann
u. R
ev. F
inan
c. E
con.
201
8.10
:261
-286
. Dow
nloa
ded
from
ww
w.a
nnua
lrev
iew
s.or
g A
cces
s pr
ovid
ed b
y 72
.82.
224.
177
on 0
1/01
/19.
For
per
sona
l use
onl
y.

FE10CH12_Xiong ARI 11 October 2018 13:52
recapitalized them and eventually listed all of them on the stock markets, both inside China onthe Shanghai Stock Exchange and outside on the Hong Kong Stock Exchange.
Local governments at all levels of the government hierarchy also enjoy a soft budget constraintfrom the central government. Fiscal decentralization in the 1980s allowed local officials to keepfiscal surpluses, which could be used to support local projects. Local fiscal capacity has been greatlyexpanded by land revenue since the 1990s. As will be discussed in Section 3, the financial dereg-ulation after 2008 further relaxed local governments’ budget constraint, granting more flexibilityfor local officials to influence credit allocation.
A direct implication of the soft budget constraint is that SOEs, state banks, and local govern-ments are not as price sensitive as one would expect from profit-maximizing agents. For example,after the crisis-induced economic stimulus program ended in 2010, despite the fact that the cen-tral government explicitly instructed local governments to scale down many of their projects andbanks to stop funding those projects, local governments continued to scale up rather than down andmanaged to obtain funding from the shadow banking system at substantially higher costs (Chen,He & Liu 2017). When a substantial fraction of the participants is not particularly sensitive tothe costs of funding, it is difficult for asset prices determined by the typical market equilibrium tobe efficiently anchored on the asset fundamentals. Thus, the lack of price sensitivity of these im-portant institutions has been a key obstacle for China’s development of a market-driven financialsystem. This is also a key reason for the PBC’s current use of a quantity-based monetary policyframework that directly targets money supply (Sun 2015), rather than a seemingly more conve-nient price-based framework that anchors on interest rates like the one used by the US FederalReserve Board.
Another implication of the soft budget constraint is implicit government guarantees. Specif-ically, even when SOEs, state banks, and local governments suffer large financial losses, theircreditors anticipate that the government will bail them out. As a result, creditors continue to offerthem credit at substantially lower costs relative to private firms with similar financial status. This inturn encourages them to further build up, rather than scale down, financial leverage. This kind ofrisk-seeking problem is a standard agency problem, caused by the implicit government guarantee,and is key to understanding risks in China’s financial system. Zhu (2016) provides an extensiveaccount of how government guarantees might have contributed to excessive speculation and pricebubbles in China.
3. CHINA’S CURRENT ECONOMIC AND FINANCIAL CONDITIONS
In this section, we investigate the current economic and financial conditions in China’s household,corporate, and government sectors. We also review recent developments in the financial system.
3.1. Households and Firms
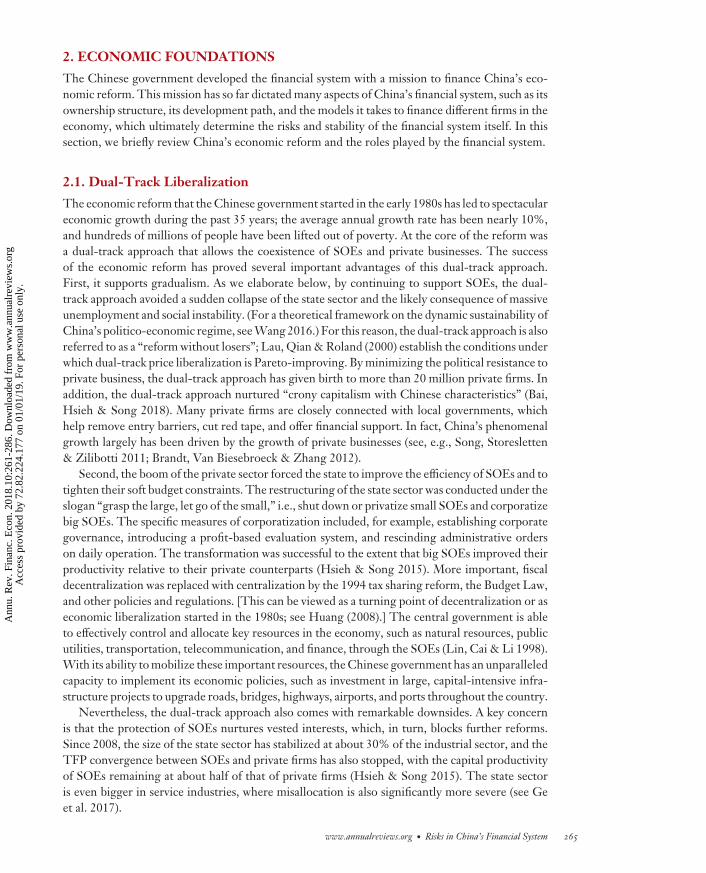
China saves about half of its GDP (see Figure 3). The high aggregate saving rate comes fromhigh savings by both households and firms. China’s urban household survey, which biases savingrates downward by underrepresenting rich households, shows an average saving rate of 30%. Thenational data adjusted by the NBS suggest that the household sector saves more than 40% of itsearnings. There is a long list of factors that may contribute to the extraordinarily high householdsaving rate (for a literature review, see Yang 2012; for more recent work, see Wei & Zhang 2011;Chen & Chen 2016; Choukhmane, Coeurdacier & Jin 2016; Cooper & Zhu 2017). All the factorsare associated with some China-specific institutional features, suggesting that high householdsavings are likely to persist in the near future.
www.annualreviews.org • Risks in China’s Financial System 267
Ann
u. R
ev. F
inan
c. E
con.
201
8.10
:261
-286
. Dow
nloa
ded
from
ww
w.a
nnua
lrev
iew
s.or
g A
cces
s pr
ovid
ed b
y 72
.82.
224.
177
on 0
1/01
/19.
For
per
sona
l use
onl
y.

FE10CH12_Xiong ARI 11 October 2018 13:52
1980 1985 1990 1995 2000 2005 2010 201520%
25%
30%
35%
40%
45%
50%
55%
60%
Saving rateInvestment rate
Year
Chin
a's
stat
isti
cal y
earb
ook
(var
ious
yea
rs)
Figure 3Saving (solid purple line) and investment (dashed blue line) rates in China from 1978 to 2016. Data from theNational Bureau of Statistics of China (http://data.stats.gov.cn/english/easyquery.htm?cn=C01).
The housing price boom greatly increased the net worth of Chinese households. Despite fast-growing mortgages, the balance sheet of Chinese households remains solid. Only 30% of bankloans are made to households (mostly mortgage loans). While the required down payment variesover time, it has stayed at high levels—at least 20% for first homes and 30% for second homes.To curb the recent housing price boom, the required down payment was raised to 50% or higherin some big cities. Even a significant housing price adjustment would be unlikely to trigger amortgage crisis of the scale seen in the Great Recession of the United States.
Chinese firms also have a high saving rate. The corporate sector accounts for about half ofnongovernment savings (Yang, Zhang & Zhou 2011). The literature is relatively thin on China’shigh corporate saving rate. Yet it has been widely acknowledged that the high rate is caused byfirms’ precautionary motives (see, e.g., Li 2001, Gordon & Li 2003). Due to the nature of thedual-track reform discussed above, the financial system—including banks, the stock market, andthe bond market—favors SOEs. As a result, most private businesses have been excluded fromformal credit channels, and private investment has been primarily financed by firms’ own savings(Allen, Qian & Qian 2005). In turn, higher returns to investment in the private sector—the flipside of the higher financing costs—encourage private firms to save more. Again, this is unlikely tochange in the near future.
Despite the financial frictions and other barriers, the private sector has been flourishing overthe past two decades. It now accounts for 80% of China’s urban employment and continues to bethe main growth engine. The inefficient state sector used to be a big burden that could possiblydrag China into a crisis. While the reform of the state sector is far from complete, the survivingSOEs have greatly improved their vitality. In contrast to their moribund status in the 1990s,today’s SOEs do not pose an imminent threat to China’s economic and financial stability. In fact,some of the SOEs have even managed to establish monopolistic positions in various upstreamindustries, such as energy, transportation, telecommunications, and finance, under the protection
268 Song · Xiong
Ann
u. R
ev. F
inan
c. E
con.
201
8.10
:261
-286
. Dow
nloa
ded
from
ww
w.a
nnua
lrev
iew
s.or
g A
cces
s pr
ovid
ed b
y 72
.82.
224.
177
on 0
1/01
/19.
For
per
sona
l use
onl
y.

FE10CH12_Xiong ARI 11 October 2018 13:52
of industry regulations (see, e.g., Li, Liu & Wang 2014). The main concern is now the relativelylow efficiency of the state sector and its long-run implications.
In summary, China’s domestic savings are more than enough to finance its investment, ablessing for a fast-growing economy. Figure 3 shows that the aggregate saving rate has beengreater than the investment rate since the mid-1990s—a mirror image of China’s trade surplus(Song, Storesletten & Zilibotti 2011). The investment boom in the post-2008 period has reducedbut has not yet completely removed the surplus. There is no significant external debt. A Greece-likecrisis is unlikely to happen.
3.2. Local Governments
Local governments have played an important role in China’s economic development as well asin the financial risks related to rising real estate prices and rising leverage across China. Thecentral government has formed a tournament between local officials to encourage development intheir local economies (see, e.g., Zhou 2002, 2007; Li & Zhou 2005). To outperform others, localofficials need to build up local infrastructures (such as roads and highways), which in turn help toattract businesses and investments (for a theoretical model of the local government tournamentas a key driver of economic growth in China, see Xiong 2018). Competition between regions alsodrives local officials to provide resources, such as startup funds, tax subsidies, and land subsidies,to facilitate local business development and bail out nonperforming SOEs. This is referred to asregionally decentralized authoritarianism (Xu 2011, 2015; Qian 2017) or “crony capitalism withChinese characteristics” (Bai, Hsieh & Song 2018).
The Budget Law enacted in 1994 prohibited local governments from running budgetarydeficits. External financing was not allowed either. (The central government has modest fiscaldeficits, with the deficit-to-GDP ratio of a mere 2–3%.) This has been widely viewed as a criticalstep in confining the soft budget constraint problem between local governments and their favoredbusinesses. Instead, since the late 1990s, local governments greatly expanded their fiscal capacityby relying on nonbudgetary funding sources such as land revenue. The Chinese constitution statesthat urban land is owned by the state. In practice, land is administered by local governments. Rev-enue from sales of land use rights (land revenue henceforth) has accounted for about one-third oflocal government revenue (the sum of local fiscal revenue and land revenue) since the early 2000s.
Tying local government budget to land revenue is a novel design mechanism. Given the initialcondition of underdevelopment across Chinese cities, local tax revenue was far from covering theneed for funding large, capital-intensive infrastructure projects and other local business develop-ments. The great uncertainty would also discourage banks from funding such projects, even iflocal governments were allowed to directly raise debt financing. However, the land prices thatbuyers pay, like equity prices, are determined not only by the current business conditions in acity but also their expected future conditions. Conditional on local governments using land rev-enue to improve local infrastructure and business environments, land prices can be substantiallyhigher than what is justified by current business conditions, similar to the often-observed highshare prices of new technology firms even when they have no earnings yet. The need for localgovernments to regularly sell land to the public also serves as a device to discipline them to carryout their pledged infrastructure projects. This arrangement is similar to staged venture capitalfinancing for new firms.
This budgetary arrangement gives local governments the necessary resources and incentivesto invest in infrastructure projects and support local businesses, which greatly contributed to therapid urban and business developments across Chinese cities. The net effect of this budgetary
www.annualreviews.org • Risks in China’s Financial System 269
Ann
u. R
ev. F
inan
c. E
con.
201
8.10
:261
-286
. Dow
nloa
ded
from
ww
w.a
nnua
lrev
iew
s.or
g A
cces
s pr
ovid
ed b
y 72
.82.
224.
177
on 0
1/01
/19.
For
per
sona
l use
onl
y.

FE10CH12_Xiong ARI 11 October 2018 13:52
reform on the soft budget constraint is ambiguous, as local governments also have more resourcesto bail out failed businesses.2
The heavy budgetary reliance of local governments on land revenue also has profound implica-tions for the real estate sector. As local governments are monopolistic land suppliers, the estimateof Wu, Gyourko & Deng (2012) suggests that much of the increase in housing prices occurredin land values. Concerns about the financial health of local governments also prompted the cen-tral government to frequently intervene in real estate markets, using measures such as mortgagepolicies to home buyers and credit policies to real estate developers, to manage potential cycles inthe real estate prices (see, e.g., Fang et al. 2015). As we discuss below, these interventions in turnencourage real estate speculation of households and firms to acquire investment homes and land(see, e.g., Chen et al. 2017).
The 2008 stimulus plan compromised the borrowing constraint on local governments. Bai,Hsieh & Song (2016) demonstrate that most of the stimulus was financed by local governmentsthrough bank loans, as local governments could not have sold enough land to cover the stimulus.To facilitate local financing, the central government, for the first time since the early 1980s,relaxed the financial controls on local governments. A prominent regulatory change made by theCBRC turned out to be a key step (Document No. 92, CBRC, March 18, 2009). Specifically, localgovernments were encouraged to set up LGFVs to borrow from banks and financial institutions.This circumvents the Budget Law that prohibits local governments from borrowing. Auxiliaryregulatory changes were also made by various units in the central government (including theMinistry of Finance) to endorse LGFVs. Consequently, about 1,800 LGFVs had issued bonds by2015, while less than 100 did so before 2008. Local government debt is accumulating disturbinglyfast even by the official statistics: The outstanding local government debt increased from less than5 trillion yuan in 2008 to 23 trillion yuan in 2015. Bai, Hsieh & Song (2016) argue that much debtborrowed by LGFVs is not officially classified as local government debt. Their estimates suggestthat the outstanding debt of LGFVs could be 46 trillion yuan in 2015, which is twice the official sizeof local government debt and about two-thirds of GDP in that year. Xiong (2018) attributes therapid growth of LGFV debt to the tournament competition between local government officials.
Nevertheless, it would be far-fetched to conclude that local governments are becoming illiquidor insolvent. With annual fiscal revenues of 8 trillion yuan and annual land revenues of 3 trillionyuan, local governments have sufficient cash flow to pay the interest on their debt. Moreover,LGFVs’ assets actually outgrew their liability. For the 1,800 LGFVs studied by Bai, Hsieh &Song (2016), their total assets amount to 70 trillion yuan—50% more than their liability. Muchof the assets are land reserves. In other words, local governments are unlikely to be illiquid orinsolvent in the near future unless China experiences a dramatic adjustment in land prices.
3.3. Financial Institutions
China has a bank-based financial system. Bond and equity financing account for only about one-fifth of the total credit to nonfinancial institutions. Unlike the nonfinancial sector, the financialsector is dominated by state-owned financial institutions. Most banks are state-owned. The BigFour alone account for more than 40% of total bank deposits. The main business of China’scommercial banks is taking deposits and making loans. Before 2015, bank profits were guaranteed
2New land sales improve factor mobility and, hence, increase the opportunity cost of bailouts, through the lens of Qian& Roland (1998). In addition, land prices (especially residential and commercial land prices) are essentially determined bymarket forces, particularly local productivity. Diverting too many resources to inefficient businesses would eventually affectland prices and revenue. These are the disciplining mechanisms that harden local governments’ budget constraints.
270 Song · Xiong
Ann
u. R
ev. F
inan
c. E
con.
201
8.10
:261
-286
. Dow
nloa
ded
from
ww
w.a
nnua
lrev
iew
s.or
g A
cces
s pr
ovid
ed b
y 72
.82.
224.
177
on 0
1/01
/19.
For
per
sona
l use
onl
y.

FE10CH12_Xiong ARI 11 October 2018 13:52
by interest-rate regulation that imposed a floor for the loan rate and a ceiling for the deposit rate,both around the benchmark loan rate and deposit rate published by the PBC. These benchmarkrates usually leave a spread of about 3 percentage points, which is the main source of bank revenue.In 2015, the floor and cap were removed as a key to liberalizing interest rates. Nevertheless, thePBC continues to publish benchmark deposit and loan rates, and banks continue to closely followthem and profit from the spread.
In the early stage of the economic reform, the soft budget constraint was a major concern forthe banking sector. The moribund state sector in the late 1990s led to a crumbling banking sector,where the ratio of nonperforming loans reached a record high of 30% in the early 2000s. Analogousto the corporatization of big SOEs, state-owned banks have experienced similar transformationsthat have made them more independent and profit driven.3 This process led to a much morecompetitive banking sector, which promoted financial innovations and eventually fostered shadowbanking. The Big Four commercial banks were established in the late 1970s and early 1980s asspinoffs of the commercial part of the PBC. The Big Four enjoyed a disproportional share of thedepositor pool. In contrast, the smaller banks, which are relatively new, lack household depositsand need to rely on interbank funding from the Big Four.
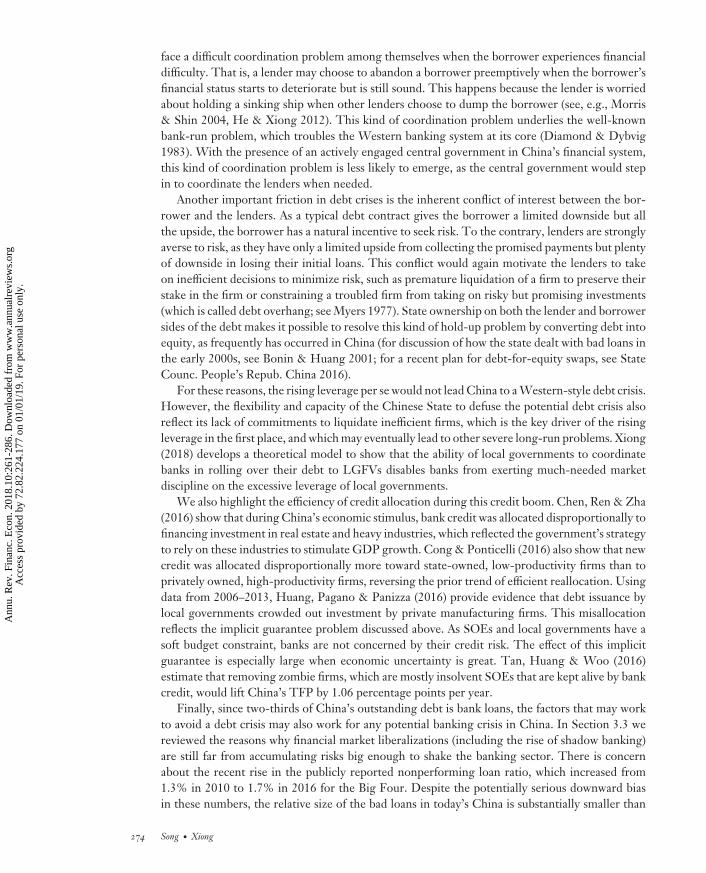
The competition for deposits among banks led to the rise of wealth management products(WMPs), which are a saving instrument that is not constrained by the deposit rate ceiling. Inthe mid-2000s, banks started to issue WMPs with higher returns (for evidence on the role ofbaking competition, see Acharya, Qian & Yang 2016). The tightening of the loan-to-deposit capin the late 2000s further gave rise to nonguaranteed WMPs, which can move loans and depositsoff balance sheets. This led to rich shadow banking activities (Hachem & Song 2016).4 Figure 4plots WMPs as percentage of GDP; the percentage increases from 2% in 2007 to 34% in 2015.
On the asset side, bank–trust cooperation is a first-generation off-balance-sheet channel thatprovides credit to firms that would have difficulty obtaining external financing otherwise. MoreWMPs were invested in municipal corporate bonds after 2011. As discussed above, LGFVs con-tinued to grow after the stimulus program ended in 2010 and needed to pay back their bank loans.Chen, He & Liu (2017) argue that the rollover pressure precipitated the rapid growth of theshadow banking system, through which LGFVs were able to roll over their debt.5 Hachem (2018)provides a more detailed review of the growing literature on China’s shadow banking, and Zhu(2017) analyzes its welfare implications.
Despite the recent rapid development of shadow banking, its overall size remains modest,with the total WMP balance being merely 18% of total bank deposits by the end of 2015,6 partlybecause the central government has tightened regulations by incorporating shadow banking activi-ties into the PBC’s macroprudential policy framework and thus imposing required capital on banksfor such activities. The interbank market has become an increasingly important source for smalland medium-sized banks’ liquidity. Yet the Big Four remain a key fund supplier and can easily in-fluence the market (Hachem & Song 2016). The rise of shadow banking has nevertheless presenteda great challenge to China’s monetary policy, which adopts a quantity-based framework with an
3The Law of the PBC and the Law of Commercial Bank were enacted in 1995 to guide and regulate banks’ daily operations.The reform was further solidified by the establishment of the CBRC in 2003, which took over banking supervision from thePBC, and the public listing of all the major commercial banks in the 2000s.4See also Sun (2017) regarding the rise of China’s shadow banking from a regulator’s perspective.5Specifically, they find that providences with abnormally greater bank loan growth in 2009 experienced more municipalcorporate bonds issuance (which was mostly through the shadow system) in 2012–2015.6Entrusted loans are also an important part of China’s shadow banking (for discussion of entrusted loans made by listed firms,see Allen et al. 2016; Chen, Ren & Zha 2016; Du, Li & Wang 2016).
www.annualreviews.org • Risks in China’s Financial System 271
Ann
u. R
ev. F
inan
c. E
con.
201
8.10
:261
-286
. Dow
nloa
ded
from
ww
w.a
nnua
lrev
iew
s.or
g A
cces
s pr
ovid
ed b
y 72
.82.
224.
177
on 0
1/01
/19.
For
per
sona
l use
onl
y.

FE10CH12_Xiong ARI 11 October 2018 13:52
2007 2008 2009 2010 2011 2012 2013 2014 20150
0.05
0.1
0.15
0.2
0.25
0.3
0.35
Year
Tota
l WM
P ba
lanc
e as
per
cent
of G
DP
Figure 4The size of wealth management products (WMPs). The figure plots the total WMP balance as a percent ofGDP from 2007 to 2015. Data from China’s Banking Wealth Management Market Annual Report.
intermediate policy target on money growth.7 Concerned by the difficulty in fully accounting forbanks’ on- and off-balance-sheet activities, the PBC has been pushing strongly for interest-rateliberalization, which is the necessary foundation for it to ultimately adopt a price-based monetarypolicy framework as an automatic stabilizer. To expose banks to more market competition, thePBC has been actively promoting the bond market, which has experienced rapid growth in recentyears. The bond market now trades bonds issued by the central and local governments, as wellas SOEs and publicly listed firms. The outstanding quantity of bonds has recently reached over30% of bank loans. Equity financing accounts for a much smaller fraction of the total credit. Asis discussed in Section 4, there have been very few defaults and delistings in China’s bond andstock markets—a natural consequence of the above features associated with the dual-track reform.Interest-rate liberalization in such a system may cause more capital to flow to the state sector orshadow banking and, hence, aggravate welfare losses (see, e.g., Wang et al. 2012; Liu, Wang &Xu 2017).
4. FINANCIAL RISKS
This section highlights several key sources of financial risks in China. We first highlight the debtcrisis risk, which is also closely related to concerns about the banking system. We then analyzehousing risk and capital outflow risk, with the latter intricately related to China’s exchange raterisk. We also discuss risk from the stock market, which tends to attract great public attentiondespite its relatively small role in financing the real economy. Finally, we highlight policy risk,which is deeply entangled with other sources of financial risks in China.
7Li & Liu (2017) provide evidence on China’s quantity-based money policy. Sun & Jia (2015), Chen, Ren & Zha (2016),and Hachem & Song (2017) show how shadow banking can create money uncounted and credit booms unexpected by thefinancial system.
272 Song · Xiong
Ann
u. R
ev. F
inan
c. E
con.
201
8.10
:261
-286
. Dow
nloa
ded
from
ww
w.a
nnua
lrev
iew
s.or
g A
cces
s pr
ovid
ed b
y 72
.82.
224.
177
on 0
1/01
/19.
For
per
sona
l use
onl
y.

FE10CH12_Xiong ARI 11 October 2018 13:52
4.1. Debt Crisis Risk
As discussed above, the issue of quickly rising financial leverage across China has become promi-nent in recent years. In particular, a substantial fraction of the sharply increased debt was channeledthrough shadow banking. The joint occurrence of rapid housing price appreciation and quicklyrising debt levels has alerted many commentators to the possibility of a debt crisis in China (see,e.g., Chen 2015, Maliszewski et al. 2016). In particular, many are worried that China might followin the footsteps of the United States, which experienced a severe financial crisis initially triggeredby the reversal of a dramatic housing boom in the mid-2000s. The US housing boom was largelyfinanced by a dramatic credit expansion across the country to households and financial firms and,in particular, by credit expansion through the shadow banking system to subprime households(see, e.g., Mian & Sufi 2009).
Several factors make it unlikely for a Western-style debt crisis to occur in China in the shortrun. First, China has a large pool of domestic savings and a low level of external debt (seeSection 3). Most of the debt in China is issued not only domestically but also, even more conve-niently, from state-owned banks to state-owned firms. In fact, this asymmetry has been furtherstrengthened in the post-2008 period for reasons discussed above.8 Second, and perhaps moreimportantly, Chinese institutions have been flexible enough for the state to develop creative waysto defuse a crisis in the short run. Some important policies implemented in the cleanup of massivebad loans in 1990s and 2000s are particularly worth documenting, as they may shed light on thepossible tactics to be adopted in the future (for an excellent review, see Walter & Howie 2012).The moribund state sector led banks to have a nonperforming loan ratio above 30% in the late1990s, a dangerous level that is likely to trigger a full-blown bank-run crisis in any economy withrigid market and policy rules (see, for example, Bonin & Huang 2001; for more detailed discussion,see below). To absorb the bad loans, the Chinese state took three steps to bend the rules withoutbreaking them entirely. First, the central bank lowered the required reserve ratio to allow banks tobuy special government bonds, which, in turn, were invested in banks as capital. Second, four largeasset management companies were established in 1999, one for each of the Big Four, to absorbtheir nonperforming loans. This is also referred to as the good bank/bad bank strategy. In the Chi-nese context, the bad banks (i.e., the asset management companies) were thinly capitalized, whileholding huge assets backed by nonperforming loans that were not appropriately valued. Third, topublicly list the Big Four, more bad loans had to be cleaned off. In 2003, the state injected about50 billion USD from its foreign reserve into two of the Big Four.9 These tactics did not resolvebad loans. Rather, they managed to move the problems to the future. Fortunately, the strongeconomic growth and rapid expansion of the financial sector afterward eventually absorbed thebad loans. In short, it is the state, rather than market rules, that has the final say on bankruptcy. Solong as the state has resources and willingness to save big businesses, bankruptcies with substantialaggregate implications will not occur.
Even if a large bankruptcy becomes unavoidable in China, it is unlikely to evolve into a debtcrisis, which often occurs in the Western world when a borrower and lenders cannot agree to amutually acceptable scheme due to all sorts of coordination and hold-up problems in preventingthe bankruptcy from escalating into a crisis. For example, with a pool of lenders, the lenders
8The analysis by Chivakul & Lam (2015), for instance, indicates that among listed firms, the leverage of SOEs grew muchfaster than that of private firms after 2009. Even though some of the debt might have been issued informally through theshadow banking system, this debt structure nevertheless makes the debt problem manageable by the government.9To quote Xie Ping, then director of the Financial Stability Bureau at the PBC (Walter & Howie 2012, p. 62), “This time,we did not just play a game with accounting. Real money went into the banks.”
www.annualreviews.org • Risks in China’s Financial System 273
Ann
u. R
ev. F
inan
c. E
con.
201
8.10
:261
-286
. Dow
nloa
ded
from
ww
w.a
nnua
lrev
iew
s.or
g A
cces
s pr
ovid
ed b
y 72
.82.
224.
177
on 0
1/01
/19.
For
per
sona
l use
onl
y.
FE10CH12_Xiong ARI 11 October 2018 13:52
face a difficult coordination problem among themselves when the borrower experiences financialdifficulty. That is, a lender may choose to abandon a borrower preemptively when the borrower’sfinancial status starts to deteriorate but is still sound. This happens because the lender is worriedabout holding a sinking ship when other lenders choose to dump the borrower (see, e.g., Morris& Shin 2004, He & Xiong 2012). This kind of coordination problem underlies the well-knownbank-run problem, which troubles the Western banking system at its core (Diamond & Dybvig1983). With the presence of an actively engaged central government in China’s financial system,this kind of coordination problem is less likely to emerge, as the central government would stepin to coordinate the lenders when needed.
Another important friction in debt crises is the inherent conflict of interest between the bor-rower and the lenders. As a typical debt contract gives the borrower a limited downside but allthe upside, the borrower has a natural incentive to seek risk. To the contrary, lenders are stronglyaverse to risk, as they have only a limited upside from collecting the promised payments but plentyof downside in losing their initial loans. This conflict would again motivate the lenders to takeon inefficient decisions to minimize risk, such as premature liquidation of a firm to preserve theirstake in the firm or constraining a troubled firm from taking on risky but promising investments(which is called debt overhang; see Myers 1977). State ownership on both the lender and borrowersides of the debt makes it possible to resolve this kind of hold-up problem by converting debt intoequity, as frequently has occurred in China (for discussion of how the state dealt with bad loans inthe early 2000s, see Bonin & Huang 2001; for a recent plan for debt-for-equity swaps, see StateCounc. People’s Repub. China 2016).
For these reasons, the rising leverage per se would not lead China to a Western-style debt crisis.However, the flexibility and capacity of the Chinese State to defuse the potential debt crisis alsoreflect its lack of commitments to liquidate inefficient firms, which is the key driver of the risingleverage in the first place, and which may eventually lead to other severe long-run problems. Xiong(2018) develops a theoretical model to show that the ability of local governments to coordinatebanks in rolling over their debt to LGFVs disables banks from exerting much-needed marketdiscipline on the excessive leverage of local governments.
We also highlight the efficiency of credit allocation during this credit boom. Chen, Ren & Zha(2016) show that during China’s economic stimulus, bank credit was allocated disproportionally tofinancing investment in real estate and heavy industries, which reflected the government’s strategyto rely on these industries to stimulate GDP growth. Cong & Ponticelli (2016) also show that newcredit was allocated disproportionally more toward state-owned, low-productivity firms than toprivately owned, high-productivity firms, reversing the prior trend of efficient reallocation. Usingdata from 2006–2013, Huang, Pagano & Panizza (2016) provide evidence that debt issuance bylocal governments crowded out investment by private manufacturing firms. This misallocationreflects the implicit guarantee problem discussed above. As SOEs and local governments have asoft budget constraint, banks are not concerned by their credit risk. The effect of this implicitguarantee is especially large when economic uncertainty is great. Tan, Huang & Woo (2016)estimate that removing zombie firms, which are mostly insolvent SOEs that are kept alive by bankcredit, would lift China’s TFP by 1.06 percentage points per year.
Finally, since two-thirds of China’s outstanding debt is bank loans, the factors that may workto avoid a debt crisis may also work for any potential banking crisis in China. In Section 3.3 wereviewed the reasons why financial market liberalizations (including the rise of shadow banking)are still far from accumulating risks big enough to shake the banking sector. There is concernabout the recent rise in the publicly reported nonperforming loan ratio, which increased from1.3% in 2010 to 1.7% in 2016 for the Big Four. Despite the potentially serious downward biasin these numbers, the relative size of the bad loans in today’s China is substantially smaller than
274 Song · Xiong
Ann
u. R
ev. F
inan
c. E
con.
201
8.10
:261
-286
. Dow
nloa
ded
from
ww
w.a
nnua
lrev
iew
s.or
g A
cces
s pr
ovid
ed b
y 72
.82.
224.
177
on 0
1/01
/19.
For
per
sona
l use
onl
y.

FE10CH12_Xiong ARI 11 October 2018 13:52
that two decades ago. While the economic reform has not resolved the aforementioned majorproblems in the banking sector, the current strategy is again to defer them to the future. To theextent that the ability of the Chinese state to resolve any potential debt or banking crisis rests onthe country’s economic growth, the growth risk is thus the ultimate risk behind the rising debtproblem.
4.2. Housing Risk
China has been experiencing a dramatic and long-lasting housing boom across the country sincethe reform of the housing market in 1990s. This boom has led to substantial concern in recentyears that rising housing prices might have developed into a gigantic housing bubble that mighteventually burst and damage both the financial system and the economy (see, e.g., Wu, Gyourko& Deng 2016; Glaeser et al. 2017; Chen & Wen 2017).
An important contributing factor to this concern is the lack of reliable statistics about thehousing markets across the country. Fang et al. (2015) provide a useful account of these issuesby examining a detailed data set of mortgage loans and constructing housing price indices for120 major cities in China in 2003–2013 based on sequential sales of new homes within the samehousing developments. Their housing price indices show enormous housing price appreciationacross China in 2003–2013: an average annual real growth rate of 13.1% in the four first-tiercities, 10.5% in second-tier cities, and 7.9% in third-tier cities. Interestingly, they also show thatthe enormous price appreciations were accompanied by equally spectacular growth in households’disposable income—an average annual real growth rate of about 9.0% throughout the countryduring the decade. The quickly rising household incomes, together with a well-known observationof high down payment ratios of at least 20%, and typically 40%, on mortgage loans, make thefinancial risk brought by a potential housing market crash much lower than that faced by the UShousing market in the mid-2000s.
Yet this study also finds that low-income home buyers often endured enormous financialburdens in buying homes at price-to-income ratios of about eight in second- and third-tier citiesand, in some years, even over ten in first-tier cities.10 It is difficult to simply attribute the willingnessof these households to endure this large financial burden to their consumption needs. Instead,their home purchases were likely driven by a speculative motive to gain from future housing priceappreciations (for a theoretical model analyzing China’s housing price dynamics from households’liquidity constraints and expectations, see Zhang 2017).
Households’ expectation of high housing price appreciations can be attributed to two keyfactors. One is a behavioral reason, and the other an institutional reason. First, the human ten-dency of extrapolating past trends into future trends is likely to cause households to hold highexpectations of rapid income growth and housing price appreciations going forward (see, e.g.,Case & Shiller 2003; Gennaioli, Shleifer & Vishny 2015; Barberis et al. 2016). Through suchexpectations, the housing market risk is also ultimately driven by the economic growth risk. If theChinese economy can maintain a high growth rate, which has slowed to 6.9% in recent quarters,
10In concrete terms, this means that a household paid eight times its annual disposable income to buy a home. Suppose thatthe household made a down payment of 40% and took a mortgage loan for the other 60% of the home price, which wouldbe 4.8 times its annual income. A modest mortgage rate of 6%, which is low relative to the actual rate observed during thedecade, would require the household to use nearly 30% of its annual income to pay for the interest on the mortgage loan,in addition to consuming another 16% of its annual income to pay down the mortgage loan based on a linear schedule for a30-year loan. Together, buying the home entails the household saving 3.2 times the annual household income to make thedown payment and using another 45% of its annual income to service the mortgage loan.
www.annualreviews.org • Risks in China’s Financial System 275
Ann
u. R
ev. F
inan
c. E
con.
201
8.10
:261
-286
. Dow
nloa
ded
from
ww
w.a
nnua
lrev
iew
s.or
g A
cces
s pr
ovid
ed b
y 72
.82.
224.
177
on 0
1/01
/19.
For
per
sona
l use
onl
y.

FE10CH12_Xiong ARI 11 October 2018 13:52
then households’ high expectations would be sustainable. However, some critics, such as Pritchett& Summers (2014), argue that a mean reversion of the spectacular growth rate of the Chineseeconomy might soon occur. If so, there is a serious risk imposed by the subsequent collapse ofhousehold expectations on housing prices.
Second, the government’s countercyclical interventions also reinforce home buyers’ high ex-pectation of future housing price appreciations. As summarized by Fang et al. (2015), local gov-ernments control land supply and heavily rely on land revenue, and banks are heavily exposed torisks in the real estate sector. As a result, it is widely perceived that the real estate sector is tooimportant to fail. Indeed, consistent with this perception, the central government has frequentlyintervened in the housing market. When the market is considered overheated, the PBC tendsto tighten mortgage down payment requirements and raise mortgage interest rates. When themarket is considered depressed, the PBC tends to reverse these measures and even use monetarypolicy to provide additional supports. These interventions have so far prevented any major crashin the real estate market at the national level.
Overall, the enormous housing price appreciation across China is supported by rapid householdincome growth, yet the high price-to-income ratios across different cities build on high expecta-tions of future economic growth and income growth. Thus, like the debt crisis risk, the housingrisk is also essentially the economic growth risk. If the economic growth rate falls substantiallybelow the currently level of 6.9% in the near future, it would be difficult to sustain home buyers’high expectations and thus to keep price-to-income ratios at the current level.
The real estate boom across China also has an important effect on firm investment and theefficiency of capital allocation across firms. Chen et al. (2017) document an intriguing observationthat publicly listed firms in China, excluding financial, real estate, and construction firms, onaverage spent nearly 20% of capital investment in 2000–2015 on acquiring land—not just industrialland, but also commercial land and residential land, which cannot be used to build productionfacilities. In some years, land investment contributed to as much as 40% of these firms’ investments.More importantly, this study finds that the ongoing real estate boom across China leads not onlyto the well-known collateral effect, through which rising land prices allow land-holding firms toget more bank loans collateralized by their land holdings, but also to two additional effects (fora theoretical analysis of the effect of credit expansion on capital misallocation through collateralvalue, see Bleck & Liu 2018). One is the so-called crowding-out effect, through which the realestate boom crowds out the access of non-land-holding firms to bank financing; similar crowdingout is also documented by Shi, Wang & Wu (2016). The other is the so-called speculation effect,through which rising land prices induce land-holding firms with access to financing to acquiremore land and reduce their nonland investment.11 Furthermore, Chen et al. (2017) find that firmswith lower, rather than higher, Tobin’s Q and productivity tend to hold land. As a result, throughthese three effects, the real estate boom has a profound negative impact on the efficiency of capitalallocation across firms, thus hurting China’s overall economic growth. This growth effect may inturn exacerbate the housing risk.
4.3. Capital Outflow Risk
There is also growing concern about capital outflow risk in China, which is also intricately relatedto risk of the RMB exchange rate. To modernize its financial system, China has gradually opened
11Shi (2017) also finds that the real estate boom induces capital reallocation within existing private businesses from themanufacturing sector to the real estate sector.
276 Song · Xiong
Ann
u. R
ev. F
inan
c. E
con.
201
8.10
:261
-286
. Dow
nloa
ded
from
ww
w.a
nnua
lrev
iew
s.or
g A
cces
s pr
ovid
ed b
y 72
.82.
224.
177
on 0
1/01
/19.
For
per
sona
l use
onl
y.

FE10CH12_Xiong ARI 11 October 2018 13:52
2006 2008 2010 2012 2014 20160
50
100
150
200
250
300
350
400
InwardOutward
Year
Chin
a’s
fore
ign
dire
ct in
vest
men
t (bi
llion
USD
)
Figure 5China’s inward (dotted orange line) and outward (solid purple line) foreign direct investment (billion USD) from2005 to 2017. Data from the State Administration of Foreign Exchange.
up its capital accounts. China is now the largest recipient of foreign direct investment amongdeveloping economies, with an average of 200 billion USD annually since 2005 (see Figure 5).China’s outward direct investments were small before the mid-2000s but grew very fast afterward(see Figure 5). Controls on international portfolio investments have been partially liberalized,although the inflow and outflow of portfolio investments remain an order of magnitude smallerthan direct investments.12 China also has made a great effort to internationalize the RMB. InNovember 2016, it achieved a milestone of getting the RMB into the International MonetaryFund’s special drawing rights (SDR) basket, together with the US dollar, the euro, the Japaneseyen, and the British pound, with a weight of 10.92%. This SDR membership establishes the RMBas a reserve currency. The capital account surplus, together with the current account surplus, ledto a rapid growth of foreign reserves, which peaked at a level of 4 trillion USD in 2014 (for adetailed account of these developments, see Prasad 2017).
The two-decade-long foreign reserve accumulation ended in 2015. Foreign reserves fell bya quarter in one year and are now back to 3 trillion USD. This adds to the growing concernsabout China’s financial stability. Trade surplus is declining as a consequence of the increase ininvestment after 2008 (see Figure 3; for a structural view of the declining trade surplus, see Sun &Lu 2012). Yet, despite the plunge in foreign reserves, China still has a sizable trade surplus, which isabout 2–3% of its GDP. Capital outflow plays a much bigger role. In 2015, for the first time sincethe economic transition started in the late 1970s, China’s outward direct investment exceededits inward direct investment (see Figure 5). This is not entirely unanticipated. In fact, inwarddirect investment has been on a declining trend since 2010, while the opposite is true for outwardinvestment. We emphasize two factors that may turn capital inflow to outflow. The deteriorating
12For instance, foreign investors identified as qualified foreign institutional investors are allowed to buy Chinese stocks andbonds. See Song, Storesletten & Zilibotti (2014) for more institutional details and Chang, Liu & Spiegel (2015) for a theoreticalanalysis on the trade-off between sterilization and domestic price stability.
www.annualreviews.org • Risks in China’s Financial System 277
Ann
u. R
ev. F
inan
c. E
con.
201
8.10
:261
-286
. Dow
nloa
ded
from
ww
w.a
nnua
lrev
iew
s.or
g A
cces
s pr
ovid
ed b
y 72
.82.
224.
177
on 0
1/01
/19.
For
per
sona
l use
onl
y.

FE10CH12_Xiong ARI 11 October 2018 13:52
resource allocative efficiency in the postcrisis period lowered the aggregate return to capital: Itdropped from an average above 10% before 2008 to 4% in 2013 (Bai & Zhang 2015). In otherwords, China has been losing its attraction to foreign capital. In addition, skyrocketing housingprices greatly increase Chinese households’ net worth and provide incentive for them to diversifytheir portfolios. A back-of-envelope calculation suggests that Chinese households have a totalwealth of 600 trillion yuan.13 Converting merely 3% of domestic assets into foreign assets wouldexhaust China’s current foreign reserves. As shown in Figure 5, outward direct investment jumpedto about 220 billion USD in 2014 and 2015, almost doubling the number from 2013. Although wedo not have the data, anecdotal stories about Chinese real estate buyers around the world suggestthat portfolio diversification plays an important role in boosting outward investment.
The dwindling trade surplus and the reversal of capital flows put depreciation pressure on theChinese yuan. The sudden but mild depreciation by 2% in August 2015 failed to defuse the risk.The currency continued to depreciate by 10% against the USD and by 15% against a basket ofcurrencies weighted by trade in 2016. The deprecation expectation further fueled capital outflow,which, in turn, led to speculation and strengthened deprecation expectations. To break the viciouscycle, the Chinese government chose to impose stricter capital controls and reserve requirementson onshore RMB deposits of offshore financial institutions in 2016. The latest statistics suggestthat these measures have been effective. China’s outward direct investment in 2017 was 116 billionUSD, less than half of the investment in 2016. The exchange rate has also stabilized. Once again,the concern is about the medium- and long-run risks. If resource allocation efficiency continued toworsen, the Chinese government would probably have to depreciate the yuan by a large margin.Moreover, given the heavy interventions by the government in the exchange rate markets, theexpectation about how the Chinese government would manage the exchange rate in the future isalso important for the market to form depreciation expectations.
4.4. Stock Market Risk
While China’s stock market plays a smaller role than banks and the bond market in providingfinancing to firms, stock market fluctuations tend to attract great public attention. In particular,the boom and bust of the stock market in 2015 caused anxiety across the globe about the healthof China’s financial system. It is useful to note several important characteristics of China’s stockmarket.
First, like other sectors of the financial system, the stock market was initially developed in theearly 1990s to help fund and improve ailing SOEs. This mission dictates that the regulations andpolicy enforcements of the stock market be protective of SOEs, as reflected in various aspectsof stock market operations. Initial public offerings (IPOs) in the stock market are subject to anaggregate quota determined by the China Securities Regulatory Commission (CSRC), whichallocates the quota across regions and industries according to regional development goals. Duringthe first 15 years of the stock market, SOEs enjoyed the privilege of being listed, while private firmswere able to get listed only in recent years (see, e.g., Allen & Shen 2012). This selection makes thelisted firms poorer performers than unlisted firms both ex ante and ex post, and consequently thestock market has offered disappointing returns to investors in its 25-year history despite China’sspectacular economic growth (Allen et al. 2017). There is also extensive evidence showing that
13We estimate financial assets of 90 trillion yuan by the end of 2015, with household bank deposits of 48.5 trillion and astock market value of 41.8 trillion (assuming all circulated shares are held by Chinese households). Xie & Jin (2015) find thatfinancial assets account for 10.6% of total Chinese household wealth in 2012. Assuming the proportion of financial assets tobe 15% in 2015, we obtain a total wealth of 600 trillion yuan.
278 Song · Xiong
Ann
u. R
ev. F
inan
c. E
con.
201
8.10
:261
-286
. Dow
nloa
ded
from
ww
w.a
nnua
lrev
iew
s.or
g A
cces
s pr
ovid
ed b
y 72
.82.
224.
177
on 0
1/01
/19.
For
per
sona
l use
onl
y.

FE10CH12_Xiong ARI 11 October 2018 13:52
political connections affect IPO selection and IPO returns (see, e.g., Fan, Wong & Zhang 2007;Piotroski & Zhang 2014).
China has adopted accounting regulations and standards for publicly listed firms similar tomost developed countries, and, in particular, strict profit requirements for firms to qualify forIPOs. However, the enforcement of the accounting rules has been lax, and penalties for account-ing violations have been light (for detailed accounts of the information environment and legalenforcement related to publicly listed firms in China, see Piotroski & Wong 2012, Allen & Shen2012). Strict enforcement would have disqualified some SOEs for IPOs, as they relied on earningsmanagement to satisfy the requirement on IPOs (see, e.g., Aharony, Lee & Wong 2000; Chen& Yuan 2004; Chen, Lee & Li 2008; Allen et al. 2017). Furthermore, there have been very fewdelistings in China’s stock market, in sharp contrast to the large number of delistings in the USstock market, which are roughly in balance with the number of IPOs each year. One can againexplain the small number of delistings on the basis of the soft budget constraint or the politicalpower of the SOEs, which are aligned with the interests of local governments and can often resistorders from the CSRC. The lack of delistings in turn limits the number of new IPOs on the stockmarket and leads to substantial shell value of weak listed firms that wait for merger offers fromunlisted firms seeking an alternative channel to be listed (see, e.g., Lee, Qu & Shen 2017).
Second, China’s stock market was developed outside the banking system, as banks are notallowed to directly trade in the stock exchanges. As a result, the stock market has been populatedby retail investors, who started to invest in stocks only in the early 1990s after the stock market wasshut down for nearly half a century. A large body of academic studies has shown that the Chinesestock market is substantially more speculative than the US market (for a review, see Carpenter &Whitelaw 2017). Stock prices in China’s A-share market are highly volatile, as demonstrated by thedramatic boom and bust of stock prices in 2007–2008 and again in 2014–2015 (see Figure 6). TheA-share market also has a remarkably high turnover rate, which has often been a monthly rate of100% and has routinely stayed at the level of 40% per month—the highest among major nationalstock markets. The turnover rate directly reflects the speculative behavior of many investors,who aim to make a quick profit through trading rather than investing for the long term. There
1
0
2
3
6,000
5,000
4,000
3,000
2,000
1,000
0
Jan 1994
Jan 1995
Jan 1996
Jan 1997
Jan 1998
Jan 1999
Jan 2000
Jan 2001
Jan 2002
Jan 2003
Jan 2004
Jan 2005
Jan 2006
Jan 2007
Jan 2008
Jan 2009
Jan 2010
Jan 2011
Jan 2012
Jan 2013
Jan 2014
Jan 2015
Jan 2016
Jan 2017
Date
Mon
thly
mar
ket t
urno
ver r
ate
Com
posi
te in
dex
Figure 6Shanghai Stock Exchange monthly market turnover rate (vertical axis, left) and Composite Index (vertical axis,right).
www.annualreviews.org • Risks in China’s Financial System 279
Ann
u. R
ev. F
inan
c. E
con.
201
8.10
:261
-286
. Dow
nloa
ded
from
ww
w.a
nnua
lrev
iew
s.or
g A
cces
s pr
ovid
ed b
y 72
.82.
224.
177
on 0
1/01
/19.
For
per
sona
l use
onl
y.

FE10CH12_Xiong ARI 11 October 2018 13:52
is also extensive evidence linking investors’ speculative motives, induced by their heterogeneousbeliefs, to stock prices in China (see, e.g., Mei, Scheinkman & Xiong 2009; Andrade, Bian &Burch 2013; Chang et al. 2015; Hong et al. 2014; Jia, Wang & Xiong 2017). The spectacularprice bubble associated with the deep out-of-the-money put warrants traded on the Shanghai andShenzhen Stock Exchanges in 2005–2008 provided another vivid example of how investors wholacked the basic knowledge of stock warrants caused frenzied speculation and highly inflated pricesfor fundamentally worthless securities (Xiong & Yu 2011; Gong, Pan & Shi 2016; Pearson, Yang& Zhang 2017).
Third, despite the rapid growth of China’s stock market, equity offerings contributed to onlyabout 5% of the total social financing to the real economy in 2015, while bank loans contributedover 70% (according to social financing statistics provided by the NBS). Due to this relativelysmall contribution to social financing, high stock market volatility is usually not a serious concernto the real economy.
Finally, the boom and bust of the stock market in 2015 deserves special attention due to theheavy use of financial leverage by stock investors. China has allowed investors to buy stocks onmargin only since March 2010, initially within a highly restricted list of only 90 stocks. The listwas gradually expanded to cover 800 stocks by September 2014. While buying on margin in thestock exchanges was closely monitored, a large amount of leverage was also employed outside theexchange system. Allegedly, some investors used leverage of a multiple of eight or even ten to buystocks in the off-exchange margin system. This large amount of leverage served to strongly prop upthe stock market before it peaked in June 2015. As the market started to turn back down, leveragecaused a liquidity spiral, as is often seen in financial market crashes across the world, leading toforced and preemptive liquidation by investors with large leverage (e.g., Bian et al. 2017a,b). Atone point, this liquidity spiral threatened the stability of the financial system, and the CSRC hadto orchestrate a national team of financial firms to bail out the falling stock market. The bailouteventually calmed down the stock market in late summer of 2015 (Huang, Miao & Wang 2016).
In the aftermath of the dramatic stock market boom and bust, the CSRC has substantiallytightened the use of margin buying both on and off the two stock exchanges. It is thus unlikelythat similar leverage-induced cycles will occur again in China’s stock market in the near future.
4.5. Policy Risk
Due to the two-track structure of the Chinese economy, the government has maintained a highlyactive role in managing the economy and the financial system. The extensive policy interventionsby the government have important implications for the risk and efficiency of the financial system.
There are several key motivations for government interventions in the financial system. First,as discussed above, the financial system provides the necessary financial instruments to fund thegovernment’s policy agenda. As a result, the government has undertaken various initiatives todevelop different financial markets and sectors to meet its funding needs. Second, the governmentbelieves that countercyclical management of the financial system is necessary due to the presenceof a large pool of inexperienced institutions and investors, which are often subject to excessivesentimental fluctuations. Guided by a paternalistic philosophy to protect inexperienced investorsand maintain market stability, the government has employed a wide range of policy tools tointervene in the financial system.
For example, the PBC has frequently used its authority to change benchmark interest rates forbank deposits and loans, which directly affect the costs of funding throughout the whole economy.The PBC has also frequently changed the required reserve ratio for banks to manage liquidity inthe banking system. In recent years, the PBC has also developed a macroprudential framework
280 Song · Xiong
Ann
u. R
ev. F
inan
c. E
con.
201
8.10
:261
-286
. Dow
nloa
ded
from
ww
w.a
nnua
lrev
iew
s.or
g A
cces
s pr
ovid
ed b
y 72
.82.
224.
177
on 0
1/01
/19.
For
per
sona
l use
onl
y.
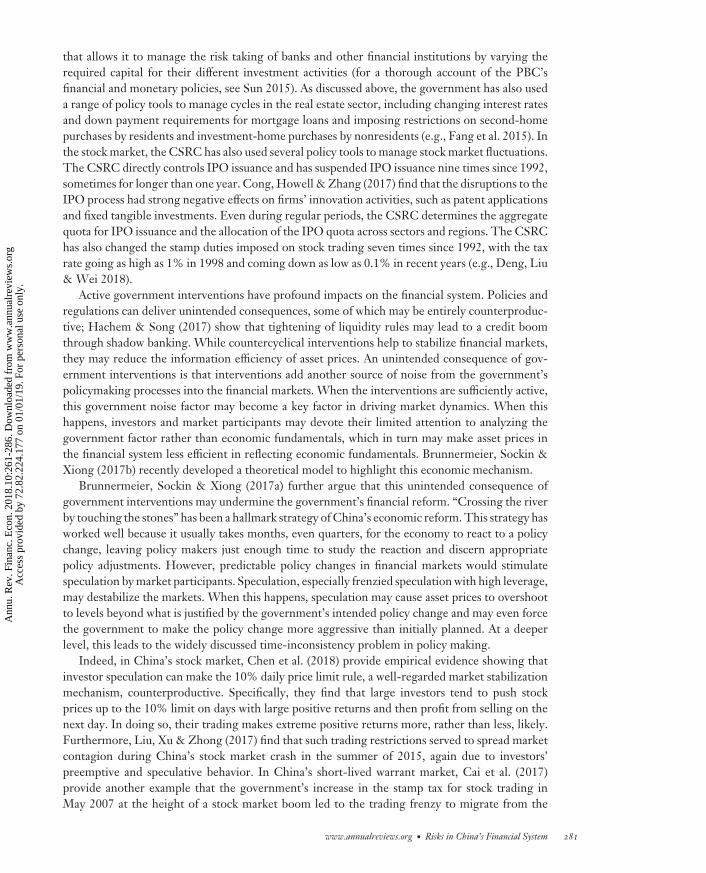
FE10CH12_Xiong ARI 11 October 2018 13:52
that allows it to manage the risk taking of banks and other financial institutions by varying therequired capital for their different investment activities (for a thorough account of the PBC’sfinancial and monetary policies, see Sun 2015). As discussed above, the government has also useda range of policy tools to manage cycles in the real estate sector, including changing interest ratesand down payment requirements for mortgage loans and imposing restrictions on second-homepurchases by residents and investment-home purchases by nonresidents (e.g., Fang et al. 2015). Inthe stock market, the CSRC has also used several policy tools to manage stock market fluctuations.The CSRC directly controls IPO issuance and has suspended IPO issuance nine times since 1992,sometimes for longer than one year. Cong, Howell & Zhang (2017) find that the disruptions to theIPO process had strong negative effects on firms’ innovation activities, such as patent applicationsand fixed tangible investments. Even during regular periods, the CSRC determines the aggregatequota for IPO issuance and the allocation of the IPO quota across sectors and regions. The CSRChas also changed the stamp duties imposed on stock trading seven times since 1992, with the taxrate going as high as 1% in 1998 and coming down as low as 0.1% in recent years (e.g., Deng, Liu& Wei 2018).
Active government interventions have profound impacts on the financial system. Policies andregulations can deliver unintended consequences, some of which may be entirely counterproduc-tive; Hachem & Song (2017) show that tightening of liquidity rules may lead to a credit boomthrough shadow banking. While countercyclical interventions help to stabilize financial markets,they may reduce the information efficiency of asset prices. An unintended consequence of gov-ernment interventions is that interventions add another source of noise from the government’spolicymaking processes into the financial markets. When the interventions are sufficiently active,this government noise factor may become a key factor in driving market dynamics. When thishappens, investors and market participants may devote their limited attention to analyzing thegovernment factor rather than economic fundamentals, which in turn may make asset prices inthe financial system less efficient in reflecting economic fundamentals. Brunnermeier, Sockin &Xiong (2017b) recently developed a theoretical model to highlight this economic mechanism.
Brunnermeier, Sockin & Xiong (2017a) further argue that this unintended consequence ofgovernment interventions may undermine the government’s financial reform. “Crossing the riverby touching the stones” has been a hallmark strategy of China’s economic reform. This strategy hasworked well because it usually takes months, even quarters, for the economy to react to a policychange, leaving policy makers just enough time to study the reaction and discern appropriatepolicy adjustments. However, predictable policy changes in financial markets would stimulatespeculation by market participants. Speculation, especially frenzied speculation with high leverage,may destabilize the markets. When this happens, speculation may cause asset prices to overshootto levels beyond what is justified by the government’s intended policy change and may even forcethe government to make the policy change more aggressive than initially planned. At a deeperlevel, this leads to the widely discussed time-inconsistency problem in policy making.
Indeed, in China’s stock market, Chen et al. (2018) provide empirical evidence showing thatinvestor speculation can make the 10% daily price limit rule, a well-regarded market stabilizationmechanism, counterproductive. Specifically, they find that large investors tend to push stockprices up to the 10% limit on days with large positive returns and then profit from selling on thenext day. In doing so, their trading makes extreme positive returns more, rather than less, likely.Furthermore, Liu, Xu & Zhong (2017) find that such trading restrictions served to spread marketcontagion during China’s stock market crash in the summer of 2015, again due to investors’preemptive and speculative behavior. In China’s short-lived warrant market, Cai et al. (2017)provide another example that the government’s increase in the stamp tax for stock trading inMay 2007 at the height of a stock market boom led to the trading frenzy to migrate from the
www.annualreviews.org • Risks in China’s Financial System 281
Ann
u. R
ev. F
inan
c. E
con.
201
8.10
:261
-286
. Dow
nloa
ded
from
ww
w.a
nnua
lrev
iew
s.or
g A
cces
s pr
ovid
ed b
y 72
.82.
224.
177
on 0
1/01
/19.
For
per
sona
l use
onl
y.
FE10CH12_Xiong ARI 11 October 2018 13:52
stock market to the warrant market, which was not subject to the stamp tax. Furthermore, Chen,Petukhov & Wang (2017) develop a theoretical model to show that market-wide trading haltsmay increase, rather than decrease, the probability of hitting the triggering price threshold, whichhelps explain the short-lived circuit breakers adopted by China’s stock market in January 2016.
Frequent government interventions also reinforce the perceived government guarantees bymarket participants, which in turn create another channel to indulge excessive risk taking bymarket participants (for a full account of how government guarantees have led to widespreadrisk-taking behavior across China, see Zhu 2016).
Through the aforementioned channels, households and firms across the country have strongincentives to use various instruments offered by the financial system to load on risks that are tiedto policy agendas and regulations of the government. As a result, the financial system may serveto aggregate risks—risks that are backed by the government—instead of spreading risks acrossdifferent households and firms. This may eventually reduce the efficiency of the financial systemand exacerbate systemic risk.
5. CONCLUSION
By reviewing China’s unique economic and financial systems, we argue that the widely heldconcerns about rising leverage and housing prices are unlikely to lead to an imminent financialcrisis in China. Instead, we believe the ultimate risk lies with the efficiency of the financial systemin allocating capital and supporting China’s economic growth. In particular, a vicious cycle ofdistortions in the financial system may lower economic growth and exacerbate financial risks inthe long run.
DISCLOSURE STATEMENT
The authors are not aware of any affiliations, memberships, funding, or financial holdings thatmight be perceived as affecting the objectivity of this review.
LITERATURE CITED
Acharya V, Qian J, Yang Z. 2016. In the shadow of banks: wealth management products and issuing banks’ risk inChina. Work. Pap., Stern Sch. Bus., N.Y. Univ., New York
Aharony J, Lee CWJ, Wong TJ. 2000. Financial packaging of IPO firms in China. J. Account. Res. 38(1):103–26Allen F, Qian J. 2014. China’s financial system and the law. Cornell Int. Law J. 47(3):499–554Allen F, Qian J, Gu X. 2017. An overview of China’s financial system. Annu. Rev. Financ. Econ. 9:191–231Allen F, Qian J, Qian M. 2005. Law, finance, and economic growth in China. J. Financ. Econ. 77(1):57–116Allen F, Qian J, Shan C, Zhu L. 2017. Dissecting the long-term performance of the Chinese stock market. Work.
Pap., Imp. Coll. Lond., LondonAllen F, Qian J, Zhang C, Zhao M. 2012. China’s financial system: opportunities and challenges. In Capitalizing
China, ed. J Fan, R Morck, pp. 63–148. Chicago: Univ. Chicago PressAllen F, Qian Y, Tu G, Yu F. 2016. Entrusted loans: a close look at China’s shadow banking system. Work. Pap.,
Imp. Coll. Lond., LondonAllen WT, Shen H. 2012. Assessing China’s top-down securities markets. In Capitalizing China, ed. J Fan,
R Morck, pp. 149–95. Chicago: Univ. Chicago PressAndrade SC, Bian J, Burch TR. 2013. Analyst coverage, information, and bubbles. J. Financ. Quant. Anal.
48(5):1573–605Bai CE, Hsieh CT, Song Z. 2016. The long shadow of China’s fiscal expansion. Brookings Pap. Econ. Act.
2016(Fall):129–65
282 Song · Xiong
Ann
u. R
ev. F
inan
c. E
con.
201
8.10
:261
-286
. Dow
nloa
ded
from
ww
w.a
nnua
lrev
iew
s.or
g A
cces
s pr
ovid
ed b
y 72
.82.
224.
177
on 0
1/01
/19.
For
per
sona
l use
onl
y.

FE10CH12_Xiong ARI 11 October 2018 13:52
Bai CE, Hsieh CT, Song Z. 2018. Institutional foundations for China’s growth and slowdown. Unpublishedmanuscript
Bai CE, Zhang Q. 2015. The return on capital in China and its determinants. China Econ. 10(3):20–37Barberis N, Greenwood R, Jin L, Shleifer A. 2016. Extrapolation and bubbles. NBER Work. Pap. 21944Bian J, Da Z, Lou D, Zhou H. 2017a. Leverage network and market contagion. Work. Pap., Mendoza Coll. Bus.,
Univ. Notre Dame, Notre Dame, INBian J, He Z, Shue K, Zhou H. 2017b. Leverage-induced fire sales and stock market crashes. Work. Pap., Univ.
Chicago, ChicagoBleck A, Liu X. 2018. Credit expansion and credit misallocation. J. Monet. Econ. 94:27–40Bonin JP, Huang Y. 2001. Dealing with the bad loans of the Chinese banks. J. Asian Econ. 12(2):197–214Borst N, Lardy N. 2015. Maintaining financial stability in the People’s Republic of China during financial liberal-
ization. Work. Pap. 15-4, Peterson Inst. Int. Econ., Washington, DCBrandt L, Van Biesebroeck J, Zhang Y. 2012. Creative accounting or creative destruction? Firm-level pro-
ductivity growth in Chinese manufacturing. J. Dev. Econ. 97(2):339–51Brandt L, Wang L, Zhang Y. 2017. Productivity in Chinese industry: 1998–2013. Work. Pap., Univ. Toronto,
TorontoBrandt L, Zhu X. 2000. Redistribution in a decentralized economy: growth and inflation in China under
reform. J. Political Econ. 108(2):422–39Brunnermeier M, Sockin M, Xiong W. 2017a. China’s gradualistic economic approach and financial markets.
Am. Econ. Rev. Pap. Proc. 107(5):608–13Brunnermeier M, Sockin M, Xiong W. 2017b. China’s model of managing the financial system. Work. Pap.,
Princeton Univ., Princeton, NJCai J, He J, Jiang W, Xiong W. 2017. The whack-a-mole game: Tobin tax and trading frenzy. Work. Pap.,
Princeton Univ., Princeton, NJCarpenter JN, Whitelaw RF. 2017. The development of China’s stock market and stakes for the global
economy. Annu. Rev. Financ. Econ. 9:233–57Case KE, Shiller RJ. 2003. Is there a bubble in the housing market? Brookings Pap. Econ. Act. 2003(2):299–342Chang C, Liu Z, Spiegel MM. 2015. Capital controls and optimal Chinese monetary policy. J. Monet. Econ.
74:1–15Chang YC, Hong HG, Tiedens L, Wang N, Zhao B. 2015. Does diversity lead to diverse opinions? Evidence from
languages and stock markets. Work. Pap., Columbia Univ., New YorkChen H, Petukhov A, Wang J. 2017. The dark side of circuit breakers. Work. Pap., Mass. Inst. Technol.,
Cambridge, MAChen J, Chen Z. 2016. Confucianism, social norms and household savings rates in China. Work. Pap., Yale Univ.,
New Haven, CTChen K, Ren J, Zha T. 2016. What we learn from China’s rising shadow banking: exploring the nexus of monetary
tightening and banks’ role in entrusted lending. Work. Pap. 2016-1, Fed. Reserve Bank AtlantaChen K, Wen Y. 2017. The great housing boom of China. Am. Econ. J. 9(2):73–114Chen KCW, Yuan H. 2004. Earnings management and capital resource allocation: evidence from China’s
accounting-based regulation of rights issues. Account. Rev. 79(3):645–65Chen T, Gao Z, He J, Jiang W, Xiong W. 2018. Daily price limits and destructive market behavior. J. Econom.
In pressChen T, Liu L, Xiong W, Zhou LA. 2017. Real estate boom and misallocation of capital in China. Work. Pap.,
Princeton Univ., Princeton, NJChen X, Lee CJ, Li J. 2008. Government assisted earnings management in China. J. Account. Public Policy
27(3):262–74Chen Z. 2015. China’s dangerous debt. Foreign Aff. 94:13–24Chen Z, He Z, Liu C. 2017. The financing of local government in China: Stimulus loan wanes and shadow banking
waxes. NBER Work. Pap. 23598Chivakul M, Lam RW. 2015. Assessing China’s corporate sector vulnerabilities. Work. Pap., Int. Monet. Fund,
Washington, DCChoukhmane T, Coeurdacier N, Jin K. 2016. The one-child policy and household savings. Work. Pap., Lond. Sch.
Econ., London
www.annualreviews.org • Risks in China’s Financial System 283
Ann
u. R
ev. F
inan
c. E
con.
201
8.10
:261
-286
. Dow
nloa
ded
from
ww
w.a
nnua
lrev
iew
s.or
g A
cces
s pr
ovid
ed b
y 72
.82.
224.
177
on 0
1/01
/19.
For
per
sona
l use
onl
y.

FE10CH12_Xiong ARI 11 October 2018 13:52
Cong LW, Howell S, Zhang R. 2017. The impact of delay in going public: evidence from China. Work. Pap., Univ.Chicago, Chicago
Cong LW, Ponticelli J. 2016. Credit allocation under economic stimulus: evidence from China. Res. Pap. 17-19,Booth Sch. Bus., Univ. Chicago, Chicago
Cooper R, Zhu G. 2017. Household finance in China. NBER Work. Pap. 23741Deng Y, Liu X, Wei S. 2018. One fundamental and two taxes: When does a Tobin tax reduce financial price
volatility? J. Financ. Econ. In press. https://doi.org/10.1016/j.jfineco.2018.04.009Dewatripont M, Maskin E. 1995. Credit and efficiency in centralized and decentralized economies. Rev. Econ.
Stud. 62(4):541–55Diamond DW, Dybvig PH. 1983. Bank runs, deposit insurance, and liquidity. J. Political Econ. 91(3):401–19Du J, Li C, Wang Y. 2016. Shadow banking activities in non-financial firms: evidence from China. Work. Pap.,
Dep. Econ., Chin. Univ. Hong Kong, Hong KongFan JPH, Wong TJ, Zhang T. 2007. Politically connected CEOs, corporate governance, and post-IPO per-
formance of China’s newly partially privatized firms. J. Financ. Econ. 84(2):330–57Fang H, Gu Q, Xiong W, Zhou L. 2015. Demystifying the Chinese housing boom. NBER Macroecon. Annu.
30(1):105–66Ge F, Luo J, Song Z, Yuan Y. 2017. Aggregating misallocation under endogenous markups: theory and evidence from
China. Work. Pap., Dep. Econ., Chin. Univ. Hong Kong, Hong KongGennaioli N, Shleifer A, Vishny R. 2015. Neglected risks: the psychology of financial crises. Am. Econ. Rev.
105(5):310–14Glaeser E, Huang W, Ma Y, Shleifer A. 2017. A real estate boom with Chinese characteristics. J. Econ. Perspect.
31(1):93–116Gong B, Pan D, Shi D. 2016. New investors and bubbles: an analysis of the Baosteel call warrant bubble.
Manag. Sci. 63(8):2493–508Gordon RH, Li W. 2003. Government as a discriminating monopolist in the financial market: the case of
China. J. Public Econ. 87(2):283–312Hachem K. 2018. Shadow banking in China. Annu. Rev. Financ. Econ. 10:287–308Hachem K, Song ZM. 2016. Liquidity regulation and unintended financial transformation in China. Work. Pap.,
Dep. Econ., Chin. Univ. Hong Kong, Hong KongHachem K, Song ZM. 2017. Liquidity rules and credit booms. Work. Pap., Dep. Econ., Chin. Univ. Hong Kong,
Hong KongHe Z, Xiong W. 2012. Dynamic debt runs. Rev. Financ. Stud. 25(6):1799–843Hong H, Jiang W, Wang N, Zhao B. 2014. Trading for status. Rev. Financ. Stud. 27(11):3171–212Hsieh CT, Klenow PJ. 2009. Misallocation and manufacturing TFP in China and India. Q. J. Econ.
124(4):1403–48Hsieh CT, Song Z. 2015. Grasp the large, let go of the small: the transformation of the state sector in China.
Brookings Pap. Econ. Act. 2015(Spring):295–366Huang Y. 2008. Capitalism with Chinese Characteristics. Cambridge, UK: Cambridge Univ. PressHuang Y, Miao J, Wang P. 2016. Saving China’s stock market. Work. Pap., Boston Univ., BostonHuang Y, Pagano M, Panizza U. 2016. Public debt and private firm funding: evidence from Chinese cities. Work.
Pap., Dep. Econ., Grad. Inst. Int. Dev. Stud., GenevaJia C, Wang Y, Xiong W. 2017. Market segmentation and differential reactions of local and foreign investors
to analyst recommendations. Rev. Financ. Stud. 30(9):2972–3008Kornai J. 1979. Resource-constrained versus demand-constrained systems. Econometrica 47(4):801–19Kornai J. 1980. Economics of Shortage. Amsterdam: North-HollandKornai J, Maskin E, Roland G. 2003. Understanding the soft budget constraint. J. Econ. Lit. 41(4):1095–136Lau LJ, Qian Y, Roland G. 2000. Reform without losers: an interpretation of China’s dual-track approach to
transition. J. Political Econ. 108(1):120–43Lee C, Qu Y, Shen T. 2017. Reverse mergers, shell value, and regulation risk in Chinese equity markets. Work.
Pap., Stanford Univ., Stanford, CALi B, Liu Q. 2017. On the choice of monetary policy rules for China: a Bayesian DSGE approach. China Econ.
Rev. 44:166–85
284 Song · Xiong
Ann
u. R
ev. F
inan
c. E
con.
201
8.10
:261
-286
. Dow
nloa
ded
from
ww
w.a
nnua
lrev
iew
s.or
g A
cces
s pr
ovid
ed b
y 72
.82.
224.
177
on 0
1/01
/19.
For
per
sona
l use
onl
y.

FE10CH12_Xiong ARI 11 October 2018 13:52
Li DD. 2001. Beating the trap of financial repression in China. Cato J. 21(1):77–91Li H, Zhou LA. 2005. Political turnover and economic performance: the incentive role of personnel control
in China. J. Public Econ. 89(9):1743–62Li X, Liu X, Wang Y. 2014. A model of China’s state capitalism. Work. Pap., Hong Kong Univ. Sci. Technol.,
Hong KongLin JY, Cai F, Li Z. 1998. Competition, policy burdens, and state-owned enterprise reform. Am. Econ. Rev.
88(2):422–27Liu X, Xu J, Zhong N. 2017. Trading restriction as a channel of financial contagion-evidence from China’s stock
market. Work. Pap., Peking Univ., PekingLiu Z, Wang P, Xu Z. 2017. Interest-rate liberalization and capital misallocation. Work. Pap. 2017-15, Fed.
Reserve Bank of San Francisco, San FranciscoMaliszewski W, Arslanalp MS, Caparusso J, Garrido J, Guo MS, et al. 2016. Resolving China’s corporate debt
problem. Work. Pap. WP/16/203, Int. Monet. Fund, Washington, DCMei J, Scheinkman J, Xiong W. 2009. Speculative trading and stock prices: evidence from Chinese AB share
premia. Ann. Econ. Financ. 10(2):225–55Mian A, Sufi A. 2009. The consequences of mortgage credit expansion: evidence from the US mortgage default
crisis. Q. J. Econ. 124(4):1449–96Morris S, Shin HS. 2004. Coordination risk and the price of debt. Eur. Econ. Rev. 48(1):133–53Myers SC. 1977. Determinants of corporate borrowing. J. Financ. Econ. 5(2):147–75Nat. Bur. Stat. China. 2017. China Statistical Yearbook 2017. Beijing: China Stat. PressPearson N, Yang Z, Zhang Q. 2017. Evidence about bubble mechanisms: precipitating event, feedback trading, and
social contagion. Work. Pap., Univ. Illinois, Urbana-ChampaignPiotroski JD, Wong TJ. 2012. Institutions and information environment of Chinese listed firms. In Capital-
izing China, ed. J Fan, R Morck, pp. 201–42. Chicago: Univ. Chicago PressPiotroski JD, Zhang T. 2014. Politicians and the IPO decision: the impact of impending political promotions
on IPO activity in China. J. Financ. Econ. 111(1):111–36Prasad E. 2017. Gaining Currency: The Rise of the Renminbi. Oxford, UK: Oxford Univ. PressPritchett L, Summers LH. 2014. Asiaphoria meets regression to the mean. NBER Work. Pap. 20573Qian Y. 2017. How Reform Worked in China. Cambridge, MA: MIT PressQian Y, Roland G. 1998. Federalism and the soft budget constraint. Am. Econ. Rev. 88(5):1143–62Shi J, Wang Y, Wu W. 2016. The crowding-out effect of real estate markets on corporate innovation: evidence from
China. Work. Pap., Univ. South. Calif., Los AngelesShi Y. 2017. Real estate booms and endogenous productivity growth. Work. Pap., Mass. Inst. Technol., Cambridge,
MASong Z, Storesletten K, Zilibotti F. 2011. Growing like China. Am. Econ. Rev. 101(1):196–233Song Z, Storesletten K, Zilibotti F. 2014. Growing (with capital controls) like China. IMF Econ. Rev. 62(3):327–
70Song Z, Wu GL. 2015. Identifying capital misallocation. Work. Pap., Univ. Chicago, ChicagoState Counc. People’s Repub. China. 2016. China details plan for debt-for-equity swaps. http://english.gov.
cn/policies/policy_watch/2016/10/11/content_281475463445096.htmSun G. 2015. Reforms in China’s Monetary Policy. London: Palgrave MacmillanSun G. 2017. China’s monetary policy and its RMB exchange rate regime. VoxChina, Sep. 20. http://voxchina.
org/show-3-45.htmlSun G, Jia J. 2015. [Defining China’s shadow banking and assessing its scale: seen in terms of the creation of
credit money]. China’s Soc. Sci. 239(11):92–110 (In Chinese)Sun G, Lu D. 2012. [Predictive analysis on mid-long term trend of current account surplus in China based on
a perspective of saving-investment structural change]. [Compar. Stud.] 63(6):142–59 (In Chinese)Tan Y, Huang Y, Woo WT. 2016. Zombie firms and the crowding-out of private investment in China. Asian
Econ. Pap. 15(3):32–55Walter C, Howie F. 2012. Red Capitalism: The Fragile Financial Foundation of China’s Extraordinary Rise. New
York: John Wiley & SonsWang H, Wang H, Wang L, Zhou H. 2012. Shadow banking: China’s dual-track interest rate liberalization.
Work. Pap., Tsinghua Univ., Beijing
www.annualreviews.org • Risks in China’s Financial System 285
Ann
u. R
ev. F
inan
c. E
con.
201
8.10
:261
-286
. Dow
nloa
ded
from
ww
w.a
nnua
lrev
iew
s.or
g A
cces
s pr
ovid
ed b
y 72
.82.
224.
177
on 0
1/01
/19.
For
per
sona
l use
onl
y.

FE10CH12_Xiong ARI 11 October 2018 13:52
Wang Y. 2016. Will China escape the middle-income trap? A politico-economic theory of growth and state capitalism.Work. Pap., Univ. Oslo, Oslo, Nor.
Wei SJ, Zhang X. 2011. The competitive saving motive: evidence from rising sex ratios and savings rates inChina. J. Polit. Econ. 119(3):511–64
Wong SML. 2006. China’s stock market: a marriage of capitalism and socialism. Cato J. 26(3):389–424Wu J, Gyourko J, Deng Y. 2012. Evaluating conditions in major Chinese housing markets. Reg. Sci. Urban
Econ. 42(3):531–43Wu J, Gyourko J, Deng Y. 2016. Evaluating the risk of Chinese housing markets: what we know and what we
need to know. China Econ. Rev. 39:91–114Xie Y, Jin Y. 2015. Household wealth in China. Chin. Sociol. Rev. 47(3):203–29Xiong W. 2018. The Mandarin model of growth. Work. Pap., Princeton Univ., Princeton, NJXiong W, Yu J. 2011. The Chinese warrants bubble. Am. Econ. Rev. 101(6):2723–53Xu C. 2011. The fundamental institutions of China’s reforms and development. J. Econ. Lit. 49(4):1076–151Xu C. 2015. China’s political-economic institutions and development. Cato J. 35(3):525–48Yang DT. 2012. Aggregate savings and external imbalances in China. J. Econ. Perspect. 26(4):125–46Yang DT, Zhang J, Zhou S. 2011. Why are saving rates so high in China? In Capitalizing China, ed. J Fan,
R Morck, pp. 249–78. Chicago: Univ. Chicago PressZhang Y. 2017. Liquidity constraints, transition dynamics, and the Chinese housing return premium. Work. Pap.,
Peking Univ., BeijingZhou LA. 2002. Career concerns, incentive contracts, and contract renegotiation in the Chinese political economy. PhD
Diss., Stanford Univ., Palo Alto, CAZhou LA. 2007. Zhongguo difang guanyuan de jingsheng jinbiaosai moshi yanjiu [Governing China’s local officials:
an analysis of promotion tournament model]. Jingji Yanjiu [Econ. Res. J.] 42(7):36–50Zhou X. 2006. China’s corporate bond market development: lessons learned. In Developing Corporate Bond
Markets in Asia, BIS Pap. Vol. 26, pp. 7–10. Basel, Switz.: Bank Int. Settl.Zhu N. 2016. China’s Guaranteed Bubble: How Implicit Government Support Has Propelled China’s Economy While
Creating Systemic Risk. New York: McGraw-Hill Education.Zhu X. 2012. Understanding China’s growth: past, present, and future. J. Econ. Perspect. 26(4):103–24Zhu X. 2017. The varying shadow of China’s banking system. Work. Pap., Dep. Econ., Univ. TorontoZilibotti F. 2017. Growing and slowing down like China. J. Eur. Econ. Assoc. 15(5):943–88
286 Song · Xiong
Ann
u. R
ev. F
inan
c. E
con.
201
8.10
:261
-286
. Dow
nloa
ded
from
ww
w.a
nnua
lrev
iew
s.or
g A
cces
s pr
ovid
ed b
y 72
.82.
224.
177
on 0
1/01
/19.
For
per
sona
l use
onl
y.