risk measurement at pimco - uci paul merage school …jorion/varseminar/riskmanagement...2 uarterlyq...
TRANSCRIPT

Quarterly ReviewF O U R T H Q U A R T E R 2 0 0 0
Risk Measurement at PIMCO
In June of 1998, we wrote “Measuring Risk in Bond Portfolios – A Primer”to describe the important portfolio level risk metrics that PIMCO haddeveloped to measure and control risk in client portfolios. In that paper weadvocated separate measurement of the many risk factors impacting bondportfolios, rather than the increasingly popular single measure approachessuch as VAR or tracking error. The ensuing months proved turbulent asRussia defaulted and triggered extreme dislocation in global bond markets.Correlations of most spread product soared, and players who invested onthe assumption that history would eventually repeat itself experiencedtrouble, Long Term Capital being the most notorious. The robustness ofPIMCO’s risk metrics enabled us to endure that and subsequent volatileperiods relatively unscathed. Since risk measurement is a continuallyevolving field, we would like to take this opportunity to update you onour efforts.
Vineer Bhansali is the new head of domestic analytics at PIMCO. Hejoined us early in 2000 to assume many of Pasi Hamalainen’s responsibili-ties, in anticipation of Pasi’s move to Munich to head up portfolio manage-ment there. Vineer is an Executive Vice President of PIMCO and a seniormember of PIMCO's portfolio management group. He was previouslyassociated with Credit Suisse First Boston, where he was Vice President ofproprietary fixed-income trading. Prior to that, he was a proprietary traderfor the Salomon Brothers arbitrage desk in New York and worked in theglobal derivatives group at Citibank. He is the author of numerousscientific and financial papers, and is the author of the book Pricing andManaging Exotic and Hybrid Options published by McGraw-Hill in 1998.He currently serves as an associate editor for the International Journal ofTheoretical and Applied Finance. Vineer has ten years of investment experi-ence, and holds a bachelor’s and master’s degree in physics from theCalifornia Institute of Technology, and a Ph.D. in theoretical particlephysics from Harvard University.
(continued inside)
�������������
����������������
��������������������

2�����Q U A R T E R L Y R E V I E W
Risk Measurement at PIMCO
������������� ����������������������������� �����������All portfolio level risk measures are simply an aggregationof the risks of each individual security held in a portfolio.Therefore, accurate portfolio level risk measurementdepends on accurate individual security risk measurement.PIMCO has developed a library of proprietary models tovalue and measure risks in virtually every fixed incomesecurity type including:
These relative value and risk models are designed topermit stress testing of all embedded assumptions in orderto provide portfolio managers with the widest spectrum ofoutcomes, from very likely to most unlikely. Our modelsare unbiased by PIMCO’s market views, and wherepossible, we allow for calibration of important variablessuch as volatility and future interest rates using tradedsecurity prices. We embed a common interest rate or termstructure model in all our analytics, so that all our riskmeasures are comparable across sectors and can belegitimately aggregated. The Financial Engineering Group,led by Vineer, continually upgrades PIMCO models toreflect the latest advances in theoretical finance and
responds to innovation on Wall Street by creating newrisk measurement models for newly developed fixedincome instruments.
����� ���������� �����PIMCO computes the risk characteristics of all the majorbenchmarks used by our clients. In practice, this entailsusing the models listed above to analyze each and everybond in large indices such as the Lehman Aggregate or theLehman Global Aggregate (6000+ securities), on a dailybasis. The proprietary portfolio level risk measures thatwe describe below are then computed for each benchmark,so that portfolio managers have targets against which theycan manage portfolios. Frequently our proprietarysystems identify risks (such as effective durations formortgages) that are different from the index provider’sown values, and we can use those insights to enhanceperformance and lower the tracking error of our portfolios.On any given day, we are re-computing the risk measuresusing our own analytics for more than 500 primary andsecondary benchmarks.
���� �����������Until 15 or 20 years ago, average maturity was used togauge a portfolio’s price sensitivity to changes in interestrates. Maturity’s major shortcoming – only considering abond’s final due date, and not the dates of the interveningcashflows – is now well understood. Effective duration,which does consider all cashflows, is now the standardway to measure interest rate risk. However, duration,while useful, has its shortcomings too, and must beaugmented with other measures of interest rate risk:
Effective Duration – Effective duration is a weightedaverage maturity calculation that incorporates all of abond’s expected cashflows, and weights them accordingto the present value of each cashflow. It is used to measurea bond’s price sensitivity to changes in interest rates.However, it is only an accurate predictor of price for small,parallel shifts in the yield curve. For a small parallelinterest rate fluctuation, the percentage change in a bond’sprice is approximately equal to its duration multiplied bythe size of the shift. For example, a portfolio with aduration of 2 years would be expected to go up in price by2 basis points for every 1 basis point drop in interest rates.
Effective Convexity – When moderate to large changes ininterest rates occur, effective duration cannot accuratelypredict the change in value of a bond because its duration
� �������������� �����������������������������
� ������������� ���������������������������������
� ���������������������� ��������������������������������������������������
� !��
� "# �����
� $��������������
� "������
� �������%���������"������
� �������������
� ���������������
� &�������!������������������
� $�������������� ���������
� #���'����
� (����������)���
� *&+�
� "��������������������������������
� �������������������������� "��"����,(�����������
� (-����&���."����������������
Q U A R T E R L Y R E V I E W 3
Risk Measurement at PIMCO
will change. The duration of an option free bond, suchas a treasury, will increase as rates fall and decrease asrates rise because the discount rate used in the durationcalculation falls and rises, respectively. Convexitycaptures the price effect resulting from the durationchange. Positive convexity is always favorable to bondinvestors, however, one can rarely get it for free – investorsgenerally pay for positive convexity by accepting lower yields.
The duration of a mortgage security will increase as ratesrise because prepayments will be slower than originallyassumed, swamping the favorable impact of the change inthe discount rate. Conversely, in a bull market, wheninterest rates fall, a mortgage will generally become shorterin duration because prepayments will speed up. Thisperverse characteristic of becoming longer in bear marketsand shorter in bull markets is referred to as negativeconvexity, and is the main reason why mortgage investorsare paid higher yields than treasuries, which have similarcredit quality.
For non-optionable securities, the calculation of convexityincludes the simple discounting of known, fixed cashflows.However, for mortgages and other optionable bonds, thecalculation of convexity is not so simple because it involvesbehavioral assumptions (e.g. future prepayment patterns).Moreover, convexity assumes that duration extension orcontraction in response to interest rate changes issymmetrical. In other words, the change in durationinduced by a rise in rates, will be identical in magnitude(though opposite in direction) to the change induced bya similar fall in rates. In the real world, optionable bondsrarely exhibit symmetry.
Bull and Bear Market Durations – Because of theshortcomings of effective convexity, PIMCO’s riskmanagement process does not rely on the commonapproach of using a combination of effective duration andeffective convexity to predict the response of our portfoliosto a large parallel shift in interest rates. Instead, we havedeveloped proprietary measures known as bull and bearmarket durations. To calculate these durations, we shockthe portfolio with a 50 basis point rise and 50 basis pointdrop in rates. Each security in our portfolios is thenindividually re-analyzed using the appropriate securityvaluation tool (e.g. our adjustable rate mortgage model,our mortgage pass-through model or our callable corporatebond model), to calculate the expected duration under the“shock” scenarios. Those durations are then averaged toarrive at the portfolio bull and bear durations. Each of
PIMCO’s security specific models is designed to reflectreal world behavior, and are therefore not exposed to theerroneous assumptions of the standard convexity calculation.
While PIMCO typically uses shock scenarios of plus orminus 50 basis points, we have the ability to run scenariosof different magnitudes. A portfolio with a +50 BearDuration of 5 years, versus an effective duration of 4.5years, tells the portfolio manager the portfolio is exposedto extension risk. An effective portfolio convexitycalculation would not usually measure that risk accurately.
������� ����������� ��Yield curve risk gauges price exposure to non-parallelshifts in the yield curve. It is critical to evaluate yield curveexposure because two portfolios with identical effectivedurations can perform very differently. For example, a 5year duration portfolio that contains only 5 year durationbonds (called a bullet structure) can perform verydifferently from a 5 year duration portfolio that contains50% cash and 50% 10 year duration bonds (called abarbell). Barbelled portfolios will typically outperformbulleted portfolios if the yield curve flattens (spreads oflong rates narrow relative to short rates), and vice-versa.PIMCO measures and monitors yield curve exposure withthe following tools:
Curve Durations – Empirical evidence suggests that morethan 95% of the fluctuations of the yield curve can bedescribed in terms of parallel shifts and twists. PIMCOtries to capture the effect of these two factors with ourcurve duration risk measures. We assume the 10 yearpoint of the curve as the pivot point, and then our2-10 Duration measures the price sensitivity of a portfolioto a steepening or flattening in the 2 to 10 year part of thecurve, while our 10-30 Duration measures the impact ofchanges to the slope of the 10 to 30 year part of the curve.
However, since no single measure can accurately captureall the curve exposure in our portfolios, we also decomposeour exposures along the yield curve into multiple durationclassification matrices.
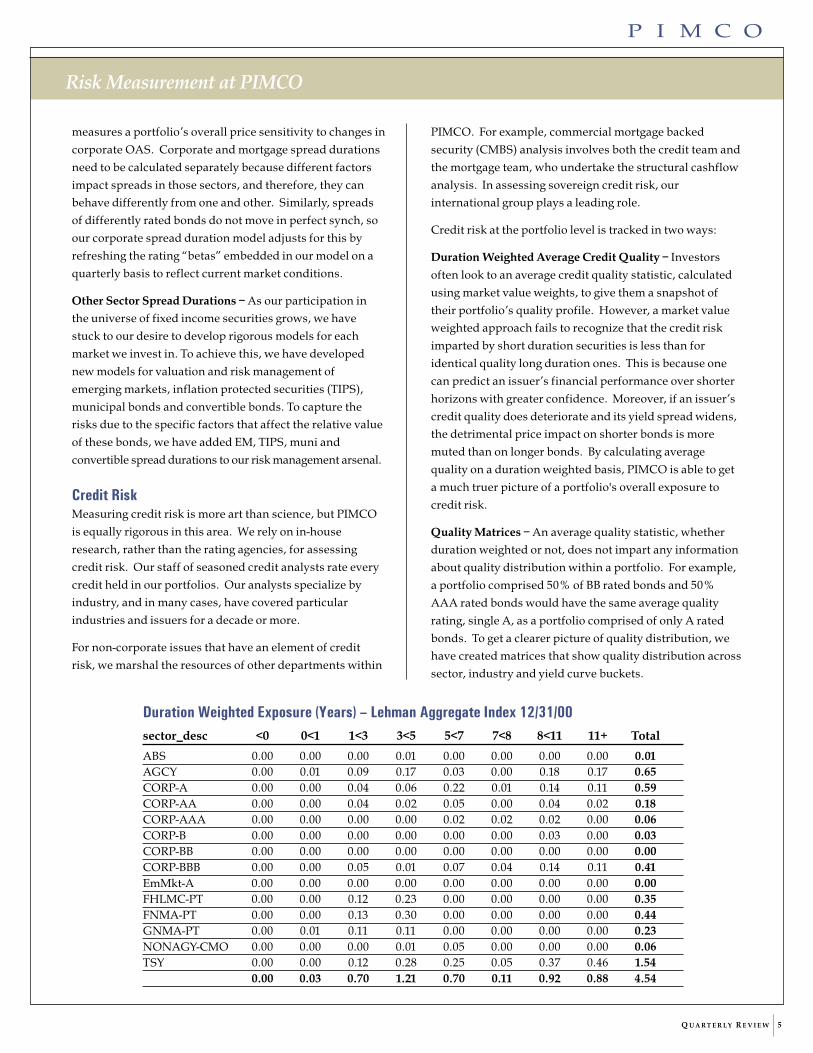
Duration Classification Matrices – Each holding within aPIMCO portfolio is individually analyzed daily in order topopulate a variety of duration classification matrices. Wecan also create a similar matrix for any client benchmarks,as shown for the Lehman Aggregate Index on the nextpage. The matrix sorts the portfolio or benchmark into“duration buckets” that can be customized by the user.

4�����Q U A R T E R L Y R E V I E W
Risk Measurement at PIMCO
�� �������������� !��� �"��� �#$������%�� ��������� ���&'()*')++<0 0 to 1 1 to 3 3 to 5 5 to 7 7 to 8 8 to 11 11+ Total
Treasury/Tsy Future 0.00 0.00 0.12 0.28 0.25 0.05 0.37 0.46 1.54Agencies/Swaps 0.00 0.01 0.09 0.17 0.03 0.00 0.18 0.17 0.65GNMA Mtg/CMOs 0.00 0.01 0.11 0.11 0.00 0.00 0.00 0.00 0.23Conventional Mtges/CMOs 0.00 0.01 0.25 0.53 0.00 0.00 0.00 0.00 0.79NonAgency Mtges/CMOs 0.00 0.00 0.00 0.03 0.05 0.00 0.00 0.00 0.07Corporates 0.00 0.01 0.13 0.09 0.36 0.06 0.34 0.25 1.24High Yield 0.00 0.00 0.00 0.00 0.00 0.00 0.03 0.00 0.03Emerging Markets 0.00 0.00 0.00 0.00 0.00 0.00 0.00 0.00 0.00
0.00 0.03 0.70 1.21 0.70 0.11 0.92 0.88 4.54
The matrix can be run on a market value weighted basis, aduration weighted basis or using one of our sector riskmeasures, enabling portfolios managers greater insightinto the nature of their exposure along the yield curve. Todrill deeper, portfolio managers can click on any cell in thematrix and identify all the individual securities thatcontribute to that cell.
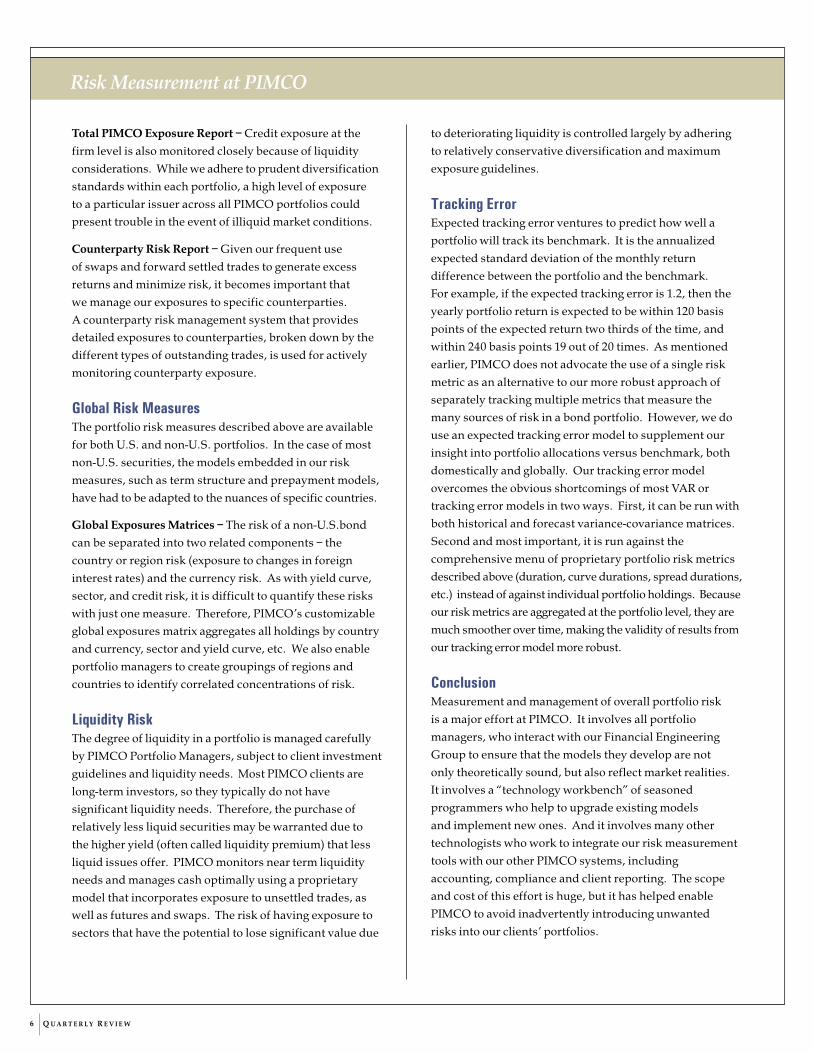
���� � !��� �Sector Classification Matrix – Just as the classificationmatrix is used to depict portfolio exposure along the yieldcurve, it also shows portfolio exposure to each sector. Thesample matrix above shows eight different sector buckets,but portfolio managers have unlimited ability to customizethem. This enables PIMCO’s mortgage specialist, forexample, to drill deeper into our mortgage holdings bydefining finer slices. A sample matrix with more sectordetail is shown on the following page.
While the matrix provides in-depth insight into thedistribution of our sector allocations, there is still a needfor summary risk measures that gauge a portfolio’ssensitivity to the important sector related performancevariables.
Volatility Duration – Fixed income securities that containembedded options, including all mortgages and mostcorporates, are exposed to interest rate volatility risk. Thatis, a rise or fall in interest rate volatility will impact theprice of a bond with embedded options. Volatility durationis computed by shocking the implied volatility in thecommon underlying term structure model embedded in allour analytics by 1%, thus arriving at a risk measure that iscomparable across sectors. We cumulate the results fromanalyzing individual securities in a portfolio to arrive at aportfolio level sensitivity measure that predicts the priceimpact resulting from changes in volatility. For example,
all else being equal, a portfolio with a volatility durationof 0.1 would be expected to decline 10 basis points forevery 1% (or 100 basis point) rise in interest rate volatility.
Mortgage Spread Duration – Option adjusted spread(OAS) is the net spread over the Treasury curve thatoptionable securities offer, in addition to compensatingfor the embedded option. For example, a current couponGNMA may have a nominal yield spread of 150 basispoints over similar duration Treasuries, but analysis of theprepayment option embedded in the GNMA values it at 50basis points, so the OAS would be 100 (150-50). Wheninterest rate volatility rises, the value of the option willincrease, pushing spreads wider, but the OAS may stay thesame. The OAS demanded by investors tends to be morestable than the nominal spread, but it does vary withmarket conditions. PIMCO’s mortgage spread durationgauges the price sensitivity of a portfolio to changes in theOAS for mortgages, all other things being equal. If OASacross all mortgage sectors increased by 1 basis point, aportfolio with a mortgage spread duration of 1 would beexpected to lose 1 basis point, all other things being equal.
Prepayment Duration – When analyzing mortgagesecurities, calculation of the volatility duration and spreadduration involve forecasting future prepayment patternsfor each type of mortgage security. Prepaymentforecasting has evolved into a very complex science,and we have developed our own proprietary prepaymentmodels that capture short term fluctuations and long termtrends of prepayments based on our macroeconomicforecasts. To know the impact on our portfolios of anunforeseen change in prepayments, we shock theparameters of our models to gauge the effect of fasteror slower prepayments.
Corporate Spread Duration – PIMCO’s corporate spreadduration, similar to our mortgage spread duration,
Q U A R T E R L Y R E V I E W 5
Risk Measurement at PIMCO
�� �������������� !��� �"��� �#$������%�� ��������� '()*')++sector_desc <0 0<1 1<3 3<5 5<7 7<8 8<11 11+ Total
ABS 0.00 0.00 0.00 0.01 0.00 0.00 0.00 0.00 0.01AGCY 0.00 0.01 0.09 0.17 0.03 0.00 0.18 0.17 0.65CORP-A 0.00 0.00 0.04 0.06 0.22 0.01 0.14 0.11 0.59CORP-AA 0.00 0.00 0.04 0.02 0.05 0.00 0.04 0.02 0.18CORP-AAA 0.00 0.00 0.00 0.00 0.02 0.02 0.02 0.00 0.06CORP-B 0.00 0.00 0.00 0.00 0.00 0.00 0.03 0.00 0.03CORP-BB 0.00 0.00 0.00 0.00 0.00 0.00 0.00 0.00 0.00CORP-BBB 0.00 0.00 0.05 0.01 0.07 0.04 0.14 0.11 0.41EmMkt-A 0.00 0.00 0.00 0.00 0.00 0.00 0.00 0.00 0.00FHLMC-PT 0.00 0.00 0.12 0.23 0.00 0.00 0.00 0.00 0.35FNMA-PT 0.00 0.00 0.13 0.30 0.00 0.00 0.00 0.00 0.44GNMA-PT 0.00 0.01 0.11 0.11 0.00 0.00 0.00 0.00 0.23NONAGY-CMO 0.00 0.00 0.00 0.01 0.05 0.00 0.00 0.00 0.06TSY 0.00 0.00 0.12 0.28 0.25 0.05 0.37 0.46 1.54
0.00 0.03 0.70 1.21 0.70 0.11 0.92 0.88 4.54
measures a portfolio’s overall price sensitivity to changes incorporate OAS. Corporate and mortgage spread durationsneed to be calculated separately because different factorsimpact spreads in those sectors, and therefore, they canbehave differently from one and other. Similarly, spreadsof differently rated bonds do not move in perfect synch, soour corporate spread duration model adjusts for this byrefreshing the rating “betas” embedded in our model on aquarterly basis to reflect current market conditions.
Other Sector Spread Durations – As our participation inthe universe of fixed income securities grows, we havestuck to our desire to develop rigorous models for eachmarket we invest in. To achieve this, we have developednew models for valuation and risk management ofemerging markets, inflation protected securities (TIPS),municipal bonds and convertible bonds. To capture therisks due to the specific factors that affect the relative valueof these bonds, we have added EM, TIPS, muni andconvertible spread durations to our risk management arsenal.
� ��������Measuring credit risk is more art than science, but PIMCOis equally rigorous in this area. We rely on in-houseresearch, rather than the rating agencies, for assessingcredit risk. Our staff of seasoned credit analysts rate everycredit held in our portfolios. Our analysts specialize byindustry, and in many cases, have covered particularindustries and issuers for a decade or more.
For non-corporate issues that have an element of creditrisk, we marshal the resources of other departments within
PIMCO. For example, commercial mortgage backedsecurity (CMBS) analysis involves both the credit team andthe mortgage team, who undertake the structural cashflowanalysis. In assessing sovereign credit risk, ourinternational group plays a leading role.
Credit risk at the portfolio level is tracked in two ways:
Duration Weighted Average Credit Quality – Investorsoften look to an average credit quality statistic, calculatedusing market value weights, to give them a snapshot oftheir portfolio’s quality profile. However, a market valueweighted approach fails to recognize that the credit riskimparted by short duration securities is less than foridentical quality long duration ones. This is because onecan predict an issuer’s financial performance over shorterhorizons with greater confidence. Moreover, if an issuer’scredit quality does deteriorate and its yield spread widens,the detrimental price impact on shorter bonds is moremuted than on longer bonds. By calculating averagequality on a duration weighted basis, PIMCO is able to geta much truer picture of a portfolio's overall exposure tocredit risk.
Quality Matrices – An average quality statistic, whetherduration weighted or not, does not impart any informationabout quality distribution within a portfolio. For example,a portfolio comprised 50% of BB rated bonds and 50%AAA rated bonds would have the same average qualityrating, single A, as a portfolio comprised of only A ratedbonds. To get a clearer picture of quality distribution, wehave created matrices that show quality distribution acrosssector, industry and yield curve buckets.
6�����Q U A R T E R L Y R E V I E W
Risk Measurement at PIMCO
Total PIMCO Exposure Report – Credit exposure at thefirm level is also monitored closely because of liquidityconsiderations. While we adhere to prudent diversificationstandards within each portfolio, a high level of exposureto a particular issuer across all PIMCO portfolios couldpresent trouble in the event of illiquid market conditions.
Counterparty Risk Report – Given our frequent useof swaps and forward settled trades to generate excessreturns and minimize risk, it becomes important thatwe manage our exposures to specific counterparties.A counterparty risk management system that providesdetailed exposures to counterparties, broken down by thedifferent types of outstanding trades, is used for activelymonitoring counterparty exposure.
,��-����������� ��The portfolio risk measures described above are availablefor both U.S. and non-U.S. portfolios. In the case of mostnon-U.S. securities, the models embedded in our riskmeasures, such as term structure and prepayment models,have had to be adapted to the nuances of specific countries.
Global Exposures Matrices – The risk of a non-U.S.bondcan be separated into two related components – thecountry or region risk (exposure to changes in foreigninterest rates) and the currency risk. As with yield curve,sector, and credit risk, it is difficult to quantify these riskswith just one measure. Therefore, PIMCO’s customizableglobal exposures matrix aggregates all holdings by countryand currency, sector and yield curve, etc. We also enableportfolio managers to create groupings of regions andcountries to identify correlated concentrations of risk.
��.����������The degree of liquidity in a portfolio is managed carefullyby PIMCO Portfolio Managers, subject to client investmentguidelines and liquidity needs. Most PIMCO clients arelong-term investors, so they typically do not havesignificant liquidity needs. Therefore, the purchase ofrelatively less liquid securities may be warranted due tothe higher yield (often called liquidity premium) that lessliquid issues offer. PIMCO monitors near term liquidityneeds and manages cash optimally using a proprietarymodel that incorporates exposure to unsettled trades, aswell as futures and swaps. The risk of having exposure tosectors that have the potential to lose significant value due
to deteriorating liquidity is controlled largely by adheringto relatively conservative diversification and maximumexposure guidelines.
/ ������� � Expected tracking error ventures to predict how well aportfolio will track its benchmark. It is the annualizedexpected standard deviation of the monthly returndifference between the portfolio and the benchmark.For example, if the expected tracking error is 1.2, then theyearly portfolio return is expected to be within 120 basispoints of the expected return two thirds of the time, andwithin 240 basis points 19 out of 20 times. As mentionedearlier, PIMCO does not advocate the use of a single riskmetric as an alternative to our more robust approach ofseparately tracking multiple metrics that measure themany sources of risk in a bond portfolio. However, we douse an expected tracking error model to supplement ourinsight into portfolio allocations versus benchmark, bothdomestically and globally. Our tracking error modelovercomes the obvious shortcomings of most VAR ortracking error models in two ways. First, it can be run withboth historical and forecast variance-covariance matrices.Second and most important, it is run against thecomprehensive menu of proprietary portfolio risk metricsdescribed above (duration, curve durations, spread durations,etc.) instead of against individual portfolio holdings. Becauseour risk metrics are aggregated at the portfolio level, they aremuch smoother over time, making the validity of results fromour tracking error model more robust.
����������Measurement and management of overall portfolio riskis a major effort at PIMCO. It involves all portfoliomanagers, who interact with our Financial EngineeringGroup to ensure that the models they develop are notonly theoretically sound, but also reflect market realities.It involves a “technology workbench” of seasonedprogrammers who help to upgrade existing modelsand implement new ones. And it involves many othertechnologists who work to integrate our risk measurementtools with our other PIMCO systems, includingaccounting, compliance and client reporting. The scopeand cost of this effort is huge, but it has helped enablePIMCO to avoid inadvertently introducing unwantedrisks into our clients’ portfolios.
Recent Developments
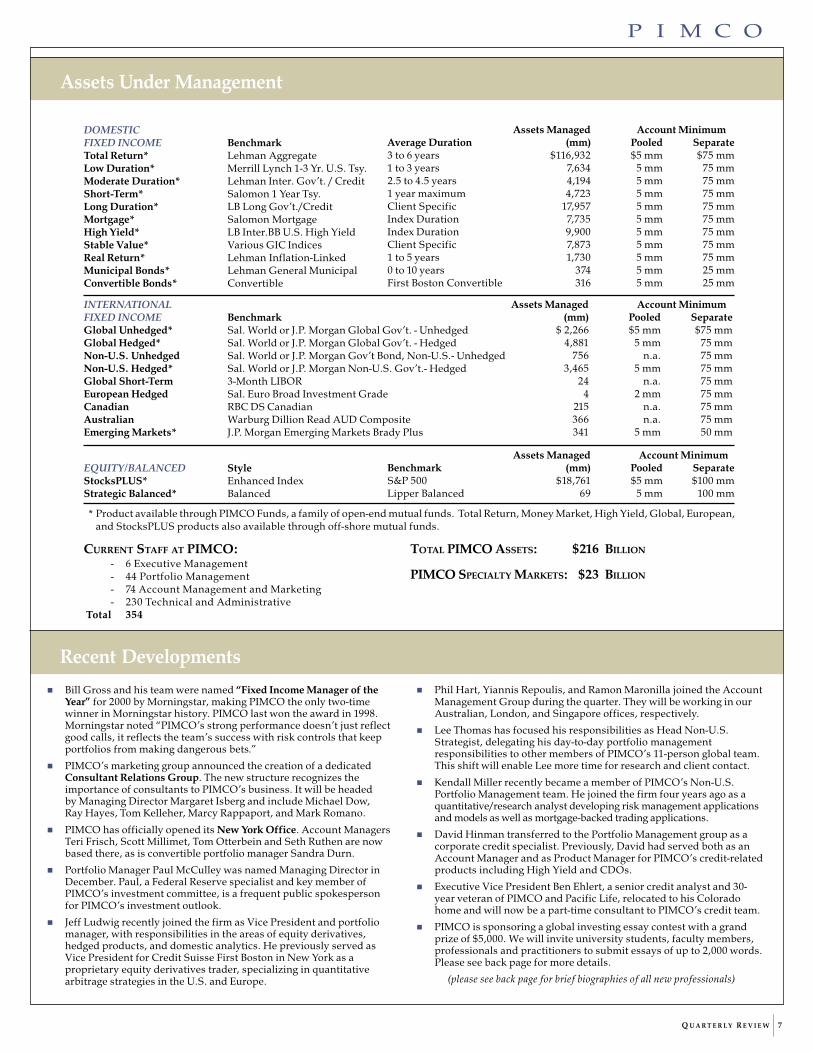
Assets Managed Account MinimumAverage Duration (mm) Pooled Separate3 to 6 years $116,932 $5 mm $75 mm1 to 3 years 7,634 5 mm 75 mm2.5 to 4.5 years 4,194 5 mm 75 mm1 year maximum 4,723 5 mm 75 mmClient Specific 17,957 5 mm 75 mmIndex Duration 7,735 5 mm 75 mmIndex Duration 9,900 5 mm 75 mmClient Specific 7,873 5 mm 75 mm1 to 5 years 1,730 5 mm 75 mm0 to 10 years 374 5 mm 25 mmFirst Boston Convertible 316 5 mm 25 mm
INTERNATIONALFIXED INCOME BenchmarkGlobal Unhedged* Sal. World or J.P. Morgan Global Gov’t. - UnhedgedGlobal Hedged* Sal. World or J.P. Morgan Global Gov’t. - HedgedNon-U.S. Unhedged Sal. World or J.P. Morgan Gov’t Bond, Non-U.S.- UnhedgedNon-U.S. Hedged* Sal. World or J.P. Morgan Non-U.S. Gov’t.- HedgedGlobal Short-Term 3-Month LIBOREuropean Hedged Sal. Euro Broad Investment GradeCanadian RBC DS CanadianAustralian Warburg Dillion Read AUD CompositeEmerging Markets* J.P. Morgan Emerging Markets Brady Plus
Assets Managed Account Minimum(mm) Pooled Separate
$ 2,266 $5 mm $75 mm4,881 5 mm 75 mm
756 n.a. 75 mm3,465 5 mm 75 mm
24 n.a. 75 mm4 2 mm 75 mm
215 n.a. 75 mm366 n.a. 75 mm341 5 mm 50 mm
EQUITY/BALANCED StyleStocksPLUS* Enhanced IndexStrategic Balanced* Balanced
Assets Managed Account MinimumBenchmark (mm) Pooled SeparateS&P 500 $18,761 $5 mm $100 mmLipper Balanced 69 5 mm 100 mm
* Product available through PIMCO Funds, a family of open-end mutual funds. Total Return, Money Market, High Yield, Global, European,and StocksPLUS products also available through off-shore mutual funds.
DOMESTICFIXED INCOME BenchmarkTotal Return* Lehman AggregateLow Duration* Merrill Lynch 1-3 Yr. U.S. Tsy.Moderate Duration* Lehman Inter. Gov’t. / CreditShort-Term* Salomon 1 Year Tsy.Long Duration* LB Long Gov’t./CreditMortgage* Salomon MortgageHigh Yield* LB Inter.BB U.S. High YieldStable Value* Various GIC IndicesReal Return* Lehman Inflation-LinkedMunicipal Bonds* Lehman General MunicipalConvertible Bonds* Convertible
� Bill Gross and his team were named “Fixed Income Manager of theYear” for 2000 by Morningstar, making PIMCO the only two-timewinner in Morningstar history. PIMCO last won the award in 1998.Morningstar noted “PIMCO’s strong performance doesn’t just reflectgood calls, it reflects the team’s success with risk controls that keepportfolios from making dangerous bets.”
� PIMCO’s marketing group announced the creation of a dedicatedConsultant Relations Group. The new structure recognizes theimportance of consultants to PIMCO’s business. It will be headedby Managing Director Margaret Isberg and include Michael Dow,Ray Hayes, Tom Kelleher, Marcy Rappaport, and Mark Romano.
� PIMCO has officially opened its New York Office. Account ManagersTeri Frisch, Scott Millimet, Tom Otterbein and Seth Ruthen are nowbased there, as is convertible portfolio manager Sandra Durn.
� Portfolio Manager Paul McCulley was named Managing Director inDecember. Paul, a Federal Reserve specialist and key member ofPIMCO’s investment committee, is a frequent public spokespersonfor PIMCO’s investment outlook.
� Jeff Ludwig recently joined the firm as Vice President and portfoliomanager, with responsibilities in the areas of equity derivatives,hedged products, and domestic analytics. He previously served asVice President for Credit Suisse First Boston in New York as aproprietary equity derivatives trader, specializing in quantitativearbitrage strategies in the U.S. and Europe.
Q U A R T E R L Y R E V I E W 7
Assets Under Management
CURRENT STAFF AT PIMCO:- 6 Executive Management- 44 Portfolio Management- 74 Account Management and Marketing- 230 Technical and Administrative
Total 354
TOTAL PIMCO ASSETS: $216 BILLION
PIMCO SPECIALTY MARKETS: $23 BILLION
� Phil Hart, Yiannis Repoulis, and Ramon Maronilla joined the AccountManagement Group during the quarter. They will be working in ourAustralian, London, and Singapore offices, respectively.
� Lee Thomas has focused his responsibilities as Head Non-U.S.Strategist, delegating his day-to-day portfolio managementresponsibilities to other members of PIMCO’s 11-person global team.This shift will enable Lee more time for research and client contact.
� Kendall Miller recently became a member of PIMCO’s Non-U.S.Portfolio Management team. He joined the firm four years ago as aquantitative/research analyst developing risk management applicationsand models as well as mortgage-backed trading applications.
� David Hinman transferred to the Portfolio Management group as acorporate credit specialist. Previously, David had served both as anAccount Manager and as Product Manager for PIMCO’s credit-relatedproducts including High Yield and CDOs.
� Executive Vice President Ben Ehlert, a senior credit analyst and 30-year veteran of PIMCO and Pacific Life, relocated to his Coloradohome and will now be a part-time consultant to PIMCO’s credit team.
� PIMCO is sponsoring a global investing essay contest with a grandprize of $5,000. We will invite university students, faculty members,professionals and practitioners to submit essays of up to 2,000 words.Please see back page for more details.
(please see back page for brief biographies of all new professionals)

,��-����������, �0��/���0�� !��1�����233Global growth will decelerate sharply as a U.S. slow-down spills over into other developed and emergingeconomies. The landing will be hardest in the U.S.,where previously exuberant investment and consumerspending will slow substantially. Tentative recovery inJapan will evaporate in the face of reduced demand forJapanese exports from the rest of Asia and the U.S.Europe will land more softly, cushioned by more limitedexport ties to the U.S. and the absence of investmentand consumption bubbles.
� The investment spending boom that fueled therapidly growing New Economy has been self-justifying until recently. Investment in productivity-enhancing information technology boostedprofitability and returns, begetting higher assetvalues and lower capital costs, prompting stillmore investment.
� This virtuous circle is now reversing itself. Reducedearnings growth and concern about high levels ofcorporate debt produced a dramatic repricing ofrisk in stock, corporate bond and bank loan marketsin 2000. Heightened risk aversion among suppliersof capital, combined with lower profits and returnsas the economy cools, point to a sharp slowdown ininvestment spending.
� The U.S. consumption binge will slow along withinvestment as confidence erodes further. Softerequity markets mean that consumers can no longercount on capital gains to supplement disposableincome. Slowing corporate profits translate intomore insecurity about future income and employment.
� Stability in the housing sector will partially offsetweaker investment and consumer spending.Lower mortgage rates will stimulate housing starts,boosting sectors of the economy related to housing,such as consumer durables.
8 ���Q U A R T E R L Y R E V I E W
U.S. Strategy
� We expect protracted Fed easing as the economyslows, while Federal budget surpluses also provideroom for fiscal stimulus. These effects will, however,arrive with a lag over the next 12 to 18 months.
� A cyclical drag created by microeconomic restruc-turing makes Japan especially vulnerable tospillover from the U.S. Still, reforms such asallowing more bankruptcies will provide macro-economic benefits for Japan in the long run.
� A terms of trade shock from last year's surgein oil prices will help curtail growth in Euroland.Exacerbated by a weak euro, this shock is producinga decline in real wages that will depress aggregatedemand.
� Inflation in the U.S. and Euroland will decline overthe next several quarters as oil prices move lower.Slower worldwide growth and the end of cold winterweather will reduce price pressure in the oil market.
��������� ���������&������������������� ������Emphasis on high quality assets will continue to berewarded as the economy slows and credit qualitycomes under increasing pressure. Top-tier agency andcorporate issues with short maturities are reasonablealternatives in this environment. While longer datedcorporates and emerging market bonds offer higheryield premiums, they are also more vulnerable to adverseprice performance as global growth slows. Mortgages areanother high quality alternative, but mortgage investorswill face greater refinancing risk as decelerating growthputs a ceiling on interest rates. Increasing the portfolio'soverall interest rate sensitivity, or duration is one way tooffset heightened refinancing risk.

,��-����������, �0���������� ����� !��The pace of global growth will decelerate sharply, ledby the U.S. economy. Global inflation will also declineas slower worldwide growth reduces price pressure,particularly in commodities. The U.S. slowdown willbe hardest, as investment and consumer spending slowsubstantially. The European landing will be softer,cushioned by 2001 tax cuts. Prospects for economicrecovery in Japan will be hampered by low consumerconfidence, banking system weakness and an expectedreduction in investment spending.
�� �!�We continue to see a good environment for bonds incore Europe. Headline inflation has peaked and coreinflation will remain stable, below two percent. Highgrade European bonds should outperform, given weakequity markets and continued deterioration in creditquality. In Europe we will:
� Overweight core Europe, as slowing global growthwill cause bond prices to rally.
� Hold shorter maturity bonds in core Europe as theslowdown in global growth will allow the EuropeanCentral Bank to begin lowering short-term rates.
� Underweight the U.K. We believe market expecta-tions for U.K. yields trading below German yieldsare incorrect, given prospects for tighter labormarkets and rising inflation in the U.K.
� Take positions that will benefit from widening ofcorporate yield premiums due to increased corporateissuance and reduced government bond supply.
� Overweight the euro versus the U.S. dollar. Rela-tively slower U.S. growth, worries over the U.S.current account deficit and further Europeanstructural reforms will bolster the euro.
4�!��Weak bank balance sheets, ongoing corporate restruc-turing and the global economic slowdown will limitJapanese growth. The deteriorating fiscal situation willweigh heavily on this market as government bondissuance continues to increase. Credit fundamentalswill deteriorate as Japan remains the most heavily
Q U A R T E R L Y R E V I E W 9
Global Strategy
indebted developed nation, with debt as a percentage ofGDP over 120 percent. For this reason, we will continueto underweight Japan.
����� 5����In the U.S., we expect bonds to continue to rally as theFed cuts rates amid a slowing economy. Heightened riskaversion among suppliers of capital, combined withlower profits and returns as the economy cools, pointto a sharp slowdown in investment spending. Consump-tion will slow as confidence falls further. Softer equitymarkets mean that consumers can no longer count oncapital gains to supplement disposable income. Re-duced corporate profits will result in more insecurityabout future income and employment.
Elsewhere in the dollar-bloc, we expect the Canadianeconomy to follow the U.S., but with a lag. Domesticdemand will be supported by new spending initiativesof the recently re-elected Liberal Party. Canada's lowbond yields relative to the U.S. continue to make thismarket unattractive. Australian growth will slow amideroding business and consumer confidence, but growthin exports fueled by a weak currency will cushion thisimpact. New Zealand's economic recovery will con-tinue, but weaker global growth will cause the ReserveBank to begin reducing rates from 6.5 percent duringthe first quarter. In the dollar-bloc, we will:
� Underweight Canada due to unattractive yieldsand risks that new spending measures will turnthe fiscal surplus into a deficit.
� Focus on U.S. mortgages, where credit risk isminimal and attractive yield premiums providea cushion against adverse price performance.
� Hold select top-quality corporate issues, focusingon short maturities, given our concern abouteroding credit quality amid slower growth.
� Emphasize real return bonds as weaker growth willput continued downward pressure on real yields.
��� ������ ����Where permitted, we will maintain a small emergingmarket position, favoring higher-quality credits such asMexico, Hungary, Poland and South Korea. Our focuswill continue to be on highly liquid, shorter-maturityinstruments.

����������
840 Newport Center Drive
Post Office Box 6430
Newport Beach
California 92658-6430
Tel: 949-720-6000
www.pimco.com
New Professionals
%����������������
Phillip P. HartMr. Hart is a Vice President and account manager. He recently joinedthe firm to manage existing client relationships in Australia and NewZealand. Previously, he represented Global Cash Management forState Street Bank & Trust in Asia where he was responsible for fundmanager and pension fund clients in interest rate products andbanking e-commerce systems. Prior to that, he held a sales andstructuring role at one of Australia's leading banks Westpac,specializing in fixed income and foreign exchange products forinstitutional clients. He has eleven years of investment experience.He served thirteen years in the Royal Australian Navy and holds aBachelor of Science degree from the University of New South Walesand an MBA from the University of Adelaide.
Ramon F. MaronillaMr. Maronilla is an account manager for the PIMCO Asia Pte. Ltdoffice in Singapore. He is responsible for servicing PIMCO's clientrelationships in the Asia ex-Japan region. Mr. Maronilla joined thefirm in 2000, having been previously associated with GoldsteinCapital Corp, a hedge fund in New York City, and Citibank in Manila.He has over three years of investment experience, and holds abachelor's degree in Economics from the University of thePhilippines and an MBA in Finance from Columbia UniversityGraduate School of Business.
Yiannis D. RepoulisMr. Repoulis is an account manager. He joined the firm in 1998, andfocuses on building PIMCO's client servicing efforts in Europe. Priorto joining PIMCO Europe Ltd’s Lon-don office, Mr. Repoulis wasassociated with EFG Private Bank. He holds a bachelor's degree ineconomics and a master's degree in international political economyfrom the London School of Economics, and an MBA from the J.L.Kellogg Graduate Schoolof Management.
6� �&��������������
Jeffrey LudwigMr. Ludwig is a Vice President and portfolio manager, withresponsibilities in the areas of equity derivatives, hedged products,and domestic analytics. Mr. Ludwig recently joined the firm, havingpreviously served as Vice President for Credit Suisse First Boston inNew York as a proprietary equity derivatives trader, specializing inquantitative arbitrage strategies in the U.S. and Europe. He has fouryears of investment experience, and holds a bachelor's degree inAeronautics and Astronautics and a master's degree and Ph.D. inelectrical engineering and computer science, all from theMassachusetts Institute of Technology.
This information is intended solely to report on investment strategies and opportunities identified by PIMCO. Opinions and estimates offered constitute our judgment andare subject to change without notice, as are statements of financial market trends, which are based on current market conditions. We believe the information provided here isreliable, but do not warrant its accuracy or completeness. This material is not intended as an offer or solicitation for the purchase or sale of any financial instrument. Pleasenote that investments in non-U.S. securities and markets pose different and possibly greater risk than those customarily associated with domestic securities, includingcurrency fluctuations, non-U.S. taxes and political and economic instability. The views and strategies described may not be suitable for all investors. This material has beenprepared for informational purposes only, and is not intended to provide, and should not be relied on for, accounting, legal or tax advice. You should consult your tax or legaladvisor regarding such matters. Please contact your account manager for further information.
Copyright 2001, PIMCO.
,��-�����������������������
�������������������������������������������������������
������������������ !"""#�$���������������������������������������������������������������������������������������
��������������������%������������������#�&��������������
�������������������!��������������!��������������������������������������������������������'!"""���������������
������������������������������!�����(������������
�������������������������)����������#�*���������������������!����������������������������������+��������������!
����������������������������������������)�������������+
�����������,!"""�������#�*��-���������������������������������������������#�$�����������.�������������������/�����
-�������!�0������-�����������������*�������1��������������
��������������������������������$�������2�����������3#�*��������!�������������������3#�*�����������#�4������������������������
�������������������5����,!�'"",#������������������������
���#����#��)����������������������������#
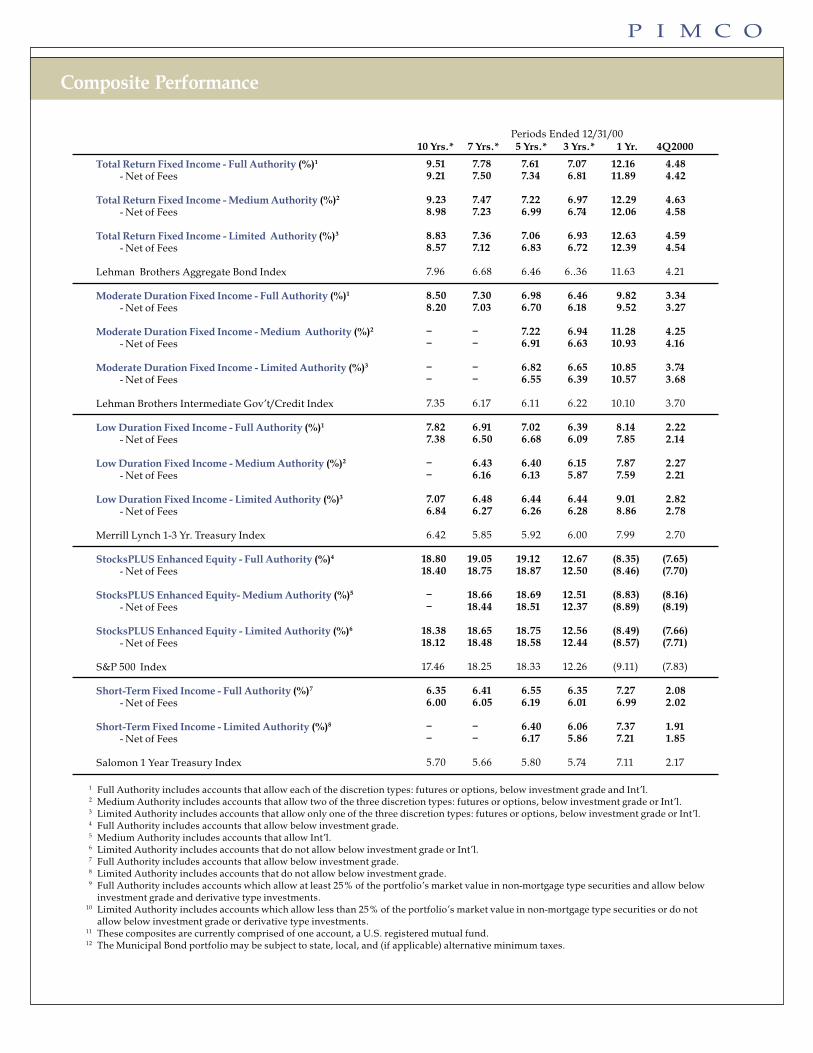
Total Return Fixed Income - Full Authority (%)1
- Net of Fees
Total Return Fixed Income - Medium Authority (%)2
- Net of Fees
Total Return Fixed Income - Limited Authority (%)3
- Net of Fees
Lehman Brothers Aggregate Bond Index
Moderate Duration Fixed Income - Full Authority (%)1
- Net of Fees
Moderate Duration Fixed Income - Medium Authority (%)2
- Net of Fees
Moderate Duration Fixed Income - Limited Authority (%)3
- Net of Fees
Lehman Brothers Intermediate Gov’t/Credit Index
Low Duration Fixed Income - Full Authority (%)1
- Net of Fees
Low Duration Fixed Income - Medium Authority (%)2
- Net of Fees
Low Duration Fixed Income - Limited Authority (%)3
- Net of Fees
Merrill Lynch 1-3 Yr. Treasury Index
StocksPLUS Enhanced Equity - Full Authority (%)4
- Net of Fees
StocksPLUS Enhanced Equity- Medium Authority (%)5
- Net of Fees
StocksPLUS Enhanced Equity - Limited Authority (%)6
- Net of Fees
S&P 500 Index
Short-Term Fixed Income - Full Authority (%)7
- Net of Fees
Short-Term Fixed Income - Limited Authority (%)8
- Net of Fees
Salomon 1 Year Treasury Index
Periods Ended 12/31/0010 Yrs.* 7 Yrs.* 5 Yrs.* 3 Yrs.* 1 Yr. 4Q2000
9.51 7.78 7.61 7.07 12.16 4.489.21 7.50 7.34 6.81 11.89 4.42
9.23 7.47 7.22 6.97 12.29 4.638.98 7.23 6.99 6.74 12.06 4.58
8.83 7.36 7.06 6.93 12.63 4.598.57 7.12 6.83 6.72 12.39 4.54
7.96 6.68 6.46 6..36 11.63 4.21
8.50 7.30 6.98 6.46 9.82 3.348.20 7.03 6.70 6.18 9.52 3.27
– – 7.22 6.94 11.28 4.25– – 6.91 6.63 10.93 4.16
– – 6.82 6.65 10.85 3.74– – 6.55 6.39 10.57 3.68
7.35 6.17 6.11 6.22 10.10 3.70
7.82 6.91 7.02 6.39 8.14 2.227.38 6.50 6.68 6.09 7.85 2.14
– 6.43 6.40 6.15 7.87 2.27– 6.16 6.13 5.87 7.59 2.21
7.07 6.48 6.44 6.44 9.01 2.826.84 6.27 6.26 6.28 8.86 2.78
6.42 5.85 5.92 6.00 7.99 2.70
18.80 19.05 19.12 12.67 (8.35) (7.65)18.40 18.75 18.87 12.50 (8.46) (7.70)
– 18.66 18.69 12.51 (8.83) (8.16)– 18.44 18.51 12.37 (8.89) (8.19)
18.38 18.65 18.75 12.56 (8.49) (7.66)18.12 18.48 18.58 12.44 (8.57) (7.71)
17.46 18.25 18.33 12.26 (9.11) (7.83)
6.35 6.41 6.55 6.35 7.27 2.086.00 6.05 6.19 6.01 6.99 2.02
– – 6.40 6.06 7.37 1.91– – 6.17 5.86 7.21 1.85
5.70 5.66 5.80 5.74 7.11 2.17
1 Full Authority includes accounts that allow each of the discretion types: futures or options, below investment grade and Int’l.2 Medium Authority includes accounts that allow two of the three discretion types: futures or options, below investment grade or Int’l.3 Limited Authority includes accounts that allow only one of the three discretion types: futures or options, below investment grade or Int’l.4 Full Authority includes accounts that allow below investment grade.5 Medium Authority includes accounts that allow Int’l.6 Limited Authority includes accounts that do not allow below investment grade or Int’l.7 Full Authority includes accounts that allow below investment grade.8 Limited Authority includes accounts that do not allow below investment grade.9 Full Authority includes accounts which allow at least 25% of the portfolio’s market value in non-mortgage type securities and allow below
investment grade and derivative type investments.10 Limited Authority includes accounts which allow less than 25% of the portfolio’s market value in non-mortgage type securities or do not
allow below investment grade or derivative type investments.11 These composites are currently comprised of one account, a U.S. registered mutual fund.12 The Municipal Bond portfolio may be subject to state, local, and (if applicable) alternative minimum taxes.
Composite Performance

– – – 7.07 11.20 3.98– – – 6.72 10.85 3.90
8.20 7.15 7.25 7.06 11.95 3.928.08 7.04 7.13 6.95 11.85 3.89
7.88 7.01 6.90 6.63 11.29 3.87
– – 9.42 7.59 11.15 4.21– – 9.07 7.24 10.79 4.12
8.66 7.84 8.44 7.59 10.96 4.17
8.58 6.52 4.58 4.35 2.32 3.728.25 6.21 4.31 4.09 2.09 3.66
6.99 5.13 3.10 3.89 1.60 4.30
– 9.27 10.38 7.58 10.31 3.80– 8.73 9.85 7.07 9.83 3.69
8.98 8.47 9.49 8.02 9.71 3.73
– 5.27 2.08 2.15 (2.46) 3.96– 5.05 1.87 1.96 (2.70) 3.89
6.78 4.65 1.64 2.87 (2.64) 4.00
– 8.47 7.14 3.46 0.05 (1.47)– 7.93 6.64 3.01 (0.37) (1.57)
10.14 7.30 6.41 3.88 3.73 (0.06)
– 9.07 8.33 8.44 20.98 8.10– 8.53 7.79 7.90 20.38 7.97
9.91 8.02 7.28 7.61 20.28 7.23
– – – 10.18 (1.09) (1.65)– – – 9.47 (1.73) (1.81)
13.79 13.75 13.78 10.29 (0.99) (3.07)
– – – 8.61 14.05 3.66– – – 8.07 13.48 3.53
– – – 6.39 13.18 3.79
– – – – (0.12) (10.23)– – – – (0.77) (10.38)
14.72 11.87 13.21 11.80 (7.83) (12.31)
– – – 4.56 10.84 3.16– – – 4.04 10.29 3.03
– 5.76 5.84 5.21 11.69 4.37
– – – 9.50 15.58 2.59– – – 8.58 14.61 2.37
– 10.56 14.47 7.67 15.66 1.72
Mortgage Fixed Income - Full Authority (%)9
- Net of Fees
Mortgage Fixed Income - Limited Authority (%)10
- Net of Fees
Salomon Mortgage Index
Global Hedged Fixed Income (%)- Net of Fees
J.P. Morgan Global - Hedged Index
Global Unhedged Fixed Income (%)- Net of Fees
Salomon World Gov’t. Bond Unhedged Index
Non-U.S. Hedged Fixed Income (%)- Net of Fees
J.P. Morgan Gov’t. Bond Non-U.S., Hedged Index
Non-U.S. Unhedged Fixed Income (%)- Net of Fees
Salomon World Gov’t., Non-U.S. Unhedged Index
High Yield Fixed Income (%)- Net of Fees
Lehman Brothers Interm. BB U.S. High Yield Index
Long-Term U.S. Government (%)11
- Net of Fees & Expenses
Lehman Long Term Treasury Index
Strategic Balanced (%)11
- Net of Fees & Expenses
60% S&P500 / 40% LBAG Index
Real Return Full Authority (%)1
- Net of Fees & Expenses
Lehman Inflation Linked Index
Convertible Fund (%)11
- Net of Fees & Expenses
First Boston Convertible Index
Municipal Bond Fund (%)11
- Net of Fees & Expenses 12
Lehman General Municipal Index
Emerging Markets Fund (%)- Net of Fees
J.P. Morgan Emerging Markets + Index
Periods Ended 12/31/0010 Yrs.* 7 Yrs.* 5 Yrs.* 3 Yrs.* 1 Yr. 4Q 2000
* Annualized. Past performance is no guarantee of future results. All performance figures reflect commissions, other expenses (except custody),and reinvestment of earnings. The “net of fees” performance figures above also reflect the deduction of actual investment advisory fees.
Composite Performance