risk intelligence in the energy & resources industry ...€¦ · risk intelligence in the...
TRANSCRIPT
Deloitte Enterprise Risk Services
Risk Intelligence in the Energy & Resources IndustryEnterprise Risk Management Benchmark Survey
To start a new section, hold down the apple+shift keys and click
to release this object and type the section title in the box below.
Contents
Foreword 1
Executive summary 2
About this survey 5
Detailed survey findings 9
Current state of ERM 9
Implementing ERM and organizational approaches 15
• Governance 15
• Process 29
• People 35
• Technology 37
• Conclusion 41
Top energy and resources risks 43
General conclusion 46
Contact us 50
To start a new section, hold down the apple+shift keys and click
to release this object and type the section title in the box below.
Foreword
In a changing world where energy and resource scarcity and climate change have become key themes, energy and resources companies face a myriad of emerging risks. Political instability, safety hazards, infrastructure degradation, operational outages, adverse weather events, greenhouse gas emissions, and risks related to disruptive technologies such as distributed electricity generation or shale gas production are just a few of the perils they face.
The financial and economic crisis that started in 2008, had and still has, an impact on the energy and resources industry. Many companies in the industry experienced turbulent times, with a range of challenges remaining for the near future.
While some traditional risk management approaches may have served the industry well in the past, the scope, complexity, and interdependencies of emerging risks are forcing many energy and resources companies to adopt a more comprehensive and integrated approach.
Deloitte recently launched a second edition of the Energy & Resources Enterprise Risk Management Benchmark Survey. The previous edition (2009) was centered on the EMEA region (Europe, Middle East and Africa). This second survey (2014) is globally focused.
The main objective is to assess the overall maturity level of energy and resources companies’ ERM and risk management activities, and to help identify new challenges, critical issues and risks they may be facing today and in the future. Additional focus is placed on the different industry sectors, as well as recent developments in risk management. The results of this survey will allow energy and resources companies to benchmark and assess their current ERM activities against industry best practices, and learn new emerging trends for risk management in the industry.
There were more than 100 responses worldwide, spread over all geographical regions as well as spanning the different sectors of the energy and resources industry.
Boards of directors have become increasingly aware of their responsibilities related to effective oversight of management’s execution of enterprise‑wide risk management processes. This is due, in part, to significant external pressures that have developed recently which are thrusting risk management and its oversight to the forefront of many board agendas and management action plans. Many organizations are embracing an enterprise‑wide approach to risk oversight known as Enterprise Risk Management (ERM) and executive management teams leading these efforts are turning to frameworks to aid them in strengthening their enterprise‑wide risk management processes.
Risk Intelligence in the Energy & Resources IndustryEnterprise Risk Management Benchmark Survey 1
To start a new section, hold down the apple+shift keys and click
to release this object and type the section title in the box below.
Executive summary
Substantial effort has been directed towards developing enhanced approaches to risk management in the energy and resources industry, particularly in the past decade. ERM has therefore become common practice within the industry, as evidenced by more than half of the survey respondents reporting that they have a fully operational ERM program. For ERM programs in development, most of the respondents indicated that the program has been under development for more than one year.
Several key themes concerning ERM emerged in the survey results, and also when making a comparison to the benchmark survey performed in 2009:
ERM programs are achieving enterprise‑wide coverage, and risk‑informed decision‑making is growingThe scope of ERM has expanded in recent years, progressing towards a real enterprise‑wide management practice. While traditionally focussed on financial matters, risk information is increasingly being incorporated into strategic decision‑making processes, including business development, marketing, commodity trading, regulatory compliance, worker and contractor safety, and operational reliability.
The connection between ERM and management decision‑making is still in developmentThe integration of ERM with other key management systems, such as asset integrity management, safety management and quality management, is still in development in most organizations.
Nevertheless, some leading energy companies are making the critical link between risk and decision‑making, through the emerging discipline of Value‑Based Asset Management (VBAM). This approach links risk management and operational reliability practices to create an integrated framework that helps prioritize and optimize operational and capital spending for asset intensive organizations.
Rewarded risks are slowly getting more attention. However, recent crises across the industry have once again put asset protection high on the agendaThe respondents in this survey, for the most part, indicated that their organizations are using the information gleaned from their ERM programs to deal with unrewarded risks. These typically include risks to the integrity of financial reporting, compliance with regulations and protection of assets. This is the traditional domain of risk management.
However, recent catastrophic events within the energy and resources industry such as nuclear and mining disasters and oil spills, have put asset protection high on the agenda again.
These events have demonstrated not only the immediate and drastic impact one event can have on a company’s operations, as well as on the regulatory environment, but also the need for energy companies to implement a robust ERM system that includes the identification and mitigation of the (unknown) low probability/high impact risks.
Nevertheless, leading organizations have designed their risk management programs to not only address unrewarded risks, but also to consider rewarded risks. Rewarded risks are related to value creation. These typically include increasing operational reliability, improving asset performance, introducing new products, merging with or acquiring new businesses, and entering new markets. The management of these risks holds the potential for reward if they are intelligently managed, but can have seriously adverse effects if they are not.
2

To start a new section, hold down the apple+shift keys and click
to release this object and type the section title in the box below.
ERM frameworks, methodologies and tools are becoming more mature and advanced risk management practices are developingAlmost half of the organizations reported having an ERM practice that has progressed beyond its early stages. The fundamentals of the ERM program, i.e. a risk management framework, methodology and tools have been established and serve as the basis for the development of more advanced risk management practices. These include:
• consistent use of this central risk management framework across the organization;
• increasing integration of ERM with other management systems (e.g. asset integrity management systems, safety management systems and quality management systems, etc.);
• growing use of Key Risk Indicators (KRIs) and other tools to monitor risks on a continuous basis;
• expanding application of quantitative techniques for evaluation of risk, risk measurement, and risk monitoring; and
• use of advanced risk analytics, such as network‑ and pattern‑recognition techniques, semantic analysis and artificial intelligence to analyze risks and more accurately, to model failure predictions and model interdependencies between risks, understand concentrations of risk exposures, aggregate risks, and perform immediate risk identification and analysis.
ERM processes are implemented but organizations still face challenges with respect to effective monitoring and reportingERM provides a robust and holistic enterprise‑wide view of potential events that may affect the ability to achieve an organization’s objectives. And because risks are constantly evolving as an organization strives to achieve its objectives, there is high demand for relevant and timely risk information.
Organizations reported being mature regarding risk identification, assessment and prioritization, as well as the design and implementation of mitigating actions. Many organizations, however, still struggle with monitoring and reporting risks. A lack of appropriate tooling is one of the reasons. Other reasons include the lack of suitable methodology for aggregating risks, the lack of ability to measure and integrate risk exposures from both the top‑down (organizational level) and bottom‑up (operational level). However, the use of key risk indicators to monitor risks in a cost‑efficient way is emerging.
ERM training is mostly incorporated into a structured training plan, although it is still largely limited to risk specialists and people directly involved in risk management activitiesFew organizations provide ERM training to all employees. However, best practice organizations do integrate ERM training in their corporate training programs, ranging from basic risk management principles (e.g. what is a risk and what does it mean for daily operations?) to more in‑depth training for senior management.
A risk intelligent culture is becoming more importantEssentially, a risk intelligent culture exists within an organization when its employees’ understanding and attitudes toward risk lead them to consistently make appropriate risk‑based decisions. Consequently, an organization’s risk culture drives the behaviors that influence day‑to‑day business practices, and is a significant indicator of whether the organization embodies the characteristics of a Risk Intelligent Enterprise™.
To a large degree, an organization’s culture determines how it manages risk when it is under stress. For some organizations, their risk culture is a liability. For others, it facilitates both stability and competitive advantage. To that end, an organization wishing to cultivate a risk intelligent culture should first understand and measure its existing risk culture.
An organization’s risk culture not only depends on the tone set by the board of directors but also on the culture’s pervasiveness throughout the business and the ability of employees to identify and mitigate risk independently of an ERM function.
Risk culture is an evolving concept that may be challenging to implement. For example, it may involve reconciling multiple cultures in both regulated and unregulated businesses in multiple jurisdictions.
Technology can help to smooth the ERM process, but many organizations still struggle with itTechnology can facilitate the ERM process (e.g. risk identification, documentation, aggregation, assessments, quantitative techniques and risk monitoring and reporting etc.) although organizations indicated they are not yet at that level.
Despite a proliferation of technology vendors competing in the ERM marketplace with integrated packages, take‑up has been limited so far.
Risk Intelligent Enterprises™ manage risk for two reasons: to protect what they have and to grow the value of what they have.
Risk Intelligence in the Energy & Resources IndustryEnterprise Risk Management Benchmark Survey 3

To start a new section, hold down the apple+shift keys and click
to release this object and type the section title in the box below.
ERM done right: the Risk Intelligent Enterprise™The management of risk is inherent to the survival of mankind. When early man built a fire at night to ward off predatory animals while he slept, he was managing risk. All of us manage risk on a daily basis, often without being aware we are doing it.
Risk management is not new but ERM, an approach to managing risk, is a relatively new concept. Risk Intelligent Enterprises™ manage risk for two reasons: to protect what they have and to grow the value of what they have. The premise of ERM is that it attempts to present an overall and integrated view of the risks to which an enterprise is exposed. Ideally, with this information, the enterprise is then able to make better informed decisions about how it can protect what it has and how it can, in an intelligent manner, add value to what it has. In other words, the organization can be smarter about the risks it needs to take. It can be “Risk Intelligent.”
ERM is an enabler of risk intelligence; its true value may lie in its ability to enable the systematic identification of possible causes of failure – failure to protect existing assets (unrewarded risk) and failure to achieve value creation (rewarded risk).
The extent to which an organization uses risk information from its ERM framework to influence decision making in both areas (unrewarded and rewarded risk) is a direct reflection of the maturity of its ERM program and of its risk intelligence.
Of course, the path to this lofty designation is long and sometimes arduous. Every organization that charts its progress will find itself in a different location on the map, depending on the unique business challenges it faces and the competencies and capabilities it possesses. But every organization that attains the status of a Risk Intelligent Enterprise™ will find that they share similar characteristics, including the following:
• risk management practices that encompass the entire business, creating connections between the so‑called “silos” that often arise within large, mature, and/or diverse corporations;
• risk management strategies that address the full spectrum of risks, including industry‑specific, compliance, competitive, environmental, security, privacy, business continuity, strategic, reporting, and operational risks;
• risk management approaches that do not solely consider single events, but also take into account risk scenarios and the interaction of multiple risks;
• risk management practices that are infused into the corporate culture, so that strategy and decision‑making evolve out of a risk‑informed process, instead of having risk considerations imposed after the fact (if at all); and
• risk management philosophy that focuses not solely on risk avoidance, but also on risk‑taking as a means to value creation.
Source: Deloitte Risk Intelligence Series
4

To start a new section, hold down the apple+shift keys and click
to release this object and type the section title in the box below.
Objective of the survey
The objective of this Enterprise Risk Management Benchmark Survey is to provide a broad perspective on the state of risk management across the energy and resources industry.
The objective of this survey is twofold; first of all, it assesses the overall maturity level of a company’s ERM and risk management activities, and secondly, it helps to identify the new challenges, critical issues and risks that energy and resources companies are facing today. The results of this survey may allow companies to benchmark and assess their current ERM activities against industry best practice.
The ERM assessment has been structured around the four capabilities of the Deloitte ERM Capability Model: governance, process, people, and technology.
Governance: The governance capability focuses on the structure and organization of the risk management function (even if no risk officer position formally exists) and its ability to make risk‑intelligent decisions and execute them in a timely and effective manner. A company needs to define the roles and responsibilities of its board and committees, management, internal audit and risk management functions with respect to risk management. Risk management policies such as risk appetite, tolerance and delegation of authority need to be formally documented and communicated.
Process: The process capability focuses on the processes in place to execute risk management. These include core operational and infrastructure processes necessary to manage risk in an efficient manner, creating and protecting value.
People: The people capability focuses on having the right number of people with the appropriate training and awareness, to execute the risk management process. This includes trained people at all levels and a company‑wide risk awareness culture.
Technology: The technology capability focuses on the IT systems used to analyze and communicate risk information throughout the organization, as well as to enable risk‑intelligent decision‑making in a timely manner.
This survey is based on self‑assessment. Self‑assessment, by definition, entails an unknown degree of subjectivity and Deloitte did not attempt to validate the responses. In addition, there is no statistical significance to the responses – they are merely the opinions held at the time by those who responded. It is also important to emphasize that the prevailing practice is not necessarily the “leading practice”.
About this survey
Governance
Risk Intelligence To Create &
Preserve Value
Sustain &ContinuouslyImprove
Developand DeployStrategies
Monitor,Assure &Escalate
Design& TestControls
Respondto Risks
Assess and MeasureRisks
IdentifyRisks
Deloitte ERM capability model™
Peop
le
Technology
Process
Risk Intelligence in the Energy & Resources IndustryEnterprise Risk Management Benchmark Survey 5

To start a new section, hold down the apple+shift keys and click
to release this object and type the section title in the box below.
Approach
The benchmark survey, which forms the basis of this report, was conducted online and via an electronic questionnaire between April and August 2013. The functions most represented are Chief Risk Officers (48%), Internal Audit and Internal Control Directors/Managers (20%), Chief Financial Officers (8%) and Chief Executive Officers (5%). The ‘others’ category consists of a variety of functions e.g. Quality Managers, Energy Managers, Operations Managers, etc.
Respondent profile
0%
10%
20%
30%
40%
50%
60%
OthersCEOCFOInternal Audit/Internal Control
CRO
48%
20% 19%
8%5%
The vast majority of respondents (87%) completed the survey data in view of their entire organization. Ten per cent of respondents considered a division, group or a business unit while only 3% completed the survey in view of a local unit.
The level at which survey data will be entered
3%
10%
Entire corporation Division/Group/Business unit
Local unit
87%
6
To start a new section, hold down the apple+shift keys and click
to release this object and type the section title in the box below.
Respondent profile
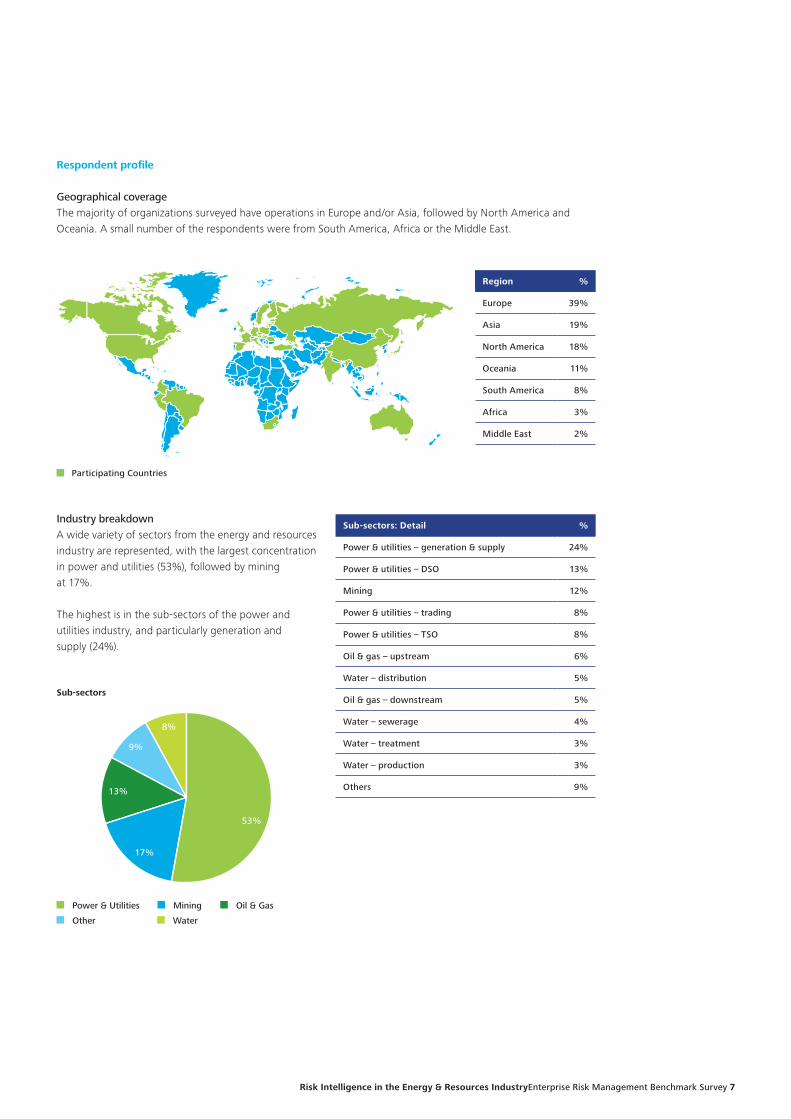
Geographical coverageThe majority of organizations surveyed have operations in Europe and/or Asia, followed by North America and Oceania. A small number of the respondents were from South America, Africa or the Middle East.
Sub-sectors
13%
17%
Power & Utilities Mining Oil & Gas
Other Water
53%
9%
8%
Sub‑sectors: Detail %
Power & utilities – generation & supply 24%
Power & utilities – DSO 13%
Mining 12%
Power & utilities – trading 8%
Power & utilities – TSO 8%
Oil & gas – upstream 6%
Water – distribution 5%
Oil & gas – downstream 5%
Water – sewerage 4%
Water – treatment 3%
Water – production 3%
Others 9%
Industry breakdownA wide variety of sectors from the energy and resources industry are represented, with the largest concentration in power and utilities (53%), followed by mining at 17%.
The highest is in the sub‑sectors of the power and utilities industry, and particularly generation and supply (24%).
Region %
Europe 39%
Asia 19%
North America 18%
Oceania 11%
South America 8%
Africa 3%
Middle East 2%
Participating Countries
Risk Intelligence in the Energy & Resources IndustryEnterprise Risk Management Benchmark Survey 7

To start a new section, hold down the apple+shift keys and click
to release this object and type the section title in the box below.
Participants in the survey mostly represented organizations with a turnover of more than $1,000 million (57%) and a headcount of more than 1,000 full‑time employees (71%).
The majority of the organizations that participated are operationally active in less than five countries (71%), although 11% indicated that they are active in more than 20 countries.
Operating revenues (mUSD)
0%
5%
10%
15%
20%
25%
30%
35%
>=10.0005.000 – 10.0001.000 – 5.000500 – 1.0000 – 500
28%
15%
29%
20%
8%
Full time employees
0%
5%
10%
15%
20%
25%
30%
35%
40%
>=10.0005.000 – 10.0001.000 – 5.000500 – 1.0000 – 500
21%
34%
25%
12%9%
Global operations (countries active in)
0%
10%
20%
30%
40%
50%
60%
70%
80%
>=2015 – 2010 – 155 – 100 – 5
71%
13%
5%11%
0%
8
To start a new section, hold down the apple+shift keys and click
to release this object and type the section title in the box below.
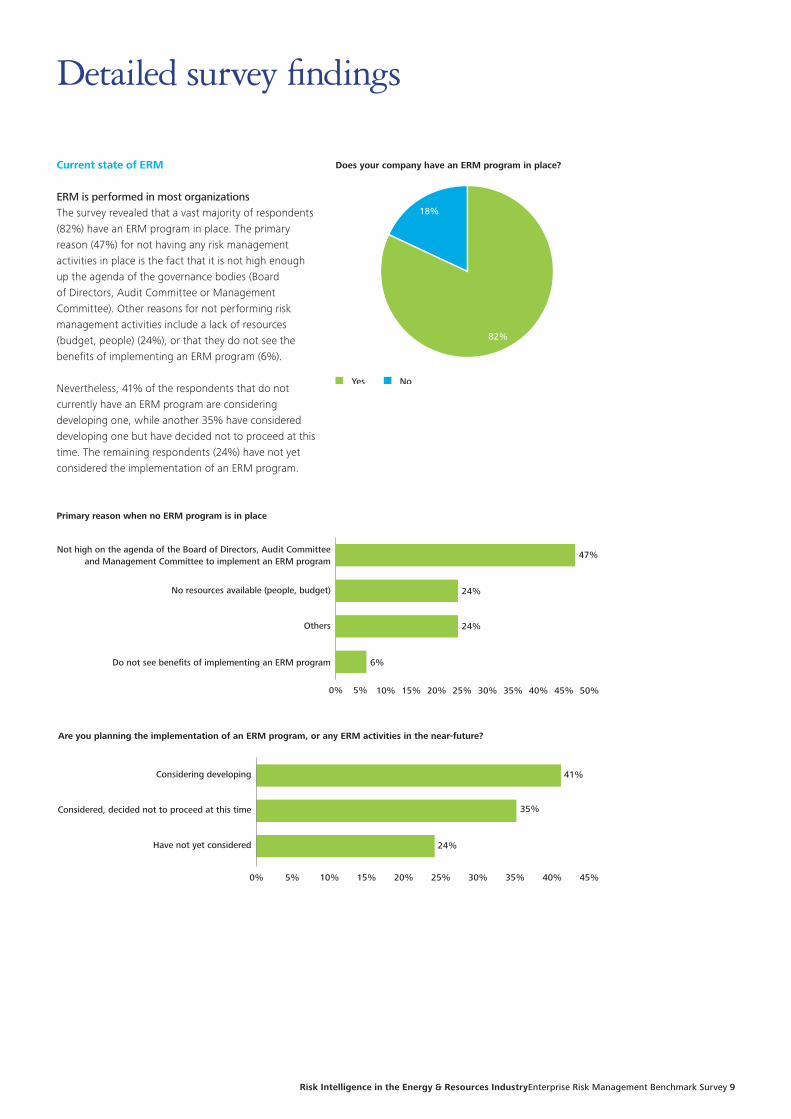
Does your company have an ERM program in place?
18%
Yes No
82%
0% 5% 10% 15% 20% 25% 30% 35% 40% 45% 50%
Do not see benefits of implementing an ERM program
Others
No resources available (people, budget)
Not high on the agenda of the Board of Directors, Audit Committeeand Management Committee to implement an ERM program
Primary reason when no ERM program is in place
47%
24%
24%
6%
Detailed survey findings
0% 5% 10% 15% 20% 25% 30% 35% 40% 45%
Have not yet considered
Considered, decided not to proceed at this time
Considering developing
Are you planning the implementation of an ERM program, or any ERM activities in the near-future?
41%
35%
24%
Current state of ERM
ERM is performed in most organizationsThe survey revealed that a vast majority of respondents (82%) have an ERM program in place. The primary reason (47%) for not having any risk management activities in place is the fact that it is not high enough up the agenda of the governance bodies (Board of Directors, Audit Committee or Management Committee). Other reasons for not performing risk management activities include a lack of resources (budget, people) (24%), or that they do not see the benefits of implementing an ERM program (6%).
Nevertheless, 41% of the respondents that do not currently have an ERM program are considering developing one, while another 35% have considered developing one but have decided not to proceed at this time. The remaining respondents (24%) have not yet considered the implementation of an ERM program.
Risk Intelligence in the Energy & Resources IndustryEnterprise Risk Management Benchmark Survey 9

To start a new section, hold down the apple+shift keys and click
to release this object and type the section title in the box below.
Operational performance can be significantly improved when risk management contributes to safeguarding the overall asset integrity, comprising the design and the technical and operating integrity of a company’s assets.
More than half of the respondents have a fully operational ERM programERM has become common practice in the energy and resources industry. More than half of the participants (54%) reported that they have a fully operational ERM program. For ERM programs in development, most of the respondents indicated that the program has been under development for more than one year. Eighty‑eight per cent of the respondents indicated that they have a fully operational ERM program that has been in place for at least four years.
Operational performance and regulatory compliance appear to be the key drivers of ERM, while strategy is an emerging driverRespondents stated their organization’s ERM efforts are being driven mainly because of the need to improve operational performance (31%), and the need to comply with regulations (30%).
• Operational performance can be significantly improved when risk management contributes to safeguarding overall asset integrity, comprising the design and technical and operating integrity of a company’s assets. Not surprisingly, this is one of the main drivers for ERM programs.
• Regulatory compliance has been one of the main drivers for several years due to increasingly complex multijurisdictional requirements. European corporate governance (CG) regulations have incorporated risk management for a decade, some of them for even longer (the UK since 1992, the Netherlands since 1997, Germany since 2000, France since 2002, and Belgium since 2004). The European CG regulations also define a broader scope for ERM that includes the management of risks for strategic, operational, financial, and compliance objectives.
• Strategy is an emerging driver of ERM programs, increasing from 16% in 2009 to 26% in 2013. More and more companies are aware of the strategic importance of risk management to their organization, and how risk management can contribute to the prioritization of strategic initiatives by quantifying the associated risks and helping to make the right risk and reward trade‑off.
• Another prominent driver is business continuity, while only a small sample (1%) cited reputation as a possible driver for undertaking ERM activities.
Operational status of the ERM program
46%
Fully operational In development
54%
Boards are the primary drivers of ERM but senior management’s tendency to pull ERM through an organization is growingThe key groups driving ERM within the surveyed organizations are the Board of Directors, Management Committee, and the Audit Committee. The Board and the Audit Committee, jointly accounted for at least 52% of those pushing for ERM within an organization.
Nevertheless, it should be noted that the Board has become an increasing primary driver, whereas the opposite is true for the Audit Committee compared to 2009.
For 30% of respondents, the Management Committee is aligning ERM to more strategic risk management activities and operational performance. This is consistent with the observation that strategy and growth are becoming increasingly important elements in an organization’s risk management program. This can also explain the appearance of strategy as an emerging driver of ERM.
Most prominent driver for undertaking ERM activities
30%
26%
Operational performance Regulatory compliance
Strategic reasons
Public image
Business continuity
31%
12%
1%
10
To start a new section, hold down the apple+shift keys and click
to release this object and type the section title in the box below.
Strategy is an emerging driver of ERM programs, increasing from 16% in 2009 to 26% in 2013. More and more companies are aware of the strategic importance of risk management to their organization, and how risk management can contribute to the prioritization of strategic initiatives by quantifying the associated risks and helping to make the right risk and reward trade‑off.
As Boards of Directors usually focus more on asset protection while Management Committees focus more on future growth, there may be a possible disconnect between program goals (asset protection) and expectations (value creation). Where regulation and compliance appear to be the primary drivers of ERM, Management Committees are more often not the key program driver.
When the risk management system is driven by the Board or its committees, it may be perceived by the Management Committee as yet another form of compliance, something that must be done and which is not driven by business needs. Management Committees may be more interested in improving operational performance and value creation than the protection of existing assets. In those cases, ERM will usually be ‘pushed’ through organizations, instead of being ‘pulled’ through by business departments.
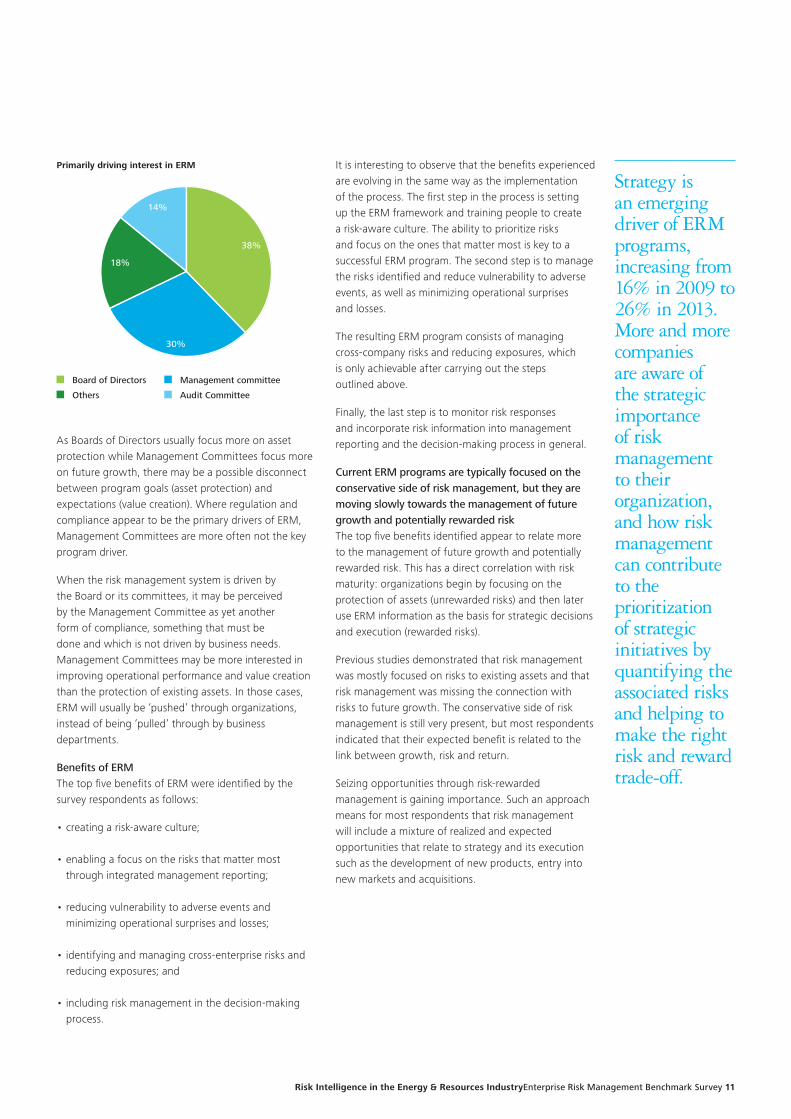
Benefits of ERMThe top five benefits of ERM were identified by the survey respondents as follows:
• creating a risk‑aware culture;
• enabling a focus on the risks that matter most through integrated management reporting;
• reducing vulnerability to adverse events and minimizing operational surprises and losses;
• identifying and managing cross‑enterprise risks and reducing exposures; and
• including risk management in the decision‑making process.
Primarily driving interest in ERM
30%
18%
Board of Directors Management committee
Others Audit Committee
38%
14%
It is interesting to observe that the benefits experienced are evolving in the same way as the implementation of the process. The first step in the process is setting up the ERM framework and training people to create a risk‑aware culture. The ability to prioritize risks and focus on the ones that matter most is key to a successful ERM program. The second step is to manage the risks identified and reduce vulnerability to adverse events, as well as minimizing operational surprises and losses.
The resulting ERM program consists of managing cross‑company risks and reducing exposures, which is only achievable after carrying out the steps outlined above.
Finally, the last step is to monitor risk responses and incorporate risk information into management reporting and the decision‑making process in general.
Current ERM programs are typically focused on the conservative side of risk management, but they are moving slowly towards the management of future growth and potentially rewarded riskThe top five benefits identified appear to relate more to the management of future growth and potentially rewarded risk. This has a direct correlation with risk maturity: organizations begin by focusing on the protection of assets (unrewarded risks) and then later use ERM information as the basis for strategic decisions and execution (rewarded risks).
Previous studies demonstrated that risk management was mostly focused on risks to existing assets and that risk management was missing the connection with risks to future growth. The conservative side of risk management is still very present, but most respondents indicated that their expected benefit is related to the link between growth, risk and return.
Seizing opportunities through risk‑rewarded management is gaining importance. Such an approach means for most respondents that risk management will include a mixture of realized and expected opportunities that relate to strategy and its execution such as the development of new products, entry into new markets and acquisitions.
Risk Intelligence in the Energy & Resources IndustryEnterprise Risk Management Benchmark Survey 11
To start a new section, hold down the apple+shift keys and click
to release this object and type the section title in the box below.
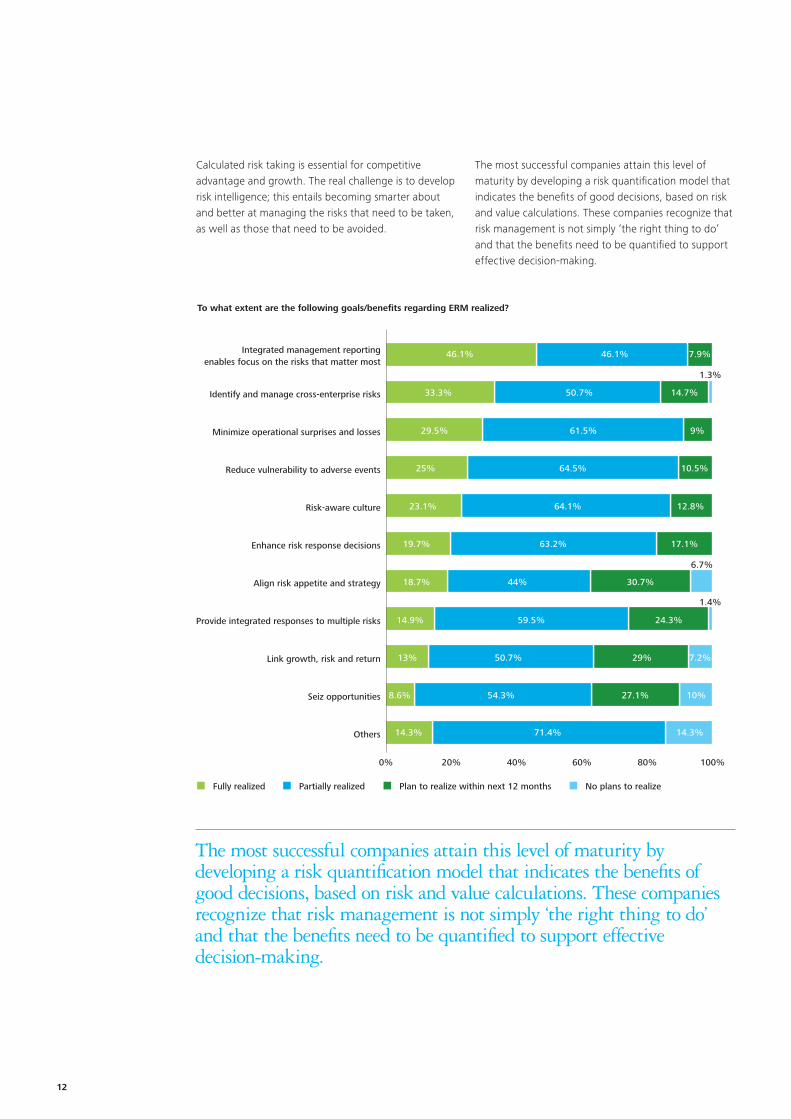
Calculated risk taking is essential for competitive advantage and growth. The real challenge is to develop risk intelligence; this entails becoming smarter about and better at managing the risks that need to be taken, as well as those that need to be avoided.
The most successful companies attain this level of maturity by developing a risk quantification model that indicates the benefits of good decisions, based on risk and value calculations. These companies recognize that risk management is not simply ‘the right thing to do’ and that the benefits need to be quantified to support effective decision‑making.
The most successful companies attain this level of maturity by developing a risk quantification model that indicates the benefits of good decisions, based on risk and value calculations. These companies recognize that risk management is not simply ‘the right thing to do’ and that the benefits need to be quantified to support effective decision‑making.
To what extent are the following goals/benefits regarding ERM realized?
0% 20% 40% 60% 80% 100%
Others
Seiz opportunities
Link growth, risk and return
Provide integrated responses to multiple risks
Align risk appetite and strategy
Enhance risk response decisions
Risk-aware culture
Reduce vulnerability to adverse events
Minimize operational surprises and losses
Identify and manage cross-enterprise risks
Integrated management reportingenables focus on the risks that matter most
Fully realized Partially realized Plan to realize within next 12 months No plans to realize
46.1%
33.3%
29.5% 61.5% 9%
25% 64.5%
64.1% 12.8%
10.5%
23.1%
19.7% 63.2% 17.1%
18.7% 44% 30.7%
6.7%
14.9% 59.5% 24.3%
1.4%
13% 50.7% 29% 7.2%
8.6% 54.3% 27.1% 10%
14.3% 71.4% 14.3%
50.7% 14.7%
1.3%
46.1% 7.9%
12

To start a new section, hold down the apple+shift keys and click
to release this object and type the section title in the box below.
Scope of ERMCompared with the previous benchmarking survey, the scope of ERM is expanding to include all functions across the business. This is reflected by the diversity of the risks that fall within scope of the risk management program.
Furthermore, the survey demonstrated that:
• 23% of the respondents have a full scope ERM program including 17 risk areas or more;
• 58% include more than 10 risk areas; and
• 70% include more than five risk areas.
Consistent with the focus on unrewarded risk, almost all current ERM programs include operations (78%), external factors (78%), information technology (74%), finance (74%), human resources (71%) and compliance (71%) in their ERM scope. This reflects the historical focus on compliance and financial risks.
Scope of Enterprise Risk Management
0% 10% 20% 30% 40% 50% 60% 70% 80% 90%
Others
Product Development
Sales, marketing & communications
Corporate governance
Ethics
Corporate responsibility
Strategy
Reporting
Planning
Corporate assets
Environment, health & safety
Legal
Compliance
Human resources
Finance
Information technology
External factors
Operations 78%
78%
74%
74%
71%
71%
70%
70%
70%
68%
64%
64%
63%
62%
62%
55%
46%
6%
Risk Intelligence in the Energy & Resources IndustryEnterprise Risk Management Benchmark Survey 13

To start a new section, hold down the apple+shift keys and click
to release this object and type the section title in the box below.
Although the overall scope of ERM has increased compared with our 2009 survey, it is important to mention that generally the developing trend of a shifting focus towards rewarded risks has slowed down. The occurrence of several catastrophic events within the energy and resources industry, such as nuclear and mining disasters and oil spills, has led companies to focus again on asset protection and unrewarded risk in general.
A clear example is the increasing importance of environmental health and safety, which 70% of respondents indicated is included in the scope of their ERM programs.
The integration of risk management in the decision‑ making process is growing, but is still in development for most respondentsMost respondents integrate or plan to systematically integrate risk management into all of their decision‑ making processes. At the moment, organizations have, for the most part, fully incorporated risk management into their decision‑making processes in relation to internal audit (50%) and health, safety and environment (50%). However, the survey does indicate a growing trend, as seen previously, towards more systematic integration into other critical decision‑making processes, such as ethics and compliance (38%).
Often a low score for integration of risk management into the decision‑making process is due to a lack of formalization of risk management in these areas. For instance, many IT organizations have integrated a risk dimension into the decision‑making process for information communication technology (ICT) projects, although it is often not formalized or connected to broader risk management programs. Nevertheless, those organizations with the most sophisticated practices indicated that they have fully integrated ERM into their decision‑making processes.
Integrating risk management into the decision‑making processes may increase the understanding of the benefits of an ERM program at the Management Committee level. In order for operational management to see the value, they need to see that their issues are being addressed in a beneficial way. Too often, operational management perceives risk management as an administrative burden and does not realize that active risk management is required for further growth. Respondents have recognized this challenge and plan to link risk with performance in future by quantifying risk management activities and prioritizing those that create the most value.
Respondents have recognized this challenge and plan to link risk with performance in the future by quantifying risk management activities and prioritizing those that create the most value.
Integration of ERM in the decision-making process
0% 20% 40% 60% 80% 100%
Others
ICT
Legal
Production, generation & extraction
Strategic planning
Asset management
Finance (incl. treasury & tax)
Ethics and compliance
Commodity trading/sourcing
Insurance
Internal audit
Health, safety & environment
Fully incorporated Partially incorporated Plan to realize within next 12 months No plans to incorporate
50%
50%
39.5% 6.6%
33.8% 8.1% 8.1%
42.5% 41.1% 11%
5.5%
3.9%
40.9% 30.3% 7.6% 21.2%
37.8% 47.3% 9.5%
5.4%
36% 53.3% 6.7%
4%
35.5% 51.3% 6.6% 6.6%
31.6% 52.6% 13.1%
2.6%
29% 50.7% 8.7% 11.6%
28.9% 53.9% 11.8%
5.3%
27.3% 42.4% 12.1% 18.2%
25% 35.5% 12.5% 25%
14

To start a new section, hold down the apple+shift keys and click
to release this object and type the section title in the box below.
Governance
Most companies believe that having a formal ERM program in place will have a positive impact on their credit ratingFifty‑eight per cent of survey respondents have already received an external credit rating. Of those that have not, 87% have no plans to apply for a credit rating in the near future.
External credit rating received?
42%
Yes No
58%
Ninety‑three per cent of the respondents believe that having a formal ERM program in place would have a positive impact on their credit rating.
ERM positive impact on rating?
7%
Yes No
93%
For the majority of those with an ERM program, a formal risk management organization is in placeFor those where an ERM program is in place, 96% indicated that a formal risk management organization is in place.
The primary reason why organizations have not yet established a formal risk management organization is the lack of available resourcesThe main reason why respondents do not have a formal risk management organization for their ERM activities is due to the fact that they have no resources (budget, people) available (67%). Thirty‑three per cent of the respondents indicated that they have other reasons for not implementing a formal risk management organization, for example, because ERM is kept at a high level within the organization. However, none of the respondents believed that once ERM evolves in its breadth and depth, the presence of a formal risk management organization would be of no value to the business.
In most organizations, ERM has been implemented on different levelsThe majority (60%) of the respondents have implemented ERM at Board level. A smaller group (57%) have implemented ERM at group level, followed by 51% at divisional level. Less than half of the respondents have implemented ERM at operating sites (41%) and within functions and processes (40%).
0% 10% 20% 30% 40% 50% 60% 70%
Functions andprocesses
Operating sites
Divisional level
Group Level
Board level
Levels in the organization where ERM has been implemented
60%
57%
51%
41%
40%
Implementing ERM and organizational approaches
Risk Intelligence in the Energy & Resources IndustryEnterprise Risk Management Benchmark Survey 15

To start a new section, hold down the apple+shift keys and click
to release this object and type the section title in the box below.
For the majority (43%) of the companies, the ERM organization was established four to six years ago. Twenty‑four per cent and 23% implemented the ERM organization one to three, and seven to nine years ago respectively.
Analyzing this question from a geographical point of view shows that respondents with operational activities in Europe, Asia and North America tend to have a longer history of ERM, as at least 70% have had ERM in place for more than six years.
0%
10%
20%
30%
40%
50%
>=10 years
7-9years
4-6years
1-3years
<1year
1%
43%
8%
24%23%
Years since establishment of the ERM organization
Most organizations have structured their risk management in a hybrid formatThe vast majority of respondents (65%) have structured their risk management organization in a hybrid format. The most mature and thus leading ERM practices also apply this format. A hybrid risk management organization combines the advantages of a centralized and decentralized structure and enables adequate and timely responses to new emerging risks.
In a hybrid structure, the different business functions perform their own risk management activities (e.g. identification and analysis of risks, or implementation of control measures), supported and coordinated by a central risk management department.
Typically, the tasks of this central team include:
• establishing a common ERM methodology and tools;
• integrating different ERM practices;
• consolidating and integrating company‑wide risks;
• monitoring and reporting on a company‑wide ERM dashboard; and
• disseminating best ERM practice and knowledge.
In general, no operational risk responsibilities are assigned to this central risk management function. The ownership of risk lies with the business functions. In this set‑up, Boards will take on an oversight function while Internal Audit will provide independent assessment and monitoring services.
The hybrid structure facilitates the integration of different approaches that can exist with regard to strategic and operational risks. Strategic risks will usually need a centralized approach due to their wide impact, whereas operational risks will usually be tackled in a more decentralized way.
The number of Full Time Equivalent (FTE) roles involved in risk management activities depends largely on the size of the organizationThe survey reveals the relationship between an organization’s total resources and the number of resources involved at a central level in risk management.
Structure of ERM organization
31%
4%
Hybrid Centralized Decentralized
65%
16
To start a new section, hold down the apple+shift keys and click
to release this object and type the section title in the box below.
Small organizations (< 1,000 FTE) usually have either no central risk department (41%) or a central risk department consisting of one to five FTE (38%). Additionally, medium‑sized organizations (> 1,000 but < 10,000 FTE) mostly staff their risk department with 1 to 5 FTE (62%), so few economies of scale appear to take place. However, the apparent lack of economies of scale is compensated for by more depth and specialization within these medium‑sized organizations, enabling them to introduce emerging risk practices such as KRIs and advanced quantitative techniques for risk analyses. For large organizations (> 10,000 FTE), no clear trend is observed.
Geographically extended organizations need larger decentralized risk management teamsOrganizations tend to structure their risk management processes depending on their existing structure and geographic footprint. The more regions in which the organization is active, the more risk specialists will be needed in the different locations to enable rapid response to emerging operational risks, as these are managed locally most of the time.
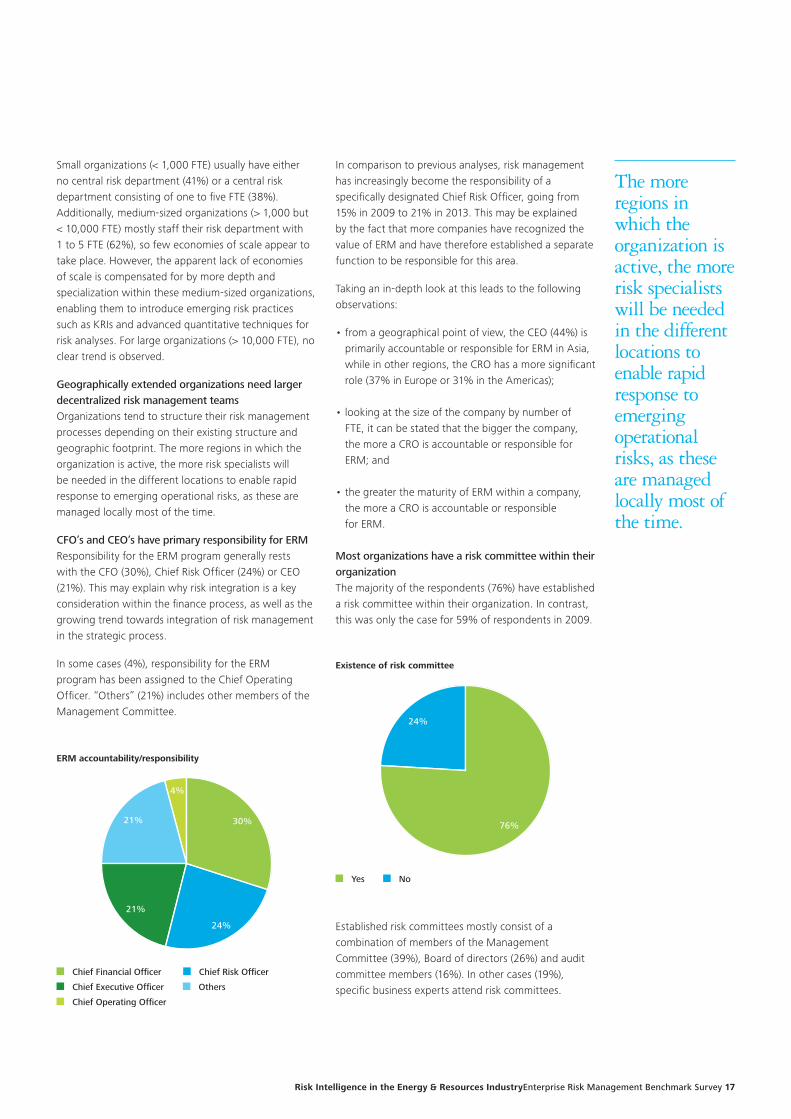
CFO’s and CEO’s have primary responsibility for ERMResponsibility for the ERM program generally rests with the CFO (30%), Chief Risk Officer (24%) or CEO (21%). This may explain why risk integration is a key consideration within the finance process, as well as the growing trend towards integration of risk management in the strategic process.
In some cases (4%), responsibility for the ERM program has been assigned to the Chief Operating Officer. “Others” (21%) includes other members of the Management Committee.
ERM accountability/responsibility
24%
21%
Chief Financial Officer Chief Risk Officer
Chief Executive Officer
Chief Operating Officer
Others
30%21%
4%
In comparison to previous analyses, risk management has increasingly become the responsibility of a specifically designated Chief Risk Officer, going from 15% in 2009 to 21% in 2013. This may be explained by the fact that more companies have recognized the value of ERM and have therefore established a separate function to be responsible for this area.
Taking an in‑depth look at this leads to the following observations:
• from a geographical point of view, the CEO (44%) is primarily accountable or responsible for ERM in Asia, while in other regions, the CRO has a more significant role (37% in Europe or 31% in the Americas);
• looking at the size of the company by number of FTE, it can be stated that the bigger the company, the more a CRO is accountable or responsible for ERM; and
• the greater the maturity of ERM within a company, the more a CRO is accountable or responsible for ERM.
Most organizations have a risk committee within their organizationThe majority of the respondents (76%) have established a risk committee within their organization. In contrast, this was only the case for 59% of respondents in 2009.
Existence of risk committee
24%
Yes No
76%
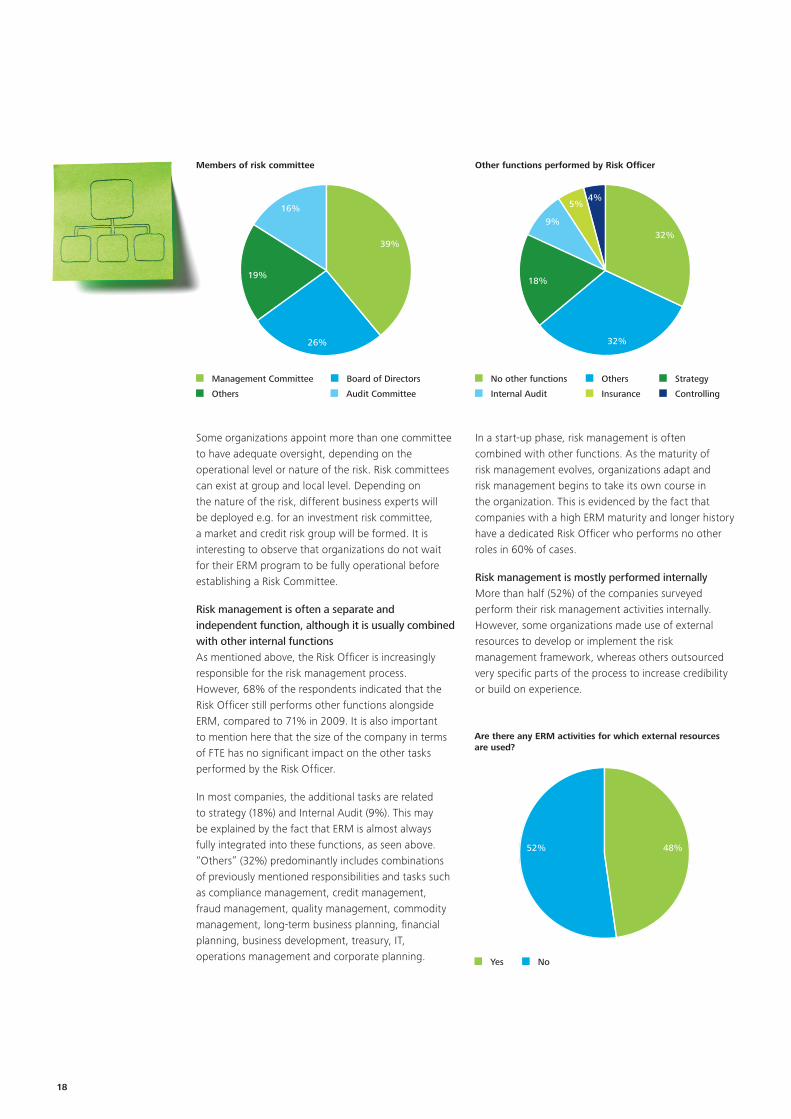
Established risk committees mostly consist of a combination of members of the Management Committee (39%), Board of directors (26%) and audit committee members (16%). In other cases (19%), specific business experts attend risk committees.
The more regions in which the organization is active, the more risk specialists will be needed in the different locations to enable rapid response to emerging operational risks, as these are managed locally most of the time.
Risk Intelligence in the Energy & Resources IndustryEnterprise Risk Management Benchmark Survey 17
To start a new section, hold down the apple+shift keys and click
to release this object and type the section title in the box below.
Members of risk committee
26%
19%
Management Committee Board of Directors
Others Audit Committee
39%
16%
Some organizations appoint more than one committee to have adequate oversight, depending on the operational level or nature of the risk. Risk committees can exist at group and local level. Depending on the nature of the risk, different business experts will be deployed e.g. for an investment risk committee, a market and credit risk group will be formed. It is interesting to observe that organizations do not wait for their ERM program to be fully operational before establishing a Risk Committee.
Risk management is often a separate and independent function, although it is usually combined with other internal functionsAs mentioned above, the Risk Officer is increasingly responsible for the risk management process. However, 68% of the respondents indicated that the Risk Officer still performs other functions alongside ERM, compared to 71% in 2009. It is also important to mention here that the size of the company in terms of FTE has no significant impact on the other tasks performed by the Risk Officer.
In most companies, the additional tasks are related to strategy (18%) and Internal Audit (9%). This may be explained by the fact that ERM is almost always fully integrated into these functions, as seen above. “Others” (32%) predominantly includes combinations of previously mentioned responsibilities and tasks such as compliance management, credit management, fraud management, quality management, commodity management, long‑term business planning, financial planning, business development, treasury, IT, operations management and corporate planning.
In a start‑up phase, risk management is often combined with other functions. As the maturity of risk management evolves, organizations adapt and risk management begins to take its own course in the organization. This is evidenced by the fact that companies with a high ERM maturity and longer history have a dedicated Risk Officer who performs no other roles in 60% of cases.
Risk management is mostly performed internallyMore than half (52%) of the companies surveyed perform their risk management activities internally. However, some organizations made use of external resources to develop or implement the risk management framework, whereas others outsourced very specific parts of the process to increase credibility or build on experience.
Other functions performed by Risk Officer
32%
18%
4%
No other functions Others Strategy
Internal Audit Insurance Controlling
32%
9%
5%
Are there any ERM activities for which external resourcesare used?
52%
Yes No
48%
18
To start a new section, hold down the apple+shift keys and click
to release this object and type the section title in the box below.
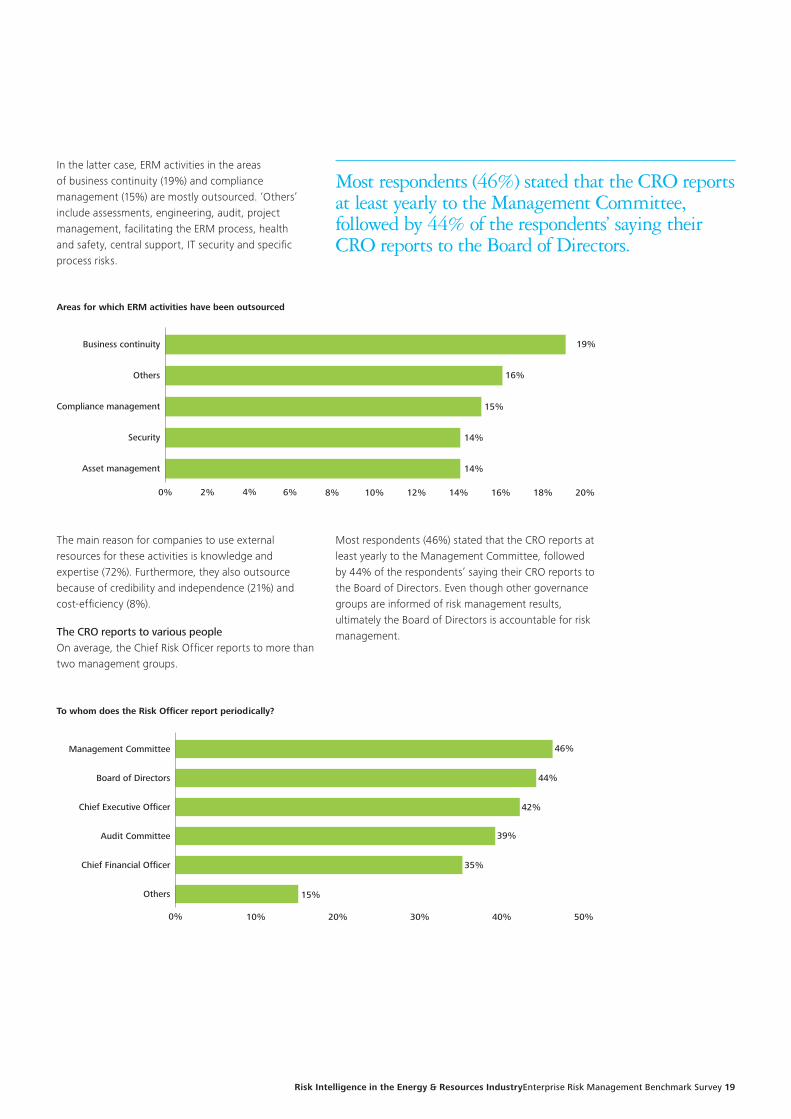
In the latter case, ERM activities in the areas of business continuity (19%) and compliance management (15%) are mostly outsourced. ‘Others’ include assessments, engineering, audit, project management, facilitating the ERM process, health and safety, central support, IT security and specific process risks.
0% 2% 4% 6% 8% 10% 12% 14% 16% 18% 20%
Asset management
Security
Compliance management
Others
Business continuity
Areas for which ERM activities have been outsourced
19%
16%
15%
14%
14%
The main reason for companies to use external resources for these activities is knowledge and expertise (72%). Furthermore, they also outsource because of credibility and independence (21%) and cost‑efficiency (8%).
The CRO reports to various peopleOn average, the Chief Risk Officer reports to more than two management groups.
Most respondents (46%) stated that the CRO reports at least yearly to the Management Committee, followed by 44% of the respondents’ saying their CRO reports to the Board of Directors. Even though other governance groups are informed of risk management results, ultimately the Board of Directors is accountable for risk management.
0% 10% 20% 30% 40% 50%
Others
Chief Financial Officer
Audit Committee
Chief Executive Officer
Board of Directors
Management Committee
To whom does the Risk Officer report periodically?
46%
44%
42%
39%
35%
15%
Most respondents (46%) stated that the CRO reports at least yearly to the Management Committee, followed by 44% of the respondents’ saying their CRO reports to the Board of Directors.
Risk Intelligence in the Energy & Resources IndustryEnterprise Risk Management Benchmark Survey 19

To start a new section, hold down the apple+shift keys and click
to release this object and type the section title in the box below.
0% 10% 20% 30% 40% 50% 60% 70% 80%
Others
Internal Audit identifies risks, audits control measures, makes recommendationsbut is not the owner of the risk system and the risks it contains
Internal Audit and ERM roles relate to different functions operating withindifferent departments and the ERM function and processes are objectively and
independently monitored and reviewed by Internal Audit
Means of ensuring independance between Internal Audit and ERM
70%
18%
12%
On what is the internal risk-based audit plan founded?
23%
10%
Combination of both residual and inherent risk level
Residual risk level
Inherent risk level
Others
64%
3%
The role of Internal Audit with respect to ERMGood practice demonstrates independence between the Internal Audit function and the ERM function. In order to ensure this independence, more than half of the respondents (70%) indicated that Internal Audit and ERM roles relate to different functions operating within different departments. In addition, the ERM function and processes are subject to objective and independent monitoring and review by Internal Audit.
Another 18% claim that Internal Audit identifies risks, audits control measures and makes recommendations, but is not the owner of the risk system and the risks it contains. In the remaining 12% of cases, other safeguards are applicable. For instance, when ERM and Internal Audit are operating within the same department, different roles and responsibilities are defined.
The use of an ERM framework by Internal AuditA significant proportion of the companies surveyed (81%) use a risk‑based audit plan in their Internal Audit department. This audit plan is based mainly on a combination of both residual and inherent risk level. However, if the audit plan is based on a single risk level, most of the companies choose to base it on the residual risk level instead of the inherent risk level.
The combination of both levels is clearly best practice, although the fact that more companies tend to focus primarily on residual risk can be explained by the fact that organizations in the start‑up phase of developing ERM, tend to focus first on the residual risk level.
In 53% of the responses, the internal auditors develop their own framework, process, tools and methodology. Only 38% fully rely on those provided by the ERM framework. In the remaining cases, Internal Audit relies on both performed risk assessments and their own assessments (8%).
20

To start a new section, hold down the apple+shift keys and click
to release this object and type the section title in the box below.
0% 10% 20% 30% 40% 50% 60%
Others
Fully rely on ERM framework, process, toolsand methodologies (as designed)
Internal audit developed its own framework,process, tools and methodologies
Does Internal Audit rely on an ERM framework, process, tools and methodologies?
53%
38%
8%
The integration of risks, recommendations, monitoring and follow‑up of activities, as identified by Internal Audit, are in most cases (47%) only partially incorporated (as monitoring and follow‑up are a separate process). In 25% of cases, full incorporation is present. However, 18% of respondents are planning to integrate processes within the next 12 months. Only a small number (10%) have no intention to incorporate Internal Audit activities in the ERM program.
Integration of risks, recommendations, monitoring andfollow up activities, as identified by Internal Audit, in theERM program?
25%
18%
Partially incorporated
Fully incorporated
Plan to incorporate within next 12 months
No plans to incorporate
47%
10%
Definition
Key Risk Indicators (KRI) are measurable management metrics used to properly monitor risks. These leading or lagging indicators (mostly expressed in amounts, percentages or ratios) provide insights on the accuracy of the assessment of the risk exposure (i.e. impact multiplied by probability of occurrence) by alerting staff and management that a risk profile has or is changing. KRI’s values are monitored in absolute values as well as compared to trends. They are tracked relative to a specified threshold, called risk tolerance (i.e. the acceptable level of variation relative to the achievement of objectives). Operating within risk tolerance levels provides management with assurance that the entity remains within its risk appetite, which, in turn, provides a certain degree of comfort the entity will achieve its objectives. Hence, KRIs do not measure risk but state how ‘risky’ it is.
To which extent is the use of KRIs incorporated within ERM?
21%
19%
Partially incorporated
Fully incorporated
Plan to incorporate within next 12 months
No plans to incorporate
41%
19%
Risk Intelligence in the Energy & Resources IndustryEnterprise Risk Management Benchmark Survey 21

To start a new section, hold down the apple+shift keys and click
to release this object and type the section title in the box below.
0% 5% 10% 15% 20% 25% 30%
Others
To quantify risk assessments
To ensure the company operateswith the defined risk tolerance
To alert staff or managementwhen risk profile is changing
For monitoring purposes
Main reason to use KRIs
29%
25%
22%
16%
8%
The use of KRIsTwenty‑one per cent of respondents indicated that KRIs are fully incorporated within their ERM process, whereas 41% stated that they are only partially incorporated. Other respondents are planning to incorporate KRIs within the next 12 months, while a minority (19%) have no plans to incorporate.
Levels on which KRIs are used
0%
10%
20%
30%
40%
50%
60%
Product/serviceProcessBusiness unitCompany-wide
55%
7%
18%23%
Taking a closer look at these results over the different sub‑sectors suggests that power and utilities and mining are more mature in terms of using KRIs within ERM, as more than half of these respondents indicated that they have partially incorporated KRIs already. The level of ERM maturity also has a similar significant impact on the use of KRIs.
KRIs are mainly used for monitoring purposes (29%). Furthermore, as KRIs can be used as lagging or leading indicators that provide insight on the accuracy of the risk assessment exposure, another main reason they are used is to alert staff or management when the risk profile is changing (25%). The third most common reason is to ensure that the company operates within defined risk tolerance levels (22%). KRIs are also used to quantify risk assessments, or for a combination of the reasons outlined above.
For most respondents (55%), KRIs are used or will be used on a company‑wide level. Nevertheless, some companies narrow it down and use KRIs at a business unit level (23%) and process level (18%), while some even use them on a product/service level (7%).
22
To start a new section, hold down the apple+shift keys and click
to release this object and type the section title in the box below.
0% 10% 20% 30% 40% 50% 60%
Others
ICT
Commodity trading/sourcing
Project and project portfolio
Operational performance& asset management
Finance, credit & tax
Operational safety
Functions/areas in which KRIs are applied
51%
49%
45%
42%
8%
26%
29%
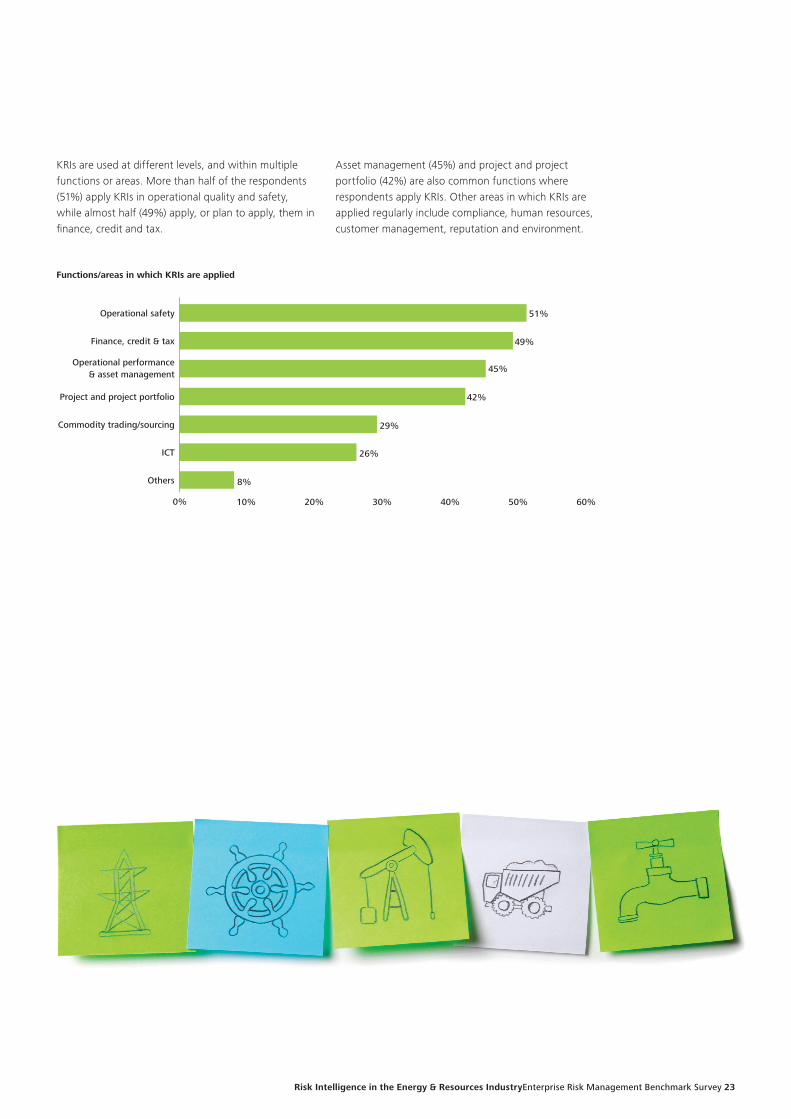
KRIs are used at different levels, and within multiple functions or areas. More than half of the respondents (51%) apply KRIs in operational quality and safety, while almost half (49%) apply, or plan to apply, them in finance, credit and tax.
Asset management (45%) and project and project portfolio (42%) are also common functions where respondents apply KRIs. Other areas in which KRIs are applied regularly include compliance, human resources, customer management, reputation and environment.
Risk Intelligence in the Energy & Resources IndustryEnterprise Risk Management Benchmark Survey 23
To start a new section, hold down the apple+shift keys and click
to release this object and type the section title in the box below.
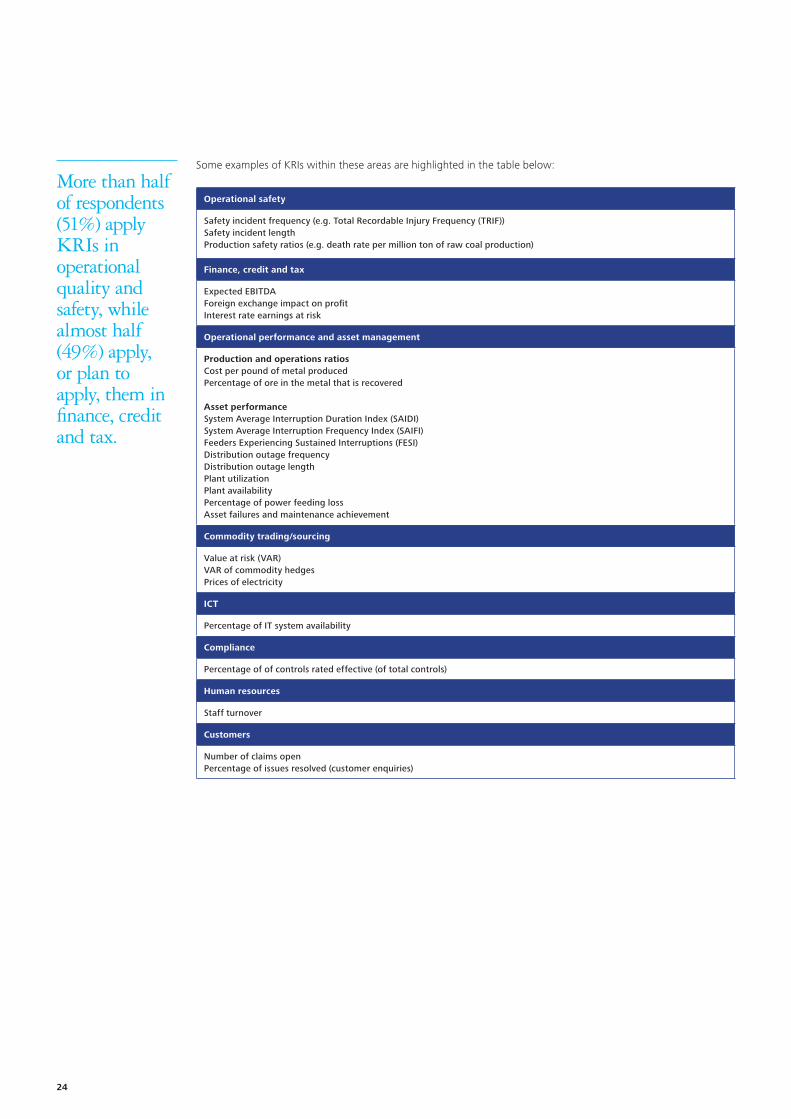
Operational safety
Safety incident frequency (e.g. Total Recordable Injury Frequency (TRIF))Safety incident lengthProduction safety ratios (e.g. death rate per million ton of raw coal production)
Finance, credit and tax
Expected EBITDAForeign exchange impact on profitInterest rate earnings at risk
Operational performance and asset management
Production and operations ratiosCost per pound of metal producedPercentage of ore in the metal that is recovered
Asset performanceSystem Average Interruption Duration Index (SAIDI)System Average Interruption Frequency Index (SAIFI)Feeders Experiencing Sustained Interruptions (FESI)Distribution outage frequencyDistribution outage lengthPlant utilizationPlant availabilityPercentage of power feeding lossAsset failures and maintenance achievement
Commodity trading/sourcing
Value at risk (VAR)VAR of commodity hedgesPrices of electricity
ICT
Percentage of IT system availability
Compliance
Percentage of of controls rated effective (of total controls)
Human resources
Staff turnover
Customers
Number of claims openPercentage of issues resolved (customer enquiries)
Some examples of KRIs within these areas are highlighted in the table below:
More than half of respondents (51%) apply KRIs in operational quality and safety, while almost half (49%) apply, or plan to apply, them in finance, credit and tax.
24
To start a new section, hold down the apple+shift keys and click
to release this object and type the section title in the box below.
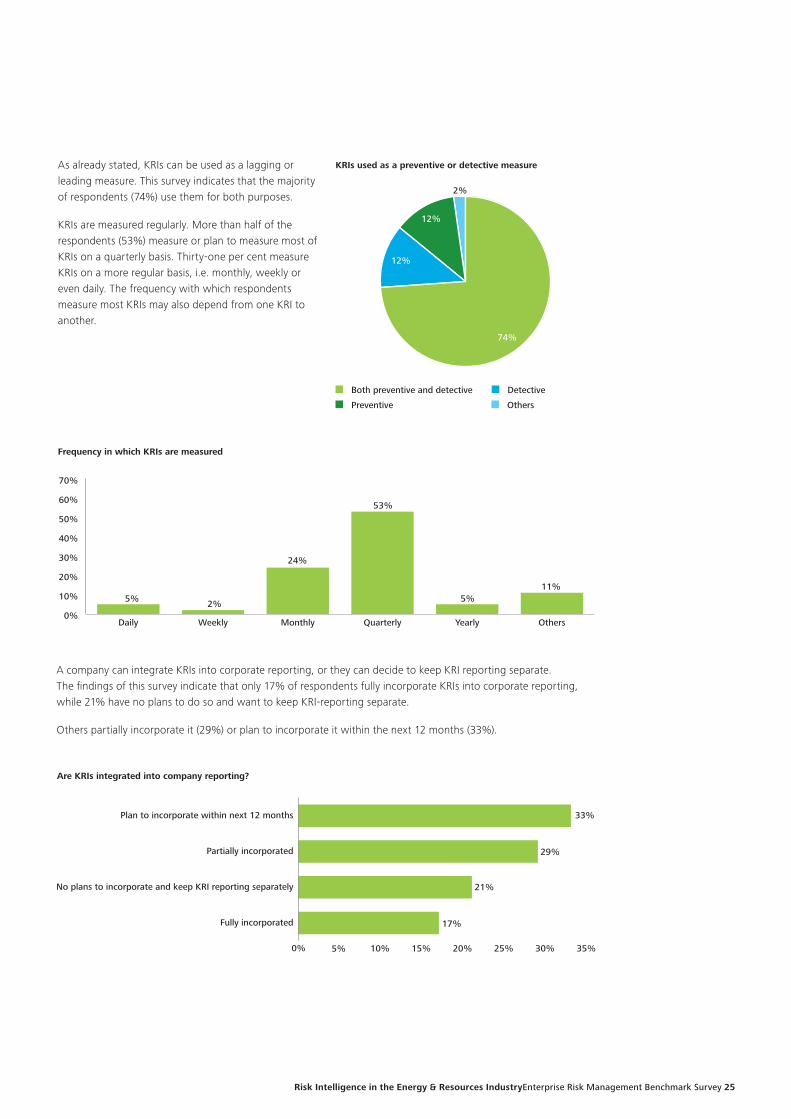
As already stated, KRIs can be used as a lagging or leading measure. This survey indicates that the majority of respondents (74%) use them for both purposes.
KRIs are measured regularly. More than half of the respondents (53%) measure or plan to measure most of KRIs on a quarterly basis. Thirty‑one per cent measure KRIs on a more regular basis, i.e. monthly, weekly or even daily. The frequency with which respondents measure most KRIs may also depend from one KRI to another.
KRIs used as a preventive or detective measure
12%
12%
Both preventive and detective Detective
Preventive Others
74%
2%
Frequency in which KRIs are measured
5% 2%
24%
53%
5%11%
0%
10%
20%
30%
40%
50%
60%
70%
OthersYearlyQuarterlyMonthlyWeeklyDaily
A company can integrate KRIs into corporate reporting, or they can decide to keep KRI reporting separate. The findings of this survey indicate that only 17% of respondents fully incorporate KRIs into corporate reporting, while 21% have no plans to do so and want to keep KRI‑reporting separate.
Others partially incorporate it (29%) or plan to incorporate it within the next 12 months (33%).
0% 5% 10% 15% 20% 25% 30% 35%
Fully incorporated
No plans to incorporate and keep KRI reporting separately
Partially incorporated
Plan to incorporate within next 12 months
Are KRIs integrated into company reporting?
33%
29%
21%
17%
Risk Intelligence in the Energy & Resources IndustryEnterprise Risk Management Benchmark Survey 25

To start a new section, hold down the apple+shift keys and click
to release this object and type the section title in the box below.
Most respondents (66%) do not have an escalation procedure for when a particular KRI threshold is exceeded.
Despite the fact that KRIs are in general widely used, there are still some challenges. The major challenge is to define objective and measurable KRIs. Secondly, 39% of respondents indicated that capturing relevant data for KRIs is also difficult. The third main challenge is to monitor KRIs, namely to easily understand and communicate/report them.
0% 10% 20% 30% 40% 50% 60%
Defining: auditable KRIs
Monitoring: compare KRIs overtime and across business
Capturing data: cost-effectivedata collection for KRIs
Monitor: easily understand andcommunicate/report KRIs
Capturing data: relevant data for KRIs
Defining: objective and measurable KRIs
Main challenges concerning KRIs
52%
39%
29%
28%
25%
20%
The main KRIs that companies report on at a corporate level on a regular basis depends heavily on the industry in which the company operates. Some KRIs, such as financial risks, operational risks, health and safety risks, investment risks and compliance risks are seen across many industries, whereas others are more specific to a certain industry, e.g. death rate per million tons of raw coal production, or motor vehicle incidence frequency.
Respondents assess themselves as more mature on governance and process than on the people or technology capability componentsImplementing an ERM program starts with governance. The first task is to defining and document the ERM policy, as well as define the roles and responsibilities of risk management.
The respondents with the most mature ERM programs have clearly defined and documented the roles and responsibilities required to manage risks. More immature ERM programs, referring to emerging ERM programs i.e. those under development, also strive for adequate power and independence to execute their tasks and build credibility.
The integration of risk management with other management practices (e.g. performance management or process management, quality management, compliance, etc.) is still in development in most organizations. The same goes for the integration of ERM in goal‑setting and the decision‑making processes. Furthermore, it can be stated that, in general, risk appetite (risk averse, risk neutral or risk seeking) is not yet clearly defined at a corporate or business unit level.
26

To start a new section, hold down the apple+shift keys and click
to release this object and type the section title in the box below.
Comparison of the governance maturity level with other capability components leads to the observation that governance is, together with the process capability component, the more mature element.
Governance maturity statement per quartile
Integrated ERM framework/methodology
Adequate resources are used
Written ERM policy
Defined roles & responsibilities
Defined risk appetite
ERM considers the down & upside of risk
ERM integrated with other practices/methodologies
ERM integrated in goal setting &management decision making
Balanced top-down & bottom-up approach is used
ERM has adequate power
Q1Q2
Q3Q4
Tribal & Heroic Specialist Silos Top-Down Systematic Risk intelligent
How to read the maturity assessmentsRespondents have assessed themselves based on the Deloitte maturity model:
Source: Deloitte Risk Intelligence Maturity model™
Ad‑hoc/chaotic Depends primarily on individuals Heroics capabilities and verbal wisdom
1: Tribal & Heroic 2: Specialist silos 3: Top‑Down 4: Systematic 5: Risk Intelligent
Reaction to adverseevents by specialists Discrete rolesestablished for smallset of risks Typically financeInsurance compliance
Tone set at the top Policies, procedures, risk authorities defined and communicated Business function Primarily qualitative Reactive
Integrated response toadverse events Performance‑linkedmetrics Rapid escalation Cultural transformation Underway Bottom‑up Proactive
Building into decision‑making Conformance withenterprise riskmanagementprocesses isincentivized Intelligent risk‑taking Sustainable Risk management is everyone’s job
The figure above illustrates the five maturity steps from the least mature (Tribal and Heroic) at the left to the most mature (Risk Intelligent) at the right. The same maturity levels are represented in the diagram above representing the results of the maturity assessments, ranging from the least mature in the center, to the most mature on the outside.
The questions asked are represented on the various axes of the figure. At each extremity, reference was made to a summarized version of the question.
Risk Intelligence in the Energy & Resources IndustryEnterprise Risk Management Benchmark Survey 27

To start a new section, hold down the apple+shift keys and click
to release this object and type the section title in the box below.
Each white dotted line represents a quartile of respondents. Q4 (quartile 4) corresponds to the 25% of lowest maturity responses, Q3 to the 25% of second lowest maturity responses, Q2 corresponds to the 25% of second highest maturity responses, and Q1 corresponds to the 25% of highest maturity responses. To illustrate this, in exhibit ‘Governance Maturity per Quartile’, the top 25% of performers (Q1) assessed themselves as risk‑intelligent with respect to the ‘Integrated ERM framework/methodology’. With respect to ‘written ERM policy’, the top 50% (Q1 and Q2) indicated having the highest maturity.
28

To start a new section, hold down the apple+shift keys and click
to release this object and type the section title in the box below.
Do you have a clearly defined ERM process to execute?
27%
4%
Yes Partially No
69%
Do you have clearly documented ERM procedures to execute the ERM process?
28%
8%
Yes Partially No
64%
Most organizations wait to formally document their risk management processes until they have become more or less stable. Once the ERM program is fully operational and at high maturity, almost all organizations have clearly defined risk management processes and procedures (89%), while the remaining 11% have partially defined risk management processes.
Risks are mostly assessed on an annual basisA large number of the respondents assess their risks on an annual basis (42%). Other usual assessment frequencies are: quarterly (24%), twice a year (15%) and on an ad hoc basis (9%). Four per cent of respondents assess risks monthly, while 5% assess risks when relevant to a specific issue.
Process
Risk management processes and procedures are clearly defined in a large majority of organizationsThe survey reveals that a majority of the respondents have a clearly defined risk management process (69%) and risk management procedures (64%) in place to execute the ERM process. The documentation of processes and procedures helps to ensure consistent enterprise‑wide risk management.
Risk Intelligence in the Energy & Resources IndustryEnterprise Risk Management Benchmark Survey 29

To start a new section, hold down the apple+shift keys and click
to release this object and type the section title in the box below.
Organizations with a high ERM maturity tend to assess their risks more frequently, by making use of KRIs as mentioned earlier: 11% of the more mature organizations do so on a monthly basis, whereas none of the less mature companies do this. This latter group performs assessment on an annual basis in 48% of cases.
As a side note, it should be noted that the frequency of assessment can vary depending on the nature of the risks. For operational risks, the frequency of assessment will typically be higher than for strategic risks.
Companies primarily rely on qualitative self‑assessments for their risk analysisMost respondents use more than one technique to analyze their risks. At the onset of risk management, organizations primarily rely on qualitative self‑assessments. As maturity grows, organizations tend to invest in quantitative techniques to complement qualitative assessments.
The vast majority of the respondents (88%) currently use qualitative self‑assessments to perform risk analyses. Self‑assessments require little development as the risk information entered is usually provided by business experts, who assess the risks based on their experience. Therefore, organizations usually start by implementing self‑assessment techniques before moving to more sophisticated techniques.
Other common techniques are scenario analysis (64%), probabilistic analyses (52%), and economic metrics (51%):
• probabilistic analyses are used to estimate uncertainty in the values of input parameters by using statistical distributions;
• two interpretations of risk scenario analysis currently exist: Sensitivity/probabilistic analysis (e.g. Lognormal/Weibull distributions with Monte Carlo simulations) which is the most commonly used and well developed, and the modeling of interactions and interdependencies between different risks, which is less commonly used/well developed; and
• economic metrics include value at risk, earnings at risk and cash flow at risk, all of which provide financial evaluation of risk situations.
From these popular methods, probabilistic risk analytics is the method that most organizations plan to use (20%), followed by economic metrics (19%). Less commonly used methods are third party assessments and failure mode and effects analysis.
Surprisingly, predictive risk analytics are not widely used in practice, despite the potential to create great value for organizations. Big data is an area companies need to investigate further to better assess root causes and prevent risks from occurring.
Surprisingly, predictive risk analytics are not widely used in practice despite the potential to create great value for the organization. Big data is an area companies need to investigate further to better assess root causes and prevent risks from occurring.
Frequency of entreprise risk assessments
0%
5%
10%
15%
20%
25%
30%
35%
40%
45%
OthersAd hocAnnuallySemi-annuallyQuarterlyMonthly
4%
9%5%
24%
15%
42%
30

To start a new section, hold down the apple+shift keys and click
to release this object and type the section title in the box below.
Risk analysis methods and methodologies
0% 20% 40% 60% 80% 100%
Others
Predictive risk analytics
Failure mode and effects analysis
Third party assessments
Stress-test
Industry benchmark/loss experience
Key risk indicators
Probabilistic analysis
Economic metrics
Scenario analysis
Self-assessments
Currently in use Plan to use Plan to incorporate in next 12 months No plans to incorporate
88%
4% 5%3%
64% 15% 11% 10%
51% 18%
4%
27%
51% 13% 6% 30%
50% 11% 23% 16%
46% 15% 10% 29%
38% 13% 12% 37%
37% 10%
3%
50%
33% 7%
4%
56%
25% 75%
28% 20% 8% 44%
Two‑thirds of the respondents currently use quantitative risk analysis methodsA majority of the respondents use quantitative risk analysis (65%).
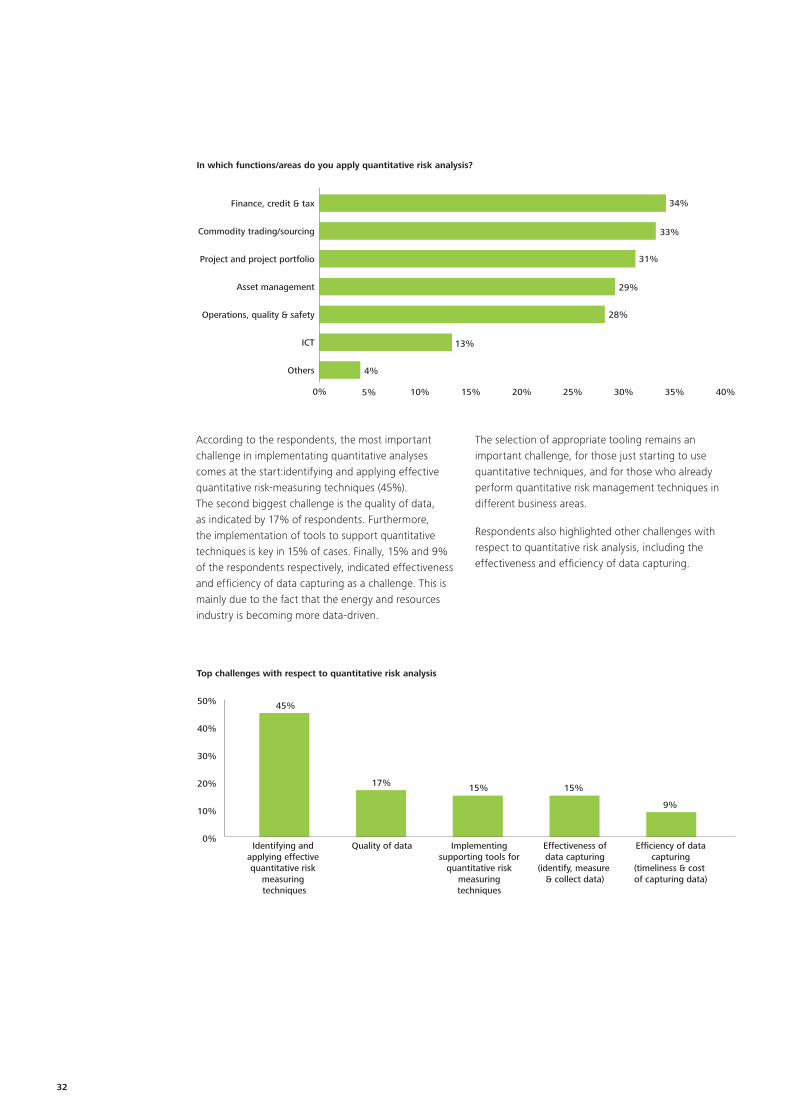
Quantitative risk analyses are used most in finance, credit and tax; commodity trading and sourcing; project and project portfolio; asset management; and operational quality and safety.These techniques are most frequently used in areas such as finance, credit and tax (34%), commodity trading and sourcing (33%), project and project portfolio (31%) asset management (29%) and operational quality and safety (28%). ‘Measurable’ business areas such as finance and commodity trading appear to be the primary drivers for developing quantitative risk analysis techniques. Not surprisingly, a longer history of risk management exists in these business areas. Once implemented in these areas, quantitative techniques are often applied to other business domains.
Do you use quantitative risk analysis methods in your company?
28%
Yes No
64%
Risk Intelligence in the Energy & Resources IndustryEnterprise Risk Management Benchmark Survey 31
To start a new section, hold down the apple+shift keys and click
to release this object and type the section title in the box below.
Top challenges with respect to quantitative risk analysis
0%
10%
20%
30%
40%
50% 45%
17% 15%15%
9%
Quality of dataIdentifying and applying effective quantitative risk
measuring techniques
Implementingsupporting tools for
quantitative riskmeasuringtechniques
Effectiveness ofdata capturing
(identify, measure & collect data)
Efficiency of datacapturing
(timeliness & cost of capturing data)
According to the respondents, the most important challenge in implementating quantitative analyses comes at the start:identifying and applying effective quantitative risk‑measuring techniques (45%). The second biggest challenge is the quality of data, as indicated by 17% of respondents. Furthermore, the implementation of tools to support quantitative techniques is key in 15% of cases. Finally, 15% and 9% of the respondents respectively, indicated effectiveness and efficiency of data capturing as a challenge. This is mainly due to the fact that the energy and resources industry is becoming more data‑driven.
0% 5% 10% 15% 20% 25% 30% 35% 40%
Others
ICT
Operations, quality & safety
Asset management
Project and project portfolio
Commodity trading/sourcing
Finance, credit & tax
In which functions/areas do you apply quantitative risk analysis?
34%
33%
31%
29%
4%
13%
28%
The selection of appropriate tooling remains an important challenge, for those just starting to use quantitative techniques, and for those who already perform quantitative risk management techniques in different business areas.
Respondents also highlighted other challenges with respect to quantitative risk analysis, including the effectiveness and efficiency of data capturing.
32

To start a new section, hold down the apple+shift keys and click
to release this object and type the section title in the box below.
Organizations capture quantitative data through incident and condition monitoring systems, and by paper formatWith respect to the techniques used to capture quantitative data, respondents noted that incident monitoring systems (81%), condition monitoring systems (70%) and paper format (66%) are the most frequently used.
Currently, most of these techniques are developed to capture historic data (e.g. about incidents). It is important to note here the significant increase (on average 40%) in companies using automated data capturing‑systems, compared to 2009.
Capturing data for quantitative risk analysis
0% 20% 40% 60% 80% 100%
Hand held devices for incident logging
Statistical sampling techniques
Automated logging systems
Mandatory fields for incident logging
Paper format
Condition monitoring systems
Incident monitoring systems
Currently in use Plan to use Plan to incorporate in next 12 months No plans to incorporate
80.9% 6.4%
2.1%
10.6%
70.2% 10.6% 19.1%
21.4% 9.5%
4.8%
64.3%
37.2% 18.6% 39.5%
4.7%
38.6% 11.4% 9.1% 40.9%
50% 33.3%9.5% 7.1%
65.9% 7.3% 24.4%
2.4%
Risk Intelligence in the Energy & Resources IndustryEnterprise Risk Management Benchmark Survey 33

To start a new section, hold down the apple+shift keys and click
to release this object and type the section title in the box below.
Organizations have a clear process for the identification, evaluation and mitigation of riskGenerally, respondents assessed themselves fairly highly on process maturity. The identification, evaluation and documentation of risks have become mature risk management activities. The lowest process maturity levels were assigned to monitoring aspects of the risk management process, as well as auditing the process itself.
The implementation of KRIs does not seem, as yet, to be a commonly used risk monitoring practice, although it is used more widely than in 2009.
Process maturity statement per quartile
All important risks are identified
KRIs are in place
Identified risks are documented
Risks are evaluated and prioritized
Risk mitigation plans are designed
ERM process is audited
Efficiency & effectiveness is monitored
Periodical reporting is in place
Risk limits are monitored
Tribal & Heroic Specialist Silos Top-Down Systematic Risk intelligent
Q1 Q2Q3
Q4
Generally, respondents assessed themselves fairly highly on process maturity.
34

To start a new section, hold down the apple+shift keys and click
to release this object and type the section title in the box below.
People
Few organizations train all employees in ERMAlthough training is recognized as an important contributor to the creation of a risk‑aware culture, a significant number of respondents (17%) do not have a structured training plan in place.
0% 10% 20% 30% 40% 50%
Not applicable
All employees
Don't know (no structured training plan)
Only specialists who perform specificrisk management activities
All employees directly involvedin risk management activities
Who receives ERM training?
47%
22%
17%
9%
6%
Approximately 78% of the respondents stated that their organizations do have a structured training plan. Of those, the greatest number (47%) focus their efforts on the employees that are directly involved in risk management activities. Twenty‑two per cent of respondents stated that their organization trains only those specialists who perform specific risk management functions. Few organizations extended ERM training to all employees (9%).
Organizations that consider themselves to be better versed in risk management involve more employees in an ERM training program and vice versa. Of those respondents stating that their organizations train all employees or all employees involved in risk management, the majority assesses their ERM maturity as being above the average. Among the organizations that only train risk specialists or have no structured training plan, only a small number assessed their ERM maturity as above average.
Top challenge with respect to embedding ERM in the organization
31%
17%
Culture change is the main target of all efforts
Change people behavior through reinforcement bymanagement
Having clear ERM processes and procedures
52%
Organizations that consider themselves to be better prepared in risk management involve more employees in an ERM training program and vice versa.
Culture change is the top challenge while embedding ERMDespite the fact that most organizations have a structured training plan, there are still some challenges with respect to embedding ERM in an organization. There are three major challenges: first, making a culture change is the main objective of all efforts (52%); second, changing staff behavior through a top‑down approach from management (31%); and third, the need to have a clear ERM process and procedures (17%) in place.
Risk Intelligence in the Energy & Resources IndustryEnterprise Risk Management Benchmark Survey 35

To start a new section, hold down the apple+shift keys and click
to release this object and type the section title in the box below.
Organizations have a strong focus on ERM skills and knowledge, and best practice is well knownRespondents assessed the people‑related aspects of ERM very differently. On the one hand, respondents gave themselves high scores for ERM knowledge and best practice indicated a high degree of specialization. These respondents feel comfortable with defined roles and responsibilities. Promoting and communicating the benefits of a risk culture to employees is widely in practice, and something that leading organizations excel at.
On the other hand, some aspects of people maturity were deemed to be less developed: the existence of risk job descriptions and the link between ERM and incentives for bonus programs appears to be ripe for improvement, as does the integration of ERM in the training curriculum. The latter might result from the earlier finding that most organizations opt to train only a limited number of people in risk management. In the majority of the responding organizations, only the people who directly perform risk management activities are involved in an ERM training program.
People maturity statement per quartile
People have skills & knowledge
Risk culture is promoted
People understand their responsibilities
Communication is in place
Risk job descriptions exist
ERM is integrated in incentive and bonus programs
ERM is integrated in training
Company knows ERM best practices
Q1Q2
Q3Q4
Tribal & Heroic Specialist Silos Top-Down Systematic Risk intelligent
36

To start a new section, hold down the apple+shift keys and click
to release this object and type the section title in the box below.
Technology
A majority of respondents do not have ERM software or tools to support the ERM processFifty‑six per cent of respondents indicated that their organizations are not using a risk management tool to support the ERM process. However, some respondents stated that their ERM tool is still in the implementation phase.
The more mature an organization becomes regarding ERM, the more important having tools to support this ERM process becomes. This conclusion can also be derived from the responses to this question: companies with a high ERM maturity, have supporting technology in 78% of cases.
Of those who are using ERM software, only 24% are using off‑the‑shelf tools, while most of the respondents modified an acquired tool (46%) or built tools in‑house (30%), mainly for company‑tailoring or cost‑efficiency purposes.
When acquiring a tool, most respondents did so because of knowledge (37%), cost‑efficiency (25%) and support (13%). Other reasons included the need to use the same tool/software as a parent company.
In the early stages of the development of an ERM system, organizations focus on the development of a tailored ERM methodology. Once this methodology is fine‑tuned, attention is paid to an appropriate supporting tool. An ERM tool is definitely an important leverage for ERM maturity.
ERM tool built in-house or acquired
30%
24%
Acquired and modified
Built in-house
Acquired
46%
ERM tool built in-house or acquired
28%
7%
ERM coordinators
Champions cross the business
Every employee
Others
61%
4%
ERM coordinators mainly have access to the ERM toolFor the companies that do use a tool or software, the ERM coordinators (61%) or the ERM champions across the business (28%) have access to the tool. Only in a very small number (7%) of cases does every employee have access. ‘Others’ may include subject matter experts from specialized functions.
Risk Intelligence in the Energy & Resources IndustryEnterprise Risk Management Benchmark Survey 37

To start a new section, hold down the apple+shift keys and click
to release this object and type the section title in the box below.
Overall, the ERM tool is used to support all ERM activitiesThe use of an ERM tool has many benefits. It contributes to a uniform application of risk management among business units and functions and allows the processing of large amounts of data into company‑wide risk monitoring tools and reports. It is mainly in these two areas that a high‑performing, user‑friendly risk management tool can prove its worth.
Respondents with an ERM tool indicated that their organizations use the tool to assess (33%), document (29%), report (26%), monitor (25%) and mitigate (24%) risk and control activities. Tooling can especially help make monitoring and risk reporting more efficient and effective, and hence drive the development of the final stages in the ERM process (which respondents indicated as the least developed aspect of the risk management process).
The connection with other key management activities has not yet been madeOnly 21% of respondents indicated using their ERM tool to integrate risk management with other functions, such as Internal Audit (15%), compliance (12%) and process management (8%). Some companies also use it to support environmental health and safety (6%) or other functions (6%) such as more specific SOX compliance requirements. Only a few organizations (3%) leverage their risk management tool to integrate risk management with performance management.
This might mean that not all value is captured from existing synergies between ERM and other management practices.
0% 5% 10% 15% 20% 25% 30% 35%
Others
Mitigating: Action tracking
Monitoring: Monitor risks/control activities
Reporting: Report risks/control activities
Identifying: Document risks/control activities
Assessing: Assess risks/control activities
ERM activity(ies) is (are) performed using an ERM tool(s)
33%
30%
27%
25%
24%
1%
The use of an ERM tool has many benefits. It contributes to a uniform application of risk management among business units and functions and allows the processing of large amounts of data into company‑wide risk monitoring tools and reports.
38
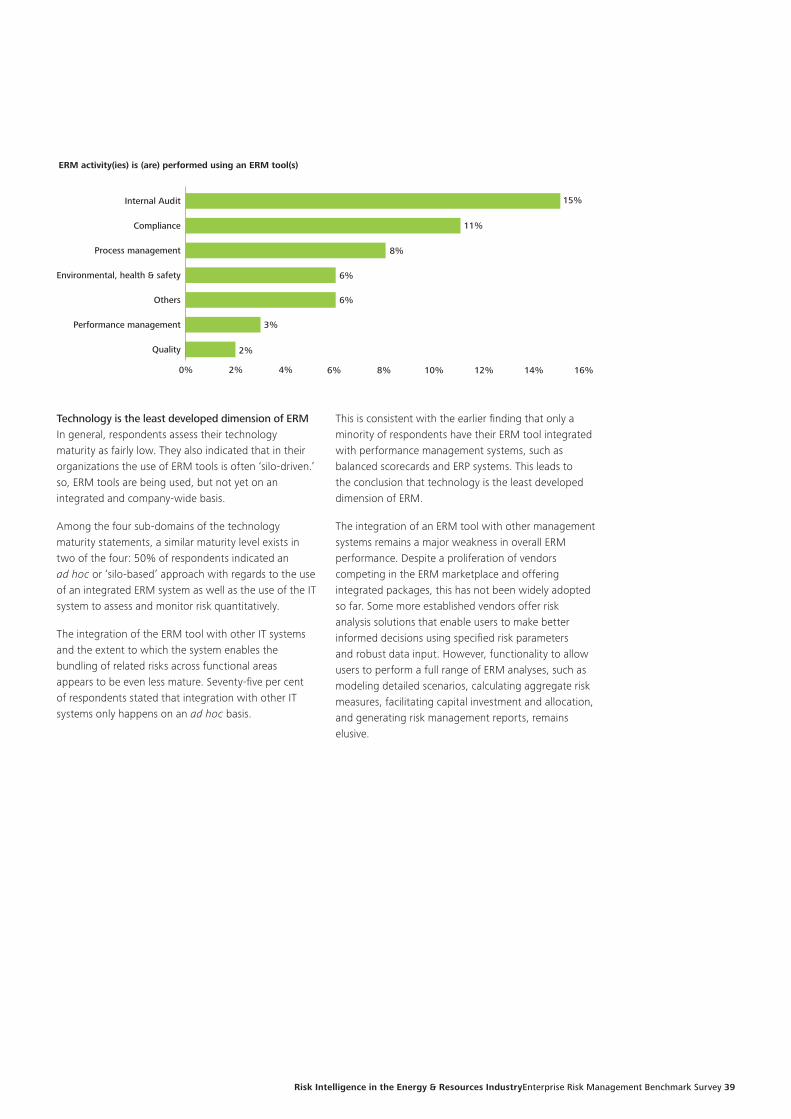
To start a new section, hold down the apple+shift keys and click
to release this object and type the section title in the box below.
Technology is the least developed dimension of ERMIn general, respondents assess their technology maturity as fairly low. They also indicated that in their organizations the use of ERM tools is often ‘silo‑driven.’ so, ERM tools are being used, but not yet on an integrated and company‑wide basis.
Among the four sub‑domains of the technology maturity statements, a similar maturity level exists in two of the four: 50% of respondents indicated an ad hoc or ‘silo‑based’ approach with regards to the use of an integrated ERM system as well as the use of the IT system to assess and monitor risk quantitatively.
The integration of the ERM tool with other IT systems and the extent to which the system enables the bundling of related risks across functional areas appears to be even less mature. Seventy‑five per cent of respondents stated that integration with other IT systems only happens on an ad hoc basis.
This is consistent with the earlier finding that only a minority of respondents have their ERM tool integrated with performance management systems, such as balanced scorecards and ERP systems. This leads to the conclusion that technology is the least developed dimension of ERM.
The integration of an ERM tool with other management systems remains a major weakness in overall ERM performance. Despite a proliferation of vendors competing in the ERM marketplace and offering integrated packages, this has not been widely adopted so far. Some more established vendors offer risk analysis solutions that enable users to make better informed decisions using specified risk parameters and robust data input. However, functionality to allow users to perform a full range of ERM analyses, such as modeling detailed scenarios, calculating aggregate risk measures, facilitating capital investment and allocation, and generating risk management reports, remains elusive.
0% 2% 4% 6% 8% 10% 12% 14% 16%
Quality
Performance management
Others
Environmental, health & safety
Process management
Compliance
Internal Audit
ERM activity(ies) is (are) performed using an ERM tool(s)
15%
11%
8%
6%
6%
3%
2%
Risk Intelligence in the Energy & Resources IndustryEnterprise Risk Management Benchmark Survey 39
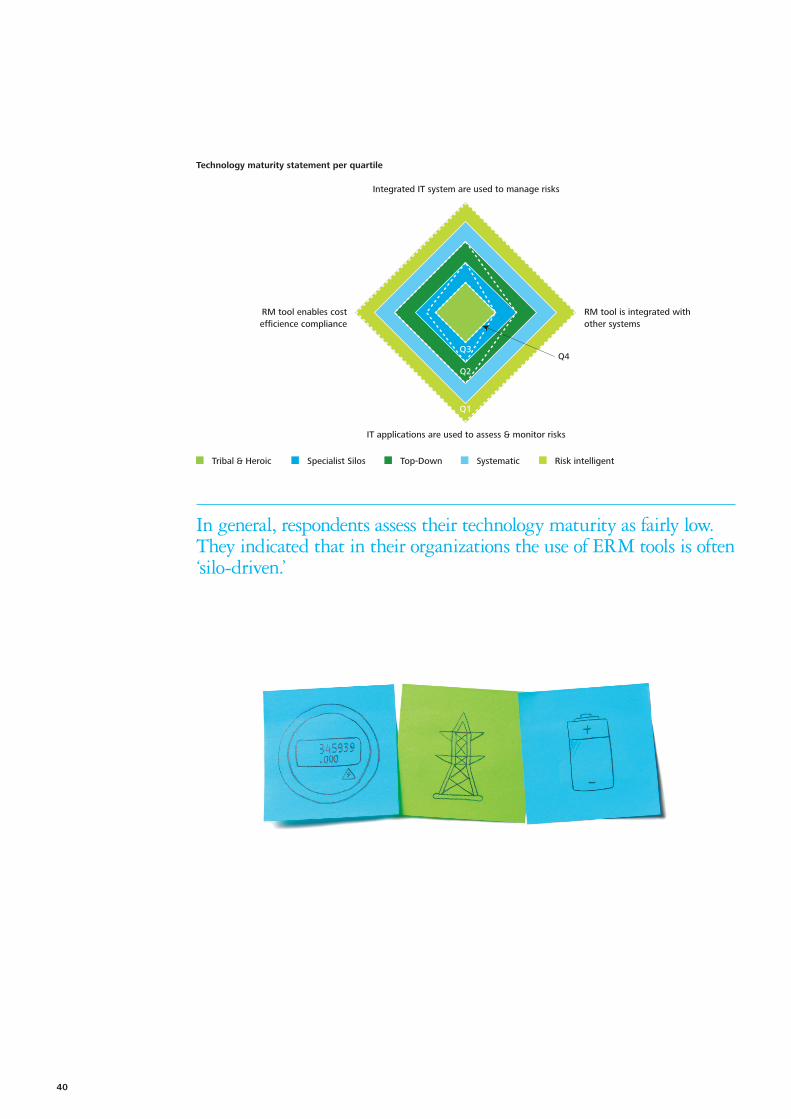
To start a new section, hold down the apple+shift keys and click
to release this object and type the section title in the box below.
Technology maturity statement per quartile
Integrated IT system are used to manage risks
IT applications are used to assess & monitor risks
RM tool is integrated with other systems
RM tool enables cost efficience compliance
Q1
Q3
Q2
Q4
Tribal & Heroic Specialist Silos Top-Down Systematic Risk intelligent
In general, respondents assess their technology maturity as fairly low. They indicated that in their organizations the use of ERM tools is often ‘silo‑driven.’
40

To start a new section, hold down the apple+shift keys and click
to release this object and type the section title in the box below.
Governance
Risk Intelligence To Create &
Preserve Value
Sustain &ContinuouslyImprove
Developand DeployStrategies
Monitor,Assure &Escalate
Design& TestControls
Respondto Risks
Assess and MeasureRisks
IdentifyRisks
Deloitte ERM capability model™
Peop
le
Technology
Process
Conclusion
This benchmarking survey has been structured around the four capabilities of the Deloitte ERM Capability Model:
The survey reveals that, for the governance capability, a vast majority of respondents have an ERM program in place, together with a formal risk management organization. Responsibility for the ERM program has generally been assigned to the Chief Financial Officer, the Chief Risk Officer or the Chief Executive Officer. In addition, 75% of respondents have established a risk committee within their organization, mainly consisting of members of the Management Committee or the Board of Directors.
Operational performance and regulatory compliance are the main drivers in organizations whose ERM programs are at the early stages of maturity, while strategic considerations have emerged strongly in recent years. The primary drivers of ERM within the surveyed organizations are the Board of Directors and the Management Committee. Major benefits of an ERM program, according to the respondents, are: creating a risk‑aware culture and enabling focus on the risks that matter most through integrated management reporting. On the other hand, the main reason for not having a formal risk management organization is that ERM is not high enough on the agenda of the Board of Directors, Audit Committee and Management Committee.
Most of the respondents have structured their risk management organization in a hybrid format, combining the advantages of centralized and decentralized structures. Many respondents have, at least partially, integrated or plan to systematically integrate risk management into their decision‑making process, which could increase the understanding of the benefits of an ERM program at the Management Committee level.
A major part of a company’s internal audit uses a risk‑based audit plan. This audit plan is mainly based on a combination of both residual and inherent risk levels.
The use of KRIs, both lagging and leading, has been at least partially incorporated within ERM. The significance of using KRIs is mainly for increasing the frequency of risk assessment and for monitoring purposes to include a quantitative dimension, complementary to more qualitative risk assessments and analyses. More than half of the respondents apply KRIs in operational quality and safety, and incorporating them within the finance, credit and tax area is also popular. These KRIs are often measured at a regular frequency. The major challenges in the use of KRIs are defining objective and measurable KRIs and collecting relevant data for KRIs.
Risk Intelligence in the Energy & Resources IndustryEnterprise Risk Management Benchmark Survey 41

To start a new section, hold down the apple+shift keys and click
to release this object and type the section title in the box below.
Taking a closer look at the process capability component, this survey indicates that the majority of the participating companies have clearly defined risk management processes and procedures in place to execute the ERM process. Most respondents use more than one technique to assess their risks. At the onset of risk management, organizations primarily rely on qualitative self‑assessments. As maturity grows, organizations tend to invest in quantitative techniques to complement qualitative assessments. The main challenges in using these quantitative risk analyses are identifying and applying the correct technique, as well as the quality of data.
Concerning the people aspect, approximately three‑quarters of the correspondents stated that their organizations do have a structured training plan for embedding ERM. However, there are still some challenges, namely achieving company‑wide cultural change and changing people’s behavior.
Regarding the technology capability component, a small majority of participants do not have ERM software or tools to support the ERM process. This may be because in the early stages of an ERM system, organizations tend to focus on the development of a tailored ERM methodology. Once this methodology is fine‑tuned, attention is then paid to appropriate supporting tools and software, or connecting with other key management activities such as Internal Audit or process management.
This survey indicates that the majority of the participating companies have clearly defined risk management processes and procedures in place to execute the ERM process. Most respondents use more than one technique to assess their risks. At the onset of risk management, organizations primarily rely on qualitative self‑assessments. As maturity grows, organizations tend to invest in quantitative techniques to complement qualitative assessments.
42

To start a new section, hold down the apple+shift keys and click
to release this object and type the section title in the box below.
Top energy and resources risks
Respondents indicated the top 10 risks faced by their company. Results are broken down by Industry/sub‑segment:
• Generation and supply/trading companies;
• System operators (transportation and distribution of electricity and gas);
• Oil and gas (upstream and downstream);
• Water (production, distribution, sewerage and treatment); and
• Mining (extraction, production and treatment of metals and minerals).
Power and utilities – Generation and supply/trading
Regulatory risk, followed by operational safety risk, topped the list for generation and supply/trading companies in power and utilities. Then came market risk and operation efficiency risk.
The “other” risks mentioned (ranked by importance) were: political risk, liquidity, outsourcing, construction, supply chain and project development risks.
Commodity trading risk
Credit risk
Information security risk
Brand and reputation risk
Business continuity risk
Asset performance risk
Operation efficiency risk
Market risk
Operational Safety risk
Regulatory risk
46%
46%
50%
50%
58%
58%
69%
69%
73%
73%
0% 10% 20% 30% 40% 50% 60% 70% 80% 90% 100%
Top energy & resources risks – Generation & supply/trading companies
Regulatory risk, followed by operational safety risk topped the list for generation and supply/trading companies in power and utilities.
Risk Intelligence in the Energy & Resources IndustryEnterprise Risk Management Benchmark Survey 43

To start a new section, hold down the apple+shift keys and click
to release this object and type the section title in the box below.
Power and utilities – System operators
When looking at the major risks amongst system operators, regulatory comes out top. Most of these companies are working in a heavily regulated environment, with the regulator setting prices for the services they provide. The second ranked risk is operational safety risk, directly followed by asset persformance risk.
“Other” risks mentioned included: stakeholder and labor union relationships, technology security and integrity, pension funds and outsourcing.
Top energy & resources risks – System operators
0% 20% 40% 60% 80% 100%
Compliance risk
Brand and reputation risk
Environmental risk
Business continuity risk
People and talent risk
Operation efficiency risk
Information security risk
Asset performance risk
Operational Safety risk
Regulatory risk
41%
41%
47%
47%
53%
59%
71%
71%
76%
100%
Oil and gas
For oil and gas companies, regulatory risk also topped the list. Operational safety risk and market risk came second and third respectively.
“Other” risks mentioned included: political, raw material sourcing, liquidity, construction/operational, corporate growth and supply chain risks.
Top energy & resources risks – Oil & gas
0% 10% 20% 30% 40% 50% 60% 70% 80% 90% 100%
Compliance risk
Operation efficiency risk
Asset performance risk
People and talent risk
Environmental risk
Brand and reputation risk
Business continuity risk
Market risk
Operational Safety risk
Regulatory risk
43%
43%
43%
43%
50%
57%
57%
71%
79%
86%
44

To start a new section, hold down the apple+shift keys and click
to release this object and type the section title in the box below.
Water
For water companies, regulatory risk comes first, followed by product quality, operation efficiency and business continuity. This ranking relates to a more limited number of respondents than for the other industries introduced in this top risk analysis.
An additional risk raised was supplier dependancy.
Mining
For mining companies, a high number of “other” risks (i.e. falling outside the defined categories) were listed by the participants. After analysis, we regrouped some of these into meaningful risk categories. The ranking shown in the chart represents the top risks for mining companies after reclassification.
Environmental risk topped the list followed by people and talent. Project risk (as a newly defined category) appears third, closely followed by operational safety risk.
Other newly defined risk categories included: political, cost control, supply chain, resources access, stakeholder, third‑party, community and labour unions relationships, financial resources, construction and operations, and tax risks.
Top energy & resources risks – Mining
Bribery or corruption risk
Operational efficiency risk
Commodity trading risk
Market risk
Asset performance risk
Regulatory risk
Operational Safety risk
Project risk
People and talent risk
Environmental risk
38%
40%
40%
50%
56%
63%
69%
69%
75%
75%
0% 10% 20% 30% 40% 50% 60% 70% 80% 90% 100%
Top energy & resources risks – Water
0% 20% 40% 60% 80% 100%
Competition risk
Information security risk
Credit risk
Health risk
Environmental risk
Operational safety risk
Business continuity risk
Operation efficiency risk
Product quality risk
Regulatory risk
50%
50%
50%
50%
67%
67%
83%
83%
83%
100%
Risk Intelligence in the Energy & Resources IndustryEnterprise Risk Management Benchmark Survey 45
To start a new section, hold down the apple+shift keys and click
to release this object and type the section title in the box below.
General conclusion
Building the risk intelligent energy and resources enterprise
While the energy and resources industry may be leading the way in implementing ERM, there is still considerable room for improvement. Many energy and resources companies are asking the question: what will it take to move beyond our current stage of ERM?
This report should help energy and resources companies identify opportunities to move toward becoming a risk intelligent energy and resources Enterprise.
Some of the remaining challenges faced by energy and resources companies and suggestions for moving toward the Risk Intelligent Enterprise™ are discussed below.
Moving beyond the initial stageMany energy and resources companies have moved forward by performing enterprise risk assessments, implementing risk registers, developing risk treatment plans, and monitoring the status of certain high‑priority risk exposures.
Although some energy and resources companies have considered implementing most or all components of an ERM program at once, many have instead chosen an incremental approach. Starting with a few risk types or business units can provide opportunities to establish credibility and bolster support through early wins while gradually changing an enterprise’s culture and learning valuable lessons along the way.
The challenge is to turn this one‑off exercise, most often driven from the top‑down, into a continuous process. Key to overcoming this hurdle is the critical connection of the ‘top‑down’ identified risks with the operational risks that people encounter in their day‑to‑day activities. Once this is accomplished, risk management can be truly embedded into an organization, making it part of daily processes and operations. Structures need to be designed where operational risk information can fed up to the higher enterprise‑level risks required for informed “top‑down” management of the organization’s risks. In contrast, enterprise‑level risk information needs to be fed down, and translated into concrete activities on the work floor for effective ‘bottom‑up’ management of specific exposures. The ability to measure and manage risk exposures from both the top‑down and bottom‑up is critical to becoming a fully Risk Intelligent Enterprise™ – to build informed risk‑taking and information into relevant decision‑making throughout the organization.
Achieving enterprise wide coverageMany energy and resources companies have developed fairly robust approaches to manage a few risk types in isolation, including insurable hazard risks and readily quantifiable market (or price) risk and credit risk. Some also rely on relatively haphazard or unsophisticated quantitative and qualitative risk analysis techniques to address other risk types on an individual basis. Many energy and resources companies also focus their risk management activities on business units that are assumed to include the most significant risk exposures such as commodity trading.
Moving beyond a fragmented ERM capability involves expanding the coverage of risk management activities to encompass all material risk types and business units. Such an approach does not mean that all risk exposures are given equal consideration or are managed in the same way; rather, it means that an organization is able to make more informed, conscious decisions on which risks it should actively manage, and how it should manage them. For example, the organization may elect to self‑insure certain nonmaterial exposures depending on its overall risk profile and risk appetite.
Achieving greater coverage requires developing and applying different approaches to analyze and manage the readily quantitative risk types described above and the more qualitative strategic, political, legal, and regulatory risk types. For example, commodity trading business units may decide that individual transactions and risk exposures should be directly modeled, measured, reported, and monitored. In contrast, techniques such as scenario analysis may be appropriate for more qualitative risk types.
Incorporating risk into strategyBefore risk can be aggregated into strategy, risk across risk types and business units needs to be integrated and aggregated to provide a truly enterprise‑wide perspective.
Once the Board of Directors and senior management better understand how individual risk exposures – arising from each risk type and business unit – contribute to the enterprise’s aggregate risk exposure, they are positioned to use risk in a more strategic way. Relying on aggregate risk measures, energy and resources companies can incorporate risk into related management areas such as strategic planning, capital investment and allocation, and performance measurement. With a clear risk appetite and risk tolerance, the organization is guided to pursue new opportunities that create value for stakeholders.
46

To start a new section, hold down the apple+shift keys and click
to release this object and type the section title in the box below.
Build/enhance the ERM capabilityTo build/enhance the ERM capability, the ERM program should start its planning with the assessment of the organization’s ERM capability, relative to capability components that correspond to each stage in the capability maturity model, in order to establish a baseline. The outcome of this diagnostic should provide sufficient information to evaluate the nature and extent of gaps between the current and desired ERM capability maturity stages. It should also provide the relevant data to perform a cost‑benefit analysis for the ERM capability and prepare a business case. Milestones should be based on key attributes in the ERM capability maturity model so that the program team can effectively monitor and report on progress.
Enhance risk cultureMeasure and monitor risk culture effectiveness
Capabilities• Measure the effectiveness and influence of risk culture
• Detect deterioration of risk culture
• Identify cultural warning signs that increase the probability of a catastrophic event occurring
• Strengthen the culture to support risk‑informed decision making
Value• Provides an objective measurement of the risk culture effectiveness
• Identifies cultural factors that may contribute to a risk event
• Identifies warning signs that the culture may be deteriorating
• Identifies weaknesses to be addressed
• Identifies pockets of the organization that have gaps
• Enables proper focus of culture enhancement initiatives on the issues that matter most
• Enables regular, ongoing monitoring of risk culture effectiveness
• Monitors the impact of culture enhancement initiatives, safety programs, and other risk management capabilities
Incorporating risk into capital and performance activities through advanced measurement techniques can provide the Board of Directors and senior management with the necessary confidence to start deploying capital with the overarching objective of creating value rather than simply preserving value.
Cultivating a Risk Intelligent CultureThere is no “one size fits all” solution to risk management – how an organization manages risk should align with, and support, its strategy, business model, business practices, and risk appetite and tolerance. This is especially true in the energy and resources industry where significant risk‑based decisions are being made throughout organizations on a daily basis.
Essentially, a risk intelligent culture exists within an organization when its employees’ understanding and attitudes toward risk lead them to consistently make appropriate risk‑based decisions. Consequently, an organization’s risk culture drives the behaviors that influence day‑to‑day business practices, and is a significant indicator of whether the organization embodies the characteristics of a Risk Intelligent Enterprise™.
To a large degree, an organization’s culture determines how it manages risk when being under stress. For some organizations, their risk culture is a liability. For others, it facilitates both stability and a competitive advantage. To that end, an organization wishing to cultivate a Risk Intelligent Culture should first understand and measure its existing risk culture.
Although organizations recognize the importance of promoting risk culture, many have not established systems for continually monitoring changes in their risk culture and are therefore not in a position to proactively identify and respond to certain potential risks.
A way forward
Building the Risk Intelligent Energy & Resources Enterprise has proven to be a daunting task, even for energy and resources companies with the most advanced and sophisticated ERM capabilities. Given the scope and complexity of implementing the ERM capability and the diversity of starting points among most energy and resources companies, a flexible approach is probably most appropriate. Below is an approach for building/enhancing and sustaining the ERM capabilities that can be effective for many organizations along the ERM journey.
Building the risk intelligent energy and resources enterprise has proven to be a daunting task, even for energy and resources companies with the most advanced and sophisticated ERM capabilities.
Risk Intelligence in the Energy & Resources IndustryEnterprise Risk Management Benchmark Survey 47

To start a new section, hold down the apple+shift keys and click
to release this object and type the section title in the box below.
Sustain the ERM capabilityAs with most of today’s critical management capabilities, sustaining the ERM capability at most energy and resources companies will require a process of continuous improvement. Changes in prevailing conditions in the operating environment, the organization’s composition and objectives, or the expectations of key stakeholders may require additional effort to maintain the desired stage of ERM capability maturity. Moving to more advanced stages will likely involve an iterative process. Developing an ERM capability can require substantial effort as well as scarce resources and senior management attention.
The benefits and costs of moving from less‑advanced to more‑advanced stages of the ERM capability maturity model should be carefully considered before launching the program.
The energy and resources industry, alongside the financial services industry, keeps on fulfilling its role of early adaptor and pioneer in the ongoing evolution of the ERM capability towards becoming a truly Risk Intelligent Enterprise™.
Expanding the ERM capability
Risk quantificationUsing risk management to quantify business value is a leading strategic practice, and operational competency that could help optimize business performance. It is a practical way to incorporate risk management into the day to day strategic decision making process by quantifying the size of the opportunities and risks in order to help to create value and drive strategy. Furthermore, it helps to transition ERM from a top down process to a useable model driving services and operations. Examples hereof can be found in the field of asset integrity management, safety management and quality management.
Advanced risk analyticsComplex technical equipment operating in harsh environments, introduction of enhanced technologies and associated changes in operations, more frequent and more severe weather events, and a constantly changing competitive environment all contribute to risks growing exponentially, becoming more complex and elusive. While devastating events may seem to come out of the blue, close inspection reveals that there were detectable clues prior to the event. These clues may be hidden anywhere: safety and hazard reports; an obscure industry report; e‑mail messages; even internal social media tools. The techniques and tools of the past no longer suffice and are unable to anticipate 21st‑century risks. Immediate risk identification and analysis is needed. The solution is the ability to identify and link seemingly random, disconnected risks.
To address this need, leading companies are already employing concepts such as the Emerging Risk Analysis and Sharing Center (eRASC). These centers are capable of continuously scanning the environment, pulling together both internal and external data, structured numerical data and unstructured text‑based information, real‑time data and historical data, which makes them able to identify, analyze, and communicate risks in their emergent phase.
Using risk management to quantify business value is a leading strategic practice, and operational competency that could help optimize business performance. It is a practical way to incorporate risk management into the day to day strategic decision making process by quantifying the size of the opportunities and risks in order to help to create value and drive strategy. Furthermore, it helps to transition ERM from a top down process to a useable model driving services and operations. Examples hereof can be found in the field of asset integrity management, safety management and quality management.
48
To start a new section, hold down the apple+shift keys and click
to release this object and type the section title in the box below.
Risk modeling and simulationQuantitative techniques to manage low probability/high impact risks
Emerging risk identificationPredict changes in risk likelihood and impact and identify emerging risks
Capabilities• Identify risk events and scenarios
affecting design and operations
• Develop the likelihoods and associated uncertainties of the events or scenarios
• Understand the consequences that could result from these events or scenarios
Capabilities• Identify indicators of potential risk events
• Identify emerging risks and trends that can contribute to catastrophic risks
• Drill down analysis and identification of unique sources
Value• Reduced uncertainties in engineering and
operations
• Verified and quantified risk events and prioritization of risk mitigation actions
• Understanding and characterization of the interdependencies among human interface, environment, systems, and equipment
• Common risk analysis method supporting communication and integration of risk‑informed decisions across engineering, operations, safety, and management
• Quantitative techniques to support risk‑informed decision making for low probability/high impact risks
Value• Competitive advantage through the
identification of emerging risks in changing environments
• Forward‑looking insights into risks by continuously scanning and analyzing external and internal information sources
• Appropriate resource allocation based on prioritization across risks via a holistic, cross‑sectional view
• Techniques to identify the unknown low probability/high impact risks
Translating massive amounts of data into useful information enables informed decisions on risk. Tools and technologies are rapidly evolving to enable us to analyze what our systems are telling use. Advances in semantic analysis and artificial intelligence enable us to ‘listen’ to the environment, detect early signals, and create structured data out of text.
Probabilistic risk assessment techniques aid in determining the probability of inherently uncertain risks including detailing initiating events and potential severity. Safety culture surveys allow measurement and monitoring of the risk culture such as people’s ability to detect new and emerging risks, to escalate warning, to question when something seems out of place, and their understanding of the risks within their work and propensity to actively manage those risks as they evolve.
Modeling and simulation techniques allow the development of causal models incorporating interdependencies and feedback loops to identify emergent behaviors and unintended consequences of changes in complex systems. New, easy‑to‑use data visualization software is making it easier than ever to create real‑time dashboards of timely and actionable information.
Risk Intelligence in the Energy & Resources IndustryEnterprise Risk Management Benchmark Survey 49

To start a new section, hold down the apple+shift keys and click
to release this object and type the section title in the box below.
Contact us
Authors
BelgiumLaurent Vandendooren Deloitte Bedrijfsrevisoren BV o.v.v.e. CVBA Risk Intelligence Leader Enterprise Risk Services +32 2 800 22 81 [email protected]
Laurent Vandendooren is a partner at Deloitte Belgium’s Enterprise Risk Services practice. Laurent is active in the setup and enhancement of Risk Management departments and sponsoring the development of Risk Management frameworks, processes, tools and techniques.
Should you have any queries or require any further information please do not hesitate to contact us using the following mailbox: [email protected]
BelgiumJeroen Vergauwe Deloitte Bedrijfsrevisoren BV o.v.v.e. CVBA Energy & Resources ERS Director Enterprise Risk Services + 32 2 800 22 84 [email protected]
Jeroen Vergauwe is director in Deloitte’s Belgium’s Energy & Resources practice. Jeroen is active in the development of comprehensive and integrated solutions to meet the needs of the Energy & Resources industry, in particular in the field of advanced risk management.
50
To start a new section, hold down the apple+shift keys and click
to release this object and type the section title in the box below.
Global coordination team
Regional coordination team
Specialists
CanadaPaul Zonneveld Global E&R ERS Leader Deloitte Canada +1 403 503 1356 [email protected]
EMEAGuido Vandervorst E&R ERS EMEA Leader Deloitte Belgium +32 2 800 20 27 [email protected]
USDmitriy Borovik ERS Director Deloitte & Touche LLP +1 212 436 4109 [email protected]
UKTimothy Archer ERS Partner Deloitte UK +44 (0) 20 7303 4484 [email protected]
BelgiumDieter Vonken ERS Senior Consultant Deloitte Belgium +32 2 800 24 61 [email protected]
BelgiumJeroen Vergauwe ERS Director Deloitte Belgium + 32 2 800 22 84 [email protected]
AmericasPaul Zonneveld E&R ERS US Leader Deloitte Canada +1 403 503 1356 [email protected]
South‑AfricaMark Victor ERS Director Deloitte Southern‑Africa +2 711 806 5594 [email protected]
USPatchin Curtis ERS Director Deloitte & Touche LLP +1 (410) 963‑4028 [email protected]
Asia‑PacificRichard Jamieson E&R ERS Asia – Pacific Leader Deloitte Australia +61 3 9671 7413 [email protected]
U.S.Darryl Butler ERS Director Deloitte & Touche LLP +1 (404) 220‑1357 [email protected]
BelgiumLaurent Van Melckebeke ERS Senior Consultant Deloitte Belgium +32 2 800 27 58 [email protected]
Risk Intelligence in the Energy & Resources IndustryEnterprise Risk Management Benchmark Survey 51

To start a new section, hold down the apple+shift keys and click
to release this object and type the section title in the box below.
Notes
52

To start a new section, hold down the apple+shift keys and click
to release this object and type the section title in the box below.

About DeloitteDeloitte refers to one or more of Deloitte Touche Tohmatsu Limited, a UK private company limited by guarantee, and its network of member firms, each of which is a legally separate and independent entity. Please see http://www.deloitte.com/about for a detailed description of the legal structure of Deloitte Touche Tohmatsu Limited and its member firms.
Deloitte provides audit, tax, consulting, and financial advisory services to public and private clients spanning multiple industries. With a globally connected network of member firms in more than 150 countries, Deloitte brings world‑class capabilities and high quality service to clients, delivering the insights they need to address their most complex business challenges. Deloitte has in the region of 200,000 professionals, all committed to becoming the standard of excellence.
DisclaimerThis publication contains general information only, and none of Deloitte Touche Tohmatsu Limited, its member firms, or their related entities (collectively the “Deloitte Network”) is, by means of this publication, rendering professional advice or services. Before making any decision or taking any action that may affect your finances or your business, you should consult a qualified professional adviser. No entity in the Deloitte Network shall be responsible for any loss whatsoever sustained by any person who relies on this publication.
© 2014. For more information, contact Deloitte Touche Tohmatsu Limited.
Designed and produced by The Creative Studio at Deloitte, London. 37839A