risk characterization for boron and aquatic plants …
TRANSCRIPT

Clemson UniversityTigerPrints
All Theses Theses
12-2007
RISK CHARACTERIZATION FOR BORONAND AQUATIC PLANTS AND ANIMALSBasma DamiriClemson University, [email protected]
Follow this and additional works at: https://tigerprints.clemson.edu/all_theses
Part of the Environmental Sciences Commons
This Thesis is brought to you for free and open access by the Theses at TigerPrints. It has been accepted for inclusion in All Theses by an authorizedadministrator of TigerPrints. For more information, please contact [email protected].
Recommended CitationDamiri, Basma, "RISK CHARACTERIZATION FOR BORON AND AQUATIC PLANTS AND ANIMALS" (2007). All Theses.235.https://tigerprints.clemson.edu/all_theses/235

iii
RISK CHARACTERIZATION FOR BORON AND AQUATIC PLANTS AND ANIMALS
A Thesis Presented to
the Graduate School of Clemson University
In Partial Fulfillment of the Requirements for the Degree
Master of Science Forestry and Natural Resources
by Basma Damiri
December 2007
Accepted by
Dr. John H. Rodgers, Jr., Committee Chair Dr. James Castle
Dr. Matt Huddleston

iii
ABSTRACT
In aqueous mixtures, boron can be toxic to plants or animals at relatively low
concentrations. Boron may occur at concentrations that can pose risk to plants used in
constructed wetland treatment systems designed to treat constituents of concerned in a
complex matrix such as flue gas desulfurization water and boron may adversely affect
survival, growth, and consequently, plant performance. The three major objectives of
this research are: 1) to measure responses of Typha latifolia (seed germination and root
and shoot elongation) and Schoenoplectus californicus early seedlings (survival, and
shoot and root elongation) to aqueous exposures of boron in diluted FGD water and
moderately hard water (MHW); 2) to measure responses of T. latifolia and S. californicus
(mature plants) to aqueous boron concentrations in simulated FGD water; and 3) to
measure responses of Ceriodaphnia dubia (survival and reproduction) and Pimephales
promelas (survival) to aqueous boron concentrations in MWW. Boron in the combination
of other constituent in FGD water may adversely affect T. latifolia and S. Californicus
early seedling growth and this must considered in planting CWTS for FGD water. S.
californicus as mature plant was more sensitive, in terms of shoot elongation shoot
density to boron exposures in simulated FGD water than T. latifolia. Similar to most
elements, aqueous boron exposures elicited different responses (sensitivity) from C.
dubia and P. promelas. C. dubia was more sensitive to boron exposures than P.
promelas. Immature plants were the most sensitive species tested in this study.

iv

v
DEDICATION
To the most important persons in my life: my parents, sisters, and brothers who
are my source of strength and had a dream of seeing me in a graduation gown. Your
understanding support and interest encouraged me throughout my journey and made this
academic accomplishment possible. Without your efforts, I can not continue.

vi

vii
ACKNOWLEDGMENTS
I would like to thank Ford Foundation in New York and America-Mideast
Educational and Training Services (AMIDEAST) office in Palestine for their support and
help. I would like also to thank my advisor Dr. John Rodgers Jr. in addition to all my
members of committee, Dr James Castle and Mat Huddleston. Many thanks go to my lab-
mate, Derek, Laura, Andrew, O’Neil, Maurice, Brenda, Even, Matt, and Lane for their
help and support. You made my life in the USA easy with your support.

viii
ix
TABLE OF CONTENTS
Page
TITLE PAGE ................................................................................................................. i ABSTRACT ................................................................................................................... iii DEDICATION ............................................................................................................... v ACKNOWLEDGMENTS ............................................................................................. vii LIST OF TABLES ......................................................................................................... xi LIST OF FIGURES ....................................................................................................... xiii INTRODUCTION ......................................................................................................... 1 1. Research Objectives .................................................................................................. 5 2. Organization of the Thesis ........................................................................................ 6 References ...................................................................................................................... 8 RESPONSES OF TYPHA LATIFOLIA LINNEAUS AND SCHOENOPLECTUS CALIFORNICUS C. A. MEYER PALLA TO AQUEOUS BORON EXPOSURES ......................................................... 11 Abstract .......................................................................................................................... 11 1. Introduction ............................................................................................................... 12 2. Materials and Methods .............................................................................................. 15 3. Results and Discussions ............................................................................................ 19 4. Conclusions ............................................................................................................... 24 References ...................................................................................................................... 26 EFFECTS OF AQUEOUS EXPOSURES OF BORON ON MATURE PLANTS OF TYPHA LATIFOLIA AND SCHEONOPLECUTS CALIFORNICUS ...................................................................... 37 Abstract .......................................................................................................................... 37 1. Introduction ............................................................................................................... 38 2. Materials and Methods .............................................................................................. 41 3. Results and Discussions ............................................................................................ 44

x
Table of Contents (Continued) Page 4. Conclusions ................................................................................................................ 49 References ...................................................................................................................... 51 RESPONSES OF CERIODAPHNIA DUBIA RICHARD AND PIMEPHALES PROMELAS RAFINESQUE TO AQUEOUSBORON EXPOSURES .................................................................................................. 67 Abstract .......................................................................................................................... 67 1. Introduction ............................................................................................................... 68 2. Materials and Methods .............................................................................................. 72 3. Results and discusions .............................................................................................. 74 4. Conclusions ............................................................................................................... 76 References ...................................................................................................................... 78 SUMMARY AND CONCLUSIONS ............................................................................ 85 References ...................................................................................................................... 92

xi
LIST OF TABLES Table Page Chapter 2 1 Responses of T. latifolia to aqueous boron exposures ........................................ 29 2 Responses of T. latifolia to boron and copper
exposures and S. californicus to boron exposure. ........................................... 30 3 Chemical and physical characteristics of boron-exposure
solutions in formulated moderately hard water (MHW). ............................... 31 4 Chemical and physical characteristics of boron-exposure
solutions in flue gas desulfurization (FGD) water. ......................................... 32 5 Responses of T. latifolia to aqueous copper exposures ....................................... 33 6 Visual observations during 35-d exposure of S. californicus
to boron ............................................................................................................ 34 7 Responses of immature seedlings of S. californicus
to aqueous boron exposures ............................................................................ 35 Chapter 3 1 Salts used to prepare simulated FGD water. ........................................................ 54 2 Mean boron concentrations in exposure water, hydrosoil,
shoots, and roots of T. latifolia experiment. .................................................... 55 3 Mean boron concentrations exposure water, hydrosoil, shoots,
and roots of S. californicus. ............................................................................ 56 4 Physical and chemical properties T. latifolia boron treatments
in simulated FGD water. ................................................................................. 57 5 Physical and chemical properties of S. californicus boron
treatments in simulated FGD water ................................................................. 58 6 Response measurements of T. latifolia to boron exposures
in simulated FGD water. ……………………………………. ....................... 59

xii
List of Tables (Continued) Table Page Chapter 3 7 Response measurements of S. californicus to boron exposures
in simulated FGD water. ................................................................................. 60 8 Comparison between T. latifolia and S. californicus differences. ....................... 61 Chapter 4 1 Boron toxicity data for fish as a function of boron form and
water characteristics ........................................................................................ 70 2 Chemical and physical characteristics of aqueous boron-
exposure concentrations to C. dubia and P. promelas during 7-d static/ renewal tests ........................................................................ 81
3 Effects of boron on P. promelas (survival) and C. dubia
(survival and reproduction) during 7-d static/renewal tests ............................. 82

xiii
LIST OF FIGURES Figure Page Chapter 2
1. Boron effects on T. latifolia shoot and root lengths.................................... 36
2. Copper effects on T. latifolia shoot and root lengths. ................................. 36 Chapter 3
1. Typha latifolia shoot height responses to boron exposures in simulated FGD water ............................................................................. 62
2. Typha latifolia shoot density and number of leaves per shoot
responses to boron exposures in simulated FGD water. ....................... 62
3. Schoenoplectus californicus shoot height responses to boron exposures in simulated FGD water. ...................................................... 62
4. Schoenoplectus californicus shoot density and inflorescence
production responses to B simulated FGD water. ................................ 62
5. Difference in boron concentrations in the soil, roots, and shoots of T. latifolia .............................................................................. 63
6. Differences in boron concentrations in soil, roots, and shoots
of Schoenoplectus californicus. ........................................................... 64
7. Comparison between boron concentrations in T. latifolia and S. californicus hydrosoil. ............................................................... 65
8. Comparison between boron concentrations in T. latifolia
and S. californicus roots ....................................................................... 65
9. Comparison between boron concentrations in T. latifolia and S. californicus. ............................................................................... 66
Chapter 4 1. Boron effect on Ceriodaphnia dubia mortality. ............................................ 83

xiv
List of Figures (Continued) Figure Page Chapter 4 2. Boron effect on P. promelas mortality. ......................................................... 83 3. Exposure-response curve for boron and C. dubia reproduction. ................... 84

1
CHAPTER 1
INTRODUCTION
Boron is an essential micronutrient for both plants and animals, with interspecies
differences in concentrations required for optimum growth (Goldberg, 1997; Nielsen,
1997). However, boron is toxic at low concentrations and the difference between required
and toxic concentrations is small. Reviews of current literature indicate that boron
toxicity to agricultural plant species is well documented while data regarding boron
toxicity to aquatic plant and animal species are limited. The research in this thesis
provided a risk-based analysis of the aqueous toxicity of boron to sentinel aquatic plant
species, Typha latifolia Linneaus (cattail) and Schoenoplectus californicus C. A. Meyer
Palla (giant bulrush), and sentinel aquatic animal species, Ceriodaphnia dubia Richard
(water flea) and Pimephales promelas Rafinesque (fathead minnow). The data of this
research can provide estimates of responses of sentinel species during aqueous exposures
of boron and may have the potential to predict remediation goals for waters impacted by
elevated boron concentrations.
To date, Water Quality Criteria (WQC) for boron have not been established by the
United States Environmental Protection Agency (U.S. EPA) and limits for releasing
boron to aquatic systems have not been proposed. To protect aquatic life, WQC have
been developed for a variety of elements and compounds (U.S. EPA, 1991) and have
been used widely by the National Pollutant Discharge Elimination System (NPDES).
WQC are based upon laboratory tests and toxicity data using sentinel plant and animal
spices. In order to develop a complete comprehensive toxicity profile for a chemical, data

2
regarding toxicity of the chemical to both sentinel aquatic plants and animals should be
examined and compared. In this research, laboratory boron toxicity tests for T. latifolia,
S. californicus, C. dubia, and P. promelas were conducted and the results for both plants
and animals were compared.
Boron is widely distributed at low concentrations in surface waters throughout the
world, but in areas associated with human activity relatively high concentrations of boron
have been observed. Typical concentrations of boron in North American surface waters
are below 0.1 mg L-1 (Coughlin, 1998). Boron concentrations in rocks and soils are
typically less than 10 mg kg-1. Boron occurs naturally in relatively elevated
concentrations in soils (20-300 mg kg-1 in the USA with a mean of 30 mg kg-1) and in
shale (100 mg kg-1) (Nable et al., 1997). Anthropogenic sources of elevated boron include
household cleaners, industrial effluents, fly ash and flue gas desulfurization (FGD) waters
(Nable et al., 1997; Weinthal et al., 2005). Standard water treatments are limited and
ineffective in their ability to remove a significant amount of boron which results in
constraints on discharge of boron-contaminated waters to watersheds or reuse for
irrigation (Polat et al., 2004). Phytoremediation is an alternative option to treat
contaminated waters.
Aquatic plants are essential components of healthy aquatic ecosystems (Wang,
1991). T. latifolia and S. californicus are useful sentinel aquatic plant species that have
been used in previous toxicity tests (Moore et al., 1999; Muller et al., 2001). Evaluation
of T. latifolia and S. californicus responses to boron is important because of the
ecological and economic importance of these plants. They are common wetland species

3
of wide geographical distribution in the continental United States. They play a major role
in structural and functional aspects of wetland ecosystems including biogeochemical
cycles, food webs, and physiological processes (Adriano et al., 1984; Lombardi et al.,
1997). T. latifolia and S. californicus are an important biotic component of constructed
wetlands and have been used to stabilize hydrosoil components and contribute organic
matter (Murray-Gulde et al., 2005). They are also used in constructed wetlands to aid in
the removal of different contaminants (Sinicrope et al., 1992; Powell et al., 1996;
Hawkins et al., 1997; Gillespie et al., 2000; Ye et al., 2003; Murray-Gulde et al., 2005).
Constructed wetlands planted with T. latifolia and S. californicus may be a viable
option for treating contaminated waters, but performance may be dependent on responses
of wetland plants to aqueous boron concentrations. FGD waters are produced at coal–
fired power plants to decrease sulfur dioxide emissions. This process produces relatively
large volumes of water that may contain significantly elevated concentrations of boron
(33 to 460 mg B L-1) (Mierzejewski, 1991; Eggert, in review). These concentrations may
prevent the establishment of vegetation especially in the first growing season. Retarded
establishment may occur in wetland and aquatic systems as a result of discharging of
these waters without sufficient treatment. The U.S. EPA through the NPDES requires
treatment of FGD waters prior to discharge. Water quality criteria have not been
established for boron, therefore, boron is not listed as a contaminant requiring monitoring
or treatment.
A crucial aspect of choosing aquatic plants for toxicity tests is choosing the stage
of life for testing. Some research suggested using seed germination and early seedlings to

4
determine the effects from point and non-point source effluents (Walsh et al., 1991;
Wang and Williams, 1988) while others have suggested the use of mature plants (Powell
et al., 1996). Germination and the first days of seedling growth can be the most sensitive
stage of plant development. Adverse effects due to chemical substances may take place
during these phases. Mature plants may withstand higher concentrations of a chemical
(Reid et al., 2004). Therefore, it is useful to contrast responses to boron exposures
between early life stages and mature plants (Moore et al., 1999).
Ceriodaphnia dubia and Pimephales promelas are routinely and extensively used
to evaluate the potential toxicity of effluents to receiving aquatic systems and individual
chemicals by the U.S. EPA through the NPDES program (Bankston and Baer, 2005;
U.S.EPA, 2002). Toxicity tests using C. dubia and P. promelas can generally provide
ecotoxicity data required for environmental protection (Wang, 1991). To the author’s
knowledge, limited to no published data are available regarding the responses of C. dubia
and P. promelas to boron (Hickey, 1989). For this thesis research, reproduction and
survival of C. dubia as well as survival of P. promelas were measured, and results were
compared between species.
Plants are fundamentally different from animals and likely have different
sensitivities to exposures. Plants may be under-or overprotected by results from animal
tests. Previous research has indicated that plants are more sensitive to some compounds
than aquatic animal (Taraldsen and Norberg-King, 1989; Wang and Freemark, 1995).
Therefore, toxicity tests for animals alone may not be protective for plant species and are
not sufficient to assess the environmental risk of an element or a compound. To protect

5
aquatic life, it is important to compare differences in response of aquatic plant and animal
species to the same chemical exposure. The present study not only provides data about
boron toxicity to sentinel aquatic plant and animal species, but also provides risk
characterization of boron to these aquatic species.
1. Research Objectives
In both plant and animal experiments, boron, in the form of boric acid B(OH)3,
was amended with formulated moderately hard water (MHW). In plant experiments,
boron was also amended with FGD water. This research had the following objectives:
1. a) to measure responses of T. latifolia seed germination and early seedling growth
(shoot and root elongation) following 7-d exposures to boron (boric acid) in amended
FGD water and formulated moderately hard water (MHW); b) to measure responses of S.
californicus immature seedlings (survival, and shoot and root growth) following 35-d
exposures to boron (boric acid) in amended FGD water and MHW; and c) to compare the
responses of T. latifolia and S. californicus to boron in amended FGD water with
responses to boron in MHW.
2. a) to determine responses of T. latifolia and S. californicus in terms of shoot height,
shoot density, number of leaves per plant, length of brown part of the shoot (necrotic
tissues) and number of inflorescences produced following 13 months of exposure to a
series of boron concentrations (as boric acid) in simulated FGD water, b) to measure
concentrations of boron in the hydrosoil and bioconcentration of boron in plant tissue (i.e.
shoots and roots) of T. latifolia and S. californicus after 13 months of exposure to boron
(boric acid) in simulated FGD water, c) to determine relationships between responses of
6
T. latifolia and S. californicus to boron exposures and concentrations of boron measured
in the roots and shoots of these plants, and d) compare the responses of T. latifolia and S.
californicus following 13 months of exposures to boron (as boric acid) in simulated FGD
water.
3. To measure the responses of C. dubia and P. promelas to aqueous boron exposures in
7-d static/renewal tests. Reproduction and survival of C. dubia as well as survival of P.
promelas were measured as endpoints. No Observed Effect Concentration (NOEC),
Lowest Observed Effect Concentration (LOEC) and Lethal Concentration (LC50) values
were estimated. Responses of C. dubia and P. promelas were compared.
Overall, this research provided data regarding responses of sentinel aquatic
species to aqueous exposures of boron. These data can contribute to development of a
comprehensive profile for boron toxicity to aquatic species and aid in establishing WQC
for boron.
2. Organization of the Thesis
This thesis is organized into chapters intended for publication in peer-reviewed
journals. Therefore, some of the introductory material and methods are repeated. Chapter
1 introduces the risk associated with releasing boron-contaminated waters and sources of
elevated boron concentrations in the environment. Chapter 2, titled “Effects of Aqueous
Exposures of Boron on Typha latifolia and Schoenoplectus californicus Seed
Germination and Early Seedling Growth,” will be submitted for publication in
Chemosphere. Chapter 3, titled “Effects of Aqueous Exposures of Boron on Mature
Plants of Typha latifolia and Schoenoplectus californicus” will be submitted for

7
publication in International Journal of Phytoremediation. Chapter 4, titled “Aqueous
Boron Toxicity to Aquatic Animal Species Ceriodaphnia dubia Richard and Pimephales
promelas Rafinesque,” will be submitted for publication in Bulletin of Environmental
Contamination and Toxicology. Chapter 5 summarizes the overall results of this research.

8
References
Adriano, D.C., Shartiz, R. R., Ciravolo, T. G., Luvall, J. C., Harding, S. A., 1984. Growth and mineral nutrition of cattails inhabiting a Thermally–Graded South Carolina Reservoir: II. The micronutrients. J. Plant Nutr. 7, 1699-1716.
Bankston, C.R., Baer, K.N., 2005. Effects of industrial and domestic wastewaters on selected biological indicators in aquatic organisms. Bull. Environ. Contamin. Toxicol. 75, 73-80.
Coughlin, J.R., 1998. Sources of human exposure: Overview of water supplies as sources of boron. Biol. Trace Elem. Res. 66, 87-100.
Eggert, D., Rodgers, J. H. Jr, Huddleston, G. M. III, Hensman, C.E., 2007 (in review). Performance of pilot-scale constructed wetland treatment systems for flue gas desulfurization (FGD) waters. In review in Environ. Geosci.
Gillespie, W.B. Jr., Hawkins, W.B., Rodgers, J.H. Jr., Cano, M.L., Dorn, P.B., 2000. Transfers and transformations of zinc in constructed wetlands: Mitigation of a refinery effluent. Ecol. Eng. 14, 279-292.
Goldberg, S., 1997. Reactions of boron with soils. Plant Soil. 193, 35-48.
Hawkins, W.B., Rodgers, J.H. Jr., Gillespie, W.B. Jr., Dunn, A.W., Dorn, P. B., Cano, M. L., 1997 . Design and construction of wetlands for aqueous transfers and transformations of selected metals. Ecotoxicol. Environ. Safe. 36, 238-248.
Hickey, C.W., 1989. Sensitivity of four New Zealand cladoceran species and Daphnia magna to aquatic toxicants. New Zeal. J. Mar. Fresh. Res. 23, 131-137.
Lombardi, T., Fochetti, T., Bertacchi, A., Onnis, A., 1997. Germination requirements in a population of Typha latifolia. Aquat. Bot. 56, 1-10.
Mierzejewski, M.K., 1991. The elimination of pollutants from FGD wastewaters, The 1991 SO2 Control Symposium, Washington.
Moore, M. T., Huggett, D. B., Huddleston, G. M. III., Rodgers, J. H. Jr., Cooper, C. M, 1999. Herbicide effects on Typha latifolia (Linneaus) germination and root and shoot development. Chemosphere. 38, 3637-3647.
Muller, S.L., Huggett, D. B., Rodgers J. H. Jr. 2001. Effects of copper sulfate on Typha latifolia seed germination and early seedling in aqueous and sediment exposures. Arch.Environ. Contam. Toxicol. 40, 192-197.

9
Murray-Gulde, C. L., Huddleston, G. M., III., Garber, K. V., Rodgers, J. H. Jr., 2005. Contributions of Schoenoplectus californicus in a constructed wetland system receiving copper contaminated wastewater. Water Air Soil Pol. 163, 355-378.
Nable, R. O., Bañuelos, G. S., Paull, J. G., 1997. Boron toxicity. Plant Soil. 193,181- 198.
Nielsen, F. H., 1997. Boron in human and animal nutrition. Plant Soil. 193, 199-208.
Polat, H., Vengosh, A., Pankratov, I., Polat, M., 2004. A new methodology for removal of boron from water by coal and fly ash. Desalination. 164, 173-188.
Powell, R.L., Kimerle, R. A., Moser, E.M., 1996. Development of a plant bioassay to assess toxicity of chemical stressors to emergent macrophytes. Environ. Toxicol. Chem. 15, 1570-1576.
Reid, R.J., Hayes, J. E., Post, A., Stangoulis, J. C. R., Graham, R. D., 2004. A critical analysis of the causes of boron toxicity in plants. Plant Cell Environ. 25, 1405-1414.
Sinicrope, T.L., Langis, R., Gersberg, R.M., Busnardo, M.J., Zedler, J.B., 1992. Metal removal mesocosms subjected to different hydro periods. Ecol. Eng. 1, 309-322.
Taraldsen, J.E. Norberg-King, T.J., 1989. New method for determining effluent toxicity using duckweed (Lemna minor). Environ. Toxicol. Chem. 9, 761-767.
U. S. Environmental Protection Agency(U.S. EPA) 1991. Technical Support Document for Water Quality-Based Toxics Control. EPA/ 505/2-90-001.
U.S. Environmental Protection Agency, 2002 Short-term methods for estimating the chronic toxicity of effluents and receiving water to freshwater organisms, EPA/821/R-02-013 Washington DC.
Walsh, G.E., Weber, D. E, Simon, T. L., Brashers, L. K.1991. Toxicity tests of effluents with marsh plants in water and sediment. Environ. Toxicol. Chem.10, 517-525.
Wang, W. C., 1986. Comparative toxicology of phenolic compounds using root elongation method. Environ. Toxicol. Chem. 5, 891-767.
Wang, W.C., 1991. Literature review on high plants for toxicity testing. Water Air Soil Pol. 59, 381-400.
Wang, W. C., Freemark K., 1995. The use of plants for environmental monitoring and assessment. Ecotox. Environ. Safe. 30, 289-301.

10
Wang, W. C., Williams, J.M., 1988. Screening and biomonitoring of industrial effluents using phytotoxicity tests. Environ. Toxicol. Chem. 7, 645-652.
Weinthal, E., Parag, Y., Vengosh, A., Muti, A., Kloppmann, W., 2005. The EU drinking water directive: The boron standard and scientific uncertainty. Eur. Environ. 15, 1-12.
Ye, Z. H., Lin, Z. -Q., Whiting, S. N, de Souza, M. P., Terry, N., 2003. Possible use of constructed wetlands to remove selenocyanate, arsenic, and boron from electric utility wastewater. Chemosphere. 52, 1571-1579.

11
CHAPTER 2
RESPONSES OF TYPHA LATIFOLIA LINNEAUS AND
SCHOENOPLECTUS CALIFORNICUS C. A. MEYER PALLA TO AQUEOUS BORON EXPOSURES
Abstract
Responses of Typha latifolia Linnaeus and Schoenoplectus californicus C. A.
Meyer Palla to aqueous boron exposures can indicate their potential for use in
constructed wetland treatment systems to treat flue gas desulfurization (FGD) waters
from coal-fired power generation. The objectives of this research were: 1) to measure
responses of T. latifolia seed germination, and shoot and root growth of early seedlings
following 7-d exposures to boron in diluted FGD water and in formulated moderately
hard water (MHW) as well as to measure responses of immature S. californicus seedlings
in terms of survival, shoot and root growth following 35-d exposures to boron
concentrations, 2) to compare the responses in diluted FGD water and MHW, and 3) to
contrast the responses of T. latifolia and S. californicus to boron exposures. T. latifolia
seed germination in FGD water or MHW was not sensitive to boron concentrations of
0.2-100 mg L-1 with seed germination of 89.6-100%. Survival of S. californicus immature
seedlings in FGD water was ≤3.3% at boron concentrations of ≥12.6 mg L-1 while in
MHW survival ranged from 23 to 96% at boron concentrations 12.6-49.9 mg L-1.
Responses of shoot and root growth to boron exposures in FGD water also differed from
responses in MHW. No root emergence or elongation was observed for T. latifolia early
seedlings at all boron concentrations ≥12.6 mg L-1 in diluted FGD water and shoots were
yellow with lengths ≤5.36 mm. In contrast, root growth decreased with increasing
12
concentrations of boron in MHW for S. californicus (≥25.8 mg B L-1) and T. latifolia
(≥12.6 mg B L-1) with no root growth observed at boron concentrations ≥99.6 mgL-1. The
results of this study indicated that boron in conjunction with other constituents in FGD
water adversely affect T latifolia and S californicus early seedling growth and this must
be considered in planting constructed wetland treatment systems for FGD waters.
Key Words: Boron, T. latifolia, S. californicus, seed germination, FGD water,
phytotoxicity
1. Introduction
Boron enters surface and ground waters from both natural and anthropogenic
sources (Polat et al., 2004). Leaching of rocks and soils, and geothermal releases are
major natural sources while release of boron containing products into water through
municipal sewage disposal, mining, and electrical power generation are major
anthropogenic sources (Nable et al., 1997). Boron has been of recent interest due to
elevated concentrations in waters from thermal electric power generation, particularly
flue gas desulfurization (FGD) waters (Changwoo and Mistch, 2001; Lamminen et al.,
2001). At coal–fired power plants, FGD waters are produced to decrease sulfur dioxide
emissions (Mierzejewski, 1991). The amount of water produced by an FGD scrubber can
exceed 0.1 mgd at large facilities (>1,000 Mega Watt, MW) and can contain significant
concentrations of boron from 33 to 460 mg L-1 and other constituents of concern (COC)
(e.g. chlorides, mercury, selenium, arsenic and zinc) (Mierzejewski, 1991; Eggert, in
review). These waters are semi-neutral in pH and contain high total dissolved and
suspended solids (calcium, chlorides, magnesium, and sulfate) (Mierzejewski, 1991).

13
However, FGD waters vary significantly in their compositions (Eggert, in review).
Treatment of FGD waters is required by the United States Environmental Protection
Agency (U.S. EPA) through the National Pollutant Discharge and Elimination System
(NPDES) before discharging to receiving systems. Constructed wetland treatment
systems have been proposed as a novel treatment approach for efficient and effective
treatment of targeted constituents (As, Hg, and Se) found in FGD waters (Ye et. al.,
2003). If a treatment approach such as CWTS is considered for FGD waters, elevated
chloride concentrations (≥4000 mg L-1) are known to be toxic to wetland plants and must
be managed (Eggert, in review). To maintain plant health in CWTS, FGD waters are
generally diluted to achieve chloride concentrations <4000 mg L-1. However, boron may
also occur in the diluted FGD waters at concentrations that pose risks to plants used in
CWTS designed to treat constituents of concern.
Typha latifolia Linnaeus (common cattail) and Schoenoplectus californicus C. A.
Meyer (giant bulrush) have been used in CWTS designed to treat FGD waters (Eggert, in
review). They play a major role in the structure and function of constructed wetlands
affecting biogeochemical cycling and energy flow (Adriano et al., 1984; Lombardi et al.,
1997). Wetland plants can also stabilize hydrosoil components, contribute organic matter
(Murray-Gulde et al., 2005) and aid in the removal of some contaminants (Sinicrope et
al., 1992; Ye et al., 2003). Due to differences in their anatomy and physiology, responses
of T. latifolia and S. californicus to boron exposures may differ.
Seed germination and early seedling are sensitive stages in plant growth, and
boron could adversely affect these stages (Boutin et al, 1995). T. latifolia propagates

14
vegetatively via rhizomatous growth as well as by seeds (Keane et al., 1999). T. latifolia
is tolerant of moderate soil salinity and grows rapidly in both brackish and freshwater
wetlands (McNaughton, 1968; Dickerman and Wetzel, 1985). Under favorable conditions
(light, temperature, and moisture), T. latifolia germinates quickly and grows rapidly after
germination with significant responses to contaminants in seven days (Moore et al., 1999;
Muller et al., 2001). In contrast, S. californicus seeds require a longer time to germinate
(≥2 weeks). S. californicus spreads primarily by vegetative propagation, producing new
stems from an extensive system of underground rhizomes, with limited expansion
through seed dispersal. S. californicus has a moderate tolerance for salinity and is found
in fresh and estuarine marsh areas (Howard and Rafferty, 2005). Since the S. californicus
seedlings used for the immature plant toxicity experiment were much larger at the
initiation of exposures than the T.latifolia seedlings were at the conclusion of seven days
of exposure, and the growth of the immature S. californicus seedlings is slow relative to
the growth of T. latifolia seedlings, we anticipated that immature S. californicus seedlings
would require more than 7-d to respond to boron exposures.
Bioavailability of boron may be altered in waters with different ionic composition
or strength. To date, no data are available regarding the influence of high ionic strength
water (e.g. FGD water) or low ionic strength (i.e. formulated moderately hard water
[MHW]) on boron toxicity to wetland plant species. The objectives of this research were:
1) to measure T. latifolia seed germination and early seedling growth (shoot and root
elongation) following 7-d exposures to boron (boric acid) in amended FGD water and
formulated MHW; 2) to measure responses of S. californicus immature seedlings

15
(survival, and shoot and root growth) following 35-d exposures to boron (boric acid) in
amended FGD water and MHW; and 3) to compare the responses of T. latifolia and S.
californicus in boron amended FGD water with responses in MHW.
2. Materials and Methods
2.1. Experimental design
The toxicity test methods used for both T. latifolia and S. californicus in these
experiments were based on previous tests developed for T. latifolia (Moore et al., 1999;
Muller et al., 2001). In these tests, environmental parameters including 1,500-3,000 (Lux)
fluorescent lighting for a 16 h light/8 h dark photoperiod and a temperature of 24 ±1 οC
were used.
2.2. Exposure concentrations
2.2.1. Formulated moderately hard water (MHW)
Boron in the form of boric acid (B (OH)3) (Fisher Scientific, Pittsburgh, PA) was
amended to formulated MHW. Boric acid was used for these experiments because it is
the dominant form of boron in natural fresh water and the available form for plants
(Goldberg, 1997). MHW was prepared at Clemson University from reverse osmosis
water and high purity salts of CaCO3, NaHCO3, MgSO4.7H2O, CaCl2
.2H2O, KCl, KNO3,
and K2PO4, Cu (as CuO2), Se (as SeO2), Zn (as ZnO2) with concentrations of 5.0, 101.8,
48.0, 33.0, 65.0, 2.1, 0.82, 0.02, 0.002, 0.001, 0.001 mg L-1, respectively. Formulated
MHW was used for these experiments in order to standardize the ionic strength and
composition of the water that would be compared with the FGD water. Nominal

16
concentrations of boron were prepared with MHW and were used for T. latifolia and S.
californicus tests (0.2, 7.5, 10.0, 12.5, 25.0, 50.0, and 100.0 mg B L-1).
2.2.2. Diluted flu gas desulfurization (FGD) water
FGD water was obtained from a coal-fired power plant in North Carolina with an
operating wet FGD scrubber. The FGD water was diluted using MHW to maintain a
chloride concentration of ≤4000 mg L-1 and a boron concentration of 12.5 mg L-1. The
boron concentration of 12.5 mg L-1 was chosen based on range finding tests with T.
latifolia and boron. To maintain consistent concentrations of other constituents, the
diluted FGD water was amended with boron to prepare other exposure concentrations
(25, 50, and 100 mg B L-1). Physical and chemical characteristics of boron amended
waters were measured according to Standard Methods (APHA, 1998).
2.3. Typha latifolia toxicity tests
Typha latifolia seeds from mature spikes were collected from a wetland in
Pickens County, South Carolina (U.S.A.) in January, 2005. Mature spikes containing
seeds were placed in a plastic bag, transferred to the laboratory at Clemson University,
and stored at 20 ± 1οC until used. The toxicity of boron was measured in 7-d static tests.
Seed germination experiments were initiated by adding 15 viable seeds (McNaughton,
1968) to a plastic container with 150 mL of testing solution with three replicates. At the
experiment termination, numbers of germinating and non-germinating seeds were
counted for each replicate in each testing solution. For this research, germination was
defined as observation of a shoot emerging from the seed during the test period. Percent
seed germination and mean shoot and root lengths of seedlings were calculated for each

17
measured boron concentration. Growth was estimated by measuring shoot and root length
for 10 germinating seeds using a Digimatic Caliper (Model CD- 8” Code No. P 500-352).
The instrument repeatability was 0.01 mm and instrument error was 0.02 ± 0.001mm.
Three definitive tests were performed for each point estimate (LC50, LOEC, and NOEC)
at three treatment concentrations plus untreated moderately hard water as a control.
2.4. Schoenoplectus californicus toxicity test
Immature seedlings of S. californicus (with initial shoot length 0.68-2.00 cm and
root length 0.28-2.18 cm) were obtained from Horticultural Systems, Inc., Parrish,
Florida. The S. californicus seedling test was initiated by placing one seedling in a plastic
container with 150 mL test solution. Ten plants were used for each treatment. Untreated
control and treatments were done in triplicate. To minimize the effect of variable shoot
and root lengths at the experiment initiation, plants were selected based on similar shoot
and root lengths for each treatment. The plants were initially distributed in this
experiment with no significant differences in average shoot and root lengths between the
treatments and the controls. The experiment was conducted in 35-d, during which daily
observations of plant general health (in terms of shoot growth, and shoot browning and
yellowing) were made. The duration of the experiment was based on visual observations
of plant health (developing of browning and chlorosis in the shoots). Test solutions were
renewed each week to minimize the effect of evapotranspiration. At test termination,
numbers of surviving seedlings in each treatment were enumerated. A plant was
considered to be alive if at least one green shoot was present and was considered dead if
no green shoots were present and brown or chlorotic shoots were present. The number of

18
green, brown, and chlorotic shoots was counted for each live plant. Live plants were also
scanned for shoot and root lengths with a WinRhizo root scanner (Regent Instruments
Inc., Quebec) to accommodate the number of roots and shoots developed during the
exposure period. One toxicity test for S. californicus was performed due to difficulties
germinating these plants in the laboratory (germination was ≤1%) and a limited number
of seedlings were obtained.
2.5. Reference Toxicant Tests
Reference toxicity tests were conducted for T. latifolia using copper sulfate
pentahydrate (CuSO4·5H2O) (Fisher Scientific, Pittsburgh, PA) as the reference toxicant
(U.S EPA, 2002) to provide a positive control for the boron toxicity tests. Since
seedlings of S. californicus were difficult to obtain, reference toxicity tests were not
conducted with this species. For these tests, a series of copper concentrations were
prepared with MHW. The copper concentrations for testing were chosen based on
previous experiments with T. latifolia (Muller et al., 2001)
2.6. Confirmation of Exposures
Experimental boron and copper concentrations were analyzed using Inductively
Coupled Plasma Atomic Emission Spectrometer (Spectro Flame Modula; ICP-AES)
according to EPA Method 200.7. (U.S. EPA, 1983). Boron and copper concentrations
were measured at test initiation and after test solutions were renewed. Exposure
concentrations for estimating boron or copper toxicity were calculated from the average
measured concentrations of the exposure solutions for each treatment.
2.7. Statistical Analyses

19
Significant responses to boron exposures in terms of average seed germination
and early seedling growth were determined by statistically significant differences relative
to untreated controls (p≤0.05). Comparisons were made among treatments and controls to
estimate No Observed Effect concentration (NOEC) and Low Observed Effect
Concentration (LOEC) using Statistical Analysis System (SAS Institute Inc., Cary NC,
USA). Analysis of variance (ANOVA) with Dunnett’s multiple range tests for significant
differences relative to controls were performed if assumptions for parametric analyses
were met. One way ANOVA on ranks with a Wilcoxon test were performed if
assumptions for parametric tests were not met. Statistical procedures followed
recommendations of the U.S. EPA (2002) and included the trimmed Spearman-Karber
method for calculating the lethal mean concentration (LC50) (Hamilton et al., 1977). The
5% alpha level was used in all statistical tests.
3. Results and Discussions
3.1. Confirmation of boron exposures in laboratory tests
The targeted boron concentrations in the laboratory phytotoxicity tests with T.
latifolia and S. californicus were confirmed through analyses using an ICP-AES (Spectro
Flame Modula; ICP-AES) (U.S. EPA, 1983). Treatment concentrations for T. latifolia
tests ranged from 0.2 to 100 mg L-1 and measured boron concentrations were 92-125% of
nominal concentrations. Treatment concentrations in the S. californicus test ranged from
0.2 to 100 mg L-1and measured boron concentrations were 97-130% of nominal
concentrations.

20
3.2. Responses of Typha latifolia to boron and copper exposures
No effects of boron on T. latifolia seed germination in FGD water or MHW were
observed under these experimental conditions with boron concentrations ranging from
0.2 to 100.0 mg L-1 and seed germination of 89.6-100% (Table 1). Mueller et al. (2001)
and Moore et al. (1999) found germination of T. latifolia seeds to be relatively insensitive
to copper sulfate and atrazine exposures in comparison with growth of roots and shoots of
the early seedlings. The toxicity testing procedure used for these experiments involves a
step to select viable seeds for initiation of the experiment (McNaughton, 1968) and these
seeds germinated within three days after initiation of aqueous boron exposures. Growth
of the early T. latifolia seedlings after germination differed in FGD water and MHW. At
all boron concentrations in FGD water, no root emergence or elongation were observed
and shoots were yellow with lengths ≤5.36 mm over the 7-d of exposures. In boron
exposures in MHW, the NOEC and LOEC for T. latifolia shoot elongation were 25.8 and
49.9 mg B L-1, respectively, and for root elongation were 10.4 and 12.6 mg B L-1,
respectively (Figure 1). Seedling root growth was affected by 12.6 mg B L-1 in MHW and
root growth was completely impeded in FGD water, possibly due to boron, but likely due
to interaction with other elements or constituents in FGD water (Table 2). Yellowing and
depression of growth of T. latifolia shoots were not observed in any of the boron
treatments in MHW, suggesting that adverse effects on shoot growth observed in the
dilute FGD water amended with boron were also likely due to other elements or
constituents. The possibility of interactive effects (e.g. synergism) cannot be ruled out by
these experiments and will have to be evaluated in future experiments. These

21
experimental waters (diluted FGD and MHW) differed significantly in terms of
conductivity and hardness (Tables 3 and 4) as well as other constituents that may
influence phytotoxicity (Mierzejewski, 1999; Eggert, in review). Results from the
reference toxicity tests (Table 5) followed the same patterns previously observed for T.
latifolia (Muller et al., 2001). Root elongation was sensitive to copper exposures with an
NOEC and an LOEC of 14.7 and 46.7 µg Cu L-1, respectively (Figure 2).
3.3. Responses of Schoenoplectus californicus to boron exposures
Immature seedlings of S. californicus showed toxicity symptoms (browning and
etiolation of shoots) after the first week of exposure in boron amended FGD water and
MHW. However, phytotoxicity symptoms developed earlier in S. californicus seedlings
exposed to boron in dilute FGD water than seedlings exposed to the same boron
concentrations in MHW suggesting other factors contributed to the observed toxicity in
FGD water (Table 6). Seedling survival in diluted FGD water with a boron concentration
of 12.6 mg L-1 was ≤3.3%. In MHW amended with boron seedlings survival was ranged
from 23-96% and the LC50 for boron and S. californicus seedlings was 29.2 mg B L-1
with a 95% confidence interval of 24.7-34.4 mg B L-1. In MHW, significant adverse
effects on shoot growth and root growth were measured at all boron concentrations ≥25.8
mg L-1(Table 7). In MHW amended with boron at a concentration of ≤12.6 mg B L-1,
significantly enhanced shoot and root growth of S. californicus seedlings was observed
relative to untreated controls (0.2 mg B L-1). The NOEC and LOEC were 12.6 mg and
25.8 mg B L-1, respectively, for S. californicus response parameters (survival, shoot
growth, and root growth) in boron amended MHW.

22
3.4. Comparison of responses of T. latifolia and S. californicus to aqueous boron
exposures
Plant growth rate, boron concentrations, and duration of boron exposure may
influence boron toxicity (Powell et al., 1996). In this study T. latifolia was more sensitive
to boron exposures than S. californicus. This could be due to the differences in the age
(size) of the two plants, but is likely due also to differences in the plants’ physiology. T.
latifolia has characteristically rapid growth (Powell et al., 1996) and thus quick responses
to exposures are expected while S. californicus is characterized by moderate growth and a
longer exposure duration (35-d) was required to observe responses to boron exposures.
At a boron concentration of 12.6 mg L-1 and following 7-d of exposure, T. latifolia root
elongation was adversely affected in MHW and no root elongation was observed in
diluted FGD water. Root elongation was enhanced at 12.6 mg B L-1 in both MHW and
diluted FGD water for S. californicus. The LOEC for S. californicus root elongation (25.8
mg B L-1) was significantly greater than the LOEC for T. latifolia root elongation (12.6
mg L-1). The longer exposure duration (35-d vs. 7-d) and the higher boron concentration
required to observe adverse effects in root elongation (25.8 mg B L-1 vs. 12.6 mg B L-1)
indicated that S. californicus is less sensitive than T. latifolia to boron exposures even in
complex matrices such as FGD waters. Based upon the results from this study, adverse
effects of boron on seed germination would not be expected for T. latifolia in field
situations uncomplicated by other sources of phytotoxicity and seed germination for S.
californicus is so infrequent (≤1%) that effects of boron would be difficult to discern.
Also in this study, S. californicus shoots of seedlings exhibit chlorosis and death during

23
35-d of boron exposures (>25.8 mg B L-1) while the length of shoots of T. latifolia
seedlings decreased proportional to boron concentrations during 7-d exposures (post
germination). Importantly, root growth decreased with increasing concentrations of boron
for S. californicus (≥25.8 mg B L-1) and T. latifolia (12.6 mg B L-1) with no root growth
observed at boron concentrations ≥99.6 mg B L-1. For S. californicus seedling mortality
exceeded 60% at concentrations of boron ≥25.8 mg B L-1 and the LC50 for S. californicus
seedlings was 29.2 mg B L-1 with a 95% confidence interval of 24.7–34.4 mg B L-1. For
crop plants and other plants exposed to boron in field studies, chlorosis, necrosis, and
death are commonly reported as boron toxicity symptoms (Butterwick et al., 1989). In
field observations of T. latifolia, symptoms in response to aqueous and sediment
exposures of boron (>6 mg B L-1). Powell (1997) found no correlation between boron
concentrations and T. latifolia visual appearance during 6 months exposures. Wang
(1986) reported that Lemna minor frond production (the most sensitive response
measured) was unaffected by boron concentrations up to 60 mgL-1, so T. latifolia and S.
californicus root growth is more sensitive than L. minor to boron exposures.
Aquatic and wetland invertebrate species commonly used for toxicity testing such
as Chironomus decorus and Daphnia magna had 48-h LC50 values of 1, 376 and 141 mg
B L-1 (boron in the form of sodium tetraborate), respectively (Maier and Knight, 1991)
while Ceriodaphnia dubia had a 14-d LOEC for reproduction of 18.1 mg B L-1 (in the
form of boric acid) (Hickey, 1989). Sentinel aquatic vertebrate species such as
Pimephales promelas had a 7-d LC50 value of 81.6 mg B L-1 (in the form of boric acid)
(Damiri, chapter 4). The results of this research indicated that T. latifolia and S.

24
californicus are more sensitive to aqueous boron exposures than the relatively sensitive
aquatic animal species (D. magna and C. decorus)
4. Conclusions
Boron concentrations ≥12.6 mg L-1 adversely affected root growth of T. latifolia
early seedlings and S. californicus immature plants in MHW and FGD waters (7-d and
35-d exposures, respectively), however, other factors could have contributed to boron
toxicity to these plants in FGD waters. Germination of T. latifolia seeds did not respond
to aqueous boron exposures of 0.2 to 99.6 mg L-1 and germination of S. californicus was
insufficient to measure responses of germination to boron exposures. For T. latifolia,
shoot growth was affected at 49.9 mg B L-1 and at 25.8 mg L-1 for S. californicus. For S.
californicus, seedling mortality exceeded 60% at concentrations of boron >25.8 mg L-1
and the LC50 for S. californicus seedlings was 29.2 mg B L-1 with a 95% confidence
interval of 24.7–34.4 mg B L-1. Seedling survival in diluted FGD water in boron
concentrations ≥ 12.6 mg L-1 was ≤3.3%. In this study, a 7-d exposure duration was
sufficient to measure significant responses in T. latifolia root length exposed to boron
concentrations ≥12.6 mg L-1 in MHW, while 35-d were required for S. californicus,
possibly due to the slower growth of S. californicus relative to the rapid growth of T.
latifolia. Based on the results of this study, T. latifolia seedlings were more sensitive than
S. californicus immature seedlings to boron exposures. FGD waters contain a variety of
constituents that may be phytotoxic, and boron in conjunction with these constituents
may adversely affect T. latifolia and S californicus in constructed wetland treatment
systems designed for these waters.

25

26
References
Adriano, D.C., Shartiz, R. R., Ciravolo, T. G., Luvall, J. C., Harding, S. A., 1984. Growth and mineral nutrition of cattails inhabiting a Thermally–Graded South Carolina Reservoir: II. The micronutrients. J. Plant Nutr. 7, 1699-1716.
American Public Health Association (APHA), 1998. Standard Methods for Examination of Water and Wastewater (20th Edition).Washington, D.C: American Public Health Association.
Boutin, C., Freemark, K. E., Keddy, C.J., 1995. Overview and rationale for developing regulatory guidelines for nontarget plant testing with chemical pesticide. Environ. Toxicol. Chem. 14, 1465–1475.
Brusick, D.J.,Young, R.R., 1982. Project summary IERL-RTP procedures manual: Level 1 environmental assessment, biological tests. Environmental Protection Agency, EPA 89/ 2:600/58-81-024 Environmental Protection Agency, Research Triangle Park, NC.
Butterwick, L., Oude, N., Raymond, K., 1989. Safety assessment of boron in aquatic and terrestrial environments. Ecotox. Environ.Safe. 17, 339-371.
Changwoo, A., Mitsch, J.W., 2001 Chemical analysis of soil and leachate from experimental wetland mesocosms lined with coal combustion products. J.Environ. QuaL. 30, 1457-146.
Dickerman, J.A., Wetzel, R.G., 1985. Clonal growth in Typha latifolia: population dynamics and demography of ramets. J. Ecol. 73, 535-552.
Eggert, D., Rodgers, J. H., Jr., Huddleston, G. M. III, Hensman, C.E., 2007 (in review). Performance of pilot-scale constructed wetland treatment systems for flue gas desulfurization (FGD) waters. In review in Environ. Geosci.
Goldberg, S., 1997. Reactions of boron with soils. Plant Soil. 193, 35-48.
Hamilton, M.A., R.C. Russo, and R.V. Thurston. 1977. Trimmed Spearman-Karber method for estimating median lethal concentrations. Environ. Sci. Technol. 11, 714-.719
Hickey, C.W., 1989. Sensitivity of four New Zealand cladoceran species and Daphnia magna to aquatic toxicants. New Zeal. J. Mar. Fresh. Res. 23, 131-137.

27
Howard R. J. and Rafferty, P. S., 2005. Clonal variation in response to salinity and flooding stress in four marsh macrophytes of the northern golf of Mexico, USA. Environ. Exp. Bot. 56, 301-313.
Keane, B. Pelikan S., Toth G.P., Smith M.K., Rogstad S.H., 1999. Genetic diversity of Typha latifolia (Typhaceae) and the impact of pollutants examined with Tandem-Repetitive DNA probes. Am. J. Bot. 86, 1226-1238.
Lamminen, M., Wood, J., Walker, H., Chin, Y.-P., He, Y., Traina, S.J., 2001. Effect of flue gas desulfurization (FGD) by-product on water quality at an underground coal mine. J. Environ. Qual. 30, 1371-1381.
Lombardi, T., Fochetti, T., Bertacchi, A., Onnis, A., 1997. Germination requirements in a population of Typha latifolia. Aquat. Bot. 56, 1-10.
Maier, K. J., Knight, A.W., 1991. The toxicity of waterborne boron to Daphnia magna and Chrimonomus decorus and the effects of water hardness and sulfate on boron toxicity. Arch. Environ. Contam. Toxicol. 20, 282-287.
McNaughton, S. J., 1968. Autotoxic feedback in relation to germination and seedling growth in Typha latifolia. Ecology. 49, 367-369.
Mierzejewski, M.K., 1991. The elimination of pollutants from FGD wastewaters, The 1991 SO2 Control Symposium, Washington.
Moore, M. T., Huggett, D. B., Huddleston, G. M. III., Rodgers, J. H. Jr., Cooper, C. M, 1999. Herbicide effects on Typha latifolia (Linneaus) germination and root and shoot development. Chemosphere. 38, 3637-3647.
Muller, S.L., Huggett, D. B., Rodgers J. H. Jr. 2001. Effects of copper sulfate on Typha latifolia seed germination and early seedling in aqueous and sediment exposures. Arch.Environ. Contam. Toxicol. 40, 192-197.
Murray-Gulde, C. L., Huddleston, G. M., III. Garber, K. V., Rodgers, J. H. Jr., 2005. Contributions of Schoenoplectus californicus in a constructed wetland system receiving copper contaminated wastewater. Water Air Soil Pol. 163, 355-378.
Nable, R. O., Bañuelos, G. S., Paull, J. G., 1997. Boron toxicity. Plant Soil. 193,181- 198.
Polat, H., Vengosh, A., Pankratov, I., Polat, M., 2004. A new methodology for removal of boron from water by coal and fly ash. Desalination. 164, 173-188.

28
Powell, R.L., Kimerle, R. A., Moser, E.M., 1996. Development of a plant bioassay to assess toxicity of chemical stressors to emergent macrophytes. Environ. Toxicol. Chem. 15, 1570-1576.
SAS Institute Inc., 1989. SAS/STAT user’s guide. Verison 6. (4th Edition). Cary, NC.
Sinicrope, T.L., Langis, R., Gersberg, R.M., Busnardo, M.J., Zedler, J.B., 1992. Metal removal mesocosms subjected to different hydro periods. Ecol. Eng. 1, 309-322.
U.S. Environmental Protection Agency, 1983. Method 200.7: Inductively coupled plasma. In Methods for Chemical Analysis of Water and Wastes. EPA-600/4-79-020. Cincinnati, OH.
U.S. Environmental Protection Agency, 2002 Short-term methods for estimating the chronic toxicity of effluents and receiving water to freshwater organisms, EPA/821/R-02-013 Washington DC.
Wang, W., 1986. Toxicity tests of aquatic pollutants by using common duckweed. Environ. Pol., Series B 1, 1-14.
Wang, W. C., Freemark K., 1995. The use of plants for environmental monitoring and assessment. Ecotox. Environ. Safe. 30, 289-301.
Ye, Z. H., Lin, Z. -Q., Whiting, S. N, de Souza, M. P., Terry, N., 2003. Possible use of constructed wetlands to remove selenocyanate, arsenic, and boron from electric utility wastewater. Chemosphere. 52, 1571-1579.
29
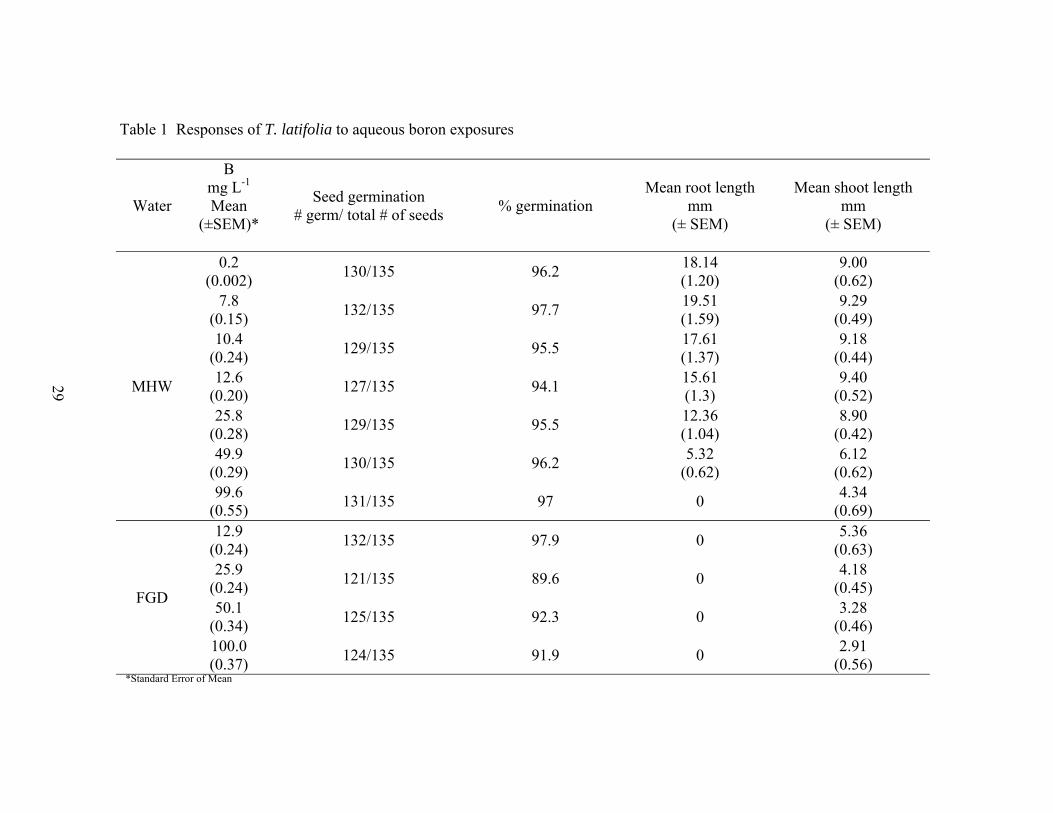
Table 1 Responses of T. latifolia to aqueous boron exposures
*Standard Error of Mean
Water
B mg L-1 Mean
(±SEM)*
Seed germination # germ/ total # of seeds % germination
Mean root length mm
(± SEM)
Mean shoot length mm
(± SEM)
MHW
0.2 (0.002) 130/135 96.2 18.14
(1.20) 9.00
(0.62) 7.8
(0.15) 132/135 97.7 19.51 (1.59)
9.29 (0.49)
10.4 (0.24) 129/135 95.5 17.61
(1.37) 9.18
(0.44) 12.6
(0.20) 127/135 94.1 15.61 (1.3)
9.40 (0.52)
25.8 (0.28) 129/135 95.5 12.36
(1.04) 8.90
(0.42) 49.9
(0.29) 130/135 96.2 5.32 (0.62)
6.12 (0.62)
99.6 (0.55) 131/135 97 0 4.34
(0.69)
FGD
12.9 (0.24) 132/135 97.9 0 5.36
(0.63) 25.9
(0.24) 121/135 89.6 0 4.18 (0.45)
50.1 (0.34) 125/135 92.3 0 3.28
(0.46) 100.0 (0.37) 124/135 91.9 0 2.91
(0.56)
29

30
Table 2 Responses of T. latifolia to boron and copper exposures and S. californicus to boron exposure
Plant Response Parameters
B mg B L-1
Cu µg Cu L-1
NOEC
LOEC
NOEC
LOEC
T. latifolia Seed germination NA NA NA NA
Shoot elongation 25.8 49.9 NA NA
Root elongation 10.4 12.6 14.7 46.7
S. californicus
Shoot elongation 12.6 25.8
Root elongation 12.6 25.8
Survival 12.6 25.8
LC50
29.2 95% CI (24.7-34.4)
30
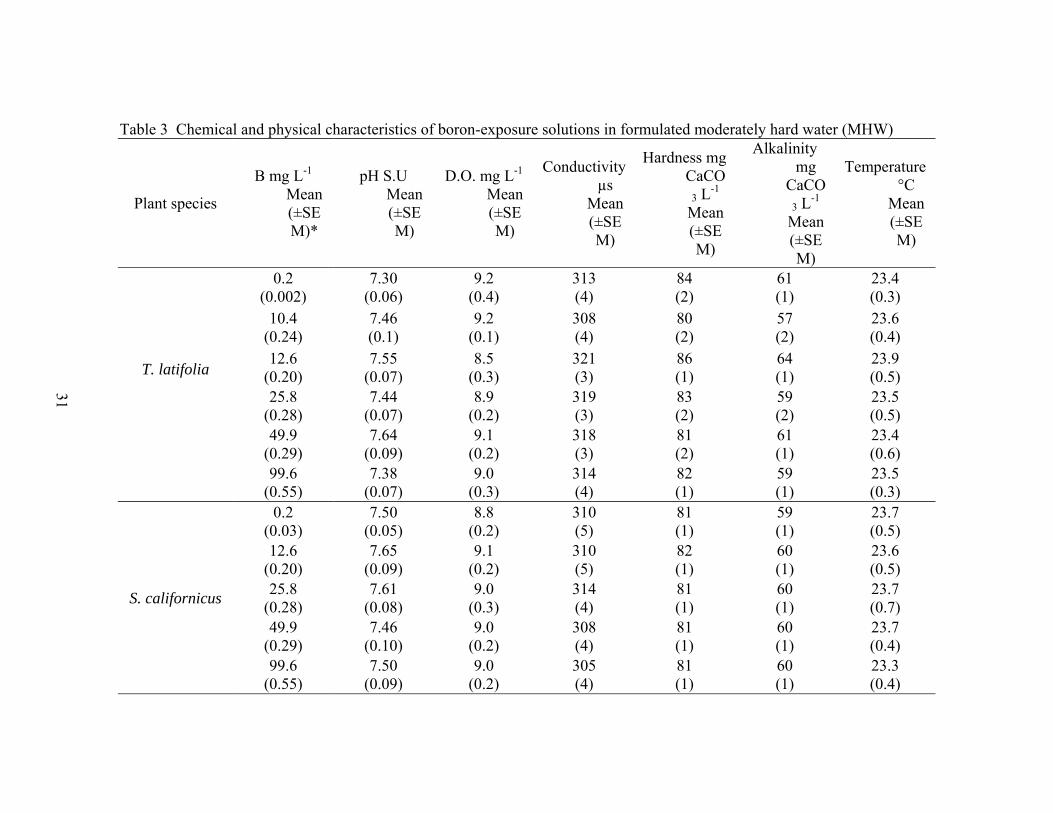
31
Table 3 Chemical and physical characteristics of boron-exposure solutions in formulated moderately hard water (MHW)
Plant species
B mg L-1 Mean (±SEM)*
pH S.U Mean (±SEM)
D.O. mg L-1
Mean (±SEM)
Conductivity µs
Mean (±SEM)
Hardness mg CaCO
3 L-1
Mean (±SEM)
Alkalinity mg
CaCO3 L-1
Mean (±SEM)
Temperature °C
Mean (±SEM)
T. latifolia
0.2 (0.002)
7.30 (0.06)
9.2 (0.4)
313 (4)
84 (2)
61 (1)
23.4 (0.3)
10.4 (0.24)
7.46 (0.1)
9.2 (0.1)
308 (4)
80 (2)
57 (2)
23.6 (0.4)
12.6 (0.20)
7.55 (0.07)
8.5 (0.3)
321 (3)
86 (1)
64 (1)
23.9 (0.5)
25.8 (0.28)
7.44 (0.07)
8.9 (0.2)
319 (3)
83 (2)
59 (2)
23.5 (0.5)
49.9 (0.29)
7.64 (0.09)
9.1 (0.2)
318 (3)
81 (2)
61 (1)
23.4 (0.6)
99.6 (0.55)
7.38 (0.07)
9.0 (0.3)
314 (4)
82 (1)
59 (1)
23.5 (0.3)
S. californicus
0.2 (0.03)
7.50 (0.05)
8.8 (0.2)
310 (5)
81 (1)
59 (1)
23.7 (0.5)
12.6 (0.20)
7.65 (0.09)
9.1 (0.2)
310 (5)
82 (1)
60 (1)
23.6 (0.5)
25.8 (0.28)
7.61 (0.08)
9.0 (0.3)
314 (4)
81 (1)
60 (1)
23.7 (0.7)
49.9 (0.29)
7.46 (0.10)
9.0 (0.2)
308 (4)
81 (1)
60 (1)
23.7 (0.4)
99.6 (0.55)
7.50 (0.09)
9.0 (0.2)
305 (4)
81 (1)
60 (1)
23.3 (0.4)
31

32
Table 4 Chemical and physical characteristics of boron-exposure solutions in flue gas desulfurization (FGD) water
Plant species
B mg L-1
Mean (±SEM)*
pH SU
Mean (±SEM)
D.O. mg L-1
Mean (±SEM)
Conductivity µS
Mean (±SEM)
Hardness mg CaCO3 L-1
Mean (±SEM)
Alkalinity mg CaCO3 L-1
Mean (±SEM)
Temperature °C
Mean (± SEM)
T. latifolia
12.9 (0.24)
7.43 (0.06)
8.9 (0.3)
6511 (122)
3142 (27)
61 (1)
23.4 (0.5)
25.9 (0.24)
7.65 (0.02)
9.2 (0.4)
6399 (152)
3254 (22)
61 (1)
23.5 (0.7)
50.1 (0.34)
7.69 (0.06)
9.0 (0.3)
6299 (137)
3205 (14)
61 (1)
23.4 (0.4)
100.0 (0.37)
7.56 (0.08)
9.0 (0.2)
6349 (152)
3301 (35)
60 (1)
23.6 (0.1)
S. californicus
12.9 (0.24)
7.72 (0.07)
8.9 (0.2)
6423 (131)
3138 (24)
61 (1)
23.7 (0.6)
25.9 (0.24)
7.85 (0.03)
9.0 (0.2)
6433 (140)
3213 (13)
62 (1)
23.6 (0.6)
50.1 (0.34)
7.79 (0.04)
8.9 (0.2)
6373 (119)
3188 (13)
60 (1)
23.7 (0.1)
100.0 (0.37)
7.70 (0.06)
9.1 (0.2)
6388 (143)
3225 (25)
59 (1)
23.8 (0.1)
32

33
Table 5 Responses of T. latifolia to aqueous copper exposures Cu concentrations
(µg L-1) Mean
(±SEM)
Seed germination #germ/ total # of seeds % seed germination
Mean root length mm
(± SEM)
Mean shoot length mm
(± SEM)
9.8 (1.40) 126/135 93.3 15.27
(0.16) 9.4
(0.16)
14.7 (1.30) 126/135 93.3 15.63
(0.11) 9.39
(0.12)
46.7 (3.20) 135/135 100 12.43
(0.12) 9.71
(0.15)
165.6 (10.4) 123/135 91 3.8
(0.13) 9.49
(0.13)
384 (23.5) 130/135 96.3 0.88
(0.12) 9.75
(0.09)
1060.8 (43.3) 127/135 94.1 0 9.11
(0.1)
33

34
Table 6 Visual observations during 35-d exposure of S. californicus to boron
Exposure Duration (Week)
Type of water
MHW FGD water
First Week
New shoots and roots developed at all boron concentrations.
New shoots and roots developed at all boron concentrations.
Second Wee
k
At 99.6 mg B L-1, shoot browning observed in 12/30 plants.
At 50 mg B, L-1 shoot browning observed in 5/30 plants At 100 mg B/L, shoot browning observed in 17/30 plants.
Third Week
At 49.9 mg B L-1, shoot browning observed in 10/30 plants.
At 99.6 mg B L-1, white shoots observed in 10/30 plants and brown shoots observed in 23/30 plants.
At 12.8 and 25.8 mg B L-1, shoot browning observed in 5/30 plants.
At 50 and100 mg B L-1, white shoots observed in > 21/30 plants.
Fourth Week
At 25.8 mg B L-1, shoot browning observed in 13/30 plants.
At 49.9 and 99.6 mg B L-1, most shoots were brown and some plants had white shoots only.
At 12.7 and 25.8 mg B L-1, white shoots observed in >25/30 plants.
At 50, 100mg B L-1,100 % of the plants had white shoots.
Fifth Week
At 25.8 and 49.9 mg B L-1, 60 and 77% of plants had only white shoots.
At 99.6 mg B L-1, 100% of plants had only white shoots.
Plants had white shoots except one plant at boron concentration 12.7 mg B L-1 had green shoots.
34

35
Table 7 Responses of immature seedlings of S. californicus to aqueous boron exposures
Water
B mg L-1
Mean (± SEM)
# survived plants/Total plants
% living
plants
Initial mean shoot
length cm
(Min-Max)
Final mean shoot
length cm
(Min-Max)
Initial mean root
length cm
(Min-Max)
Final mean root
length cm
(Min-Max) MHW 0.2
(0.002) 24/29a 82.8 1.56 (0.98-1.953)
4.91 (2.33-9.63)
1.36 (0.44-1.98)
2.16 (1.00-4.07)
12.6 (0.20) 29/30 96.7 1.60
(1.00-2.00) 5.52
(1.93-8.86) 1.46
(0.43-2.19) 2.77
(0.86-7.80)
25.8 (0.28) 12/30 40 1.72
(1.13-1.98) 3.22
(1.77-4.23) 1.63
(0.34-1.98) 1.78
(1.25-4.76)
49.9 (0.29) 7/30 23.3 1.66
(0.82-2.01) 3.40
(2.23-5.97) 1.47
(0.42-2.33) 1.21
(1.12-3.97)
99.6 (0.55) 0/30 0 1.72
(1.3-1.98) 0 1.41 (0.36-1.96) 0
FGD
12.9 (0.24) 1/30 3.3 1.61
(1.02-1.95) 2.09 1.45 (0.51-2.07) 2.1
25.9 (0.24) 0/30 0 1.63
(1.06-1.98)
NA 1.40
(0.14-2.41)
NA
50.1 (0.34) 0/30 0 1.66
(0.68-1.99)
NA 1.47
(0.49-1.99)
NA
100.0 (0.37) 0/30 0 1.72
(.0.99-1.99)
NA 1.32
(0.28-1.99)
NA a One plant was broken
35

36
Root (mm) = -0.2045x + 18.713Shoot (mm) = -0.0549x + 9.6494
0
5
10
15
20
25
0 10 20 30 40 50 60 70 80 90 100 110 mg B L-1
mm
Shoot RootLinear (Root)Linear (Shoot )
Fig. 1. Boron effects on T. latifolia shoot and root lengths
Root (mm) = -0.0131x + 11.119
Shoot (mm)= -0.0003x + 9.5861
0
2
4
6
8
10
12
14
16
18
20
0 200 400 600 800 1000 1200
µg Cu L-1
mm
ShootsRootsLinear (Roots)Linear (Shoots)
Fig. 2. Copper effects on T. latifolia shoot and root lengths

37
CHAPTER 3
EFFECTS OF AQUEOUS EXPOSURES OF BORON ON MATURE PLANTS OF TYPHA LATIFOLIA AND SCHEONOPLECUTS
CALIFORNICUS
Abstract
Typha latifolia Linnaeus and Schoenoplectus californicus C. A. Meyer Palla are
used in constructed wetland treatment systems (CWTS) to treat flue gas desulfuriztion
(FGD) waters, and boron may be phytotoxic in these waters. The objectives of this
research were to determine responses of T. latifolia and S. californicus to a series of
concentrations of boron (as boric acid) in simulated FGD water following 13 months of
exposure, to measure concentrations of boron in the hydrosoil and bioconcentration of
boron in plant tissue (i.e. shoots and roots), to determine relationships between responses
of T. latifolia and S. californicus to boron exposures and concentrations of boron
measured in roots and shoots, and to compare the responses of T. latifolia and S.
californicus to boron exposures. In this experiment, aqueous concentrations of boron
greater than 25 mg L-1 adversely affected both T. latifolia and S. californicus with
browning and yellowing of shoots and decreased shoot density and height for S.
californicus. The shoot density of T. latifolia decreased by 50% at 300 mg B L-1. In both
the shoots and the roots of these species, concentrations of boron increased proportionally
with aqueous exposure concentrations as did the concentrations of boron in the hydrosoil.
Thus adverse effects of boron were related not only to the aqueous boron exposures, but
also to boron concentrations in the hydrosoil, roots and shoots. S. californicus was more
sensitive than T. latifolia to aqueous boron exposures in simulated FGD water with 100%

38
mortality of S. californicus at 300 mg L-1 , and shoot density and shoot height at 100 mg
B L-1 were 43% and 40% less than untreated FGD water controls, respectively.
Key Words: Boron, FGD water, T. latifolia, S. californicus.
1. Introduction
Boron phytotoxicity to Typha latifolia Linnaeus and Schoenoplectus californicus
C. A. Meyer Palla used in constructed wetland treatment systems (CWTS) to treat flue
gas desulfurization (FGD) waters is a concern due to the functional importance of these
wetland plant species and due to the relatively large volumes of FGD waters and elevated
boron concentrations in these waters. Selection of plants used in constructed wetland
treatment systems for renovation of contaminated waters is a critical step in the design
process in order to achieve the targeted performance (Huddleston et al., 2000; Murray-
Gulde et al., 2005). T. latifolia and S. californicus have been used in numerous CWTS
designed to treat inorganics (arsenic, cadmium, copper, cyanide, lead, mercury, nitrogen,
phosphorous, selenium, and zinc) (Sinicrope et al., 1992; Sobolewski et al.,1996;
Hawkins et al., 1997; Ansola et al. , 2003; Huett et al., 2005; Murray-Gulde et al., 2005)
and organic compounds (biochemical oxygen demand, chemical oxygen demand, and
chlorinated organics) (Moore et al., 2000; Sherrard et al., 2004). In order to understand
the functional role of these constructed wetland plants used in phytoremediation of
contaminated waters, additional data are needed regarding their environmental
requirements and tolerances for constituents contained in complex wastestreams or
contaminated waters.

39
Often constructed wetland treatment systems are designed with emphasis on
sequestering toxic constituents of concern in the hydrosoil (Murray-Gulde et al., 2005) or
designed based on phytoconcentration of these constituents within plant tissues (Ye et al.,
2003). Data regarding the relative partitioning of potentially toxic elements or
compounds in plant tissues and to hydrosoil within CWTS can aid in design of these
systems as well as understanding the potential toxicity that certain constituents may pose
risks to wetland plants used in these treatment systems.
Renovation of waters associated with thermoelectric power generation is needed
in order to reuse these waters (e.g. cooling waters) or discharge them into aquatic
receiving systems (Mierzejewski, 1991; Eggert, in review) due to problematic
constituents contained in these waters. With the advent of more stringent air quality
standards, flue gas desulfurization technology is being implemented to decrease sulfur
dioxide emissions (Lamminen et al., 2001). During coal combustion, flue gases
containing sulfur dioxide (SO2) and other gaseous elements are produced. Some of these
gaseous elements and compounds are transferred and transformed into soluble species by
wet scrubbing of flue gases (Solan et al., 1999). The resulting water produced by the wet
scrubbing of flue gases is referred to as FGD water. The number of these scrubbing
systems is increasing within the U.S. and consequently the annual production of FGD
waters is increasing.
Constructed wetlands have been suggested for treatment of constituents of
concern in FGD waters (Eggert, in review). Boron in FGD waters may be phytotoxic to
wetland plant species in constructed wetland treatment systems, but potential boron

40
toxicity is dependent on factors such as its concentration, form, frequency of occurrence,
and duration of exposure in these waters. FGD waters can also contain elevated
concentrations of other potentially phytotoxic constituents including arsenic, cadmium,
chemical oxygen demand, chlorides, chromium, copper, lead, mercury, selenium, sulfate,
zinc and hardness (e.g. calcium, iron, and magnesium), and are typically semi-neutral in
pH (Mierzejewski, 1991). FGD waters vary in their composition and characteristics
which are influenced by many factors such as coal type used, source water used in the
scrubber, and type of flue gas scrubber employed (Eggert, in review). Since these waters
vary widely in composition (e.g. boron concentrations), their phytotoxicity may also
vary. In order to effectively use T. latifolia and S. californicus to remediate FGD waters,
we need to understand the responses of these plants to exposures of boron in FGD waters.
Since full-scale constructed wetland treatment systems are costly and inefficient
for experimental purposes, a smaller scale experimental system is advantageous for
assessing the effects of boron in FGD waters on these wetland plants. Studies in small
containers can provide crucial information and important benefits such as rigorous testing
of hypotheses through replication, control of environmental conditions, and cost effective
results. Since FGD waters vary based on site specific operations, simulated FGD waters
can be used to control composition of the experimental water, and to provide flexibility to
alter constituents of interest such as boron concentrations in these experiments. The
objectives of this research were:1) to determine responses of T. latifolia and S.
californicus in terms of shoot height, shoot density, number of leaves per shoot (T.
latifolia), length of brown shoot (necrotic tissues), and number of inflorescences

41
produced following 13 months of exposure to a series of concentrations of boron (as
boric acid) in simulated FGD water, 2) to measure concentrations of boron in the
hydrosoil and bioconcentration of boron in plant tissue (i.e. shoots and roots) of T.
latifolia and S. californicus after 13 months of exposures to boron (boric acid) in
simulated FGD water, 3) to determine relationships between responses of T. latifolia and
S. californicus to boron exposures and concentrations of boron measured in the roots and
shoots of these plants, and 4) to compare the responses of T. latifolia and S. californicus
following 13 months of exposures to boron (as boric acid) in simulated FGD water.
2. Materials and Methods
25.1. Exposure waters
Simulated FGD water was formulated by amending city water (Clemson, SC)
with high-purity salts (Fisher Scientific, Inc) containing constituents of concern (Hg, Se,
and As), technical grade salts of magnesium and calcium chloride, calcium sulfate, fly
ash, and dibasic acid (Table 1). Simulated FGD water was formulated based on data from
chemical analyses of actual FGD waters (Eggert, in review). For T. latifolia and S.
californicus experiments, treatments were prepared by amending simulated FGD water
with boric acid salts to achieve nominal boron exposure concentrations of 15, 50, 100,
and 300 mg L-1 and 25, 50, 100, 300, 600 mg L-1, respectively. In both the T. latifolia and
S. californicus tests, two controls were used: an unamended simulated FGD water [no
boron added (CFGD)], and a low ionic strength control consisting of city water (C).

42
2.2. Experimental design
Bucket-scale experiments were conducted in controlled green house with a 16/8
light-dark photoperiod and temperature of 27 ± 3 ºC using T. latifolia (mature plants) and
S. californicus plants (>1.5 years old and <126 cm). The hydrosoil used in these
experiments was collected from a full-scale constructed wetland treatment system
designed to treat FGD waters. Hydrosoil composition was dominated by clay (>70%)
with sand, silt, and organic matter accounting for 23%, 5%, and 2%, respectively (Black,
1986). Five-gallon plastic (HDPE) buckets were filled to approximately 24 cm with
hydrosoil and planted with five plants of T. latifolia or S. californicus per bucket. Three
replicates were used per treatment. The plants were collected from a wetland site in
Catawba County, NC. Both plant species were allowed to acclimate in the buckets and
were supplied city water (8L per bucket) for a period of one and a half months before
initiation of boron treatments. Osmocote ® time-release fertilizer (2.5 grams, 14-14-14)
and 8-liters of simulated FGD water amended with boron were added to each bucket in
the initiation of the experiment. To correct for effects of evapotranspiration and altered
ionic strength of the exposure waters, city water was added to each bucket as needed.
Exposure waters containing boron were renewed when the ionic strength decreased to
less than 7 mS/cm. Boron concentrations in the overlying water were measured monthly
and maintained at nominal treatment concentrations by addition of boric acid salts as
needed. Water chemistry parameters (pH, Temperature, DO, EC, hardness, and
alkalinity) were analyzed according to Standard Methods (APHA, 1998).

43
2.3. Response measurements
Shoot density, shoot or leaf height and shoot or leaf appearance, live (green or
senescent shoot or leaf), or dead (totally brown shoot or leaf), and the length of the brown
portion of the shoot (necrotic tissues), were measured 3 times during the 13 months of the
experiment. For this experiment, a shoot was considered to be the emergent portion of the
plant from the hydrosoil.
2.4. Plant and soil analyses
Soil samples were collected for analysis at termination of the experiment (after 13
months). Each soil sample was divided into two segments [surface (~12 cm deep) and
subsurface soil (~12-24 cm deep)], and analyzed for pH and boron concentrations using a
hydrochloric acid extraction method (Method 6010), (U.S.EPA, 1986). For plant analysis,
one ramet was chosen randomly from each bucket and was rinsed thoroughly with Milli-
Q water. The rhizome with the associated roots was separated from the shoots, and both
segments were analyzed for boron using a dry ash method (Method 6010) (U.S. EPA,
1986). Boron was measured in S. californicus shoots that were brown for comparison
with concentrations in green shoots. The targeted aqueous boron concentrations in
phytotoxicity tests with T. latifolia and S. californicus were confirmed through analyses
using Inductively Coupled Plasma Atomic Emission Spectrometer (Spectro Flame
Modula; ICP-AES) according to EPA Method 200.7. (U.S. EPA, 1983).
2.5. Statistical Analyses
Significant responses to boron exposures in terms of length or height of shoot and
number of shoots were determined by statistically significant differences relative to

44
untreated controls (p≤0.05) using Statistical Analysis System (SAS Institute Inc., Cary
NC, USA). Analysis of variance (ANOVA) with Dunnett’s multiple range tests for
significant differences relative to controls was performed if assumptions for parametric
analyses were met. One way ANOVA on ranks with Wilcoxon test was performed if
assumptions for parametric tests were not met. Linear regression analysis (General Linear
Model (GLM)) used to quantify differences in boron concentrations in the soil and plant
tissues of both T. latifolia and S. californicus was performed using SAS. The 5% alpha
level was used in all statistical tests.
3. Results and Discussion
3.1. Confirmation of boron exposures
Boron treatment concentrations for T. latifolia tests ranged from 0.2 to 300 and
measured boron concentrations were 92-126% of nominal concentrations. Treatment
concentrations for the S. californicus test ranged from 0.2 to 600 and measured boron
concentrations were 95-134% of nominal concentrations (Tables 2 and 3). Physical and
chemical properties of exposure boron waters for T. latifolia and S. californicus are
presented in Tables 4 and 5.
3.2. Plant responses
Symptoms of boron toxicity to T. latifolia and S. californicus developed
progressively during the duration of the experiment (13 months) and were proportional to
boron exposures. Although heights of T. latifolia leaves, and number of leaves were not
adversely affected at boron exposure concentrations ≤300 mg L-1, shoot density was
significantly adversely affected at 300 mg B L-1 (Figures 1 and 2). For T. latifolia,

45
necrotic tissue appeared in the tips of older leaves as spotting and yellowing during the
first two weeks of exposure and progressed during the first two months in boron
treatments ≥300 mg L-1. However, necrotic tissue developed in all boron treatments
following 4-months of exposure, but necrotic tissue increased significantly (100-200%,
relative to the control) at boron concentrations of ≥50 mg L-1 (Table 6). These are typical
boron phytotoxicity symptoms (Blevins and Lukaszewski, 1998). Following 13 months
of exposure, the remaining green leaves (living tissue) were young leaves (totally green
leaves <20cm) which were not exposed to boron for sufficient duration to manifest
apparent adverse effects, mostly in boron treatments ≤100 mg L-1. Totally brown leaves
were the older leaves (≤180 cm). T. latifolia did not produce any inflorescences even in
the controls during the 13 months of this experiment.
Schoenoplectus californicus shoot height, shoot density, and inflorescence
production significantly decreased with increasing boron exposure concentrations ≥100
mg L-1 (Figure 3 and 4). For S. californicus, necrotic tissue appeared in the tips of older
leaves, and spotting and yellowing progressed into the shoot. Symptoms of boron
phytotoxicity developed progressively during the 13 months of the experiment and the
intensity of the symptoms increased with increasing boron concentrations. The brown
portion of the shoot (necrotic tissues) increased significantly (200-300%) at boron
concentrations of ≥50 mg L-1 (Table 7). Shoots without necrosis (totally green leaves
<17cm) most probably were young shoots which were not exposed to boron for sufficient
duration to manifest symptoms of phytotoxicity. At boron concentrations ≥300 mg L-1,
only totally brown shoots (necrotic tissue) were observed. The number of inflorescences

46
was negatively affected by increasing boron concentrations and production of
inflorescences completely ceased at boron concentrations ≥300 mg L-1 during the13-
month exposures to boron (Figure 4).
3.3. Boron concentrations in the hydrosoil and plant tissues
3.3.1. Boron concentrations in the hydrosoil
The results of this study indicated that boron concentrations in the surface soil
(~12 cm) were not significantly different from boron concentrations in the subsurface soil
(~12-24 cm) (Tables 2 and 3). Boron concentrations in the hydrosoil were proportional
(99-105 %) to boron concentrations in exposure waters for all T. latifolia and S.
californicus treatments ≤ 100mg L-1. Hydrosoil boron concentrations in the T. latifolia
and S. californicus treatments of 300 and 600 mg L-1 were not proportional to aqueous
boron concentrations (74 and 42 %, respectively) indicating that the hydrosoil adsorption
capacity was exceeded at boron treatments ≥300 mg L-1.
3.3.2. Boron concentrations in plant tissues
Boron concentrations in T. latifolia and S. californicus roots and shoots increased
with increasing aqueous boron exposure concentrations (Figures 4 and 5). However, the
shoots had higher boron bioconcentrations than the roots. For instance, T. latifolia shoots
had boron concentrations 2-4 times greater than the roots (Table 2). In S. californicus
treatments of ≤100 mg B L-1, boron concentrations in the brown shoots (necrotic tissue)
were 15-39 times more than boron concentrations in the roots (Table 3), while in
treatments of ≥300 mg B L -1, boron concentrations were 1-3 times higher in the brown
shoots than the roots (Figure 6).

47
3.4. Correlation between plant responses to boron exposures and boron
concentrations in the hydrosoil and plant tissues
Length of shoot browning (necrotic tissues) observed in T. latifolia and S.
californicus shoots significantly increased with increasing boron exposures and
consequently, with increasing boron concentrations in the shoots and the roots indicating
that these symptoms were developed due to boron exposures. In comparison with
controls, T. latifolia had the greatest production of necrotic tissue and brown shoot length
(3.7 times), and plant density was significantly affected (50%) at a boron concentration of
300 mg L-1. For S. californicus treatments ≤100 mg L-1, significant decreases in shoot
density (≤43%), shoot height (≤40%), and inflorescence production (≤90%) were
observed, however, significant boron bioconcentration was also observed in the roots and
the shoots at these relatively low concentrations. For boron concentrations of ≥300 mg L-
1, totally brown shoots (necrotic shoots) and no production of inflorescences were
observed. At these higher concentrations of boron, significant decreases (28-58%) in
boron concentrations in the hydrosoil in proportional to exposure boron concentrations
were also observed indicating that the hydrosoil adsorption capacity may be exceeded.
3.5. Differences between T. latifolia and S. californicus responses
Typha latifolia and Schoenoplectus californicus differ in their responses and
tolerance of boron exposures, as well as bioconcentration potential for boron in simulated
FGD water. Boron concentrations in T. latifolia hydrosoil and roots did not differ
significantly from boron concentrations in S. californicus hydrosoil and roots (Figure 7
and 8). However, S. californicus had significantly more boron in its shoots than T.

48
latifolia (Figure 9). Therefore, differences in the responses of T. latifolia and S.
californicus to boron exposures could be related to significant differences in boron
bioconcentration in shoots. Necrotic tissue increased significantly with increasing boron
concentrations in shoots. For the duration of this experiment, T. latifolia withstood (green
and senesced shoots were present) boron concentrations of 300 mg B L-1 with significant
adverse effects on shoot density, while S. californicus did not withstand (totally brown
shoots) boron concentrations ≥300 mg L-1. T. latifolia shoot density, leaf height, and
number of leaves per shoot were not adversely affected at boron concentrations ≤100 mg
B L-1. In contrast, S. californicus shoot density and height were adversely affected at
boron concentrations of ≥100 mg L-1(Table 8).
The wide variance in responses of plants species to aqueous exposures of boron
was reviewed by Blevins and Lakaszewski (1998). The effects of boron on a range of
plants from jack pine (Pinus banksiana) to duckweed (Spirodella polyrrhiza) have been
evaluated in careful laboratory studies (Apostol and Zwiazek, 2004; Davis et al., 2002).
After 6 weeks of exposure, chlorosis and necrosis related to boron exposure was observed
in jack pine (Apostol and Zwiazek, 2004). Duckweed was relatively sensitive with a 10-d
EC50 of about 18-22 mg B L-1 (Davis et al., 2002). In the present study, mature plants of
T. latifolia and S. californicus responded to concentrations of boron at ≥50 mg L-1.
Powell et al. (1996) reported that T. latifolia accumulated relatively little boron but
developed chlorosis in four weeks of exposure in laboratory bioassays. In a field
investigation, Powell et al. (1997) found no correlation between tissue concentrations of
boron in T. latifolia and plant health; however boron concentrations in this study were not
49
sufficient to cause severe adverse effects. In the present study, plant tissue concentrations
of boron were strongly related to observed adverse effects for S. californicus but less
strongly related for T. latifolia. In a treatment wetland microcosm study of coal
gasification wastewater containing boron, Ye et al. (2003) found that most (57%) of the
boron accumulated in the sediment with relatively little in the plants and growth of T.
latifolia was not affected by this complex mixture (coal gasification wastewater) over the
54-d study. The data in the present study also indicate the need for careful selection of
wetland plants for remediation of contaminated waters containing multiple constituents of
concern. Prior evaluations are useful for selection of compatible plants for treatment
systems for complex matrices such as FGD waters that may contain phytotoxic
concentrations of boron, especially if other constituents have the capacity to interact
synergistically.
4. Conclusions
The results of this study demonstrated that boron toxicity is manifested over time
in T. latifolia and S. californicus with signs of toxicity increasing with the duration of
exposure. These results indicated that boron in FGD waters can adversely affect T.
latifolia and S. californicus (necrosis) at boron concentrations >25 mg L-1. In this study,
S. californicus shoot height and density were negatively affected at boron concentrations
of ≥100 mg L-1 while T. latifolia shoot density alone was adversely affected at boron
concentrations of ≥300 mg L-1. For both plants, boron concentrations in hydrosoil were
proportional to aqueous boron exposures and were significantly less than boron
concentrations in the roots. Boron was bioconcentrated in the shoots, specifically the tips.

50
Boron concentrations in the shoots are correlated with plant appearance, necrosis
and shoot density for both T. latifolia and S. californicus and shoot height and
inflorescence production for S. californicus. In FGD water, boron toxicity symptoms to T.
latifolia include necrosis and decreased shoot density and for S. californicus, include
necrosis, decreased shoot density, shoot height, and inflorescence production. The results
of this study indicated that S. californicus was more sensitive to boron exposures in FGD
water than T. latifolia. In constructed wetland treatment systems used to treat FGD
waters, T. latifolia and S. californicus can be used when boron concentrations in these
waters are maintained at ≤25 mg L-1.

51
References
Ansola, G., Juan M. G., Rubén C. E. de L.. 2003. Experimental and full–scale pilot plant constructed wetlands for municipal wastewaters treatment. Ecol. Eng. 21, 43-52.
Apostol, K.G., Zwiazek, J.J., 2005. Boron and water uptake in jack pine (Pinus
banksiana) seedlings. Environ. Exp. Botany 51, 145-153. American Public Health Association (APHA), 1998. Standard Methods for Examination
of Water and Wastewater (20th Edition).Washington, D.C: American Public Health Association.
Black, W. C. 1986. Methods of soil analysis, Parts 1 and 2. American Society of
Agronomy, Madison, WI. Blevins, D.G., Lukaszewski, K.M., 1998. Boron in plant structure and function. Annu.
Rev. Plant Physiol. Plant Mol. Biol. 49, 481-500. Davis, S. M., Drake, K. k., Maier, K. J., 2002. Toxicity of boron to the duckweed,
Spirodella polyrrhiza. Chemosphere 48, 615-620. Dickerman, J.A., Wetzel, R.G., 1985. Clonal growth in Typha latifolia: population
dynamics and demography of ramets. J. Ecol. 73, 535-552. Eggert, D., Rodgers, J. H. Jr., Huddleston, G. M. III, Hensman, C.E., 2007 (in review).
Performance of pilot-scale constructed wetland treatment systems for flue gas desulfurization (FGD) waters. In review in Environ. Geosci.
Goldberg, S., 1997. Reactions of boron with soils. Plant Soil. 193, 35-48. Hawkins, W.B., Rodgers, J.H. Jr., Gillespie, W.B. Jr., Dunn, A.W., Dorn, P. B., Cano, M.
L., 1997 . Design and construction of wetlands for aqueous transfers and transformations of selected metals. Ecotoxicol. Environ. Safe. 36, 238-248.
Huddleston, G.M., III, Gillespie, W.B., Jr., and Rodgers, J.H., Jr. 2000. Using
Constructed Wetlands to Treat Biochemical Oxygen Demand and Ammonia Associated with a Refinery Effluent Ecotoxicol. Environ. Safe 45:188-193.
Huett, D.O., Morris S.G., Smith G., Hunt, N., 2005. Nitrogen and phosphorus removal
from plant nursery. Runoff in vegetated and unvegetated subsurface flow wetlands. Water Res, 39, 3259-3272.

52
Lamminen, M., Wood, J., Walker, H., Chin, Y.-P., He, Y., Traina, S.J., 2001. Effect of flue gas desulfurization (FGD) by-product on water quality at an underground coal mine. J. Environ. Qual. 30, 1371-1381.
Lombardi, T., Fochetti, T., Bertacchi, A., Onnis, A., 1997. Germination requirements in a
population of Typha latifolia. Aquat. Bot. 56, 1-10. Mierzejewski, M.K., 1991. The elimination of pollutants from FGD wastewaters, The
1991 SO2 Control Symposium, Washington. Murray-Gulde, C. L., Huddleston, G. M., III., Garber, K. V., Rodgers, J. H. Jr., 2005.
Contributions of Schoenoplectus californicus in a constructed wetland system receiving copper contaminated wastewater. Water Air Soil Pol. 163, 355-378.
Powell, R.L., Kimerle, R. A., Moser, E.M., 1996. Development of a plant bioassay to
assess toxicity of chemical stressors to emergent macrophytes. Environ. Toxicol. Chem. 15, 1570-1576.
Powell, R.L., Kimerle, R. A., Coyle, G. T., Best, G.R., 1997. Ecological risk assessment
of wetland exposed to boron. Environ. Toxicol. Chem. 16, 2409-2414. SAS Institute Inc., 1989. SAS/STAT user’s guide. Verison 6. (4th Edition). Cary, NC. Sherrard, R. M., Bear, J.S., Murray-Gulde, C.L., Rodgers, J.H. Jr, Shah, Y.T., 2003.
Feasibility of constructed wetlands for removing chlorothalonil and chlorpyrifos from aqueous mixtures. Environ. Pol., 127, 385-394.
Sinicrope, T.L., Langis, R., Gersberg, R.M., Busnardo, M.J., Zedler, J.B., 1992. Metal
removal mesocosms subjected to different hydro periods. Ecol. Eng. 1, 309-322. Sobolewski, A.,1996. Metal species indicate the potential of constructed wetlands for
long-term treatment of metal mine drainage. Ecol. Eng. 6, 259-271 Solan J.J., Dowdy, R.H., Dolan, M.S., Rehm, G. W., 1999. Plant and soil responses to
field- applied flue gas desulfurization residue. Fuel. 78, 169-174 U.S. Environmental Protection Agency, 1983. Method 200.7: Inductively coupled
plasma. In Methods for Chemical Analysis of Water and Wastes. EPA-600/4-79-020. Cincinnati, OH.
U.S. Environmental Protection Agency1986. Method 6010: Inductivity coupled plasma
atomic emission spectroscopy. In Test Methods for Evaluating Solid Waste, Vol. 1A—Laboratory Manual of Physical/Chemical Methods. SW-846. Washington, DC.

53
Ye, Z. H., Lin, Z. -Q., Whiting, S. N, de Souza, M. P., Terry, N., 2003. Possible use of constructed wetlands to remove selenocyanate, arsenic, and boron from electric utility wastewater. Chemosphere. 52, 1571-1579.
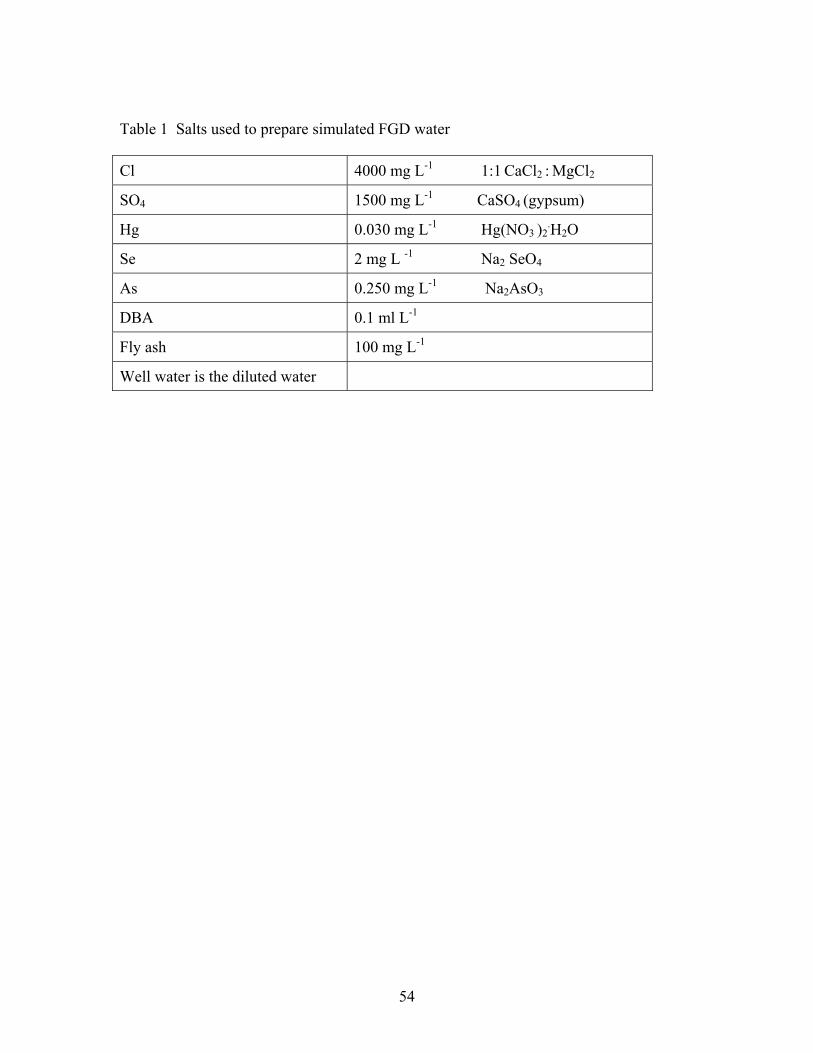
54
Table 1 Salts used to prepare simulated FGD water Cl 4000 mg L-1 1:1 CaCl2 : MgCl2
SO4 1500 mg L-1 CaSO4 (gypsum)
Hg 0.030 mg L-1 Hg(NO3 )2.H2O
Se 2 mg L -1 Na2 SeO4
As 0.250 mg L-1 Na2AsO3
DBA 0.1 ml L-1
Fly ash 100 mg L-1
Well water is the diluted water

55
Table 2 Mean boron concentrations in exposure water, hydrosoil, shoots, and roots of T. latifolia
Treatment
Mean B
mg L-1 Exposure
water (±SD)
Mean B
mg kg-1 Soil
surface
(±SD)
Mean B
mg kg-1 Soil
subsurface
(±SD)
Mean B
mg kg-1 Roots (±SD)
Mean B
mg kg-1 leaves (±SD)
C* 0.2 (0.06)
7.3 (6.4)
2.0 1.8
15.3 (7.0)
80.3 (16.3)
C FGD** 2.9 (0.44)
5.9 (1.1)
5.2 2.6
38.0 (39.2)
73.7 (52.6)
15 14.6 (0.91)
19.3 (1.0)
15.1 0.81
75.0 (67.4)
117.7 (62.3)
50 47.9 (3.54)
49.4 (4.3)
48.4 4.2
82.0 (11.53)
299.0 (59.9)
100 97.4 (6.71)
100.1 (6.8)
94.5 6.6
168.0 (30.5)
630.3 (110.2)
300 290.9 (16.4)
247.5 (8.6)
251.4 32.6
832.0 (565.3)
1694.7 (730.9)
• *City water control
• **FGD water control

56
Table 3 Mean boron concentrations exposure water, hydrosoil, shoots, and roots of S. californicus
Treatments
Mean B mg L-1 Exposure
water
(±SD)
Mean B mg kg-1
Soil Surface (±SD)
Mean B mg kg-1
Soil Subsurface
(±SD)
Mean B mg kg-1
Roots
(±SD)
Mean B mg kg-1
Shoot (brown part
s (Tips))
(±SD)
Mean B mg kg-1
Shoot
(green
parts)
(±SD)
C 0.1 (0.04)
1.8 (2.5)
2.3 (3.5)
8.7 (9.8)
96 (24.0)
14 7.1
CFGD 3.1 (0.64)
5.2 (1.1)
4.7 (0.8)
8 (2.6)
338.5 (12.0)
39.5 14.8
25 24.9 (1.41)
26.1 (1.3)
26.3 (3.7)
45.3 (18.9)
934 (215.0)
124 72.1
50 48.7 (2.52)
48.3 (5.4)
49.8 (2.5)
60.7 (5.5)
925 (141.4)
264 42.2
100 99.2 (5.96)
100.4 (28.5)
88.8 (8.3)
142.3 (19.5)
5594 0
560 0
300 296.5 (14.15)
218.4 (9.6)
238.2 (18.4)
696.7 (77.5)
2000.5 (450.4) *
600 592.5 (38.1)
246.5 (41.1)
330.3 (97)
951.7 (106.7)
1748 (280.01) *
* No green parts

57
Table 4 Physical and chemical properties T. latifolia boron treatments in simulated FGD water
Water characteristics
Boron Treatments
C C FGD 15 50 100 300
pH (SU) 7.2-8.64 6.84-7.83 7.78-7.88 6.94-7.75 6.71-7.83 7.33-7.8
EC µs 499-686 6,65-9,190 9280-9880 6520-8990 6180-9190 6710-9360
DO % 45.7-120.4 77.2-80.9 93.7-95.2 73.70-83.80 47.2-77.2 59.2-73.4
Hardness mg/L as CaCO3
82 5300 5700 5700 6000 6000
Alkalinity mg/L as CaCO3 60 40 42 150 134 148
57

58
Table 5 Physical and chemical properties of S. californicus boron treatments in simulated FGD water
Water characteristics Boron Treatments
NC C FGD 25 50 100 300 600
pH (SU) 6.54-6.94 6.64-7.04 6.72-7.2 6.92-7.36 7.15-7.81 7.39-7.54 7.35-7.56
EC µs 250.6-549 6690-8990 6470-8950 6720-9200 6950-9380 6840-9710 6590-9610
DO % 57.60-84.30 60.5-81.6 68.2-81.6 68.8-84.8 71.1-78.1 65.8-73.9 44.7-67.1
Hardness mg L-1 as CaCO3
76 6400 5600 5900 5300 6000 5700
Alkalinity mg L-1 as CaCO3 56 38 44 94 108 122 140
58

59
Table 6 Response measurements of T. latifolia to boron exposures in simulated FGD water
Treatments
Mean leaf height
(cm) (± SD)
Brown shoot length
following 1.5
months
exposure
(cm) (Range)
Brown shoot length following 13
months
exposure
(cm) (Range )
Mean numb
er of plants (± SD)
Mean numb
er of leaves (± SD)
C 96 (31.7)
1 (0-9)
17 (0-23)
3.75 (0.50)
3.3 (1.45)
CFGD 81 (40.9)
3 (0-17)
28 (0-43)
4.00 (0.58)
2.3 (1.15)
15 94 (27.3)
2 (0-9)
34 (0-67)
5.00 (0.51)
3.1 (1.2)
50 98 (21.2)
1 (0-6)
45 (17-67)
6.75 (0.5)
2.5 (1.1)
100 102 (30.8)
2 (0-10)
47 (23-72)
4 (1.83)
2.5 (1.66)
300 102 (29.0)
4 (0-30)
67 (45-84)
2.00 (2.08)
2.6 (1.06)

60
Table 7 Response measurements of S. californicus to boron exposures in simulated FGD water
Boron Treatments
Mean shoot
heights
(cm) (± SD)
Mean brown shoot lengt
h following
1.5 mont
hs expos
ure (cm)
(Range )
Mean brown shoot lengt
h following
13 mont
hs expos
ure (cm)
(Range )
Mean number
of shoots (± SD)
Mean number
of inflorescence
(± SD)
C 108 (38.4)
3 (0-11)
26
(0-72)
16 (5.7)
8 (0.7)
CFGD 104 (29.7)
8 (0-28)
26 (0-67)
22 (1.4)
10 (2.1)
25 96 (22.2)
1 (0-8)
42 (0-96)
16.5 (2.1)
7.5 (0.7)
50 71 (19.6)
2 (0-14)
65 (0-117)
20 (1.4)
9 (1.4)
100 62 (16.6)
9 (0-23)
102 (36-154)
12.5 (2.1)
1 (0.7)
300
24 (1.7)
11 (4-46)
Totally brow
n shoot
0
0
600 0
18 (2-84)
Totally brow
n shoots
0
0

61
Table 8 Comparison between T. latifolia and S. californicus
Treatments
Mean number of shoots (±SD)
Mean Shoot height (cm)
(±SD)
T. latifolia S. californicus T. latifolia S. californicus
C 3.75 (0.5)
16 (5.7)
96 (32)
108 (38)
CFGD 4 (0.6)
22 (1.4)
81 (41)
104 (30)
50 6.75 (0.5)
20 (1.4)
98 (21)
71 (22)
100 4 (1.8)
12.5 (2.1)
102 (31)
62 (13)
300 2 (2.1)
0.0 (0.0)
102 (29) 0

62
0
20
40
60
80
100
120
140
C CFGD 15 50 100 300
Boron treatments
Mea
n le
aves
hie
ght.
(cm
)
Fig 1. T. latifolia shoot height responses to boron
exposures in simulated FGD water
0
1
2
3
4
5
6
7
8
C CFGD 15 50 100 300
Boron treatments
Mean number of leaves per shoot Mean number of shoots"
Fig. 2. T. latifolia shoot density and number of leaves per shoot responses to boron exposures in simulated FGD water
0
20
40
60
80
100
120
140
160
C CFGD 25 50 100
Boron treatmenats
Mea
n sh
oot h
iegh
t (c
m)
Fig. 3 S. californicus shoot height responses to boron
exposures in simulated FGD water
0
5
10
15
20
25
C CFGD 25 50 100
Boron treatmentsMean number of inflorescences Mean number of shoots
Fig. 4. S. californicus shoot density and inflorescence production responses to B simulated FGD water
62

63
1
10
100
1000
10000
C CFGD 15 50 100 300
Boron Treatments
Log
(B m
g kg
-1)
Surface soil Roots Shoots
Fig. 5 Difference in boron concentrations in the soil, roots, and shoots of T. latifolia

64
1
10
100
1000
10000
C CFGD 25 50 100 300 600
Boron Treatments
Log
(B m
g kg
-1 )
Surface soil Roots Brown shoots' parts Green shoots' parts
Fig. 6 Differences in boron concentrations in soil, roots, and shoots of S. californicus

65
0
100
200
300
C CFGD 50 100 300Boron Treatments
mg
B k
g -1
S. californicus surface soil T. latifolia surface soil
Fig. 7 Comparison between boron concentrations in T. latifolia and S. californicus hydrosoil
0
250
500
750
1000
C CFGD 50 100 300
Boron Treatments
mg
B k
g-1
S. californicus roots T.latifolia roots Fig. 8 Comparison between boron concentrations in T. latifolia and S. californicus roots

66
0
500
1000
1500
2000
2500
C CFGD 50 100 300
Boron Treatments
mg
B k
g -1
S. californicus shoots T. latifolia shoots
Fig. 9 Comparison between boron concentrations in T. latifolia and S. californicus

67
CHAPTER 4
RESPONSES OF CERIODAPHNIA DUBIA RICHARD AND PIMEPHALES PROMELAS RAFINESQUE TO AQUEOUS BORON EXPOSURES
Abstract
Boron in industrial effluents can be found at concentrations that adversely affect
aquatic animals. The objectives of this research were to measure responses [potency,
median lethal effect concentrations (LC50s), lowest observed effect concentrations
(LOECs), no observed effect concentrations (NOECs)] for Ceriodaphnia dubia Richard
and Pimephales promelas Rafinesque in aqueous boron exposures (in the form of boric
acid) and to compare the responses of C. dubia to P. promelas. Boron toxicity tests were
conducted as 7-d static /renewal tests following U.S. testing protocols for C. dubia and P.
promelas (U.S. EPA, 2002). Each test concentration was replicated three times with 30
organisms per treatment and controls. The estimated 7-d aqueous LC50 for C. dubia was
75.9 mg B L-1 with a 95% confidence interval of 74.9-77.0 mg B L-1 while the LC50 for
P. promelas was 81.6 mg B L-1 with a 95% confidence interval of 77.8-83.7 mg B L-1.
NOEC and LOEC values for C. dubia reproduction were 16.4 and 17.2 mg B L-1,
respectively. No C. dubia reproduction was observed at boron concentrations ≥38.4 mg B
L-1. Similar to most elements, aqueous boron exposures elicited different responses
(sensitivity) for C. dubia and P. promelas with potency slopes of 0.86 and 0.57 (% of
mortality/mg B L-1), respectively, concluding that C. dubia survival is more sensitive
than P. promelas to boron.
Key words: C. dubia, P. promelas, Boron, Toxicity.

68
1. Introduction
Boron is widely distributed in relatively low concentrations in natural surface
waters (Hu and Brown, 1997). Typical boron concentrations in North American surface
waters are less than 0.1 mg L-1 and rarely exceed 1.0 mg L-1 (Coughlin, 1998). Boron
enters aquatic environments from both natural and anthropogenic sources. Natural
sources of boron include volcanic activity, weathering of clay-rich sedimentary rocks or
soils, and intrusion from seawater (Nable et al., 1997). In the United States, U.S., natural
high boron concentrations (5-15 mg B L-1) can be found in southwestern U.S as a result
of the weathering of boron-rich formations and deposits (Butterwick et al., 1989). Little
Warm Spring Creek in California had a boron concentration of 13 mg L-1, and boron
concentrations exceed 20 mg B L-1 in subsurface agricultural drainage waters in the San
Joaquin Valley of California. (Loewengart, 2001). In commerce and industry, boron
minerals have several diverse applications such as mining, coal burning for power
generation, and production of glass and cleaning products are major anthropogenic
sources (Maier and Knight, 1991; Nable et al., 1997). Boron releases to water occur from
municipal sewage containing sodium perborates from detergents and in run off from
areas using boron-containing herbicide or fertilizers (Butterwick et al., 1989; Nable et al.,
1997). Boron concentrations in contaminated water can vary from one source to another.
Boron concentrations in flue gas desulfurization water, produced in coal-fired power
plants, range from 33 to 460 mg B L-1 (Eggert, in review), while boron concentrations in
typical wastewaters are in the 1.0 mg B L-1 (Polat et al., 2004) range. However, the
discharge of boron–contaminated water during production and end use of detergents

69
could result in accumulation of boron in waste effluents and consequently in groundwater
and natural aquatic systems (Vengosh et al., 1994). Wastewater treatment systems do not
effectively remove boron from contaminated water, and insufficiently treated effluents
may be discharged into aquatic systems (Polat et al., 2004) which can result in potential
risks of boron to aquatic species.
Boron is an essential micronutrient for plants but its essentiality for animals has
not yet been established (Nielsen, 1997). Boron enhances maturation and growth of
animals and regulates parathyroid function through metabolism of calcium (Nielsen,
1997). Limited studies have been performed to establish reproductive and developmental
toxicity, and these studies indicated that when boron and its compounds are applied
directly to laboratory animals (chickens and amphibians e.g. Xenopus laevis embryos),
they could be potent teratogens but there is no evidence of mutagenic or carcinogenic
effects (Fort et al., 1998; Rowe et al., 1998). However, the mechanisms of action are not
understood.
Boron toxicity to aquatic animals is a function of its form and the species of
organism and its life stage (Birge and Black, 1977). Although the predominant and most
available form of boron in freshwater ecosystems (pH 6-9) is boric acid (B(OH)3)
(Goldberg, 1997), Birge and Black, (1997) conducted many studies to determine the
toxicity of borax (Na2B4O7.10H2O) to a variety of organisms. These studies indicated that
boric acid and borax toxicity to the same species may differ significantly (Table 1). Eisler
(1990) stated that representative species of aquatic organisms (e.g. plants, invertebrates,
fish and amphibians) can usually tolerate up to 10 mg B L-1 for an extended period (48 h–

70
28 d) without any adverse effects although >0.1 mg B L-1 may affect reproduction of
rainbow trout, while >0.2 mg B L-1 may affect survival of other fish species (Eilser,
1990). Black et al., (1993) recommended a concentration between 0.75 and 1.0 mg B L-1
as an environmentally acceptable limit for boron in aquatic systems. Environmental
conditions such as pH, hardness, dissolved oxygen, and temperature may also affect the
responses of aquatic organisms to boron toxicity (Birge and Black, 1997).
Table 1 Boron toxicity data for fish as a function of boron form and water characteristics (Birge and Black, 1977)
Test organism Life stages Duration
Form of boron used in the test
LC50 mg B L-1
Soft water 50 mg
CaCO3 L-1
Hard water 200 mg
CaCO3 L-
1
Gold fish (Carassius auratus)
Embryos, through day 4 post hatching
7d Boric acid 46 75
Borax 65 59
Channel fish (Ictalurus
punctatus)
Embryos, through day 4 post hatching
9d Boric acid 155 22
Borax 155 71
Rainbow trout (Oncorhynchus
kisutch)
Embryos, through day 4 post hatching
28d Boric acid 100 79
Borax 27 54
To protect aquatic life, water quality standards have been developed, based
primarily on laboratory toxicity tests that use relatively constant exposure concentrations.

71
Toxicity tests are used to estimate responses of sentinel aquatic species to contaminants
in waste effluents and ambient waters (Phillips et al., 2005).
Due to the potential for species selective toxicity by contaminants, in regulated
applications a minimum of two species (vertebrate fish and invertebrate) are used in
effluent toxicity tests (Doherty et al., 1999). Sentinel aquatic animal species such as
Ceriodaphnia dubia Richard and Pimephales promelas Rafinesque are common
freshwater species required for monitoring effluents discharged to surface freshwaters by
National Pollutant Discharge Elimination System (NPDES) (U.S. EPA, 1991). These
studies are required by the NPDES permitting process to evaluate potential toxicity of
individual chemicals as well as complex mixtures discharged to aquatic systems by
industrial or domestic point sources (Bankston and Baer, 2005). C. dubia, commonly
named ‘water fleas,’ are freshwater arthropods that occur in littoral areas of lakes, ponds,
and marshes throughout the world. P. promelas, commonly named ‘fathead minnow,’ is
widely distributed in temperate water throughout North America. C. dubia and P.
promelas are recommended in toxicity tests due to their sensitivity to many contaminants,
the existence of extensive published data regarding their responses to different
contaminants, and ease of culture and handling in laboratory (Doherty et al., 1999). These
data can provide estimates of responses of sentinel toxicity species to aqueous exposures
of boron and may be useful to predict remediation goals for boron impacted waters.
This research was conducted to measure responses of C. dubia and P. promelas to
aqueous exposures of boron following 7-d toxicity tests. Specific objectives were to
estimate no observed effect concentrations (NOECs), lowest observed effect

72
concentrations (LOECs), median lethal effect concentration (LC50), and to compare the
responses of C. dubia with the responses of P. promelas to aqueous boron exposures.
2. Materials and Methods
2.1. Exposure concentrations and experimental design
For laboratory toxicity tests, boron test solutions were prepared from boric acid
(B (OH)3) (Fisher Scientific, Pittsburgh, PA) and reconstituted moderately hard water
(MHW), with a hardness of ≈ 80 mg L-1 as CaCO3 and an alkalinity of ≈ 60 mg L-1 as
CaCO3. MHW was prepared at Clemson University from reverse osmosis water and high
purity salts of CaCO3, NaHCO3, MgSO4.7H2O, CaCl2
.2H2O, KCl, KNO3, and K2PO4, Cu
(as CuO2), Se (as SeO2), Zn (as ZnO2) with concentrations of 5.0, 101.8, 48.0, 33.0, 65.0,
2.1, 0.82, 0.02, 0.002, 0.001, 0.001 mg L-1, respectively. Temperature, pH, alkalinity,
dissolved oxygen, conductivity and total hardness were measured every day in selected
replicates according to Standard Methods (APHA, 1998). Boron concentrations were
measured using Inductively Coupled Plasma Atomic Emission Spectrometer (Spectro
Flame Modula; ICP-AES) following EPA Method 200.7 with a method detection limit of
10 µg L-1. (U.S. EPA, 1983). Boron concentrations were measured when test solutions
were renewed and after 24 hours from selected treatments of each concentration. The
final exposure concentrations were calculated as the mean value measured for each
treatment concentration. All test organisms (C. dubia and P. promelas) were cultured
based on ASTM (2000) methods and tested at Clemson University. All organisms used
for testing were ≤24 h old at the initiation of each experiment. The tests were conducted
according to U.S. EPA wet testing guidelines protocols for C. dubia and P. promelas

73
(U.S. EPA, 2002). Boron toxicity tests were performed for each species as 7-d
static/renewal toxicity tests. Three tests were performed for each point estimate at three
concentrations plus reconstituted moderately hard water as a control. For each treatment
in each test, thirty organisms were used.
Statistical Analysis
For C. dubia and P. promelas survival and reproduction endpoints (NOEC and
LOEC values), Analysis of Variance (ANOVA) and Dunnett’s multiple range tests were
used to detect differences between control and treatment means. Each NOEC value was
estimated as the highest concentration at which no significant difference was observed
compared to control while LOEC was estimated as the lowest observed concentration at
which significant difference was observed compared to control for each measured
parameter. In both C. dubia and P. promelas surviving tests, the numbers of survived
animals in each treatment were combined into one data set. The averages for each
treatment were calculated and these averages were used to test for differences in control
versus each treatment level with ANOVA followed by Dunnett’s test. For this stage of
the analysis, individual experiments were considered replicates. The analysis of
reproduction data from C. dubia testing was accomplished in two stages. The first stage
was to test for differences in control versus each treatment level with ANOVA followed
by Dunnett’s test. In this stage of the analysis, individual organisms were the replicates.
The mean significant differences (MSD) based on Dunnett’s test were calculated and
shown graphically with the treatment level means. In the second stage of the analysis, the
data for C. dubia reproduction experiments were combined into one data set. The

74
averages for each treatment were calculated and these averages were used to test for
differences in control versus each treatment level with ANOVA followed by Dunnett’s
test. For this stage of the analysis, individual experiments were considered replicates.
Again, the MSD based on Dunnett’s test was calculated and shown graphically with the
treatment level means. Any mean number of offspring below the critical value for
Dunnett’s test considered would be significantly different from the control. All statistical
calculations were performed using PROC GLM of SAS (SAS Institute Inc., Cary NC,
USA). The 5% alpha level was used in all statistical tests. Linear regression analysis was
used to quantify the potency of boron to C. dubia and P. promelas. Lethal mean estimates
(LC50) were analyzed using statistical procedures followed U.S. EPA guideline (U.S.
EPA, 2002) and included the trimmed Spearman-Karber method (Hamilton et al., 1997)
used for calculating median effect statistics (LC50).
3. Results and Discussion
For all toxicity tests, the responses of organisms in controls met the test
acceptability criterion of ≥80% survival (U.S. EPA, 2002). In C .dubia reproduction tests;
the surviving animals reproduced at least three broods in the 7-d toxicity test. Water
chemistry parameters for C. dubia and P. promelas tests (pH, dissolved oxygen, and
conductivity) are presented in Table 2.
In these experiments, both C. dubia and P. promelas responses to aqueous boron
exposures showed a general decrease in survival and reproduction with increasing
exposure concentrations (Table 3). The 7-d NOEC and LOEC values for C. dubia
survival were estimated at 67.5 and 71.2 mg B L-1, respectively while the NOEC and

75
LOEC values for P. promelas survival were 51.5 and 61.3 mg B L-1, respectively. The 7-
d LC50 value for C. dubia was 75.9 mg B L-1 with a 95% confidence interval of 74.9-77.0
mg B L -1 while the P. promelas 7-d LC50 value was 81.6 mg B L-1 with a 95%
confidence interval of 77.8-83.7 mg B L-1. Similar to most elements, aqueous boron
exposures elicited different responses (sensitivity) for C. dubia and P. promelas with
potency slopes of 0.86 and 0.57 % mortality/ mg B L-1, respectively, indicating that C.
dubia survival is more sensitive to boron than P. promelas (Figure 1 and Figure 2).
The 7-d aqueous NOEC and LOEC values for C. dubia reproduction were 16.4
and 17.2 mg B L-1, respectively (Figure 3). No reproduction was observed at boron
concentrations ≥38.4 mg B L-1. The estimated NOEC and LOEC for C. dubia mortality
are approximately 4 fold more than the concentration that adversely affected
reproduction, indicating that C. dubia reproduction is more sensitive than survival in this
experiment.
The results of this study indicated that boron concentrations that adversely
affected C. dubia and P. promelas reproduction and survival (≥ 17.2 mg L-1) are
somewhat greater than boron concentrations found in U.S. surface waters (0.01-2.0 mg B
L-1 with a mean of 0.1mg B L-1). The LOECs are also greater than the levels proposed by
U.S. EPA and identified as toxic to aquatic organisms (0.75 mg B L-1) (WHO, 1998).
Both the C. dubia data and P. promelas data corroborated the suggestion that
representative species of aquatic organisms such as fish, invertebrates and amphibians
can tolerate aqueous exposures of up to 10 mg B L-1 without adverse effects (Eisler,
1990). In laboratory waters, Daphnia magna exposed to boron (boric acid) for 21 days
76
produced NOECs ranging from 6 to 10 mg B L-1 and LOEC of 10-18 mg B L-1 (Birge
and Black, 1977; Hooftman et al., 2000). In other laboratory studies, 48- hour EC50
values for D. magna ( water hardness 10-170 mg CaCO3 L-1) were between 95 and 226
mg B L-1 and generally >100 mg B L-1 (Maier and Knight, 1991). For three species of
fish exposed to boric acid, Birge and Black (1977) found the range of LC50 values was
22-155 mg B L-1 (Table 1) for embryos, through day 4 post hatching.
4. Conclusions
Boron concentrations ≥17.2 mg L-1 adversely affected reproduction of C. dubia
and survival of C. dubia and P. promelas. The NOEC and LOEC values for C. dubia
reproduction were 16.4 and 17.2 mg B L-1, respectively. No C. dubia reproduction was
observed at boron concentrations ≥38.4 mg B L-1. The NOEC and LOEC values for C.
dubia survival were 67.5 and 71.2 mg B L-1, respectively. The estimated 7-d aqueous
LC50 for C. dubia was 75.9 mg B L-1 with a 95% confidence interval of 74.9-77.0 mg B
L-1. The NOEC and LOEC values for P. promelas survival were 51.5 and 61.3 mg B L-1,
respectively. The 7-d LC50 for P. promelas was 81.6 mg B L-1 with a 95% confidence
interval of 77.8-83.7 mg B L-1. Similar to most elements, aqueous boron exposures
elicited different responses (sensitivity) from C. dubia and P. promelas with potency
slopes of 0.86 and 0.57 (% mortality/mg B L-1), respectively, indicating that C. dubia is
more sensitive (in terms of survival) to boron than P. promelas. In the current research,
all response measurements (NOEC, LOEC, and LC50) are higher than concentrations of
boron normally found in fresh water. Concentrations of boron of sufficient magnitude
and duration to produce toxic effects in laboratory tests could be found in aquatic systems

77
receiving industrial or domestic effluents with elevated boron concentrations. Boron
toxicity tests were performed for two aquatic species in this study to provide additional
data for evaluation of potential impacts of boron concentrations on aquatic organisms
which may aid in establishing water quality criteria for boron.

78
References
American Public Health Association (APHA), 1998. Standard Methods for Examination of Water and Wastewater (20th Edition).Washington, D.C: American Public Health Association.
American Standards for Testing and Materials (ASTM), 2000. E729-96. Standard guide for conducting acute toxicity tests on tests materials with fishes, microinvertebrates, and amphibians. Philadelphia, PA.
Bankston, C.R., Baer, K.N., 2005. Effects of industrial and domestic wastewaters on selected biological indicators in aquatic organisms. Bull. Environ. Contamin. Toxicol. 75, 73-80.
Birge, W.J., Black, J.A., 1977. Sensitivity of vertebrate embryos to boron compounds. Final report. US Environmental Protection Agency Report. EPA-560/1-76-008.
Black, J.A., Barnum, J.B., Birge, W.J., 1993. An integrated assessment of the biological effects of boron to the rainbow trout. Chemosphere 26, 1383-1413.
Butterwick, L., Oude, N., Raymond, K., 1989. Safety assessment of boron in aquatic and terrestrial environments. Ecotox. Environ.Safe. 17, 339-371.
Coughlin, J.R., 1998. Sources of human exposure: Overview of water supplies as sources of boron. Biol. Trace Elem. Res. 66, 87-100.
Doherty, F.G., Qureshi, A.A., Razza, J.B., 1999. Comparison of the Ceriodaphnia dubia and Microtox ® inhibition tests for toxicity assessment of industrial and municipal wastewaters. Environ. Toxicol. 14: 375-382.
Eisler, R., 1990. Boron hazards to fish, wildlife and invertebrates: A synoptic review. Biological Report 85 (1.20), 1-32, U.S. Fish and Wildlife Services, Patuxent Wildlife Research Center.
Eggert, D., Rodgers, J. H. Jr., Huddleston, G. M. III, Hensman, C.E., 2007 (in review). Performance of pilot-scale constructed wetland treatment systems for flue gas desulfurization (FGD) waters. In review in Environ. Geosci.
Fort, D.J., Propst, I.L., Stover, E.L., Strong, P.L., Murray, F. J., 1998. Adverse reproductive and developmental effects in Xenopus from insufficient boron. Biol. Trace. Element. Res. 66, 237-259.
Goldberg, S., 1997. Reactions of boron with soils. Plant Soil. 193, 35-48.

79
Hamilton, M.A., R.C. Russo, and R.V. Thurston. 1977. Trimmed Spearman-Karber method for estimating median lethal concentrations. Environ. Sci. Technol. 11, 714-719.
Hooftman, R.N.D., van Drongelen-Devenhuijsen, D., de Hann, H.P.M., 2000. Semi-static reproduction test with boric acid, manufacturing grade and Daphnia magna. TNO Study 99-9047-10. Report V99-169. TNO Nutrition and Food Research Institiute, Delft, The Netherlands.
Hu, H., Brown P.H., 1997. Absorption of boron by plant roots. Plant Soil 193, 49-58.
Loewengart, G., 2001. Toxicity of boron to rainbow trout: A weight-of-the-evidence assessment. Environ. Toxicol. Chem. 20, 796-803.
Maier, K. J., Knight, A.W., 1991. The toxicity of waterborne boron to Daphnia magna and Chrimonomus decorus and the effects of water hardness and sulfate on boron toxicity. Arch. Environ. Contam. Toxicol. 20, 282-287.
Nable, R. O., Bañuelos, G. S., Paull, J. G., 1997. Boron toxicity. Plant Soil. 193,181- 198.
Nielsen, F. H., 1997. Boron in human and animal nutrition. Plant Soil. 193, 199-208.
Phillips, B.M., Nicely, P.A., Hunt, J.W., Anderson, B.S., Tjeerdema, R.S., Palmer, F.H., 2005. Tolerance of five west coast marine toxicity test organisms to ammonia. Bull. Environ. Contam. Toxicol. 75, 23-27.
Polat, H., Vengosh, A., Pankratov, I., Polat, M., 2004. A new methodology for removal of boron from water by coal and fly ash. Desalination. 164, 173-188.
Rowe, R.I., Bouzan, C., Nabili, S., Eckhert, C.D., 1998. The response of trout and zebrafish embryos to low and high boron concentrations is U-shaped. Biol. Trace. Element. Res. 66, 261-270.
SAS Institute Inc., 1989. SAS/STAT user’s guide. Verison 6. (4th Edition). Cary, NC.
U.S. Environmental Protection Agency, 1983. Method 200.7: Inductively coupled plasma. In Methods for Chemical Analysis of Water and Wastes. EPA-600/4-79-020. Cincinnati, OH.
U. S. Environmental Protection Agency (U.S. EPA) 1991. Technical Support Document for Water Quality-Based Toxics Control. EPA/ 505/2-90-001.

80
U.S. Environmental Protection Agency, 2002 Short-term methods for estimating the chronic toxicity of effluents and receiving water to freshwater organisms, EPA/821/R-02-013 Washington DC.
Vengosh A., Heumann, K.G., Juraske, S., Kasher, R., 1994. Boron isotope application for tracing sources of contamination in ground water. Environ. Sci. Technol. 28, 1968-1974.
World Health Organization (WHO), 1998. Boron (Environmental health criteria monograph 204). World Health Organization, IPCS, Geneva, Switzerland.

81
Table 2 Chemical and physical characteristics of aqueous boron-exposure concentrations to C. dubia and P. promelas during 7-d static/ renewal tests.
Test Species
B mg L-1 Mean
(± SEM)
pH (S.U) Mean
(± SEM)
D.O. ( mg L-1)
Mean (± SEM)
Conductivity (µS) Mean
(± SEM)
Temperature (°C)
Mean (± SEM)
C. dubia
0.1 (0.02)
7.38 (0.04)
7.7 (0.3)
330 (4)
24.9 (0.2)
16.4 (0.33)
7.61 (0.05)
7.4 (0.2)
332 (3)
24.9 (0.1)
17.2 (0.41))
7.66 (0.05)
7.5 (0.2)
328 (3)
24.9 (0.1)
18.3 (0.32)
7.73 (0.09)
7.5 (0.2)
327 (4)
24.9 (0.1)
67.5 (0.24)
7.45 (0.06)
7.6 (0.3)
331 (4)
24.9 (0.1)
71.2 (0.22)
7.30 (0.09)
7.8 (0.4)
328 (4)
24.9 (0.1)
P. promelas
0.01 (0.03)
7.44 (0.08)
8.8 (0.7)
334 (3)
24.9 (0.1)
51.5 (0.27)
7.48 (0.07)
8.6 (0.9)
314 (4)
24.9 (0.1)
61.3 (0.34)
7.62 (0.10)
8.4 (0.9)
308 (3)
24.9 (0.2)
184.4 (0.33)
7.62 (0.08)
9.1 (0.2)
311 (4)
24.8 (0.2)

82
Table 3 Effects of boron on P. promelas (survival) and C. dubia (mortality and reproduction) during 7-d static/renewal tests
Mean Boron Concentrations mg L-1
Test Species Test Endpoint NOEC ± (SEM)
LOEC ± (SEM)
LC50 (95% CI)
EC100 ± (SEM)
C. dubia
Reproduction 16.4 (0.33)
17.2 (0.41) NA 38.4
(0.27)
Mortality 67.5 (0.24)
71.2 (0.22)
75.97 (74.91-77.04)
95.6 (0.54)
P. promelas Mortality 51.5 (0.27)
61.3 (0.34)
81.5 (77.8-83.7)
184.2 (0.33)

83
0
10
20
30
40
50
60
70
80
90
100
0.1 67.5 71.2 75.6 77.9 80.3 85.1 90.2 95.6
mg B/L
Perc
ent m
orta
lity
Fig, 1. Boron effect on C. dubia mortality.
0
10
20
30
40
50
60
70
80
90
100
0 52 61 76 81 100 184
mg B/L
Perc
ent m
orta
lity
Fig. 2. Boron effect on P. promelas mortality.

84
Fig. 3. Boron effect on C. dubia reproduction.
1718192021222324252627282930
0.1 16.4 17.2 18.3mg B L-1
Mea
n nu
mbe
r of o
ffspr
ing.
.
Mean number of offspring ± SEM Critical value of Dunnett's
85
CHAPTER 5
SUMMARY AND CONCLUSIONS
Boron enters aquatic environments from both natural and anthropogenic sources
(Polat et al., 2004). In the United States, natural high boron concentrations (5-15 mg B L-
1) can be found in southwestern United States because of the weathering of boron-rich
formations and deposits (Butterwick et al., 1989; ECETC, 1997). In commerce and
industry, boron minerals have several diverse applications and activities such as mining,
coal burning for power generation, and production of glass and cleaning products. Boron
releases to water occur from municipal sewage containing sodium perborates from
detergents and in runoff from areas using boron-containing herbicides or fertilizers
(Butterwick et al., 1989; Nable et al., 1997). Boron concentrations in flue gas
desulfurization (FGD) waters, produced in coal-fired power plants, range from 33 to 460
mg B L-1 (Eggert in review), while boron concentrations in other wastewaters are
typically in the 1.0 mg B L-1 range (Polat et al., 2004). Conventional wastewater
treatment systems do not effectively remove boron from contaminated water, and
insufficiently treated effluents may be discharged into aquatic systems (Polat et al., 2004)
which may result in potential risks of boron to aquatic species.
Boron has been of recent interest due to elevated concentrations in waters from
thermoelectric power generation, particularly flue gas desulfurization (FGD) waters
(Changwoo and Mistch, 2001; Lamminen et al., 2001). With the advent of more stringent
air quality standards, FGD technology is being implemented at coal-fired power plants to
decrease sulfur dioxide emissions (Mierzejewski, 1991; Lammine et al., 2001). During

86
coal combustion, flue gases containing sulfur dioxide (SO2) and other gaseous
compounds are produced. Some of these gaseous elements and compounds are
transferred and transformed into soluble species by wet scrubbing of flue gases (Solan et
al., 1999). The resulting water produced by the wet scrubbing of flue gases is referred to
as ‘FGD water’.
The amount of water produced by an FGD scrubber can exceed 0.1 mgd at large
facilities (>1,000 MW) and can contain significant concentrations of boron (33-460 mg
L-1). FGD waters can also contain elevated concentrations of other potentially phytotoxic
constituents including arsenic, cadmium, chemical oxygen demand, chlorides, chromium,
copper, lead, mercury, selenium, sulfate, zinc and hardness (e.g. calcium, iron, and
magnesium) (Mierzejewski, 1991; Eggert, in review). These waters are semi-neutral in
pH and contain high total dissolved and suspended solids (calcium, chlorides,
magnesium, and sulfate) (Mierzejewski, 1991). However, FGD waters vary significantly
in their composition and are influenced by many factors such as coal type used, source
water used in the scrubber, and type of flue gas scrubber employed (Eggert, in review).
The number of scrubbing systems is increasing within the United States U.S. and
consequently the annual production of FGD waters is increasing.
Due to problematic constituents contained in FGD waters, renovation of waters
associated with thermoelectric power generation is needed in order to reuse these waters
(e.g. cooling waters) or discharge them into aquatic receiving systems (Mierzejewski,
1991; Eggert, in review). Treatment of FGD waters is required by the United States
Environmental Protection Agency (U.S. EPA) through the National Pollutant Discharge

87
and Elimination System (NPDES) before discharging to receiving systems. Constructed
wetland treatment systems have been proposed as a novel treatment approach for efficient
and effective treatment of targeted constituents (As, Hg, and Se) found in FGD waters
(Ye et. al., 2003). If a treatment approach such as CWTS is considered for FGD waters,
elevated chloride concentrations (≥4000 mg L-1) are known to be toxic to wetland plants
and must be managed (Eggert, in review). Typha latifolia Linnaeus and Schoenoplectus
californicus C. A. Meyer Palla are often used in constructed wetland treatment systems
for FGD waters (Eggert, in review). To maintain the health of plants in CWTS, FGD
waters are generally diluted to achieve chloride concentrations <4000 mg L-1. However,
boron may also occur in the diluted FGD waters at concentrations that pose risks to plants
used in CWTS designed to treat constituents of concern and boron may adversely affect
survival, growth, and, consequently, plant performance.
Boron in FGD waters may be phytotoxic to wetland plant species in constructed
wetland treatment systems, but potential boron toxicity is dependent on factors such as its
concentration, form, frequency of occurrence, and duration of exposure in these waters.
Since FGD waters vary widely in composition (e.g. boron concentrations), their
phytotoxicity may also vary. In order to effectively use T. latifolia and S. californicus to
remediate FGD waters, we need to understand the responses of these plants to exposures
of boron in FGD waters.
Chapter Two of this thesis focused on predicting responses of T. latifolia and S.
californicus to aqueous boron exposures as immature plants. Responses of T. latifolia and
S. californicus can indicate their appropriateness for use in constructed wetland treatment

88
systems to treat FGD waters. The objectives of this research were: 1) to measure
responses of T. latifolia seed germination, and shoot and root growth of early seedlings
following 7-d exposures to boron in diluted FGD water and in formulated moderately
hard water (MHW) as well as to measure responses of immature S. californicus seedlings
in terms of survival, shoot and root growth following 35-d exposures to boron
concentrations, 2) to compare the responses of T. latifolia and S. californicus in diluted
FGD water and MHW, and 3) to contrast the responses of T. latifolia and S. californicus
to boron exposures. T. latifolia seed germination in FGD water or MHW was not
sensitive to boron concentrations of 0.2-100 mg L-1 with seed germination of 92-100%.
Survival of S. californicus immature seedlings in FGD water was ≤3.3% at boron
concentrations of ≥12.6 mg L-1 while in MHW survival ranged from 23 to 96% at boron
concentrations 12.6-49.9 mg L-1. Responses of shoot and root growth to boron exposures
in FGD water also differed from responses in MHW. No root emergence or elongation
was observed for T. latifolia early seedlings at all boron concentrations ≥12.6 mg L-1 in
diluted FGD water and shoots were yellow with lengths ≤5.36 mm. Root growth
decreased with increasing concentrations of boron in MHW for S. californicus (≥25.8 mg
B L-1) and T. latifolia (≥12.6 mg B L-1) with no root growth observed at boron
concentrations ≥99.6 mg B L-1. The results of this study indicated that boron in
conjunction with other constituents in FGD water may adversely affect T. latifolia and S.
californicus seed germination and early seedling growth and this must be considered in
planting constructed wetland treatment systems for FGD waters.

89
Chapter 3 of this thesis focused on measuring responses of mature plants of T.
latifolia and S. californicus to boron exposures in simulated wetland environments. These
exposures were of sufficient duration (>1 year) to allow responses to boron to be
manifested. The specific objectives of this research were: 1) to determine responses of T.
latifolia and S. californicus in terms of shoot height, shoot density, number of leaves per
shoots (only T. latifolia), necrosis and number of inflorescences produced following 13
months of exposure to a series of concentrations of boron (as boric acid) in simulated
FGD water, 2) to measure concentrations of boron in the hydrosoil and bioconcentration
of boron in plant tissue (i.e. shoots and roots) of T. latifolia and S. californicus after 13
months of exposure to boron (boric acid) in simulated FGD water, 3) to determine
relationships between responses of T. latifolia and S. californicus to boron exposures and
concentrations of boron measured in the roots and shoots of these plants, and 4) compare
the responses of T. latifolia and S. californicus following 13 months of exposures to
boron (as boric acid) in simulated FGD water. In this experiment, aqueous concentrations
of boron greater than 25 mg L-1 adversely affected both T. latifolia and S. californicus
with browning and yellowing of shoots, decreased shoot density and height for S.
californicus and decreased density of T. latifolia at 300 mg B L-1. In both the shoots and
the roots of these species, concentrations of boron increased proportionally with aqueous
exposure concentrations as did the concentrations of boron in hydrosoil. Thus, adverse
effects of boron were related not only to the aqueous boron exposures, but also to boron
concentrations in the hydrosoil, roots and shoots. S. californicus was more sensitive than
T. latifolia to aqueous boron exposures in simulated FGD water with 100% mortality of

90
S. californicus at 300 mg L-1. In exposures of 100 mg B L-1, S. californicus shoot density
and shoot height were 43% and 40% less than untreated FGD water controls,
respectively. T. latifolia shoot density decreased to 50% of the untreated control density
at a boron concentration of 300 mg L-1. In constructed wetland treatment systems used to
treat FGD waters, T. latifolia and S. californicus can likely tolerate boron concentrations
≤25 mg L-1.
Chapter Four of this thesis focused on responses of sentinel aquatic animal
species, Ceriodaphnia dubia Richard and Pimephales promelas Rafinesque, to aqueous
boron exposures. Boron in industrial effluents and FGD waters may be found at
concentrations that adversely affect aquatic animals. The objectives of this research were
to measure responses (potency, median lethal effect concentrations (LC50s), lowest
observed effect concentrations (LOEC), and no observed effect concentrations (NOEC)
of C. dubia and P. promelas to aqueous boron exposures (in the form of boric acid).
Boron toxicity tests were conducted in 7-d static/renewal tests following U.S. EPA
testing protocols for C. dubia and P. promelas (U.S.EPA, 2002). Each test concentration
was replicated three times with 30 organisms per treatment and controls. The estimated 7-
day aqueous LC50 for C. dubia was 75.9 mg B L-1 with a 95% confidence interval of
74.9-77.0 mg B L-1 while the 7-d LC50 for P. promelas was 81.6 mg B L-1 with a 95%
confidence interval of 77.8-83.7 mg B L-1. NOEC and LOEC values for C. dubia
reproduction were 16.4 and 17.2 mg B L-1, respectively. No C. dubia reproduction was
observed at boron concentrations ≥38.4 mg B L-1. Similar to most elements, aqueous
boron exposures elicited different responses (sensitivity) from C. dubia and P. promelas

91
with potency slopes of 0.86 and 0.57 % mortality / mg B L-1, respectively, indicating that
C. dubia is more sensitive (in terms of survival) to boron than P. promelas.
The primary purpose for conducting this research was to further understanding of
potential risks of boron in a complex matrix such as FGD waters. Accurate
characterization of both phytotoxicity and toxicity of boron to aquatic vertebrates and
invertebrates is important in order to predict risks in either CWTS or receiving aquatic
systems. Boron will adversely affect the health of T. latifolia and S. californicus in
CWTS at concentrations ≤25 mg B L-1. Boron in FGD waters could contribute to
phytotoxicity in T. latifolia and S. californicus. However, other elements in FGD water
may also contribute to phytotoxicity and that toxicity may be enhanced by boron. Based
on the results from this research, CWTS for FGD waters should be planted with mature
plants. If boron concentrations in aqueous exposures exceed 12.6 mg L-1 for either T.
latifolia and S. californicus, survival of immature plants will be limited while mature
plants can tolerate boron concentrations ≤25 mg L-1. For the sensitive, sentinel aquatic
animals, C. dubia and P. promelas, the NOEC for boron was 71. and 51.5 mg B L-1,
respectively. Based on the results from this study, immature plants were the most
sensitive to aqueous boron exposures of the species tested. Water Quality Criteria for
boron that are intended to protective of aquatic life in receiving systems should be
supported by strategic phytotoxicity data.

92
References
Butterwick, L., Oude, N., Raymond, K., 1989. Safety assessment of boron in aquatic and terrestrial environments. Ecotox. Environ.Safe. 17, 339-371.
Changwoo, A., Mitsch, J.W., 2001 Chemical analysis of soil and leachate from experimental wetland mesocosms lined with coal combustion products. J.Environ. Qual. 30, 1457-146.
Eggert, D., Rodgers, J. H. Jr., Huddleston, G. M. III, Hensman, C.E., 2007. Performance of pilot-scale constructed wetland treatment systems for flue gas desulfurization (FGD) waters. In review in Environ. Geosci
European Center for Ecotoxicology and Toxicology of Chemicals, 1997. Ecotoxicology of some inorganic borates. Special Report 11. Interim Report Brussels, Belgium
Lamminen, M., Wood, J., Walker, H., Chin, Y.-P., He, Y., Traina, S.J., 2001. Effect of flue gas desulfurization (FGD) by-product on water quality at an underground coal mine. J. Environ. Qual. 30, 1371-1381.
Mierzejewski, M.K., 1991. The elimination of pollutants from FGD wastewaters, The 1991 SO2 Control Symposium, Washington.
Nable, R. O., Bañuelos, G. S., Paull, J. G., 1997. Boron toxicity. Plant Soil. 193,181- 198.
Polat, H., Vengosh, A., Pankratov, I., Polat, M., 2004. A new methodology for removal of boron from water by coal and fly ash. Desalination. 164, 173-188.
Solan J.J., Dowdy, R.H., Dolan, M.S., Rehm, G. W., 1999. Plant and soil responses to field- applied flue gas desulfurization residue. Fuel. 78, 169-174
Ye, Z. H., Lin, Z. -Q., Whiting, S. N, de Souza, M. P., Terry, N., 2003. Possible use of constructed wetlands to remove selenocyanate, arsenic, and boron from electric utility wastewater. Chemosphere. 52, 1571-1579.