risk-based performance assessments for long-term … · risk-based performance assessments for...
TRANSCRIPT

1
Sandia National LaboratoriesAlbuquerque, New Mexico
(505) [email protected]
Spectrum 2002 ConferenceAugust 4-8, Reno, NV
Clifford K. Ho, Bill W. Arnold, John R. Cochran, and Randal Y. Taira*
Risk-Based Performance Assessments for Long-Term Cover Systems:
Sensitivity and Uncertainty Analyses
*Pacific Northwest National Laboratory
Sandia is a multiprogram laboratory operated by Sandia Corporation, a Lockheed Martin Company, for the United States Department of Energy under Contract DE-AC04-94AL85000.

2
Overview
• Introduction
• Approach
• Demonstration
• Impact and Summary
3
Introduction
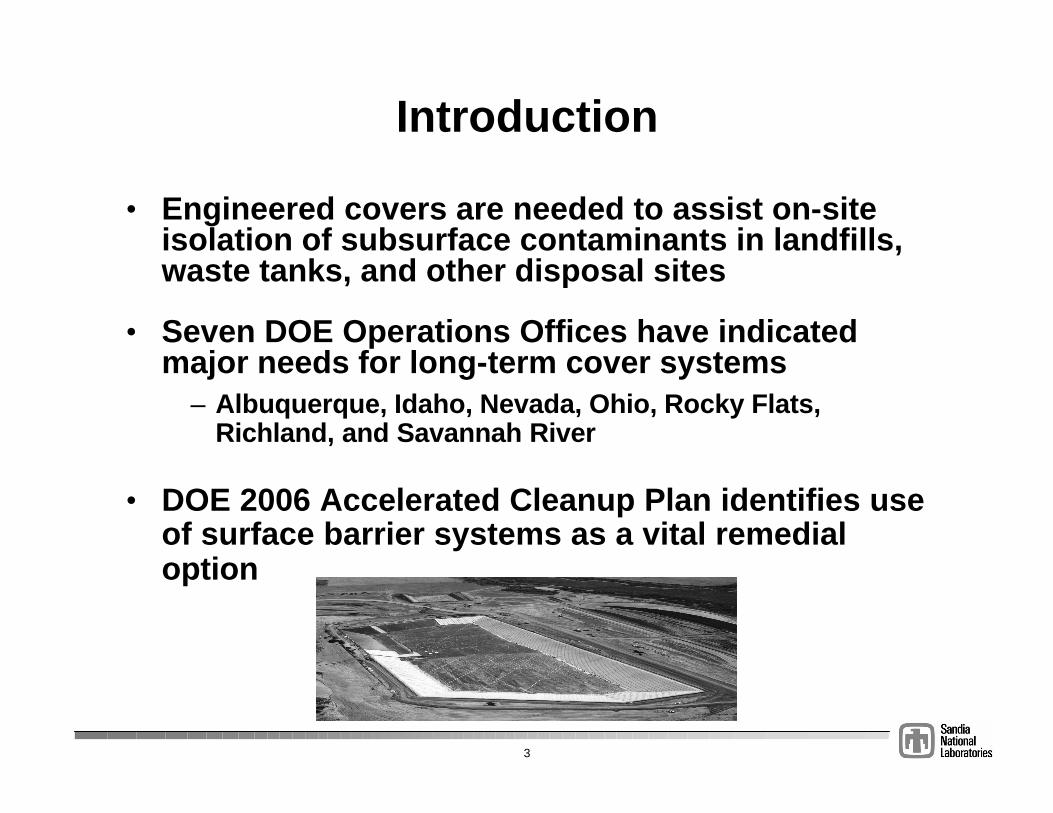
• Engineered covers are needed to assist on-site isolation of subsurface contaminants in landfills, waste tanks, and other disposal sites
• Seven DOE Operations Offices have indicated major needs for long-term cover systems
– Albuquerque, Idaho, Nevada, Ohio, Rocky Flats, Richland, and Savannah River
• DOE 2006 Accelerated Cleanup Plan identifies use of surface barrier systems as a vital remedial option

4
Problem Statement
• Need rigorous method to evaluate long-term performance of covers with quantification of risk and uncertainty
• Need way to identify parameters and processes for performance verification and monitoring
• Need more rigorous methods to compare alternative designs and approaches
– Reduce Costs– Meet regulatory performance metrics and schedules
Develop risk-based performance-assessment approach for selection, design, modeling, and monitoring of long-term covers

5
Overview
• Introduction
• Approach
• Demonstration
• Impact and Summary

6
Approach
Performance Assessment
Engineering Design/Deployment
Performance Monitoring and
Stewardship
Environmental Setting/Site
Characterization
Public and Stakeholder OutreachPublic and Stakeholder Outreach
Regulatory RequirementsRegulatory Requirements

7
Performance Assessment
Process
Scenario 2Scenario 1
Select Select Reject
Scenario 3
Develop and Screen Scenarios
KsatClimate Change Defects
Estimate Parameter Ranges and Uncertainty
ClimateEvapotranspirationSource TermVadose ZoneSaturated ZoneHuman Exposure
Develop Models
PA_process.ai
Perform Calculations00E000E000E000E000E000E000E000E000E000E000E000E0000D63768118>I<FFF8FFF8FFF80038003800380038003800380038003800380038003800380038003800380038003003800380038003800380038003800380038003800380038003800380038003800380038003800380038003800380038003800380038003800380038003800380038003800380038003800380038003800380038003800380
Uncertainty AnalysisSensitivity AnalysisAlternative Designs
Risk/Perfor manceCost/ScheduleRegulatory Compliance
Interpret Results
Monitoring Requirements
8
Overview
• Introduction
• Approach
• Demonstration
• Impact and Summary

9
Monticello Disposal Site
• Permanent repository for 2.5 million cubic yards of low-level radioactive mill tailings and contaminated soils
• Sub-humid environment– Average annual temperature ~ 46 F
– Average annual precipitation ~ 15 in
• Repository design consists of– composite cover system
– double-liner system beneath tailings
– leachate collection and removal system and leak-detection system

10
2.6 m
12.5 m Source Term
1.5 cmComposite Liner
Vadose Zone4.6 m
Receptor Well
Confining Layer
Groundwater Flow
Cover
Aquifer
not to scale
Conceptual Model Development
Vertical Percolation/
Evapotranspiration Layer (soil)
Lateral Drainage Layer (sand)
Geomembrane Liner
(60 Mil HDPE)
Barrier Layer(clay)
Uranium Mill Tailings
66”
24”
Vertical Percolation/
Evapotranspiration Layer (soil)
Lateral Drainage Layer (sand)
Geomembrane Liner
(60 Mil HDPE)
Barrier Layer(clay)
Uranium Mill Tailings
Vertical Percolation/
Evapotranspiration Layer (soil)
Lateral Drainage Layer (sand)
Geomembrane Liner
(60 Mil HDPE)
Barrier Layer(clay)
Uranium Mill Tailings
Vertical Percolation/
Evapotranspiration Layer (soil)
Lateral Drainage Layer (sand)
Geomembrane Liner
(60 Mil HDPE)
Barrier Layer(clay)
Uranium Mill Tailings
66”
24”
PrecipitationPrecipitation
Lateral DrainageLateral Drainage
RunoffEvapotranspiration
RunoffEvapotranspiration
InfiltrationInfiltration
Percolation
Radon-Gas Flux
Groundwater Concentration Peak Dose
(HELP, RAECOM codes)Cover
(FRAMES/MEPAS codes)Total System
11
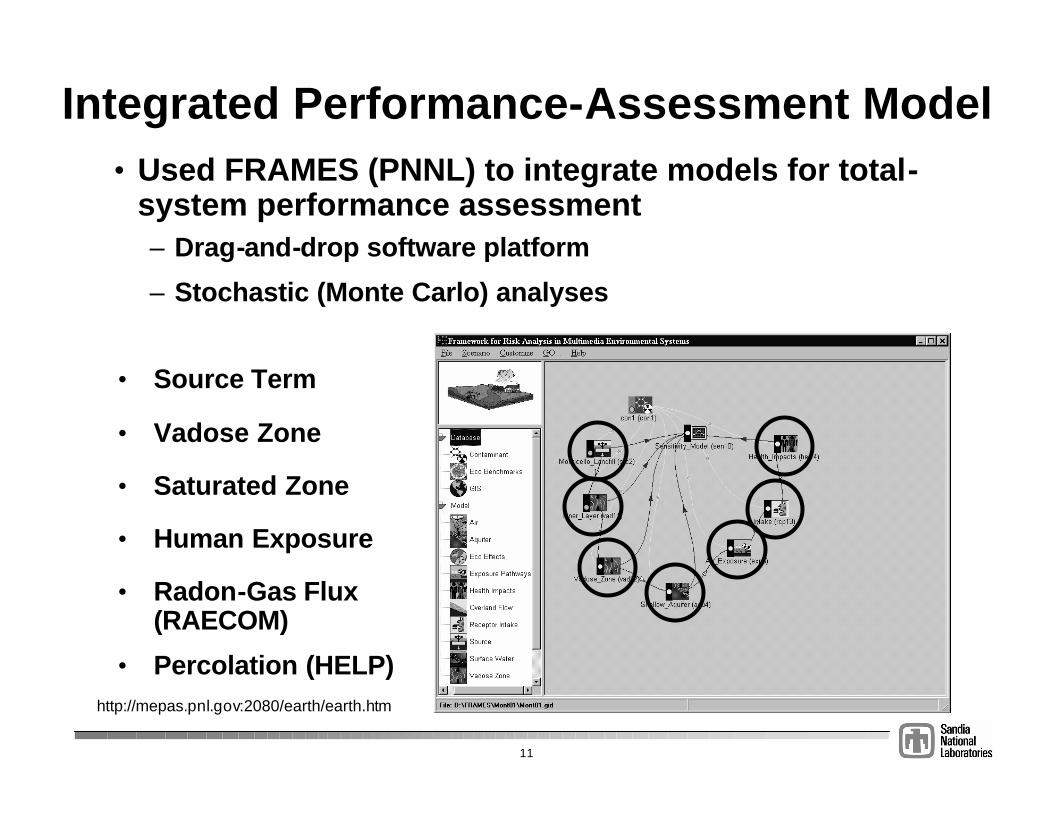
Integrated Performance-Assessment Model• Used FRAMES (PNNL) to integrate models for total-
system performance assessment– Drag-and-drop software platform
– Stochastic (Monte Carlo) analyses
• Source Term
• Vadose Zone
• Saturated Zone
• Human Exposure
http://mepas.pnl.gov:2080/earth/earth.htm
• Radon-Gas Flux (RAECOM)
• Percolation (HELP)

12
Performance-Assessment AnalysesExamples from Monticello Study
• Risk/Uncertainty Analysis
• Sensitivity Analysis
• Alternative Design Comparison
• Meet regulatory performance metrics
• Identify important parameters
• Reduce costs

13
Risk/Uncertainty Analysis• Multiple computer “realizations” are simulated
using stochastic inputs
0
2
4
6
8
10
12
-7 -6 -5 -4 -3 -2
Ksat_1.qpc
Co
un
t
log10
(Ksat
) (cm/s) for Layer 1
Stochastic Inputs(Latin Hypercube Sampling)
Multiple Computer Simulations(HELP, FRAMES)
• Ensemble of realizations yields probability distribution for “performance metric”
Distribution of Results(Present and Future Conditions)
10-6 10-5 10-4 10-3 10-2 10-1 100 1010
20
40
60
80
100present_future_cdf.qpc
Average Annual Percolation through Layer 4 (inches)
Cu
mu
lativ
e P
rob
abili
ty
sing
le d
eter
min
istic
resu
lt
present
future
14
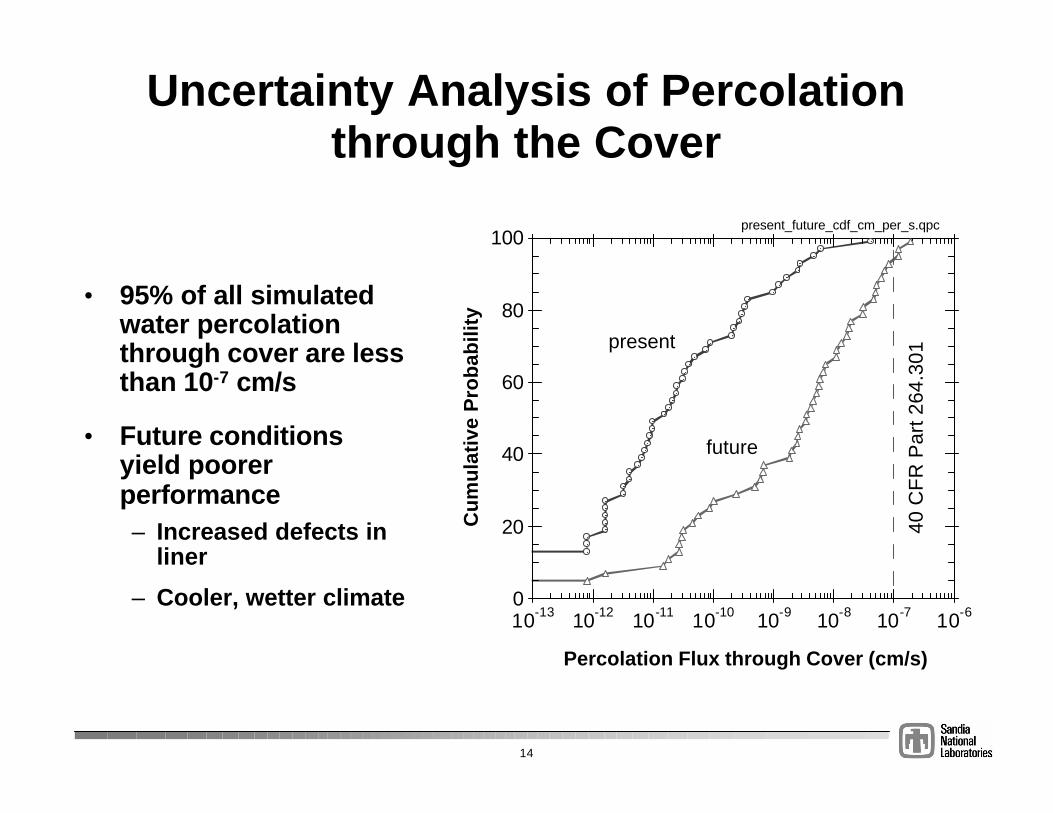
Uncertainty Analysis of Percolation through the Cover
• 95% of all simulated water percolation through cover are less than 10-7 cm/s
• Future conditions yield poorer performance– Increased defects in
liner
– Cooler, wetter climate10-13 10-12 10-11 10-10 10-9 10-8 10-7 10-60
20
40
60
80
100present_future_cdf_cm_per_s.qpc
Percolation Flux through Cover (cm/s)
Cu
mu
lati
ve P
rob
abili
ty
present
future
40 C
FR
Par
t 264
.301
15
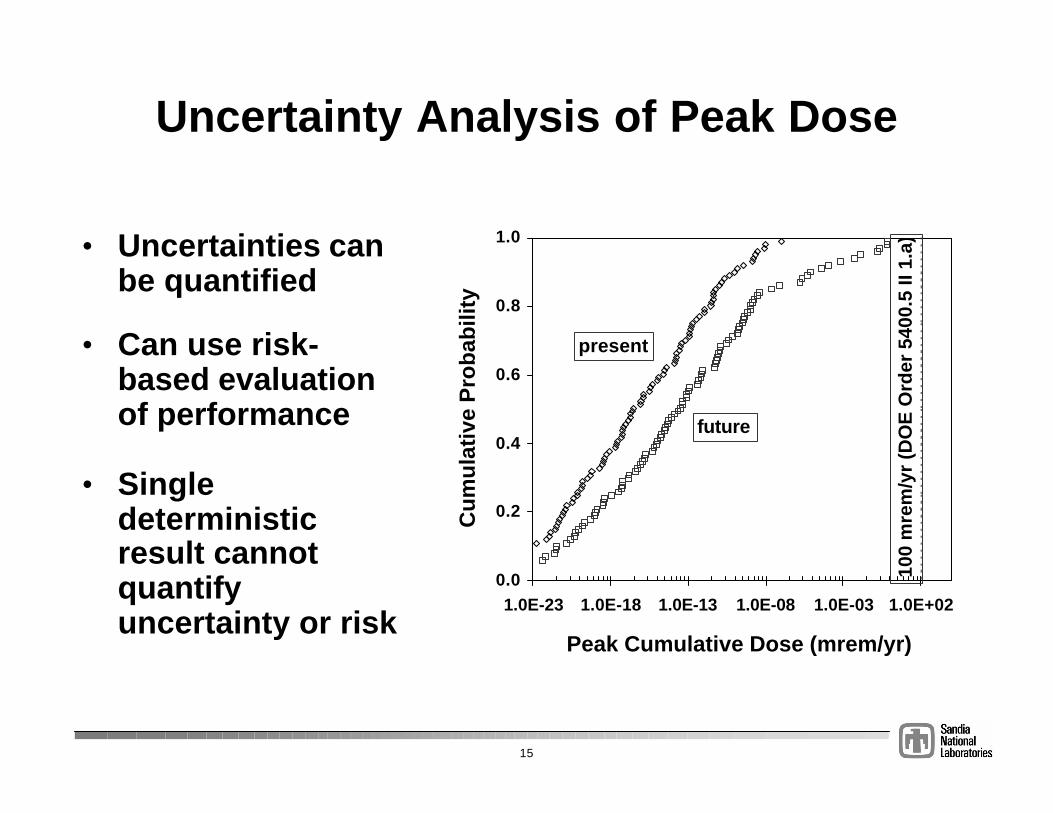
Uncertainty Analysis of Peak Dose
• Uncertainties can be quantified
• Can use risk-based evaluation of performance
0.0
0.2
0.4
0.6
0.8
1.0
1.0E-23 1.0E-18 1.0E-13 1.0E-08 1.0E-03 1.0E+02
Peak Cumulative Dose (mrem/yr)
Cu
mu
lati
ve P
rob
abili
ty
present
future
100
mre
m/y
r (D
OE
Ord
er 5
400.
5 II
1.a)
• Single deterministic result cannot quantify uncertainty or risk
16
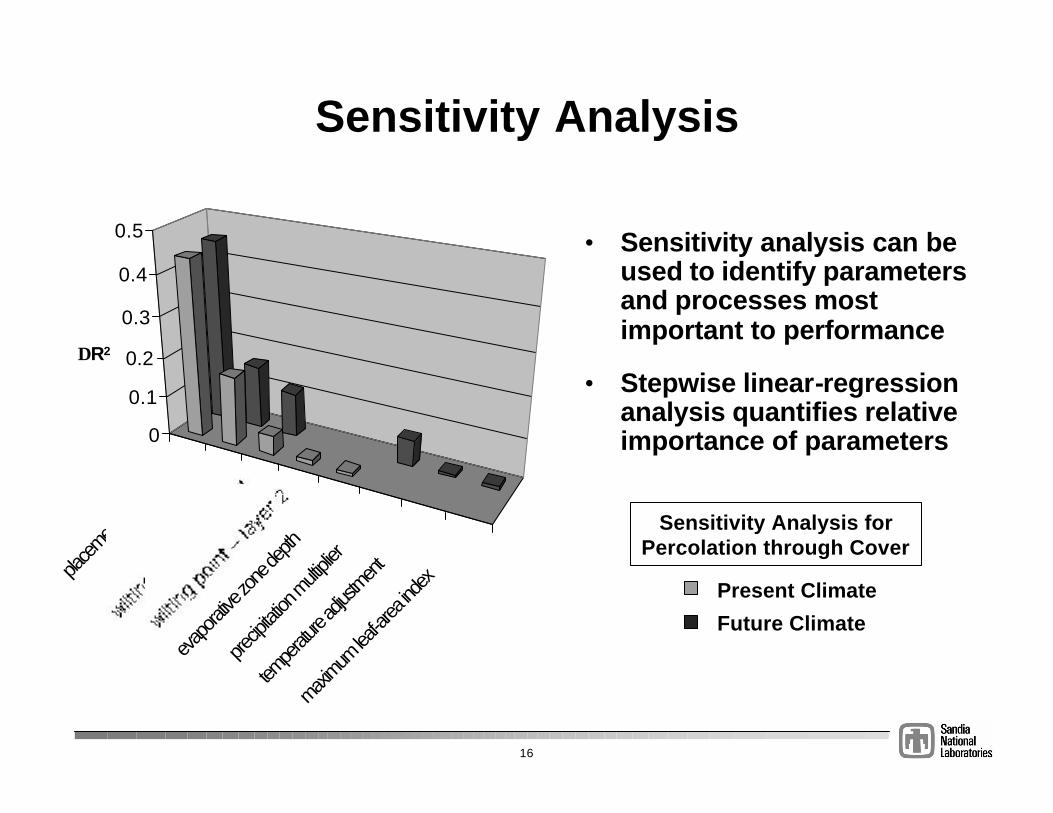
Sensitivity Analysis
place
ment qu
ality
Ksat-
layer
1
evap
orative
zone
depth
precip
itation
multi
plier
tempe
rature
adjus
tmen
t
maxim
um lea
f-area
index
0
0.1
0.2
0.3
0.4
0.5
Sensitivity Analysis for Percolation through Cover
Present Climate
Future Climate
• Sensitivity analysis can be used to identify parameters and processes most important to performance
• Stepwise linear-regression analysis quantifies relative importance of parameters
∆R2
17
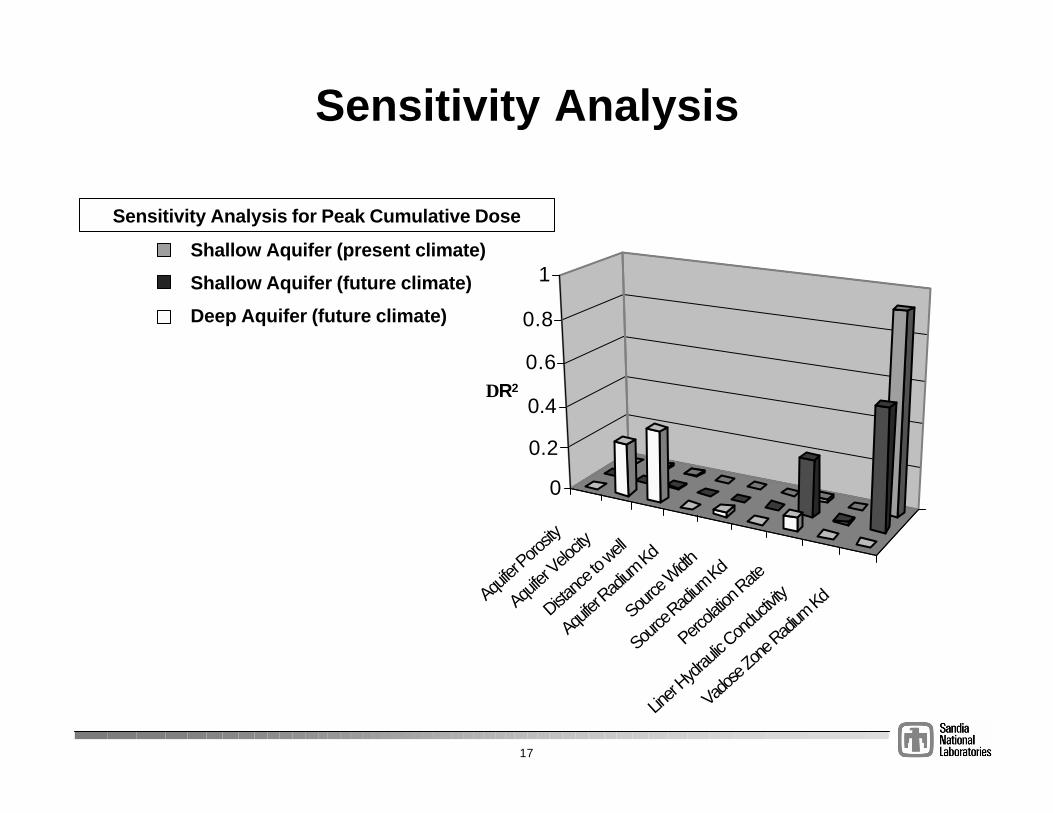
Aquifer
Porosity
Aquifer
Velocity
Distanc
e to w
ell
Aquifer
Radium
Kd
Source
Width
Source
Radium
Kd
Percola
tion Rate
Liner
Hydrau
lic Con
ductiv
ity
Vadose
Zone
Radium
Kd
0
0.2
0.4
0.6
0.8
1
Sensitivity Analysis
∆R2
Sensitivity Analysis for Peak Cumulative Dose
Shallow Aquifer (present climate)
Shallow Aquifer (future climate)
Deep Aquifer (future climate)
18
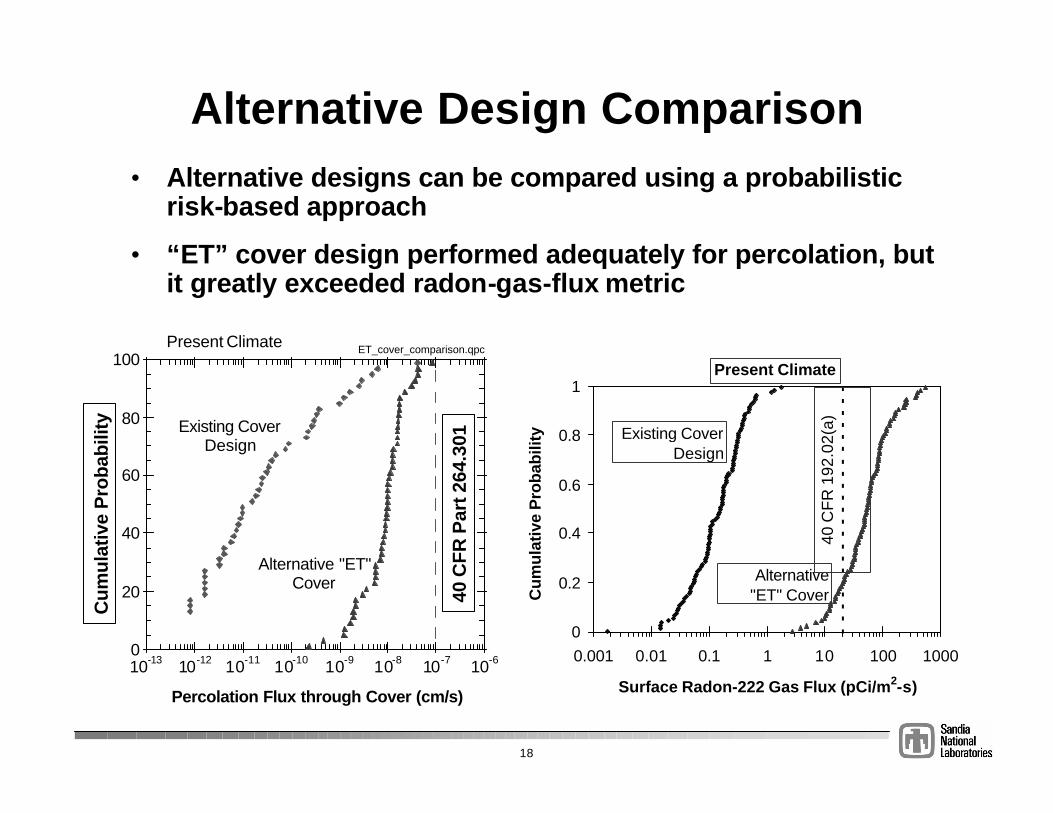
Alternative Design Comparison• Alternative designs can be compared using a probabilistic
risk-based approach
• “ET” cover design performed adequately for percolation, but it greatly exceeded radon-gas-flux metric
0
0.2
0.4
0.6
0.8
1
0.001 0.01 0.1 1 10 100 1000
Surface Radon-222 Gas Flux (pCi/m2-s)
Cu
mu
lativ
e P
rob
abili
ty Existing Cover Design
Alternative "ET" Cover
40 C
FR
192
.02(
a)
Present Climate
10-13 10-12 10-11 10-10 10-9 10-8 10-7 10-60
20
40
60
80
100ET_cover_comparison.qpc
Percolation Flux through Cover (cm/s)
Cum
ulat
ive
Pro
babi
lity
40 C
FR
Par
t 264
.301
Alternative "ET"Cover
Existing CoverDesign
Present Climate
Cum
ulat
ive
Pro
babi
lity
40 C
FR P
art 2
64.3
01

19
Overview
• Introduction
• Approach
• Demonstration
• Impact and Summary

20
Impact and Summary
• Probabilistic PA approach provides rigorous regulatory-based evaluation of long-term cover systems
– Quantifies risk and uncertainty
• Sensitivity analyses identify processes and parameters most important to performance
– Site characterization– Performance verification and monitoring
• Provides risk-based comparison between alternative approaches and designs
– Reduce costs and meet schedule– Meet regulatory performance metrics
• Software and methods are ready for use– www.sandia.gov/eesector/gs/gh/SAND2001-3032.pdf

21
Backup Slides
22
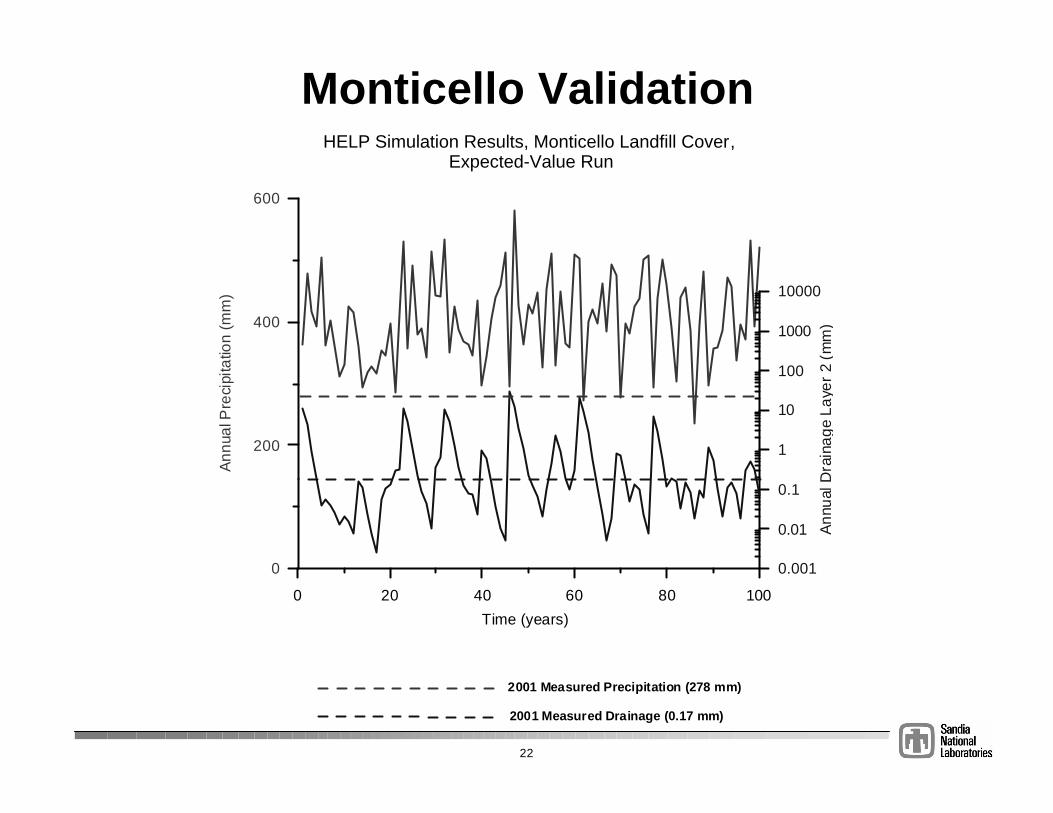
Monticello Validation
0 20 40 60 80 100
Time (years)
0
200
400
600
Ann
ual P
reci
pita
tion
(mm
)
0.001
0.01
0.1
1
10
100
1000
10000
Ann
ual D
rain
age
Laye
r 2
(mm
)
HELP Simulation Results, Monticello Landfill Cover, Expected-Value Run
2001 Measured Precipitation (278 mm)
2001 Measured Drainage (0.17 mm)

23
Uncertainty Distributions for Input Parameters
• Future Climate Conditions– Precipitation
– Temperature
• Percolation through Cover– Evapotranspiration
– Hydrologic Properties
– Geomembrane Quality
• Transport Parameters– Sorption Coefficient
– Dispersivity
– Distance to Well
• Radon-Gas Flux Parameters– Diffusion Coefficient
– Moisture Content
0
2
4
6
8
10
12
-7 -6 -5 -4 -3 -2
Ksat_1.qpc
Cou
nt
log10
(Ksat
) (cm/s) for Layer 1