risk assessment thesis
DESCRIPTION
Risk AssessmentTRANSCRIPT

Risk Assessment and Decision Support Applicable to Oil Field Development Plants
Master of Science Thesis in the Master’s Programme, International Project
Management
SAMINEHSADAT BITARAF Department of Product and Production Development Division of Production System
CHALMERS UNIVERSITY OF TECHNOLOGY Göteborg, Sweden 2011 Master’s Thesis 2011


MASTER’S THESIS 2011
Risk Assessment and Decision Support Applicable to Oil Field Development Plants
Master of Science Thesis in the Master’s Programme, International Project
Management
SAMINEHSADAT BITARAF
Department of Product and Production Development Division of Production System
CHALMERS UNIVERSITY OF TECHNOLOGY
Göteborg, Sweden 2011

Risk Assessment and Decision Support Applicable to Oil Field Development Plants Master of Science Thesis in the Master’s Programme, International Project
Management
SAMINEHSADAT BITARAF
© SAMINEHSADAT BITARAF, 2011
Examiner and Supervisor: Dr. MOHAMMAD SHAHRIARI
Department of Product and Production Development
Division of Production System
Chalmers University of Technology
SE-412 96 Göteborg
Sweden
Telephone: + 46 (0)31-772 1000
Printed by: Chalmers reproservice Göteborg, Sweden 2011
I
Risk Assessment and Decision Support
Applicable to Oil Field Development Plants
Master of Science Thesis in the Master’s Programme, International Project
Management
SAMINEHSADAT BITARAF Department of Product and Production Development Division of Production System Chalmers University of Technology
ABSTRACT
Typically, oil production activities contain many hazardous scenarios which could cause catastrophic disasters such as loss of asset, human fatalities or injuries and environmental pollutions. Essence of designing a safe process plant and delivering sustainable performance makes an efficient risk management plan necessary for promoting safety in hazardous industries such as oil production. Risk management activities including hazard identification and risk assessment support decision makers to manage the relevant risks and take appropriate actions to reduce the critical risks levels and contribute sustainable development.
In spite of abundant number of tools, techniques and methodologies to apply risk management, there are still some difficulties to address uncertainties associated with decision making during different phases of a project life cycle. Furthermore, in most decision making models, there isn't a clear distinguish between the key components of risk management process e.g. risk, uncertainty, hazard, and feeling threat.
This paper is an attempt to present an efficient model to provide an appropriate decision making approach under the uncertain situation. The novel aspect of this model is that all key components of risk management process are addressed clearly and shows the relation between hazards, feeling of threats, and risk assessment process. Additionally, the model is a great assistant for managers to identify key affective variables on safety of the plant.
An oil field development plant is selected as a case study to apply the presented model and assess related risks and uncertainties during the basic design phase of the project in order to demonstrate the efficiency of the model. Three main categories are identified as the major causes of hazard situations in the oil field development plant which are technical causes, organizational causes, and political issues. The required considerations and appropriate actions to reduce the level of risks levels as a result of identified variables have been analysed for the selected possible hazardous scenarios.
The implementation of this model in the selected case study proves that the model has the ability to support decision makers and managers in oil and gas industry to take an appropriate action by addressing the key variables which may cause potential for failures (hazard situation). Also, the challenges which are emerged during the application of model in the investigated case study have been discussed in this paper.
Key words: risk assessment, decision making, uncertainty; process industry

II CHALMERS, Product and Production Development, Master’s thesis 2011

III
ACKNOWLEDGMENTS I would not have accomplished this work without the tremendous help I have received from others. First of all, I am sincerely grateful to my supervisor, Dr. Mohammad Shahriari, for great supervision, encouragement, enthusiasm and support.
I am also very grateful for excellent support from my friend, Karan Sotoodeh. Karan, I very much appreciate your support and encouragement, thank you for your valuable discussion and feedbacks.
Deepest gratitude and love to my parents for their dedication, understanding and endless love, through the duration of my study.
Samineh Bitaraf

IV CHALMERS, Product and Production Development, Master’s thesis 2011
Contents
1 INTRODUCTION 1
1.1 Background of the Study 1
1.2 Aims and Objectives 2
1.3 Research Methodology 2
1.4 Research Limitations 2
2 THE THEORETICAL BACKGROUND 4
2.1 The Concept of Risk 4
2.2 Hazard 5
2.3 Probability/likelihood 5
2.4 Uncertainty 5
2.5 Risk Vs Uncertainty 6
2.6 Variables 8
2.6.1 Types of variable 8
2.7 Sources of Uncertainty 9
2.7.1 Parameter uncertainty 10
2.7.2 Quantifying the effect of variable uncertainties 11
2.7.3 Model Uncertainty 12
2.7.4 Scenario Uncertainties 12
2.8 Project Life Cycle 12
3 RISK MANAGEMENT METHODOLOGY 17
3.1 Risk Management Processes 17
3.1.1 Establish the Context 18
3.1.2 Risk Assessment 19
3.1.3 Managing the Risk 19
3.1.4 Monitoring and Review 19
3.1.5 Communication and Consultation 19
3.2 Risk Assessment Process 20
3.2.1 Hazard Identification 20
3.2.2 Risk Analysis 20
3.2.3 Risk Evaluation 22
3.2.4 Application of hazard and risk assessment during life cycle phases 24
3.2.5 Selection of methods for hazard identification and risk assessment 24
3.2.6 Classification of Hazard Identification and Risk Assessment Techniques 25
3.3 Hazard Identification and Risk Assessment Techniques 27
3.3.1 Check lists 27
3.3.2 HAZID (Hazard Identification) 27
3.3.3 Preliminary Hazard Analysis (PHA) 27
V
3.3.4 What-IF Method 28
3.3.5 Fault Tree Analysis (FTA) 28
3.3.6 Event Tree Analysis (ETA) 29
3.3.7 Failure Mode and Effect Analysis (FMEA) 30
3.3.8 HAZOP (Hazard and Operability Analysis) 31
3.3.9 Monte Carlo Simulation 32
3.3.10 Risk Ranking Matrix 33
4 THE UNCERTAINTY DECISION MAKING MODEL 34
4.1 The Decision Making Model 34
4.1.1 The normal planning decision making 35
4.1.2 Decision making under an emergency situation 37
4.2 Success Factors of the Uncertainty Decision Making Model 39
5 APPLICATION AND RESULTS 40
5.1 Case study description 40
5.1.1 Scope of the project 41
5.1.2 Process Description 41
5.2 Application of the decision making model in case study 43
5.2.1 Setting the Goal 43
5.2.2 Variables 43
5.2.3 Hazard (Potential for Failure) and Feeling Threat 49
5.2.4 Identification and Analysing Possible Alternatives 49
5.2.5 Hazard Identification 50
5.2.6 HAZOP 50
5.3 The Hazard Scenarios 51
5.3.1 Probability Estimation methodology 52
5.3.2 Description and probability estimation of scenario 1 52
5.3.3 Description and probability estimation of Scenario 2 57
5.3.4 Description and probability estimation of Scenario 3 62
5.4 Consequence Analysis 64
5.5 Risk Level 65
6 CONCLUSION AND RECOMMENDATIONS 68
6.1 Required considerations to reduce the effect of variables 68
6.1.1 Technical Causes 68
6.1.2 Organizational Causes 69
6.1.3 Political Issues 70
6.2 Uncertainties associated with risk assessment 71
6.3 Challenges and Success Factors of the Uncertainty Decision Making Model 71
7 REFERENCES 73

VI CHALMERS, Product and Production Development, Master’s thesis 2011
ATTACHMENT 1: THE HAZOP WORKSHEET 78

CHALMERS, Product and Production Development, Master’s thesis 2011 1
1 Introduction
1.1 Background of the Study
In General, oil production activities contain many hazardous scenarios associated with them. The oilfield development plants typically, handle large quantity of toxic, flammable and explosive substances and component often at high temperatures and pressures. These processes inherently have a potential to cause undesirable events of fire, explosion, and toxic release which leads to loss of production and assets, human fatalities or injuries and environmental pollution (Sutton, 2010). Essence of designing a safe process plant makes an efficient risk management plan necessary for promoting safety in hazardous industries such as oil production.
Decisions made during the design phase can greatly influence the safety of the plant during the operation phase. Every decision making situation involves some degree of uncertainty and managers face with judgment regarding uncertainties. Uncertainty exists where the all possible consequences of an event are unknown, the probability of either the hazards and/or their associated consequences are uncertain, or both the consequences and the probabilities are unknown (Bernhard, 1999; Rodger et al., 1999; Willows et al., 2003; Holton, 2004; Kaliprasad, 2006; Sackmann, 2007; Migilinskas et al., 2008; Cleden, 2009). To move from an uncertain situation, there is a need to improve the level of knowledge about the hazard situations, their probabilities and possible impacts; this process is referred as risk assessment. The result of risk assessment is used to provide information to aid decision making on the need to introduce risk reduction measures.
During the recent year there has been a major interest in managing risk and uncertainties in the projects to increase the level of project success. In spite of abundant number of tools, techniques and methodologies to apply risk assessment, there are still some difficulties to address uncertainties associated with decision making during different phases of a project life cycle. Furthermore, in most decision making models, there isn't a clear distinguish between the key components of risk management process e.g. risk, uncertainty, hazard, and feeling threat.
This research is an attempt to present an efficient model to provide an appropriate decision making approach under the uncertain situation. The novel aspect of this model is that all key components of risk management process are addressed clearly and shows the relation between hazards, feeling of threats, and risk assessment process. Additionally, the model is a great assistant for managers to identify key affective variables on safety of the plant.
An oil field development plant is selected as a case study to apply the presented model and assess related risks and uncertainties during the basic design phase of the project in order to demonstrate the efficiency of the model. Three main categories are identified as the major causes of hazard situations in the oil field development plant which are technical causes, organizational causes, and political issues. The required considerations and appropriate actions to reduce the risks levels as a result of identified variables have been analysed for the selected possible hazardous scenarios.
The implementation of this model in the selected case study proves that the model has the ability to support decision makers and managers in oil and gas industry to take an appropriate action by addressing the key variables which may cause potential for failures (hazard situation). Also, the

2 CHALMERS, Product and Production Development, Master’s thesis 2011
challenges which are emerged during the application of model in the investigated case study have been discussed in this paper.
1.2 Aims and Objectives
The overall aims of this thesis are
• How to address uncertainties in decision making process
• Clear distinguish between the key components of risk
To fulfil the research purpose and achieve the aim of the study the researcher identified following objectives:
• Identification of risk factors including uncertainties that influence projects and decision
making process.
• Reviewing and Comparing the existing risk assessment methods which are referred by
managers to make a decision during projects
• Presenting an uncertainty decision making model to provide an appropriate decision
making approach and establish an effective risk management process
• Applying the presented decision making model to risk and uncertainties associated with
an Oil Field Development Project and evaluating its effectiveness
1.3 Research Methodology
The research started with a general review of relevant literatures including basic concepts of risk and uncertainty, risk management processes, hazard identification and risk assessment techniques, including academic journals, articles and books. The uncertainty decision making model is presented to provide an appropriate decision making approach to support decision makers under uncertain situations. That is followed by applying the presented model to risks and uncertainties associated with an oil field development plant’s case study. This enables the researcher to evaluate the effectiveness of the presented uncertainty decision making model in the real case study and find out its weaknesses and strengths. This case study was selected due to importance of oil field development plants after oil and gas extraction from the reservoir. For more explanation, these types of plants play a great role in crude preparation and relevant preliminary treatments prior to transmission to refineries.
1.4 Research Limitations
It is almost impossible to take all the effective factors into account to develop a comprehensive decision making model dealing with risks in oil and gas industry. This research aims to present a suitable supportive model for managers who deal with hazards which can possibly happen in the process industry specifically in oilfield development plants. Since detail analysis of all identified hazards are not possible in this limited report, just three hazardous scenarios are selected for further analysis to evaluate the model efficiency. This report doesn’t cover the quantitative

CHALMERS, Product and Production Development, Master’s thesis 2011 3
consequence analysis of identified hazardous scenarios because of lack of access to detailed technical information of this project. Furthermore, this paper doesn’t focus on quantitative analysis and effectiveness of measures to mitigate the negative outcomes of identified risks.
4 CHALMERS, Product and Production Development, Master’s thesis 2011
2 The Theoretical Background
In this chapter we discuss the risk factors including uncertainties and variables that influence risk management and decision making process.
2.1 The Concept of Risk
Talking about risks faces the immediate danger that everybody talks about something different. Risk is defined in many ways and providing a universal definition of “Risk” is not easy. There are a vast number of definitions in different literatures, which are different depending on the problem area. For example, if the considered risk is based on economic view, engineering or technical view, environment or human health problems, or based on the wider view about risks in project objectives.
In general, the concept of risk is defined as a combination of the probability and the consequence of an undesirable event (Sherif, 1989; Renn, 1998; WHO, 2004; Kristensen, et. al, 2006; Aven et
al., 2007; Aven, 2010). In other word, to answer the question “what is risk?” we need to answer three questions: What can happen? What are the consequences? And how likely is this?
According to the environmental perspective about risk, risk is the combination of probability and consequence. Typically, consequences are referred to different aspect of HSE, such as loss of life, injuries, environmental and social aspects (Gough, 1994; Willows et al., 2003; Aven et al., 2007; Sutton, 2010; Filipsson, 2011). Environmental risk includes ecological risk, human risk, social, and cultural risk which is in lined with the definition of risk by United State Environmental Protection Agency (EPA) (Gough, 1994).
Another risk perspective is discussed by Chapman et al. (2003), PMI (2009), and Young (2010), which is described risk as “an uncertain event or condition that, if it occurs, has a positive or negative effect on a project Objectives”. In this definition the probability is referred to uncertainty and the consequence is described as effect on project objectives. Aven (2010) argues that, uncertainty is an important component of risk which should be considered in all aspects of risk assessment and decision analysis process. Project objectives are referred to scope, schedule, cost and quality.
In contrast to the other definitions of risk which are just focused on negative side of risk, this definition embraces both negative and positive effects. Chapman et al., (2003) and PMI (2009) argue that in any given decision situation both threats and opportunities are usually involved, and both should be managed. A focus on one should never be allowed to eliminate concern for other. Therefore, risk concept includes uncertain events which could have a negative effect on a project’s objectives, as well as those which could have a positive effect.
Another attributes typically associated with risk are hazard and probability which are described in more detail at the following paragraphs.

CHALMERS, Product and Production Development, Master’s thesis 2011 5
2.2 Hazard
It is important to remember hazard is different to risk. A hazard is a situation that has the potential to cause harm, including human injury, damage to property, damage to the environment, or some combination of these (ISO 17776, 2000; AS/NZS: 4360, 2004; IEC, 2008; Sutton, 2010; Filipsson, 2011). According to WHO (2004) hazard is “Inherent property of an agent or situation having the potential to cause adverse effects when an organism, system, or (sub) population is exposed to that agent”.
As mentioned, a hazard exists where a situation has a potential ability to cause an adverse effect. Risk, on the other hand, is the chance that such effects will occur.
2.3 Probability/likelihood
A probability is a way of expressing to what extent an event or consequence is likely to occur. (Kristensen et al., 2006; Aven et al., 2007; Aven, 2010) There are basically two ways of interpreting a probability:
(a) Within the classical statistical approach risk is exist objectively, and experts should calculate the best estimate of this risk based on hard data. Probability, based on this approach is interpreted as the relative proportion of time that an event occurs, if the investigated situation were repeated an infinite number of times. According to this definition each event has a probability of occurrence such as once in a 100 years (Bernhard, 1999; Kristensen et al., 2006; Sutton, 2010; Aven et al., 2007; Aven, 2010).
(b) Based on the Bayesian perspective, probability is a subjective measure of uncertainty. Probability is a measure of uncertainty about the event and its consequences, according to experts’ judgment evolving their background information and knowledge (Bernhard, 1999; Kristensen et al., 2006; Aven et al., 2007; Aven, 2010).
As an example, consider the probability of an explosion of a process plant within the period of one year. Following definition (a), if the sufficient experience data were available, we produce estimates base on the analysis of the data under the classical statistical approach. These estimates are uncertain, as there could be large difference between the estimates and the real values in the future. Following definition (b), if the required data were not available, we use engineering judgments to establish subjective uncertainty measures in order to estimate the true value of probability (Kristensen et al., 2006, Aven et al., 2007).
2.4 Uncertainty
Every decision making situation involves some degree of uncertainty, without uncertainty these decisions will be straightforward. While, the reality is more complex and decisions involve judgments regarding uncertainties. Uncertainty exits where we are faced with lack of certain knowledge that is assumed to be important to make a decision (Willows et al., 2003; Holton, 2004). For example, capital investment decision making in oilfield exploration projects involve

6 CHALMERS, Product and Production Development, Master’s thesis 2011
great number of uncertainties in term of oil price and demand, geological and operational uncertainties, political issues and etc which all influence over their investment plan in this industry.
Decision makers are faced with uncertainty when more than one outcome is possible for each alternative and the probabilities of these outcomes are unknown (Holton, 2004). In other word, uncertainty exists where the all possible consequences of an event are unknown, the probability of either the hazards and/or their associated consequences are uncertain, or both the consequences and the probabilities are unknown (Bernhard, 1999; Rodger et al., 1999; Willows et al., 2003; Holton, 2004; Kaliprasad, 2006; Sackmann, 2007; Migilinskas et al., 2008; Cleden, 2009).
Uncertainty indicates the level and quality of our knowledge
about probability and consequence of an event (Willows et
al., 2003).
2.5 Risk Vs Uncertainty
It is important to distinction between risk and uncertainty. There is an abundance of literature that discusses term of uncertainty, risk and their differences (Bernhard, 1999; Kaliprasad, 2006; Sackmann, 2007; Migilinskas et al., 2008; Samson et al., 2009; Cleden, 2009). Bernhard (1999) indicates the level of knowledge about risk and uncertainty as a journey from uncertainty to risk (see Figure 2.1 and Figure 2.2).
Figure 2.1 The level of knowledge about Risk and Uncertainty (Adopted from Bernhard, 1999)
The most famous theory is introduced by Frank Knight in economic points of view; he defines quantifiable uncertainties as risk and non-quantifiable uncertainties as uncertainty, in other word, risk is present if you can assign a probability to future events, but uncertainty is present if the probability of the future events is indefinite or incalculable (Samson et al., 2009). We will adopt the following definition of risk and uncertainty in this paper:
Probability and consequence
Unknown
Some knowledge of
Probability and consequence
Probability and consequence
Known
Uncertainty
Risk &
Uncertainty
Risk
Level of knowledge

CHALMERS, Product and Production Development, Master’s thesis 2011 7
• Uncertainty exists where you don’t know the all possible consequences, the possibility of
subsequences are completely unknown or you don’t know what the underlying
distribution look like, or both consequences and probabilities are unknown (Rodger et al.,
1999; Kaliprasad, 2006; Sackmann, 2007; Migilinskas et al., 2008).
• Risk exits where we know the all possible consequences but we don’t know which
consequences will occur for sure; in addition the probability of outcomes or the
underlying outcome distribution is known by decision makers (Sackmann, 2007;
Migilinskas et al., 2008).
Goo
d
Consequence uncertainty
• Limited ability to identify the all possible consequences
• Uncertain how to evaluate the consequences
State of Risk
• Stable political, financial, legal, and environmental conditions
• Good knowledge about the process
• Good knowledge about the consequences of an event
• Reliable historical data
Kn
ow
led
ge
of
pro
ba
bil
ity
State of Uncertainty
• Unstable political, financial, legal, and environmental conditions
• New/ unknown process
• Lack of knowledge about the consequences
• Insufficient data
• Lack of knowledge about the interaction and dependencies between different part of system
Probability Uncertainty
• Lack of knowledge about the likelihood of the consequences
• Uncertainty about the long term impacts
poo
r
Poor Knowledge of Consequence Good
Figure 2.2 The relation between the level of knowledge about probability and consequence and distinction between risk and uncertainty (Adopted from Willows et al., 2003)
Cleden (2009) illustrates the gap between risk and uncertainty by dividing uncertainty into two groups: Inherent uncertainty, which we start with it before make any attempt at analyzing the risk; and latent uncertainty, which is the uncertainty that remains once all the risks have been identified. Consequently, by risk management process, some uncertainties (inherent uncertainties) go into the risk, and what remains is latent uncertainty (see Figure 2.3).
The level of knowledge

8 CHALMERS, Product and Production Development, Master’s thesis 2011
Figure 2.3 The relationship between Risk and Uncertainty (adopted from Cleden, 2009)
A project manager who just relies on risk management may fall into the trap that all unknowns in the project are addressed. While (as Figure 2.3 shows) some uncertainties still remain unknown after risk analysis. These talent uncertainties can manifest as a problem much later in the project, often without warning (Cleden, 2009). This approach is in line with Chapman et al. (2003) approach about risk management. He believes that the Risk Management approach which just focuses on treats and opportunities (based on the PMI definition of Risk) will not address many sources of uncertainties (see Section 2.7 for sources of uncertainty) in the projects. Therefore, there is a strong need to move from risk management to uncertainty management in order to address all sources of uncertainty in the project.
“Consequently, the best place to start the risk assessment is to acknowledge that uncertainty
exists and plan to incorporate it into the analysis from the start” (NOAA, 2004).
2.6 Variables
Variables are the basic elements which should be identified as important ingredients to the risk analysis (Palisade, 2005). A variable in definition is any entity that can take on different values in different situations (Trochim, 2006). For example, in modelling a financial situation, variable might be sales, costs, revenues, profits, etc. Whereas, in modelling a risk analysis of a process plant, variables might be things like pressure, temperature, flow or chemical composition of material.
2.6.1 Types of variable
There are different ways to categorize the types of variable in different literatures. Pons et al., (2004) and Trochim, (2006) categorize the variable into quantitative and qualitative. Variables are not always numerical or quantitative for example gender is a variable consists of two text values, male and female.
In addition to being quantitative and qualitative, variables in a risk analysis model can be either “independent” or “dependent”. An independent variable is totally unaffected by other variables within the model. For example in financial model to evaluate the profitability of an agricultural crop, the variable of amount of rainfall is totally independent form the other variables within the model such as crop price and fertilizer cost, therefore variable of amount of rainfall is an independent variable (Palisade, 2005; Trochim, 2006)
Inherent Uncertainty
Before we take any attempt at
Latent
Uncertainty Risk
Identified through analysis
Remains after analysis

CHALMERS, Product and Production Development, Master’s thesis 2011 9
Conversely, a dependent variable is determined by one or more variables within the model. For example in modelling the safety of a process plant, compressors are utilized in gas processing units to increase the head by pressurizing the gas, this in turn, leads to temperature increscent of the gas; the variable of internal pressure of a vessel depends on the temperature of the fluid. If the temperature of the fluid increases the internal pressure of the vessel will increase as well. The correlation between variables is one of the sources of uncertainty.
Another important distinction that should be considered with the term variable is the distinction between certain and uncertain variables. The variable is certain or deterministic if you know the values that the variables will take. If you don’t know the values that variable will take they are uncertain or stochastic.
Variables aren’t the only source of uncertainty; the other sources of uncertainty are model uncertainty and scenario uncertainty that are discussed in detail in following paragraphs.
2.7 Sources of Uncertainty
Before beginning the risk assessment, decision makers need to identify the uncertainties and plan to incorporate them into the analysis from the earlier stage of project life cycle. It is important that decision makers understand that from which sources the uncertainty arises. Therefore, identification and classification the root sources of uncertainties is an efficient way to address all uncertainties in the project. Various classifications in sources of uncertainties have been suggested by different literature (Vesely et al., 1984; Haldar et al., 2000; Wang et al., 2000; Willows et al., 2003; WHO, 2008; NRC, 2009). Table 2.1 shows the summery of uncertainty types from the six sources:
Table 2.1 Uncertainty Types: Comparison from Selected Sources
Type 1 2 3 4
Vesely et
al., 1984
Knowledge Uncertainty
Physical Variability
Parameter Uncertainty
Modeling Uncertainty
Completeness Uncertainty
Haldar et
al., 2000
Non-Cognitive (Quantitative) Uncertainty
Inherent Uncertainty
Statistical Uncertainty
Modeling Uncertainty
Cognitive (Qualitative) Sources of Uncertainty
Wang et
al., 2000 Inherent
Uncertainty Statistical
Uncertainty Modeling
Uncertainty Human Error

10 CHALMERS, Product and Production Development, Master’s thesis 2011
Willows et
al., 2003
Environmental uncertainty; Inherent and
natural internal variability
Data Uncertainty
Model Uncertainty
Knowledge Uncertainty
WHO, 2008
Knowledge Uncertainty
Natural variation
(Variability)
Parameter Uncertainty
Model Uncertainty
Scenario Uncertainty
NRC, 2009
Epistemic Uncertainty
Aleatory Uncertainty
Parameter Uncertainty
Model Uncertainty
Completeness Uncertainty
Two major sources of uncertainty are needed to be differentiated:
1- Natural Variability is referred to the aleatory uncertainty, stochastic uncertainty, inherent uncertainty, or variability (Vesely et al., 1984; Haldar et al., 2000; Wang et al., 2000; Willows et al., 2003; WHO, 2008; NRC, 2009). Natural variability arises from inherently random factors that should be considered in risk assessment. Example of uncertainties due to natural variations are; environmental events such as volcanic eruptions and earthquakes; weather and climate; stock market, social and ecological systems (Willows et al., 2003).
2- Knowledge uncertainty or epistemic uncertainty is divided into parameter uncertainty, model uncertainty, and scenario uncertainty (Vesely et al., 1984; Haldar et al., 2000; Wang et al., 2000; Willows et al., 2003; WHO, 2008; NRC, 2009). This type of uncertainties can be reduced by further investigation.
The parameter uncertainty, Scenario uncertainty, and model uncertainty is described in more detail in the following paragraphs:
2.7.1 Parameter uncertainty
Parameter is the numerical value assigned to each of the variables used in a mathematical model for calculating risk. The parameter value for some of these model variables are simple to determine such as, the weight body. So, these variables have minimal parameter uncertainty. Conversely, other variables, such as the fraction of chemical absorbed into the body after ingestion, or the metabolic rate of the organism, reflect complex physiological process. Quantifying these variables are much complex and therefore the parameter uncertainty is high. In some cases, the variable cannot be measured directly and there is a need to expert judgment to
CHALMERS, Product and Production Development, Master’s thesis 2011 11
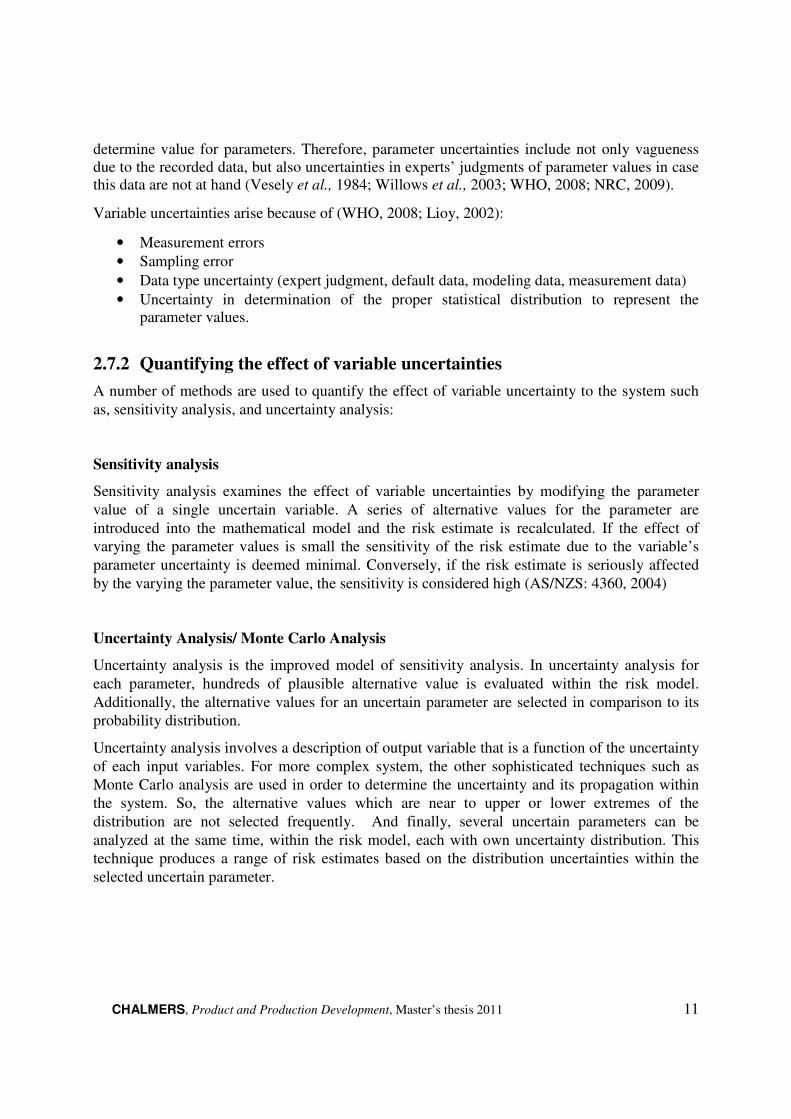
determine value for parameters. Therefore, parameter uncertainties include not only vagueness due to the recorded data, but also uncertainties in experts’ judgments of parameter values in case this data are not at hand (Vesely et al., 1984; Willows et al., 2003; WHO, 2008; NRC, 2009).
Variable uncertainties arise because of (WHO, 2008; Lioy, 2002):
• Measurement errors
• Sampling error
• Data type uncertainty (expert judgment, default data, modeling data, measurement data)
• Uncertainty in determination of the proper statistical distribution to represent the parameter values.
2.7.2 Quantifying the effect of variable uncertainties
A number of methods are used to quantify the effect of variable uncertainty to the system such
as, sensitivity analysis, and uncertainty analysis:
Sensitivity analysis
Sensitivity analysis examines the effect of variable uncertainties by modifying the parameter
value of a single uncertain variable. A series of alternative values for the parameter are
introduced into the mathematical model and the risk estimate is recalculated. If the effect of varying the parameter values is small the sensitivity of the risk estimate due to the variable’s
parameter uncertainty is deemed minimal. Conversely, if the risk estimate is seriously affected
by the varying the parameter value, the sensitivity is considered high (AS/NZS: 4360, 2004)
Uncertainty Analysis/ Monte Carlo Analysis
Uncertainty analysis is the improved model of sensitivity analysis. In uncertainty analysis for
each parameter, hundreds of plausible alternative value is evaluated within the risk model.
Additionally, the alternative values for an uncertain parameter are selected in comparison to its
probability distribution.
Uncertainty analysis involves a description of output variable that is a function of the uncertainty
of each input variables. For more complex system, the other sophisticated techniques such as
Monte Carlo analysis are used in order to determine the uncertainty and its propagation within
the system. So, the alternative values which are near to upper or lower extremes of the
distribution are not selected frequently. And finally, several uncertain parameters can be
analyzed at the same time, within the risk model, each with own uncertainty distribution. This
technique produces a range of risk estimates based on the distribution uncertainties within the
selected uncertain parameter.

12 CHALMERS, Product and Production Development, Master’s thesis 2011
2.7.3 Model Uncertainty
Model uncertainty relates to the limited ability of mathematical models to accurately represent the real world (Vesely et al., 1984; Haldar et al., 2000; Wang et al., 2000; Willows et al., 2003; WHO, 2008; NRC, 2009). Modelling uncertainty can be divided into two subcategories (Vesely et al., 1984; WHO, 2008):
• Model error is the evaluation of all key variables that have a fundamental impact on the results.
• Relation errors: the consideration of all variables in the model does not necessarily define appropriate relationships among them.
2.7.4 Scenario Uncertainties
Scenario uncertainty is also referred as completeness uncertainty. The risk analyst faces to lack knowledge or complete understanding of the problem; for example in the nature of the process, the interaction and dependencies between different parts of system, or the probability of the possible outcome. Therefore, scenario uncertainty includes both lack of information on present condition as well as future scenarios. (Willows et al., 2003; Filipsson, 2011)
Scenario uncertainty is similar in nature to modelling uncertainty. However, it discusses separately because it reflects those part of system that are not considered in the model. There are two subcategories for scenario uncertainty (Vesely et al., 1984: NCR, 2009)
• Uncertainty as to whether all the relevant risk and their consequences have been included in analysis
• Uncertainty as to whether all the significant relationships among the scenarios and variables are identified
2.8 Project Life Cycle
Project Life Cycle (PLC) is a natural framework for applying the risk management process in the project. Trough the life cycle of the project more information becomes available about all aspects and components of the project and its environment, such as stakeholders, scope, time, and cost as well as corresponding assumptions and constraints. Therefore, the risks and uncertainties are greatest at the start of the project and decrease over the life of the project (as illustrated in Figure 2.4), consequently, there is greatest opportunity to risk reduction at the earlier stage of the project.
By changing the sources of uncertainty through the project, it is vital to understand that how risk management process ought to change through the project life cycle and how management attention to the factors, which should be considered, needs to vary over the life of the project (PMI, 2009; Chapman et al., 2003; Cohen et al., 2004). This structured view of Project Life Cycle provides a proper framework for looking ahead for major sources of uncertainty as well as their timing and impacts (Chapman et al., 2003; Cohen et al., 2004).

CHALMERS, Product and Production Development, Master’s thesis 2011 13
Figure 2.4 Impact of risk and uncertainties through the project time (Adopted from PMI, 2009)
Obviously, the breakdown into phases of a project is different based on different factors such as, the size of the project (small project, large-scale project), and the type of the project (engineering and construction project, or new product development project). In spite of such differences, projects in general view, have four major phases; Conceptualization, Planning, Execution, and Termination (Figure 2.5) (Bonnal et al., 2002; Cohen et al., 2004; Cagno et al., 2007; Chapman et al., 2003; PMI, 2009).
Figure 2.5 Typical model of project lifecycle
Generally, during the conceptualization of the project, decision makers should focus on different source of uncertainties, such as technological, cultural, social, and economical to make sure about the feasibility of the project (Cohen et al., 2004). The identified uncertainties should be considered during the planning phase of the project. The project plan and expectation of results will be more realistic if the risks are recognized at the earlier stage of project life cycle (PMI, 2009).
Risk management process should monitor the changes as well as new risks which are emerged at the Execution Phase and manage the appropriate actions to reduce or eliminate them (PMI, 2009). Following Execution phase, the project enters the long phase of Termination. The typical
Concept Planning Execution Termination
Fea
sib
ilit
y s
tud
y
Bas
ic E
ng
inee
rin
g
Det
aile
d E
ng
inee
ring
Del
iver
y (
Pre
-co
mm
issi
onin
g, ,
Co
mm
issi
on
ing
, C
lose
-up
)
Co
nce
ptu
al d
esig
n
Pro
cure
men
t &
Fab
rica
tio
n
Co
nst
ruct
ion
Su
pp
ort
(O
per
atio
n a
nd
mai
nte
nan
ce)
All
oca
tio
n
Ex
ecu
tion
pla
n
Rev
iew
(L
esso
n l
earn
ed)
14 CHALMERS, Product and Production Development, Master’s thesis 2011
risks in this phase are related to the proper maintenance, improvement, and changing needs in light of evolving societal/demographic or operation/economic conditions.
Thus, risk management process must enable project managers to focus on specific sources of uncertainty in each stage of the project to execute the appropriate tools to identify, quantify, and treat them to minimize the risk impacts in a particular phase. The scope of each phase and their sources of uncertainty are argued in the following sections:
Conceptualization
The project starts with an idea or initial concept in order to satisfy a need or opportunity. In the conceptualization phase, it is desirable to refine the concept or idea by identifying a deliverable to be produced and the benefits expected from the deliverable (Cohen et al., 2004; Bonnal et al., 2002; Chapman et al., 2003).
There are enormous source of uncertainties involved through moving from the initial idea to the feasibility and financing the project (Kris, 2006). Decision makers should focus on different source of uncertainties, such as technological, cultural, social, and economical to make sure about the feasibility of the project (Cohen et al., 2004). Therefore, further to establishing the initial concept, the feasibility analysis should be conducted to determine whether the initial concept meets the defined criteria.
The market feasibility analysis is conducted to determine the best location for developing the project (Bonnal et al., 2002). Technical feasibility analysis provides the required information in answering the questions such as whether the technology needed for the project exists, how difficult it will be to implement, and whether the organization has experience using that technology (Watermeyer, 2002). Additionally, the environmental analysis should be considered in this step, to ensure that the project doesn’t go against the ecological, social, laws, and regulation considerations (Bonnal et al., 2002). The information from technical analysis is used as input for the financial feasibility analysis. The financial feasibility analysis is carried out to confirm that the project will generate profits for organization (Bonnal et al., 2002; Cohen et al., 2004). This information supports decision makers to decide whether the project should move into the Planning phase or not (Cohen et al., 2004).
The design deliverables of this stage is typically include a design basis with main process parameters, overall block flow diagrams, flow diagrams, and finally an overall cost estimates (Watermeyer, 2002; Cohen et al., 2004).
Chapman et al. (2003) emphasizes that the main threat in this phase of the project is that before the effective evaluation of the concept and feasibility analysis enter to the Planning phase. Any source of uncertainty which is not managed effectively at the earlier stage will realize at the next stage of the project.
Planning
After receiving the Go decision from Concept Phase, the Planning Phase is carried out to develop the objectives and performance criteria which are defined in conceptual phase in more details.

CHALMERS, Product and Production Development, Master’s thesis 2011 15
Chapman et al. (2003) divides the Planning Phase into three stages, basic design, plan, and allocate (Chapman et al., 2003).
Basic design is conducted to prove the feasibility study and the overall cost estimate from the conceptual phase. Additionally, the basic design stage is the start up package for detailed design stage. Typically, the deliverables of basic design stage in process and petrochemical projects include, Process Flow Diagrams, P&IDs, Equipment lists, Line Lists, Instrument Lists, Site Plans, Plot Plans, Preliminary equipment specifications (datasheets), and other overall layouts which may impact process design e.g. Hazardous area classification drawings, Fire zone layouts, etc.
Planning stage involves establishing the basic parameters for executing the project (referred as baseline). This stage focuses on how the design will be executed, what resources are required, and how long it will take. During planning stage, the specific targets and milestones for producing the project deliverable, in term of cost, time, and required resources are determined (Chapman et al., 2003).
Once the project baseline is determined in planning stage, the allocation stage is carried out to allocate the internal recourses and contracts to achieve the plan. The project organization, appropriate stakeholders are identified and the project tasks allocate between them (Chapman et
al., 2003).
Execution
The execution phase of project life cycle is the actual implementation of the physical project scope of work, from detailed engineering design to the onsite construction of the project. Typically execution phase is split into the following sub-phases (Great Britain-HSE, 2007; Cohen et al., 2004):
• Detailed engineering design; typically the deliverables of detailed engineering design are equipment, piping, instrument, electrical, control and construction specifications.
• Procurement of equipment and materials and fabrication and delivery of equipments
• Construction consists of mobilization, site and civil works, equipment installation, mechanical works, electrical works, instrumentation and control works
It is important to note that what is performed in the Execution Phase has been established during the Concept and Planning Phases (Cohen et al., 2004). Such as, the most important part in the Execution Phase is the coordination and control procedures which are proved at the Planning Phase. The major surprises in the execution phase are realized sources of uncertainty from the earlier stages were not identified, this indicating the failure of risk management process in earlier stages. Any modification arising from the earlier stages could have considerable effects in Execution Phase. For example, a common threat in execution phase is changing in design; this could result both in time delays and increase costs (Chapman et al., 2003).
Termination

16 CHALMERS, Product and Production Development, Master’s thesis 2011
The final stage of the project life cycle is termination phase, which can be divided into three stages: Delivery, Review, and Support stage. The delivery stage includes, Final Testing (i.e. Hook-up/Pre-commissioning), Commissioning, and Handover (system turnover and contract closeout) (Chapman et al., 2003; Cohen et al., 2004; Bonnal et al., 2002). The aim of this stage is to ensure that the outcome of the project will be achieved in practice. An important threat in this stage is that the project deliverable fails to meet the expected performance. Chapman et al. (2003) emphasizes that the surprises are not source of uncertainties directly in this phase, but source of uncertainties in earlier stages are realized in this stage.
During the Review Stage the lesson learned through the project is reviewed and documented. Risk management process should focus on reviewing risks and related lessons in order to contribute to organizational learning and improvement project management process (Chapman et
al., 2003; PMI; 2009). The main source of uncertainty in this stage is missing the important lessons; it means that the same mistake will be made again.
The Support Stage, which is the start of operation and maintenance of the project, is an enduring process which will continue until the project is discarded or decommissioned (Chapman et al.,
2003; Bonnal et al., 2002). The typical sources of uncertainty are in term of maintenance
One of the important risks which arise during the support stage of the project is that: Will the project meet the evolving needs of the target customers? These risks are related to the long-term strategic socio-economic evolution that makes the project continually beneficial to users. Therefore, the timely and effective changes or upgrades should be considered in the project to meet the evolving user needs. The risk management tools to address this type of risks employ long-term socio-economic view that incorporates engineering consideration to reduce or eliminate the risk of rebuilding or upgrading the project (Cohen et al., 2004).
CHALMERS, Product and Production Development, Master’s thesis 2011 17
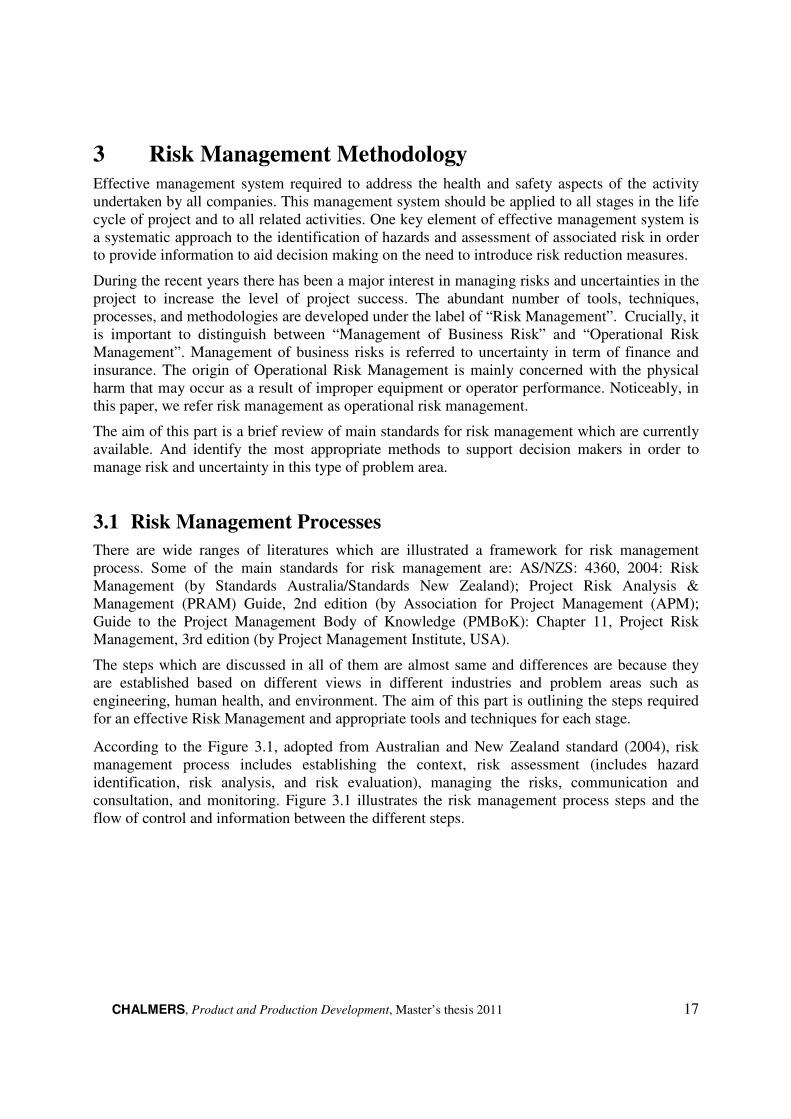
3 Risk Management Methodology
Effective management system required to address the health and safety aspects of the activity undertaken by all companies. This management system should be applied to all stages in the life cycle of project and to all related activities. One key element of effective management system is a systematic approach to the identification of hazards and assessment of associated risk in order to provide information to aid decision making on the need to introduce risk reduction measures.
During the recent years there has been a major interest in managing risks and uncertainties in the project to increase the level of project success. The abundant number of tools, techniques, processes, and methodologies are developed under the label of “Risk Management”. Crucially, it is important to distinguish between “Management of Business Risk” and “Operational Risk Management”. Management of business risks is referred to uncertainty in term of finance and insurance. The origin of Operational Risk Management is mainly concerned with the physical harm that may occur as a result of improper equipment or operator performance. Noticeably, in this paper, we refer risk management as operational risk management.
The aim of this part is a brief review of main standards for risk management which are currently available. And identify the most appropriate methods to support decision makers in order to manage risk and uncertainty in this type of problem area.
3.1 Risk Management Processes
There are wide ranges of literatures which are illustrated a framework for risk management process. Some of the main standards for risk management are: AS/NZS: 4360, 2004: Risk Management (by Standards Australia/Standards New Zealand); Project Risk Analysis & Management (PRAM) Guide, 2nd edition (by Association for Project Management (APM); Guide to the Project Management Body of Knowledge (PMBoK): Chapter 11, Project Risk Management, 3rd edition (by Project Management Institute, USA).
The steps which are discussed in all of them are almost same and differences are because they are established based on different views in different industries and problem areas such as engineering, human health, and environment. The aim of this part is outlining the steps required for an effective Risk Management and appropriate tools and techniques for each stage.
According to the Figure 3.1, adopted from Australian and New Zealand standard (2004), risk management process includes establishing the context, risk assessment (includes hazard identification, risk analysis, and risk evaluation), managing the risks, communication and consultation, and monitoring. Figure 3.1 illustrates the risk management process steps and the flow of control and information between the different steps.

18 CHALMERS, Product and Production Development, Master’s thesis 2011
Figure 3.1 Risk Management Process adopted from AS/NZS 4360: 2004
3.1.1 Establish the Context
In some literatures such as Kaliprasad, (2006) the Project Risk Management Process starts with hazard identification, while some other literatures are mentioned the context establishment at first step as a precondition for a successful risk management implementation (PMI, 2009; AS/NZS:4360, 2004). The context means definition of suitable decision criteria as well as structures for how to carry out the risk assessment process. In establishing the context risk assessment objectives, risk criteria, and risk assessment program are determined and agreed between all stakeholders. The following factors should be considered in establishing the context (PMI, 2009; AS/NZS: 4360, 2004; Aven et al., 2007; IEC, 2008):
• External context in term of cultural, political, legal, regulation, financial, economical, and perceptions and interests of external stakeholders.
• Internal context involves understanding the capability of organization (Resources and knowledge), internal stakeholders, information flow, strategies, values, culture, and policies of the organization.
• Risk management context includes defining responsibilities, risk assessment methodologies, risk criteria, etc.
• Develop the risk criteria to define the criteria against which risk is to be evaluated. Decision concerning whether risk treatment should be implemented in term of technical, financial, environmental, legal, social or other criteria.
Ris
k A
sses
smen
t
Sta
keh
old
er c
on
sult
atio
n/
Co
mm
un
icat
ion
Mon
itor/
Rev
iew
Establish the Context
Analyse Risks
Estimate Risk level
Estimate Risk Level
Probability
Consequence
Evaluate the Risks
Manage the Risks
Hazard Identification

CHALMERS, Product and Production Development, Master’s thesis 2011 19
3.1.2 Risk Assessment
Risk assessment is overall process of hazard identification, risk analysis, and risk evaluation. After the hazards are identified the risks arising from them are analyzed in term of their probability and consequences and unacceptable risks are identified by comparing them with risk acceptance criteria. Decision makers, based on the outcomes of risk assessment process, can make decision about, whether an activity should be undertaken, appropriate selection of risk treatment strategies, whether risks need to be reduced or eliminated (ISO 17776, 2000; IEC, 2008, AS/NZS: 4360, 2004) .
3.1.3 Managing the Risk
Based upon the hazard and risk assessment, the appropriate strategy should be developed to reduce the level of unacceptable risk to the tolerable level (ISO 17776, 2000; AS/NZS: 4360, 2004; IEC, 2008; PMI, 2009). The strategies may be based on the expert’s judgment or criteria adopted by the company to guide decision making on risk reduction (ISO 17776, 2000).
A range of possible strategies exist, such as avoiding the activity that generate the risk, reducing the likelihood, reducing the consequence or both of them, transferring the risk, and retaining the risk. Decision makers should select the most suitable strategy between possible response strategies. They should make ensure that selected response is achievable, affordable, cost effective, and appropriate. (AS/NZS: 4360, 2004; IEC, 2008; PMI, 2009)
3.1.4 Monitoring and Review
To make ensure about the effectiveness of Risk Management Process, it should be reviewed, monitored and updated regularly. The purpose of review and monitoring the previous steps is, reevaluate the previous identified hazards and associated risks, identify new risks and manage them accordingly, and evaluate and monitor the effectiveness of implemented strategies during the life cycle of the project. (AS/NZS: 4360, 2004; IEC, 2008; PMI, 2009)
Managers should report the progress of risk management to the risk owners, so that the risk owner can understand the risk management was effective, or weather additional action is required. Additionally, as the project progresses, additional information become available, change in environment, or achieve some new information can affect the activities of each step. Therefore, it is vital that the Risk Management Process be repeated regularly through the life cycle of the project. (PMI, 2009; AS/NZS: 4360, 2004)
3.1.5 Communication and Consultation
Success in risk management is dependent of effective communication and consultation with stakeholders. In all steps of Risk Management Process should make ensure that all who need to be involved in the process are kept informed about progress of process (AS/NZS: 4360, 2004; IEC, 2008; PMI, 2009;). Involving stakeholders in the risk management process is necessary in term of, develop communication plan; meet the interests of stakeholders and understand their
20 CHALMERS, Product and Production Development, Master’s thesis 2011
consideration; considering the different views in evaluating risks; and support for risk management strategies (IEC, 2008).
WHO (2004) considers the communication as a link between risk assessment and risk management process. Communication is an iterative process which flow the information between risk owners, decision makers, and the stakeholders. Filipsson (2011) indicates factors which affect the effectiveness of communication in risk management process, such as knowledge and expertise, openness and honestly as well as trust and credibility.
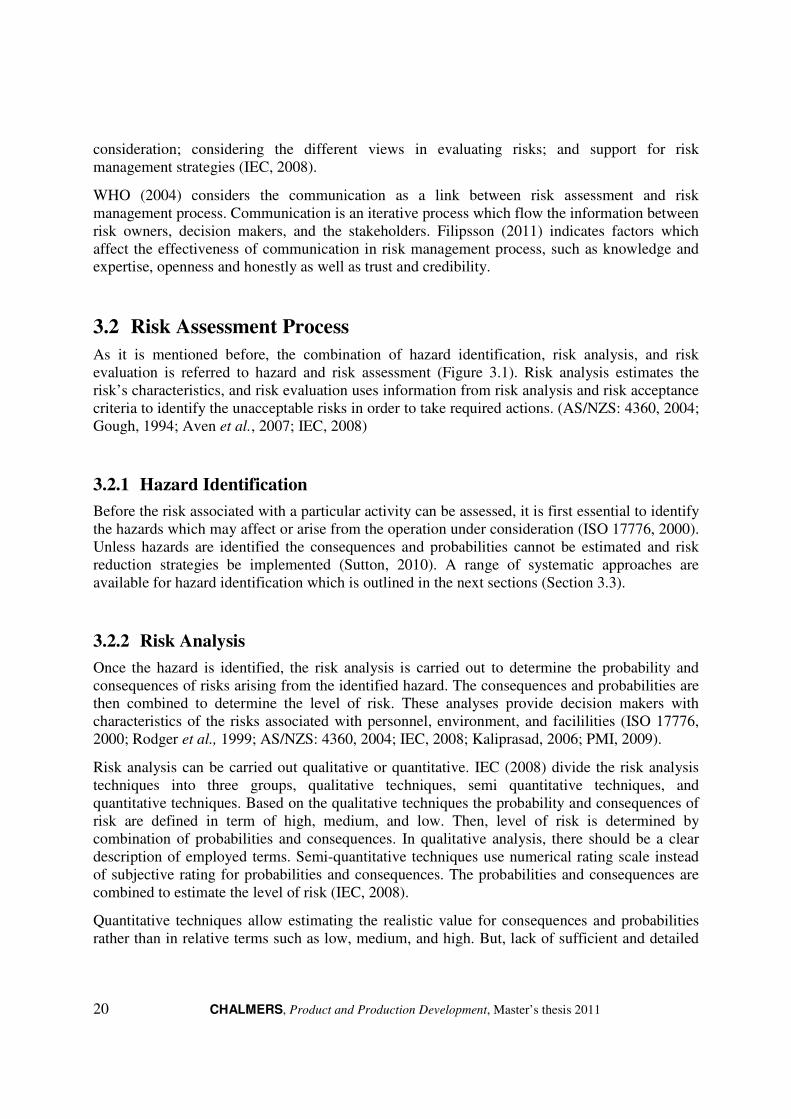
3.2 Risk Assessment Process
As it is mentioned before, the combination of hazard identification, risk analysis, and risk evaluation is referred to hazard and risk assessment (Figure 3.1). Risk analysis estimates the risk’s characteristics, and risk evaluation uses information from risk analysis and risk acceptance criteria to identify the unacceptable risks in order to take required actions. (AS/NZS: 4360, 2004; Gough, 1994; Aven et al., 2007; IEC, 2008)
3.2.1 Hazard Identification
Before the risk associated with a particular activity can be assessed, it is first essential to identify the hazards which may affect or arise from the operation under consideration (ISO 17776, 2000). Unless hazards are identified the consequences and probabilities cannot be estimated and risk reduction strategies be implemented (Sutton, 2010). A range of systematic approaches are available for hazard identification which is outlined in the next sections (Section 3.3).
3.2.2 Risk Analysis
Once the hazard is identified, the risk analysis is carried out to determine the probability and consequences of risks arising from the identified hazard. The consequences and probabilities are then combined to determine the level of risk. These analyses provide decision makers with characteristics of the risks associated with personnel, environment, and facililities (ISO 17776, 2000; Rodger et al., 1999; AS/NZS: 4360, 2004; IEC, 2008; Kaliprasad, 2006; PMI, 2009).
Risk analysis can be carried out qualitative or quantitative. IEC (2008) divide the risk analysis techniques into three groups, qualitative techniques, semi quantitative techniques, and quantitative techniques. Based on the qualitative techniques the probability and consequences of risk are defined in term of high, medium, and low. Then, level of risk is determined by combination of probabilities and consequences. In qualitative analysis, there should be a clear description of employed terms. Semi-quantitative techniques use numerical rating scale instead of subjective rating for probabilities and consequences. The probabilities and consequences are combined to estimate the level of risk (IEC, 2008).
Quantitative techniques allow estimating the realistic value for consequences and probabilities rather than in relative terms such as low, medium, and high. But, lack of sufficient and detailed

CHALMERS, Product and Production Development, Master’s thesis 2011 21
information about activities in project, causes that quantitative techniques be not possible all the time (IEC, 2008, ISO 17776, 2000).
A quantitative risk analysis can be carried out either deterministic or stochastic. In deterministic approach, a single-point value is used to estimate the likelihood and consequences. For example in financial model, usually, three different outcomes are examined as: best case, worst case, and most likely case. In stochastic approach such as Monte Carlo simulation, uncertain inputs are represented by range of possible values which is known as probability distributions. Describing uncertainty in variables are more realistic by using probability distributions (Palisade, 2005).
Consequence analysis
Consequence analysis estimates the impact of particular events or situation on objectives of the project. Consequences are generally divided into four groups; Health, Safety, environmental, and economic consequences. Safety consequences are related to the potential injuries or loss of human life as a result of hazardous scenarios. Some hazards may cause health problems for example; H2S can have the health effect in long period of time. Some hazards don’t cause human injury or loss of life but they have the environmental effects, such as oil spill into river. All hazards have economic consequences as well in term of loss of production, loss of assets or increase maintenance costs.
Probability Estimation
There are different methods to estimate the probability of the consequences of an event or situation which is identified through the risk identification stage. A common way is using the historical data about the typical event or situation which is occurred in the past to estimate the probability of event in the future (IEC, 2008; Rodger et al., 2009).
When historical data is unavailable, predictive techniques such as fault tree analysis and event tree analysis are used to forecast the probability. By analyzing system, activity, equipment, or organization, the required information is identified to estimate the probability of the consequences. In this method the numerical data for equipment, humans, and system is determined based on the operational experience or published data, then these data are combined together to determine the probability of top event. Simulation techniques may be required to generate the probability of equipment and structural failure by calculating the effect of uncertainties (IEC, 2008; Rodger et al., 2009).
Another way to estimate the probability is subjective methods by using the expert opinion in a structured and systematic way. There are a number of formal methods such as, what-if analysis, HAZOP, Delphi approach, and etc. (IEC, 2008; Rodger et al., 2009).
Prioritizing risks
Once the risk level is identified based on the estimated probability and consequences, the risk prioritization can be implemented to focus on the most important risks. Risk Matrix can be used to determine the level of risk by combination of consequence and probability (AS/NZS: 4360,

22 CHALMERS, Product and Production Development, Master’s thesis 2011
2004; Rodger et al., 2009; IEC, 2008). By prioritizing risk support decision makers to decide, whether treat risks without further assessment or proceed with more detailed risk assessment.
Uncertainties
As it is mentioned before, uncertainty is an inherent part of each project; likewise, there are considerable uncertainties during the risk analysis. Identifying the source of uncertainties is necessary to achieve reliable results from the risk analysis stage.
Referred to part 2.1.5, uncertainty about estimates is one of the main sources of uncertainty in the project. The lack of knowledge about the process of event, lack of experience of this particular event; ambiguity about the particular conditions which might affect the activity; complexity in term of the number of variable which are influenced the performance; and the quality and method of estimations are the example of root causes of uncertainty in our measurements.
IEC (2008) suggests sensitivity analysis to determine the effect of individual parameters on the level of risk. Through this analysis the parameters to which the analysis is sensitive and the degree of sensitivity should be stated.
3.2.3 Risk Evaluation
Risk evaluation, based on the results from risk analysis together with risk criteria, provides the basis for risk management decision making. Risk criteria are the target to judge the tolerability of an identified hazard or consequences. The risk criteria are defined during the conceptualization phase but should be improved in risk evaluation stage according to the more information which is achieved by analyzing risks. In risk evaluation, political, economical, social and technical considerations are taken into account in combination with outcome of risk analysis. Decision makers should decide in term of whether a risk needs to be reduced or eliminated; and whether an activity should be undertaken (AS/NZS: 4360, 2004; Kaliprasad, 2006; Aven et al., 2007; IEC, 2008).
Risk criteria are normally defined based on the basis of national and international codes, standards, and environmental regulation. Additionally, the company’s policies to define maximum tolerable risk levels should be considered (ISO 17776, 2000). The difficulty to define the risk criteria is that, it depends on many factors. Instead of the technical aspect of risk acceptable level which is defined based on codes and standards and company’s policy, some other factors are involved in defining the risk acceptance level. For example, the public considers some risk unacceptable; consequently, society is prepared to pay a high cost to avoid such risks (Gough, 1994). Engineering standards, and other professional documents, can provide guidance. But, at the end of the day, the manager has a risk-based decision to make (Sutton, 2010; Gillard, 2009). There are different terms to determine the level of acceptable risk, we discus about ALARP in more detail here:
ALARP (As Low As Reasonably Practical)
CHALMERS, Product and Production Development, Master’s thesis 2011 23
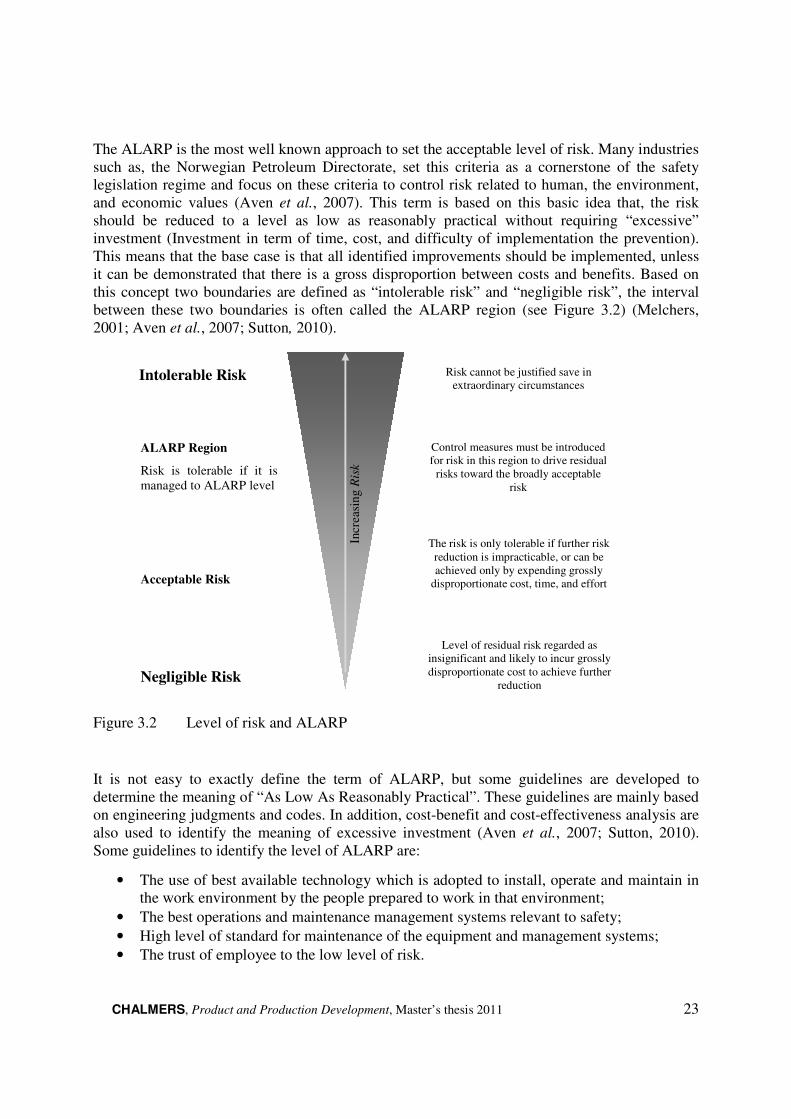
The ALARP is the most well known approach to set the acceptable level of risk. Many industries such as, the Norwegian Petroleum Directorate, set this criteria as a cornerstone of the safety legislation regime and focus on these criteria to control risk related to human, the environment, and economic values (Aven et al., 2007). This term is based on this basic idea that, the risk should be reduced to a level as low as reasonably practical without requiring “excessive” investment (Investment in term of time, cost, and difficulty of implementation the prevention). This means that the base case is that all identified improvements should be implemented, unless it can be demonstrated that there is a gross disproportion between costs and benefits. Based on this concept two boundaries are defined as “intolerable risk” and “negligible risk”, the interval between these two boundaries is often called the ALARP region (see Figure 3.2) (Melchers, 2001; Aven et al., 2007; Sutton, 2010).
Figure 3.2 Level of risk and ALARP
It is not easy to exactly define the term of ALARP, but some guidelines are developed to determine the meaning of “As Low As Reasonably Practical”. These guidelines are mainly based on engineering judgments and codes. In addition, cost-benefit and cost-effectiveness analysis are also used to identify the meaning of excessive investment (Aven et al., 2007; Sutton, 2010). Some guidelines to identify the level of ALARP are:
• The use of best available technology which is adopted to install, operate and maintain in the work environment by the people prepared to work in that environment;
• The best operations and maintenance management systems relevant to safety;
• High level of standard for maintenance of the equipment and management systems;
• The trust of employee to the low level of risk.
Intolerable Risk Risk cannot be justified save in extraordinary circumstances
Control measures must be introduced for risk in this region to drive residual
risks toward the broadly acceptable risk
ALARP Region
Risk is tolerable if it is managed to ALARP level
The risk is only tolerable if further risk reduction is impracticable, or can be achieved only by expending grossly
disproportionate cost, time, and effort Acceptable Risk
Level of residual risk regarded as insignificant and likely to incur grossly disproportionate cost to achieve further
reduction Negligible Risk
Incr
easi
ng R
isk

24 CHALMERS, Product and Production Development, Master’s thesis 2011
The difficulty with this concept is that it is not possible to dispassionately define these terms such as, best available technology, best operation or high standard (Melchers, 2001; Sutton, 2010).
3.2.4 Application of hazard and risk assessment during life cycle phases
Risk assessment can be applied at all phases of project life cycle. The level of details is different in each phase based on the available information and the required detail to assist the decision maker at each phase. For example, during the conceptualization phase, hazard and risk assessment is applied to evaluate the different alternative concepts to help evaluate the weakness and strength of each of them. In planning and design phase, hazard and risk assessment contributes to ensuring that risks are tolerable, assist cost effectiveness studies and hazard identification, etc. Additionally, as the activity proceeds risk assessment can be used as a resource of information in developing procedures for normal and emergency conditions (IEC, 2008; Mannan, 2005; Nolan, 2008; Sutton, 2010).
3.2.5 Selection of methods for hazard identification and risk assessment
There are wide ranges of tools and techniques to apply the hazard identification and risk assessment in the project. Different factors should be considered to select the appropriate tools and techniques such as, the level of complexity of the project; the type and level of risk; the potential magnitude of the consequence; the available information and resources; regulation or contractual requirement; and the stage of project life cycle (ISO 17776, 2000; IEC, 2008).
The appropriate hazard identification and risk assessment tools vary depending on the level of complexity of the project. For example, in large production plants with complex facilities, detailed studies are required to address all hazardous scenarios such as, fires, explosions, structural damages, or leakages. While, in simpler projects with limited process facilities, it may be possible to rely on application of codes and standards. Codes and standards includes lesson learned from previous experiences which are gathered on the basis of company and national or international operations. Therefore, hazard identification and risk assessment is part of codes and standards, since the hazards have already been identified and the standard methods for their control and mitigation are defined. Additionally, when the activity under consideration is similar to the previous activities, the knowledge and experience of staff might be used for hazard identification and risk assessment but this approach is not sufficient for novel systems (ISO 17776, 2000).
Furthermore, the nature and degree of uncertainty should be taken into account through the selection of hazard identification and risk assessment method. In order to identify the nature and level of uncertainty, it is essential to understand the quality, quantity and integrity of available information in term of risk, its causes and sources, and its consequences into the project objectives. As it is mentioned before one of the sources of uncertainty is poor quality data, or the lack of essential and reliable data. The quality of collected data depends on the methods and who use that methods (IEC, 2008).

CHALMERS, Product and Production Development, Master’s thesis 2011 25
Therefore, the reliable risk assessment outcome depends on the methods which are used to assess the risks. For example check list is a technique for hazard identification, which are normally drawn up from codes and standards and operational experiences. They provide a listing of typical hazards which need to be addressed and assesses in the project. Therefore, where the process is complex and face with high level of uncertainties, check lists are not proper techniques to identify the all sources of uncertainties (IEC, 2008).
3.2.6 Classification of Hazard Identification and Risk Assessment Techniques
Hazard identification and risk assessment methods can be classified in different ways to identify their strengths and weaknesses in each group. Here two approaches to classifying risk assessment methods are introduced. The first classification shows how different methods apply to each step of hazard and risk assessment process. Based on this perspective hazard and risk assessment methods are divided to five groups as follow (Table 3.1):
• Hazard identification,
• Consequence analysis,
• Qualitative, semi-quantitative, and quantitative probability analysis
• Estimation the level of risk
• Risk Evaluation
Table 3.1 Selection of tools for risk Assessment Process (Adopted from IEC, 2008)
Techniques
Hazard and Risk assessment Process
Hazard
Identification
Risk Analysis Risk
Evaluation Consequence Probability Level
Checklists SA NA NA NA NA
SWIFT SA SA SA SA SA
Fault Tree Analysis NA A A A A
Event Tree Analysis NA SA SA A NA
Cause & Consequence Analysis
A SA NA A A
FMEA SA NA NA NA NA
FMECA SA SA SA SA SA
HAZOP SA SA NA NA SA
Monte Carlo NA SA SA SA SA
Consequence/Likelihood Matrix
SA SA SA SA A
SA: Strongly Applicable; A: Applicable; NA: Not Applicable

26 CHALMERS, Product and Production Development, Master’s thesis 2011
The second approach of classification is applied the risk assessments methods through the life cycle of the project (Gould et al., 2000; Mannan, 2005; Nolan, 2008). The appropriate method for each stage of project life cycle will differ in respect to the increasing the available information (Gould et al., 2000; Mannan, 2005; Nolan, 2008). Additionally, the level of detail that decision makers need is changed trough the project life cycle. Gould et al. (2000), Mannan (2005), and Nolan (2008) summarize the suggested hazard analysis methods through the Project Life Cycle (See Table 3.2).
Table 3.2 Appropriate hazard identification methods through the project life cycle
Stage Available Information Hazard Identification Methods
Feasibility study Basic Outline; preliminary operation instructions
Check list; What If
Conceptual design Preliminary P&IDs; flow sheet Check list; What If
Basic Engineering Final Flow Sheets & P&IDs; Data sheets for equipment, instruments; Preliminary layout
Check list; What If; HAZOP
Execution plan Preliminary time schedule; preliminary cost estimate
_
Allocation Stakeholders _
Detailed Engineering Equipment, Piping, Electrical Instrument, Control, Construction specification
What If; HAZOP; FMEA
Procurement & Fabrication
Vendor and fabrication documents, inspection reports
Check list; What If; HAZOP; FMEA
Construction Field change documents _
Delivery (Pre-comm. , Commissioning, Close-up)
Start-up and test-run documents Check list; What if; HAZOP; FMEA
Review Lesson learned _
Support (Operation and maintenance) Operation reports
Check list; What If; HAZOP; FMEA
Co
nce
pt
Pla
nn
ing
E
xec
uti
on
T
erm
ina
tio
n
Phase

CHALMERS, Product and Production Development, Master’s thesis 2011 27
3.3 Hazard Identification and Risk Assessment Techniques
3.3.1 Check lists
Checklists are simple form of hazard identification methods. They provide a listing of typical hazards which need to be considered in the process based on the previously developed lists, codes, or standards. Using of checklists is suitable for situation where the level of uncertainty is low and the process is not too complex. Checklists can use at any stage of project life cycle. They also can be used as part of other hazard and risk assessment techniques to check that everything has been covered (Sutton, 2010; IEC, 2008).
3.3.2 HAZID (Hazard Identification)
HAZID is a common and frequent used technique for identification of major hazards associated with the particular activity under consideration. HAZID is usually carried out in the early stages of project to identify the major hazards without having to go into a lot of detail (Sutton, 2010).
HAZID is conducted by a multi-disciplinary team that uses the pre-defined guidewords to identify the major hazards. In order to identify the hazards properly the process under consideration is divided into nodes. Typically, in HAZID study, the nodes are much bigger than in HAZOP.
The process of hazard identification starts with identifying all undesirable consequences associated with the defined node. Typically, in order to identify the undesirable consequences, they are divided into broad categorizations such as human impacts, environmental impacts, and economic impacts. Then, each of these categories is subdivided based on the type of resulting damage, e.g. overpressure, toxic exposure, thermal exposure, etc. Checklists from previous similar HAZID can be used to assist the consequences and hazard identification.
Once the undesirable consequences are identified, the hazards which cause those consequences can be identified. Typically the following methods are used for hazard identification:
• Analyzing process material properties
• Analyzing process conditions
• Reviewing company and industry experiences
Additionally, the technical and organizational safeguards already being in place are listed for each identified hazard and improvement or prevention acts are suggested.
3.3.3 Preliminary Hazard Analysis (PHA)
PHA is an analytical method use to identify hazards which will give rise to hazardous scenarios. Typical hazardous event sources are oil and gas under pressure, fluids at high temperature, toxic, explosive, inflammable, and radioactive materials, etc. (ISO 1776, 2000)
PHA is often carried out early in a project at the conceptual and basic design when there is a little information about the detailed design and operational procedures. This method allows the

28 CHALMERS, Product and Production Development, Master’s thesis 2011
identification of hazards early in the project life cycle to assists in selection of most appropriate arrangement of facilities and equipments (ISO 17776, 2000; IEC, 2008).
The process of PHA involves the following steps (ISO 17776, 2000):
• Definition of operational modes and subsystems
• Identification of hazards associated with each subsystem
• Definition of hazardous scenarios arises from the identified hazard
• Estimation of the probabilities and potential consequences of the hazardous scenarios and the level of risk
• Identify the safeguards and appropriate actions which should be taken to reduce the probability, impact of consequences or both
• Identify the interaction of hazardous scenarios
3.3.4 What-IF Method
The What-If Analysis method is carried out by a team of very experienced analysts, engineers, and operation experts to identify the incident scenarios based on their experienced and knowledge. This method is the least structured of the risk identification techniques, therefore the success of this method is highly dependent on the knowledge and attitude of the individual team members. Because it has relatively little structure allows the team members to be creative. It is vital that team members be prepared very thoroughly before the meeting. The issues and facilities that can be addressed during the what-if meeting are listed in Nolan (2008) and Sutton, (2010). The What-If Analysis can be organized by the approach which is used in FMEA method (by analysis the major equipments and items) (Manan, 2005; IEC, 2008; Nolan, 2008; Sutton, 2010).
The What-If methods are based on the experiences. Therefore this analysis cannot be relied upon for identifying unrecognized risks. The right questions should be asked by the team to identify the hazard efficiently. Additionally, this analysis is not systematic, because is based on the brainstorming sessions. Using checklist will be helpful to overcome this limitation in What-If method. What-If is usually applied at the first stage of the project life cycle (at the conceptual design or early design stage) when limited information is available or may change. While, the lack of information at the earlier stage of the project is type of limitation, but it allows identifying concerns early in the project and avoiding costly changes later. What-If method is a direct question method, so it is fast to implement than other techniques. Additionally, it can analyze a combination of failures (Nolan, 2008).
3.3.5 Fault Tree Analysis (FTA)
Fault Tree Analysis is a graphical, deductive method for identifying the combination of factors such as equipment failure and human errors that can result in the occurrence of the hazardous scenarios (top event) (IEC, 2008; Sutton, 2010). Additionally, the probability of the top event can be estimated by failure rate calculation of each individual component. FTA is an efficient method to analysis the complex systems. This method is often used in combination with other

CHALMERS, Product and Production Development, Master’s thesis 2011 29
hazard analysis method such as HAZOP, when a hazardous scenario is identified and required further investigation.
The Fault Tree is built up of gates and events. Or Gate gives a positive outcome if one or more of the inputs are positive. In contrast for And Gate, all the inputs to an And Gate need to be positive for the output to be positive. The Voting Gate has at least three inputs; two or more of which need to be positive for the outcome to be positive (IEC, 2008; Sutton, 2010).
There are three events in Fault Tree Analysis, Top Event, Intermediate vents, and Basic events. As it is mentioned before, Fault Tree Analysis is used to identify how a hazardous scenario is caused; this undesirable event is referred to the Top Event. To definition of top event the following questions should be included: how much? How long? What is the safety impact? What is the environmental impact? What is the production impact? What is the regulatory impact? The intermediate event is defined to further development of the analysis of top event. Intermediate events are developed through the OR and AND Gates to finally become the base event. The Base Event cannot be developed further. Once the tree has been constructed, it can be quantified (Sutton, 2010).
Once the fault tree has been developed, failure rate can be entered for each individual component and then the probability of undesirable event can be estimated. The main uncertainty in this method is related to the estimated failure rate which is referred to measurement uncertainty. After the fault tree model and its related estimation have been made, mitigation actions in term of additional safeguards can be carried out (IEC, 2008; Sutton, 2010).
3.3.6 Event Tree Analysis (ETA)
Event Tree Analysis is a graphical way of showing the consequences of a hazardous scenario and checking up the safety of the process. Event Tree Analysis considers the impact of the failure of a particular component or item in the system. The example of initiating event in ETA is usually, failure or unsafe condition of individual item or equipment, human error, or external events. In order to quantify the Event Tree model, the likelihood of success and failure of each safeguard is mentioned on the branch (EIC, 2008; Sutton, 2010).
Fault Tree and Event Tree can be combined which is called Bow-Tie analysis. As shown in Figure 3.3, the fault Tree (Which is left to right) generates the top event. The Top Event of Fault Tree is the Initiate Event of Event Tree Analysis. For example, a series of equipment failure, human errors, or instrument failure lead to the Top Event of “Tank over Pressure”. The safeguards to control and mitigate the Top Event are followed in the Event Tree Analysis (IEC, 2008; Sutton, 2010).

30 CHALMERS, Product and Production Development, Master’s thesis 2011
Figure 3.3 The Bow-Tie Analysis (Fault Tree and Event Tree)
3.3.7 Failure Mode and Effect Analysis (FMEA)
FMEA is a systematic technique to identify the ways in which components or systems can fail to perform to their design intent. The basic idea of FMEA is identifying causes or the ways in which a system can fail (Failure Mode) and then identifying the consequence of such failures. The consequences are identified in term of safety, reliability and environmental effect (Goble, 2005; Manan, 2005; IEC, 2008; Sutton, 2010).
FMECA (Failure Modes, Effects. and Criticality Analysis) is the extended model of FMEA, so that each fault mode identified is ranked based on the combination of its probability and consequences. This analysis is usually, qualitative or semi-quantitative, but can be quantitative if we use the actual failure rates. FMEA/ FMECA can be applied during the design, manufacturing, or executing phase of project life cycle, but as soon as the problem of system is identified, changes are easier to implement (IEC, 2008).
FMEA is a down-top method, which in compare to the top-down methods such as Fault Tree Analysis, can provide more details in risky situation. Therefore, top-down methods are more appropriate to highlight the risky situation, while down-top methods are useful to investigate more details (Goble, 2005; Manan, 2005; IEC, 2008; Sutton, 2010).
FMEA is typically carried out by team, who are specialist in the required field. The FMEA includes following steps:
• List all component;
• Determine the failure modes for each component;
• Determine the effects of each failure mode;
• Determine the criticality of that failure;
• Identify the indications that the failure has occurred;
• Estimate the rates (either over time or per mission) for that failure mode; and
• Identify the failure compensation mechanisms.
FMEA is an efficient method to identify critical failure within a system. The main benefit of FMEA is that, the system can change in the design stage to mitigate or reduce the likelihood of
Top Event/ Initiating
Event
Event Tree Fault Tree

CHALMERS, Product and Production Development, Master’s thesis 2011 31
critical failures. Therefore the best time to implement the FMEA is at the early stage of project life cycle (Goble, 2005).
The FMEA format includes following information:
1. The name of the device under review, which can be a component, a module, or a unit. 2. The code number of the device under review 3. Description of the function of the component 4. Description of failure mode 5. Description of causes of the failure mode. For example, heat, chemical corrosion, dust,
electrical overload, RFI, human operational error, etc. 6. Description to how this component failure mode affects the component function of the
module/ sub-system 7. Description of how this component failure mode affects the next system sub level. 8. Determine the failure rate of the particular component failure mode. When quantitative
failure rates are desired and specific data for the application is not available, failure rates and failure mode percentages are available from handbooks (see Ref. 4, 5, 6, and 7).
9. Suggestion for improvements in design, methods to increase strength of the component (against the perceived stress) or perhaps needed user documentation considerations.
3.3.8 HAZOP (Hazard and Operability Analysis)
HAZOP (Hazard and Operability Analysis) is the most widely used method to identify risks or hazardous situations. The strength of HAZOP is because of its clear organization. The HAZOP meeting is started with node selection. A node represents a section of the process in which the condition has significant change in term of pressure, temperature, chemical composition. In practice, a single node may include more than one process change (Nolan, 2008; Sutton, 2010).
The basic idea of HAZOP is identifying the deviation from design or safe process conditions. So, the process parameter which will be discussed should be identified. The general process parameters are: Flow Rate; Flow Quantity (for batch operations); Pressure; Temperature; Level (when vessels and tanks are a part of the node); Composition; and Phase. The safe limit values for each parameter should be established wherever possible (Manan, 2005; Nolan, 2008; Sutton, 2010).
Once the nodes and safe operating limits are identified, the hazard is determined. Usually the guidewords for deviation from the safe operating limits are: High, Low, No, Reverse, Misdirected, and Wrong. The HAZOP Matrix is used to organize the process and deviation guidewords. The deviation outside the safe limits should be announced to the operator. These alarms announce the operator that an unsafe condition has occurred. If the HAZARD team identify that there is no obvious way to alarm the operator about the unsafe condition, they should recommend the installation of additional instrumentation to providing alarms (Manan, 2005; Nolan, 2008; Sutton, 2010).
At the next step the consequence of hazard should be determined in term of safety, environmental, and economic. Also, the frequency for each hazard should be valued. And the team should evaluate the level of risk for each identified hazard scenario. Risk Matrix is a proper way to rank risks. Finally, the recommendation should be generated in associate with those

32 CHALMERS, Product and Production Development, Master’s thesis 2011
hazards that have a risk level above the acceptable risk (Manan, 2005; Nolan, 2008; Sutton, 2010).
The HAZOP may be slower to implement compare to the other methods. But, the main advantage of HAZOP method is because of its systematic and logical approach. HAZOP team should follow a standard format with special guidewords and deviations that need to be addressed. The team leader is assigned to guide the meeting during the process. Additionally, HAZOP can analyze a combination of failure by addressing continuing sequential failures. The specific HAZOP is not necessary when the process is simple, the team can review the items by What-If questions (Nolan, 2008).
HAZOP can be carried out at any stage of project from conceptual to modification. However, undertaking the recommendation from HAZOP study to control the assessed hazards may not be economically feasible at the execution phase. Hence, the best time for applying the HAZOP, is when the recommendations are easily followed by simply alerting the design, processes, and operational procedures. Consequently, the best stage in project for the HAZOP study is just after the basic design, before making any decision regarding fabrication or installation; the application of suggested modifications will be cost effective in this stage. Moreover, the necessary information for applying an efficient HAZOP study, such as P&IDs, PFDs, material data sheets, and operational procedures should be available at this stage.
3.3.9 Monte Carlo Simulation
Monte Carlo simulation is a quantitative risk analysis method which uses the mathematical techniques to identify the all possible outcomes of an undesirable event and the probabilities they will occur.
In general, Monte Carlo simulation takes the distributions that have been specified for each input and use them to produce the probability distribution of outcomes. The Monte Carlo simulation starts with generating the probability distribution for each input that has inherent uncertainty. For each input, Monte Carlo selects values from the relevant distribution as random; each set of sampled values is called an iteration. Monte Carlo simulation runs hundreds or thousands of time as the user specifies and the result is the probability distribution of the possible outcomes. Variables can have different probabilities of different outcomes by using the distributions, which is more realistic than deterministic approach that uses one-point value for variables. Common probability distributions are Normal distribution, Lognormal, Uniform, Triangular, PERT, and Discrete (Palisade, 2005; Rodger et al., 1999).
In Monte Carlo simulation, it is possible to consider the relationship between input variables (Correlation of inputs). It is important to know how, in reality, when the value of one input change, others changed accordingly. Additionally, Monte Carlo simulation is an efficient tool to analyse the effect of each input on final results (Palisade, 2005).
The spreadsheets are usually used as a platform for performing Monte Carlo simulation. @RISK is a software, which provides additional functions to Excel for specifying probability distributions and analyzing output results (Palisade, 2005). @RISK is used to analysis risks by Monte Carlo simulation to identify the many possible outcomes and also how likely they may

CHALMERS, Product and Production Development, Master’s thesis 2011 33
occur. This information helps to select the most significant risks and making best decisions under uncertainty.
3.3.10 Risk Ranking Matrix
The Risk Ranking Matrix is used to combine the qualitative or semi quantitative rating of consequence and likelihood to evaluate the risk level. This matrix usually use as a screening tool when many risks have been identified to decide which risk need more detailed analysis, or which risk need to be managed first (IEC, 2008).
The consequence scale should cover the range of different type of consequences to be considered (financial loss, safety, environment, or other dependent parameters). The likelihood scale may also have any number of points; it needs to span the range relevant to the study in hand (IEC, 2008).
Figure 3.4 shows a matrix is drawn with consequence in one axis with 6 points scale, and likelihood on the other with 5 points scale. To rank risks, first the consequence descriptor that best fit the situation is identified and then the likelihood with which those consequences will occur is defined. Many risk events have more than one consequence. Therefore, there is a choice as to whether to address the most common outcomes or most serious or some other combination (IEC, 2008).
Lik
elih
oo
d r
atin
g
E IV III II I I I
D IV III III II I I
C V IV III II II I
B V IV III III II I
A V V IV III II II
1 2 3 4 5 6
Consequence rating
Figure 3.4 Risk matrix

34 CHALMERS, Product and Production Development, Master’s thesis 2011
4 The Uncertainty Decision Making Model
The main purpose of this chapter is to present an uncertainty decision making model to provide an appropriate decision making approach to support decision makers under uncertain situations. This model provides decision makers with guidance and structure to increase their confidence in being able to obtain desirable outcomes.
4.1 The Decision Making Model
Figure 4.1 shows the decision making model under uncertain situations. Generally, there could be two different situations where one has to make a decision, either in a normal planning or in an emergency situation.
Figure 4.1 The Uncertainty Decision Making Model

CHALMERS, Product and Production Development, Master’s thesis 2011 35
4.1.1 The normal planning decision making
In a normal planning, decision makers set a goal to achieve the desirable outcome, for example an investment to establish a plant, or to develop a product to launch into the market. After setting the goals, all related variables which affect the defined goals should be taken into account e.g. technical, environmental, political and economical variables. It must be noted that decision maker face with variables along the project life cycle from the beginning up to the end. However, the type of variables might be changed, or new variables add to the decision making process through the project life cycle. These variables in general could cause potentials for failures (hazard situations) such as loss of capital investment, reputation, productivity, assets, human life, environmental pollution, etc. The hazard situation could in turn results in a feeling of threat and an urgency to act against an uncontrollable and uncertain situation by finding some alternatives and try to make proper decisions. Once decision makers feel threat they have to make decision and choose the best options to prevent the hazard situation. Decision makers by using their mental models analyze the received information and variables in order to identify, analyze and evaluate the alternatives. Based on the mental model the information/variables are processed in two ways, either the mental models will filter the information based on the perceptual filters or the information will change the mental models (Isenberg, 1984 in Shahriari et al. 2008). Perceptual filters are ways decision makers look at things based on expectation, assumption, and experiences. The lack of knowledge about the alternatives causes the decision makers to face an uncertain situation. To move from an uncertain situation, there is a need to improve the level of knowledge about the alternatives by quantification of uncertainties. In order to quantify the uncertainties, each alternative should be evaluated by estimating the relevant risk probabilities and consequences, calculating risk and comparing weakness and strengths of different alternatives, this process is referred as risk assessment. The result of risk assessment is feed back to the decision maker as a decision support to choose the best option among the all alternatives.
Oilfield exploration example
To make the description of the model clearer, consider a case of capital investment in an oilfield exploration. Statistics show that only 10 percent of hydrocarbon recovery ventures are successful worldwide whereas drilling well costs approximately $15 million (Lerche, 1997). The different type of variables such as political, economic, environmental and technological variables make the capital investment decision making in an oilfield exploration projects as a complicated issue. The variables such as geological variables, oil price, demand of energy, natural disasters, political issues, and operational and technical variables would cause to potential for failure of the investment. Therefore, the investment organization feels threat to act against an uncertain situation which is caused by these variables and select the best investment strategy. The uncertain situation is caused because of lack of knowledge about the above mentioned variables. Here each variable is described in more detail as follow:
Geological variables
Does reservoir contain economical amount of hydrocarbon? How easily the oil and gas will flow from the well? What about the drilling and completion cost? Is it really worthy to deplete the reservoir? Making a wrong decision to spend money on either a dry hole or non-economical

36 CHALMERS, Product and Production Development, Master’s thesis 2011
hydrocarbon producing well will lose the investment partially or completely as a result of zero or low capital rate of return.
Oil price volatilities and unpredictability
Historically, crude price experienced a lot of fluctuations (Figure 4.2) because of many uncertain factors like wars, strikes, natural disasters, OPEC policies and etc. Lower oil price restrains the intention for hydrocarbon investment. For example crude price dropped to very low level in winter 1998-1999 that squeezed profits of large oil companies and discouraged them for new investment. However, recent elevated prices to more than 94$ per barrels is a great motivation for investors to enter upstream venture. But the question is that is there any quick fall of prices ahead or not?
Figure 4.2 Crude Oil Price fluctuation (based on the BP’s report)
Future energy demand
All industrialized countries modern way of life is largely dependent on petroleum resources. Both oil and natural gas assist human to produce electricity, synthetic clothes, fertilizer and many other products. Therefore, although demand for oil and gas is increasing steeply at the moment, the dilemma is the future prospective of these products. Consequently, uncertain future demand will definitely affect the investment status in this industry.

CHALMERS, Product and Production Development, Master’s thesis 2011 37
Political issues
Noticeably, main oilfields are located in unstable political areas like Middle East, Africa, and Latin America. So, this industry and also oil price are very sensitive to geo-political events in hydrocarbon producing areas. Foreign oil companies and host governments sign long term agreements for crude exploration and production in high oil reserves countries. However, government is changed and future government policy is to utilize oilfields by their own national resources.
Natural disasters
Natural calamities like flood, earthquake, storm, volcano and hurricane can cause billion dollar losses of capital investment in upstream business and create bottlenecks on the supply chain. Hurricane in Gulf of Mexico in 2005 caused raises the crude price and damages to oil platforms significantly. Additionally, In November 2007, 1300 tons of oil split in the sea from an oil tanker near Ukraine as a result of storm. Since countries are divided based on their exposure and vulnerability to natural catastrophes natural disaster risk evaluation of oil projects can be implemented easily.
Operational and technical variables
Drilling operation, oilfield development and production usually contain major technical difficulties which are assessed at feasibility study phase of projects and cause companies to ignore the prospect.
Therefore, analysis and searching for alternatives and evaluate them based on the risk assessment process is vital to identify the weakness and strengths of each alternative and select the most proper investment strategy.
4.1.2 Decision making under an emergency situation
Decision making under an emergency situation has its special characteristics which makes it different from the normal planning situation. During the emergency situation, decision makers face with an unwanted event, and they need to process large amount of data and information which are sometimes unavailable or unreliable, under time pressure. The decisions that are made in the first minutes, and hours are critical to damage control, prevention of human life and assets loss, environmental pollution, and financial costs (Kowalski-Trakofler, et al, 2001). One who is faced with an emergency situation may know what to do as it has been planned before or has no idea which action to take. Therefore, if the emergency situation is as planned, decision maker should follow the instructions e.g. evacuation instructions in the event of fire in a building. In case, there is no instruction and plan for emergency situation or the situation has turned to an unexpected state instead of being match with what has been planned, the decision will be made based on the individual experience and perceptions.
There are several variables which affect decision making under the emergency situation. For example, when a firefighter dealt with emergency decision making, there are large numbers of

38 CHALMERS, Product and Production Development, Master’s thesis 2011
variable which are influenced his decision e.g. weather condition, the fire cause, the building layout, etc. As the decision in an emergency situation is taken under the severe time pressure, there is a lack of knowledge about the situation and decision makers cope with an uncertain situation also they have to select the best option between the limited numbers of alternatives. The normal decision analysis would be quiet time consuming: identifying the related variables, identifying the full range of alternatives, estimating the probability of risk and its consequences and obtaining total score for each alternative, and finally comparing them to identify the best option; is not practically possible under the time pressure decision making. Therefore, decision makers don’t have time to analyze all options and weight them up; they have to come up to a very quick decision based on his/her perception.
The case of Piper Alpha Disaster
The Piper Alpha disaster was the worst offshore oil disaster in term of lives lost and industry impact; the explosion and resulting fire in July 1988 on board Piper Alpha killed 167 people and cost $3 billion (Cornell, 1993).
The first explosion took place when a cloud of gas condensed, leaking from a pump that was missing a safety valve, ignited. Three further huge explosions followed and severed a petroleum line causing a pool fire. About twenty minutes after the initial explosion the fire impinged on a gas riser from another platform which fuelled an extremely intense fire under the deck of Piper Alpha. In the early stage of the accident, the control room and radio room were destroyed. Also, most of the safety systems such as electric power generation, general alarm, emergency shutdown, and fire detection and protection systems failed after the first explosion. Piper Alpha was eventually lost in the sequence of structural failures (Cornell, 1993).
The unwanted event of explosion and fire in the offshore platform of Piper Alpha, was faced the personnel with an emergency situation. There were some evacuation instructions in the event of fire on the platform but the situation hadn’t gone same as it was planned because of several reasons. The offshore installation manager died during the accident and the evacuation was not ordered to the personnel, even it had been ordered, could not have been fully carried out because the fire fighting equipment could not operate, many evacuation routes were blocked and life boats were inaccessible, furthermore the helicopter couldn’t land as was planned due to lot of smoke on the platform. Therefore, personnel had to decide to save their life individually (Cornell, 1993).
The fire as a hazard situation caused that personnel of Piper Alpha felt the threat and tried to find some alternatives to rescue. The personnel realized that the only alternative to survive would be to escape from the station immediately. As all the routs to life boats were blocked by smoke and flames, and in the lack of any other alternative, they decided to jump into the sea hoping to be rescued by boat. Of those who tried to jump, some found themselves trapped at the 68 ft level and the 175 ft level and took the risk of jumping from such heights. Some of them decided to escape and jump off against previous information of not jumping in the sea from more than 60 ft. From personnel who jumped some drowned because they were not equipped to survive in the water and some died because their ribcages were fractured and damaged their lungs, heart and liver (Cornell, 1993). .

CHALMERS, Product and Production Development, Master’s thesis 2011 39
The whole accident took place in 22 minutes; and the personnel had to make decision to rescue under the pressure time and uncertainty about the future conditions and available options. They made decision to jump into the sea under the uncertainty of not knowing the risk of jumping from height of more than 60ft and uncertainty about the available rescue boats.
4.2 Success Factors of the Uncertainty Decision Making Model
• The success of this model is associated with addressing all key variables related to the defined goals or unwanted event. The process of variable identification should be performed by expert’s backgrounds and knowledge along with developing a systematic method. Some methods such as, checklists, fishbone diagrams, brainstorming sessions can be applied to identify all key variables properly. On the other side, the management intention and openness to the expert’s judgments and analysis is vital to consider all related variables during the decision making process.
• The novel aspect of this model is that, all key components of risk management process are addressed clearly. Typically, in most decision making models, there isn't a clear distinguish between risk and hazard. But this model define the hazard and risk clearly and shows the relation between hazard, feeling of threat, and risk assessment process through the decision making situation.
• Additionally, the presented model is general and could be applied to all types of decision making processes under uncertainty situation.

40 CHALMERS, Product and Production Development, Master’s thesis 2011
5 Application and Results
The safety of the process plant should fulfil the certain required level because of the legal requirements, and organizational reputation as well as economical reasons. Clearly, an unsafe plant cannot be profitable due to losses of production and capital investment. Therefore, there is essential to design a process plant which is safe, environmental friendly and profitable (Heikkilä, 1999).
Decisions made during the design phase can greatly influence the operational and cost effectiveness of a plant and subsequently its safety and environmental performance. The safety of process plant should be considered from the earlier phases of design when the major decisions to design the plant are made. The largest payoffs are achieved by verifying that safety has considered early in the design phase due to remove the hazard situations instead of control them. Good design can often bring safety at less cost.
The aim of this chapter is to apply the presented decision making model (Chapter 4) to risk and uncertainties associated with an oil field development project and evaluating the effectiveness of the model. The case study is related to the basic design phase of an oilfield development plant (See Section 2.8 for description about basic design stage in project life cycle). The decision to be made is what design and organizational concepts should be considered during the basic design phase of an oil field development plant in order to reduce the level of safety risks.
5.1 Case study description
The case study is related to the basic design phase of an oil field development plant. Extracted fluids from wells are normally a mixture of oil, gas and water. An oilfield development plant is a unit which is constructed to apply preliminary process treatment to producing fluids from wells in order to separate major compounds and prepare them for export to the refineries.
The production hydrocarbon mixture from each well is passed through the choke valve, which reduces the flow rate and piped to a manifold via flow lines. The next facilities are separators where separate three phases of oil, gas and water by gravity forces and density differential of compounds. Separated oil is pumped to refineries for producing other petroleum products afterwards.
The produced water is normally piped to separator facilities to separate residual oil, gas and solids prior to injection to the well for advanced oil recovery or safety releasing to the environment.
The produced gas shall be dehydrated by knock out drums and dehydration package to reduce the water content to less than 5ppm to meet gas quality for refineries. However, gas could be transported or injected to reservoir for gas lift or used as a fuel for prime movers and power generators.
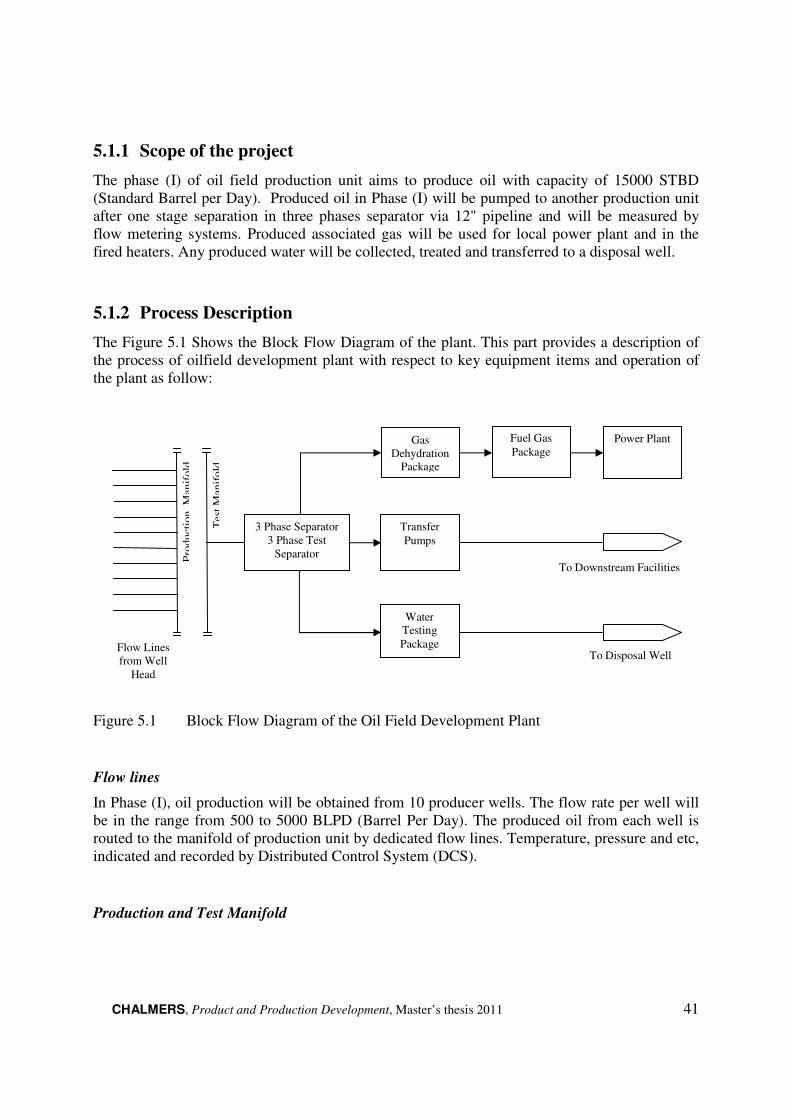
CHALMERS, Product and Production Development, Master’s thesis 2011 41
5.1.1 Scope of the project
The phase (I) of oil field production unit aims to produce oil with capacity of 15000 STBD (Standard Barrel per Day). Produced oil in Phase (I) will be pumped to another production unit after one stage separation in three phases separator via 12" pipeline and will be measured by flow metering systems. Produced associated gas will be used for local power plant and in the fired heaters. Any produced water will be collected, treated and transferred to a disposal well.
5.1.2 Process Description
The Figure 5.1 Shows the Block Flow Diagram of the plant. This part provides a description of the process of oilfield development plant with respect to key equipment items and operation of the plant as follow:
Figure 5.1 Block Flow Diagram of the Oil Field Development Plant
Flow lines
In Phase (I), oil production will be obtained from 10 producer wells. The flow rate per well will be in the range from 500 to 5000 BLPD (Barrel Per Day). The produced oil from each well is routed to the manifold of production unit by dedicated flow lines. Temperature, pressure and etc, indicated and recorded by Distributed Control System (DCS).
Production and Test Manifold
Gas Dehydration
Package
Fuel Gas
Package Power Plant
3 Phase Separator 3 Phase Test
Separator
Transfer
Pumps
Water Testing Package
To Downstream Facilities
To Disposal Well Flow Lines from Well
Head
Tes
t M
anif
old
Pro
du
ctio
n M
anif
old

42 CHALMERS, Product and Production Development, Master’s thesis 2011
The production manifold collects the crude from flow lines and transfers to the one stage and 3phase separator (Separation unit) to separate 3phase oil, water and gas in an effective manner. The test manifold collects the crude from flow lines and transfers to the test separator.
Crude Oil Separation
Crude oil from production manifold header enters to the 1st stage separator. The separator was designed as a 3-phase (vapour/oil/water) separator. The crude from the first stage separator is pumped to the downstream facilities, the associated gas evolved in the separator shall be routed to the gas dehydration unit, and the produced water will enter to the Water Treatment Package for purification and oil removal.
The 1st stage separator is equipped with level transmitters and relevant alarms for very low (LALL) and very high liquid levels (LAHH) that initiate equipment or plant emergency shutdown respectively through the ESD system. In order to protect the vessel against high pressure cases, PSHH is installed on the vessel; moreover, the separator is equipped with safety relief valves (PSV) to exit the excess gases to HP (High Pressure) Flare at unusual conditions.
When the plant stops and in emergency shutdown situations, it is necessary to depressurize 1st stage of separation. In this case the gas contents of the vessel are directed to the high pressure flare header. There is a blow down valve (BDV) on depressurizing line that activates by the emergency shutdown signal command issued through the ESD system.
Crude Oil Testing
A 3-phase test separator is also provided for well testing purposes. Any production well can be routed to the test separator. Only one well will be routed to the test separator at any time. Oil from the test separator is returned to the production separator .Gas from the test separator will be routed to the associated fuel gas header if the pressure is sufficient; otherwise the gas will be flared. Separated water will be routed to the water treatment system.
Oil Transfer Pumps
The crude from the first stage separator is pumped to the downstream facilities, by three centrifugal pumps (one is stand-by) with discharge pressure 300 psig for total flow rate of 15000 STBD in phase I.
A flow control valve is considered to control the mentioned flow rate in different conditions according to separator level and a pressure transmitter on suction of each pump to alarm at low pressure cases.
Gas Dehydration Package
The water remaining in the associated gas is removed to achieve maximum of 7 ppm water content in the gas phase. Inlet gases to gas dehydration section routed to an absorber column

CHALMERS, Product and Production Development, Master’s thesis 2011 43
with Triethylene Glycol (TEG) absorbent. The wetted gases after contacting with rich TEG will be dried and then routed to the Fuel Gas Package. Outlet TEG of absorber column is lean TEG and pumped to regeneration column.
Fuel Gas System
The dried gas from dehydration package is divided into HP & LP fuel gas system. LP fuel gas at 3-4 barg is used for purge gas, blanket gas, fired heaters, etc. HP fuel gas is supplied gas turbine drivers of mains power generators.
Water Treatment Package
The produced water from separators which contains oil will enter to the Water Treatment Package for purification and oil removal. The treated water flows from the package to the Water Injection Pumps to raise the pressure sufficiently to allow the produced water to flow in to the well.
5.2 Application of the decision making model in case study
5.2.1 Setting the Goal
The main goal is to design an oil field development plant in a safe and environmental friendly manner that can be safely operated and minimize the costs of failure as well as maintenance. Therefore safety consideration shall be coupled with any decision made over the period of plant design.
5.2.2 Variables
As it is described before, the success in applying the uncertainty decision making model is associated with addressing all key variables related to the defined goals or unwanted event. Different sorts of variables such as technical, political and organizational parameters are influential over the goal of a safe and environmentally friendly design for the plant. Variables, as the main sources of risks, have potential to cause failures in the plant. Consequently, it is an essence for the engineers and managers as decision makers to identify these parameters at first in order to take appropriate measures to mitigate their negative consequences on safety.
Methodology to identify variables
The cause and effect diagram (Fishbone diagram) is developed (Figure 5.3) to identify all key variables which may cause hazardous scenario of fire, explosion, and toxic material release. Three major categories are identified as the major causes of hazard situation in the oilfield development plant which are technical causes, organizational causes, and political issues.

44 CHALMERS, Product and Production Development, Master’s thesis 2011
The historical data related to the accidents in process industry is used to identify the main causes of each defined category. There are several literatures and historical reviews and analysis about technical and organizational causes of accidents in process industry, whereas it is rare to find historical reviews and literatures about effects of political matters on safety of process industries. Therefore, for the first couple of groups, organizational and technical causes, the historical analysis of accidents in process industry is used as a source to identify the key variables which are effective on the safety of the project; and the effects of political issues on the safety of the project are identified based on the experts’ judgment and experience.
There are several historical analyses to categorize the causes of accidents in process industry. Kidam, et al, (2009) analyzed the historical data of 364 accident cases related to process industry based on the Failure Knowledge Database (Japan & Science Technology Agency). The causes of accidents are categorized into two main groups; technical and human/organizational (Figure 5.2). Figure 5.2 shows that 73% of accidents in process industry are caused by technical failures, 23% by organizational matters and 4% by unknown reasons.
Figure 5.2 The general causes of accidents in process industry based on the historical data (adopted from Kidam, et al, 2009)
Organiza
tional
causes,
23%
Technical
causes;
73%
Unknow
n; 4%

CHALMERS, Product and Production Development, Master’s thesis 2011 45
Fire,
explosion,
Toxic release
Political issues
Organizational causes
Technical Causes
Sanctions
Unstable national
political situation
Selection of vendors
Supply of material
Foreign licensors companies’ partnership
Piping system failure Contamination
Material Selection
Mass Transfer Corrosion
Substandard Equipment Heat Transfer
Flow related Fabrication
Control system Layout
Managerial failure Operator’s Failure
Knowledge based causes
Wrong policies
Poor hazard identification
Wrong instructions and procedures
Lack of safety culture
Human error
Short cuts
Not following instructions
Miss judgment/ underestimates
Ignorance of lesson learned from previous experiences
Lack of communication (No transfer of knowledge within the project
Figure 5.3 The cause and effect diagram of key variables which may cause hazard events of fire, explosion, and toxic material release.

46 CHALMERS, Product and Production Development, Master’s thesis 2011
Organizational causes
Based on the accident analysis in process industry, 23% are classified as organizational causes. The organizational failures are happened by poor human performance in managerial level or operator’s level (Kidam, et al, (2009).
Managerial failure
The importance of an effective management system has been emphasized in different safety reports. e.g. Piper alpha disaster, Flixborough disaster. The managerial faults could be due to wrong policies, poor hazard identification, and wrong instructions and procedures (Kidam, et al, (2009). Additionally, the senior management attitude toward safety assures the safety and loss prevention in organizations. The safety culture of an organization affects the way the staff behave, and the actions they take to prevent accident. It is the duty of senior managers to create and maintain safety culture in organization by training the staff (Mannan, 2005).
Operator’s failure
The majority of operator’s faults are due to human errors, short cuts, not following instructions, miss judgment, and underestimation of chemical safety. There are several examples of operators’ failure in accidents in process industry; according to Kletz (2001), one of the undesirable events which caused the Bhopal disaster happened simply because of ignorance of operator in reading unusual over temperature which could be eliminated by sufficient training and appropriate safety culture establishment in the organization.
Furthermore, at the design stage, the experienced and skilful designers who are familiar with codes and standards are highly needed to design the plant based on the required safety considerations. Poor design of inexperienced designers could cause inevitable damages to the plant, environment and human life during the operation. As an example designing equipment in terms of temperature and pressure rating, thickness of the body, required Net Positive Suction Head are very critical parameters which should be taken into account at basic design phase of the project.
Knowledge based causes
Knowledge-Based is known as a reason for quite a few accidents and this is related to avoid updating with new technology advancements as well as knowledge sharing. Lack of knowledge sharing could be arisen due to reasons such as ignoring lesson learned transfer from one project to another one. Alternatively, it is a common scenario that experienced engineers quit their jobs without any back up or replacement.
Technical Causes
Figure 5.4 shows the main reasons for technical causes based on reviewing the accidents in process industry. Each root causes is described in more detail in the following paragraphs:

CHALMERS, Product and Production Development, Master’s thesis 2011 47
Figure 5.4 Root causes of technical failures based on the historical data on accidents in process industry (adopted from Kidam, et al, 2009)
Piping system failure
According to the Figure 5.4, piping system failure is the most frequent cause of accidents in process industries (Kidam, et al, 2009). The Flixborough disaster on 1 June 1974 which killed 28 people and seriously injured 36 is one of the major disasters in process industry due to piping system failure (Mannan, 2005).
The failure of piping system may lead to release of contaminants such as toxic or flammable materials which causes irreversible damages to the environment like fire and explosion as well as human tissues. Loss of assets and production stop are additional outcomes of this undesirable event. Piping system failure might be happened due to several reasons, e.g. corrosion, poor bounding between pipe joints, sever cycling condition and over pressure, inappropriate method of fabrication, or wrong material selection. In the following case study rupture of flow line is one of the investigated hazard scenarios which is identified by HAZOP study and cause loss of hydrocarbon to the atmosphere; the flow line rupture and its main causes are discussed in more detail in the following case study.
Contaminations
Contamination of process streams by impurities and undesirable by-products is known as the second main reason of technical failures (Kidam, et al, 2009). The major reason of contamination is due to improper design of the projects. Common scenarios of contaminate formation are observed in drinking water transport pipes with wrong material that could lead to rust creation in the drinking water. Similarly, instrument air transportation shall be conducted through stainless steel materials or galvanized carbon steel and shall be dry to prevent any rust in the fluid and disturb functioning of relevant instrumentation and process integrity. Furthermore,
3%
4%
5%
6%
7%
7%
10%
10%
11%
14%
22%
Control system
layout
fabrication
flow related
heat transfer
substandard equipment
Corrosion
Mass transfer
Material selection
Contamination
Piping system

48 CHALMERS, Product and Production Development, Master’s thesis 2011
lack of cleaning, pigging and draining could intensify the possibility of this sort of hazard as well. Many negative outcomes of contaminants are operational problems, pipe blockage, corrosion rate increasing and scaling formation, disturbing process integration, etc.
Material Selection
Wrong material selection that cannot satisfy the process condition is the third main reasons of technical failures (Kidam, et al, 2009). Wrong material selection can cause major negative events like corrosion, erosion, crack, fatigue, creep, shock and mechanical stress, etc. Thus, both mechanical and chemical properties of material shall be taken into account at design phase to minimize both risks of corrosion and mechanical failure.
Mass Transfer and Corrosion
The mass transfers as well as corrosion/erosion are important to cause accidents (Kidam, et al, 2009). Accidents due to poor or no mixture, excessive flow, and flow fluctuations are common parameters related to the mass transfer item and lead to uncontrolled reactions. Additionally, corrosion/erosion could be caused by parameters like operational scenarios such as flow restriction, process condition alternation, and raw material variation. The main reasons for corrosion attack could be the process parameters deviation from the design condition like temperature, pressure, PH value, chemical composition, fluid velocity, etc.
Heat Transfer
Heat transfer is also identified as a usual cause of chemical plant accidents. Ineffective cooling or heating methods and scaling formation in the piping system and process equipment are problems related to heat transfer accidents.
Other less important and low fraction reasons of technical accidents like substandard equipment, fabrication, flow related, layout, and control system shall be taken into account since they can create big problems if they do not manage properly (Kidam, et al, 2009).
Political Issues
Noticeably, main oilfields are located in unstable political areas like Middle East, Africa, and Latin America. So, this industry is very sensitive to geo-political events in hydrocarbon producing areas. Uunstable political situation affects the safety of process plants in these countries by imposing limitations on supply of required materials and facilities, selection of vendors, and avoiding foreign licensor’s to be companies’ joint ventures.
Unstable political situations in oil producer countries which carry high amount of risk cause supply of materials to a complicated venture. Vendors which show their interests to start their business with these countries are increasing their quotation to cover the potential risks. Moreover, difficulties in opening a letter of credit in situation of sanction is an affective burdensome in this regard.

CHALMERS, Product and Production Development, Master’s thesis 2011 49
Sanction against countries like Libya limits the vendors’ intentions to cooperate with companies so that finding a technically approved vendor to supply required high technological materials like Nickel alloys is very difficult. In other words, availability of some material types has been reduced and this in turn pushes companies to replace their requests with lower quality and more available materials. This substitution puts the safety of the plant in a great jeopardy.
Additionally, companies in oil producer countries are largely dependent on foreign licensors companies’ partnership especially in Europe for basic design phases of oil and gas projects. Nowadays, sanction against some countries like Libya makes reputable international companies to stop or strictly limit their activities in these countries.
5.2.3 Hazard (Potential for Failure) and Feeling Threat
The identified variables in previous section (Section 5.2.2) have a potential to cause undesirable events of fire, explosion, and toxic material release. The oilfield development plants typically, handle large quantity of toxic, flammable and explosive substances and component often at high temperatures and pressures. These processes inherently have a potential to cause undesirable events of fire, explosion, and toxic material release and as a result loss of life and assets, injuries and environmental pollution. This hazard situation in turn results in feeling of threat to act against an uncontrollable and uncertain situation. Consequently, identification of hazards is essential at the early stage of design for assessing the safety level.
5.2.4 Identification and Analysing Possible Alternatives
The presented model suggests identifying and analysis possible alternatives and evaluating them by risk assessment methodologies to choose the best option among the all options to prevent the hazards.
The investigated case study in this paper is related to the basic design phase of an oil field development plant, so the major decisions about the location of the plant, the main applied technology, the main joint ventures of the project, and the investigators are made at the concept phase. Therefore, searching and analyzing possible alternatives to prevent the hazard situation is not applicable for this project which is implemented at basic design phase. The alternative approach is more suitable for conceptual phase of project that major decisions haven’t fixed yet.
consequently, in order to mitigate the hazard situation in the project and meet the defined goal which is design a safe and environmental friendly plant, first we need to identify all hazardous scenarios and then assess them to estimate their probability and consequences and related risk level to support decision makers about required actions to decrease the risk level to the acceptable level.

50 CHALMERS, Product and Production Development, Master’s thesis 2011
5.2.5 Hazard Identification
Selection of Hazard Identification Methodology
According to Section 3.2.5, not all hazard identification methods are suitable for all phases of project life cycle. The appropriate method for each stage of project will differ in respect to the available information as well as the level of detail that decision makers need. Referred to the Table 3.2 (appropriate hazard identification methods through the project life cycle), and in respect to the available information and documents at the basic design stage of the investigated case study, HAZOP study should be carried out at final stage of basic design phase to identify hazardous scenarios.
5.2.6 HAZOP
The purpose of HAZOP study is to review every part of process and operation to discover the deviations from the normal operation and provide the recommendations for design improvements and operating procedures. The HAZOP team review the process based on the P&IDs or equivalent, and systematically questions every part to discover the deviation which can give rise to hazards. The result of HAZOP study for Process Area of the oilfield development plant is illustrated in Attachment 1. The HAZOP procedure is described in the following paragraphs:
Step 1: Node selection and purpose
The HAZOP meeting is started with node selection. A node represents a section of the process in which the condition has significant change in term of pressure, temperature, chemical composition. In practice, a single node may include more than one process change. Due to relatively large volume of associated hazards, only the process area as the main unit of this project will be analyzed to identify related hazards. The Process Area of the investigated oilfield development plant is divided into four nodes:
Node 1, Receipt of gas and oil to 1st stage Three Phase Separator
Node 2, Gas from 1st stage separator to fuel gas KO (Knock Out) drum and dehydration package
Node 3, Transfer of oil from 1st stage Three Phase Separator to Oil export line including Pig Launchers
Node 4, Transfer of water from 1st stage Three Phase Separator to Produced water flash vessel and recovered oil to closed drain header
The HAZOP study has been carried out by HAZOP team for each described node.
Step 2: Process guideword/safe limits
The basic idea of HAZOP is identifying the deviation from design or safe process conditions. So, the process parameter which will be discussed should be identified. The general process parameters are: Flow; Pressure; Temperature; Level; Composition; and Phase. And the guidewords for deviation from the safe operating limits are: High, Low, No, Reverse, and
CHALMERS, Product and Production Development, Master’s thesis 2011 51
Misdirected. The guidewords are combined with process parameters to identify the deviation from safe process condition.
Step 3: Identification of hazards and their causes
Once the nodes are described and the guidewords and process parameters are defined, the hazard is determined. A hazard is a deviation from the safe operating limit which is identified based on the defined guidewords. The first column of HAZOP worksheet (Attachment 1) shows the deviations.
The HAZOP team had identified the root causes of identified hazard associated with the node (Column 2 of HAZOP worksheet, Attachment 1)
Step 4: Consequences
At the next step the HAZOP team had determined the consequence of hazard in term of safety, environmental, and economic. These consequences are determined with and without safeguards in place. Column 3 illustrates the consequences associated with identified hazards.
Step 5: Identification of safeguards
The relevant available safeguards to detect the identified deviations (hazards) and prevent the identified consequences are considered and documented in HAZOP worksheet (Column 4)
Step 8: Recommendations
The recommendations to decrease the level of risk are discussed by HAZOP team and recorded in the HAZOP worksheet (Column 5).
5.3 The Hazard Scenarios
The following hazard scenarios had been identified based on the HAZOP study results in Process Area of the plant:
Scenario 1: Fire/Explosion due to leakage of gas and crude oil as a result of damage to 1st stage separator
Scenario 2: Loss of hydrocarbon due to rupture of flow line
Scenario 3: Rupture of production tube due to High pressure on upstream of well
Scenario 4: Reduce the plant load due to less supply of gas to dehydration package
Scenario 5: Damage to export pumps due to low NPSH (Net Positive Suction Head) and as a result possible cavitations

52 CHALMERS, Product and Production Development, Master’s thesis 2011
Between the identified scenarios, the first three scenarios are chosen for further analysis and risk assessment. These scenarios are chosen between other identified scenarios due to their high likelihood or their major consequences. The first two scenarios are chosen, since their consequences are so sever once the incident happen. The consequence of the scenario 3 is pretty low, but the probability of this scenario is high.
5.3.1 Probability Estimation methodology
Once the hazard scenarios are identified based on the HAZOP study; the fault tree analysis is developed for each hazard scenario in order to estimate the probability of undesirable scenarios. The process of fault tree analysis is described in Section 3.3.5.
Reliable data for failure rates
Estimation of the probability of the top event requires the input of probabilities for the failure of process components, human errors as well as frequencies for the external events. The reliable data for failure rates should be based on the specific characteristics of the plant under investigation such as the quality of the component employed, their working environment and the quality of their handling and maintenance (Hauptmanns, 2004). The working environment is affected by both process variables and ambient and plant conditions. The process variables include operational temperature, pressure, corrosion, erosion, cleanliness of the fluid, and material phase (gas, liquid, solid). The environmental variables which affect the component failure are environment temperature, humidity, dust, and rainfall. There is limited information to assess the effect of these factors on the failure rates (Mannan, 2005). Therefore, the failure rates used for base events in the fault tree model are based on the basic failure rates without considering the quality of the component, process conditions, environmental variables and maintenance practices; consequently, the uncertainty of failure rate data is quiet large.
There are several data banks for failure rate data, e.g. NCSR database, ERDS database (European Reliability Data System), FACTS database (Failure and Accident Technical Information System), ORDEA database (Offshore Reliability Data), EIReDA database (European Industry Reliability Data Bank), and GIDEP database (Government Industry Data Exchange Program). The failure rate data for basic events of fault tree analysis is derived from summery information which are developed by Mannan (2005) based on one of these databases.
5.3.2 Description and probability estimation of scenario 1
Scenario 1: Fire/Explosion due to leakage of gas and crude oil as a result of damage to 1st
stage separator
Fire which is the most serious hazardous scenario in process plants requires fuel and oxygen along with source of ignition (fire triangle). Based on the HAZOP study, the undesirable event of high pressure in 1st stage separator causes possible damage and leakage of gas and crude oil form 1st stage separator which provide one of the three required elements of fire triangle. If two other
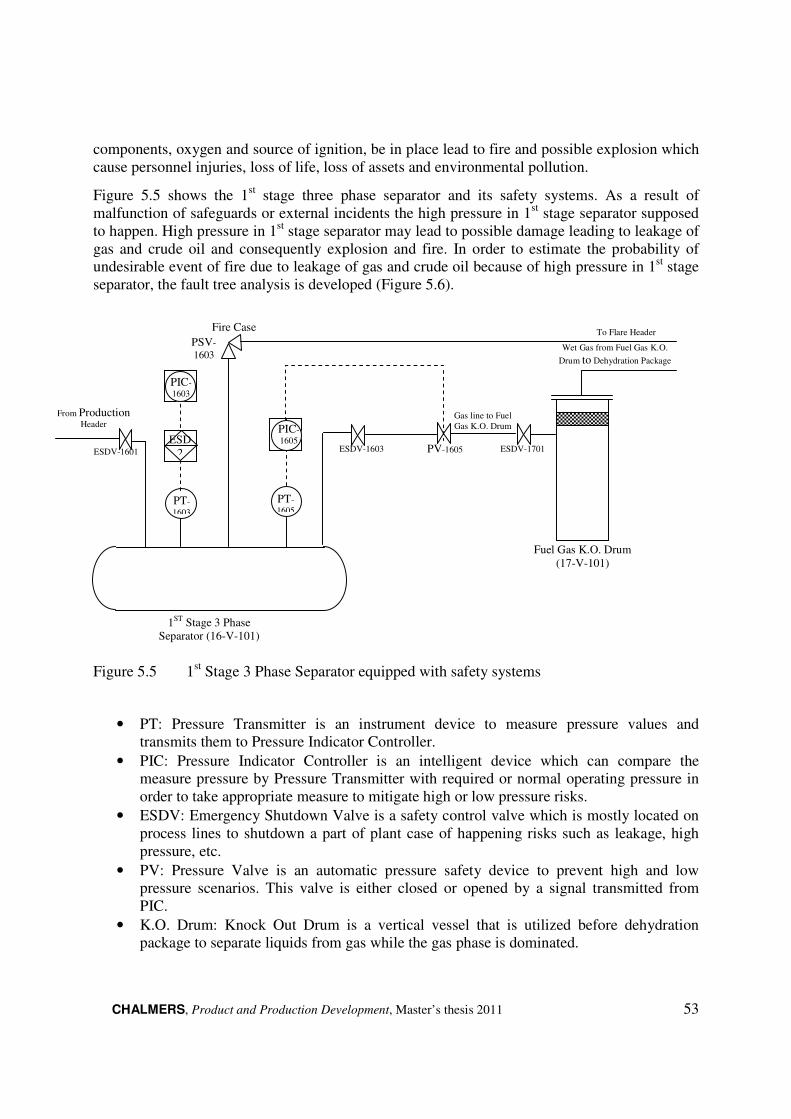
CHALMERS, Product and Production Development, Master’s thesis 2011 53
components, oxygen and source of ignition, be in place lead to fire and possible explosion which cause personnel injuries, loss of life, loss of assets and environmental pollution.
Figure 5.5 shows the 1st stage three phase separator and its safety systems. As a result of malfunction of safeguards or external incidents the high pressure in 1st stage separator supposed to happen. High pressure in 1st stage separator may lead to possible damage leading to leakage of gas and crude oil and consequently explosion and fire. In order to estimate the probability of undesirable event of fire due to leakage of gas and crude oil because of high pressure in 1st stage separator, the fault tree analysis is developed (Figure 5.6).
Figure 5.5 1st Stage 3 Phase Separator equipped with safety systems
• PT: Pressure Transmitter is an instrument device to measure pressure values and transmits them to Pressure Indicator Controller.
• PIC: Pressure Indicator Controller is an intelligent device which can compare the measure pressure by Pressure Transmitter with required or normal operating pressure in order to take appropriate measure to mitigate high or low pressure risks.
• ESDV: Emergency Shutdown Valve is a safety control valve which is mostly located on process lines to shutdown a part of plant case of happening risks such as leakage, high pressure, etc.
• PV: Pressure Valve is an automatic pressure safety device to prevent high and low pressure scenarios. This valve is either closed or opened by a signal transmitted from PIC.
• K.O. Drum: Knock Out Drum is a vertical vessel that is utilized before dehydration package to separate liquids from gas while the gas phase is dominated.
PT-
1605
PV-1605 ESDV-1603
1ST Stage 3 Phase Separator (16-V-101)
Gas line to Fuel Gas K.O. Drum
ESDV-1701
Fuel Gas K.O. Drum (17-V-101)
Wet Gas from Fuel Gas K.O.
Drum to Dehydration Package
PIC-
1605
PT-
1603
ESD2
PIC-
1603
From Production
Header
ESDV-1601
To Flare Header
PSV-
1603
Fire Case

54 CHALMERS, Product and Production Development, Master’s thesis 2011
• PSV: PSV stands for a Pressure safety valve installed at the top of equipment like vessels, tanks and pumps to relief over pressure gas or liquid in the system to a flare sub header line and prevent damages could be happened due to a high pressure scenario in the system.
The high pressure in 1st stage separator has different causes which have been developed through intermediate event of G-003. Noticeably, the system has some safeguards to prevent high pressure in 1st stage separator regarding intermediate event of G-008. These two undesirable events of high pressure (G-003) and safeguards failures (G-008) are coupled together (as illustrated by AND gate G-002), to cause the possible damage to separator and leakage and fire as a result.
The high pressure in 1st stage separator may cause by no/less flow form separator or external fire on separator (G-003). If Pressure Indicator Controller (PIC-1605) fails to detect high pressure and incorrect signal is transmitted to the Pressure Valve (PV-1605) (base event of E-004) OR the Pressure Valve (PV-1605) fails to open in case of high pressure (base event of E-003) as a result, PV-1605 is closed and lead to close on gas line from separator (Intermediate event of G-006). Additionally, undesirable event of no flow from 1st stage separator may cause by malfunction of Emergency Shutdown Valve (ESDV-1603) as well (base event of E-002).
In addition to the internal failure of instruments, the external undesirable event of fire on 1st stage separator (base event of E-005) leads to increase the pressure and possible damage to separator which cause leakage of gas and possible fire.
Two safeguards have been considered in case of high pressure in 1st stage separator. First, the Pressure Transmitter (PT-1603) with high high alarm and interlock ESD-2 to shutdown ESD-1601(base event of E-006). And Pressure Safety Valve (PSV-1603) provided on separator and checked for blocked condition in case of fire (Base event of E-007). If both of these safeguards do not work properly in case of high pressure may cause possible damage to 1st stage separator (Intermediate event of G-007).
The hazard situation of high pressure in first stage separator leads to possible leakage of gas and crude oil and fire and explosion as a result which make sever consequences of personnel injuries and environmental damage.

CHALMERS, Product and Production Development, Master’s thesis 2011 55
Close on gas line from
separator
Close inlet to fuel gas K.O. Drum due to malfunction of
ESDV-1701
External Fire on
separator
Close on
PV-1605
Malfunction of
ESDV-1603
PV-1605 fails
open
PIC fails to detect high
pressure (PIC-1605)
G-002
G-006
G-005
E-002
E-005
E-006
E-003 E-004
High Pressure in 1st Stage
separator (16-V-101) Safeguards
failure
High High Alarm
Failure (PT-1603)
PSV-1603 fails in fire condition
AND
G-003 G-007
E-007 E-008
Fire/Explosion
Gas and crude oil leakage as a result of damage to 1st stage
separator
Air Present Ignition source
present
AND
G-001
G-008
OR
Lightning Spark Hot
surface
E-001
OR
No/less flow form separator
G-004
OR
OR
OR
OR
E-009 E-010 E-011
Figure 5.6 Fault Tree Analyses for Scenario 1

56 CHALMERS, Product and Production Development, Master’s thesis 2011
The data on the failure rates of instruments on process plants derive from the failure rate databases available at Mannan, (2005): Table 5.1 Failure rate of Base events for Scenario1
Base Event Item Failures/year References
E-001 Air present Will be always present
E-002 Malfunction of ESDV-1603 0.25 a
E-003 PV-1605 fails open 0.02 b
E-004 PIC-1605 fails to detect high pressure
0.29 c
E-005 malfunction of ESDV-1701 0.25 a
E-006 External fire 0.02
E-007 Failure of PT-1603 0.49 c
E-008 Failure of PSV-1603 0.02 b
E-009 Lightning _ d
E-010 Spar _ d
E-011 Hot surface _ d
a. failure rate for Emergency Shutdown valve is based on the failure rate of control valve given by Mannan (2005) (page 14/19)
b. Based on the failure rate data for Pressure Relief Valves given by Mannan (2005) (Page 14/19)
c. failure rate for Pressure Transmitter and Pressure Indicator Controller are based on the failure rate given by Mannan (2005) (page 13/19, Table 13.6)
d. Assessing the probability of ignition sources (Lightning, Spar, hot surface) is not possible based on the available data. Therefore the overall probability of the availability of ignition sources are considered 0.05 per/year based on the Sutton (2010)
The Probability of intermediate events are calculated based on the developed fault tree model and input data of failure rates of base events. Table 5.2 The probability of intermediate events of scenario 1
Intermediate
Event
Item Formula Failures/year
G-002 Gas and crude oil leakage as a result of damage to 1st stage
G-003 AND G-007 0.42
G-003 High Pressure in 1st Stage separator (16-V-101)
G-004 OR E-006 0.83
G-004 No/less flow form separator G-005 OR E-005 0.81
G-005 Close on gas line from separator
E-002 OR G-006 0.56
G-006 Close on PV-1605 E-003 OR E-004 0.31

CHALMERS, Product and Production Development, Master’s thesis 2011 57
G-007 Safeguards failure E-007 OR E-008 0.51
G-008 Ignition source present * 0.05
The probability of top event (G-001: Fire/explosion due to gas and crude oil leakage from 1st stage separator) is based on the And gate of E-001 AND G-002 AND G-008:
Top event probability = 1 * 0.42*0.05 = 0.021 failure/year
5.3.3 Description and probability estimation of Scenario 2
Scenario 2: Loss of hydrocarbon due to rupture of flow line
Piping system failure is mentioned as one of the most frequent technical causes of accidents in process industry (See Section 5.2.2). Loss of containment form pipe and associated fitting is one of the major hazards in process plants which lead to major fire and explosion, environmental damage and personnel injuries.
There are several codes and standards which are covered the safety factors in pipework and fittings such as, ASME B31 codes for pressure piping. Mannan (2005) gave some suggestion for reducing pipwork failures e.g. high quality designers, appropriate use of computer aids, improved inspection during construction and operation phase, and design for ease of maintenance. These factors are accessible by an effective and competent management from first stage of design to the operation phase.
The flow line from well head and its safety systems are shown in Figure 5.7.
Figure 5.7 Flow line from well head and its safety systems
• SSSV: Sub Surface Safety Valve is a safety device installed in the upper wellbore to provide emergency closure and isolate wellbore in the event of any system failure or damage to the control facilities.
• SSV: Safety Shutoff Valve is a safety valve used to close a line and stop the flow of material in the event of any failure in the system.
PT-0101 C
PT-
0101 B
PT-
0101
PI-0101 C
PI-0101 B
PI-0101 A
ESD2
Well outlet line Flow Line from Well Head
PT-0907
ESD2
PI-0907
ESDV-0902
To Manifold
58 CHALMERS, Product and Production Development, Master’s thesis 2011
The fault tree model is developed to estimate the probability of loss of hydrocarbon due to rupture of flow line (Figure 5.8). The leakage from flow line is caused by one of the following reasons:
Leak from flow line due to corrosion
Corrosion of pipes, fittings, flanges and other components is a common risk which is largely dependent on the fluid nature and other process parameters like temperature, pressure, velocity, etc. Generally speaking CO2 and H2S corrosions known as sweet and sour corrosions respectively are more dangerous in the investigated case study oil field development as well as other projects.
Leak from flow line due to poor bounding between pipe joints
There are three main pipe connection methods defined in a piping system which are socket weld, threaded and butt weld. Threaded connection provides the poorest and lower cost bonding between two pipe spools. However, this is not a good choice for aggressive process fluids that are flammable, toxic and corrosive like H2S, Hydrocarbon, etc. Threaded pipe joints are also subjected to leakage in high pressures and temperatures more than 102 bar and 250 C respectively. When it comes to welding, both but weld and socket welds are safely worked in critical process condition with one exception that socket welds are subjected to crevice corrosion in corrosive fluids due to the welding mechanism, so that this weld type shall be avoided for corrosive media. Ignoring standards requirement for butt weld connection will definitely lead to leakage of welded pipes (Mannan, 2005).
Leak from flow line due to Sever Cyclic Condition and over Pressure
Pipes are exposed to different loads during their design life like thermal load, fluid pressure, etc. If the over load conditions are frequently occurred (More than 7000 time) during the design life of a piping system this condition is so called ‘’ Sever Cyclic Condition” (ASME B31.3 Process Piping Code of Design). To avoid possible damages of the system out of this phenomenon, special design requirements like stress analysis and very strict inspection level is proposed (Mannan, 2005).
Leak from flow line due to Inappropriate Method of Fabrication
There are two main methods of fabrication for pipes namely Seamless (SML) and Welded. SML pipe indicates a type of pipe without any seam or weld with the highest joint efficiency. Apparently, the joint efficiency of this pipe is 100%. On the other hand, Welded pipes are produced from plates that are bended and welded later on. Welding can reduce the joint efficiency of a pipe length to 60% and it depends on the welding mechanism (ASME B31.3). Appropriate welding mechanism and method of fabrication for pipes shall be utilized to prevent piping leakage at operation (Mannan, 2005).

CHALMERS, Product and Production Development, Master’s thesis 2011 59
Leak from flow line due to Wrong Material Selection
Proper material shall be selected for equipment, instruments and piping considering fluid nature and process parameters to assure proper functioning of facilities over design life of the plant. Poor or wrong material selection puts the plant safe operation in a big risk of failure. As an example failure of carbon steel components in relatively highly corrosive environment is a common scenario in plants.
On the flow line of the oil field development plant, two safeguards had been considered to prevent the rupture of flow line (Figure 5.7). The Pressure Transmitter (PT-0101A/B/C) provided on each well outlet line with Low Low alarm and interlock ESD-2 to close Sub Surface Safety Valve (SSSV) on well head to trip Electrical Submersible Pump (Well head shutdown) and also close Shutdown Valves (SDVs) on flow line. Another safeguard is Pressure Transmitter (PT-0907) provided with Low Low alarm upstream of Emergency Shutdown Valves (ESDV-0902) with interlock ESD-2 to shutdown the well head and close Emergency Shutdown Valves on flow line.
The failure of each safeguards cause system fails to prevent the flow line rupture and as a result loss of hydrocarbon to atmosphere which leading to possible major fire and explosion, and consequently environmental damages and personnel injury.
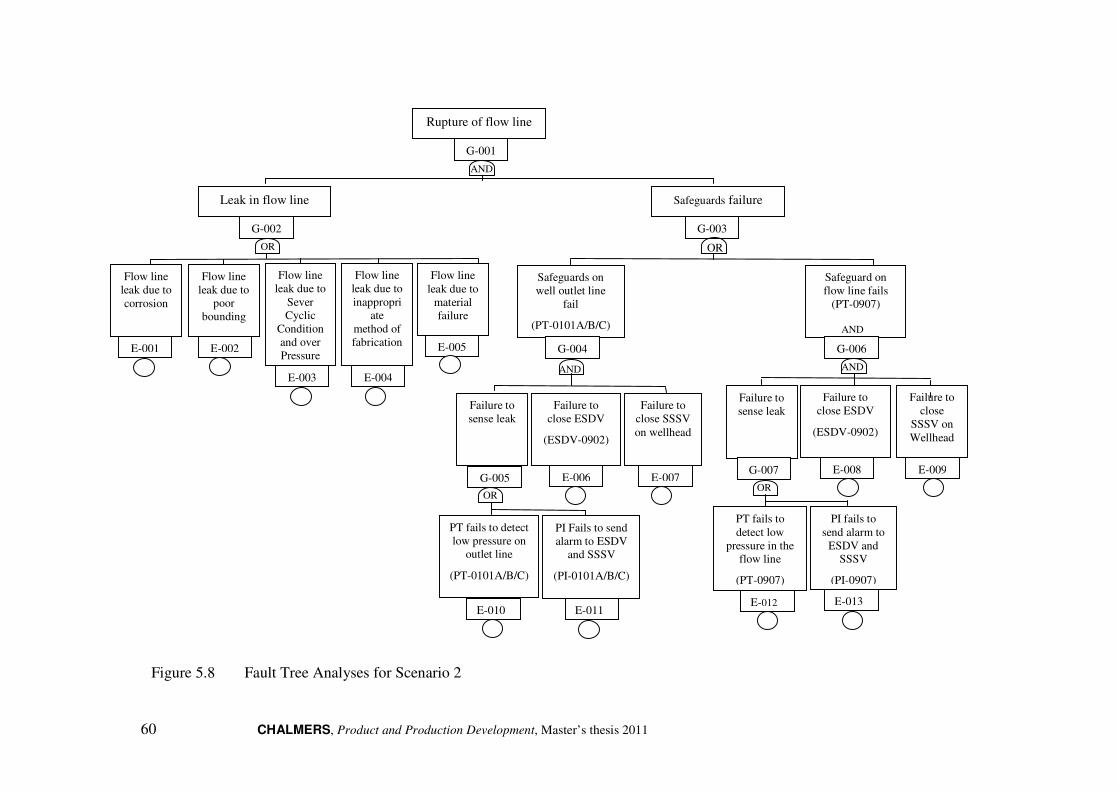
60 CHALMERS, Product and Production Development, Master’s thesis 2011
Rupture of flow line
G-001
Leak in flow line Safeguards failure
AND
G-002 G-003
Flow line leak due to
poor bounding
Flow line leak due to corrosion
Flow line leak due to
Sever Cyclic
Condition and over Pressure
Flow line leak due to inappropri
ate method of fabrication
Flow line leak due to
material failure
Failure to close ESDV
(ESDV-0902)
Failure to sense leak
PT fails to detect low pressure on
outlet line
(PT-0101A/B/C)
G-005
PI fails to send alarm to
ESDV and SSSV
(PI-0907)
Safeguards on well outlet line
fail
(PT-0101A/B/C)
Safeguard on flow line fails
(PT-0907)
G-004 G-006
Failure to sense leak
Failure to close ESDV
(ESDV-0902)
PT fails to detect low
pressure in the flow line
(PT-0907)
G-007 E-007
Failure to close
SSSV on Wellhead
Failure to close SSSV on wellhead
OR OR
AND
AND
OR OR
E-005
E-004 E-003
E-002 E-001
E-006 E-008 E-009
E-013 E-011 E-010
PI Fails to send alarm to ESDV
and SSSV
(PI-0101A/B/C)
E-012
AND
Figure 5.8 Fault Tree Analyses for Scenario 2

CHALMERS, Product and Production Development, Master’s thesis 2011 61
The data on the failure rates of instruments on process plants derive from the failure rate databases available at Mannan, S. (2005):
Table 5.3 Failure rate of Base events for Scenario2
Base
Event
Item Failures/year References
E-001 Flow line leak due to corrosion - d
E-002 Flow line leak due to poor bounding - d
E-003 Flow line leak due to Sever Cyclic Condition and over Pressure
- d
E-004 Flow line leak due to inappropriate method of fabrication
- d
E-005 Flow line leak due to material failure - d
E-006 Failure to close ESDV (ESDV-0902) 0.25 a
E-007 Failure to close SSSV on wellhead 0.25 a
E-008 Failure to close ESDV (ESDV-0902) 0.25 a
E-009 Failure to close SSSV on Wellhead 0.25 a
E-010 PT fails to detect low pressure on outlet line (PT-0101A/B/C)
0.49 c
E-011 PI fails to send alarm to ESDV and SSSV (PI-0101A/B/C)
0.29 c
E-012 PT fails to detect low pressure in the flow line (PT-0907)
0.49 c
E-013 PI fails to send alarm to ESDV and SSSV(PI-0907)
0.29 c
a. failure rate for Emergency Shutdown valve and Subsurface Safety Valve (SSSV) is based on the failure rate of control valve given by Mannan (2005) (page 14/19)
c. failure rate for Pressure Transmitter and Pressure Indicator are based on the failure rate given by Mannan (2005) (page 13/19, Table 13.6)
d. The information about the leakage of flow line due to mentioned reason is not available. The leakage of flow line is estimated based on the historical information the leakage of pipework which is developed based on the pipe diameter (Mannan, 2005, page Table 12/24, page 12/104)
The Probability of the intermediate events are calculated based on the developed fault tree model and input data of failure rates of base events. Table 5.4 the probability of intermediate events of scenario 2
Intermediate
Event
Item Formula Failures/year
G-002 Leak in flow line e 3*10�� e
G-003 Safeguards failure G-004 OR G-006 0.08
G-004 Safeguards on well outlet line fail
G-005 AND E-006 AND E-007
0.04
G-005 Failure to sense leak E-010 OR E-011 0.78
G-006 Safeguards on flow line fails
G-007 AND E-008 AND E-009
0.04
G-007 Failure to sense leak E-012 OR E-013 0.78

62 CHALMERS, Product and Production Development, Master’s thesis 2011
e. based on the pipe diameter which is >150 mm (Mannan, 2005, page table 12/24, page 12/104)
The probability of top event (G-001: rupture of flow line) is based on the And gate of G-002 AND G-003:
Top event probability = 3*10�� ∗ 0.08= 0.24*10��failure/year
5.3.4 Description and probability estimation of Scenario 3
Scenario 3: Production Tube Rupture due to High pressure on upstream of well
According to the HAZOP study the probability of undesirable event of high pressure on upstream of well is high. The high pressure on upstream of well cause rupture of production tube and as a result plant shutdown and loss of production.
Figure 5.9 shows the well head and its safety systems. The fault tree analysis (Figure 5.10) is developed to estimate the probability of rupture of tube due to high pressure on upstream of well.
Figure 5.9 well head and its safety instruments
Two undesirable events of high pressure (G-002) and safeguards failures (G-003) are coupled together (as illustrated by AND gate G-001), to cause the possible rupture of production tube and as a result plant shutdown and loss of production. The high
Production Tube
Well
Flow Line
ESDV
SSSV
Choke Valve PT-
0101 C
PT-0101 B
PT-0101 A
PI-0101 C
PI-0101 B
PI-0101 A
ESD2
Well outlet line

CHALMERS, Product and Production Development, Master’s thesis 2011 63
pressure on upstream of well may cause by malfunction of Emergency Submersible Pump (ESP) and as a result no flow from upstream of respective well (E-001). Additionally, malfunction of Choke Valve and fail to close cause to high pressure on upstream of well (E-002).
A safeguard has been considered in case of high pressure on upstream of well. Pressure Transmitters (PT-0101A/B/C) provided on each well outlet line with interlock ESD-2 to close Subsurface Safety Valve (SSSV) on well head and to trip the Emergency Submersible Pump (ESP) in order to shutdown the well head. The safeguard failure may cause by two undesirable events of failure to sense high pressure on well outlet line (G-003) OR failure to close SSSV on wellhead and trip ESP (E-005).
The hazard scenario of high pressure on upstream of wellhead leads to possible rupture of production tube and as a result well shutdown and loss of production.
Figure 5.10 Fault tree analysis of Scenario 3
The data on the failure rates of components on process plants derive from the failure rate databases available at Mannan (2005): Table 5.5 Failure rate of Base events for Scenario3
AND
Failure to sense high pressure
PT fails to detect high pressure on
outlet line
(PT-0101A/B/C)
Fail to send alarm to SSSV on wellhead
E-005
Failure to close
SSSV on wellhead
OR OR
E-002
E-003
E-001
E-004
Rupture of production tube
G-001
High pressure on upstream of well
Failure of safeguards
Malfunction of Emergency
Submersible Pump (ESP)
FCV (choke valve)
malfunction and close
G-002
G-004
G-003
OR

64 CHALMERS, Product and Production Development, Master’s thesis 2011
Base Event Item Failures/year Reference
E-001 Malfunction of Emergency Submersible Pump
1 f
E-002 FCV (choke valve) malfunction and close
0.25 a
E-003 PT fails to detect high pressure on outlet line (PT-0101A/B/C)
0.49 c
E-004 PI fails to send alarm to SSSV on wellhead (PI-0101A/B/C)
0.29 c
E-005 Failure to close SSSV on wellhead
0.25 a
a. failure rate for Emergency Shutdown valve and Subsurface Safety Valve (SSSV) is based on the failure rate of control valve given by Mannan (2005) (page 14/19) c. failure rate for Pressure Transmitter and Pressure Indicator Controller are based on the failure rate given by Mannan (2005) (page 13/19, Table 13.6) f. Based on the data from 320 electronic submersible pump gathered the mean time to failure is estimated to 330 days (Mannan, 2005). Therefore the failure rate for ESP (Emergency Submersible Pump) is considered as 1 per/year The Probability of the intermediate events are calculated based on the developed fault tree model and input data of failure rates of base events. Table 5.6 The probability of intermediate events of scenario 3
Intermediate
Event
Item Formula Failures/year
G-002 High pressure on upstream of well
E-001 OR E-002 1.25
G-003 Failure of safeguards G-004 OR E-005 1.03
G-004 Failure to sense high pressure
E-003 OR E-004 0.78
The probability of top event (G-001: Rupture of production tube) is based on the And gate of G-002 AND G-003:
Top event probability = 1.25 * 1.03= 1.28 failure/year
5.4 Consequence Analysis
The consequence analysis for each investigated scenario should be developed to estimate the impact of the hazards on health, safety, environmental, and economic consequences. Typically, consequence modeling is developed to calculate or estimate the numerical value or graphical representation that describes the impact of hazard scenarios in term of people injuries, loss of assets, or environmental damage.
In this study the quantitative consequence analysis is not possible due to lack of required information. Therefore, the qualitative consequence analysis is developed to estimate the impact of hazard scenarios. Based on the consequence classification table, the impact of the hazard scenarios are categorized as following:

CHALMERS, Product and Production Development, Master’s thesis 2011 65
Crude oil and natural gas are both inflammable and hazardous, therefore the consequence of first scenario, leakage of gas and crude oil due to damage to 1st stage separator, may cause to major fire and explosion and as a result damage to assets and loss of human life. Based on the consequence classification in Table 5.7 the consequence level of scenario 1 is considered 4.
The consequence of scenario 2 (loss of hydrocarbon to the atmosphere due to flow line rupture) same as first scenario is considered as 4 level. Loss of hydrocarbon to the atmosphere causes major fire and explosion because hydrocarbon is inflammable and may irreversible damage to the environment, loss of human life and loss of assets.
According to the HAOP study result, the third hazard scenario, rupture of production tube, may cause plant shut down and loss of production. Therefore, based on the description of consequence classification table the consequence level of this scenario is estimated 2.
5.5 Risk Level
According to the estimated number in probability estimation and consequence estimation, the risk level is developed based on the semi-quantitative risk ranking matrix (the risk ranking matrix procedure is explained in Section 3.3.10)
The Consequence and probability of identified hazard scenarios are classified based on the consequence and probability classification tables (Table 5.7, Table 5.8):
Table 5.7 The classification of consequences
Level Severity
class
People Asset Environment Reputation
4 Catastrophic Fatalities, sever health problem
Extensive damage
Extensive effect
Major International
Impact
3 Critical Major health problem/ disability
Major damage
Major effect Major National Impact
2 Important Major injuries Local Damage
Local effect Considerable Impact
1 Negligible No health/ Injury
Minor damage
Minor effect limited Impact
Table 5.8 The classification of probability
Level Probability
class
Failure/Year Description (Failure/Year)
A Frequent 1 to 0.1 Once/year to once/10 years
B Probable 0.1 to 0.01 Once/10 year to once/100 years

66 CHALMERS, Product and Production Development, Master’s thesis 2011
C Occasional 0.01 to 0.001 Once/100 year to once/1000 years
D Remote 0.001 to 0.0001 Once/1000 year to once/10000 years
E Improbable Less than 0.0001 Less than once/10000 years
Probability Level
Failure/Year
A 1 to 0.1 Senario 3
B 0.1 to 0.01
C 0.01 to 0.001 Scenario 1
D 0.001 to 0.0001
E Less than
0.0001 Scenario 2
Consequence Level
1 2 3 4
Consequence Class
Negligible Important Critical Catastrophic
Figure 5.11 Semi-Quantitative Risk Matrix
Red-Risk Level I: Not acceptable- risk reducing measures required
Yellow-Risk Level II: Acceptable- but should consider further investigation
Green-Risk Level III: Acceptable
Table 5.9 The Risk Level of three investigated scenarios
Hazard Scenario Probability (failure/year)
Consequence level
Risk Level
Description
Scenario I
0.021 4 III Unacceptable
Scenario II
0.24 * 10�� 4 II Acceptable- but should consider further investigation
Scenario III
1.28 2 III Unacceptable
The result from the risk evaluation (Table 5.9) shows that the hazard scenario 1 and 3 are at the unacceptable level, and Scenario 2 is at acceptable level but further consideration should be measured to reduce the level of risk into the acceptable level.

CHALMERS, Product and Production Development, Master’s thesis 2011 67
Based upon the result form risk assessment, the appropriate strategy should be developed to reduce the level of unacceptable risks to the tolerable level. The possible strategies would be reducing the probability of the event or reducing the consequences or both of them. The required consideration and appropriate actions are discussed at conclusion Chapter (Chapter 6).
68 CHALMERS, Product and Production Development, Master’s thesis 2011
6 Conclusion and Recommendations
In this chapter, the required considerations and appropriate actions to reduce or mitigate the associated uncertainties due to the key variables are explained. Also the effectiveness of the approach and challenges emerged as a result of the presented model in the investigated case study are evaluated.
6.1 Required considerations to reduce the effect of variables
The result of risk evaluation (Table 5.9) shows risk level of scenario I & III are at unacceptable risk level, and Scenario II is acceptable but is required more investigation to reduce the level of risk to the tolerable level. The management team should develop required modification to reduce the risk level either by decreasing the probability or consequences. Furthermore, there are some uncertainties due to different variables (technical, organizational, and political) which may affect the risk level considerably. The required considerations and appropriate actions to reduce or mitigate the associated uncertainties due to the key variables are explained in the following Sections:
6.1.1 Technical Causes
To prevent the hazard scenarios due to technical causes which are mentioned at Section 5.2.2, the following considerations should be taken into account during the design phase:
• Following codes and standards by designers apart from limitations arisen from
sanctions and economic crises;
• Appropriate design and material selection to meet technical requirements in
spite of imposed sanctions and consequent cost impacts;
• Regular audit plans and inspection schedules during the operation phase to
obtain sustainable safety;
• Appropriate control and safety systems implementation to detect the possible
deviations from safe operation conditions;
In addition to the general aspects which are mentioned above, the following considerations should be taken into account in design of 1st stage separator to reduce the risk level of scenario 1:
• Reviewing the necessity for internal lining of the separators and proper
corrosion allowance consideration
• Studying the necessity of demulsifiers and corrosion inhibitors to increase
separation efficiency and corrosion attack risk mitigation respectively;
• Considering mercaptans (components with sulfur contents exists in crude oil
which are extremely corrosive) effect on material selection in separator as
well as other equipment in process area;
• Installation of level controllers to prevent operational problems such as carry
over and blow-by;

CHALMERS, Product and Production Development, Master’s thesis 2011 69
• Antifoam injection in separators to prevent mixing gas and water in their
surface contacts;
• Taking design standards and practices into account to size separators in a
manner to achieve effective separation
As it is described in Scenario 2 (Section 5.5.3), the main reasons of piping system failure are corrosion, poor bounding between pipe joints, sever cycling condition and over pressure, inappropriate method of fabrication, and wrong material. To prevent these failure causes, the following considerations should be paid attention during the design of a flow line:
• Injection of corrosion inhibitors to prevent different types of corrosion attacks
such as H2S and CO2 corrosion.
• Following codes and standards related to choose the appropriate pipe joints
• Special design requirements like stress analysis and very strict inspection level
to avoid possible damages of the system due to over pressure and sever
cycling conditions in flow line
• Appropriate welding mechanism and method of fabrication for pipes shall be
utilized to prevent piping leakage at operation.
• Proper material selection for equipment, instruments and piping considering
fluid nature and process parameters to assure proper functioning of facilities
over design life of the plant.
Tubing as a mean of crude oil and gas transportation from subsurface to the ground level is exposed to corrosion attack, high temperature loads as well as elevated temperature. Therefore to prevent the undesirable event of production tube rupture in Scenario 3, the following design considerations should be applied by engineers during the design stage:
• Using corrosion and temperature resistant Alloy like Nickel Alloys to satisfy
technical requirements;
• To calculate adequate wall thickness to withstand high pressure of fluid
extracted from reservoir;
6.1.2 Organizational Causes
In addition to the design considerations other operational safeguards and procedures should be considered to prevent or decrease the consequences of hazards due to organizational causes. The most important procedures are as follow:
• Identifying escape routes from process area;
• Considering required fire trucks, fire fighters and their adequate equipment;
• Considering medical assistance equipment, ambulance and proper training for
personnel;
• Providing environmental/waste management plan to protect the environment
after any fire accident;
• Periodic operating inspection;

70 CHALMERS, Product and Production Development, Master’s thesis 2011
• Operational personnel shall be trained for toxic gases and specially H2S
hazards.
• Develop emergency response procedure.
• The risk assessment and evaluation should be conducted from the earlier stage
of the project
• Operators should have work permit and follow the instructions
6.1.3 Political Issues
Uunstable political situation in oil producer countries and sanctions against countries like Libya, affect the safety of process plants in these countries by imposing limitations on supply of required materials and facilities, selection of vendors, and avoiding foreign licensor’s to be companies’ joint ventures. The effects of political issues on investigated hazard scenarios are described in the following paragraphs:
Scenario 1: Fire/ explosion due to leakage of gas and crude oil from 3 phase
separator
Separators are generally made of carbon Steel and can withstand the fluid corrosion considering the fact that the injected corrosion inhibitor is effective in the separator. Additionally, since supplying carbon steel is not an issue even because of sanction, separator leakage as a result of material failure is not a risky scenario.
On the other hand, less qualified vendors cannot achieve welding, casting, forging and inspection qualities as high standard as reputable experienced vendor can which definitely increase the risk of vessel failure.
Scenario 2: Loss of Hydrocarbon due to rupture of flow line
Flow lines are generally made of carbon steel since it is not economical to use expensive alloys for relatively long distance. However, corrosion inhibitor is injected in the flow line to avoid any possible corrosion attack. Since supplying carbon steel is not an issue even because of sanction, flow line rupture due to material failure is not a risky scenario.
However, like the first scenario as a result of sanction, many qualified vendors from Western European countries and Japan do not show any intention to deal with some countries so that the choice of selection becomes very limited for these companies. This in turn leads to risky situations when potential vendors cannot meet some supplementary requirements to avoid sour corrosion risk in flow lines as follows:
• The quality of material in term of chemical composition maybe less than specified request.
• Some required tests such as HIC test and SSC test which affect the sour corrosion in pipe cannot be performed with less qualified vendors.
Scenario 3: Rupture of production tube due to High pressure on upstream of
well

CHALMERS, Product and Production Development, Master’s thesis 2011 71
Tubing as a mean of crude oil and gas transportation from subsurface to the ground level is exposed to corrosion attack, high pressure loads as well as elevated temperature. Therefore, very costly CRA (Corrosion Resistant Alloy) like Nickel Alloys shall be selected to satisfy technical requirements.
Sanction against countries like Libya makes it nearly impossible for companies to purchase Nickel alloys so that they sometimes ought to shift to lower grades material such as duplex which could not offer adequate corrosion resistance.
Additionally, designing a plant requires licensor technical support as well as its guarantee to end users. But unstable political situations in oil producer countries make licensors to stop their cooperation. So, designing plants without any licensor which fully aware of Know-How, increases the risk of plant failures in terms of material selection, process condition, etc.
6.2 Uncertainties associated with risk assessment
There are considerable uncertainties associated with data, methods, and models used to identify hazards and analysis their probabilities and consequences. Identifying sources of uncertainties is necessary to achieve reliable results from the risk analysis stage.
One of the sources of uncertainties in probability estimation is related to the input data for the failure rates. As it is mentioned before, the failure rates of process components depend on the working environment, process parameters, quality of the materials, methods of their handling and maintenance. In this case study, the failure rates used for base events in the fault tree model are based on the basic failure rates without considering the quality of the materials , process conditions, environmental variables and maintenance practices; consequently, the uncertainty of failure rate data is quiet large. Additionally, there are several data banks sources exist for failure rate estimation. However, there are challenges related to the most appropriate choice and subsequent impacts such as which data base is appropriate for the investigated case study? How to use the information from the data base? And how to apply them in the specific case study?
But the accuracy of the probability estimation depends not only on the data uncertainties but there are other factors determine the reliability of the probability estimation. Whether all the significant contributors which may affect the hazard scenarios are identified and considered during the probability estimation? Whether all the significant relationships among the scenarios and variables are identified (See Section 2.7-Sources of Uncertainties)
6.3 Challenges and Success Factors of the Uncertainty
Decision Making Model
In Section 4.2 some applicable success factors to establish the decision making model have been discussed; Addressing all key variables related to the defined goals, developing systematic methods along with expert’s background and knowledge to identify the key variables, the management intention and openness to the expert’s
72 CHALMERS, Product and Production Development, Master’s thesis 2011
judgments and analysis, are the success factors in applying the decision making model.
Some challenges are emerged during the application of model in the investigated case study which are listed below:
• The investigated case study in this paper is related to the basic design phase of
an oil field development plant, so the major decisions about the location of the
plant, the main applied technology, the main joint ventures of the project, and
the investigators are made at the concept phase. Therefore, searching and
analyzing possible alternatives to prevent the hazard situation is not applicable
for this project which is implemented at basic design phase. The alternative
approach is more suitable for conceptual phase of project that major decisions
haven’t fixed yet.
• The model shows the situation of uncertainty at the Alternative Identification
and Analysis Step. But as it is mentioned before, there are considerable
uncertainties associated with risk assessment process e.g. data uncertainty,
scenario uncertainty, and etc. Therefore, the situation of uncertainty will
remain during the risk assessment stage; just the type and sources of
uncertainties may change.

CHALMERS, Product and Production Development, Master’s thesis 2011 73
7 References
1. Aven, T., Vinnem, J.E. (2007): Risk Management with Applications from
the Offshore Petroleum Industry. Springer series in reliability Engineering,
London 2. Aven, T., Vinnem, J.E., Wiencke, H.S. (2007): A decision framework for risk management, with application to the offshore oil and gas industry. Reliability Engineering & System Safety, Vol. 92, Issue 4, April 2007, pp. 433-448 3. Aven, T. (2010): On how to define, understand and describe risk. Reliability Engineering and System Safety, Vol. 95 (2010), pp. 623–631
4. AS/NZS: 4360, (2004): The Australian and New Zealand Standard on Risk Management. 3rd edition. Australian and New Zealand Standard 5. Bernhard, K.J., (1999): Risk, Uncertainty, and Management Implications. National Program for Integrated Dairy Risk Management Education & Research. [Online] Accessible at: http://aede.osu.edu/programs/dairyRME/CL100/idr1kberF.PDF. Dated: 26 April, 2011
6. Bonnal, P., Gourc, D., Lacoste, G., (2002): The life cycle of technical Projects. Project Management Journal, Vol. 33. No. 1. pp 12-19
7. Cagno, E., Caron, F., Mancini, M., (2007): A multi-dimensional Analysis of Major Risks in Complex Projects. Risk Management. Vol. 9. Pp. 1-18
8. Chapman, C., Ward, S. (2003): Project Risk Management: Processes,
Techniques and Insights. Second edition. Chichester: Wiley, cop. 2003
9. Cleden, D., (2009): Managing Project Uncertainty. Aldershot, Hants, England; Burlington, VT: Ashgate, c2009.
10. Cohen, M.W., Palmer, G.R., (2004): Project Risk Identification and
Management, AACE International Transactions
11. Cornell, M.E.O., (1993): Learning from the Piper Alpha Accident: A Postmortem Analysis of Technical and Organizational Factors. Risk Analysis, Vol.13, No.2, 1993 12. Filipsson, M., (2011): Uncertainty, Variability and Environmental Risk Analysis (Doctoral Dissertation). Linnaeus University Press 13. Gough, J.D., (1994): Environmental Decision Making and Risk Management for Groundwater System. [Online] , Available at: http://law.unh.edu/risk/vol8/spring/gough.htm , Accessed: 2011-04-17

74 CHALMERS, Product and Production Development, Master’s thesis 2011
14. Goble, W.M., Cheddie, H., (2005): Safety Instrumented Systems
Verification: Practical Probabilistic Calculations. Research Triangle Park, NC: ISA-The Instrumentation, Systems, and Automation Society, c2005.
15. Gould, J., Glossop, M., Ioannides, A., (2000): Review of hazard Identification Techniques. Health and Safety Laboratory-An agency of the Health and Safety Executive. [Online] Available at: http://www.hse.gov.uk/research/hsl_pdf/2005/hsl0558.pdf. Accessed: 12 July, 2011
16. Haldar, A., Mahadevan, S., (2000): Probability, Reliability and Statistical
Methods in Engineering Design. John Wiley & Sons, New York, 2000.
17. Hauptmanns, U., (2004): Semi-quantitative fault tree analysis for process plant safety using frequency and probability ranges. Journal of Loss
Prevention in the Process Industries, Vol. 17, pp. 339–345
18. Heikkilä, A.M., (1999): Inherent safety in process plant design, an index based approach (Doctoral dissertation). Technical research center of Finland.
19. Holton, G.A., (2004): Perspectives: Defining Risk. Financial Analysts Journal, Vol. 60, No. 6, pp. 19-25, November/December 2004
20. IEC, (2008): Risk Management, Risk Assessment Techniques. 1st edition. International Electrotechnical Commission
21. ISO 17776, (2000): Petroleum and natural gas industries-Offshore
production installations-Guidelines on tools and techniques for hazard
identification and risk assessment. First edition. ISO-International Organization for Standardization
22. Kaliprasad, M., CCE, (2006): Proactive Risk Management. Cost
Engineering, Vol. 48/No. 12 Dec, 2006
23. Kidam, K., Hurme, M., Hassim, M.H., (2009): Technical Analysis of accident in Chemical Process Industry and Lessons Learnt. [Online] Available at: http://www.aidic.it/CISAP4/webpapers/24Kidam.pdf, Accessed: 2011-08-19 24. Kletz. T., (2001): Learning from Accidents. Third Edition. Gulf Professional Publishing 25. Kristensen, V., Aven, T., Ford, D. (2006): A new perspective on Renn and Klinke's approach to risk evaluation and management. Reliability Engineering
and system safety, Vol. 91 (2006), pp. 421-432
CHALMERS, Product and Production Development, Master’s thesis 2011 75
26. Kowalski-Trakofler, K.M., Vaught, C., Scharf, T., (2001): Judgment and decision making under stress: an overview for emergency managers. National Institute for Occupational Safety and Health. [Online] Available at: http://www.cdc.gov/niosh/mining/pubs/pdfs/jadmu.pdf. Accessed: 2 July, 2011
27. Lerche, I., (1997): Geological Risk and Uncertainty in Oil Exploration
.United states of America, Elsevier.
28. Lioy, P.J., (2002): Uncertainty Analysis. The Gale Group Inc., Macmillan Reference USA. Gale Encyclopedia of Public Health, 2002. [Online] Available at: http://www.enotes.com/public-health-encyclopedia/uncertainty-analysis, Accessed: 2011-04-08
29. Mannan, S., (2005): Lees' Loss Prevention in the Process Industries, Volumes 1-3. 3rd Edition. Elsevier
30. Melchers, R.E., (2001): On the ALARP Approach to Risk Management. Reliability Engineering and System Safety, Vol. 71, pp. 201 to 208
31. Migilinskas , D., Ustinovičius, L. (2008): Methodology of Risk and Uncertainty Management in Construction Technological and Economical Problems. [Online] Available at: http://www.iaarc.org/publications/fulltext/8_sec_114_Migilinskas_et_al_Methodology.pdf. Accessed: 2011-04-08
32. NOAA, (2004): Risk and Uncertainty in Environmental Restoration Programs. NOAA Coastal Services Center. [Online] Available at: http://www.csc.noaa.gov/coastal/economics/riskinrest.htm. Accessed: 2011-06-11
33. Nolan, D. P., (2008): Safety and Security Review for Process Industries:
Application of HAZOP, PHA, and What-if Review. Norwich, NY : William Andrew, c2008
34. NRC, (2009): NUREG-1855, Vol. 1, Guidance on the Treatment of Uncertainties Associated with PRAs in Risk-Informed Decision Making. U.S. Nuclear Regulatory Commission, March 2009. [Online] Available at: http://www.nrc.gov/reading-rm/doc-collections/nuregs/staff/sr1855/v1/sr1855v1.pdf, Accessed: 2011-04-08
35. Palisade, (2005): Guide to using @RISK- advanced risk Analysis for
Spreadsheets. Palisade Corporation
36. Pons D.J. Raine, J.K., (2004): Design with uncertain qualitative variables under imperfect knowledge. Proceedings of the Institution of Mechanical Engineers: Part B. Journal of Engineering Manufacture. London: Aug 2004.Vol. 218, Iss. 8; pp. 977

76 CHALMERS, Product and Production Development, Master’s thesis 2011
37. PMI (Project Management Institute), (2009): Practice Standard for Project
Risk Management. 4th edition. Project Management Institute.
38. Renn, O. (1998): The Role of Risk Perception for Risk Management. Reliability Engineering and System Safety. Vol. 59, (1998), pp. 49-62
39. Rodger, C., Petch, J., (1999): Uncertainty & Risk Analysis- A practical guide from Business Dynamics. Business Dynamics, PricewaterhouseCoopers
United Kingdom firm. [Online] Available at: http://clem.mscd.edu/~mayest/Excel/Files/Uncertainty%20and%20Risk%20Analysis.pdf. Accessed: 2011-04-08 40. Sackmann, J. (2007): Risk Vs Uncertainty. [Online] Available at: http://www.hardballtimes.com/main/article/risk-vs-uncertainty/, Accessed: 2011-04-08 41. Samson, S., Reneke, J.A., Wiecek, M.M. (2009): A Review of Different Perspectives on Uncertainty and Risk and an Alternative Modeling Paradigm. Reliability Engineering and System Safety, vol. 94 (2009), pp. 558– 567
42. Sherif, Y.S., (1989): On Risk and Risk Analysis. Reliability Engineering
and System Safety, 31, (1991), pp. 155-178
43. Sutton, I. (2010): Process Risk and Reliability Management - Operational
Integrity Management. Elsevier Science Ltd, 1st edition
44. Trochim W.M.K, (2006): Research Methods Knowledge Base. [Online] Available at: http://www.socialresearchmethods.net/kb/index.php. Access on: 15, June 2011 45. Vesely, W.E., Rasmuson, D.M. (1984): Uncertainties in Nuclear Probabilistic Risk Analyses. Risk Analysis, Vol. 4. No. 4, pp. 313-322
46. Wang, J.X., Roush, M.L., (2000): What Every Engineer Should Know
About Risk Engineering And Management. Marcel Dekker, New York, 2000.
47. Watermeyer, P., (2002): Handbook for Process Plant Project
Engineers. Wiley Publications
48. WHO (World Health Organization Geneva), (2004): IPCS Risk Assessment Methodology. World Health Organization Geneva
49. Willows, R., Connell, R., (2003): Climate adaptation: Risk, Uncertainty and Decision Making. UKCIP (UK Climate Impacts Program) Technical
Report, May 2003. [Online] available at: http://www.sfrpc.com/Climate%20Change/2.pdf. Accessed: 2011-09-15

CHALMERS, Product and Production Development, Master’s thesis 2011 77
50. Young, T.L., (2010): Successful project Management: Develop Effective
Skills, Manage the Risks. 3rd edition. London; Philadelphia: Kogan Page, 2010, pp. 80-93

78 CHALMERS, Product and Production Development, Master’s thesis 2011
Attachment 1: The HAZOP Worksheet
Node: 1. Receipt of gas and oil to 1st stage Three Phase Separator
Deviation Causes Consequences Safeguards Recommendations
1. No/ Less flow
1. No flow from upstream of respective well (eg ESP pump failure)
1.1. Less production from well to 1st stage separator. Low pressure in header.
1.1.1. PI provided on each well outlet line with low alarm (eg PI-0105)
1.2. High pressure on upstream of well
1.2.1. PI provided on each well outlet line with interlock ESD-2 (2oo3) to close SSV and SSSV on well head and to trip ESP pump (well head shutdown). (eg PI-0101A/B/C connected to interlock ESD-2)
1. ESP pump running indication to be provided in DCS.
2. FCV (choke valve) malfunction and close
2.1. High pressure on upstream of well
2.1.1. PT provided on each well outlet line with interlock ESD-2 (2oo3) to close SSV and SSSV on well head and to trip ESP pump (well head shutdown). (eg PT-0101A/B/C connected to interlock ESD-2)
1. ESP pump running indication to be provided in DCS.
2.2. Less production from well to 1st stage separator. Low pressure in header.
2.2.1. PI provided on each well outlet line with low alarm (eg PI-0105)
3. Plugging of line between choke valve and separator
3.1. High pressure on line upstream SDVs if plugging takes place u/s of SDV's. The pipeline upto SDV is designed for well head pressure
3.1.1. Asphalt inhibitor and wax inhibitor provided on well head line upstream of choke valve
3.2. High pressure on line downstream of SDVs if plugging takes place d/s of SDV's. This may lead to pipeline damage. Possible fire and explosion. Environmental issue.
3.2.1. PT provided on each well outlet line with interlock ESD-2 (2oo3) to close SSV and SSSV on well head and to trip ESP pump (well head shutdown). (eg PT-0101A/B/C connected to interlock ESD-2)
2. Review the requirement of shutting down of well in the event of PT-XXX (eg PT-1001A/B/C) on high high pressure. The need for

CHALMERS, Product and Production Development, Master’s thesis 2011 79
Node: 1. Receipt of gas and oil to 1st stage Three Phase Separator
Deviation Causes Consequences Safeguards Recommendations
3.2.2. PSV provided on each flow line and sized for blocked out condition.(eg. PSV-0901/0902 provided d/s of SDV-0902)
shutting down of ESP alone is sufficient.
4. SDV on individual flow line (eg SDV-0902)malfunction and close (one or two SDV considered)
4.1. Less production from well to 1st stage separator. Low pressure in header.
4.1.1. PT provided on flow line downstream of SDV with low low alarm and interlock ESD-2 to shut down the well (eg SDV-0902)
3. Provide low flow alarm on FIC-XXX on flow line upstream of SDVs (eg SDV-0502).
4.2. High pressure on upstream of SDV (eg SDV-0902)
4.2.1. PT provided on each well outlet line with interlock ESD-2 (2oo3) to close SSV and SSSV on well head and to trip ESP pump (well head shutdown). (eg PT-0101A/B/C connected to interlock ESD-2)
1. ESP pump running indication to be provided in DCS.
2. Review the requirement of shutting down of well in the event of PT-XXX (eg PT-1001A/B/C) on high high pressure. The need for shutting down of ESP alone is sufficient.
5. Rupture of flow line 5.1. Loss of hydrocarbon to atmosphere leading to possible major fire and explosion. Environmental issue. Possible personnel injury.
5.1.1. PT provided on each well outlet line with low low alarm and interlock ESD-2 (2oo3) to close SSV and SSSV on well head and to trip ESP pump (well head shutdown) and close SDVs on flow line. (eg PT-0101A/B/C connected to interlock ESD-2)
4. Relocate PT-0907 to upstream of SDV-0902.

80 CHALMERS, Product and Production Development, Master’s thesis 2011
Node: 1. Receipt of gas and oil to 1st stage Three Phase Separator
Deviation Causes Consequences Safeguards Recommendations
5.1.2. PT-XXX provided with low low alarm downstream of SDVs with interlock ESD-2 to shut down the well head and close SDVs on flow line. (eg PT-0907 provided downstream of SDV-0902 on flow line)
5. SDVs (eg SDV-0902 and ESDV from well head) provided on line to be able to close (for reverse flow) and time of closure to be specified.
6. Rupture of gas line from wells
6.1. Loss of hydrocarbon to atmosphere leading to possible major fire and explosion. H2S escape to atmosphere. Environmental issue. Possible personnel injury.
18. Review scenario and study the necessary protection of failure of gas line from the well.
19. Consider increasing additional corrosion allowance (3mm) for the gas line from the well.
20. Consider HC / H2S / flame detectors on well head and connect to hydraulic panel. Symbols of detectors will be added during detail design by EPC.
7. XVs on individual flow line (eg XV-0901) malfunction and close on line to
7.1. Less production from well to 1st stage separator. Low pressure in header.
7.1.1. Valve open / close indication available in DCS
3. Provide low flow alarm on FIC-XXX on flow line upstream of SDVs (eg SDV-0502).

CHALMERS, Product and Production Development, Master’s thesis 2011 81
Node: 1. Receipt of gas and oil to 1st stage Three Phase Separator
Deviation Causes Consequences Safeguards Recommendations
production header 7.2. High pressure on upstream of XVs (eg XV-0901)
7.2.1. Valve open / close indication available in DCS
1. ESP pump running indication to be provided in DCS.
7.2.2. PT provided on each well outlet line with interlock ESD-2 (2oo3) to close SSV and SSSV on well head and to trip ESP pump (well head shutdown). (eg PT-0101A/B/C connected to interlock ESD-2)
2. Review the requirement of shutting down of well in the event of PT-XXX (eg PT-1001A/B/C) on high high pressure. The need for shutting down of ESP alone is sufficient.
6. Provide interlock to shutdown SDVs upstream on the manifold in the event of XVs leaving open position. (eg SDV-0902 to close in the event of XV-0901 and XV-0902 leaving open position)
8. FIC-XXX malfunction and close FV-XXX on individual flow line to production header
8.1. Less production from well to 1st stage separator. Low pressure in header.
8.2. High pressure on upstream of FCVs on individual flow line.
7. The line upstream of FCVs to be designed for well head pressure.

82 CHALMERS, Product and Production Development, Master’s thesis 2011
Node: 1. Receipt of gas and oil to 1st stage Three Phase Separator
Deviation Causes Consequences Safeguards Recommendations
8. Review deleting PTs with high alarm with interlock ESD-2. (eg delete PT-0907 high high with interlock ESD-2)
9. Relocate PSVs on flow line downstream of FCVs on flow line
9. ESDV-1601 / ESDV-1602 malfunction and close on inlet to 1st stage separator
9.1. No flow from wells to 1st stage separator. Low pressure in header.
9.1.1. Valve open / close indication available in DCS
9.2. Loss of level in 1st stage separator. This may lead to loss of suction to export pumps P-101A/B and damage.
9.2.1. LIC-1604 provided on 1st stage separator with low alarm maintaining level of separator by FV-1802 on pump discharge line
9.2.2. LALL-1602 provided on 1st stage separator with interlock ESD-4 to trip export pumps P-101A/B
9.3. High pressure on upstream of ESDV-1601 / 1602. This may lead to possible damage and leakage. Potential fire and explosion. Environmental issue. Personnel injury.
9.3.1. PSVs provided on individual flow line upstream of FCVs and sized for blocked out condition
9. Relocate PSVs on flow line downstream of FCVs on flow line
10. Provide independent PT downstream of XV-1601 / 1602 with high high alarm and interlock to close SDVs on flow line except in SDV to test separator (eg SDV-0902).

CHALMERS, Product and Production Development, Master’s thesis 2011 83
Node: 1. Receipt of gas and oil to 1st stage Three Phase Separator
Deviation Causes Consequences Safeguards Recommendations
10. Pig trap in the line (during pigging operation)
10.1. High pressure on line upstream of pig trap. This may lead to possible damage
10.1.1. This pipeline upto SDV is designed for well head pressure
11. PSVs on flow line malfunction to open (eg PSV-0901)
11.1. Less flow of gas to oil to 1st stage separator. Loss of material to blowdown and flare. Possible high level in closed drain drum
11.1.1. Regular calibration and inspection of safety valves
11.1.2. LIC-4101 with high high alarm provided on closed drain drum with autostart of closed drain pump on high high level
12. BDV-1601 malfunction and open
12.1. Loss of gas to fuel gas system. Loss of material.
12.1.1. BDV-1601 provided with open / close indication in DCS
2. More Flow 1. FCV (choke valve) malfunction and open fully
1.1. High pressure on flow line upto FCV-XXX on the flow line. This may lead to possible damage
1.1.1. The pipeline upto FCV-XXX designed for well head pressure
2. FIC-XXX malfunction and open FV-XXX fully on individual flow line to production header
2.1. High level in 1st stage separator (16-V-101). This may lead to carryover of liquid in gas line. This will affect dehydration package
2.1.1. LIC-1604 provided on 1st stage separator (16-V-101) with high alarm
2.1.2. LAHH-1602 provided on 1st stage separator (16-V-101) with interlock ESD-2 to shutdown the unit
2.1.3. Fuel gas KO drum (17-V-101) provided upstream of dehydration package
3. Reverse/Misdirected Flow
1. Well shutdown due to downstream condition
1.1. Possible reverse flow of liquid through ESP (pump) and damage
11. Confirm the provision of back-spin protection on ESP (pump) package.

84 CHALMERS, Product and Production Development, Master’s thesis 2011
Node: 1. Receipt of gas and oil to 1st stage Three Phase Separator
Deviation Causes Consequences Safeguards Recommendations
2. Injection asphalt / wax / corrosion inhibitor stop
2.1. Possible reverse flow of HC in injection line
2.1.1. Check valve provided at injection points
3. Interconnection between flow lines
3.1. Possible reverse flow from one flow line to the other
3.1.1. Check valve provided at each flow line upstream of XVs (eg XV-0901)
4. Mal-operation of XVs in manifold
4.1. Possible HC going to test separator when not needed
4.1.1. XVs provided with open / close indication in DCS
4. High Pressure
1. Refer No / Less Flow Cause 1, 2, 3, 4, 6 to 9 discussed in this Node
2. Refer More Flow Cause 1 discussed in this Node
3. External fire on well head
3.1. This may lead to high temperature and pressure and damage to well head (during major fire)
3.1.1. Fusible plugs considered in well head area with interlock to shutdown well head
4. External fire in manifold area
4.1. This may lead to high temperature and pressure in flow line and damage
4.1.1. PSVs provided on flow line and checked for fire case (eg PSV-0901 / 0902)
5. Low Pressure
1. Refer No / Less Flow Cause 1, 2, 4, 5, 6, 7, 8 discussed in this Node
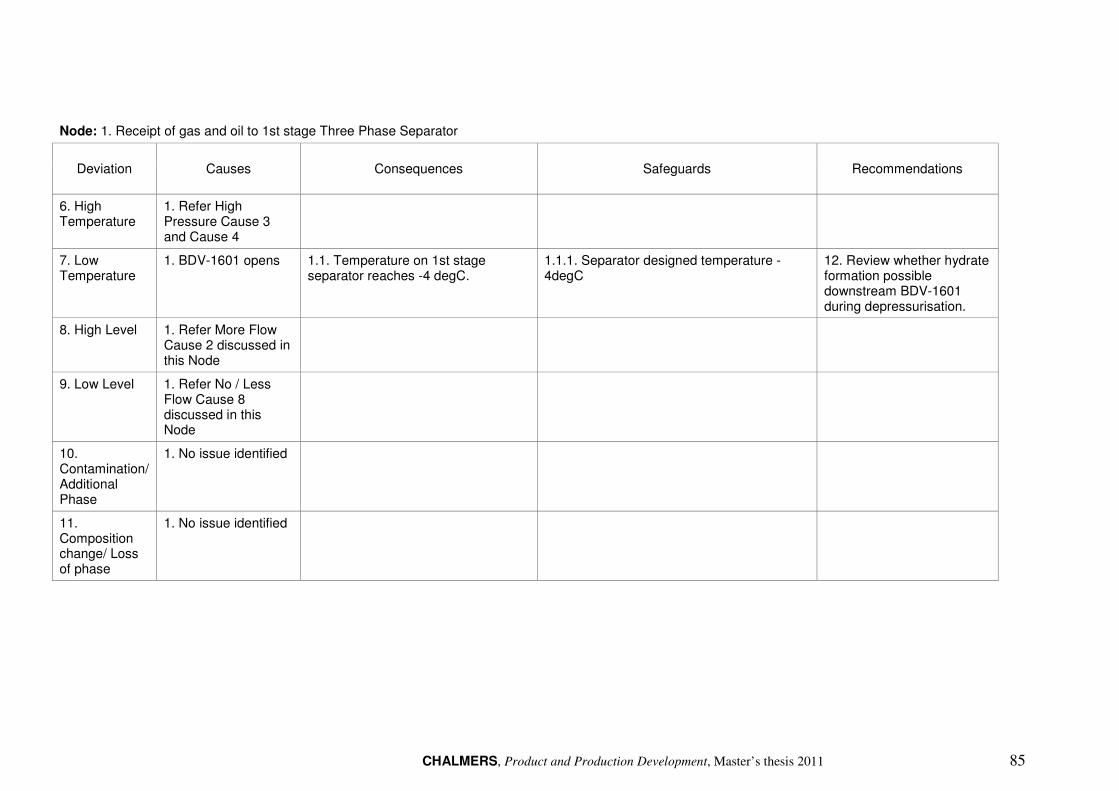
CHALMERS, Product and Production Development, Master’s thesis 2011 85
Node: 1. Receipt of gas and oil to 1st stage Three Phase Separator
Deviation Causes Consequences Safeguards Recommendations
6. High Temperature
1. Refer High Pressure Cause 3 and Cause 4
7. Low Temperature
1. BDV-1601 opens 1.1. Temperature on 1st stage separator reaches -4 degC.
1.1.1. Separator designed temperature -4degC
12. Review whether hydrate formation possible downstream BDV-1601 during depressurisation.
8. High Level 1. Refer More Flow Cause 2 discussed in this Node
9. Low Level 1. Refer No / Less Flow Cause 8 discussed in this Node
10. Contamination/ Additional Phase
1. No issue identified
11. Composition change/ Loss of phase
1. No issue identified

86 CHALMERS, Product and Production Development, Master’s thesis 2011
Node: 1. Receipt of gas and oil to 1st stage Three Phase Separator
Deviation Causes Consequences Safeguards Recommendations
12. Others - non normal operation
1. ESDV-1602 equalisation valve malfunction
1.1. 13. ESDV-1602 to be replaced by manual equalising valve with closing limit switch and interlock to open ESDV-1601 when valve is in close position.
2. ESDV on well outlet / ESDVs on flow line opening during startup
2.1. Difficulty in opening the valve due to high differential pressure
14. Provide equalising valve across ESDVs and SDVs on flow lines. The valve to be provided with closing limit switch and interlock to open ESDVs and SDVs only if valve is in close position.
3. Isolation valve upstream of SDVs (eg SDV-0902)
3.1. 15. Delete isolation valve upstream of SDVs (eg SDV-0902).
4. Maintenance of XVs (eg XV-0901)
4.1. This calls for total shutdown of unit for maintenance
16. Provide isolation valve valve downstream of XVs (eg XV-0901).
13. Utility Failure
1. Instrument air failure
1.1. Control valves and shutdown valves go to fail safe condition
2. Power failure - Covered under No / Less Flow Ca sue 1 in this Node

CHALMERS, Product and Production Development, Master’s thesis 2011 87
Node: 1. Receipt of gas and oil to 1st stage Three Phase Separator
Deviation Causes Consequences Safeguards Recommendations
14. Others 1. Purging requirement
1.1. In absence of purging provision, it is unsafe to take HC in the system which will delay the startup
17. Provide N2 connections at appropriate points for purging the flow line (at wells, flow lines and inlet manifold).

88 CHALMERS, Product and Production Development, Master’s thesis 2011
Node: 2. Gas from 1st stage separator to fuel gas KO drum and dehydration package
Deviation Causes Consequences Safeguards Recommendations
1. No/ Less flow
1. PIC-1605 malfunction and close PV-1605A/B from 1st stage separator 16-V-101
1.1. In the event of no flow, high pressure in 1st stage separator 16-V-101. This may lead to possible damage leading to fire and explosion. Personnel injury.
1.1.1. PT-1603 with high high alarm and interlock ESD-2 to shutdown ESD-1601
1.1.2. PSV-1603 / 1604 provided on separator and checked for blocked condition
1.2. No supply of gas to dehydration and downstream. This may lead to shutting down of power generation and no supply of gas to flare system
1.2.1. Power generation is provided with alternate fuel (diesel)
1.2.2. N2 provided as alternate source for purging of flare header
1.2.3. LPG bottle provided for supply for pilot in flare as alternate source
2. PV-1605A malfunction and partially close PV-1605A from 1st stage separator 16-V-101
2.1. Possible low flow from separator. In the event of valve not fully closing, this will lead to increase in pressure in separator gradually.
2.1.1. PT-1603 with high high alarm and interlock ESD-2 to shutdown ESD-1601
21. Consider provision of PIC (from PT-1611 and PT-1612) on product header separator with selector switch linking with FICs on flow lines.
2.1.2. PSV-1603 / 1604 provided on separator and checked for blocked condition
2.2. Less supply of gas to dehydration and downstream. This may reduce the plant load
2.2.1. Power generation is provided with alternate fuel (diesel)
2.2.2. N2 provided as alternate source for purging of flare header
2.2.3. LPG bottle provided for supply for pilot in flare as alternate source
3. ESDV-1603 malfunction and close
3.1. High pressure in 1st stage separator 16-V-101. This may lead to
3.1.1. ESDV provided with open / close indication in DCS

CHALMERS, Product and Production Development, Master’s thesis 2011 89
Node: 2. Gas from 1st stage separator to fuel gas KO drum and dehydration package
Deviation Causes Consequences Safeguards Recommendations
on gas line from separator
possible damage leading to fire and explosion. Personnel injury.
3.1.2. PT-1603 with high high alarm and interlock ESD-2 to shutdown ESD-1601
3.1.3. PSV-1603 / 1604 provided on separator and checked for blocked condition
3.2. No supply of gas to dehydration and downstream. This may lead to shutting down of power generation and no supply of gas to flare system
3.2.1. ESDV provided with open / close indication in DCS
3.2.2. Power generation is provided with alternate fuel (diesel)
3.2.3. N2 provided as alternate source for purging of flare header
3.2.4. LPG bottle provided for supply for pilot in flare as alternate source
4. ESDV-1701 malfunction and close on inlet to fuel gas KO drum 17-V-101
4.1. High pressure in 1st stage separator 16-V-101. This may lead to possible damage leading to fire and explosion. Personnel injury.
4.1.1. ESDV provided with open / close indication in DCS
22. Consider deleting ESDV-1701 on inlet to fuel gas KO drum 17-V-101 as ESDV-1603 and ESDV-1604 are provided on gas line outlet of separators.
4.1.2. PT-1603 with high high alarm and interlock ESD-2 to shutdown ESD-1601
4.1.3. PSV-1603 / 1604 provided on separator and checked for blocked condition
4.2. No supply of gas to dehydration and downstream. This may lead to shutting down of power generation and no supply of gas to flare system
4.2.1. ESDV provided with open / close indication in DCS
4.2.2. Power generation is provided with alternate fuel (diesel)
4.2.3. N2 provided as alternate source for purging of flare header

90 CHALMERS, Product and Production Development, Master’s thesis 2011
Node: 2. Gas from 1st stage separator to fuel gas KO drum and dehydration package
Deviation Causes Consequences Safeguards Recommendations
4.2.4. LPG bottle provided for supply for pilot in flare as alternate source
5. LIC-1701 malfunction and open LV-1701 on drain line of 17-V-101
5.1. Less supply of gas to dehydration and downstream. This may reduce the plant load
5.1.1. Power generation is provided with alternate fuel (diesel)
5.1.2. N2 provided as alternate source for purging of flare header
5.1.3. LPG bottle provided for supply for pilot in flare as alternate source
5.2. Gas breakthrough to closed drain header. Possible overpressure on closed drain drum
5.2.1. LI-1702 provided with low low alarm and interlock ESD-4 to close SDV-1702 on main line from fuel gas KO drum
23. Vent line of closed drain drum 41-V-101 to be sized for gas breakthrough from 1st stage Separator
5.2.2. Vent from closed drain drum connected to flare header with LO valve
6. Interruption of gas line in dehydration package
6.1. No supply of gas to dehydration and downstream. This may lead to shutting down of power generation and no supply of gas to flare system
6.1.1. Power generation is provided with alternate fuel (diesel)
6.1.2. N2 provided as alternate source for purging of flare header
6.1.3. LPG bottle provided for supply for pilot in flare as alternate source
6.2. High pressure in 1st stage separator 16-V-101. This may lead to possible damage leading to fire and explosion. Personnel injury.
6.2.1. PT-1603 with high high alarm and interlock ESD-2 to shutdown ESD-1601
6.2.2. PSV-1603 / 1604 provided on separator and checked for blocked condition

CHALMERS, Product and Production Development, Master’s thesis 2011 91
Node: 2. Gas from 1st stage separator to fuel gas KO drum and dehydration package
Deviation Causes Consequences Safeguards Recommendations
6.3. High pressure in fuel gas KO drum.
6.3.1. PSV-1701 / 1702 provided on KO drum sized for blocked out case
7. LIC-1701 malfunction and close LV-1701
7.1. High level in fuel gas KO drum and liquid carryover to dehydration unit and shutting down dehydration unit
7.1.1. LI-1702 with high high alarm and interlock ESD-2 to close ESDV-1603 on gas line from separator.
8. BDV-1701 malfunctions and opens
8.1. Loss of gas to flare and less gas to dehydration package
8.1.1. BDV provided with open / close indication in DCS
9. SDV-1702 malfunction and close
9.1. High level in fuel gas KO drum and liquid carryover to dehydration unit and shutting down dehydration unit
2. More Flow 1. PIC-1605 malfunction and open PV-1605A/B fully from 1st stage separator 16-V-101
1.1. Less gas to dehydration package. Loss of gas to flare header. This may lead to less pressure in 1st stage separator 16-V-101 resulting in low NPSH for oil export pump 18-P-101A/B/C. Possible cavitation and damage to pump
1.1.1. PT-1603 provided on 16-V-101 with low low alarm and interlock ESD-2 to trip oil export pump and close ESDV-1601
24. Review the requirement of mechanical stopper on PV-1605B on vent line to flare header from Separator.
1.1.2. PT-0810 provided on export pump suction with low low alarm and interlock ESD-4 to trip oil export pump
2. PV-1605A malfunctions and opens fully to fuel gas KO drum
2.1. More gas to dehydration package. This may lead to less pressure in 1st stage separator 16-V-101 resulting in low NPSH for oil export pump 18-P-101A/B/C. Possible cavitation and damage to pump
2.1.1. PT-1603 provided on 16-V-101 with low low alarm and interlock ESD-2 to trip oil export pump and close ESDV-1601
2.1.2. PT-0810 provided on export pump suction with low low alarm and interlock ESD-4 to trip oil export pump

92 CHALMERS, Product and Production Development, Master’s thesis 2011
Node: 2. Gas from 1st stage separator to fuel gas KO drum and dehydration package
Deviation Causes Consequences Safeguards Recommendations
3. PV-1605B malfunctions and opens fully to flare header
3.1. Loss of gas to flare header and less gas to dehydration package. This may lead to less pressure in 1st stage separator 16-V-101 resulting in low NPSH for oil export pump 18-P-101A/B/C. Possible cavitation and damage to pump
3.1.1. PT-1603 provided on 16-V-101 with low low alarm and interlock ESD-2 to trip oil export pump and close ESDV-1601
24. Review the requirement of mechanical stopper on PV-1605B on vent line to flare header from Separator.
3.1.2. PT-0810 provided on export pump suction with low low alarm and interlock ESD-4 to trip oil export pump
3. Reverse/Misdirected Flow
1. LIC-1701 malfunction and open LV-1701 on drain line of 17-V-101
1.1. Gas breakthrough to closed drain header. Possible overpressure on closed drain drum
1.1.1. LI-1702 provided with low low alarm and interlock ESD-4 to close SDV-1702 on main line from fuel gas KO drum
23. Vent line of closed drain drum 41-V-101 to be sized for gas breakthrough from 1st stage Separator
1.1.2. Vent from closed drain drum connected to flare header with LO valve
4. High Pressure
1. Refer No / Less Flow Cause 1 to 6 discussed in this Node
2. External fire on 1st stage separator 16-V-101
2.1. High pressure on vessel leading to possible damage
2.1.1. PSV-1603 / 1604 provided on separator and sized for fire case
3. External fire on fuel gas KO drum 17-V-101
3.1. High pressure on vessel leading to possible damage
3.1.1. PSV-1701 / 1702 provided on KO drum and checked for fire case
5. Low Pressure
1. Refer More Flow discussed in this Node
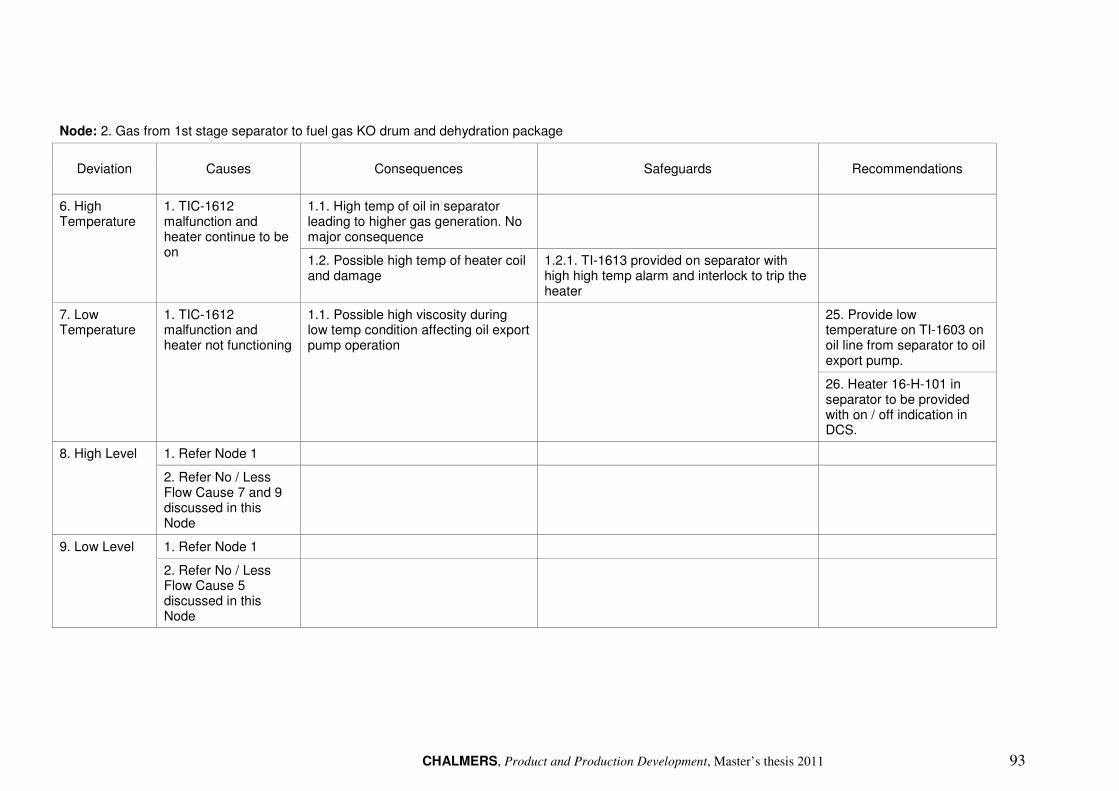
CHALMERS, Product and Production Development, Master’s thesis 2011 93
Node: 2. Gas from 1st stage separator to fuel gas KO drum and dehydration package
Deviation Causes Consequences Safeguards Recommendations
6. High Temperature
1. TIC-1612 malfunction and heater continue to be on
1.1. High temp of oil in separator leading to higher gas generation. No major consequence
1.2. Possible high temp of heater coil and damage
1.2.1. TI-1613 provided on separator with high high temp alarm and interlock to trip the heater
7. Low Temperature
1. TIC-1612 malfunction and heater not functioning
1.1. Possible high viscosity during low temp condition affecting oil export pump operation
25. Provide low temperature on TI-1603 on oil line from separator to oil export pump.
26. Heater 16-H-101 in separator to be provided with on / off indication in DCS.
8. High Level 1. Refer Node 1
2. Refer No / Less Flow Cause 7 and 9 discussed in this Node
9. Low Level 1. Refer Node 1
2. Refer No / Less Flow Cause 5 discussed in this Node
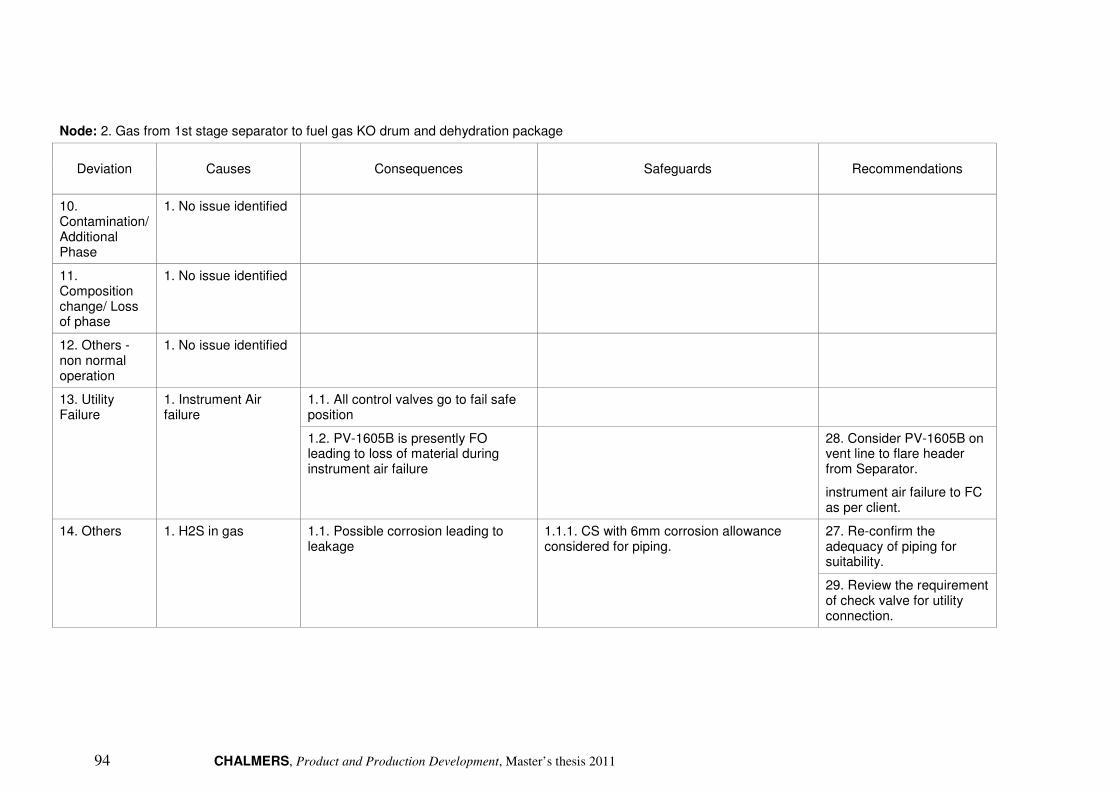
94 CHALMERS, Product and Production Development, Master’s thesis 2011
Node: 2. Gas from 1st stage separator to fuel gas KO drum and dehydration package
Deviation Causes Consequences Safeguards Recommendations
10. Contamination/ Additional Phase
1. No issue identified
11. Composition change/ Loss of phase
1. No issue identified
12. Others - non normal operation
1. No issue identified
13. Utility Failure
1. Instrument Air failure
1.1. All control valves go to fail safe position
1.2. PV-1605B is presently FO leading to loss of material during instrument air failure
28. Consider PV-1605B on vent line to flare header from Separator.
instrument air failure to FC as per client.
14. Others 1. H2S in gas 1.1. Possible corrosion leading to leakage
1.1.1. CS with 6mm corrosion allowance considered for piping.
27. Re-confirm the adequacy of piping for suitability.
29. Review the requirement of check valve for utility connection.

CHALMERS, Product and Production Development, Master’s thesis 2011 95
Node: 3. Transfer of oil from 1st stage Three Phase Separator to Oil export line including Pig Launchers
Deviation Causes Consequences Safeguards Recommendations
1. No/ Less flow
1. SDV-1604 malfunction and close on separator outlet line
1.1. High level in 1st stage separator leading to liquid carryover in fuel gas. This may lead to possible shutdown in dehydration unit and the plant
1.1.1. LIC-1604 with high alarm provided on separator
1.1.2. LAHH-1603 provided on oil side of separator with interlock ESD-2 to shutdown
1.2. Loss of suction to oil export pump leading to cavitation and damage
1.2.1. PT-0810 provided on pump suction line with low low alarm and interlock ESD-4 to trip the pump
2. Oil export pump 18-P-101A/B trip
2.1. Interruption in export of oil 2.1.1. Pump running indication provided in DCS
2.2. High level in 1st stage separator leading to liquid carryover in fuel gas. This may lead to possible shutdown in dehydration unit and the plant
2.2.1. Pump running indication provided in DCS
2.2.2. LIC-1604 with high alarm provided on separator
2.2.3. LAHH-1603 provided on oil side of separator with interlock ESD-2 to shutdown
3. Partial choking of strainer of Oil export pump 18-P-101A/B
3.1. Possible loss of suction to oil export pump leading to cavitation and damage
3.1.1. Regular checking and maintenance of strainer
30. Review the possibility of wax / asphalt formation in oil.
3.1.2. Standby pump available
4. LIC-1604 / FIC-1802 malfunction to close FV-1802 on pump discharge line
4.1. Interruption in export of oil
4.2. High level in 1st stage separator leading to liquid carryover in fuel gas. This may lead to possible shutdown in dehydration unit and the
4.2.1. Pump running indication provided in DCS
4.2.2. LIC-1604 with high alarm provided on separator

96 CHALMERS, Product and Production Development, Master’s thesis 2011
Node: 3. Transfer of oil from 1st stage Three Phase Separator to Oil export line including Pig Launchers
Deviation Causes Consequences Safeguards Recommendations
plant 4.2.3. LAHH-1603 provided on oil side of separator with interlock ESD-2 to shutdown
4.3. High pressure in pump discharge header. This may lead to possible damage.
4.3.1. Discharge header is designed for pump shutoff condition
4.4. Pump running on blocked head. This may lead to possible damage
4.4.1. FIC-1801/FV-1801 provided for minimum flow protection for the pump
31. Review the requirement of providing safety valve on pump discharge of oil export pump 18-P-101A/B for blocked condition operation protection as per IPS.
5. FIC-1801 malfunction to open FV-1801 on recirculation minimum flow line
5.1. Less export of oil 5.1.1. FIC-1802 provided with low alarm on discharge header
5.2. High level in 1st stage separator leading to liquid carryover in fuel gas. This may lead to possible shutdown in dehydration unit and the plant
5.2.1. Pump running indication provided in DCS
5.2.2. LIC-1604 with high alarm provided on separator
5.2.3. LAHH-1603 provided on oil side of separator with interlock ESD-2 to shutdown
6. ESDV-1803 malfunction and close on oil export line (it is agreed to delete this valve during Hazop session)

CHALMERS, Product and Production Development, Master’s thesis 2011 97
Node: 3. Transfer of oil from 1st stage Three Phase Separator to Oil export line including Pig Launchers
Deviation Causes Consequences Safeguards Recommendations
7. ESDV-1801 malfunction and close on oil export line
7.1. No export of oil 7.1.1. FIC-1802 provided with low alarm on discharge header
7.2. High pressure in pump discharge header. This may lead to possible damage to pump and piping.
7.2.1. Discharge header is designed for pump shutoff condition
7.2.2. FIC-1801/FV-1801 provided for minimum flow protection for the pump
8. ESDV-1802 malfunction and close on oil line at receiver point
8.1. No export of oil 8.1.1. FIC-1802 provided with low alarm on discharge header
8.2. High pressure in pump discharge header. This may lead to possible damage to pump and piping.
8.2.1. Discharge header is designed for pump shutoff condition
8.2.2. FIC-1801/FV-1801 provided for minimum flow protection for the pump
8.3. High pressure due to surge may lead to damage of pipeline
32. Surge analysis to be carried out and necessary protection to be considered.
9. PIC-XXX malfunction and close PV-XXX on inlet to manifold
9.1. No export of oil 9.1.1. FIC-1802 provided with low alarm on discharge header
9.2. High pressure in pump discharge header. This may lead to possible damage to pump and piping.
9.2.1. Discharge header is designed for pump shutoff condition
9.2.2. FIC-1801/FV-1801 provided for minimum flow protection for the pump
9.3. High pressure due to surge may lead to damage of pipeline
32. Surge analysis to be carried out and necessary protection to be considered.

98 CHALMERS, Product and Production Development, Master’s thesis 2011
Node: 3. Transfer of oil from 1st stage Three Phase Separator to Oil export line including Pig Launchers
Deviation Causes Consequences Safeguards Recommendations
10. Rupture of export pipeline
10.1. Large oil spill from pipeline leading to possible fire. Personnel injury. Environmental issue.
10.1.1. PT-1809 with low low alarm and interlock ESD-2 to shutdown and isolate the pipeline
33. Review the requirement of line break valves on the pipeline.
11. Pig trap in the line (during pigging operation)
11.1. High pressure on line upstream of pig trap. This may lead to possible damage
11.1.1. This pipeline is designed for blocked condition.
2. More Flow 1. LIC-1604 / FIC-1802 malfunction to open FV-1802 fully on pump discharge line
1.1. More flow on export line may lead to overloading of export pump. This may lead to tripping of export pump.
1.1.1. Pump will trip on motor over current 34. Review LIC-1604 / FIC-1802 control system philosophy for effective control from operation point of view.
1.2. Less level in separator. This may lead to loss of suction of pump and damage
1.2.1. LALL-1603 provided on separator with interlock ESD-4 to trip the pump
2. PIC-XXX malfunction and open PV-XXX fully on inlet to manifold
2.1. Possible two phase flow in the line. This may lead to vibration / damage of valve, although the gas in liquid is very small.
35. Review the pipeline design with respect to two phase flow in the event of PCV-XXX on fully open condition.
3. Reverse/Misdirected Flow
1. Export pump trip 1.1. Possible reverse through the pump. This may lead to pump damage.
1.1.1. Check valve provided on pump discharge
1.2. Reverse flow of oil to 1st stage separator through min flow line. This may lead to overfilling and overpressurisation
1.2.1. Check valve provided on metering package outlet

CHALMERS, Product and Production Development, Master’s thesis 2011 99
Node: 3. Transfer of oil from 1st stage Three Phase Separator to Oil export line including Pig Launchers
Deviation Causes Consequences Safeguards Recommendations
1.3. Possible damage of metering facilities
1.3.1. Check valve provided on metering package outlet
2. Interconnection between test separator and 1st stage separator
2.1. Possible intermixing between the stream
56. Provide check valve on line from test separator at the tie-in point.
4. High Pressure
1. Refer No / Less Flow Cause 4, 7, 8, 9 and 11
2. External fire on pig launcher and receiver
2.1. High pressure on vessel leading to damage
2.1.1. PSV-1801 / 1802 provided on pig launcher and receiver respectively
3. External fire on pump area
3.1. Possible damage to pump 3.1.1. Water spray provided on pump area with manual intervention
4. Blocked condition of pipeline (aboveground)
4.1. High pressure on piping due to solar radiation
36. Review the effect of solar radiation on blocked condition and provide thermal safety valve if required.
5. Low Pressure
1. Refer No / Less Flow Cause 1 to 3
6. High Temperature
1. No issue identified
7. Low Temperature
1. Low ambient temperature
1.1. Possible blockage due to wax / asphalt in oil
1.1.1. Wax inhibitor and asphalt inhibitor injection provided at well outlet
37. Wax inhibitor and asphalt inhibitor to be oil based.

100 CHALMERS, Product and Production Development, Master’s thesis 2011
Node: 3. Transfer of oil from 1st stage Three Phase Separator to Oil export line including Pig Launchers
Deviation Causes Consequences Safeguards Recommendations
38. Wax and asphalt appearance temperature to be checked.
39. Provide TI on outlet of metering package with high and low alarm
8. High Level 1. Refer No / Less Flow Cause 1, 2, 4 and 5
9. Low Level 1. Refer More Flow Cause 1
10. Contamination/ Additional Phase
1. No issue identified
11. Composition change/ Loss of phase
1. No issue identified
12. Others - non normal operation
1. Maintenance of SDV-1604 and 1609
1.1. Difficult to do maintenance when production online
57. Provide isolation valve downstream of SDV-1604 and 1609 on 1st stage separator and test separator respectively.
13. Utility Failure
1. Instrument air failure
1.1. All control valve go to safe position
40. FV-1802 on export line to be of FC type.

CHALMERS, Product and Production Development, Master’s thesis 2011 101
Node: 3. Transfer of oil from 1st stage Three Phase Separator to Oil export line including Pig Launchers
Deviation Causes Consequences Safeguards Recommendations
2. Power failure - covered under No / Less Flow
14. Others 1. Underground pipeline
1.1. External corrosion of pipeline and possible damage
1.1.1. Pipeline coating and wrapping and cathodic protection considered

102 CHALMERS, Product and Production Development, Master’s thesis 2011
Node: 4. Transfer of water from 1st stage Three Phase Separator to Produced water flash vessel and recovered oil to closed drain header
Deviation Causes Consequences Safeguards Recommendations
1. No/ Less flow
1. LDIC-1601 malfunction and close LDV-1601 on water line from 1st stage separator
1.1. High interface level on separator and carryover of water to oil and possible carryover water / oil to gas line. Offspec oil production
1.1.1. LAHH-1602 provided on water side of separator with interlock ESD-2 to close ESDV-1601 and shut down
41. LDV-1601 on the water line from 1st separator to be suitable for sulphate and carbonate deposition.
2. SDV-1603 malfunction and close on water line from 1st stage separator
2.1. High interface level on separator and carryover of water to oil and possible carryover water / oil to gas line. Offspec oil production
2.1.1. LAHH-1602 provided on water side of separator with interlock ESD-2 to close ESDV-1601 and shut down
3. LIC-2901 malfunction and close LV-2901 on line from produced water flash vessel 29-V-101
3.1. High level in produced water flash vessel and possible carryover of liquid in flare header. No liquid to CPI package for treatment
3.1.1. LT-2910 with high high alarm provided on produced water flash vessel 29-V-101
4. LI-2905 malfunction and Recovered oil pump 29-P-101 not getting started or pump trip condition
4.1. Level in build up in recovered oil vessel 29-V-102 and possible carryover to flare header
42. Provide level transmitter on Recovered oil vessel 29-V-102 with low and high alarm.
43. Review the possibility of providing bypass on oil line from CPI package to closed drain header and burn pit.
5. Interruption in reverse demulsifier injection
5.1. Poor performance in CPI package and gas floatation package. This may lead to oil carryover in water
5.1.1. Reverse demulsifier injection pumps running indication available in DCS
45. Sampling point or online analyser to be considered on water line before disposal.
5.1.2. Standby pumps available

CHALMERS, Product and Production Development, Master’s thesis 2011 103
Node: 4. Transfer of water from 1st stage Three Phase Separator to Produced water flash vessel and recovered oil to closed drain header
Deviation Causes Consequences Safeguards Recommendations
2. More Flow 1. LDIC-1601 malfunction and open LDV-1601 fully on water line from 1st stage separator
1.1. Loss of level in 1st stage separator
1.1.1. LALL-1602 provided on water side of separator with interlock ESD-4 to close SDV-1603 on outlet line
1.2. Gas break through to Produced flash water vessel and possible damage
1.2.1. Vent line connected to flare header with LO valve and sized for gas breakthrough
1.3. Possible pressure build up in CPI package and recovered oil vessel during gas breakthrough condition
1.3.1. Vent line connected to flare header with LO valve from CPI package and recovered oil vessel and sized for gas breakthrough
44. Provide check valve on vent line on CPI package and recovered oil vessel.
1.4. Increase in liquid level on 29-V-101
1.4.1. LT-2910 and LT-2901 with high high level alarm provided on 29-V-101
2. LIC-2901 malfunction and open LV-2901 fully on line from produced water flash vessel 29-V-101
2.1. Overloading of CPI package leading to poor performance and possible carryover of oil in water
45. Sampling point or online analyser to be considered on water line before disposal.
46. Review the requirement of bypass on CPI package.
3. LI-2905 malfunction and Recovered oil pump 29-P-101 continue to run
3.1. Pump may subject to dry run and possible damage.
42. Provide level transmitter on Recovered oil vessel 29-V-102 with low and high alarm.
3. Reverse/Misdirected Flow
1. No issue identified

104 CHALMERS, Product and Production Development, Master’s thesis 2011
Node: 4. Transfer of water from 1st stage Three Phase Separator to Produced water flash vessel and recovered oil to closed drain header
Deviation Causes Consequences Safeguards Recommendations
4. High Pressure
1. Refer More Flow Cause 1
5. Low Pressure
1. No issue identified
6. High Temperature
1. No issue identified
7. Low Temperature
1. Low ambient temperature
1.1. Possible congeeling of water in piping
47. Review the temperature profile over a period of time (years) to decide the requirement of heater / tracing of lines.
8. High Level 1. No new issue
9. Low Level 1. No new issue
10. Contamination/ Additional Phase
1. No issue identified
11. Composition change/ Loss of phase
1. High quantity of oil in water
1.1. Poor separation in CPI package and oil escape along with water
1.1.1. Demulsifier injection provided at the inlet manifold
12. Others - non normal operation
1. No issue identified

CHALMERS, Product and Production Development, Master’s thesis 2011 105
Node: 4. Transfer of water from 1st stage Three Phase Separator to Produced water flash vessel and recovered oil to closed drain header
Deviation Causes Consequences Safeguards Recommendations
13. Utility Failure
1. Instrument air failure
1.1. Control valves go to fail safe position
14. Others 1. No issue identified