risk assessment for subsea gas pipeline to … · of the risk management process used by the based...
TRANSCRIPT
1
RISK ASSESSMENT FOR SUBSEA GAS PIPELINE TO MITIGATE THE POTENTIAL HAZARDS DUE TO THE IMPACT OF THE SINKING VESSELS USING DNV RP F107 STANDARD Name: Lepi Yamba NRP: 2505100179 Email: [email protected] or [email protected] Department: Industrial Engineering Supervisor 1: Arief Rahman, ST., M.Sc Supervisor 2: Ratna Sari Dewi.ST., MT
ABSTRACT Risk Assessment is a systematic approach in assessing hazards which provides an objective to measure the hazard and allows hazards to be prioritized and compared. Risk assessment is undertaken to determine the likelihood of injury or damage to be caused by the hazard. Physical unwanted hazards that cost millions of money and lives are likely to occur in any assets if the level of risk is not analyzed and assessed. Before safety can be implemented, the level of risk involved must be determined.
This final project has been carried out on the untrenched subsea gas pipeline owned by Amerada Hess Export Limited (Indonesia -Pangkah) at zone III.
The risk assessment was carried out for the impact of the sinking vessel on the pipeline under loose control conditions using DNV RP F 107. Event Tree Analysis (ETA) and DNV RP F107 were used as tools to determine the risk level. After the risk level has been known, three technical mitigation methods were designed and their material and installation costs were analyzed. The three technical methods include Submat Flexiform Concrete Mattress, U Type Pre-Cast and Massive Mess Pre-Cast Methods and U Type Pre-Cast Method was preferred best alternative forgone and applicable.
Keywords: Risk Assessment, DNV RP F107, Mitigation.
1.1 Background Amerada Hess is one of the companies
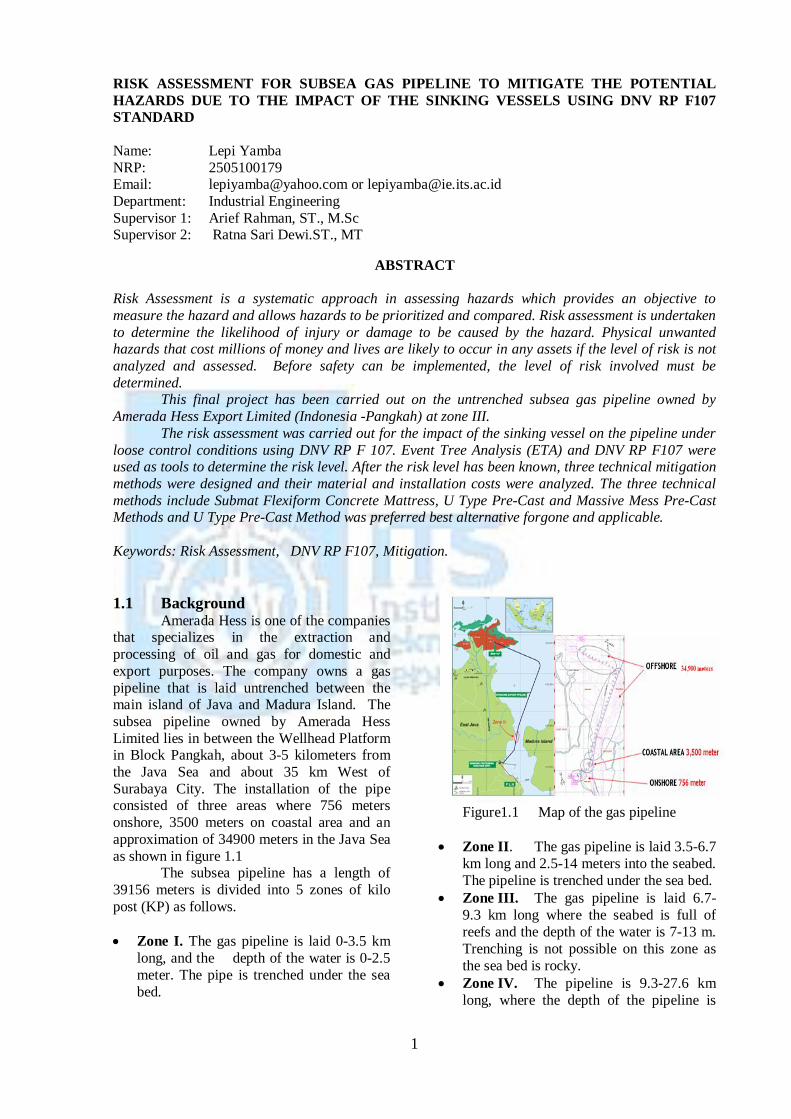
that specializes in the extraction and processing of oil and gas for domestic and export purposes. The company owns a gas pipeline that is laid untrenched between the main island of Java and Madura Island. The subsea pipeline owned by Amerada Hess Limited lies in between the Wellhead Platform in Block Pangkah, about 3-5 kilometers from the Java Sea and about 35 km West of Surabaya City. The installation of the pipe consisted of three areas where 756 meters onshore, 3500 meters on coastal area and an approximation of 34900 meters in the Java Sea as shown in figure 1.1
The subsea pipeline has a length of 39156 meters is divided into 5 zones of kilo post (KP) as follows.
Zone I. The gas pipeline is laid 0-3.5 km
long, and the depth of the water is 0-2.5 meter. The pipe is trenched under the sea bed.
Figure1.1 Map of the gas pipeline
Zone II. The gas pipeline is laid 3.5-6.7 km long and 2.5-14 meters into the seabed. The pipeline is trenched under the sea bed.
Zone III. The gas pipeline is laid 6.7- 9.3 km long where the seabed is full of reefs and the depth of the water is 7-13 m. Trenching is not possible on this zone as the sea bed is rocky.
Zone IV. The pipeline is 9.3-27.6 km long, where the depth of the pipeline is

2
about 5-16 m. The pipe is trenched under the sea bed.
Zone V. The pipeline is 27.6-38.4km and is located in the deep sea. The pipe is trenched under the sea bed.
According to the Indonesian Regulatory Laws (Nomor 300.K/38/M.pe/1997) regarding the Oil and Gas Pipeline Safety Regulation states that all subsea pipelines installed has to meet the following regulatory criteria in accordance with section 13 and section 15 of the pipeline regulations in Indonesia. Section 13
a. States that every subsea pipeline has to be laid 2 meters into the seabed in areas where the depth of the sea is less than 13 meters.
b. In conditions where the seabed is more than 13 meters deep, the pipeline has to be stabilized so that it does not move from side to side.
Section 15 In situations where the section 13 of the constitutions is not fulfilled, then risk assessment has to be carried out over the subsea pipeline so that safety precautions can be implemented.
Based on the Indonesian Regulatory
Laws (Nomor 300.K/38/M.pe/1997) regarding the Oil and Gas Pipeline Safety Regulation, this research is carried out to fulfill section 13 and section 15 of this constitution. 1.2 Problem Formulation
Sinking vessels can be hazardous over zone III of the subsea pipeline. The problem now is: a. How to estimate the incidental probability
of the sinking vessel on the pipeline due to the impact of sinking vessels under loose control conditions.
b. How to estimate the consequences of sinking vessels impact energy on the subsea pipeline.
c. Whether the risk level of the sinking vessel over the subsea pipeline is acceptable or not.
1.3 The Objectives In order to fulfill the existing Indonesian national laws concerning subsea gas and oil pipeline based on 300.K /38/M.pe/1997 to:
a) Assess the risk level on the gas-pipeline at zone III due to the impact of vessels sinking.
b) Implement a mitigate safety precaution measure over the untrenched subsea gas pipeline depending on the risk level to be identified.
c) Evaluate material and the installation costs involved in implementing safety mitigating precaution measures over the sub gas pipeline at zone III.
2.1 Literature Review
Risk assessment is a broad term that encompasses a variety of analytic techniques that are used in different situations, depending upon the nature of the hazard, the available data, and needs of decision makers (Ian Hawkins, 1998 and Frederick J, Barnard, 2005). The systematic application of management policies, procedures and practices to the task of communicating through establishing the context by identifying, analyzing, evaluating, treating, monitoring and reviewing as risk management process is all concerned about (AS/NZS 4360:2004). The AS/NZS standard clarifies what risk assessment is all about in its risk management process. The quoted figure 2.1 is an illustration of the risk management process used by the Australia and New Zealand standards.
According to David L.G (2005), OSD Energy Services (2004), S.F. (Steve) Biagiotti, and S.F. (Stephen) Gosse (2000), defined risk assessment as the process of quantifying or measuring the level of risk associated with the operation of an asset.
Risk Assessment can be done through both the quantitative and qualitative approaches based on experimental data and expert judgments.
The process of risk evaluation is to make decisions, based on the outcomes of risk analysis about which risks need treatment and treatment priorities. Risk evaluation involves comparing the level of risk found during the analysis process with the risk criteria when the context was established.
According to Fuller and Vassie, (2004), risk estimation is the identification of the outcomes of an event and an estimation of the magnitude and probability of these outcomes. Most risk experts connote that risk estimations based on qualitative based on experts judgments and opinions and quantitative predictions through numerical evaluations (American Society of Mechanical Engineers

3
(AMSE), American Petroleum Institute, and (API)).
Again, Fuller and Vassie, (2004) stated that risk estimation is the identification of the outcomes of an event and an estimation of the magnitude and probability of these outcomes.
To control the risk level requires a mitigation process by implementing a safety precaution technical measure to reduce or control the level of risk. Before mitigating risk, the need to evaluate the risk and the possible effects on the surrounding environment must be considered. If the level of risk is too high, any industries need to insure its properties that are vulnerable to the risky hazards to insurance companies apply or by applying a risk control mitigation process.
Figure 2.1Risk management process 2.2 Risk Assessment Techniques and Tools The tools used in this risk assessment include the following. 2.2.1 Event Tree Analysis (ETA) for Frequency Estimations
One of the widely used methods in risk assessment technique, used to evaluate the frequency of an event through event tree analysis, coded with codes that try to define the level of risk. ETA is a tool used to find the probability of risk posed by any hazard as shown in figure 2.2
2.2.2 Det Norske Veritas (DNV) RP F107 Standard
DNV RP F107 standard is a risk-based approach for assessing pipeline protection against accidental external loads. Recommendations are given for the damage capacity of pipelines and alternative protection measures and for assessment of damage frequency and consequence impacts. To measure the risk level, the need to determine the frequency and the energy impact on the pipeline using the DNV RP F107 Standard is required.
Figure 2.2 Even-tree analysis (ETA) used to calculate the probability
In assessing the risk level for any pipeline, the acceptance of the risk criteria will follow the methodologies outline in the DNV RP 107 as an international recognized standard.
To evaluate the consequence of an event, the impact energy on the subsea pipeline is evaluated using DNV RP F107 Standard. 4. DATA COLLECTION AND ANALYSIS 4.1 Vessel Data
The vessel data shown in table 4.1 below, includes the types of vessels and their descriptions, the routes taken, total weight of the vessel which includes the dead weight ton (DWT) and the light weight tone (LWT) of the vessel that will impact the pipeline upon sinking.
To estimate the incidental probability that will impact the pipeline, Even Tree Analysis (ETA) is used. ETA is used as a tool to estimate the incidental probability by combining the probability of three incidental conditions.

4
a. The probability of the vessel arriving at the untrenched Critical Accidental Damage Zone (CADZ) zone III, at loose control conditions.
b. The likeliness probability of the vessel sinking at the untrenched zone III, (CADZ zone) at loose control conditions.
c. The probability of each individual group vessels and sub group vessels will have on the pipeline during loose control conditions.
Table 4.1 Vessel Data
4.2 Vessel Dimensions
The type of vessels given in table 4.1 has the following dimensions in as shown in table 4.2 Table 4.2 Vessel Dimensions
4.3 Pipe Specification Data
The pipe specification data shown in table 4.3 includes the kilo post (KP), which is the distance of each segmented zone I-Vb of the subsea. The pipe’s cross-sectional diameter, its thickness and the coating thickness of the pipe as shown in table 4.3 are all given in millimeters. The coating density is given in kilogram per m3. The type of pipe used is in accordance with the American Petroleum Institute (API) 5L X65 Standard. This standard is specifically used for pipelines to be used under the subsea pipeline. Table 4.3 Pipe Specification Data
4.4 Segmentation of Zone III
Zone III with a kilo post (KP) of 9.3-6.7 kilometer, about 2600 meters in length has been segmented into 13 segments as shown in table 4.4 below. The KP given in kilometers has been segmented into a distance of 200 meters. Each segment is 200 meters is classified as the Critical Accidental Zone (CADZ). Table 4.4 Segmentation of zone III
4.5 CADZ Zone
The CADZ zone shown in figure 4.1, is the portion of the of the 2600 meter length

5
of zone III. The segmentation of CADZ zone is based on the average dimension of the vessel length. The CADZ area (200m pipeline x (2x the average length of the vessels +0.03m concrete thickness +0.457m diameter of pipe) is shown in figure 4.1.
Figure 4.1 CADZ zone 4.6 Grouping the Vessel Based on Weights Range
To calculate the probability of individual vessel arriving at CADZ zone, the 18 vessels given in table 4.1 have been grouped based on the similarities of weight range as shown in table 4.5.
Table 4.5 Probability of each vessel
4.7 Probability of the vessel groups and the sub vessel groups
To estimate the probability of the vessel groups that will arrive at untrenched pipeline at zone III can be evaluated as shown in table 4.6. From table 4.6, the sub vessel group with the highest weight for each group has been selected. These sub vessel groups include A8, B3, C, D2, E2, F and G. The sub vessel group A8, B3, C, D2, E2, F and G, has the highest weight.
Table 4.6 Probability of sub vessel group and the vessel group
4.8 Probability of Vessel Arriving in Critical Accidental Damage Zone (CADZ)
To calculate the probability of vessel arriving at CADZ, three scenarios have been taken into consideration. The first scenario is the consideration of the velocity in which the vessels is travelling equivalent to 5 knots, 7.5 knots and 10 knots. The second scenario to be considered is the loose control condition and the vessel arriving at the CADZ in loose control conditions as assumed to be 2.5%, 5% and 7.5%. And the third scenario is the probability of the vessel sinking considered to be 2.5%, 5% and 7.5%. This is in accordance with the Lloyd’s Register for ship dimensions 4.9 Incidental Probability
The probability that the vessel will arrive at the CADZ zone III can be calculated as shown in table 4.7. The scene in this scenario is that the vessel is travelling at a velocity of 5 knots, the vessel will arrive at CADZ zone is 2.5% and the likeliness of the vessel sinking is assumed to be 2.5% as well.
From the probability of vessel arriving at CADZ zone, the incidental probability can be calculated as shown in figure 4.2(a) and figure 4.2(b) using Even Tree Analysis (ETA). Figure 4.2 (a) shows the incidental probability sub group vessels and the figure 4.2 (b) shows the probability for group vessels.

6
Table 4.7 Probability of vessels arriving at CADZ zone
The incidental probability of the sub vessel group and the group vessel can be represented on Even Tree Analysis (ETA) as shown in figure 4.2 (a).
Figure 4.2 (a) ETA for 1st scenario of sub group vessels.
Figure 4.2 (b) ETA for 1st scenario of group vessels. The incidental probability of figure 4.2 (a) and figure 4.2 (b) is ranked as shown in table 4.8 as follows for both sub vessel group and group vessel. Table 4.8 Incidental Ranking probability
4.10 Consequency Estimation
To estimate the impact energy of the sinking vessel that will rupture the pipe due to its sinking impact requires the calculation of the kinetic energy. Most impacts are expected to result in a relatively smooth dent shape. The dent-absorbed energy relationship for steel pipelines can be calculated using equation stated in the DNV RP F107 standard. The dent percentages are stated in the DNV RP F107 standard for both coating and non-coating as follows. 4.11 Non Coating Resistive Energy of the
Pipe The normal energy of the pipe without
coating that can resist the impact of sinking vessels can be calculated as using equation 1 as follows.
2/32/12/1
....9
2.16
DD
TDmE P
… (1)
Where:
E Impact energy on the pipeline in joules (J)

7
Pm Plastic moment capacity of the wall (=2..
41 ry )
Pipe deformation, dent depth t Wall thickness (normal) y Yield strength D Steel outer diameter
At the dent percentage of 5%, the impact energy of the pipe can be calculated using equation 1 as follows. The Impact energy of the denting percentage of 1% to 22% can be calculated in the same way as shown in table 4.9 below.
1088.316)108.16(10448
..41
236
2
xxx
rm yp
kJjoules
xxx
xxxx
DD
TDmE P
42.51707.5170420
457.005.0457.0
108.16457.01088.316
914.3216
....9
2.16
2/32/1
3
2/1
2/32/12/1
Table 4.9 Impact energy at various denting percentages
DENT (%) E(Joule) E(kJ)
1 462456.48 462.46
2 1308024.46 1308.02
3 2402994.38 2402.99
4 3699651.87 3699.65
5 5170420.67 5170.42
6 6796694.48 6796.69
7 8564813.93 8564.81
8 10464195.70 10464.20
9 12486325.06 12486.33
10 14624158.07 14624.16
11 16871741.02 16871.74
12 19223955.02 19223.96
13 21676337.33 21676.34
14 24224952.05 24224.95
15 26866293.89 26866.29
16 29597214.95 29597.21
17 32414867.79 32414.87
18 35316660.48 35316.66
Continuation of table 4.9
DENT (%) E(Joule) E(kJ)
19 38300220.48 38300.22
20 41363365.36 41363.37
21 44504078.67 44504.08
22 47720489.93 47720.49
4.12 Coating Energy of the Pipe
As illustrated in figure 4.3, the impacting crushing energy of the pipe coating can be calculated using equation (2) as follows.
Figure 4.3 Impact on the concrete coating
0... XhbyE k ………… (2) Where:
26 /10105353 mNxMpaxEk
Kinetic energy
26 /10105353 mNxMpaxy
(Pressure of the pipe in N/m2) b. 24.48 m (With of the average
breath vessel that fractures the pipe) h 122.2 m (Length of the vessel)
0X 0.03m is the coating thickness of the pipe
kJjoules
xxxxXhbyE k
33.94231939423193325
03.02.1228.2410105
...6
0
The Impact energy of both coating and non-coating at denting percentage of 5%, 10%, 15% and 20% can be calculated in the same way as shown in table 4.10 below.

8
Table 4.10 Non coating and coating energy of the pipe
Dent (%) E(kJ) Non-Coating (kJ)
Energy Total (kJ)
1 9423193.33 462.46 9423655.78
2 9423193.33 1308.02 9424501.35
3 9423193.33 2402.99 9425596.32
4 9423193.33 3699.65 9426892.98
5 9423193.33 5170.42 9428363.75
6 9423193.33 6796.69 9429990.02
7 9423193.33 8564.81 9431758.14
8 9423193.33 10464.20 9433657.52
9 9423193.33 12486.33 9435679.65
10 9423193.33 14624.16 9437817.48
11 9423193.33 16871.74 9440065.07
12 9423193.33 19223.96 9442417.28
14 9423193.33 24224.95 9447418.28
15 9423193.33 26866.29 9450059.62
16 9423193.33 29597.21 9452790.54
17 9423193.33 32414.87 9455608.19
18 9423193.33 35316.66 9458509.99
19 9423193.33 38300.22 9461493.55
20 9423193.33 41363.37 9464556.69
21 9423193.33 44504.08 9467697.40
22 9423193.33 47720.49 9470913.81
From table 4.10, the non coating and coating energy ranged on the denting percentage between 0%-5%, 5-10%, 10-15%, 15-20% and the dent percentage greater than 20%. Table 4.11 shows the ranking of the categorical energy based on the impact energy category. Table 4.11 Consequency Ranking
4.13 Impact Energy of the Sinking Vessel on the Pipe
After the ranging the non-coating and coating energy of the pipe, the kinetic energy of the sinking vessel is calculated using
equation 3 and 4 respectively. The sinking velocity of the sinking vessel is calculated using equation 3.
2...21.. tDwaterwater VACgVm …… (3)
m Mass of the sinking vessel (kg) g Gravitational acceleration, (9, 81
m/s2) V Volume of the vessel (m3),
where the density of steel is 7850 kg/m3/ by the mass of vessel
water Density of sea water (i.e. 1025 kg/m3)
DC 1.5 Drag coefficient of the object A Projected area of the object in the
flow direction (m2) L x B of the vessel
2tV Terminal velocity through the
water (m/s)
For Example for the vessel type PFS = 2500000 kg/7850 kg/m3 = 318.4713m3, (see table 4.12).
smV
xVmxxmkgx
smxmkgxm
VACgVm
t
t
tDwaterwater
/38.2398
96.20883.1/102521
/81.9)/1025)417.3182500000((
...21..
223
233
2
The sinking velocity for the vessel
type PFS can be calculated using this formular as shown above. Likewise, the sinking velocity for other vessels can also be calculates in the same way and the results are shown in table 4.12 below.

9
Table 4.12 Sinking velocity of each vessel
The kinetic EE energy of the sinking vessel can be calculated using the formular 4 as follows. For the vessel type PFS can be calculated as follows.
2.21
taATE VmmEEE
. (4) Where: am Is the added mass (kg) found
by:
kgmxxmkg
VCm awatera
121.3264434713.3181/1025 33
(See table 4.13)
m Total weight of ship g Gravitational force (9.81m/s2) v Volume of ship (m2) water = density of the sea water, 1025
kg/m3 Ca = coefficient of the area (m3) A = projection of the area, m2 Vt = velocity of the vessel sinking, m/s2
Table 4.13 Hydrodynamic mass of the sinking vessel in water
No Pwater Ca V ma
1 1025 1 318.47 326433.12
2 1025 1 955.41 979299.36
3 1025 1 2388.54 2448248.4
4 1025 1 159.24 163216.56
5 1025 1 2388.54 2448248.4
6 1025 1 5573.25 5712579.6
7 1025 1 1592.36 1632165.6
8 1025 1 4777.07 4896496.8
9 1025 1 5573.25 5712579.6
10 1025 1 11146.5 11425159
11 1025 1 3184.71 3264331.2
12 1025 1 4777.07 4896496.8
13 1025 1 0.01 8.16
14 1025 1 15.92 16321.66
15 1025 1 31.85 32643.31
16 1025 1 15.92 16321.66
17 1025 1 14331.21 14689490
18 1025 1 159.24 163216.56
The kinetic energy of the sinking vessel can then be ranked accordingly in accordance with the denting percentage ranking of DNV RP F107 as shown in table 4.14 below Table 4.14 Kinetic energy of the vessel and their ranking

10
Based on the calculation of summarized incidental probability rank values of table 4.14 of the sub group vessels and the vessel groups rank values are plotted for both coating and non-coating given as shown in table 4.14. After the plotting, the risk level can be seen table 4.15(a) for sub group vessel and table 4.15(b) under non costing conditions of the pipeline for group vessels respectively. Table 4.15(a) Risk matrix plot for the sub group vessel at non coating conditions
Risk Matrix Plotting for Sub Group Vessels
Frequency Degree
1st Scenario
Consequency Degree
1 2 3 4 5
1 A8,B3, C, E2,D2,F,G
2
3
4
5
Table 4.15 (b) Risk matrix plot for the group vessel at non coating conditions
Vessel group
Risk Matrix Plotting for Group Vessels
Frequency Degree
1st Scenario
Consequency Degree
1 2 3 4 5
1 A,B,C,D,E,F,G
2
3
4
5
And the risk level at the condition
where the pipe is coated is show at table 4.16(a) for sub group vessels and 4.16(b) for group vessels. Table 4.16(a) Risk matrix plot for the sub group vessel at coating conditions
Risk Matrix Plotting for Sub Group Vessels
Frequency Degree
1st Scenario
Consequency Degree
1 2 3 4 5
1 A8,B3, C, E2,D2,F,G
2
3
4
5
Table 4.16(b) Risk matrix plot for the group vessel at coating conditions
Vessel group
Risk Matrix Plotting for Group Vessels
Frequency Degree
1st Scenario
Consequency Degree
1 2 3 4 5
1 A,B,C,D,E,F,G
2
3
4
5
4.14 Risk Matrix Analysis
From the risk matrix plot in table 4.15 (a), under non coating condition of the pipe, the sub group vessels A8, B3, D2, F,G and C falls in the medium risk level
From the risk matrix plot in table 4.15(b), under non coating condition of the pipe, the group vessel A, B, C, D, E, F and G falls in the medium risk level
For the coating condition of the pipe, the sub group vessels have the same risk level as the group vessels. From the risk matrix plot in table 4.16 (a), where the condition of the pipeline is coated, the sub group vessels A8, B3, D2, E2,F and G falls in the medium risk level.
From the risk matrix plot in table 4.16 (b) and where the condition of the pipeline is coated, the group vessels A, B, C, D, E, F and G medium risk level. 5 Risk Mitigation Process
After the risk level being identified, mitigating such medium risk level is significantly important. The only way of reducing the risk level is through:
Reducing the incidental probability by reducing the annual frequency of the number of vessels crossing over the subsea gas pipeline at zone III.
Reducing consequence impact on the subsea pipeline. This can be done through the application of protective pipeline covers that shields the untrenched pipeline from the impact of the sinking vessels as well as dropped objects over zone III of the untrenched subsea gas pipeline at zone III.

11
Risk retention to third parties such as insurance companies. However, this cannot reduce the risk level being identified. Risk retention is to compensate for the damages that will occur if such accidents occur.
5.1 Technical Mitigation Process To mitigate the medium risk level of the sinking vessels impact on the subsea pipeline, three technical mitigation pipe shield protective covering methods were taken into consideration to mitigate medium risk level. The pipe shield protective cover includes the Submat Flexiform Concrete Method, U Type Pre-Cast Method and Massive Mess Pre-Cast Method as shown figures 5.1 for Submat Flexiform Concrete Method, figure 5.2 for U Type Pre-Cast Method and figure 5.3 for Massive Mess Pre-Cast Method.
Figures 5.1 for Submat Flexiform Concrete Method
Figure 5.2 for U Type Pre-Cast Method
Figure 5.3 for Massive Mess Pre-Cast Method
The total material and the installation cost can be calculated as shown in table 5.1. Table 5.1 shows the estimated material and installation costs for the three types of mitigation process methods analyzed in this final project as follows. Table 5.1 Overall materials and installation cost
CONCLUSION AND SUGGESTIONS 6.1 Conclusion
a. The potential risk to be caused by sinking vessels on the subsea pipeline for Amerada Hess at zone III is a medium risk level. The risk level is categorized as medium risk level due to the potential impact of the sinking vessels can be a major treat in rupturing the subsea pipeline and can only be accepted with a technical mitigation process applied. As such, to protect the pipeline from the medium risk level, Amerada Hess is required to shield the untrenched pipeline using the U-Type Pre-Cast method or any other pipe protective precautions that can resist the weight of the sinking vessels impact from hitting the pipeline.
b. From the frequency estimations, the results of the incidental probability from the combination of the three factors where: - The velocity of the vessel at 5
knots, 7.5 knots and 10 knots - The percentages used for the vessel
loose control conditions and

12
arriving at the CADZ are at 2.5%, 5% and 7.5% in accordance with Lloyds’ registry number
- The percentage probability of the vessel sinking to be 2.5%, 5% and 7.5% in accordance with Lloyds’ registry number.
c. For the Consequency Estimation, the
ranking consequency of the vessels all falls at ranking of 5. Acceptation for vessels with small weights. As the weight of the vessel increases the impact energy of such vessels sinking hitting the subsea pipeline is very high and at a point of rupturing the pipeline. As such, the outcome of the vessel sinking and hitting the pipeline can result in leakages and the complete rupture of the pipeline at zone III.
d. The estimated material and installation cost for the Submat Flexiform Concrete Mattress Method is $2,272,692.14 (Rp 22,726,921,433.33), U Type Pre-Cast Method at $3,497,112.34 (Rp 34,971,123,392.48) and Massive Mess Pre-Cast Method at $4,478,917.67 (Rp44, 789,176,719.54).
e. Comparing the three types of methods the most preferred type is the U Type Pre-Cast Method.
6.2 Suggestions Several Suggestions that can be taken
into account from this final project are as follows:
a. There is a need to calculate the incidental probability of individual of the different types of vessels crossing over the subsea pipeline at zone III due to the changes in the annual frequency of the vessels crossing over the pipeline in the future.
b. Re-evaluate the consequency again as there might be vessels with greater weights passing through apart from the types of vessels stated in this final project.
c. The re-design of a better technical mitigation process that is more reliable and cost effective if the Submat Flexiform Concrete Mattress, U Type Pre-Cast and the Massive Mess Pre-Cast Methods are considered expensive based on material and cost analysis and reliability performance of the design.
d. The need to estimate the reliability and maintenance cost of the U Type Pre-Cast method on timely basis to maintain the safety of the pipeline during the long run of the supply of the gas.
REFERENCES
Books
1. David L. Goetsch (2005). “Occupational Health and Safety for Technologists, Engineers and Managers”, Prentice Hall, 5th Edition.
2. Collin W. Fuller and Luise H. Vassie (2004), “HEALTH AND SAFETY MANAGEMENT”; Principles and Best Practice, Prentice Hall,
3. Hiromitsu Kumamoto & Ernest J.Henley, “Probabilistic Risk Assessment and Management for Engineers and Scientists”, 2nd Edition, IEEE Press.
Journals 1. C. Clausand, Pipeline Integrity Management Strategy for Aging Off Shore Pipelines, MACAW
Engineering Limited, Wallsend, UK. 2. OSD Energy Services (2004), Preliminary Risk Assessment in Accordance with AS 2885 for the
Trans Territory Pipeline, Level 9, Toowong Tower QLD, 4066. 3. Nord Stream Espoo Report (2009), Nord Stream Environemntal Impact Assessment
Documentation for Consulatation under the Espoo Convention, Maritime Safety. 4. S.F Biagiotti and S.F Gosse, Formalizing Pipeline Integrity with Risk Assessment Methods and
Tools, International Pipeline Conference, Vol 1, ASME 2000.

13
5. Frederick J, Barnard (2005), An Integrated Health, Safety and Environmental Risk Assessment Model for the South African Global System Mobile Telecommunications (GSM), University of South Africa.
6. Hawkins (1998): Risk Analysis Techniques, A rent Quant Research Paper

14