risk army guidance
TRANSCRIPT

8/18/2019 Risk Army Guidance
http://slidepdf.com/reader/full/risk-army-guidance 1/74
Directory of Expertise for Civil Works
Cost Engineering
COST AND SCHEDULE RISK ANALYSIS
GUIDANCE
17 May 2009

8/18/2019 Risk Army Guidance
http://slidepdf.com/reader/full/risk-army-guidance 2/74
i
Table of Contents
1. PURPOSE................................................................................................................1
2. APPLICABILITY ......................................................................................................1
3.
DISTRIBUTION STATEMENT................................................................................. 1
4.
REFERENCES......................................................................................................... 1
5.
GUIDANCE ..............................................................................................................2
6.
CSRA OVERVIEW...................................................................................................3
7.
RESPONSIBILITIES ................................................................................................5
7.1 Project Manager............................................................................................... 5
7.2 Cost Engineer/Risk Analyst.............................................................................. 5
7.3 Project Delivery Team...................................................................................... 5
8.
DOCUMENTS REQUIRED FOR A CSRA ...............................................................6
9.
STARTING THE CSRA PROCESS .........................................................................6
9.1 CSRA Determination........................................................................................ 8
9.2 Initial CSRA Preparations................................................................................. 8
9.3 Initial Risk Discussions..................................................................................... 8
9.3.1 PDT Coordination.................................................................................... 9
9.3.2 CSRA Presentation................................................................................. 9
9.3.3 Project Scope Presentation.....................................................................9
9.3.4 PDT Brainstorming Session ....................................................................9
9.3.5 Completing Initial Risk Register ..............................................................9
10.
ESTIMATE AND SCHEDULE ATR .......................................................................10
11.
MARKET RESEARCH...........................................................................................11
12. RISK REGISTER COMPLETION...........................................................................11
12.1 Cost Impacts and Distribution ........................................................................12
12.2 Schedule Impacts and Distribution.................................................................12
12.3 Correlations.................................................................................................... 12
12.4 Risk Register Quality Control Check ..............................................................12
13. COST RISK MODEL DEVELOPMENT..................................................................12
13.1 Cost Risk Model Template ............................................................................. 13
13.1.1
Methods............................................................................................... 13 13.1.2 Establishing the Risk Events for Study................................................19
13.1.3 Incorporating Market Research into Model..........................................19
13.1.4 Establishing Variance Distribution .......................................................19
13.1.5 Most Likely Cost Value........................................................................21
13.2 Cost Risk Model Run...................................................................................... 21
13.2.1 Initial Model Run.................................................................................. 21
13.2.2 Model Results Quality Check...............................................................21

8/18/2019 Risk Army Guidance
http://slidepdf.com/reader/full/risk-army-guidance 3/74
ii
Table of Contents (Continued)
13. COST RISK MODEL DEVELOPMENT (CONT.)13.3 Cost Risk Model Output ................................................................................. 22
13.3.1 Sensitivity Chart................................................................................... 22
13.3.2
Total Project Contingency Analysis .....................................................23
14. SCHEDULE RISK MODEL DEVELOPMENT........................................................26
14.1 Schedule Risk Model Template......................................................................27
14.1.1 Methods............................................................................................... 27
14.1.2 Establishing the Risk Events for Study................................................31
14.1.3 Incorporating Market Research into Model..........................................31
14.1.4 Establishing Variance Distribution .......................................................31
14.1.5 Most Likely Duration Value..................................................................33
14.2 Schedule Risk Model Run.............................................................................. 34
14.2.1 Initial Model Run.................................................................................. 34
14.2.2 Model Results Quality Check...............................................................34
14.3
Schedule Risk Model Output.......................................................................... 34
14.3.1 Sensitivity Chart................................................................................... 35
14.3.2 Total Project Contingency Analysis .....................................................35
14.4 Schedule Risk Conversion to Contingency ....................................................36
15. TOTAL PROJECT COST SUMMARY ...................................................................37
16. REPORTS..............................................................................................................37
17. CONCLUSION .......................................................................................................38
List o f Tables
Table 1. Sample Cost Risk Model ................................................................................ 15 Table 2. Contingency Analysis Output for Cost............................................................24
Table 3. Sample Schedule Risk Model.........................................................................29
Table 4. Contingency Analysis Output for Total Project Schedule ...............................36
List of FiguresFigure 1. Project Evolution Over Time............................................................................4
Figure 2. CSRA Flow Chart............................................................................................7
Figure 3. Example of Triangular Distribution ................................................................20
Figure 4. Example of Uniform Distribution....................................................................20
Figure 5. Sensitivity Chart for Cost...............................................................................23
Figure 6. Total Project Cost Contingency Analysis ......................................................25 Figure 7. Cumulative Frequency View..........................................................................26
Figure 8. Example 1 of Triangular Distribution .............................................................32
Figure 9. Example 2 of Triangular Distribution .............................................................32
Figure 10. Example of Uniform Distribution..................................................................33
Figure 11. Sensitivity Chart for Schedule .....................................................................35
Figure 12. Total Project Cost Summary .......................................................................37

8/18/2019 Risk Army Guidance
http://slidepdf.com/reader/full/risk-army-guidance 4/74
iii
Table of Contents (Continued)
List of Appendixes Appendix A PDT Risk Checklist Appendix B Sample Risk Registers
Appendix C Sample Risk Analysis Report

8/18/2019 Risk Army Guidance
http://slidepdf.com/reader/full/risk-army-guidance 5/74
1
COST AND SCHEDULE RISK ANALYSIS GUIDANCE
1. PURPOSE
The purpose of this document is to provide the guidance and processes recommended
to perform an acceptable cost and schedule risk analysis (CSRA) that meetsHeadquarters (HQ), U.S. Army Corps of Engineers (USACE), requirements andsuccessfully passes an agency technical review (ATR). This document was preparedby the USACE Cost Engineering Directory of Expertise (DX). The DX provides costengineering guidance, performs CSRAs, ATRs, and has available both large and smallbusiness indefinite delivery, indefinite quantity (IDIQ) cost engineering contracts servingthe USACE at a national level.
HQ mandates the CSRA requirement to enforce improvements in establishing the costand schedule risk and resulting contingencies that are used within the calculation of theTotal Project Cost (TPC). The CSRA is part of the greater emphasis to produce quality
TPCs.
This document is not meant to serve as the risk management process. The CSRA is just a portion of a risk management strategy and should not be mistaken as theprocess. The CSRA is a management tool that supports the risk management process.During the course of project execution, the prudent project manager (PM) may chooseto monitor and update the CSRA as the project evolves and risks change, regardless ofthe mandated requirements.
Many informational sources are available and recommended for the PM and the projectdelivery team (PDT). Among these sources is the Project Management Body of
Knowledge (PMBoK) published by the Project Management Institute (PMI).
2. APPLICABILITY
This guidance applies to all HQ USACE decision documents prepared forCongressional authorization and appropriation for any project where the total projectcost exceeds $40 million. It also applies to any funding document prepared where HQUSACE, Division offices, or upper management has made a request for a CSRA tosupport the project.
3. DISTRIBUTION STATEMENT
Approved for public release; distribution is unlimited.
4. REFERENCES
• Engineer Regulation (ER) 1110-2-1150, Engineering and Design for Civil WorksProjects.
• ER 1110-2-1302, Civil Works Cost Engineering.• Engineer Circular (EC) 1105-2-410, Review of Decision Documents.

8/18/2019 Risk Army Guidance
http://slidepdf.com/reader/full/risk-army-guidance 6/74
2
• Engineer Technical Letter (ETL) 1110-2-573, Construction Cost EstimatingGuide for Civil Works.
• Engineer Circular Bulletin (ECB) 2007-17, Application of Cost Risk AnalysisMethods to Develop Contingencies for Civil Works Total Project Costs, dated 10Sep 2007.
• CECW-CE Memorandum, dated 3 Jul 2007 by Major General Riley.• CECW-CP Memorandum, dated 19 Sep 2007, Initiatives to Improve Accuracy of
Total Project Costs in Civil Works Feasibility Studies Requiring Congressional Authorization.
• PMBoK Guide, published by PMI.
5. GUIDANCE
In accordance with ECB No. 2007-17, dated 10 September 2007, "Cost risk analysismethods will be used for the development of contingency for the Civil Works TotalProject Cost estimate. It is the process of identifying and measuring the cost andschedule impact of project uncertainties on the estimated total project cost. When
considerable uncertainties are identified, cost risk analysis can establish the areas ofhigh cost uncertainty and the probability that the estimated project cost will or will not beexceeded. This gives the management team an effective additional tool to assist in thedecision making process associated with project planning and design."
The ECB further states, "A formal cost risk analysis shall be prepared for all decisiondocuments requiring congressional authorization for projects exceeding forty milliondollars. This applies to USACE commands having design and/or constructionresponsibilities for Civil Works."
The ECB continues by assigning the cost engineer the responsibility for conducting the
CSRA for development of project contingencies. The Project Delivery Team (PDT) shallassist the cost engineer in establishing project contingencies by identifying risks andtheir potential impacts to cost and schedule. Crystal Ball software shall be used toconduct the CSRA.
Memorandum CECW-CE (1110), dated 3 July 2007, from Major General Don T. Riley"...directs the use of specific cost risk analysis methods for the development ofcontingency on Civil Works Total Project Cost. This is applicable for all decisiondocuments requiring Congressional authorization for projects exceeding $40 million."
HQ’s intention is that any document going forward to Congress requesting fundingrequires a formal risk analysis if the Total Project Cost is greater than $40 million. Forconsistency in software usage, HQ mandates the use of Crystal Ball software to performthe CSRAs.
There are several recent HQ documents that have been updated to address this newrequirement. Other regulations are currently under revision:
• EC 1105-2-410, Review of Decision Documents, dated 1 Jul 2008.• ER 1110-2-1150, Engineering and Design for Civil Works Projects.

8/18/2019 Risk Army Guidance
http://slidepdf.com/reader/full/risk-army-guidance 7/74
3
• ER 1110-2-1302, Civil Works Cost Engineering, dated 15 Sep 2008.• ETL 1110-2-573, Construction Cost Estimating Guide for Civil Works, dated 30
Sep 2008.
In general, the “decision document” (as referenced in ECB No. 2007-17) typically occursat the feasibility stage of the design process, following the reconnaissance phase. The
feasibility phase includes further investigations and studies of various alternatives todetermine whether a Federal project can and should solve the identified problem. Therecommended solution is then sent forward to Congress with an authorization andfunding request (ER 1110-2-1150), while a CSRA is mandatory for the “decisiondocument” for project estimates above $40 million.
While HQ requires a CSRA at feasibility level or for Congressional reports and decisiondocuments, the initial risk discussions can begin much earlier, and it is recommendedthat the process continue throughout the project life. HQ recommends a continuationthrough project completion as a prudent project risk management tool. This isespecially important on large projects over extended years where project scope, costs,
and risks have a greater chance of design change and evolving risks.
6. CSRA OVERVIEW
The goal of risk management is to identify project risks and develop strategies tomanage those risks. In that process of managing and mitigating risks, there are likelyproject opportunities and benefits that are realized. Four main building blocks of the riskmanagement process are identification, assessment, response, anddocumentation. The CSRA process addresses the “identification” and “assessment”portions of the risk management process. The activities of “response” and“documentation” are PM and PDT management efforts to mitigate, monitor, and
manage the risks throughout the life of the project. On larger projects over extendedyears, industry chooses to continue the risk analysis process, recognizing that as theproject evolves and risks are mitigated, new risks may become apparent. The CSRAprocess is a tool used to study the new risk potentials throughout the project life.
The CSRA identification and assessment portions focus on the total project. Theoutcome identifies the more critical risks to the project cost and schedule and assists inestablishing contingencies to manage the project to completion. In figure 1, note thepoint estimate change and growth over time and scope development. The figureillustrates a common project evolution whereby the final cost is beyond the originallydeveloped scope and the budgeted total project cost estimates. For this reason, it isimportant to begin this process early in project development so that the risks determinedover time can be managed, planned for and mitigated as much as practical to remainwithin the appropriated budget. It is critical that the CSRA be performed on the bestknown confident scope available with the most likely cost estimate and schedule;otherwise, the contingencies developed from the CSRA may be too low and unable tocapture the funding needed as the project scope is further developed.

8/18/2019 Risk Army Guidance
http://slidepdf.com/reader/full/risk-army-guidance 8/74
4
Figure 1. Project Evolution Over Time
The CSRA is the process of determining the risks associated with the studied project.The CSRA attempts to quantify potential value variance of the risks as related to theproject cost and schedule. The results are expressed as contingency amounts in theform of dollars and time with reflective confidence levels for successful execution. It is aformal documented process that includes PDT involvement, utilizing nationallyrecognized Crystal Ball software based on the Monte Carlo principles.
To meet HQ requirements, a CSRA must be performed on the total project cost,
including all features of the project, but excluding escalation and contingency. Whenconsidering total project features, refer to the USACE Civil Works Work BreakdownStructure (CWWBS) that is required for funds management (ER 1110-2-1302).
Appendix A includes the higher level CWWBS). Too often, risk studies focus on just theconstruction activities, which can result in critical risk elements remaining unidentifiedand unmanaged. Through early determination of potential project risks, managementcan then focus efforts to mitigate those risks and realize opportunities for cost andschedule savings.
As directed in ECB 2007-17, a formal risk analysis must be accomplished as a jointanalysis between the PM, the cost engineer, and the PDT members that have specific
knowledge and expertise on all possible project risks for all features and internal risksas well as external risks. Internal risks are those related specifically to the project,many within the control of the PDT. External risks are those outside forces that canimpact the project with little PDT control. The advantages to performing risk analyseson the more significant projects include:
• Involving PDT to share risk concerns and communicate as a team.• Establishing contingencies supported by PDT involvement and studies.
Risk Contingency
Concept Design Contract Award
$
Total ProjectCost
Base Cost Estimates
ConstructionCompletion

8/18/2019 Risk Army Guidance
http://slidepdf.com/reader/full/risk-army-guidance 9/74
5
• Defining and targeting high risk areas for management and mitigation.• Possibly realizing cost and schedule opportunities similar to value engineering
processes.
7. RESPONSIBILITIES
7.1 Project Manager
The responsibility to adhere to the CSRA process lies predominantly with the projectmanager (PM) that leads the project. The PM responsibilities include:
• Determining the need for a CSRA based on regulation requirements and/or whatis reasonable for a healthy project execution.
• Developing a project management plan (PMP) that addresses risk management,the CSRA requirements and its execution.
• Supporting the CSRA process related to budgeting, scheduling, and teamformulation to accomplish the CSRA.
• Identifying risk mitigation areas.• Assisting management in establishing the contingency level based on the CSRA
confidence curves.• Monitoring and managing recognized risk items that may impact successful
execution of the budget and schedule.• Evaluating the need for follow-on CSRAs.
The PM can also serve as the CSRA meeting facilitator; however, it is recommended asenior cost engineer or a seasoned risk analyst perform this function. A confidentfacilitator, knowledgeable with the type of project work, is needed to actively engageand encourage communication amongst the PDT.
7.2 Cost Engineer/Risk Analyst
The cost engineering office is tasked to perform the CSRA as well as present the finalreport within the cost engineering appendix. In support of the CSRA, the cost engineerwill likely lead the market research that supports the CSRA.
A senior cost engineer is typically assigned the role as the risk analyst and many timesserves as a meeting facilitator to lead the PDT through the CSRA process, i.e., PDTdiscussions to develop the initial risk register and establish the resulting CSRAconclusions. Cost engineering personnel are trained in the CSRA process and havebeen provided the Crystal Ball licensed software, which is administered by the CostEngineering Branch located at USACE, Huntsville District.
7.3 Project Delivery Team
The PDT, in support of the CSRA process, should involve all major members that haveknowledge of the specific project and critical responsibility for development andmanagement of the total project and all project features. The CSRA is to be performed

8/18/2019 Risk Army Guidance
http://slidepdf.com/reader/full/risk-army-guidance 10/74
6
on total project costs, not just construction costs. Typical PDT representatives involvedwith a CSRA are from the following:
• Project and planning management.• Contracting and acquisition.• Real estate and relocations.• Environmental.• Technical design.• Estimators and schedulers.• Risk Analyst/Facilitator.• Construction.• Operations.• Sponsors.• Others with critical input.
8. DOCUMENTS REQUIRED FOR A CSRA
The starting documents recommended for beginning a CSRA include:
• Well-developed project scope.• Quality estimate excluding contingency and escalation.• Schedule reflecting the estimate.• Expended project costs and durations.• This guidance document.*• Crystal Ball software used to run a CSRA.• Risk presentation to educate the PDT.*• PDT risk checklist presenting typical risks considered.*•
Sample risk register.*• Sample cost and schedule risk templates/models.• Sample report of the process, outcome, and recommendations.
*These documents are maintained by the Cost Engineering Directory of Expertise (DX)at USACE, Walla Walla District. Note that this is the same DX charged with maintainingthe Construction Equipment Ownership and Operating Expense Schedule (EP 1110-1-8) and the Construction Cost Indices for Civil Works Projects (EM 1110-2-1304).
The DX maintains a web site where this guidance and sample documents can beobtained by USACE and contractors.
http://www.nww.usace.army.mil/html/OFFICES/Ed/C/default.htm
9. STARTING THE CSRA PROCESS
The main building blocks of the risk management process include accomplishing aCSRA. Figure 2 illustrates the cost and schedule risk analysis process. Note theseparation of the cost and schedule processes, since each requires a separateanalysis.

8/18/2019 Risk Army Guidance
http://slidepdf.com/reader/full/risk-army-guidance 11/74
7
Figure 2. CSRA Flow Chart

8/18/2019 Risk Army Guidance
http://slidepdf.com/reader/full/risk-army-guidance 12/74
8
9.1 CSRA Determination
CSRA is recommended for all projects that are large, complex, have high visibility orcritical funding constraints. CSRA are required for certain projects. Based on HQguidance, the PM must determine whether a CSRA is required or prudent for theproject. The PM may consult the current USACE regulations and guidance or HQ. As arule, well-defined scope is the critical element that then establishes the current costestimates, and schedules. The poorer these products, the greater the risks andresulting contingencies. As scope is improved and more confident designs aredeveloped, contingencies normally decrease.
The risk management process should be included within the PMP, which should includethe four main risk management building blocks: identification, assessment, response,and documentation.
9.2 Initial CSRA Preparations
The PM should ensure an adequate total project cost estimate and reflective schedulehas been prepared to support the CSRA process. The total project scope must bereflected within the two products. ER 1110-2-1150, ER 1110-2-1302, and ETL 1110-2-573 provide further guidance related to the expected quality level.
The PM must establish the PDT. The PDT is comprised of senior members withknowledge of the project scope as well as the associated potential risks, opportunities,and unknowns.
The PM must determine what project costs and durations have already been expended,
since these should not be part of the CSRA.In preparation for the initial PDT risk discussions that prepare the first risk register (thedocument used to support the CSRA), it is recommended that the PM distribute to thePDT a list of potential risks that are commonly encountered. A PDT risk checklist isavailable on the Cost Engineering DX web site. The checklist is a compilation ofcommon risks encountered by USACE, DOE, and state Departments of Transportation.
After reviewing the checklist, the PDT members will be better prepared to present theirrisk concerns at the PDT brainstorming meeting where the risks are discussed andcaptured within the initial risk register (the document used to support the CSRA).
9.3 Initial Risk Discussions
The PDT brainstorming session is the initial attempt to develop the risk register thatserves as the basis for the CSRA. In order to prepare the initial risk register supportingthe CSRA, certain coordination steps are recommended. These recommendations arebased on experience in performing CSRAs within the USACE environment.

8/18/2019 Risk Army Guidance
http://slidepdf.com/reader/full/risk-army-guidance 13/74
9
9.3.1 PDT Coordination
The PM will coordinate an initial risk discussion meeting, also referred to as a PDTbrainstorming session. This is the first meeting where the PDT attempts to collectivelycapture the total project risks and place them into the risk register. It is highly
recommended that the brainstorming session include the major PDT members, becausethe dialogue between the members typically results in scope clarification or change,findings of new risks, even possibly revising the estimates and the schedules. It is alsothe best opportunity to address all features of the project.
9.3.2 CSRA Presentation
To begin the PDT brainstorming session, it is recommended that the designatedfacilitator begin with a CSRA presentation. A confident facilitator, knowledgeable withthe type of work, is needed to actively engage and encourage discussion andcommunication amongst the PDT. Like a value engineering study, all concerns arevalid, considered, and captured within the risk register. The Cost Engineering DX has a
CSRA slide show presentation available on its web site.
9.3.3 Project Scope Presentation
Following the CSRA presentation, it is highly recommended that the PM present theproject scope. This presentation will lead the PDT into risk discussions. Thepresentation should include the major construction features.
9.3.4 PDT Brainstorming Session
The PDT brainstorming session is the opportunity to bring the PDT together to
qualitatively define the risk concerns as well as potential opportunities. To lead the PDTthrough the discussions, an effective approach is to simply work down the PDT riskchecklist. This ensures that the each major PDT member is given equal opportunity toaddress their concerns. As the concerns are discussed, the facilitator or risk analystbegins developing the initial risk register that supports the CSRA, capturing the PDT’sconcerns and discussions. This session can result in revised estimates and schedules.
9.3.5 Completing Initial Risk Register
The recommended software for risk registers is Excel (a sample risk register in Excel isavailable on the DX website). The risk register will serve as the basis for the CSRAmodel, which is run in Crystal Ball. Crystal Ball software utilizes Excel in its CSRA
application. When referring to the risk register, the PDT should simply focus on thefollowing columns:
• Risk/Opportunity – Event.• PDT Event Concerns.• PDT Discussions.• Responsibility/POC.

8/18/2019 Risk Army Guidance
http://slidepdf.com/reader/full/risk-army-guidance 14/74
10
• Project Cost: Likelihood, Impact, and Risk Level.• Project Schedule: Likelihood, Impact, and Risk Level.
The remaining risk register columns will be completed by the risk analyst during themarket research and the CSRA model development. A PDT risk register is provided in
appendix A and sample risk registers are provided in appendix B.
The PDT should capture all concerns for all project features even if the risk level isconsidered low. The register serves as an archive of discussions and there is potentialthat those low-level risks may become higher following market studies, more informationmade available, or through time during the risk management and mitigation processes.
Within the risk register, the PDT concerns and discussions must be adequately andclearly captured, because the logic presented in those discussions must support the“likelihood” and “impact” decisions reflected within the risk register. While this product isthe initial risk register, it has already captured the PDT’s greater concerns. The PDTcan begin using this data to prepare for project risk management.
10. ESTIMATE AND SCHEDULE ATR
The CSRA can begin before the estimate and schedule have received an adequatereview. This may be a reasonable approach if the PM is keenly interested in quantifyingthe potential impacts from the established risk events. However, if an ATR laterdetermines critical changes in the estimate and schedule are needed, the CSRA mayhave to be adjusted.
Once the initial risk register is complete, the PM and cost engineer, responsible for theestimate and schedule, must consider whether the current estimate and schedule truly
represent the most likely case. Often times, PDT discussions will present scopechanges or processes that may impact the current estimate and schedule. There couldbe a different construction approach. There could be items such as revised productivityor crew makeup. Other PDT members may choose to revise their portions of thefeature costs and schedules that reside within their area of responsibility. Rememberthat ER 1110-2-1302 makes the cost engineer responsible for the construction costsand schedules. Other PDT members are responsible for their portions, such as projectmanagement, real estate, relocations, contract acquisition, design studies, constructionmanagement, etc. The PM must confirm from the PDT whether these areas must befurther developed or improved to reflect the most likely case estimate and schedule thatserve as the basis for the market studies and the CSRA product. Those estimates must
exclude contingency, because the CSRA process will establish the contingency values.The risk analyst must remove the expended costs and durations from the CSRA, sincethese have little to no risk.
Before the CSRA models are made ready, it is advisable that the total project costestimate and schedule have adequately passed an internal quality control (QC) and an
ATR. Should they fail, another CSRA may have to be performed.

8/18/2019 Risk Army Guidance
http://slidepdf.com/reader/full/risk-army-guidance 15/74
11
11. MARKET RESEARCH
Once the initial risk register is completed and the PDT is confident that the total projectestimate and schedule reflect the most likely case, the initial risk register is ready for therisk analyst to begin the market research. The analyst will use the risk register items as
a basis for what cost and schedule items will be studied as well as use the most likelyestimate and schedule as a basis of comparison and measure. The market researchsupports the quantitative portion of the CSRA, establishing actual values or ranges incost and schedule. It is intended to validate the presumed risk levels within the initialrisk register for both cost and schedule. The market analysis will help establish the“most optimistic” (also referred to as the “best case” or “low value”), the “most likelycase” (commonly the existing estimate and schedule), and the “worst case” (alsoreferred to as the “high value”). These three points or values will be used within theCrystal Ball risk model.
The study may require PDT interviews, historical data research, internet searches, etc.Issues may include items such as real estate fluctuations, land acquisition andeasements, construction productivity concerns, significant weather impacts, fuel pricing,construction modifications, specialized equipment and material availability, local laborresources and rates, potential scope growth, bidding competition, effects resulting fromthe acquisition strategy, economic trends, etc.
12. RISK REGISTER COMPLETION
This section describes the completion of the risk register. Crystal Ball modelpreparation is described separately for cost and schedule in subsequent sections of thisdocument.
To finalize the risk register, market research may result in the risk analyst revising therisk register as he/she prepares the final risk register for the CSRA models. Refinementmay reveal similar risk events that could duplicate or double count a risk impact. It mayresult in adding risk/opportunity events not previously captured. It may result in revisingthe “likelihood” and “impact” values to support a revised risk level that reflects theresearch findings. Should the likelihood and impact values be revised, the PDTconcerns and discussions may have to be reevaluated to ensure that they logicallysupport the revised risk register.
The market research will enable the risk analyst to compete the risk register columns:
•
Cost Impacts.• Cost Variations (best and worst case).• Schedule Impacts.• Schedule Variations (best and worst case).• Correlation of Risks to One Another.• Affected Project Component.• Project Implications.

8/18/2019 Risk Army Guidance
http://slidepdf.com/reader/full/risk-army-guidance 16/74
12
12.1 Cost Impacts and Distribution
The market analysis will help establish the most optimistic (also referred to as the bestcase or low value), the most likely case (commonly the existing estimate), and the worstcase (also referred to as the high value). These three points or values will be used
within the Crystal Ball risk model and serve as the variance curves. The best and worstcase impacts can be indicated in dollars or percent.
12.2 Schedule Impacts and Distribution
The market analysis will help establish the best case, the most likely case, and theworst case values. These three points or values will be used within the Crystal Ball riskmodel and serve as the variance curves. The impacts can be indicated in months orpercent.
12.3 Correlations
Many times, risk events have a correlation or relationship to one another. A positivecorrelation occurs when one risk goes higher, so must the other. A negative or adversecorrelation occurs when one risk increases, the other must decrease. To complete therisk register, note the correlation relationships. When preparing the model, moreinstructions will be provided; however, it is highly recommended to minimize correlationsbefore running the risk model, because they may impact the resulting output. There aremethods used to minimize the correlations. One can combine like correlations into onerisk event. If revision is not possible, then the correlation must be modeled, based onthe positive or negative event relationships.
12.4 Risk Register Quality Control Check
Upon completion of the market research, the risk analyst should complete the riskregister, confident that the:
• PDT risk/opportunity events are adequately captured/conveyed.• PDT discussions support the ”likelihood” and “impact” decisions.• Market research supports the risk level assigned.• Current estimate and schedule serve as the most likely case for the CSRA.• Correlations and event duplication are minimized and addressed.• Market research adequately defines the cost and schedule variations.
13. COST RISK MODEL DEVELOPMENT
Sections 13 and 14 are intended for readers with a basic understanding of using CrystalBall software for the CSRA. PMs can skip to section 15. The following guidanceseparates the processes related to the cost risk analysis (CRA) and the schedule riskanalysis (SRA), because the two are performed somewhat differently, yet use the samebasic tools.

8/18/2019 Risk Army Guidance
http://slidepdf.com/reader/full/risk-army-guidance 17/74
13
The cost risk model development and resulting CRA are most commonly performed bya trained senior cost engineer and/or a senior risk analyst. On larger projects, this mayrequire several members to study the initial risk register, evaluate the concernscaptured within the brainstorming session(s), perform market studies of those riskevents, and validate whether the PDT’s risk level assignments are accurate.
13.1 Cost Risk Model Template
The risk model utilizes the risk register as its basis within the Excel format. The riskanalyst and the PM must determine the best modeling method that provides adequateCRA model output for the project. The result is a customized model specifically relatedto the project. The final product must present contingencies in the desired format forthe total project cost estimate. For example, risk analyses can be performed on eachcontract (assuming several contracts), on each project feature, or on the total projectbase cost.
13.1.1 Methods
In developing the cost risk model template, two common approaches arerecommended. The approaches are dependent upon what the PM prefers as theoutcome when establishing the contingencies. For example, if just a single project orcontract is planned, the PDT may desire a single contingency value. The PM mayprefer a contingency developed for each project feature. If several projects or contractsare planned, the PM may desire a separate contingency for each project. These issuesshould be resolved before preparation of the CRA model. Typical approaches currentlyused:
• Risk event based: Develop the model to reflect the completed risk register. In a
sense, the risk register becomes the model. In that way, the Crystal Ball outputsdirectly reflect the risk register’s risk events established by the PDT. This outputwell supports the PDT when related to document traceability, risk management,and follow-on risk studies. The CRA output is risk based and typically presentsthe contingency per each project. This method can be obtained from the CostEngineering DX.
• Cost based: This method might be used when several contracts are beingstudied within the program and separate contract contingencies or featurecontingencies are desired. The resulting model reflects the work breakdownstructure (WBS) within the estimate(s). To pursue this avenue, the CRA modelis developed by downloading the most likely estimate into an Excel file at the
chosen WBS level that best relates to the risk register. Once that isaccomplished, refer to the market study and the various risk events, creating thebest and worst case estimates, again reflecting the chosen WBS. The CRAoutput is cost based, because it reflects the WBS within the estimate templateand is more intuitive for the cost engineer. The advantage is that the modeloutput can better reflect multiple project features, contracts or different fundingaccounts. The disadvantage is that it does not directly correlate to the riskevents established by the PDT and is less traceable to the risk register. If this

8/18/2019 Risk Army Guidance
http://slidepdf.com/reader/full/risk-army-guidance 18/74
14
alternative is chosen, the report must document how the CRA outputs relate tothe risk register event concerns.
Table 1 is a sample of the risk event method. Note that the model focuses on certainrisk register categories and the market research values related to best case, most likely,
and worst case. The entire risk register can be included; however, it can becumbersome when producing paper documents and reports. The key risk registercolumns are:
• Risk No.• Risk/Opportunity Event.• Risk Level.• Variance Distribution.• Correlation to Others.

8/18/2019 Risk Army Guidance
http://slidepdf.com/reader/full/risk-army-guidance 19/74
15
Table 1. Sample Cost Risk Model
Cry
RiskNo. Risk/Opportunity Event Risk Level*
VarianceDistribution
Correlationto Other(s) Low ($ or %
Internal Risks (Internal Risk Items are those that are generated, caused, or controlled within the PDT
PROJECT & PROGRAM MGMT
PPM-1
Product Development by SeveralSources Moderate* Triangular $269,608,214
PPM-5
Inefficient Contractor/Productivity ofCritical Work Items
High Triangular $276,753,091
GENERAL AND ECONOMIC RISKS
GE-2 Bidding Climate (Mobilization) Moderate Triangular* $1,622,055
GE-3
Contract Phasing/Timing of Contract Awards
Moderate Uniform* PR-5 $0
GE-4
Design Development Stage Incomplete
Moderate* Triangular $241,228,402

8/18/2019 Risk Army Guidance
http://slidepdf.com/reader/full/risk-army-guidance 20/74
16
Table 1. Sample Cost Risk Model (Cont .)
GE-5
Inaccurate Design Assumptions
Moderate* Triangular GE-4 $255,418,308
GE-9
Negative Community Impacts
Moderate Uniform PR-2 $0
GE-11
Estimate Quality Related to LesserDesigned Features Moderate* Triangular GE-4 $189,198,747
GE-12
Conflicts with Known/Unknown UtilitiesDuring Construction High Uniform $0
GE-13
Permit and Environmental WorkWindows Moderate Uniform* $0
Dredging/Disposal Acti vities
DD-2
In-Water Work
Moderate Triangular $16,176,493
Cell/CDF Construction
CD-1
Source for Stone
High Triangular CD-3 $146,660,050
CD-3
Material Availability and Delivery
High Triangular $150,382,223

8/18/2019 Risk Army Guidance
http://slidepdf.com/reader/full/risk-army-guidance 21/74
17
Table 1. Sample Cost Risk Model (Cont .)
External Risks (External Risk Items are those that are generated, caused, or controlled exclusively o
PR-1 Adequacy of Incremental ProjectFunding High Uniform $0
PR-2
Local Communities PoseObjections/Loss of Public Trust/PoliticalFactors Change Moderate Uniform GE-9 $0
PR-3
Stakeholders Request LateChanges/Influential StakeholdersRequest Additional Needs Moderate* Uniform ($14,189,906)
OPPORTUNITIES
PR-5
Market Conditions and BiddingCompetition High Uniform ($56,759,624)
All Other Project Costs (Placeholder) N/A N/A N/A
*Changed during CSRA Study
Instructions:
1) Enter all entries from the PDT risk register that were identified to be either moderate or high risk level
2) Create Reference Tab Worksheets for each studied item, studying and developing values, and documeimportant for traceability both internally and externally. If you ever have to dust the study o ff, you'll need
3) Copy and paste developed values into the cost model as numbers only -- Crystal Ball does not like forthat it is critical that the values from the estimate MUST NOT include contingency markups in MII.
4) Establish your assumption variable distributions on your most likely value cells. Determine the distribparameters using cell references (this w ill eliminate going back and changing the values every time).
5) Establish your forecast value for total project cost (or total feature cost for a more complex estimate). formula, but it should equal the actual most likely project (or feature) cost. Use the placeholder line to en

8/18/2019 Risk Army Guidance
http://slidepdf.com/reader/full/risk-army-guidance 22/74
18
Table 1. Sample Cost Risk Model (Cont .)
6) Run the simulation, using 10,000 trials. Evaluate the result. Chances are, there will be some errors in should be studied again or more closely. Rule of thumb is that for a feasibility level estimate, a healthy cland between 20% and 30%, or between 30% and 40% for a cont roversial, high-risk (and easy to documenTornado Chart and the other tools to assist in the evaluation. Realistically, do the results make sense fro
judgment? If not , there's reason to believe the model may be in error. Look for i tems that might be doubthan they should be. Next, evaluate correlations -- perhaps they should be reduced, increased, or brokenwhether the distributions chosen accurately reflect the true nature of the cost and how it behaves, and m
7) Rerun the simulation as many times as necessary to validate the model -- this i s an iterative process. the model, run the simulation for 100,000 trials. This enhances accuracy, but can take several minutes to
8) If the results l and within a reasonably expected range, then clean up the model and begin the final repcost to the Project Manager. If the contingency is below 20%, then recommend revising the estimate, as pessimistic). If the contingency is above 40%, then recommend revising the estimate as it has some hole
9) This sample was intended to serve as an example, but may be used to with some manipulation to perfoa) There will be some manipulation of the distri butions and formulas required throughout the workbook -
math! b) Every cost risk study is different and unique. It is necessary to "create" the model from scratchworked on -- one size does not fit all.
10) Remember also to study scheduleseparately!

8/18/2019 Risk Army Guidance
http://slidepdf.com/reader/full/risk-army-guidance 23/74
19
13.1.2 Establishing the Risk Events for Study
It is recommended that the number of events under study within the model not exceed 8to 15 risk items. The preferred study would include the high and moderate risks. Themoderate risks are included, because their impact value may be higher than a high risk.
Another decision sort could be those risks that may impact the total project estimate byat least 1 percent.
Table 1 depicts only the risk events under study; however, the risk analyst could stillinclude all risk events within the model, simply ignoring those outside the study by notassigning a variance distribution.
13.1.3 Incorporating Market Research into Model
Once it has been established as to which risk events will be incorporated into the model,the market research findings can be added. For traceability purposes, the
recommended approach is to create Excel tabs next to the risk model dedicatedspecifically for each risk event. The tabs will present the market findings and the logicused to determine the best and worst case values for each risk event. Those values arethen placed into the model input to support the variance distribution. When assigningthe distributions, the most likely case must be a hard value with no equations or links toother data. Remember that the most likely case should reflect the base estimate.
13.1.4 Establishing Variance Distribution
The variance distribution within Crystal Ball must only address those risk events understudy.
Within the Crystal Ball software, the distribution gallery provides more than 20 diagramor curve choices that can represent the market research data related to best case, mostlikely, and worst case. The two most commonly used and recommended for firstconsideration are the triangular and the uniform distribution curves. Other curves maybetter address certain risks where better data exists and should be considered whenmore appropriate.
The triangular distribution (figure 3) is commonly used when the market research hasestablished the best case, most likely, and worst cases: three distinct points, measuredin dollars or percent. By definition, the most likely estimate has established what ismost likely to occur. This distribution is recommended for the risks events that impact
discreet areas or details of the estimate where one can determine that one cost value ismore likely to occur than another value.

8/18/2019 Risk Army Guidance
http://slidepdf.com/reader/full/risk-army-guidance 24/74
20
Figure 3. Example of Triangular Distribution
The uniform distribution (figure 4) is used when any value between the best case andworst case are equally likely to occur. In these instances, only two points are needed,the best and the worse case. This distribution is recommended when the risk eventsare more global to the project and a most likely occurrence cannot be established.Within the model, the best case is assigned a value equal-to/or less-than the most likely(cost estimate) value and the worst case is assigned a value equal-to/or greater-thanthe most likely (cost estimate) value.
Figure 4. Example of Uniform Distribut ion

8/18/2019 Risk Army Guidance
http://slidepdf.com/reader/full/risk-army-guidance 25/74
21
When assigning the variance distribution within the Crystal Ball model, for each riskevent, the risk analyst must link the risk event title, the best case, most likely, and worstcase values and address any correlations, both positive and negative, between therespective risk events.
13.1.5 Most Likely Cost ValueThe Crystal Ball model will be run, targeting the most likely total value. Within themodel, this is also referred to as the forecast value. The most likely value should reflectthe most likely estimate total, encompassing all feature accounts, but excluding anyescalation or contingency. The total value, or forecast value, is linked to the other mostlikely costs with an equation that enables the model to run and capture the variances.
Generally, the model under development at this stage does not total the most likelyproject estimate. An easy solution is to input a place risk event for all other projectcosts (placeholder). It may be a plus or minus value to bring the most likely value totalto the current estimate total. Given the nature of the remaining costs, the risk analyst
can choose whether a distribution variance is needed for inclusion into the risk model.For example, is the remaining placeholder cost value significant and at any significantrisk?
13.2 Cost Risk Model Run
Within Crystal Ball, the risk analyst must set the model related to desired reports,decision variables, defining the forecast, establishing precisions, etc. Once the modelincludes the risk events under study, all distribution variances have been assigned,duplications and correlations addressed, and the most likely estimate captured, the riskanalyst is ready for the initial model run.
13.2.1 Initial Model Run
By this time, the cost engineer and risk analyst should have a feel for the scope, theestimate, and the market research quality. It will be of value when reviewing the initialoutput data. The risk analyst evaluates the initial reports, reviewing areas of potentialconflict or inaccuracy. Even if the contingency values appear reasonable, a QC checkshould still be performed.
Generally, several iterations will be performed as the model is studied for logic,assumptions, and values. Through several iterations, the model is corrected andimproved; however, care must be given to ensure the model is not arbitrarily adjusted tooutput preferred results. Ultimately, the final product and report must reflect logic andpass an ATR.
13.2.2 Model Results Quality Check
After initial model or first trial is run, a quality check is required for reasonableness. Thecontingency calculations may seem too low or too high, based on the risk analyst’sknowledge of the scope and estimate quality. If the contingency data falls significantly

8/18/2019 Risk Army Guidance
http://slidepdf.com/reader/full/risk-army-guidance 26/74
22
outside the anticipated range, there may be errors within the scope development, themost likely estimate, market research, or model development. Within the sensitivitychart (figure 5), the order of high risk events may seem unlikely or out of expectedorder.
Common mistakes include poor scope confidence. Perhaps the most likely estimate isactually too optimistic or too conservative. There may be similar risk events that arelisted separately within the risk register, thereby measuring the risk twice. There maybe critical risks absent, especially external risks. Another common error is failing toadequately consider correlation relationships between risk events. The distributioncurves may have to be reevaluated. If another Excel spreadsheet is open, the softwaremay have grabbed outside data. It is normal to run the model several times before aconfident model is developed that reflects reasonable results for the known data.
13.3 Cost Risk Model Output
There are numerous Crystal Ball outputs that are helpful in presenting the data as well
as supporting the CSRA report. While not all are portrayed in this guidance, the morecommon figures used to support the final report are presented in the followingparagraphs. This data is obtained from the Crystal Ball report output after the risksimulation is run.
13.3.1 Sensitivity Chart
The sensitivity chart (figure 5) reflects the risk register areas of greatest concern (riskevent based), rated in order of criticality, also referred to as the key risk drivers. It iscommonly referred to as a tornado chart. Generally, the more common areas of highrisk concern are scope development, contract acquisition, bidding climate, funding
availability, and contract modifications.

8/18/2019 Risk Army Guidance
http://slidepdf.com/reader/full/risk-army-guidance 27/74
23
Figure 5. Sensi tivi ty Chart for Cost
13.3.2 Total Project Contingency Analysis
The contingency analysis is measured against the most likely estimate in dollars. Theoutput presents (table 2) the cost values based on the confidence levels for successfulproject execution and completion. It can be presented in tabular form and also
represented graphically and termed as the confidence curve. The PM and managementare left to decide what confidence level they prefer to present to Congress forauthorization. Historically, Congress and the Assistant Secretary of the Army areaccustomed to a contingency value with an 80 percent confidence of successfulexecution and completion. Examples are presented in figures 6 and 7.

8/18/2019 Risk Army Guidance
http://slidepdf.com/reader/full/risk-army-guidance 28/74
24
Table 2. Contingency Analysis Output for Cost
Most LikelyCost Estimate
$ 283,798,120
Confidence Level Value Contingency0% $196,251,351 -30.85%5% $265,301,883 -6.52%10% $278,356,727 -1.92%15% $287,628,329 1.35%20% $294,426,931 3.75%25% $300,576,519 5.91%30% $306,044,712 7.84%35% $311,348,193 9.71%40% $316,463,923 11.51%45% $321,561,018 13.31%
50% $325,920,859 14.84%55% $330,801,756 16.56%60% $335,990,370 18.39%65% $340,890,506 20.12%70% $346,028,517 21.93%75% $351,266,705 23.77%80% $357,691,114 26.04%85% $365,347,118 28.73%90% $373,567,089 31.63%95% $385,963,837 36.00%
100% $455,670,837 60.56%

8/18/2019 Risk Army Guidance
http://slidepdf.com/reader/full/risk-army-guidance 29/74
25
Total Project Cost Contingency Analysis (Does not Inc
Escalation)
$140,000,000
$160,000,000$180,000,000$200,000,000$220,000,000$240,000,000$260,000,000$280,000,000$300,000,000$320,000,000$340,000,000$360,000,000$380,000,000$400,000,000$420,000,000$440,000,000$460,000,000$480,000,000
0 %
1 0 %
2 0 %
3 0 %
4 0 %
5 0 %
6 0 %
7 0 %
Confidence Levels
C o s t
Project Cost based at 80
Confidence Level
"Most Likely"
Project Cost
Corresponding
Contingency
Amount
Figure 6. Total Project Cost Contingency Analysis

8/18/2019 Risk Army Guidance
http://slidepdf.com/reader/full/risk-army-guidance 30/74
26
Figure 7. Cumulative Frequency View
14. SCHEDULE RISK MODEL DEVELOPMENT
The guidance prescribed for the schedule risk analysis (SRA) is treated somewhatdifferently than the CRA, but using the same basic tools. The output related to schedulegrowth in months is also portrayed as added contingency in cost when evaluating how
schedule growth can affect cost. For example, added schedule growth may addescalation, it may add certain overheads to design or construction costs, etc.
The schedule risk model development and the resulting SRA are most commonlyperformed by a trained senior cost engineer and/or a senior risk analyst. On largerprojects, this may require several members to study the initial risk register, evaluate theconcerns captured within the brainstorming session(s), perform market studies of thoserisk events, and validate whether the PDT’s risk level assignments are accurate.
To perform a reasonable SRA, an adequate schedule must be developed that reflectsall project features, including the critical and near critical paths of those features. If the
project is large and more complex, the construction schedule needs better developmentso that the risk analyst can determine what the schedule impacts would do to thosedurations. The construction schedule should reflect most likely estimate durations andhow the PDT expects the construction to occur. Items such as site access andeasements, long lead items, parallel or concurrent activities, and phasing andsequencing for the major construction and equipment items for the critical and nearcritical paths are critical for a confident result. Often times, the construction

8/18/2019 Risk Army Guidance
http://slidepdf.com/reader/full/risk-army-guidance 31/74
27
representatives are included in these discussions and are considered a valuableconsulting asset.
14.1 Schedule Risk Model Template
The risk model utilizes the risk register as its basis within the Excel format. The riskanalyst and the PM must determine the best approach to use that provides adequateSRA model output for the project. The result is a customized model specifically relatedto the project. The final product must present schedule growth contingencies in thedesired format for the total project cost estimate. For example, risk analyses can beperformed on each contract (assuming several contracts), on each project feature, or onthe total project base cost.
14.1.1 Methods
In developing the schedule risk model template, two common approaches arerecommended. The approaches are dependent upon what the PM prefers as the
outcome when establishing the contingencies. For example, if just a single project orcontract is planned, the PM may desire a single contingency value. The PM may prefera contingency developed for each project feature. If several projects or contracts areplanned, the PM may desire a separate contingency for each project. These issuesshould be resolved before preparation of the SRA model. The typical approachescurrently used are:
• Risk event based: Develop the model to reflect the completed risk register. In asense, the risk register becomes the model. In that way, the Crystal Ball outputsdirectly reflect the risk register’s risk event established by the PDT. This outputwell supports the PDT when related to document traceability, risk management,
and follow-on risk studies. The SRA output is risk based and typically presentsthe contingency per each project. This method can be obtained from the CostEngineering DX.
• Cost based: This method might be used when several contracts are beingstudied within the program and separate contract contingencies or featurecontingencies are desired. The resulting model reflects the WBS within theestimate(s). To pursue this avenue, the CRA model is developed bydownloading the most likely estimate into an Excel file at the chosen WBS thatbest relates to the risk register. Once that is accomplished, refer to the marketstudy and the various risk events, creating the best and worst case estimates,again reflecting the chosen WBS. The CRA output is cost based, because it
reflects the WBS within the estimate template and is more intuitive for the costengineer. The advantage is that the model output can better reflect multipleproject features, contracts, or different funding accounts. The disadvantage isthat it does not directly correlate to the risk events established by the PDT and isless traceable to the risk register. If this alternative is chosen, the report mustdocument how the SRA outputs relate to the risk register event concerns.

8/18/2019 Risk Army Guidance
http://slidepdf.com/reader/full/risk-army-guidance 32/74
28
Table 3 is a sample of the risk event method. Note that the model focuses on certainrisk register categories and the market research values related to best case, most likelyand worst case. The entire risk register can be included; however, it can becumbersome when producing paper documents and reports. The key risk registercolumns are:
• Risk No.• Risk/Opportunity Event.• Risk Level.• Variance Distribution.• Correlations to Other(s).

8/18/2019 Risk Army Guidance
http://slidepdf.com/reader/full/risk-army-guidance 33/74
29
Table 3. Sample Schedule Risk Model
Project Schedule
RiskNo.
Risk/OpportunityEvent Discussion and Concerns Likelihood* Impact*
RiskLevel*
Internal Risks (Internal Risk Items are those that are generated, caused, or controlled within the
I-1Staff Turnover/LosingStaff at Critical Points
Potential to lose critical staff throughout life ofproject due to workload and attrition. Very Likely Significant High
I-2Inexperienced Staff
Assigned
Assignment of inexperienced staff due toturnover of experienced staff and requirementsdictate necessity for more staff. New staff notfamiliar with Corps processes and regulations. Very Likely Significant High
I-3Changes in SELAPriority
Pulling funding for this project -- competing withother SELA components or other HPS projectsthrough the 2011 timeframe. Likely Significant High
I-4
Functional ResourcesOverloaded/Shift ofStaff Priorities
Lack of internal human resources to executeproject due to heavy workload, overloaded staff,
and shifting priorities. Very Likely Significant High
I-8Control & Diversion ofWater
Rain events may result in flooding. There areadditional diversion and dewatering potential
from rain event, storm, and/or loss of dam. Bidschedule includes flood events, but the current
estimate does not. Likely Marginal Moderate
I-10
Real Estate Not Fully
Defined
Real estate plan is at the feasibility level. Thereare risks associated with lack of scope
development. Need to acquire land, easements.Local development may threaten contemplated
areas for acquisition/access. Very Likely Marginal Moderate
I-11 Land Ownership
Uncertain ownership of several land parcels.Issues surrounding ownership of the canal. Also
issues with parcels outside the canal. Very Likely Critical High

8/18/2019 Risk Army Guidance
http://slidepdf.com/reader/full/risk-army-guidance 34/74
30
Table 3. Sample Schedule Risk Model (Cont.)
I-14 Relocations Occurring Timely Cooperation of the utility owner and the Corps may not follow planned schedule, cau
I-23
Historical Cost Growth inModifications
Risks associated with cost and schedule growth due to modifications, particularly withstations.
External Risks (External Risk Items are those that are generated, caused, or controlled exclusiv
E-1 Incremental Funding Impacts due to lack of funding or untimely receipt of funds.
E-3 Market Conditions Risks to increased costs and schedule due to market saturation
E-4
Inadequate skilled trades laborforce
Many projects will occur concurrent to this project. Competing with other projects for smarket (equipment operators, cement masons, steel/bridge, pump stati
All Other Project Costs Placeholder for costs not captured in summation of risks being stud
PROJECT TOTAL DURATION

8/18/2019 Risk Army Guidance
http://slidepdf.com/reader/full/risk-army-guidance 35/74
31
14.1.2 Establishing the Risk Events for Study
It is recommended that the number of events under study within the model not exceed 8to 15 risk items. The preferred study would include the high and moderate risks. Themoderate risks are included, because their impact may be greater than a high risk.
Table 3 depicts only the risk events under study; however, the risk analyst could stillinclude all risk events within the model, simply ignoring those outside the study by notassigning a variance distribution.
14.1.3 Incorporating Market Research into Model
Once it has been established as to which risk events will be incorporated into the model,the market research findings can be added. For traceability purposes, therecommended approach is to create Excel tabs next to the risk model dedicatedspecifically for each risk event. The tabs will present the market findings and the logic
used to determine the best and worst case values for each risk event. Those values arethen placed into the model input to support the variance distribution. When assigningthe distributions, the most likely case must be a hard value with no equations or links toother data. Remember that the most likely case should reflect the base schedule.
14.1.4 Establishing Variance Distribution
The variance distribution within Crystal Ball must only address those risk events understudy.
Within the Crystal Ball software, the distribution gallery provides more than 20 diagramor curve choices that can represent the market research data related to best case, mostlikely, and worst case. The two most commonly used and recommended for firstconsideration are the triangular and the uniform distribution curves. Other curves maybetter address certain risks where better data exists and should be considered whenmore appropriate.
The triangular distribution is commonly used when the market research has establishedthe best case, most likely, and worst cases: three distinct points, measured in months.By definition, the most likely estimate has established what is most likely to occur. Thisdistribution is recommended for the risk events that impact discreet areas or details ofthe schedule where one can determine that one time value is more likely to occur thananother value. Two examples are provided below (figures 8 and 9).

8/18/2019 Risk Army Guidance
http://slidepdf.com/reader/full/risk-army-guidance 36/74
32
Figure 8. Example 1 of Triangular Dist ribution
Figure 9. Example 2 of Triangular Dist ribution
The uniform distribution (figure 10) is used when any value between the best case andworst case are equally likely to occur. This distribution is recommended when the riskevents are more global to the project and a most likely occurrence cannot

8/18/2019 Risk Army Guidance
http://slidepdf.com/reader/full/risk-army-guidance 37/74
33
be established. In these instances, only two points are needed, the best and the worsecase. Within the model, the best case is assigned a value equal-to/or less-than themost likely (base) value and the worst case is assigned a value equal-to/or greater-thanthe most likely (base) value.
Figure 10. Example of Uniform Distribution
When assigning the variance distribution within the Crystal Ball model, for each risk
event, the risk analyst must be sure to link the risk event title; the best case, most likely,and worst case values; and address any correlations, both positive and negativebetween the respective risk events.
14.1.5 Most Likely Duration Value
The Crystal Ball model will be run, targeting the most likely total value. Within themodel, this is also referred to as the forecast value. The most likely value should reflectthe most likely schedule duration total, encompassing all feature accounts, butexcluding any schedule contingency. The total value, or forecast value, is linked to theother most likely durations with an equation that enables the model to run and capturethe variances.
Generally, the model under development at this stage does not reflect the most likelyproject schedule duration. An easy solution is to input a place risk event for all otherproject durations (placeholder). It may be a plus or minus value to bring the most likelyvalue to the current schedule duration. Given the nature of the placeholder durations,the risk analyst can choose whether a distribution variance is needed for inclusion intothe risk model. For example, is the remaining placeholder item significant and at anysignificant risk?

8/18/2019 Risk Army Guidance
http://slidepdf.com/reader/full/risk-army-guidance 38/74
34
14.2 Schedule Risk Model Run
Within Crystal Ball, the risk analyst must set the model related to desired reports,decision variables, defining the forecast, establishing precisions, etc. Once the modelincludes the risk events under study, all distribution variances have been assigned,
duplications and correlations addressed, and the most likely schedule durationcaptured, the risk analyst is ready for the initial model run.
14.2.1 Initial Model Run
By this time, the cost engineer and risk analyst should have a feel for the scope, theschedule, and the market research quality. It will be of value when reviewing the initialoutput data. The risk analyst evaluates the initial reports, reviewing areas of potentialconflict or inaccuracy. Even if the duration values appear reasonable, a QC checkshould still be performed.
Generally, several iterations will be performed as the model is studied for logic,
assumptions, and values. Through several iterations, the model is corrected andimproved; however, care must be given to ensure the model is not arbitrarily adjusted tooutput preferred results. Ultimately, the final product and report must reflect logic andundergo an ATR.
14.2.2 Model Results Quality Check
After initial model or first trial is run, a quality check is required for reasonableness. Therisk duration calculations may seem too low or too high, based on the risk analyst’sknowledge of the scope and schedule quality. If the contingency data falls significantlyoutside the anticipated range, there may be errors within the scope development, the
most likely schedule, market research, or model development. Within the sensitivitychart, the order of high risk events may seem unlikely or out of expected order.
Common mistakes include poor scope confidence. Perhaps the most likely schedule isactually too optimistic or too conservative. Perhaps the schedule does not correlatewell to the estimate productivities. There may be similar risk events that are listedseparately within the risk register, thereby measuring the risk twice. There may becritical risks absent, especially external risks. Another common error is failing toadequately consider correlation relationships between risk events. The distributioncurves may have to be reevaluated. If another Excel spreadsheet is open, the softwaremay have grabbed outside data. It is normal to run the model several times before a
confident model is developed that reflects reasonable results for the known data.14.3 Schedule Risk Model Output
There are numerous Crystal Ball outputs that are helpful in presenting the data as wellas supporting the CSRA report. While not all are portrayed in this guidance, the morecommon figures used to support the final report are presented in the followingparagraphs. This data is obtained from the Crystal Ball report output after the risksimulation is run.

8/18/2019 Risk Army Guidance
http://slidepdf.com/reader/full/risk-army-guidance 39/74
35
14.3.1 Sensitivity Chart
The sensitivity chart (figure 11) reflects the risk register areas of greatest concern (riskevent based), rated in order of criticality. It is commonly referred to as a tornado chart.Generally, the more common areas of high risk concern are scope development,
contract acquisition, bidding climate, funding availability, and contract modifications.
Figure 11. Sensitivi ty Chart for Schedule
14.3.2 Total Project Contingency Analysis
The contingency analysis is measured against the most likely schedule. The outputpresents (table 4) the duration values based on the confidence levels for successfulproject execution and completion. It can be in tabular form and also representedgraphically and termed as the confidence curve. The PM and management are left todecide what confidence level they prefer to present to Congress for authorization.Historically, Congress and the Assistant Secretary of the Army are accustomed to acontingency value with an 80 percent confidence of successful execution and
completion.

8/18/2019 Risk Army Guidance
http://slidepdf.com/reader/full/risk-army-guidance 40/74
36
Table 4. Contingency Analysis Output for Total Project Schedule
PercentileForecast values
(months)0% 795% 92
10% 9515% 9820% 10025% 10230% 10335% 10540% 10745% 10950% 11055% 112
60% 11465% 11670% 11875% 11980% 12185% 12390% 12695% 130
100% 146
14.4 Schedule Risk Conversion to Contingency
The risk model output presents the schedule risk in months. It should demonstratewhere those schedule risks are and by what monthly value. Realistically, the scheduleduration also represents a cost to the project that the CRA did not capture. Schedulerisk should be presented in both schedule growth and cost growth potential. Whenevaluating the schedule growth, consider what costs may be related to those riskevents. Commonly, it could be an escalation value added by using the Office ofManagement and Budget (OMB) established rates. It can also include certain overheadcosts, depending on whether it is design or construction risk.
Once determined, the schedule duration must be evaluated to determine if the added
time results in added costs specifically related to the project and its stage in the designand construction process. Such cost impacts would be added onto the costcontingency calculations. Evaluation should consider how the time risks relate to suchitems as:
• Any current authorizations, appropriations, and Section 902 limits.• Anticipated funding profiles.• Pre-construction engineering and design risks.

8/18/2019 Risk Army Guidance
http://slidepdf.com/reader/full/risk-army-guidance 41/74
37
• Construction risks.• Local markets exceeding the established OMB escalation.• Market risks impacting contractor bids related to market variability on lengthy
construction activities.
15. TOTAL PROJECT COST SUMMARY
The CSRA results, both cost and schedule contingency, can now be transferred to thetotal project cost summary in the form of contingencies. Figure 12 is an acceptedexample that meets regulation requirements.
Figure 12. Total Project Cost Summary
16. REPORTS
Finally, the CSRA is included within a report (a sample risk analysis report is availableat site http://www.nww.usace.army.mil/html/offices/ed/c/default.asp). The report can beadded to the cost engineering appendix at feasibility stage, or it can remain a

8/18/2019 Risk Army Guidance
http://slidepdf.com/reader/full/risk-army-guidance 42/74
38
standalone report or appendix. The Cost Engineering DX provides guidance on theirweb site for a satisfactory report. Either way, the report should include:
• Title page with project name, date, and author.• Table of contents.•
Executive summary reflecting the main report.• Report purpose, background, and project scope.• CSRA methodology/processes used including software, PDT, and market
research.• Key Assumptions, listing concerns, inclusions, and exclusions.• Final Risk Register for the CRA and SRA.• Crystal Ball reports such as sensitivity charts, contingency tables, and
confidence curves.• Presentation of the base cost and schedule with contingencies.• Major findings and observations.• Mitigation recommendations.
17. CONCLUSION
The CSRA output and resulting report contingencies serve as a management tool inestablishing the total project cost. It also serves as a risk base line for PM riskmanagement, mitigation and further CSRAs as the project moves forward and updatesare deemed necessary. Later CSRAs serve to recalibrate, identify new risks as well asexclude mitigated or unrealized risks. The resulting CSRAs can also be used as acomparison to the funded amount and forecast whether the project is on target with theavailable funding that was appropriated.

8/18/2019 Risk Army Guidance
http://slidepdf.com/reader/full/risk-army-guidance 43/74
APPENDIX A
PDT RISK CHECKLIST

8/18/2019 Risk Army Guidance
http://slidepdf.com/reader/full/risk-army-guidance 44/74
A-1
PDT RISK CHECKLIST
Provided here is a checklist of risk items for consideration when performing a riskanalysis. Consideration of all feature accounts is critically important as presented withinthe civil works breakdown structure.
FEATURECODE DESCRIPTION
01 Lands and Damages02 Relocations03 Reservoirs04 Dams05 Locks06 Fish and Wildlife Facilities07 Power Plant08 Roads, Railroads, and Bridges09 Channels and Canals10 Breakwaters and Seawalls11 Levees and Floodwalls12 Navigation Ports & Harbors13 Pumping Plants14 Recreation Facilities
15Floodway Control-DiversionStructure
16 Bank Stabilization17 Beach Replenishment18 Cultural Resource Preservation19 Buildings, Grounds, & Utilities
20Permanent OperationEquipment
30Planning, Engineering andDesign
31 Construction Management
1. Engineering and Construction Management Risk Document Checklist.
Risk management reports vary depending on the size, nature, and phase of the project.The following are examples of risk management documents and reports that may beuseful:
Risk management plan Risk information form Risk assessment report Risk handling priority list Risk handling plan of action Aggregated risk list
Risk monitoring documentation:

8/18/2019 Risk Army Guidance
http://slidepdf.com/reader/full/risk-army-guidance 45/74
A-2
– Project metrics – Technical reports – Earned value reports – Watch list – Schedule performance report
– Critical risk processes reports
2. The following items are a composite of several checklists from various agencies.They have been tailored to better address the more common USACE civil works projectrisks. The list, though not all encompassing provides a valuable tool, meant to serve asan aid in PDT discussions of potential risk items for a specific project.
Organizational and Project Management Risks Project purpose and objectives are poorly defined Project scope definition is poor or incomplete Project schedule in question
No control over staff priorities Project competing with other projects, funding and resources Functional and Technical labor units not available or overloaded Losing critical staff at crucial point of the project Inexperienced or inadequate staff assigned Product development by several sources or entities (virtual or remote efforts) Coordination/communication difficulties Communication breakdown with project team Insufficient time to plan Timely response to critical decisions by PM and/or management A/E/C Consultant or contractor delays Pressure to deliver project on an accelerated schedule Unanticipated project manager workload Internal red tape causes delay getting approvals, decisions Unplanned work that must be accommodated Local agency/regulator issues Priorities change on existing program
Contract Acquisition Risks Undefined acquisition strategy Lack of acquisition planning support/involvement Preference to SDB and 8(a) contracts Acquisition planning to accommodate funding stream or anticipated strategy Numerous separate contracts Acquisition strategy decreasing competition Acquisition strategy results in higher scope risk (Design Build)
Technical Risks Design development stage, incomplete or preliminary Confidence in scope, investigations, design, critical quantities
8/18/2019 Risk Army Guidance
http://slidepdf.com/reader/full/risk-army-guidance 46/74
A-3
GeotechnicalCivilStructuralMechanicalElectrical
ArchitecturalEnvironmentalControlsOther Specialized Disciplines
Design confidence in products by others Consultant design not up to department standards Inaccurate or risky design assumptions on technical issues Innovative designs, highly complex, first of a kind, or prototypes Incomplete studies (geotech, hydrology and hydraulic, structural, HTRW, etc) Surveys late and/or surveys in question Sufficiency / availability of as-built data / base map data
Borrow/fill sources identified / secured Sufficiency/condition of borrow / fill sites Right-of-way analysis in question Lacking critical subsurface information for under-water / in-water work Hazardous waste concerns Need for design exceptions or waivers Adaptive Management features (<3% of construction cost, excluding monitoring) Dredge Estimate scope, quantities, equipment
Correct dredge equipment decisions (type, size, number)Reasonable productivity (seasonal, environmental, weather)Consideration for adequate pumping for long pipeline runs
Adequate disposal facilities in size and number
Lands and Damages Real Estate plan defined Status of real estate / easement acquisition Objections to right-of-way appraisal take more time and/or money Ancillary owner rights, ownerships in question Freeway agreements Railroad involvement Relocations identified Records / as-built availability / inaccuracies Known and unknown utility impacts Relocations may not happen in time Environmental mitigation needs identified Vagrancy, loitering issues Quality of L&D estimates as “most likely” case Hidden estimate/schedule contingencies
Regulatory and Environmental Risks

8/18/2019 Risk Army Guidance
http://slidepdf.com/reader/full/risk-army-guidance 47/74
A-4
Established requirements for initial project studies and potential impacts Environmental and Water quality issues Adaptive Management features (<3% of construction cost, excluding monitoring) Conforming to the State implementation plan for air quality Historic/Cultural site, endangered species, or wetlands present
Project in an area of high sensitivity for paleontology Project in an area of high sensitivity for cultural artifacts Numerous exclusion zones in project area / vicinity Hazardous waste preliminary site investigation required Status of critical environmental and regulatory studies Status of permits Lack of specialized staff (biology, anthropology, archeology, etc.) Reviewing agency requires higher-level review than assumed Permits or agency actions delayed or take longer than expected Reviewing agency requires higher-level review than assumed Potential for critical regulation changes
New permits or new information required Project in the Coastal Zone Project on a Scenic Highway, state or national park Negative community impacts expected Pressure to compress the study and permitting activities
Construction Risks Accelerated contract schedule Inefficient contractor Subcontractor capabilities Conflicts with other contracts Innovative project construction Timely delivery of critical GFE Permits, licenses, submittal approvals Permit and environmental work windows Environmental restrictions (equipment use, exhaust, paint fumes) Site access / restrictions (highways, bridges, dams, water, overhead / underground
utilities) Adequate staging areas Rural / remote locale Inadequate skilled trades available for labor force Inadequate housing/utilities to support labor force Special equipment and equipment availability Material availability and delivery Productivity of critical work items Critical fabrication and delivery Unknown utilities Survey information Limited transportation / haul routes available Transportation / haul routes constricted or unusable during periods of time

8/18/2019 Risk Army Guidance
http://slidepdf.com/reader/full/risk-army-guidance 48/74
A-5
Unusual transportation haul distances Regulatory / operational work windows or outage periods Restricted schedule, accelerated schedule impacts In-water work Control and diversion of water
Differing site conditions Unidentified hazardous waste Historic change order or modification growth Consideration for standard weather impact Adequacy of construction schedule depicting durations, sequencing, phasing,
production rates
Estimate and Schedule Risks Estimate captures scope for all project features Estimate developed for current scope and design level Estimates developed in MCACES MII and/or CEDEP
Estimate quality related to lesser designed features Estimate excludes contingency and escalation Estimate(s) quality when developed by others Estimate confidence in large and critical quantities Estimate include waste / drop off quantities Estimate reflects local market for labor and subsistence Estimate reasonableness of crews and productivities Estimate reflects local material costs and delivery Parametric estimates for unit prices adequate for critical items Consideration and local quotes for special equipment (cranes, barges, tugs, diving) Prime and subcontractor structure matches likely acquisition strategy Adequate schedule depicting all project features Schedule matches PED plan Schedule portrays critical construction features, matching estimate productivity Schedule depicts logical construction sequencing, phasing and parallel activities Estimate and schedule reflecting “most likely” occurrence Overall confidence in estimate and schedule
External Risks Adequacy of project funding (incremental or full funding) Priorities change on existing program Local communities pose objections Loss of public trust / goodwill Political factors change at local, state or federal Stakeholders request late changes New stakeholders emerge and demand new work Influential stakeholders request additional needs to serve other purposes Political opposition / threat of lawsuits Stakeholders choose time and / or cost over quality Market conditions and bidding competition

8/18/2019 Risk Army Guidance
http://slidepdf.com/reader/full/risk-army-guidance 49/74
A-6
Unexpected escalation on key materials Labor disruptions Acts of God (seismic events: volcanic activity, earthquakes, tsunamis; or severe
weather: freezing, flooding or hurricane)

8/18/2019 Risk Army Guidance
http://slidepdf.com/reader/full/risk-army-guidance 50/74
APPENDIX B
SAMPLE RISK REGISTERS

8/18/2019 Risk Army Guidance
http://slidepdf.com/reader/full/risk-army-guidance 51/74

8/18/2019 Risk Army Guidance
http://slidepdf.com/reader/full/risk-army-guidance 52/74
B-2
PPM-6 Contract Acquisition Impacts The contract acquisitionstrategy may impact costand schedule.
Current acquisition plan is a D/BFFP. Estimate is based on a D/BFFP.
PPM-8 Design Scope Maturity The estimate and schedulequality could be in questionbecause of limited 10%design.
A significant amount of the estimateand schedule are parametric-basedwith critical assumptions that aredifficult to capture. The design
team believes cost and scheduleestimates are conservative in manyareas. But the ITR Team feelscertain areas are underestimated.
Also, a complete independenttechnical design review of criticalassumptions has not beenperformed; therefore, uncertaintyexists regarding the current level ofdesign. Impact assumptions arebased on design team discussions.
Cost E
OPPORTUNITIES
PPM-9 Alternate Project Delivery MethodEfficiencies
Use of alternate projectdelivery methods similar to
Early ContractorInvolvement (ECI) may lowercontract cost byreducing/realigning risk andproviding opportunities toimprove designs.
Alternative project delivery methodsshould provide opportunities to
improve the RFP, specifically asrelated to pumping station design.The anticipated D/B process willinvolve a 2-step procurementprocess whereby the selectedbidders will be given opportunitiesfor RFP and design improvements,similar to an ECI process. Largecontractors are growing morefamiliar and confident with USACEcontracting methodology,processes, indemnity and risks.Design team believes there is goodcompetitive interest in this project.
Projec Acq
Prof
GENERAL AND ECONOMIC
RISKS
GE-1 Construction ContractModifications
Depending on level ofcomplexity, weather impacts,and contract language,construction contractmodifications can impactconstruction cost and
Local specifications assume highergovernment risk for weatherconcerns, thereby increasing thelikelihood of construction contractmodifications. Technicalcomplexities related to the pump
Projec AcqProf
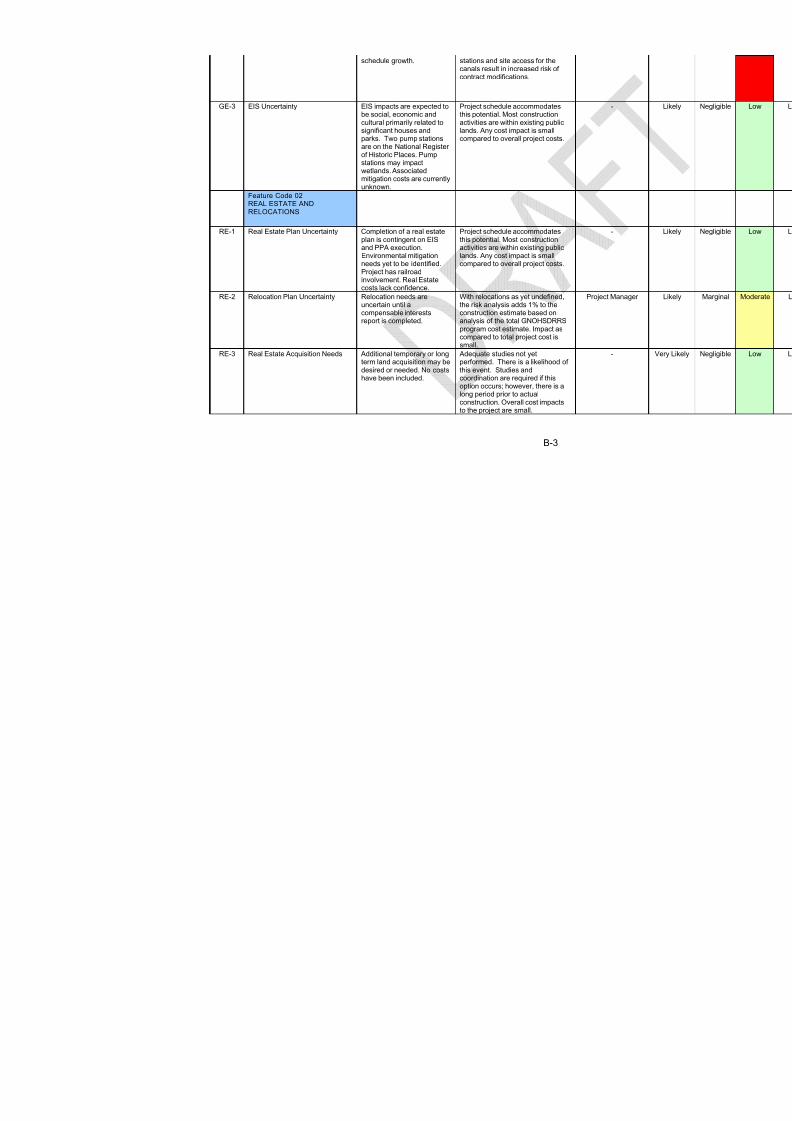
8/18/2019 Risk Army Guidance
http://slidepdf.com/reader/full/risk-army-guidance 53/74
B-3
schedule growth. stations and site access for thecanals result in increased risk ofcontract modifications.
GE-3 EIS Uncertainty EIS impacts are expected tobe social, economic andcultural primarily related tosignificant houses andparks. Two pump stationsare on the National Registerof Historic Places. Pumpstations may impactwetlands. Associatedmitigation costs are currentlyunknown.
Project schedule accommodatesthis potential. Most constructionactivities are within existing publiclands. Any cost impact is smallcompared to overall project costs.
Feature Code 02REAL ESTATE ANDRELOCATIONS
RE-1 Real Estate Plan Uncertainty Completion of a real estateplan is contingent on EISand PPA execution.Environmental mitigationneeds yet to be identified.Project has railroadinvolvement. Real Estatecosts lack confidence.
Project schedule accommodatesthis potential. Most constructionactivities are within existing publiclands. Any cost impact is smallcompared to overall project costs.
RE-2 Relocation Plan Uncertainty Relocation needs areuncertain until acompensable interestsreport is completed.
With relocations as yet undefined,the risk analysis adds 1% to theconstruction estimate based onanalysis of the total GNOHSDRRSprogram cost estimate. Impact ascompared to total project cost issmall.
Projec
RE-3 Real Estate Acquisition Needs Additional temporary or longterm land acquisition may bedesired or needed. No costshave been included.
Adequate studies not yetperformed. There is a likelihood ofthis event. Studies andcoordination are required if thisoption occurs; however, there is along period prior to actualconstruction. Overall cost impactsto the project are small.

8/18/2019 Risk Army Guidance
http://slidepdf.com/reader/full/risk-army-guidance 54/74

8/18/2019 Risk Army Guidance
http://slidepdf.com/reader/full/risk-army-guidance 55/74
B-5
Feature Code 13PERMANENT PUMP STATIONS
PPS-4 Design Criteria - Pumps Design level is less than10%. At pre- and post-contract award stages,design criteria will besubjected to independentreviews, internal andexternal. The outcome maybe design revisions.Potential also exists forscope evolution within theD/B process.
Designs have not fully consideredimpacts of larger pumpingrequirements for larger weatherevents. Significant technical reviewconcern regarding incorporation ofdischarge head in pump design.
Civ
PPS-6 Disposal of Excavated Materials The results of environmentalsite assessments may resultin higher than anticipateddisposal costs. Disposal ofsome excavated materialsassumed to require sanitarylandfill disposal.
Estimate appears to lack mostdisposal activities.
Cost E
PPS-8 Project Constructability Constructability may be inquestion as related to in-water work, phasing andsequencing whilemaintaining flows andprotection.
A thorough constructability reviewhas been performed by thedesigner and Corpsrepresentatives. Alternate projectdelivery methods will minimizeimpacts.
PPS-10 Site Access Restrictions Restricted site access, laydown and work stagingareas impacting productivityand constructionmanagement.
Site access is somewhat restricted,but considered acceptable withproper site management andcoordination during design period.
Programmatic Risks (External Risk Items are those that are generated, caused, or controlled exclusively outside the PDT's s
RiskNo.
Risk/Opportunit y Event Concerns
PDT Discussions
Respon
PR-1 Undefined Funding Profile Project costs are high for anextended schedule periodthat is not currentlyauthorized/funded. Futurefull or incremental fundingscenarios are unknown.
The funding profile is unknown.Design and construction delayscould occur pending funding,resulting in increased escalationcosts.
Projec

8/18/2019 Risk Army Guidance
http://slidepdf.com/reader/full/risk-army-guidance 56/74

8/18/2019 Risk Army Guidance
http://slidepdf.com/reader/full/risk-army-guidance 57/74
B-7
Sample Risk Register for Risk Analyst
COMPLETED BY RISK
RiskNo.
PDT-developed Risk/Opportunity
Event (logic by feature, contract,responsibility) Cost Impact ($) Variance Distri buti on(Cost)
SchImpa
Contract Risks (Internal Risk Items are those that are generated, caused, or controlled within the PDT's sphere of inf
PROJECT & PROGRAM MGMT
PPM-1
Project Personnel Resources N/ALow Level Risks
Not Modeled
N/ALow Level Risks
Not Modeled
PPM-2
Project Experience with CivilDesign/Build
N/ALow Level Risks
Not Modeled
N/ALow Level Risks
Not Modeled
NLow Le
Not M
PPM-3
Unanticipated Requirements andReviews
Construction contingency willbe applied at the same rate
for PED.
Same as overallconstruction variance
3
PPM-6
Contract Acquisition Impacts N/ALow Level Risks
Not Modeled
N/ALow Level Risks
Not Modeled
NLow Le
Not M
PPM-8
Design Scope Maturity $400,000,000 Triangular 3
OPPORTUNITIES
PPM-9
Alternate Project Delivery MethodEfficiencies
$65,000,000 Triangular NLow Le
Not M
GENERAL AND ECONOMIC RISKS
GE-1 Construction Contract Modifications $50,000,000 Triangular

8/18/2019 Risk Army Guidance
http://slidepdf.com/reader/full/risk-army-guidance 58/74
B-8
GE-3 EIS Uncertainty N/ALow Level Risks
Not Modeled
N/ALow Level Risks
Not Modeled
NLow Le
Not M
Feature Code 02REAL ESTATE AND RELOCATIONS
RE-1 Real Estate Plan Uncertainty N/ALow Level Risks
Not Modeled
N/ALow Level Risks
Not Modeled
NLow Le
Not M
RE-2 Relocation Plan Uncertainty $25,000,000 Same as overallconstruction variance1%
added to construction
3
RE-3 Real Estate Acquisition Needs N/ALow Level Risks
Not Modeled
N/ALow Level Risks
Not Modeled
NLow Le
Not M
RE-4 Impacts to High Value Habitats N/ALow Level Risks
Not Modeled
N/ALow Level Risks
Not Modeled
NLow Le
Not MFeature Code 09 CANALS
C-2 Design Criteria $40,000,000 Triangular
C-3 Structural and Geotechnical Uncertainty $10,000,000 Triangular
C-5 Site Access and Constructability inCanal Reaches - Wet Work
$15,000,000 Triangular 3
C-7 Unknown Utilities $5,000,000 Triangular 3
C-11 Disposal of Excavated Materials less than $1,000,000 Triangular N
Low LeNot M
Feature Code 13PERMANENT PUMP STATIONS
PPS-4 Design Criteria - Pumps $45,000,000 Triangular

8/18/2019 Risk Army Guidance
http://slidepdf.com/reader/full/risk-army-guidance 59/74
B-9
PPS-6 Disposal of Excavated Materials less than $1,000,000 Triangular NLow Le
Not M
PPS-8 Project Constructability N/ALow Level Risks
Not Modeled
N/ALow Level Risks
Not Modeled
NLow Le
Not M
PPS-10 Site Access Restrictions N/ALow Level RisksNotModeled N/ALow Level RisksNotModeled N/ALoRisMo
Programmatic Risks (External Risk Items are those that are generated, caused, or cont rolled exclusively outside the
COMPLRiskNo.
Risk/Opportuni ty Event
Cost Impact ($) Variance Distri buti on(Cost)
SchImpa
PR-1 Undefined Funding Profile $60,000,000 Uniform NLow Le
Not M
PR-2 Funding Availability -5% - +25% Uniform 12
PR-3 Bidders Risk in Volatile Market 0-10% based on study 6-
PR-4 Bid Protest Potential N/ALow Level Risks
Not Modeled
N/ALow Level Risks
Not Modeled

8/18/2019 Risk Army Guidance
http://slidepdf.com/reader/full/risk-army-guidance 60/74
APPENDIX C
SAMPLE RISK ANALYSIS REPORT

8/18/2019 Risk Army Guidance
http://slidepdf.com/reader/full/risk-army-guidance 61/74
PROJECT NAMEDESIGN LEVEL
FORDISTRICT NAME AND LOCATION
Prepared for:
___________________________
Prepared by:
___________________________
Date: ____________________

8/18/2019 Risk Army Guidance
http://slidepdf.com/reader/full/risk-army-guidance 62/74
i
TABLE OF CONTENTS
EXECUTIVE SUMMARY ................................................................................................1
1. PURPOSE .................................................................................................................2
2.
BACKGROUND.........................................................................................................2
3. REPORT SCOPE ......................................................................................................2
3.1 Project Scope .................................................................................................... 2
3.2 USACE Risk Analysis Process .......................................................................... 2
4.
METHODOLOGY/PROCESS.................................................................................... 3
4.1 Identify and Assess Risk Factors....................................................................... 4
4.2 Quantify Risk Factor Impacts............................................................................. 5
4.3 Analyze Cost Estimate and Schedule Contingency...........................................6
5.
KEY ASSUMPTIONS ................................................................................................7
6.
RISK ANALYSIS RESULTS .....................................................................................7
6.1 Risk Register ..................................................................................................... 8
6.2 Cost Risk Analysis - Cost Contingency Results.................................................9
6.3 Schedule Risk Analysis - Schedule Contingency Results..................................9
6.4 Combined Cost and Schedule Contingency Results .........................................9
7.
MAJOR FINDINGS/OBSERVATIONS ......................................................................9
8.
MITIGATION RECOMMENDATIONS .....................................................................11
LIST OF TABLES
Table 1. Work Breakdown Structure by Feature ............................................................6
Table 2. Sample Project Contingencies (Base Cost Plus Cost and ScheduleContingencies) .............................................................................................................. 10
FIGURE
Figure 1. Sample of Project Confidence Curves ..........................................................11
APPENDIX
APPENDIX A Detailed Risk Register

8/18/2019 Risk Army Guidance
http://slidepdf.com/reader/full/risk-army-guidance 63/74
ES-1
EXECUTIVE SUMMARY
Provide a brief synopsis of the main report; keep pages of the executive summary to aminimum covering:
• Report purpose.• Background.• Project scope.• Risk analysis methodology.• Project development team (PDT) processes utilized (exclude names)• Key project and risk assumptions.• Contingency results to the feature level.• Major findings/observations.• Mitigation recommendations.

8/18/2019 Risk Army Guidance
http://slidepdf.com/reader/full/risk-army-guidance 64/74
2
1. PURPOSE
Present report purpose, acknowledging project name, location, and design phase. Thepurpose for a cost and schedule risk analysis (CSRA) would briefly present discussionof the studied elements related to cost and schedule with an outcome contingencycalculation at the recommended confidence level for both cost and schedule that aremeasured in terms of dollars and months, respectively. The most common andrecommended contingency has been established at 80 percent confidence.
2. BACKGROUND
Present project background, including any related congressional appropriations, designdevelopment phase, and brief history.
3. REPORT SCOPE
The scope of the risk analysis report is to calculate and present the cost and schedulecontingencies at the 80 percent confidence level using the risk analysis processes asmandated by U.S. Army Corps of Engineers (USACE) Engineer Regulation (ER) 1110-2-1150, Engineering and Design for Civil Works, ER 1110-2-1302, Civil Works CostEngineering, and Engineer Technical Letter 1110-2-573, Construction Cost EstimatingGuide for Civil Works. The report presents the contingency results for both cost andschedule risks for all project features. The study and presentation can include orexclude consideration for operation and maintenance or life cycle costs, dependingupon the program or decision document intended for funding.
3.1 Project Scope
Provide any congressional mandates and appropriations.
The report includes the project technical scope, estimates, and schedules as developedand presented by (list the name of the product developer by district or design firm).Consequently, these documents serve as the basis for the risk analysis. In generalterms, the construction scope consists of the following:
• List major project features studied from the civil works work breakdownstructure (CWWBS).
• Indicate the approximate design phase. Many times, various design featuresare at varying design stages, which impact the contingency results. If there is
a design quality or scope variance between various critical features, whichshould be made known.
3.2 USACE Risk Analysis Process
The risk analysis process follows the USACE Headquarters requirements as well as theguidance provided by the Cost Engineering Directory of Expertise for Civil Works (CostEngineering DX). The risk analysis process reflected within the risk analysis report

8/18/2019 Risk Army Guidance
http://slidepdf.com/reader/full/risk-army-guidance 65/74
3
uses probabilistic cost and schedule risk analysis methods within the framework of theCrystal Ball software. The risk analysis results are intended to serve several functions,one being the establishment of reasonable contingencies reflective of an 80 percentconfidence level to successfully accomplish the project work within that establishedcontingency amount. Furthermore, the scope of the report includes the identification
and communication of important steps, logic, key assumptions, limitations, anddecisions to help ensure that risk analysis results can be appropriately interpreted.
Risk analysis results are also intended to provide project leadership with contingencyinformation for scheduling, budgeting, and project control purposes, as well as providetools to support decision making and risk management as the project progressesthrough planning and implementation. To fully recognize its benefits, cost and schedulerisk analyses should be considered as an ongoing process conducted concurrent to,and iteratively with, other important project processes such as scope and execution plandevelopment, resource planning, procurement planning, cost estimating, budgeting, andscheduling.
In addition to broadly defined risk analysis standards and recommended practices, therisk analysis is performed to meet the requirements and recommendations of thefollowing documents and sources:
• ER 1110-2-1150, Engineering and Design for Civil Works Projects.• ER 1110-2-1302, Civil Works Cost Engineering.• ETL 1110-2-573, Construction Cost Estimating Guide for Civil Works.• Cost and Schedule Risk Analysis Process guidance prepared by the USACE
Cost Engineering DX.• Memorandum from Major General Don T. Riley (U.S. Army Director of Civil
Works), dated July 3, 2007.• Engineering and Construction Bulletin issued by James C. Dalton, P.E.
(Chief, Engineering and Construction, Directorate of Civil Works), datedSeptember 10, 2007.
4. METHODOLOGY/PROCESS
Present team makeup, including PDT members and technical positions, as well as theteam makeup performing the risk analysis (both USACE and contracted members, notby name, but by position). Present timeframe of the study.
Indicate whether the cost and schedule products under analyses have successfully
passed an Agency Technical Review (ATR) (if not, the risk analysis outcome is basedupon an unapproved product and likely to change after an ATR is completed).
The risk analysis process for this study is intended to determine the probability ofvarious cost outcomes and quantify the required contingency needed in the costestimate to achieve any desired level of cost confidence. A parallel process is alsoused to determine the probability of various project schedule duration outcomes and

8/18/2019 Risk Army Guidance
http://slidepdf.com/reader/full/risk-army-guidance 66/74
4
quantify the required schedule contingency (float) needed in the schedule to achieveany desired level of schedule confidence.
In simple terms, contingency is an amount added to an estimate (cost or schedule) toallow for items, conditions, or events for which the occurrence or impact is uncertain
and that experience suggests will likely result in additional costs being incurred oradditional time being required. The amount of contingency included in project controlplans depends, at least in part, on the project leadership’s willingness to accept risk ofproject overruns. The less risk that project leadership is willing to accept the morecontingency should be applied in the project control plans. The risk of overrun isexpressed, in a probabilistic context, using confidence levels.
The Cost Engineering DX guidance for cost and schedule risk analysis generallyfocuses on the 80-percent level of confidence (P80) for cost contingency calculation. Itshould be noted that use of P80 as a decision criteria is a risk adverse approach(whereas the use of P50 would be a risk neutral approach, and use of levels less than50 percent would be risk seeking). Thus, a P80 confidence level results in greatercontingency as compared to a P50 confidence level.
The risk analysis process uses Monte Carlo techniques to determine probabilities andcontingency. The Monte Carlo techniques are facilitated computationally by acommercially available risk analysis software package (Crystal Ball) that is an add-in toMicrosoft Excel. Cost estimates are packaged into an Excel format and used directly forcost risk analysis purposes. Because Crystal Ball is an Excel add-in, the schedules foreach option are recreated in an Excel format from their native format. The level of detailrecreated in the Excel-format schedule is sufficient for risk analysis purposes that reflectthe established risk register, but generally less than that of the native format.
The primary steps, in functional terms, of the risk analysis process are described in thefollowing subsections. Risk analysis results would be provided in section 6.
4.1 Identify and Assess Risk Factors
Identifying the risk factors via the PDT are considered a qualitative process that resultsin establishing a risk register that serves as the document for the further study using theCrystal Ball risk software. Risk factors are events and conditions that may influence ordrive uncertainty in project performance. They may be inherent characteristics orconditions of the project or external influences, events, or conditions such as weather oreconomic conditions. Risk factors may have either favorable or unfavorable impacts on
project cost and schedule.
Checklists or historical databases of common risk factors are sometimes used tofacilitate risk factor identification. However, key risk factors are often unique to a projectand not readily derivable from historical information. Therefore, input from the entirePDT is obtained using creative processes such as brainstorming or other facilitated riskassessment meetings. In practice, a combination of professional judgment from thePDT and empirical data from similar projects is desirable and is considered.

8/18/2019 Risk Army Guidance
http://slidepdf.com/reader/full/risk-army-guidance 67/74
5
Formal PDT meetings are held (include the name of the location in the report) for thepurposes of identifying and assessing risk factors. The meetings (include the date)should include capable and qualified representatives from multiple project teamdisciplines and functions, for example:
•
Project/program managers.• Contracting/acquisition.• Real Estate.• Relocations.• Environmental.• Civil, structural, geotechnical, and hydraulic design.• Cost and schedule engineers.• Construction.• Key sponsors
The initial formal meetings should focus primarily on risk factor identification using
brainstorming techniques, but also include some facilitated discussions based on riskfactors common to projects of similar scope and geographic location. Subsequentmeetings should focus primarily on risk factor assessment and quantification.
Additionally, numerous conference calls and informal meetings are conductedthroughout the risk analysis process on an as-needed basis to further facilitate riskfactor identification, market analysis, and risk assessment.
4.2 Quantify Risk Factor Impacts
The quantitative impacts of risk factors on project plans are analyzed using acombination of professional judgment, empirical data, and analytical techniques. Riskfactor impacts are quantified using probability distributions (density functions), becauserisk factors are entered into the Crystal Ball software in the form of probability densityfunctions.
Similar to the identification and assessment process, risk factor quantification involvesmultiple project team disciplines and functions. However, the quantification processrelies more extensively on collaboration between cost engineering, designers, and riskanalysis team members with lesser inputs from other functions and disciplines.
The following is an example of the PDT quantifying risk factor impacts by using aniterative, consensus-building approach to estimate the elements of each risk factor:
• Maximum possible value for the risk factor.• Minimum possible value for the risk factor.• Most likely value (the statistical mode), if applicable.• Nature of the probability density function used to approximate risk factor
uncertainty.• Mathematical correlations between risk factors.• Affected cost estimate and schedule elements.

8/18/2019 Risk Army Guidance
http://slidepdf.com/reader/full/risk-army-guidance 68/74
6
In this example, the risk discussions focused on the various project features aspresented within the USACE Civil Works Work Breakdown Structure for cost accountingpurposes. It was recognized that the various features carry differing degrees of risk asrelated to cost, schedule, design complexity, and design progress. The examplefeatures under study are presented in table 1:
Table 1. Work Breakdown Structure by Feature
01 LANDS AND DAMAGES
02 RELOCATIONS
09 CHANNELS & CANALS
11 LEVEES & FLOODWALLS
13 PUMPING PLANT
30PLANNING, ENGINEERING &DESIGN
31 CONSTRUCTION MANAGEMENT
The resulting product from the PDT discussions is captured within a risk register aspresented in section 6 for both cost and schedule risk concerns. Note that the riskregister records the PDT’s risk concerns, discussions related to those concerns, andpotential impacts to the current cost and schedule estimates. The concerns anddiscussions are meant to support the team’s decisions related to event likelihood,impact, and the resulting risk levels for each risk event.
4.3 Analyze Cost Estimate and Schedule Contingency
Contingency is analyzed using the Crystal Ball software, an add-in to the MicrosoftExcel format of the cost estimate and schedule. Monte Carlo simulations are performedby applying the risk factors (quantified as probability density functions) to theappropriate estimated cost and schedule elements identified by the PDT.Contingencies are calculated by applying only the moderate and high level risksidentified for each option (i.e., low-level risks are typically not considered, but remainwithin the risk register to serve historical purposes as well as support follow-on riskstudies as the project and risks evolve).
For the cost estimate, the contingency is calculated as the difference between the P80cost forecast and the base cost estimate. Each option-specific contingency is thenallocated on a civil works feature level based on the dollar-weighted relative risk of eachfeature as quantified by Monte Carlo simulation. Standard deviation is used as thefeature-specific measure of risk for contingency allocation purposes. This approachresults in a relatively larger portion of all the project feature cost contingency beingallocated to features with relatively higher estimated cost uncertainty.
For schedule contingency analysis, the option schedule contingency is calculated as thedifference between the P80 option duration forecast and the base schedule duration.These contingencies are then used to calculate the time value of money impact of

8/18/2019 Risk Army Guidance
http://slidepdf.com/reader/full/risk-army-guidance 69/74
7
project delays that are included in the presentation of total cost contingency in section 6.The resulting time value of money, or added risk escalation, is then added into thecontingency amount to reflect the USACE standard for presenting the “total project cost”for the fully funded project amount.
Schedule contingency is analyzed only on the basis of each option and not allocated tospecific tasks. Based on Cost Engineering DX guidance, only critical path and nearcritical path tasks are considered to be uncertain for the purposes of contingencyanalysis.
5. KEY ASSUMPTIONS
Present key assumptions in this section. Certain assumptions may be dictated by thecustomer. Other assumptions may be assumed by the risk analyst or cost engineer.Key assumptions are those that are most likely to significantly effect the determinationsand/or estimates of risk presented in the risk analysis. The key assumptions areimportant to help ensure that project leadership and other decision makers understand
the steps, logic, limitations, and decisions made in the risk analysis, as well as anyresultant limitations on the use of outcomes and results. (Certain risks may have beenexcluded due to USACE or PDT guidance – these should be mentioned.)
The following is an example of key assumptions for the risk analysis that could beidentified by the PDT and risk analyst.
• Address design stage.• Address confidence in design scope.• Address any critical inclusions or exclusions of scope or risk.• Address any sunk or expended costs not included within the risk study.• Address life cycle costs, whether included or excluded.• Address operations and maintenance, whether included or excluded.• Address major features.• Address congressional authorization.• Address funding profiles.• Address contract acquisition strategy.• Address ATR status: successfully complete, incomplete, or unsatisfactory.• Address feature cost accounts.• Address confidence and quality of cost estimates and project schedules.• Address the contingency confidence level recommended within the report.•
Address which impact levels were studied or applied within the risk analysis.These relate to the high, moderate, or low risk level ratings (generally, thehigh and moderate risk levels are studied).
6. RISK ANALYSIS RESULTS
Present the risk products and results in narrative form as well as tables andfigures including the cost and schedule risk analysis results. In addition to

8/18/2019 Risk Army Guidance
http://slidepdf.com/reader/full/risk-army-guidance 70/74
8
contingency calculation results, sensitivity analyses provide decision makers with anunderstanding of variability and the key contributors to the cause of this variability.
6.1 Risk Register
A risk register is a tool commonly used in project planning and risk analysis and servesas the basis for the risk studies and Crystal Ball risk models. A summary risk registerthat includes typical risk events studied (high and moderate levels) should be presentedin a table in this section. The risk register reflects the results of risk factor identificationand assessment, risk factor quantification, and contingency analysis. A more detailedrisk register would be provided in appendix A. The detailed risk registers of appendix Ainclude low level and unrated risks, as well as additional information regarding thespecific nature and impacts of each risk.
It is important to note that a risk register can be an effective tool for managing identifiedrisks throughout the project life cycle. As such, it is generally recommended that riskregisters be updated as the designs, cost estimates, and schedule are further refined,
especially on large projects with extended schedules. Recommended uses of the riskregister going forward include:
• Documenting risk mitigation strategies being pursued in response to theidentified risks and their assessment in terms of probability and impact.
• Providing project sponsors, stakeholders, and leadership/management with adocumented framework from which risk status can be reported in the contextof project controls.
• Communicating risk management issues.• Providing a mechanism for eliciting risk analysis feedback and project control
input.• Identifying risk transfer, elimination, or mitigation actions required for
implementation of risk management plans.
In simple terms, a correlation is a dependency that exists between two risks and maybe direct or indirect. An indirect correlation is one in which large values of one risk areassociated with small values of the other. Indirect correlations have correlationcoefficients between 0 and -1. A direct correlation is one in which large values of onerisk are associated with large values of the other. Direct correlations have correlationcoefficients between 0 and 1.
Correlations are important to understand the logic used in the risk analyses. The
mathematical correlations used in the Monte Carlo simulations are as follows:
• Present any risk event correlations, addressing their relationships.• Present the final risk register or the condensed version. At a minimum
include those risk events studied (an appendix can include the complete riskregister): Risk event identifying number. Risk or opportunity event.
8/18/2019 Risk Army Guidance
http://slidepdf.com/reader/full/risk-army-guidance 71/74
9
PDT concerns. PDT discussions. Project cost likelihood, impact, and risk level. Project schedule likelihood, impact, and risk level,
Insert table containing a condensed risk register table.6.2 Cost Risk Analys is - Cost Contingency Results
Provide a cost contingency narrative presentation of the results followed by tablespresented from the Crystal Ball reports depicting the:
• Cost sensitivity chart.• Confidence tables in 10 percent increments of confidence associated with
dollars.• Confidence curves relationship of percent confidence with contingencies in
dollars (build from confidence tables).
Make note that these results reflect only those contingencies established from the costrisk analysis.
6.3 Schedule Risk Analys is - Schedule Contingency Results
Provide a schedule contingency narrative presentation of the results followed by tablespresented from the Crystal Ball reports depicting the:
• Schedule sensitivity chart.• Schedule confidence tables in 10 percent increments of confidence
associated with months.• Schedule confidence curves with contingencies (build from confidence
tables).
Make note that these results reflect only those contingencies established from theschedule risk analysis.
6.4 Combined Cost and Schedule Contingency Resul ts
Provide a brief narrative presentation of the combined cost and schedule resultsfollowed by tables depicting (combined tables of cost and schedule reports):
• Cost confidence table in percent confidence with contingencies in dollars.• Schedule confidence table in percent confidence with contingencies in
months.
7. MAJOR FINDINGS/OBSERVATIONS
Present the major findings and observations for both the cost and schedule riskanalysis. It is beneficial to refer back to the key assumptions and how they relate to the

8/18/2019 Risk Army Guidance
http://slidepdf.com/reader/full/risk-army-guidance 72/74
10
findings and observations. Present the total cost summary at 10 percent confidenceintervals unless otherwise directed. Provide a summary of significant risk analysisresults in this section, which have been identified in the preceding sections of the report.Risk analysis results are intended to provide project leadership with contingencyinformation for scheduling, budgeting, and project control purposes, as well as to
provide tools to support decision making and risk management as projects progressthrough planning and implementation. Because of the potential for use of risk analysisresults for such diverse purposes, this section also reiterates and highlights importantsteps, logic, key assumptions, limitations, and decisions to help ensure that the riskanalysis results are appropriately interpreted. Table 2 presents project contingencies,which include base cost plus cost and schedule contingencies. Figure 2 illustrates thetotal project cost risk analysis in confidence curve.
Table 2. Sample Project Contingencies (Base Cost Plus Cost and ScheduleContingencies)
Confidence
LevelProject Cost Contingency ($) Contingency
(%)P0 $46,955,000 ($4,875,000) -9%
P10 $56,233,000 $4,403,000 8%
P20 $58,669,000 $6,839,000 13%
P30 $60,784,000 $8,954,000 17%
P40 $62,997,000 $11,167,000 22%
P50 $65,857,000 $14,027,000 27%
P60 $71,467,000 $19,637,000 38%
P70 $85,760,000 $33,930,000 65%
P80 $106,150,000 $54,320,000 105%
P90 $136,226,000 $84,396,000 163%
P100 $262,998,000 $211,168,000 407%

8/18/2019 Risk Army Guidance
http://slidepdf.com/reader/full/risk-army-guidance 73/74
11
$0
$50,000,000
$100,000,000
$150,000,000
$200,000,000
$250,000,000
$300,000,000
P0 P10 P20 P30 P40 P50 P60 P70 P80 P90 P100
E s t i m a t e d T o t a l P r o j e c t C o s t
Confidence
Level
Total
Project
Cost
Risk
Analysis
Figure 1. Sample of Project Confidence Curves
8. MITIGATION RECOMMENDATIONS
Present key recommendations that may assist in mitigating risks. Present anyrecommendations for opportunities for both cost and schedule.

8/18/2019 Risk Army Guidance
http://slidepdf.com/reader/full/risk-army-guidance 74/74
APPENDIX A
DETAILED RISK REGISTERS
(Present the detailed Risk Register here, covering all risk events, regardless oflow, medium, or high risk concerns)