risk and vulnerability assessment of expanding the...
TRANSCRIPT

Risk and Vulnerability Assessment of
Expanding the Windhoek Drinking Water
Supply Master of Science Thesis in the Master’s Programme Geo and Water Engineering
SOFIE FLOD, HANNA LANDQUIST
Department of Civil and Environmental Engineering
Division of GeoEngineering
CHALMERS UNIVERSITY OF TECHNOLOGY
Göteborg, Sweden 2010
Master’s Thesis 2010:48

MASTER’S THESIS 2010:48
Risk and Vulnerability Assessment of Expanding the
Windhoek Drinking Water Supply
Master of Science Thesis in the Master’s Programme Geo and Water Engineering
SOFIE FLOD, HANNA LANDQUIST
Department of Civil and Environmental Engineering
Division of GeoEngineering
CHALMERS UNIVERSITY OF TECHNOLOGY
Göteborg, Sweden 2010

Risk and Vulnerability Assessment of Expanding the Windhoek Drinking Water
Supply
Master of Science Thesis in the Master’s Programme Geo and Water Engineering
SOFIE FLOD, HANNA LANDQUIST
© SOFIE FLOD & HANNA LANDQUIST, 2010
Examensarbete / Institutionen för bygg- och miljöteknik,
Chalmers tekniska högskola
Department of Civil and Environmental Engineering
Division of GeoEngineering
Chalmers University of Technology
SE-412 96 Göteborg
Sweden
Telephone: + 46 (0)31-772 1000
Chalmers Reproservice / Department of Civil and Environmental Engineering

Göteborg, Sweden 2010


CHALMERS, Civil and Environmental Engineering, Master’s Thesis 2010:48 I
Risk and Vulnerability Assessment of Expanding the Windhoek Drinking Water
Supply
Master of Science Thesis in the Master’s Programme Geo and Water Engineering
SOFIE FLOOD & HANNA LANDQUIST
Department of Civil and Environmental Engineering
Division of GeoEngineering
Chalmers University of Technology
ABSTRACT
The overall aim with this project was to provide a structured and operational method
for conducting risk assessments concerning projects for expansion of water supplies,
which might become an issue for Namibia’s capital Windhoek in the close future.
This report also aimed to serve as a pre-study for a possible expansion of the
Windhoek water supply and as a basis for further more detailed studies.
This project was performed by identifying advantages and limitations of an expansion
of the current water scheme through the construction of a pipeline between the cities
Windhoek and Rehoboth, located approximately 90 km apart. The possible limitations
were identified by conducting a Failure Modes, Effects and Criticality Analysis
(FMECA), which identifies related risks to the system. One possible action for
increasing the feasibility of a water expansion project of this kind can be to find
further water abstraction points along the pipeline to increase the total available
quantity of water to the system. Such extraction points can be vulnerable to pollution
and should therefore be subject to a specific risk assessment. This master thesis
provides an example method for conducting such a risk assessment and the extraction
point chosen is the aquifer of the Omeya golf and residential oasis at the Gross
Haigamas farm about 30 km south of Windhoek.
The FMECA identified in total 22 failure causes to the possible pipeline, of which 3
falls in the unacceptable risk (red) category, 13 within the potentially unacceptable
risk (yellow) category, and 6 within the acceptable risk (green) category. The failure
causes that were found within the unacceptable risk category are: accidental damage,
flash floods and polluted water into the system. The risk assessment for the aquifer of
the Omeya golf and residential Oasis at the Gross Haigamas farm identified areas
where the most vulnerable ground material coincided with the largest possible sources
of pollution, thus the areas of highest risk to groundwater pollution.
Recommended mitigation measures for an expanded water supply via a pipeline are
careful planning of the pipeline stretch and well engineered material and construction.
Key words: Risk assessment, FMECA, vulnerability, water supply, aquifer, Namibia,
Windhoek.
CHALMERS, Civil and Environmental Engineering, Master’s Thesis 2010:48 II
Risk och sårbarhetsbedömning av en expansion av Windhoeks försörjningssystem för
dricksvatten
Examensarbete inom Geo and Water Engineering
SOFIE FLOD & HANNA LANDQUIST
Institutionen för bygg- och miljöteknik
Avdelningen för Geologi och Geoteknik
Chalmers tekniska högskola
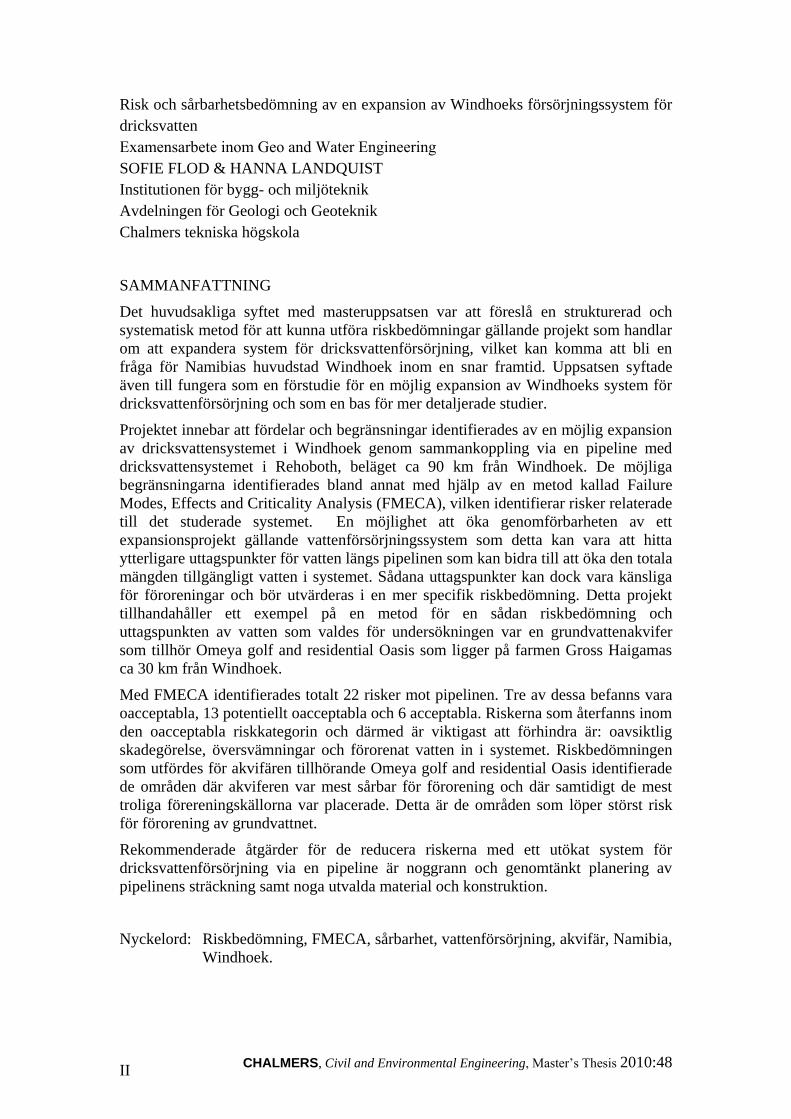
SAMMANFATTNING
Det huvudsakliga syftet med masteruppsatsen var att föreslå en strukturerad och
systematisk metod för att kunna utföra riskbedömningar gällande projekt som handlar
om att expandera system för dricksvattenförsörjning, vilket kan komma att bli en
fråga för Namibias huvudstad Windhoek inom en snar framtid. Uppsatsen syftade
även till fungera som en förstudie för en möjlig expansion av Windhoeks system för
dricksvattenförsörjning och som en bas för mer detaljerade studier.
Projektet innebar att fördelar och begränsningar identifierades av en möjlig expansion
av dricksvattensystemet i Windhoek genom sammankoppling via en pipeline med
dricksvattensystemet i Rehoboth, beläget ca 90 km från Windhoek. De möjliga
begränsningarna identifierades bland annat med hjälp av en metod kallad Failure
Modes, Effects and Criticality Analysis (FMECA), vilken identifierar risker relaterade
till det studerade systemet. En möjlighet att öka genomförbarheten av ett
expansionsprojekt gällande vattenförsörjningssystem som detta kan vara att hitta
ytterligare uttagspunkter för vatten längs pipelinen som kan bidra till att öka den totala
mängden tillgängligt vatten i systemet. Sådana uttagspunkter kan dock vara känsliga
för föroreningar och bör utvärderas i en mer specifik riskbedömning. Detta projekt
tillhandahåller ett exempel på en metod för en sådan riskbedömning och
uttagspunkten av vatten som valdes för undersökningen var en grundvattenakvifer
som tillhör Omeya golf and residential Oasis som ligger på farmen Gross Haigamas
ca 30 km från Windhoek.
Med FMECA identifierades totalt 22 risker mot pipelinen. Tre av dessa befanns vara
oacceptabla, 13 potentiellt oacceptabla och 6 acceptabla. Riskerna som återfanns inom
den oacceptabla riskkategorin och därmed är viktigast att förhindra är: oavsiktlig
skadegörelse, översvämningar och förorenat vatten in i systemet. Riskbedömningen
som utfördes för akvifären tillhörande Omeya golf and residential Oasis identifierade
de områden där akviferen var mest sårbar för förorening och där samtidigt de mest
troliga förereningskällorna var placerade. Detta är de områden som löper störst risk
för förorening av grundvattnet.
Rekommenderade åtgärder för de reducera riskerna med ett utökat system för
dricksvattenförsörjning via en pipeline är noggrann och genomtänkt planering av
pipelinens sträckning samt noga utvalda material och konstruktion.
Nyckelord: Riskbedömning, FMECA, sårbarhet, vattenförsörjning, akvifär, Namibia,
Windhoek.

CHALMERS, Civil and Environmental Engineering, Master’s Thesis 2010:48 III
Contents
ABSTRACT
SAMMANFATTNING
CONTENTS
PREFACE
NOTATIONS
EQUATIONS
1 INTRODUCTION 1
1.1 Background 1
1.2 Aim and objectives 2
1.3 Delimitations 3
1.4 Disposition of the Report 3
2 THE RISK ASSESSMENT PROCESS 5
2.1 Foundations of the risk assessment process 5
2.2 Risk assessment concepts 6
2.3 The risk analysis process 7
2.4 The risk evaluation process 8
3 WATER AS A RESOURCE 9
3.1 Water scarcity 9
3.2 Water in Namibia 10
4 GENERAL AREA DESCRIPTION 18
4.1 Topography and climate 18
4.2 Geology 19
4.3 Hydrogeology 19
4.4 General description of the area between Windhoek and Rehoboth 21
5 WATER SUPPLY DESCRIPTIONS 22
5.1 The water supply in Windhoek 22
5.2 The water supply in Rehoboth 25
5.3 The possible pipeline connection 27
CHALMERS, Civil and Environmental Engineering, Master’s Thesis 2010:48 IV
6 METHODS 28
6.1 Overview of the methodological application 28
6.2 The FMECA methodology 29
6.3 Method for risk and vulnerability assessment of pollution of groundwater 32
6.4 Identification of advantages 42
7 FMECA FOR A POSSIBLE PIPELINE 43
7.1 Scope 43
7.2 Hierarchical holographic model (HHM) for the pipeline 43
7.3 Table of identified risks 44
7.4 Discussion 47
7.5 Conclusions 49
8 CASE STUDY OF THE OMEYA GOLF AND RESIDENTIAL OASIS 50
8.1 Introduction 50
8.2 Results of the risk assessment of groundwater contamination 59
8.3 Identified possible sources of pollution 63
8.4 Risk estimation 66
8.5 Discussion 67
8.6 Conclusions 67
9 ADVANTAGES OF EXPANDING THE WATER SUPPLY 68
9.1 Introduction 68
9.2 Further extraction points along the pipeline 68
9.3 Supply of new developments 69
9.4 Emergency supply for Windhoek and Rehoboth 69
10 DISCUSSION 71
10.1 Evaluation of the methodological implementation 71
10.2 Discussion concerning the project as a pre-study for further investigations 74
11 CONCLUSIONS 77
REFERENCES 78
APPENDICES

CHALMERS, Civil and Environmental Engineering, Master’s Thesis 2010:48 V

CHALMERS, Civil and Environmental Engineering, Master’s Thesis 2010:48 VI
Preface and acknowledgements
This master´s thesis was performed during the spring of 2010 at Chalmers University
of Technology in cooperation with the Ministry of Agriculture, Water and Forestry
(MAWF) in Windhoek Namibia. The collection of the data needed for performing the
thesis took place in Namibia during a 9 week visit and field study. The project was
partially financed by a Minor Field Study (MFS) scholarship from the Swedish
International Development Cooperation Agency (SIDA) and a scholarship from
Chalmers Master Card foundation.
We would like to express a great gratitude to our supervisors Professor Lars Rosén,
LicEng Andreas Lindhe and Deputy Director of Geohydrology at the Department of
Water Affairs at the MAWF, Greg Christelis. Thank you for informative and inspiring
discussions and constructive response. We would also like to thank Nils Kellgren at
SWECO for very helpful support during the last stage of this project and Annika
Malm for supplying us with information about pipelines and water distribution
systems.
We would also like to thank a number of people working with water related issues in
Namibia; Frank Bochmühl, Henry Beukes, Hanjörg Drews, N P Du Plessis, Peter Du
Plessis, John Eterhuisen, Martin Harris, Israel Hasheela, Piet Heyns, Jürgen Kirchner,
Lothar Menge, Chris Muir, Immo Peters, Diganta Sarma, Penny Shidute, Koos
Theron, Ben van der Merwe and André van der Walt.
Finally we would like to thank our friends and families for their encouragement,
patience and support and Emma Kullgren and Jennie Perdell for their companionship
and support during this project.
Göteborg June 2010
Sofie Flod and Hanna Landquist
CHALMERS, Civil and Environmental Engineering, Master’s Thesis 2010:48 VII
L fin1
5Li
i 1
5
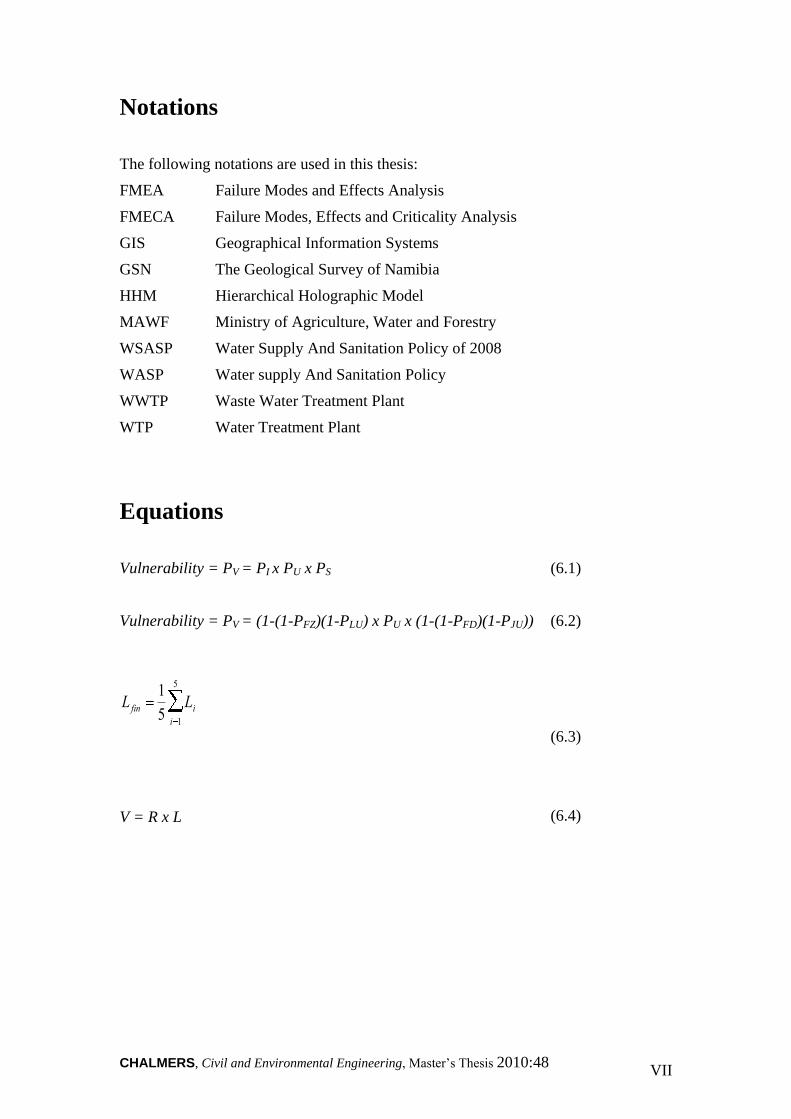
Notations
The following notations are used in this thesis:
FMEA Failure Modes and Effects Analysis
FMECA Failure Modes, Effects and Criticality Analysis
GIS Geographical Information Systems
GSN The Geological Survey of Namibia
HHM Hierarchical Holographic Model
MAWF Ministry of Agriculture, Water and Forestry
WSASP Water Supply And Sanitation Policy of 2008
WASP Water supply And Sanitation Policy
WWTP Waste Water Treatment Plant
WTP Water Treatment Plant
Equations
Vulnerability = PV = PI x PU x PS (6.1)
Vulnerability = PV = (1-(1-PFZ)(1-PLU) x PU x (1-(1-PFD)(1-PJU)) (6.2)
(6.3)
V = R x L (6.4)


CHALMERS, Civil and Environmental Engineering, Master’s Thesis 2010:48 1
1 Introduction
This chapter provides background and aims and objectives of this master’s thesis.
Delimitations and the disposition of the report to guide the reader through the report
are also presented.
1.1 Background
“Imbalances between availability and demand, the degradation of groundwater and
surface water quality, intersectorial competition, interregional and international
conflicts, all contributes to water scarcity” (FAO, 2010).
Today one in three people in the world are affected by water scarcity (WHO, 2010)
and it is estimated that by the end of 2025 1.8 billion people will be living in countries
or regions with absolute water scarcity (UNDP, 2006). Namibia is the driest country
south of the Sahara and has a potential evaporation exceeding the potential
precipitation (Heyns et al., 1998). The country also suffers from sporadic droughts
(LCE, 2008).
There are a number of threats to drinking water quality and one of them, pollution,
typically occurs in connection to development of human societies. Agriculture,
urbanization and industry are causing pollution and the diversity and scale have
increased rapidly in recent times (UNEP, 2003). Rapid population growth is one of
the major challenges in preventing groundwater pollution and even if pollution levels
in Namibia are generally low, a growing population and an expanding development
will increase the amount of toxic substances in nature and water. Increased pollution
will not only affect human health and environment but also the economic growth of
Namibia (Tarr, 2002).
WHO (2008) states that access to safe drinking water is a basic human right and also
important as a health and development issue. Moreover it is the aim of the millennium
development goal number seven to halve the proportion of people without basic
sanitation and sustainable access to safe drinking water (UN, 2009). In some regions it
has been shown that investments in sanitation and water supply reduce adverse health
effects and cost, thus creating a net benefit for the investor. Actions in improving
access to safe water have also proven to have the ability to be an effective measure of
reducing poverty.
Without water, life cannot be sustained and a safe, accessible and adequate supply
must be provided to all. Windhoek, the capital of Namibia, daily supplies about
240,000 consumers with drinking water (City of Windhoek, 2010). Rehoboth, located
87 km south of Windhoek, supplies a smaller amount, about 40,000 people (Strauss,
cited in Kullgren & Perdell, 2010) with their daily needs. In between the two cities
few people live today but much development is taking place (Bochmühl, 2010), for
example the Omeya golf and residential oasis situated approximately 30 km south of
Windhoek.
To ensure a long term sustainable water supply and to expand the water scheme, the
City of Windhoek is investigating the possibility of building a pipeline between
Windhoek and Rehoboth to be able to pump water from the Oanob dam to Windhoek
(Christelis, 2010). Actions to increase the economic viability of such a project can be
to identify additional water supply sources to increase the available amount of water

CHALMERS, Civil and Environmental Engineering, Master’s Thesis 2010:48 2
to the system and to possible developments along the pipeline in need of water. It
could also be of interest to include the possibility to pump water from Windhoek to
Rehoboth in case of a temporarily increased need of water in Rehoboth.
The master thesis “Vulnerability and risk assessment of artificial recharge of the
Oanob aquifer” by Kullgren & Perdell (2010) has been performed parallel with this
master thesis. The thesis examines the possibility for artificial recharge of the Oanob
aquifer in Rehoboth from a risk and vulnerability perspective. If artificial recharge
would be implemented in Rehoboth, this could result in more available drinking water
for both Windhoek and Rehoboth.
WHO (2008) argues that a comprehensive holistic risk assessment and risk
management are the most effective means of ensuring the safety of a water supply. A
possible pipeline to expand the water supply scheme for Windhoek will be exposed to
a number of threats, which result in risks of both water supply interruptions and
pollution. It is thus important to identify the hazards and the consequences and
probabilities related to evaluate the risk and safety of the suggested expansion
scheme.
There are a number of methods for assessing and evaluating risks, and a risk analysis
is according to the International standard 300-3-9 (IEC, 1995) “a structured process
that identifies both the likelihood and extent of adverse consequences arising from a
given activity, facility or system”. A method applied in risk assessments is the Failure
Modes, Effects and Criticality Analysis (FMECA) which is a qualitative analysis
where elements of the systems and correlated possible failure causes are identified.
Further, possible effects of each failure cause are identified and a risk ranking of the
failure causes is performed (Tweedale, 2003).
In this study the FMECA methodology and also the HHM (Hierarchical Holographic
Model) was applied for investigating the feasibility of a pipeline between Windhoek
and Rehoboth for an extended water supply scheme for the central area of Namibia. In
addition, the risks of groundwater pollution of the groundwater aquifer at the Omeya
golf and residential Oasis were performed as a basis for evaluating the possibilities for
connecting the aquifer to the pipeline.
1.2 Aim and objectives
The overall aim was to provide a structured and operational method for conducting
risk assessments concerning projects for expansion of water supplies, which might
become an issue for Windhoek in the close future. This report also aimed to serve as
pre-study for a possible expansion of the Windhoek water supply and as basis for
further detailed studies.
This project was performed by identifying advantages and limitations of an expansion
of the water scheme and thus the pipeline between Windhoek and Rehoboth. The
possible limitations were identified by conducting an FMECA and by this method
also related risks to the system was identified. One possible action for increasing the
feasibility of a water expansion project of this kind can be to find additional water
extraction points to increase the total available water quantity to the system. Such
extraction points can be vulnerable to pollution and should therefore be subject to a
specific risk assessment. The report provides an example method for conducting such
risk assessment.
CHALMERS, Civil and Environmental Engineering, Master’s Thesis 2010:48 3
The specific objectives of the project were:
- To identify advantages of connecting the water distribution systems of
Windhoek and Rehoboth via a pipeline.
- To identify and assess vulnerabilities and hazards related to the possible
pipeline between Windhoek and Rehoboth.
- To assess the vulnerability of one possible extraction point along the
pipeline and to identify relevant hazards.
- To combine the vulnerability and information on hazards into risk
assessments; one for the pipeline and another for the extraction point.
1.3 Delimitations
The risk assessment connecting the water supply of Windhoek and Rehoboth provides
a general overview of risks. At this stage, when the stretch, selection of material,
dimensions, or if the system will be open or closed have not been decided upon, a
detailed investigation is not possible. Therefore, this was an early stage risk
assessment not including any events of force majeure but rather looking at
operational, functional and social risks to a failure of the pipeline. This risk
assessment is meant to function as a pre-study, thus more thorough investigation
might be needed if the expansion project would go further.
Investigations concerning advantages of expanding the Windhoek water supply were
based on interviews and questionnaires with relevant people. Logic reasoning is the
core for the investigation of advantages and to derive limitations the FMECA method
is partly used.
For the risk assessment of the pipeline, FMECA was chosen as method. The
assessment included definition of scope, definition of the level of detail, identification
failure causes and effects, and assessments of the severity of the failure modes. This
report focused on identification and classification of risks as a basis for prioritisation
of risk reduction measures.
The case study for the area of the Omeya golf and residential resort at the Haigamas
farm was based on a methodology used to assess the risks to groundwater in the
Windhoek area (IN & SCC, 2000) providing a risk map suggesting where to be
careful of contaminating activities. Little focus was here put on mitigation.
1.4 Disposition of the Report
Initially the reader will be presented to the aims and objectives of this master’s thesis
and hopefully brought to an interest of the subject. After this the overall risk
assessment process applied is described, and further on background information
concerning water as a resource both worldwide and in Namibia is given.
On this follows a general area description to orientate the reader of what
characteristics affect water supply in terms of natural preconditions. Also a closer
description of the area between the two cities, to give background information on the
opportunity of extracting more water along a possible pipeline, is given. Subsequently
a description of the water supplies of Windhoek and Rehoboth is presented to give an
overview of what components are included in supplying parts of central Namibia with
water.
CHALMERS, Civil and Environmental Engineering, Master’s Thesis 2010:48 4
The next chapter describes the different methods applied to conduct the risk
assessment. The methods for identifying hazards and limitations to the project, the
FMECA and the HHM as well as the method for analysis of groundwater risk and
vulnerability assessment is presented along with how the advantages of a possible
pipeline for water transport are derived. The reader is then presented to the actual
studies performed on risks to a possible pipeline and risk of groundwater pollution in
a specific area along the pipeline along with the results, a discussion and conclusions
related to each part of the study.
After this there is a discussion on the applicability of the risk analysis methods
performed along with a discussion on advantages and limitations on expanding the
Windhoek water supply by a pipeline. Lastly the conclusions of the study are
presented.

CHALMERS, Civil and Environmental Engineering, Master’s Thesis 2010:48 5
2 The risk assessment process
This chapter describes a general risk assessment process. Some risk analysis concepts
are presented and the parts of the risk assessment, risk analysis and risk evaluation
are described separately.
2.1 Foundations of the risk assessment process
The International standard Risk analysis of technological systems (IEC, 1995) upon
which this study is based, generally aim to answer three central questions;
- What can go wrong?
- How likely is this to happen?
- What are the consequences?
The first question is investigated by hazard identification, secondly the likelihood is
estimated by frequency analysis and the third question is investigated by consequence
analysis. The specific study presented in this report identified hazards, analysed
frequency and consequence by the FMECA and HHM methods, further described in
Chapter 6.2. A case study to more thoroughly investigate risks to the system, thus
risks to a part of the water supply, was performed through a risk and vulnerability
assessment method developed in the Windhoek report (IN & SSC, 2000), described in
Chapter 6.3.
The risk assessment was performed by compiling the estimated risks into a risk matrix
where risks are evaluated by a specific number derived from estimates of frequency
and consequence. This matrix described what risks are tolerable by a ranking
procedure and a discussion was carried out to analyse the options.
Figure 2.1 The risk management process (IEC, 1995).

CHALMERS, Civil and Environmental Engineering, Master’s Thesis 2010:48 6
Risk analysis is a structured procedure describing both the likelihood and extent of
adverse consequences from a specific system or facility. In this standard, the adverse
consequences of concern are physical harm to property, people or the environment.
The IEC standard focuses on describing the process of risk analysis, whereas this
report comprises a more extended risk assessment. This infers that it also includes risk
evaluation (see Figure 2.1), where risk tolerability decisions and an analysis of
options are parts of the process.
2.2 Risk assessment concepts
There are a number of concepts and terms in risk analysis and risk assessment and to
clarify the actual meaning a selection of frequent words are described below. There is
of course an extensive nomenclature in the case of risk assessment and the selection
below is chosen to fit this very project to avoid unnecessary confusion and
communicative problems. The definitions are quoted from the standard developed by
IEC (1995).
Hazard
“Source of potential harm or a situation with a potential for harm.”
Hazard identification
“Process of recognizing that a hazard exists and defining its characteristics.”
Risk
“Combination of the frequency, or probability, of occurrence and the
consequence of a specified hazardous event.”
Risk analysis
“Systematic use of available information to identify hazards and to estimate
the risk to individuals or populations, property or the environment”
Risk assessment
“Overall process of risk anlysis and risk evaluation.”
Risk control
“Process of decision-making for managing and/or reducing risk; its
implementation, enforcment and re-evaluation from time to time, using the
results of risk assessment as one input.”
Risk estimation
“Process used to produce a measure of the level of risks being anaylsed. Risk
estimation consist of the following steps: frequency analysis, consequence
analysis and their integration.”
System
“Composite entity, at any level of complexity, of personnel, procedures,
materials, tools equipment, facilities and software. The elements of this
composite entiy are used together in the intended operational or support
environment to perform a given task or achieve a specific objective.”
CHALMERS, Civil and Environmental Engineering, Master’s Thesis 2010:48 7
2.3 The risk analysis process
In order to increase effectiveness and objectivity of a risk analysis, a number of steps
should be followed. This can also facilitate the comparison with other analyses. The
steps are as follows.
Scope definition;
Hazard identification and initial consequence evaluation;
Risk estimation;
Verification;
Documentation;
Analysis update.
The scope should make up a basis for a risk analysis plan and should include a
background to the problem, well formulated objectives and criteria for failure or
success of the system. Further the system, limits and assumptions concerning the
project should be stated. Lastly also an identification of the decisions that have to be
made, the decision-makers and the required output from the study should be presented
(IEC, 1995).
The step of hazard identification and initial consequence evaluation implicate an
identification of hazard together with how those can be realized. To identify hazards
not previously known, formal methods should be used i.e. the FMECA which is
applied on this project. A study of the significance of the identified hazards should be
based on a consequence analysis. The analysis can be terminated here if no hazards
are found (IEC, 1995).
Following this is the risk estimation step with the purpose to investigate the events of
concern, mitigating features and nature and frequency of possible hazardous events
affecting the system. An uncertainty analysis should be performed and risk estimation
is conducted to measure the level of risk to the system (IEC, 1995).
There are qualitative and quantitative risk estimates where a qualitative estimate
expresses risk in words while a quantitative estimate expresses risk in numbers. The
quantitative analysis is the most common but there are not always enough information
to perform such an analysis. A combined analysis can then be done where involved
experts subjectively estimate the level of risks based on experience. When a
quantitative analysis has been carried out the accuracy of numbers should not be
overestimated since they are estimates and care should be taken they are not
considered more precise than the level of the analysis, data accuracy and/or the
methods employed (IEC, 1995).
As part of the risk estimation a frequency analysis should be carried out, which
estimates the likelihood of a certain hazardous event. A number of techniques can be
used such as use of relevant historical data and simulation, analytical techniques and
expert opinions. The first two are used together while the last one is utilised when the
other two are not sufficient. The use of many methods increases the confidence in the
study (IEC, 1995).
A consequence analysis is the next step estimating the probable impact of the
hazardous events and is based on the hazardous event selected and describes the
consequences of these events. It should consider both immediate and future
consequences as well as secondary consequences to related equipment and systems. It

CHALMERS, Civil and Environmental Engineering, Master’s Thesis 2010:48 8
is also emphasized that risk should be expressed in understandable and in suitable
terms (IEC, 1995).
Uncertainties are numerous when analysing risks and should therefore be well
examined. The sources of uncertainty should when possible be identified and
translated into the outputs of the risk model. Both data and model uncertainties are of
importance and also parameters sensitive for the analysis should be identified (IEC,
1995).
Some kind of verification to the assessment should be carried out to confirm the
integrity of the analysis. If field experience on the same issue is available, the
verification can be conducted by a comparison of the results. Formal reviewing
processes can also function as a verification of the study (IEC, 1995).
Documentation is made in the form of a report of the risk analysis process. This
should include or refer to the plan of the risk analysis and initial hazard evaluation
results and thoroughly present the technical information of the system. Strengths and
limitations of methods of measurement used should be explained and uncertainties
and risk estimates should be expressed in understandable terms. The scope and
objectives of the analysis will decide the extent of the report (IEC, 1995).
The analysis should be prepared for an analysis update if the risk analysis is
performed as a continuous process. The document can then be maintained during the
lifecycle of the system (IEC, 1995).
It is mentioned that a thorough knowledge of the analysis method and the system is
required. Further, the importance of investigator competence for the task is
emphasized. In many cases a group (“risk team”) rather than one person is needed to
fully understand a complex system and it is emphasized that the subject under
consideration should be well understood by the group. In certain cases expertise
knowledge is required which should then be specified and recorded. Not all elements
of the process are necessary in order to fulfil the scope of a certain risk analysis.
Rather the steps needed for the specific object are chosen (IEC, 1995).
2.4 The risk evaluation process
This report comprises a risk assessment and therefore includes risk evaluation
including risk tolerability decisions and an analysis of options. The Australian/New
Zealand standard Risk management (AS/NZS 4360:2004) states that the purpose of
the risk evaluation process is to make decisions about what risks to prioritise and treat
based on the outcome of the analysis.
Risk tolerability decisions are taken involving comparison of the level of risk with set-
up criteria. For example, in the analysis of options the balance between potential
benefits and adverse effects should be regarded. Risk should also be taken under
consideration not only affecting the organisation conducting the study. This will
facilitate decisions about extent and priorities and also about the type of treatments
required.
These processes are displayed in Chapter 7 and 8 through example studies. To further
expand the project a risk management perspective can be adopted where decision-
making, implementation and monitoring is applied.

CHALMERS, Civil and Environmental Engineering, Master’s Thesis 2010:48 9
3 Water as a resource
This chapter presents water as a resource and commences with a section about water
scarcity to be followed by a segment about the water in Namibia. The Water in
Namibia segment deals with how the water sector looks like in Namibia when it comes
to legislation, economy and sustainability.
3.1 Water scarcity
Water scarcity occurs when the demand for water is greater than the supply in a
country. Water scarcity can as well occur in regions with relatively plentiful supplies
of water. It all depends on the quality, distribution and the conservation of the water
(WHO, 2010). Also interregional and international conflicts and intersectional
competition contributes to water scarcity (FAO, 2010). Declining freshwater causes
water scarcity in terms of both quantity and quality (WHO, 2010). It is in the arid and
semiarid regions of the world that are affected by droughts and wide climate
variability combined with population growth and economic development, that the
problems of water scarcity are most urgent (FAO, 2010).
Water demand can either be consumptive or non-consumptive. The consumptive
water demand removes water from a source without directly returning it to the same
place in the environment. Non-consumptive water demand is when then used water
returns to the environment again, often with a reduced quality though. An example of
this is untreated municipal wastewater. Around 70 percent of the total water demand
on a global average is from the agricultural sector, 23 percent from the industry and 7
percent from the domestic sector. In dry areas these numbers are more distorted
towards agricultural use. The water supply of a community refers to the renewable
and non- renewable water that are available within a specific area (UOC, 2010).
Water scarcity can be either absolute or induced. Absolute water scarcity takes place
when a region has low precipitation and a large evaporation rate, while induced water
scarcity takes place when a country or a region does not have an adequate
development of their water resources. Critical conditions often arise in politically
weak and economically poor communities with already dry environments. Water
scarcity can be defined by the Falkenmark Water Stress Indicator, which is an index
that measures water availability on a per capita base (UOC, 2010).
Water scarcity affects one in three people around the world and today 1.2 billion
people live in areas where the water is scarce (WHO, 2010). One in five people in the
developing world lack access to sufficient clean water whereas people in e.g. some
parts of Europe have access to almost unlimited amounts of clean water (UNDP,
2006). Due to urbanization, population growth and a growing industry, the situation is
getting worse every year (WHO, 2010). By the year of 2025 it is estimated that there
will be 1.8 billion people living in countries or regions with absolute water scarcity. It
is people living in rural areas that suffer most when water scarcity occurs in a country
or region (UNDP, 2006).
People living in developing countries also face water shortages due to lack of methods
for collecting water from aquifers and rivers. When water scarcity occurs, people are
forced to rely on unsafe sources of drinking water and it also minimizes the
possibilities for them to clean themselves and their clothes. Poor water quality
increases the risk for different diseases, for example cholera and typhoid fever.
CHALMERS, Civil and Environmental Engineering, Master’s Thesis 2010:48 10
Storage of water is common in water scarce areas which can increase the risk for
contaminated water and the stored water also becomes a breeding ground for
mosquitoes that carry diseases like e.g. malaria and dengue fever. Due to a lack of
water the use of wastewater (containing chemicals and disease causing organisms) for
agricultural production has increased tremendously in poor communities (WHO,
2010).
In the year of 2000, world leaders set far-sighted goals that should free the poorest
people in the world from extreme hunger, poverty and diseases. Targets were
established for achieving gender equality and environmental sustainability and the
target date for most of the goals are set to 2015. One of the targets of the Millennium
Development Goal number seven aims to halve the proportion of people without
sustainable access to safe drinking water and basic sanitation by 2015. The Sub-
Saharan Africa has made notable progress in reaching the target and the population
that uses an improved sanitation facility has increased by over 80 percent since 1990.
The world is ahead of schedule in meeting the drinking water target, though some
countries still face huge challenges and water scarcity threatens the progress (UN,
2009).
To be able to manage growing water scarcity around the world, different approaches
need to be considered at both local and national river basin levels. A combination of
increased water use efficiency and sound policies could lead to sustainable solutions
within this complicated area (UOC, 2010). In situations where two or more countries
are sharing the same river basins and there is an absence of agreements or institutions
that controls this, a change within a basin can lead to instability between the involved
countries (WWC, 2009). Therefore collaboration between nations is necessary and a
multidisciplinary approach is needed in order to maximize economic and social
welfare in an equitable manner without compromising the sustainability in vital
ecosystems. Restoring and protection of ecosystems that naturally capture, filter, store
and release water is crucial for being able to increase the availability of water of good
quality (UNDP 2006).
3.2 Water in Namibia
Namibia is the driest country south of the Sahara and water is scarce. The country has
an arid to semiarid climate which means that the potential evaporation is bigger than
potential precipitation (Heyns et al., 1998). The average rainfall is much lower than
half of the world average and the water that exists in the country is spatially poorly
distributed. The country also suffers of heavy droughts periodic (LCE, 2008).
Namibia has a population of 2.1 million inhabitants and a population growth rate of
approximately 1 percent. As the population is growing every year, the demand for
water is increasing. The water in Namibia has to be shared between the growing
population, agriculture, the industry and other services that provide employment
(Heyns et al., 1998).
The Department of Water Affairs at the Ministry of Agriculture, Water and Forestry,
on behalf of the government, administers all water resources in Namibia. The
Department of Water Affairs consists of two directorates: the Directorate of Resource
Management and the Directorate of Rural Water Supply. The objectives for the
Directorates are:
CHALMERS, Civil and Environmental Engineering, Master’s Thesis 2010:48 11
1. Essential water supply and sanitation services should become available to all
Namibians, and should be accessible at a cost which is affordable to the
country as a whole.
2. This equitable improvement of services should be achieved by the combined
efforts of the government and the beneficiaries, based on community
involvement, community participation and the acceptance of mutual
responsibility.
3. Communities should have the right, with regard for environmental needs and
the resource available, to determine which solutions and service levels are
acceptable to them. Beneficiaries should contribute towards the cost of
services at increasing rates for standards of living exceeding the levels
required for providing basic needs.
The major supplier of bulk water in Namibia is the Namibia Water Corporation
(NamWater, 2006), which is a government owned corporation. NamWater was
established in 1997 and has been the bulk water supplier since 1998 and the objectives
of NamWater are to be found in the NamWater Act of 1997. The central
responsibilities of NamWater are provide bulk water to most of the major users in a
sustainable way, provide water at a cost that is affordable for all consumers and
manage the water at a full cost recovery basis with all necessary costs included
(MAWF, 2010). There are currently six water supply areas in Namibia, which are:
Cuvelai, Okavango, Brandberg, Khomas, Namib and Karas. Windhoek belongs to the
Khomas water supply area (LCE, 2008).
3.2.1 Legislation
The legislation for administration of water in Namibia is based on different articles,
acts and policies, where the following five are the most important:
The Namibian Constitution, Article 95
The Water Act, Act No 54 of 1956
The Water Resource Management Act, Act No 24 of 2004
The Water Supply and Sanitation Policy of 2008
The National Water Policy of Namibia, 2001
Article 95 of the Constitution presents the guiding principles for sustainable water
development in Namibia (Heyns et al., 1998). The Water Act, No 54 of 1956, is the
legislative framework for water management in Namibia and the purpose of the Act is
to manage the use and conservation of water for domestic, agricultural, urban and
industrial use. It covers topics concerning protection of surface and subsurface water.
Even though the Act is old, it is still legally compulsory in Namibia (ORASECOM,
2007). A major limitation with the Act is that it does not recognize the natural
environment as a user of water nor as a provider of essential processes and services.
Furthermore, it does not specify the sustainable use of water resources in terms of
economic, social and environmental sustainability (Heyns et al., 1998).

CHALMERS, Civil and Environmental Engineering, Master’s Thesis 2010:48 12
The Water Resource Management Act, No 24 of 2004, has not yet been implemented,
but will hopefully be implemented by the end of 2010. When the new Act is
implemented it will immediately replace the old one. The difference between the old
and the new Water Act is that the new one provides a more modern legal framework
for managing water resources, it classifies water as a national asset and has stronger
requirements when it comes to the standard of both the drinking water quality and the
effluent quality (ORASECOM, 2007). The treatment plants that exist in Namibia
today will not be able to reach the high standard of water quality that the new Act
demands. This means that penalty fees have to be paid until treatment plants that
could manage the new higher demands are built. The building of one new plant is
under discussion, but it is an expensive project meaning that finance is needed (Peters,
2010).
The Water Supply and Sanitation Policy of 2008 (WSASP) replaced the old Water
Supply and Sanitation Policy (WASP) from 1993 and has a strong focus on water
demand management (Republic of Namibia, 2008). The National Water Policy of
Namibia sets a good basis for improved water management and pollution control. The
policy states, amongst other things, that the management and planning of water
sources in Namibia will take into account social, economic and environmental issues.
It also states that in order to prevent and control water pollution, permits will be
issued for disposing effluents. The “polluter pays principle” will be introduced and
applied and reclamation of wastewater will be promoted (Tarr, 2002).
3.2.2 Economy
Water is essential for socio- economic development and for maintaining healthy
ecosystems (FAO, 2010). In Namibia and many other countries where water is scarce
an effective use of water is necessary. This can be a tough challenge when those
countries are most often developing countries with a lack of good infrastructure for
supplying water in an effective way. How Namibia develops affects the country’s
water resources, but the scarcity of water in Namibia also affects how the country can
develop. Because of the scarcity of water, it is expensive to supply. The cost of
supplying water in Namibia derives from the abstraction of groundwater,
transportation and damming of river water, treatment of the water and in some cases
desalination of seawater. The scarcity of water implies that there is a need to allocate
costs and prioritize between different water users and that an inefficient use of water
is a waste of money (Heyns et al., 1998). Figure 3.1 shows the different costs that are
relevant when it comes to water supply in general (LCE, 2008).
CHALMERS, Civil and Environmental Engineering, Master’s Thesis 2010:48 13
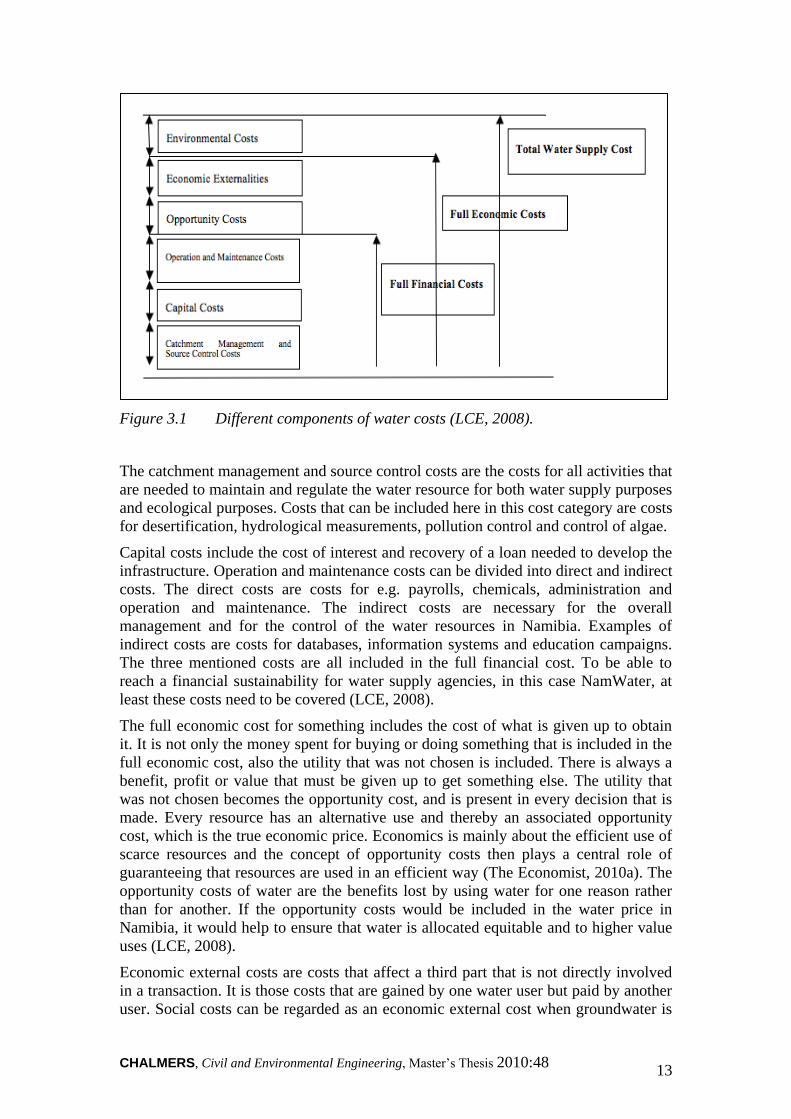
Figure 3.1 Different components of water costs (LCE, 2008).
The catchment management and source control costs are the costs for all activities that
are needed to maintain and regulate the water resource for both water supply purposes
and ecological purposes. Costs that can be included here in this cost category are costs
for desertification, hydrological measurements, pollution control and control of algae.
Capital costs include the cost of interest and recovery of a loan needed to develop the
infrastructure. Operation and maintenance costs can be divided into direct and indirect
costs. The direct costs are costs for e.g. payrolls, chemicals, administration and
operation and maintenance. The indirect costs are necessary for the overall
management and for the control of the water resources in Namibia. Examples of
indirect costs are costs for databases, information systems and education campaigns.
The three mentioned costs are all included in the full financial cost. To be able to
reach a financial sustainability for water supply agencies, in this case NamWater, at
least these costs need to be covered (LCE, 2008).
The full economic cost for something includes the cost of what is given up to obtain
it. It is not only the money spent for buying or doing something that is included in the
full economic cost, also the utility that was not chosen is included. There is always a
benefit, profit or value that must be given up to get something else. The utility that
was not chosen becomes the opportunity cost, and is present in every decision that is
made. Every resource has an alternative use and thereby an associated opportunity
cost, which is the true economic price. Economics is mainly about the efficient use of
scarce resources and the concept of opportunity costs then plays a central role of
guaranteeing that resources are used in an efficient way (The Economist, 2010a). The
opportunity costs of water are the benefits lost by using water for one reason rather
than for another. If the opportunity costs would be included in the water price in
Namibia, it would help to ensure that water is allocated equitable and to higher value
uses (LCE, 2008).
Economic external costs are costs that affect a third part that is not directly involved
in a transaction. It is those costs that are gained by one water user but paid by another
user. Social costs can be regarded as an economic external cost when groundwater is
CHALMERS, Civil and Environmental Engineering, Master’s Thesis 2010:48 14
exploited because it may gain costs to other users of the same aquifer (LCE, 2008).
External costs can then be both positive and negative, but either way they are not
reflected fully in the total price. External costs are a form of market failure since they
are not a part of calculations and the activity carried out causing the external cost will
be left to the free market, which is an inefficient use of resources (The Economist,
2010b). Therefore to be able to cover the full economic cost, both opportunity costs
and economic external costs need to be included. To cover the total water supply cost,
also the environmental cost needs to be included. Environmental costs are “costs” to
the environment. When water from a river system is used it may cause negative
effects such as loss of habitats for different species and reduced river flow. The
environmental costs are often not reflected in the water price and are seen as a specific
instance of economic externalities. Also the cost of maintaining an environmental
reserve for keeping natural ecosystems is regarded as an environmental cost.
There are different ways of obtaining an efficient use of the water in Namibia, and for
being able to keep an economic development in Namibia the same or a better output
must be reached. Drip irrigation can for example reach the same result as sprinklers,
but much less water is needed. Another option to increasing the water use in Namibia
is to use the same amount of water but for a greater benefit. One has to consider
where the water gives the most valuable result, filling up 330 swimming pools or
irrigating one hectare of crop production. At the same time the full cost must include
both opportunity and external costs for being able to obtain a sustainable value use,
which is needed for being able to achieve a sustainable development within Namibia
(Heyns et al., 1998).
Some industries are more water efficient than others and produce more output for less
water. When choosing appropriate water use all costs and benefits need to be
considered, not just the economic value. Job opportunities, ecosystem functions and
foreign exchange are examples of other areas that also need to be assessed in the
decisions (Heyns et al,. 1998). Due to Namibia´s scarcity of water, water supply
priorities have been formed, which are:
Priority 1: Water for domestic use
Priority 2: Water for economic activities
Those priorities can be found in The Water Supply and Sanitation Policy of 2008
(Republic of Namibia, 2010).
What kind of good water is can be discussed. It can be regarded as a private good with
public goodness attached to it, but it would probably be more correct to describe water
as a quasi public good. A public good means that it is a good available to all, and
nobody can be denied access to it. In an economic sense there is no reason why water
should not be treated as any other good though, especially when taking into account
that the real cost for the water attaches to the infrastructure of getting the water (LCE,
2008).
Pricing water is the best way of guaranteeing that it will be used in an efficient way.
In cases where water is supplied by the state, people often do not pay the full cost for
their water. To solve this problem the water sector should be financially self-
sufficient, like the way it is attempted in Namibia today since NamWater took over
1998 as bulk water suppliers. In developing countries like Namibia, when the water
consumers have to pay more for their water, people generally lower their water
consumption rather than paying more. This could lead to that sanitation problems
CHALMERS, Civil and Environmental Engineering, Master’s Thesis 2010:48 15
occur which can be solved by dividing the water consumers into two categories, those
who can pay and those who cannot afford the full cost. Those who can pay include
mining, manufacturing and service sectors as well as households. The ones excepted
are the poorest urban households, which account for about one third of the water use
in Namibia. The water tariffs for those sectors should include the full capital and
operating costs of supply as well as external costs (Heyns et al., 1998).
The sector with those who cannot afford to pay includes poor urban households, most
communal farmers and commercial irrigation farmers. The sector with the commercial
irrigation farmers accounts for about 40 percent of all water use in Namibia and
receives subsidized water for irrigation to grow essentially lucerne and cereal crops
like wheat and maize. The farmers cannot pay the full water cost themselves and still
be profitable due to the present irrigation practices. Subsidized water for irrigation
falls under the policy of food self- sufficiency for the country, which also offers trade
protection from cheaper imports of wheat and maize. So even if the farming practices
are economically inefficient and ecologically inappropriate, they are protected and
encouraged in the interest of the policy. This is not a sustainable way of using
resources and the policy need to be reassessed (Heyns et al., 1998).
Subsidies are used worldwide today within the water sector and particularly in
developing countries. They should be used to provide social benefits to the poor
people and not be allowed to become an advantage to rich consumers, industrial users
or farmers. Therefore the effect of the subsidies must be strictly monitored and openly
analyzed. Subsidized water is often directed towards sectors with low economic
benefits, since the water is not implicitly valued. Historically water in Namibia has
been supplied at low costs, which has generated that people think that water should be
supplied at low costs even now (LCE, 2008). Before Namibia became independent in
1990, water was even free of charge in most rural instances (Peters, 2010). Many
water users in Namibia also consider water is a “gift from God”, and nobody should
ever be expected to pay to use it. The subsidized water has in the past resulted in very
high water usage within almost all sectors. Since the price of water in Namibia has
increased during the past twenty years, there has been a reduction in water usage and
water demand (LCE, 2008).
Using water tariffs is a way to get a sustainable water use if the costs reflect the
correct price. Under the right conditions tariffs can develop water access and justice.
The outcome of using tariffs depends on a diversity of factors. If the tariffs are set far
below the levels needed to meet the overall costs of operation and maintenance they
will not fulfil their purpose. In many countries using tariffs the cost for the initial
volume is low or free, after that the cost rises (UNDP 2006).
The tariffs used need to be designed using sound economic principles in order to
optimize the allocation of this scarce resource. The tariffs also need to be quite high to
influence the water behaviour amongst people and reduce the use. To make the tariff
structure successful, the water users must accept the tariffs as fair. The structure must
be easy to understand and the tariffs need to send out the correct economic message to
the water users. When large increases in the tariffs need to be done, it should be done
over a longer period so that people get the chance to adjust their water consumption.
Social equity within the water resource area means that all user groups have fair
access to the scarce water resources in Namibia. The tariffs also need to be equitable,
which means that all customers within a water supply area, linked to the same
pipeline, should pay the same price (LCE, 2008).

CHALMERS, Civil and Environmental Engineering, Master’s Thesis 2010:48 16
There are a number of different tariff structures that can be used, and the four most
common ones are marginal costing, rising block tariffs, two part tariffs and peak
demand tariffs. Rising block tariffs are used all over the world, in both developing and
developed countries, and are the structure that is used in Namibia today. The meaning
of rising block tariffs is that the water is divided into blocks, and the consumers pay
one price per m3 water used within one block, and a higher price per m
3 water used
within the next block. If the consumers just use the amount of water within the first
block the water is quite cheap, but if they use more water the price is rising. This
promotes water conservation and discourages an over usage of water. Using rising
block tariffs results in higher marginal prices to the customer as the water use rises.
The price for water in the initial start block can be subsidized or set very low to be
able to ensure that poor people can afford it. Seen from an equity perspective, rising
water block tariffs often assist low income households due to the fact that those
households use less water than high income households. Using rising block tariffs
often rely on the fact that each household has its own water usage meter. For people
living in buildings with a number of apartments, this becomes a problem because
there is often just one meter for the whole building. This means that the water costs
for those people can be higher than for people living in single households, and poor
people may get a disadvantage (LCE, 2008).
3.2.3 Management and Sustainability
A sustainable development is a guiding principle for use of all resources and need to
include economic, social and environmental factors. Different planning strategies are
needed for the water sector in Namibia and they should all be included in one bigger
long term plan. The long term planning needs to take into account the environmental
characteristics in Namibia such as the wide variation in rainfall, runoff, recharge and
the increasing population. The worst case scenario with heavy droughts needs to be
defined and accounted for in the plan (Heyns et al., 1998). Inappropriate government
subsidies that encourage inefficient use of water and an excessive use of pesticides
and other harmful chemicals should be stopped (Tarr, 2002).
A sustainable development within the water area requires integration with other sector
activities such as family planning, range and livestock management and wetland
conservation. For ephemeral rivers and perennial river basins shared with other
countries a special approach is needed (Heyns et al., 1998). To be able to control
pollution an integrated approach of water and natural resource management is
essential. Land use management needs to be integrated with water resource
management to avoid pollution of the land within the catchment area of a river by e.g.
pesticides or decomposing waste matter that will reach the river in the end and pollute
it (Tarr, 2002).
The government, local authorities, NGOs and individuals all need to be involved in
assessing options and in making plans for water use and management. In rural areas
women often are the major domestic water users and managers of water while the
men decide where and when the water should be supplied. Therefore all of them need
to be involved in the process, not just the men (Heyns et al., 1998).
An effective management is based upon awareness and understanding of water
availability, use and development in Namibia. Understanding and awareness can be
increased with inputs from research and long term monitoring. Skills can be

CHALMERS, Civil and Environmental Engineering, Master’s Thesis 2010:48 17
developed and improved with training and experience. With increasing knowledge
and understanding the changes in water availability can be understood and suitable
management decisions made (Heyns et al., 1998).
Today the majority of the people in Namibia are aware that they need to utilize
economically with the water and most people do what they can to minimize their
consumption (Peters, 2010). As mentioned above, Namibia has developed a better and
more sustainable legislation when it comes to water supply and water usage. To be
able to reach a sustainable use, the guidelines need to be followed and the new Water
Act (The Water Resource Management Act, Act No 24 of 2004) needs to be
implemented (Peters, 2010).
CHALMERS, Civil and Environmental Engineering, Master’s Thesis 2010:48 18
4 General Area Description
This chapter gives a general area description of Namibia and its topography, climate,
geology and hydrogeology. A more detailed area description of the area between
Windhoek and Rehoboth is given.
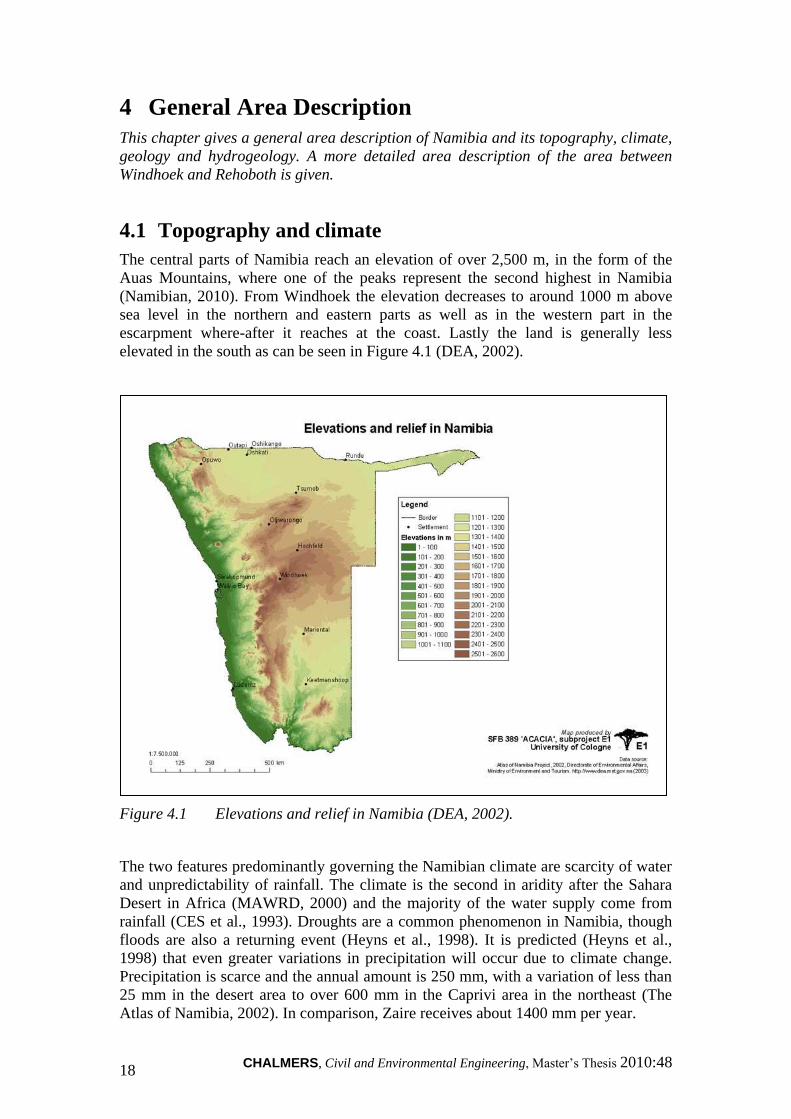
4.1 Topography and climate
The central parts of Namibia reach an elevation of over 2,500 m, in the form of the
Auas Mountains, where one of the peaks represent the second highest in Namibia
(Namibian, 2010). From Windhoek the elevation decreases to around 1000 m above
sea level in the northern and eastern parts as well as in the western part in the
escarpment where-after it reaches at the coast. Lastly the land is generally less
elevated in the south as can be seen in Figure 4.1 (DEA, 2002).
Figure 4.1 Elevations and relief in Namibia (DEA, 2002).
The two features predominantly governing the Namibian climate are scarcity of water
and unpredictability of rainfall. The climate is the second in aridity after the Sahara
Desert in Africa (MAWRD, 2000) and the majority of the water supply come from
rainfall (CES et al., 1993). Droughts are a common phenomenon in Namibia, though
floods are also a returning event (Heyns et al., 1998). It is predicted (Heyns et al.,
1998) that even greater variations in precipitation will occur due to climate change.
Precipitation is scarce and the annual amount is 250 mm, with a variation of less than
25 mm in the desert area to over 600 mm in the Caprivi area in the northeast (The
Atlas of Namibia, 2002). In comparison, Zaire receives about 1400 mm per year.

CHALMERS, Civil and Environmental Engineering, Master’s Thesis 2010:48 19
4.2 Geology
Geology in Namibia spans over 2,600 million years from Archean to Phanerozoic
times. Nearly half of the land surface is outcropping bedrock with an exception of the
Kalahari and Namib deserts which are covered by young surficial deposits which in
general can be found where the Kalahari group is indicated in Figure 4.2.
The oldest rocks (220-1,800 Ma) can be found in the central and northern parts where
highly deformed gneisses, amphibolites, metasediments and associated intrusive rocks
are present. During 1,800-1,000 Ma the Namaqua Metamorphic Complex was
formed, which includes granitic/metabasic intrusions and the volcano sedimentary
Sinclair Sequence of central Namibia with associated granites.
Large parts of central and north-western Namibia are composed of a variety of
metasedmentary rocks. During Tertiary to Recent (less than 50 Ma), widespread
sediments have been spread over the Namib and Kalahari Sequences (GSN, 2006).
Figure 4.2 Geology of Namibia 1: major geological divisions (DEA, 2002).
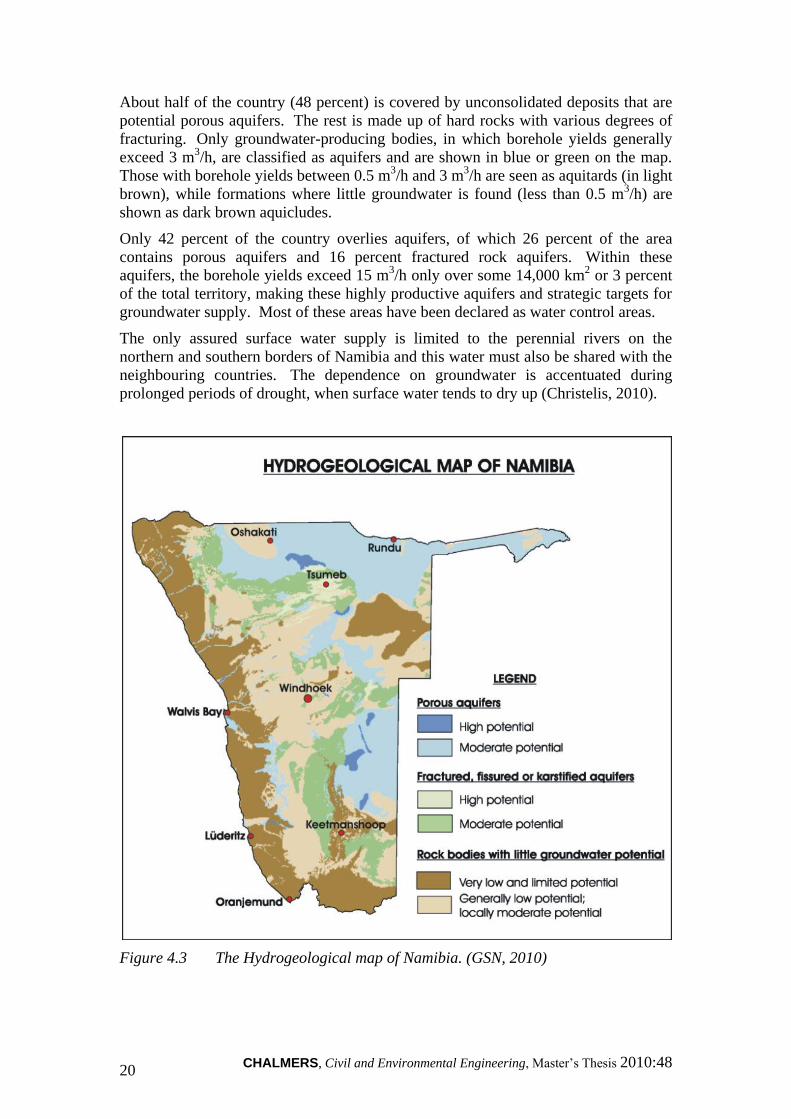
4.3 Hydrogeology
As can be seen in Figure 4.3 (The hydrogeological map of Namibia), the aquifers of
Namibia ranges from having a good to poor potential for water extraction. On the
west coast, where the main climatic region is desert, there is very poor groundwater
extraction potential, whereas the north eastern parts have a quite good potential to
yield groundwater (CES et al., 1993).
CHALMERS, Civil and Environmental Engineering, Master’s Thesis 2010:48 20
About half of the country (48 percent) is covered by unconsolidated deposits that are
potential porous aquifers. The rest is made up of hard rocks with various degrees of
fracturing. Only groundwater-producing bodies, in which borehole yields generally
exceed 3 m3/h, are classified as aquifers and are shown in blue or green on the map.
Those with borehole yields between 0.5 m3/h and 3 m
3/h are seen as aquitards (in light
brown), while formations where little groundwater is found (less than 0.5 m3/h) are
shown as dark brown aquicludes.
Only 42 percent of the country overlies aquifers, of which 26 percent of the area
contains porous aquifers and 16 percent fractured rock aquifers. Within these
aquifers, the borehole yields exceed 15 m3/h only over some 14,000 km
2 or 3 percent
of the total territory, making these highly productive aquifers and strategic targets for
groundwater supply. Most of these areas have been declared as water control areas.
The only assured surface water supply is limited to the perennial rivers on the
northern and southern borders of Namibia and this water must also be shared with the
neighbouring countries. The dependence on groundwater is accentuated during
prolonged periods of drought, when surface water tends to dry up (Christelis, 2010).
Figure 4.3 The Hydrogeological map of Namibia. (GSN, 2010)
CHALMERS, Civil and Environmental Engineering, Master’s Thesis 2010:48 21
4.4 General description of the area between Windhoek and
Rehoboth
The distance between Rehoboth and Windhoek is about 90 km and is sparsely
populated. A few settlements can be found, such as Groot Aub (Bochmühl, 2010)
which is a low income settlement and several private farmers keep land in the area.
Besides a smaller quarry and a paint manufacturing no other larger industries can be
found. There is also an abandoned copper mine called Oamities. One activity taking
place is a quarry in production just south of Windhoek. (Du Plessis, P. 2010).
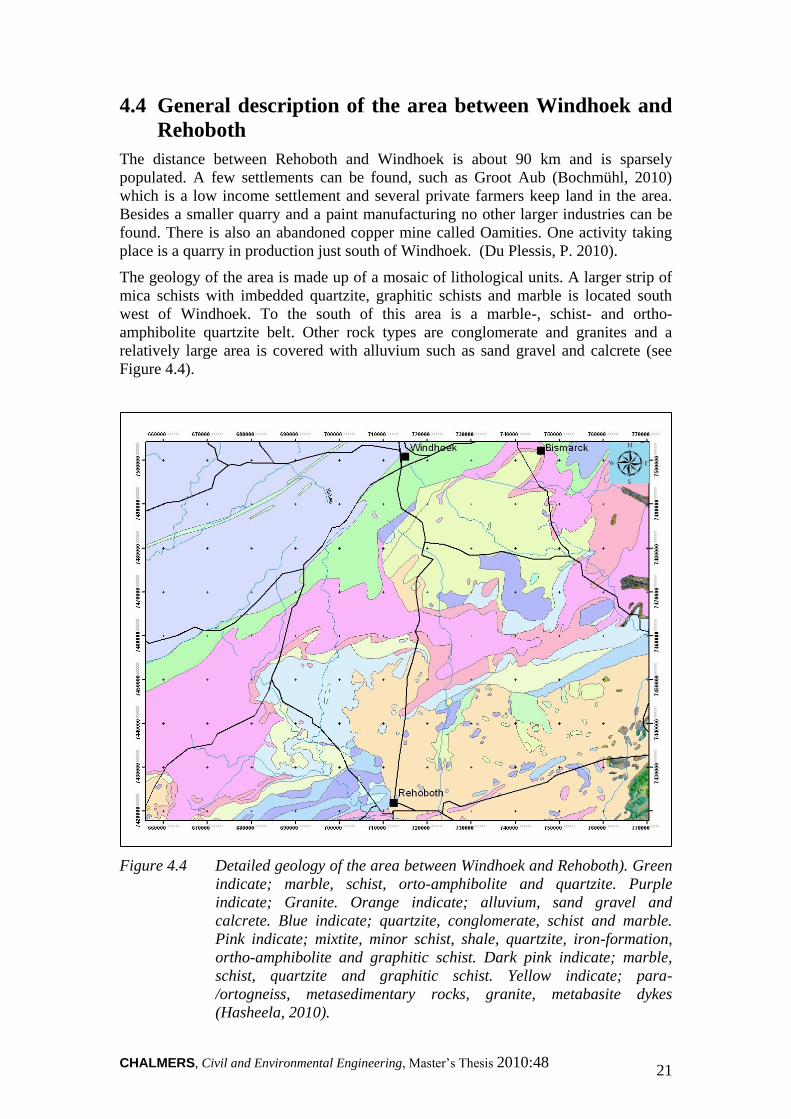
The geology of the area is made up of a mosaic of lithological units. A larger strip of
mica schists with imbedded quartzite, graphitic schists and marble is located south
west of Windhoek. To the south of this area is a marble-, schist- and ortho-
amphibolite quartzite belt. Other rock types are conglomerate and granites and a
relatively large area is covered with alluvium such as sand gravel and calcrete (see
Figure 4.4).
Figure 4.4 Detailed geology of the area between Windhoek and Rehoboth). Green
indicate; marble, schist, orto-amphibolite and quartzite. Purple
indicate; Granite. Orange indicate; alluvium, sand gravel and
calcrete. Blue indicate; quartzite, conglomerate, schist and marble.
Pink indicate; mixtite, minor schist, shale, quartzite, iron-formation,
ortho-amphibolite and graphitic schist. Dark pink indicate; marble,
schist, quartzite and graphitic schist. Yellow indicate; para-
/ortogneiss, metasedimentary rocks, granite, metabasite dykes
(Hasheela, 2010).

CHALMERS, Civil and Environmental Engineering, Master’s Thesis 2010:48 22
5 Water supply descriptions
This chapter describes the water supply in Windhoek and Rehoboth as well as the
possible pipeline connection between the two urban centres. The descriptions of the
water supply include the current water supplying sources, water costs and
distribution.
5.1 The water supply in Windhoek
Windhoek is located in the centre of Namibia, about 750 km away from the closest
perennial river (Menge et al., 2009). The infrastructure that supplies the city of
Windhoek with water consists of a number of different facilities owned and operated
by NamWater and the City of Windhoek. NamWater is the major bulk water supplier
in Namibia and is a parastatal company with the Namibian government as its only
stakeholder. The Windhoek population is approximately 240,000 people (City of
Windhoek, 2010), and they use around 60,000 m3 water every day (around 21 Mm
3
per year), the exact amount depends on the season (Theron, 2010).
5.1.1 Water supplying sources
Today there are three sources supplying Windhoek with water, which are
groundwater, surface water and reclaimed water (Menge et al., 2009). A diagram
showing the annual change in water production from the water supplying sources and
the daily water consumption per capita can be seen in Appendix B (Peters, 2010).
5.1.1.1 The groundwater source
The groundwater is abstracted from the Windhoek aquifer by 60 production boreholes
which are divided into three borehole groups. The water from the boreholes is not
treated separately and is only chlorinated before it is placed in the storage reservoir
(Menge et al., 2009). The total amount water generated from the boreholes per year
ranges between 0.5 and 5.5 Mm3 (Christelis, 2010).
5.1.1.2 The surface water source
The surface water that supplies Windhoek with drinking water comes from three dams
in ephemeral rivers. The dams are the Von Bach Dam, the Swakoppoort Dam and the
Omatako Dam (Menge et al., 2009). The total amount water generated from the three
dams per year is approximately 15 Mm3 (Christelis, 2010). Water from the Omatako
dam and the Swakoppoort dam is transferred to the Von Bach Dam as soon as
possible due to the fact that the evaporation rate is the lowest there (Du Plessis, N.P.
2010). The goal is to have an amount of water in the Von Bach Dam that can supply
Windhoek with water for two years (Menge et al., 2009).
Together the dams can produce a maximum of approximately 20 Mm3 per year, but as
mentioned earlier just 15 Mm3 per year is used today. The surface water from the
dams is treated at the Von Bach Water Treatment plant, which is owned and run by
NamWater, before it reaches the water distribution system and the consumers (Du
Plessis, N.P. 2010).
CHALMERS, Civil and Environmental Engineering, Master’s Thesis 2010:48 23
5.1.1.3 The reclaimed water source
The Goreangab water reclamation plant treats domestic wastewater (Menge et al.,
2009). Before the water reaches this plant two treatment plants treat the domestic
effluents, the Gammams wastewater treatment plant and the Otjomuise wastewater
treatment plant. Gammams treat around 25,000 m3 every day and the sludge produced
in the treatment process can be used for growing crops but is not regarded as
completely safe due to the contents of heavy metals and bacteria. The Otjomuise plant
is smaller than the Gammams plant and has a capacity of treating around 5 Mm3
wastewater per year, but is now under construction and will in the near future be able
to treat 15 Mm3 per year (Peters, 2010).
After the wastewater has been treated at the Gammams wastewater treatment plant the
effluent goes to the Goreangab water reclamation plant for drinking water treatment.
The Goreangab water reclamation plant is owned by the City of Windhoek, but
operated by Windhoek Goreangab Operating Company (WINGOC) with the
shareholders Berlinwasser International, WABAG/ VATECH and Veolia Water
(NGWRP, 2010).
The new Goreangab plant purifies about 16,000 m3 per day, but are designed to for
21,000 m3. The reclaimed water is mixed with surface water from the dams, and only
one third may come from the reclamation plant in order to reduce the risk for polluted
drinking water. When the water from the two sources is mixed, the water is
chlorinated to prevent bacterial growth (Eterhuisen, 2010).
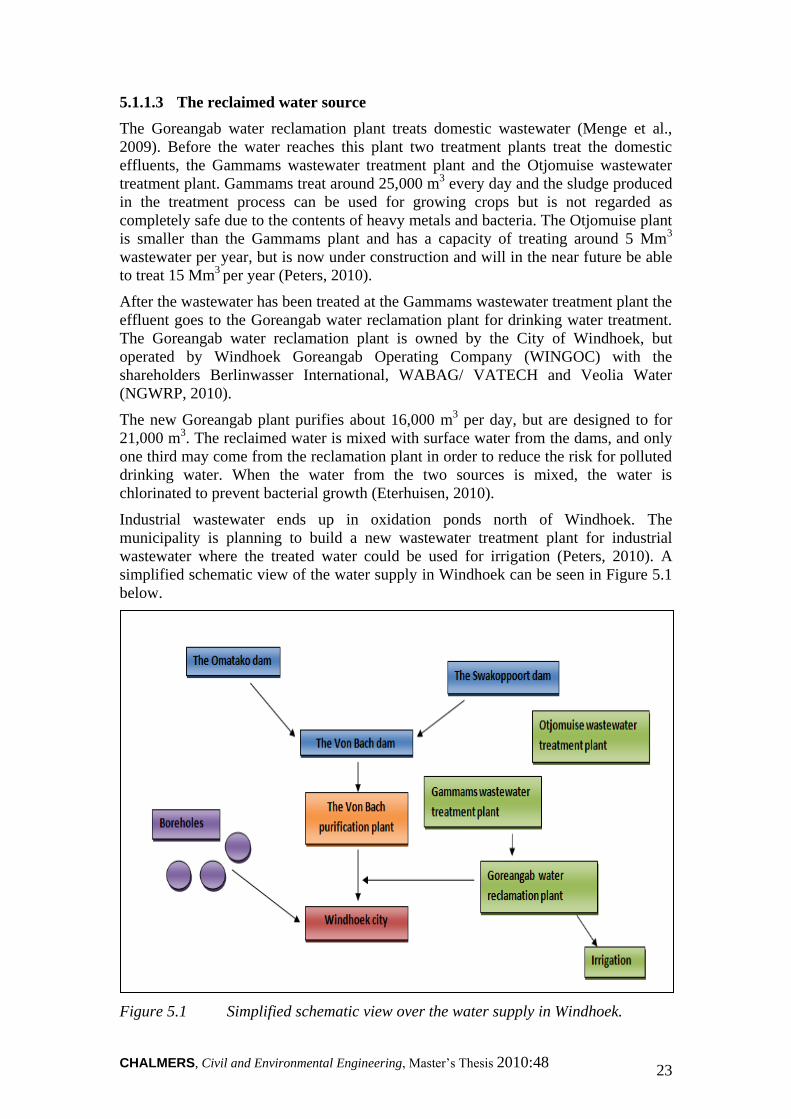
Industrial wastewater ends up in oxidation ponds north of Windhoek. The
municipality is planning to build a new wastewater treatment plant for industrial
wastewater where the treated water could be used for irrigation (Peters, 2010). A
simplified schematic view of the water supply in Windhoek can be seen in Figure 5.1
below.
Figure 5.1 Simplified schematic view over the water supply in Windhoek.
CHALMERS, Civil and Environmental Engineering, Master’s Thesis 2010:48 24
5.1.2 Distribution system
The distribution system in Windhoek consists of 17 water reservoirs and 12 pressure
zones (Menge et al., 2009). One of the reservoirs is owned by NamWater and can
store around 27,000 m3, while the other 16 are owned by the City of Windhoek
(Theron, 2010). The water system of the City of Windhoek also consists of pumping
stations, transmission and distribution pipelines and groundwater wells (SWECO,
2002).
5.1.3 Emergency plan
To be able to support the city of Windhoek with water during heavy droughts as in
1992 and 1997, the City of Windhoek works with emergency planning. The plan for
the future is to extend the amount of boreholes in Windhoek and increase the artificial
recharge with water from the Von Bach dam in the boreholes. The existence of the
planned project depends on the obtaining of financial support from e.g. the World
Bank. If the system is expanded, it will on completion be able to produce 17.3 Mm3
water per year and will be able to supply Windhoek with water for two years (Peters,
2010).
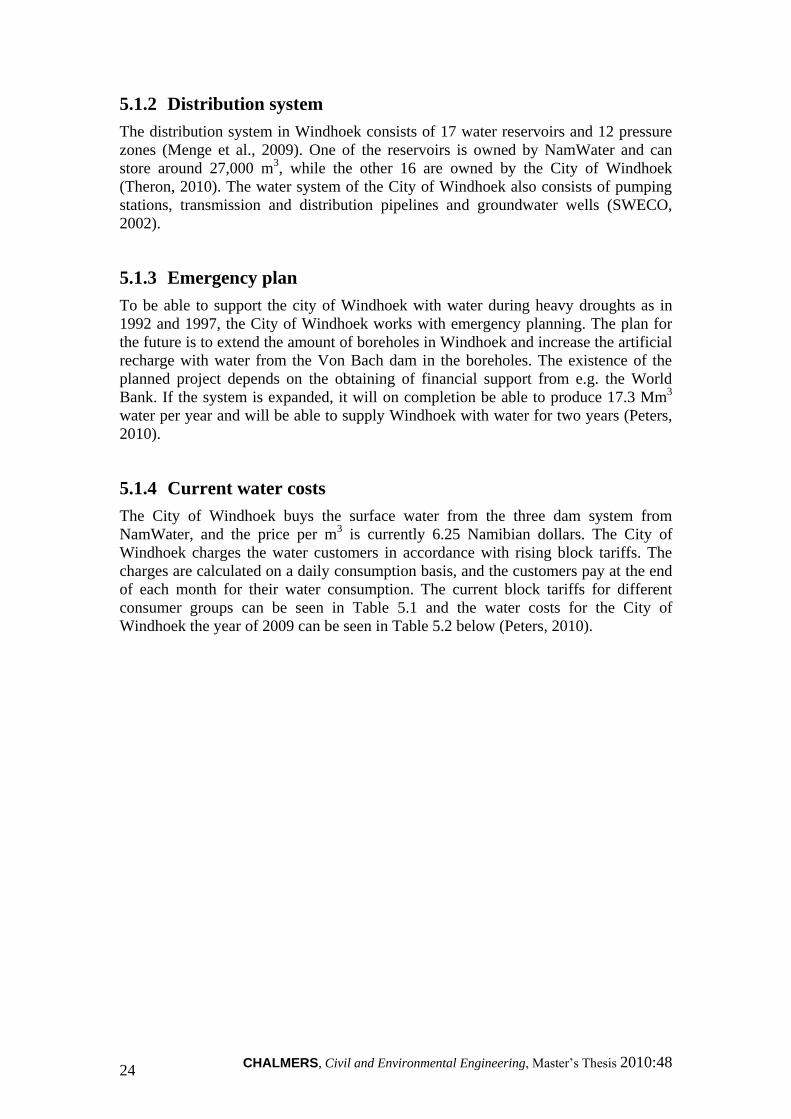
5.1.4 Current water costs
The City of Windhoek buys the surface water from the three dam system from
NamWater, and the price per m3 is currently 6.25 Namibian dollars. The City of
Windhoek charges the water customers in accordance with rising block tariffs. The
charges are calculated on a daily consumption basis, and the customers pay at the end
of each month for their water consumption. The current block tariffs for different
consumer groups can be seen in Table 5.1 and the water costs for the City of
Windhoek the year of 2009 can be seen in Table 5.2 below (Peters, 2010).
CHALMERS, Civil and Environmental Engineering, Master’s Thesis 2010:48 25
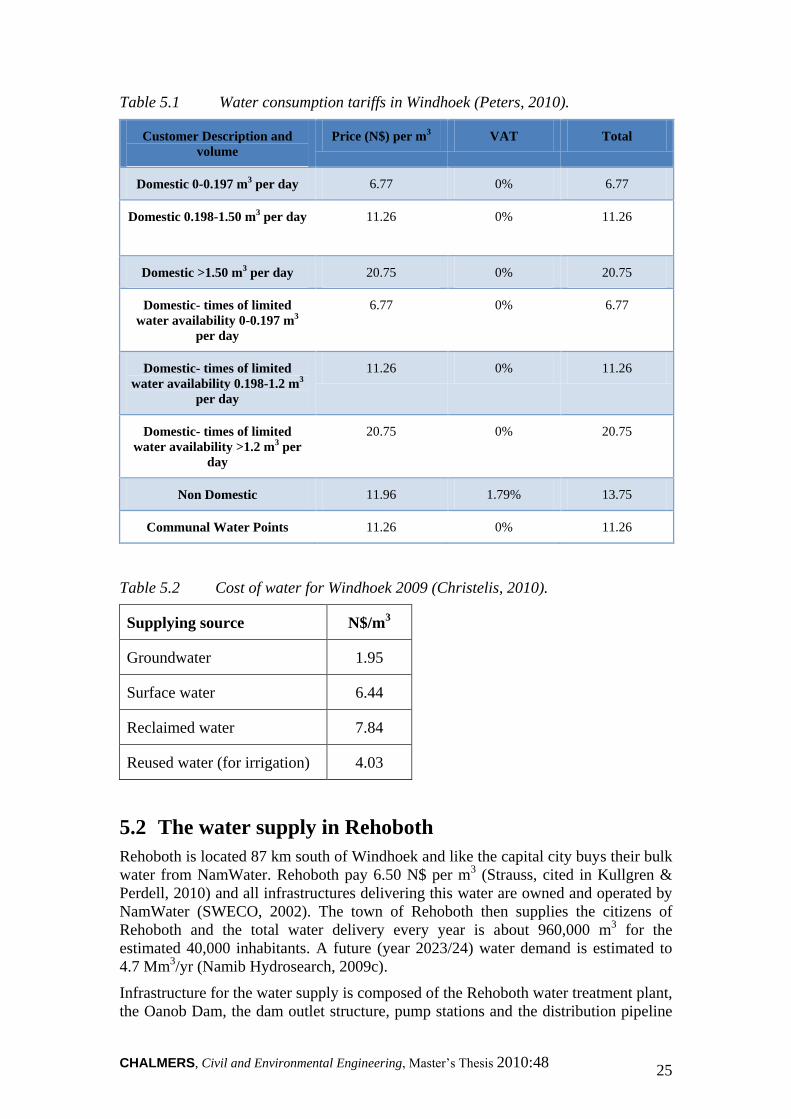
Table 5.1 Water consumption tariffs in Windhoek (Peters, 2010).
Customer Description and
volume
Price (N$) per m3
VAT Total
Domestic 0-0.197 m3 per day 6.77 0% 6.77
Domestic 0.198-1.50 m3 per day 11.26
0% 11.26
Domestic >1.50 m3 per day 20.75 0% 20.75
Domestic- times of limited
water availability 0-0.197 m3
per day
6.77 0% 6.77
Domestic- times of limited
water availability 0.198-1.2 m3
per day
11.26 0% 11.26
Domestic- times of limited
water availability >1.2 m3 per
day
20.75 0% 20.75
Non Domestic 11.96 1.79% 13.75
Communal Water Points 11.26 0% 11.26
Table 5.2 Cost of water for Windhoek 2009 (Christelis, 2010).
Supplying source N$/m3
Groundwater 1.95
Surface water 6.44
Reclaimed water 7.84
Reused water (for irrigation) 4.03
5.2 The water supply in Rehoboth
Rehoboth is located 87 km south of Windhoek and like the capital city buys their bulk
water from NamWater. Rehoboth pay 6.50 N$ per m3 (Strauss, cited in Kullgren &
Perdell, 2010) and all infrastructures delivering this water are owned and operated by
NamWater (SWECO, 2002). The town of Rehoboth then supplies the citizens of
Rehoboth and the total water delivery every year is about 960,000 m3 for the
estimated 40,000 inhabitants. A future (year 2023/24) water demand is estimated to
4.7 Mm3/yr (Namib Hydrosearch, 2009c).
Infrastructure for the water supply is composed of the Rehoboth water treatment plant,
the Oanob Dam, the dam outlet structure, pump stations and the distribution pipeline

CHALMERS, Civil and Environmental Engineering, Master’s Thesis 2010:48 26
system. The maximum capacity is estimated to approximately 9 Mm3/yr (SWECO,
2002).
The water treatment plant is based on chemical dosing, flocculation, sedimentation
and filtration and has a capacity of 1,080 m3/hr. The clean water is stored in three
reservoirs of 2,500 m3
each (Namib Hydrosearch, 2009c) and distributed to the city by
gravity. Treatment of the wastewater takes place in oxidation ponds located
approximately 2 km east of Rehoboth and according to SWECO (2002) a good
estimation is that 40-50 percent of the consumed water reaches the ponds.
Payment for water is made according to a certain tariff system based on the amount of
water used, a similar system to that in Windhoek (see Chapter 5.1.4). For a small
amount of water used the cost is 8.10 N$ per m3 but above 20 m
3 the sum is higher
and increases with an augmented consumption as can be seen in Table 5.3 (Strauss,
cited in Kullgren & Perdell, 2010).
Table 5.3 Water consumption tariffs in Rehoboth (Strauss, cited in Kullgren &
Perdell, 2010).
Volume [m3] Cost [N$]
0-20 m3 8.10
21-36 m3 10.25
37-46 m3 10.7
> 47m3 11.88
5.2.1 The surface water source
The surface water used in Rehoboth comes from the Oanob Dam that is located
approximately 7 km west of Rehoboth and is replenished by the Oanob River. The
capacity of the dam is 34.5 Mm3 and the surface area is 3.6 km
2 when full. The mean
annual precipitation in the area is 250 mm (NamWater, 2006) and the total catchment
area is estimated to be 2,726 km2 (DWA, 1991).
The Oanob Dam was built in 1990 (Namib Hydrosearch, 2009c) due to an increase of
water demand in Rehoboth. When the dam was completed, the town of Rehoboth
started to charge for the water supplied in contrary to the free supply that had been a
fact before the dam was completed. The demand has then gone down to such great
extent that the dam would not have to be built at that time (Harris, 2010).
5.2.2 The groundwater source
The aquifer is a two compartment alluvial aquifer, and the bedrock surrounding it
predominantly consists of quartzite and phyllite considered to be relatively
impermeable. Storage potential is about 27 Mm3 but losses from evapotranspiration
are high when the groundwater level is close to surface (SWECO, 2002). Recharge to
CHALMERS, Civil and Environmental Engineering, Master’s Thesis 2010:48 27
the aquifer mainly steams from leakage of the Oanob Dam, direct recharge from
precipitation, river recharge, leakage and discharge from the oxidation ponds. The
aquifer is, after the dam is built, mainly recharged by release water from the dam
(SWECO, 2002).
The total planned utilisation of the aquifer is 1.6 Mm2/yr (Namib Hydrosearch,
2009c). Investigations for artificial recharge are conducted for the Rehoboth aquifer
(Namib Hydrosearch, 2009c; SWECO, 2002) and if this is realized the municipality
plan to discontinue water use from the dam but to supply the city solely from the
aquifer (Strauss, cited in Kullgren & Perdell, 2010).
SWECO (2002) further mentions that before the Oanob Dam was built in 1989,
Rehoboth abstracted approximately 1.4 Mm3 from the upper compartment and 0.3
Mm3 from the lower annually totally relying on the alluvial aquifer. The borehole
yields were between 10 and 30 m3/h but it is assumed by SWECO (2002) that proper
well design could increase the abstraction considerably.
5.3 The possible pipeline connection
The possible pipeline connection will stretch between Windhoek and Rehoboth, a
distance of 87 km. The pipeline would connect the water supply in the two cities and
could increase the total amount of water for the people living in the cities. The area
between the two urban areas is described in more detail in Chapter 4.4, but a possible
pipeline would need to cross land belonging to farmers. Otherwise there are few
activities of hazardous nature going on in the area at the moment, but some new
developments are to be built in the near future though. This project does not consider
the exact stretch of the pipeline, if the pipeline system is open or closed, the material
of the pipeline or if the pipeline will be built above or below the ground.

CHALMERS, Civil and Environmental Engineering, Master’s Thesis 2010:48 28
6 Methods
This chapter provides an overview and description of the methods applied in this
master thesis. These were; identification of advantages, the FMECA including a HHM
for a possible construction of a pipeline between Windhoek and Rehoboth and lastly a
risk and vulnerability assessment method with respect to the groundwater pollution
potential of the Omeya gold and residential oasis.
6.1 Overview of the methodological application
The three main methods described in this chapter are tools to conduct a part of a risk
assessment on expanding the Windhoek water supply. As seen in Figure 6.1 below, a
risk assessment contains risk analysis and risk evaluation. The first component is
roughly divided into three parts; scope definition, hazard identification and risk
estimation. To identify hazards the Failure Modes, Effects and Criticality Analysis
(FMECA) and the Hierarchical Holographic Model (HHM) methods are applied. The
risk and vulnerability assessment for the Omeya golf and residential resort is a more
intense investigation of one specific hazard therefore placed below the FMECA.
The identification of advantages is not originally a part of a risk assessment but is
included in this report to investigate possibilities to further increase the economic
viability of the possible project. No specific method, rather logic reasoning constitutes
the basis for the identification of advantages.
Figure 6.1 Flow chart of the correlation between the methods applied to evaluate
the risk of expanding the Windhoek water supply. The specific methods
applied for hazard identification, groundwater pollution and ranking
are dashed.
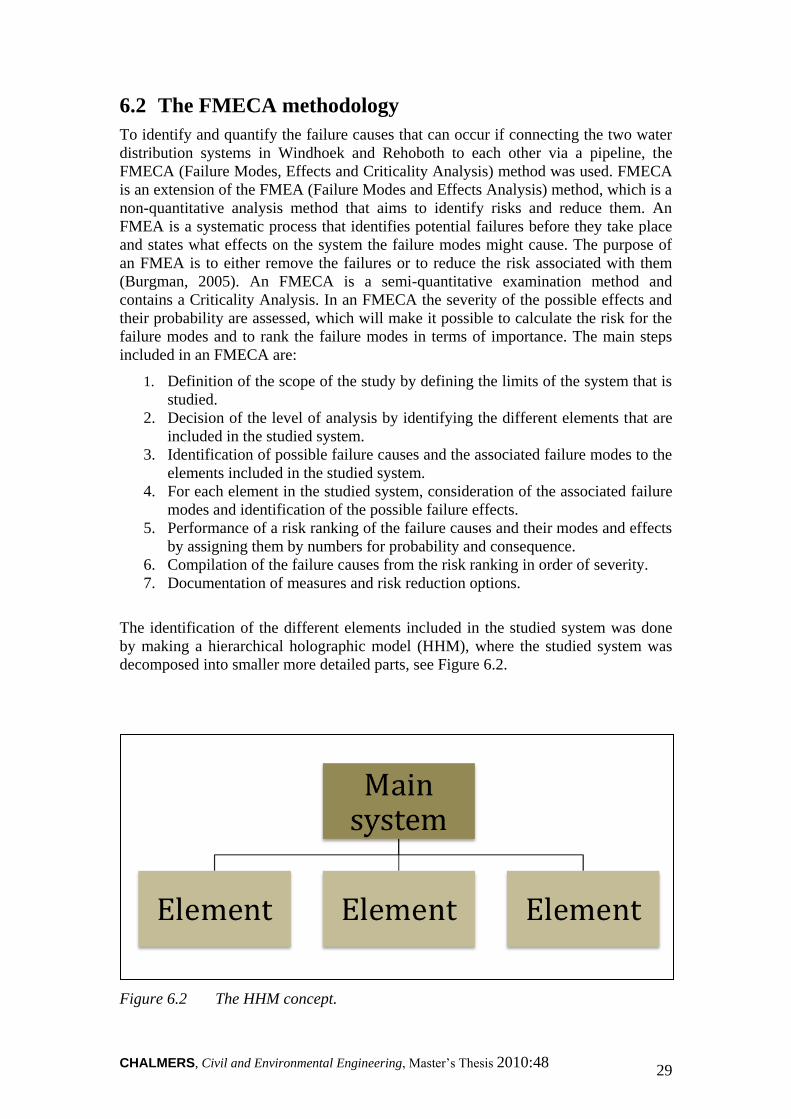
CHALMERS, Civil and Environmental Engineering, Master’s Thesis 2010:48 29
6.2 The FMECA methodology
To identify and quantify the failure causes that can occur if connecting the two water
distribution systems in Windhoek and Rehoboth to each other via a pipeline, the
FMECA (Failure Modes, Effects and Criticality Analysis) method was used. FMECA
is an extension of the FMEA (Failure Modes and Effects Analysis) method, which is a
non-quantitative analysis method that aims to identify risks and reduce them. An
FMEA is a systematic process that identifies potential failures before they take place
and states what effects on the system the failure modes might cause. The purpose of
an FMEA is to either remove the failures or to reduce the risk associated with them
(Burgman, 2005). An FMECA is a semi-quantitative examination method and
contains a Criticality Analysis. In an FMECA the severity of the possible effects and
their probability are assessed, which will make it possible to calculate the risk for the
failure modes and to rank the failure modes in terms of importance. The main steps
included in an FMECA are:
1. Definition of the scope of the study by defining the limits of the system that is
studied.
2. Decision of the level of analysis by identifying the different elements that are
included in the studied system.
3. Identification of possible failure causes and the associated failure modes to the
elements included in the studied system.
4. For each element in the studied system, consideration of the associated failure
modes and identification of the possible failure effects.
5. Performance of a risk ranking of the failure causes and their modes and effects
by assigning them by numbers for probability and consequence.
6. Compilation of the failure causes from the risk ranking in order of severity.
7. Documentation of measures and risk reduction options.
The identification of the different elements included in the studied system was done
by making a hierarchical holographic model (HHM), where the studied system was
decomposed into smaller more detailed parts, see Figure 6.2.
Figure 6.2 The HHM concept.
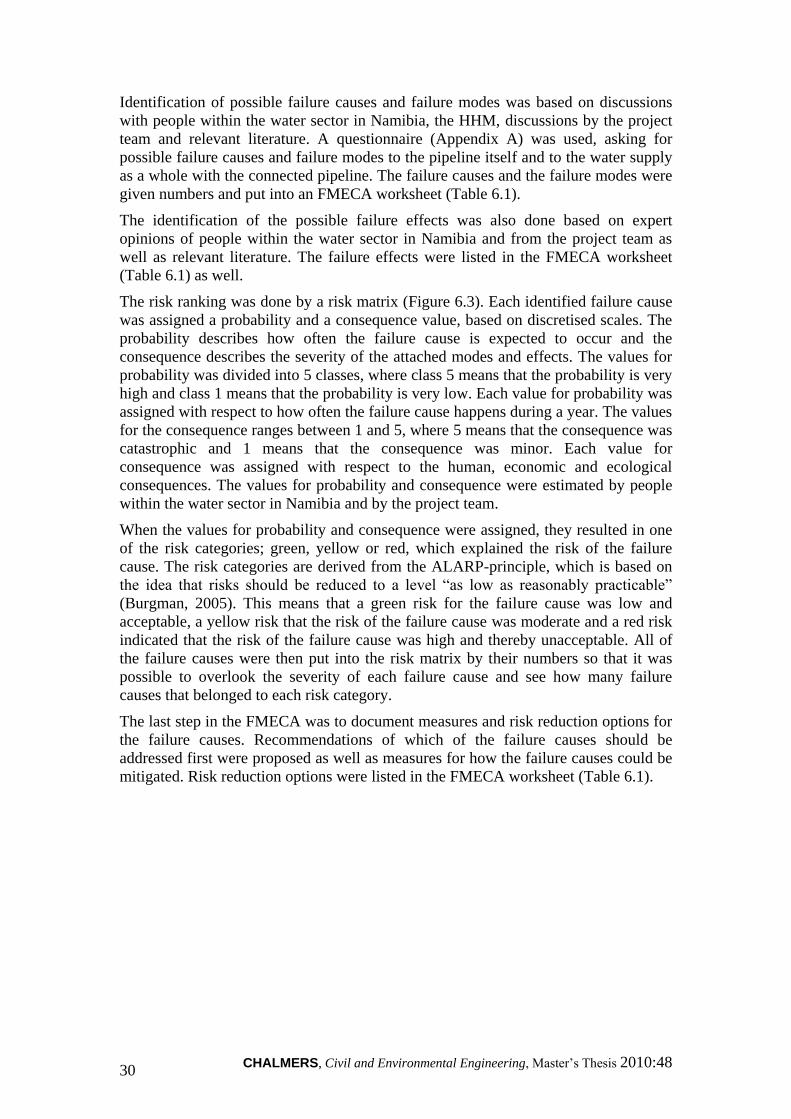
CHALMERS, Civil and Environmental Engineering, Master’s Thesis 2010:48 30
Identification of possible failure causes and failure modes was based on discussions
with people within the water sector in Namibia, the HHM, discussions by the project
team and relevant literature. A questionnaire (Appendix A) was used, asking for
possible failure causes and failure modes to the pipeline itself and to the water supply
as a whole with the connected pipeline. The failure causes and the failure modes were
given numbers and put into an FMECA worksheet (Table 6.1).
The identification of the possible failure effects was also done based on expert
opinions of people within the water sector in Namibia and from the project team as
well as relevant literature. The failure effects were listed in the FMECA worksheet
(Table 6.1) as well.
The risk ranking was done by a risk matrix (Figure 6.3). Each identified failure cause
was assigned a probability and a consequence value, based on discretised scales. The
probability describes how often the failure cause is expected to occur and the
consequence describes the severity of the attached modes and effects. The values for
probability was divided into 5 classes, where class 5 means that the probability is very
high and class 1 means that the probability is very low. Each value for probability was
assigned with respect to how often the failure cause happens during a year. The values
for the consequence ranges between 1 and 5, where 5 means that the consequence was
catastrophic and 1 means that the consequence was minor. Each value for
consequence was assigned with respect to the human, economic and ecological
consequences. The values for probability and consequence were estimated by people
within the water sector in Namibia and by the project team.
When the values for probability and consequence were assigned, they resulted in one
of the risk categories; green, yellow or red, which explained the risk of the failure
cause. The risk categories are derived from the ALARP-principle, which is based on
the idea that risks should be reduced to a level “as low as reasonably practicable”
(Burgman, 2005). This means that a green risk for the failure cause was low and
acceptable, a yellow risk that the risk of the failure cause was moderate and a red risk
indicated that the risk of the failure cause was high and thereby unacceptable. All of
the failure causes were then put into the risk matrix by their numbers so that it was
possible to overlook the severity of each failure cause and see how many failure
causes that belonged to each risk category.
The last step in the FMECA was to document measures and risk reduction options for
the failure causes. Recommendations of which of the failure causes should be
addressed first were proposed as well as measures for how the failure causes could be
mitigated. Risk reduction options were listed in the FMECA worksheet (Table 6.1).
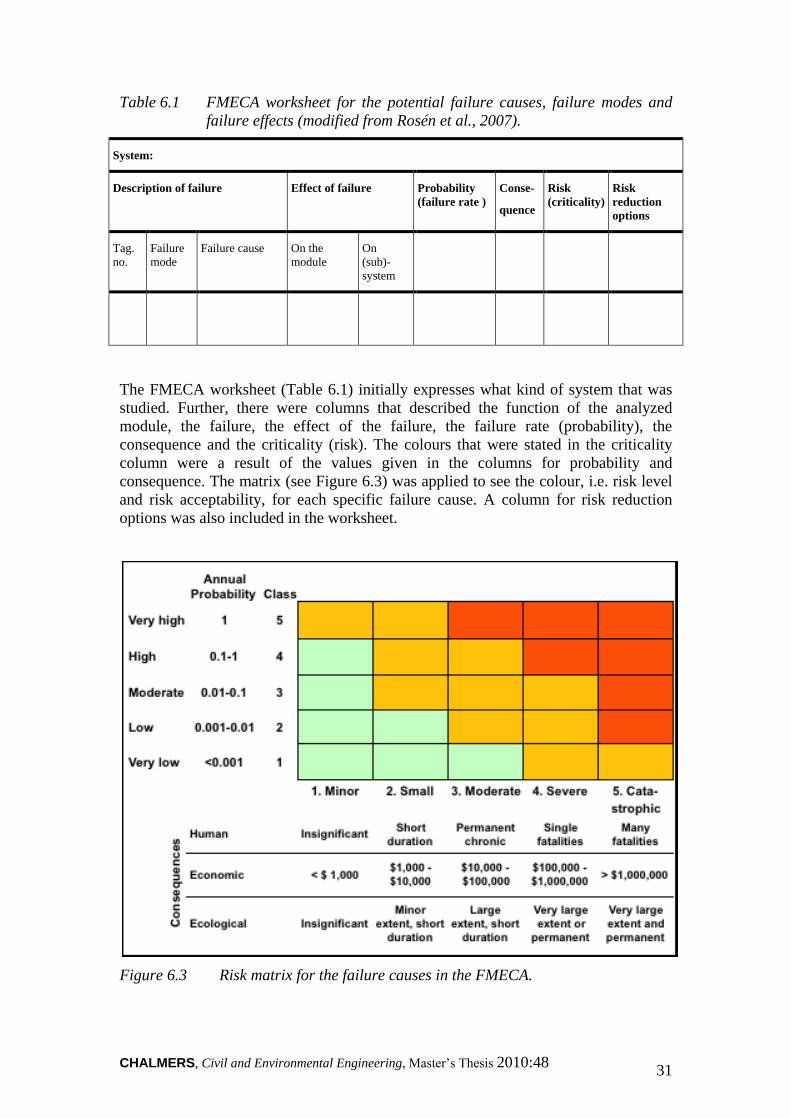
CHALMERS, Civil and Environmental Engineering, Master’s Thesis 2010:48 31
Table 6.1 FMECA worksheet for the potential failure causes, failure modes and
failure effects (modified from Rosén et al., 2007).
System:
Description of failure Effect of failure Probability
(failure rate )
Conse-
quence
Risk
(criticality)
Risk
reduction
options
Tag.
no.
Failure
mode
Failure cause On the
module
On
(sub)-
system
The FMECA worksheet (Table 6.1) initially expresses what kind of system that was
studied. Further, there were columns that described the function of the analyzed
module, the failure, the effect of the failure, the failure rate (probability), the
consequence and the criticality (risk). The colours that were stated in the criticality
column were a result of the values given in the columns for probability and
consequence. The matrix (see Figure 6.3) was applied to see the colour, i.e. risk level
and risk acceptability, for each specific failure cause. A column for risk reduction
options was also included in the worksheet.
Figure 6.3 Risk matrix for the failure causes in the FMECA.
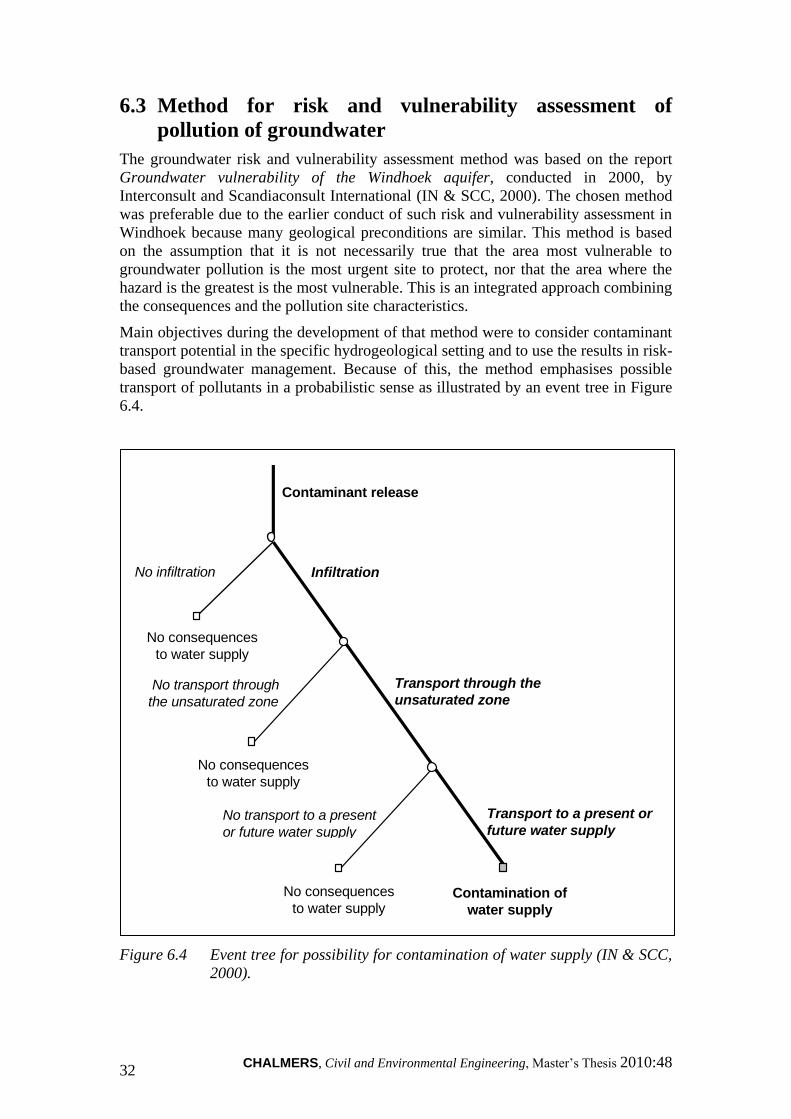
CHALMERS, Civil and Environmental Engineering, Master’s Thesis 2010:48 32
6.3 Method for risk and vulnerability assessment of
pollution of groundwater
The groundwater risk and vulnerability assessment method was based on the report
Groundwater vulnerability of the Windhoek aquifer, conducted in 2000, by
Interconsult and Scandiaconsult International (IN & SCC, 2000). The chosen method
was preferable due to the earlier conduct of such risk and vulnerability assessment in
Windhoek because many geological preconditions are similar. This method is based
on the assumption that it is not necessarily true that the area most vulnerable to
groundwater pollution is the most urgent site to protect, nor that the area where the
hazard is the greatest is the most vulnerable. This is an integrated approach combining
the consequences and the pollution site characteristics.
Main objectives during the development of that method were to consider contaminant
transport potential in the specific hydrogeological setting and to use the results in risk-
based groundwater management. Because of this, the method emphasises possible
transport of pollutants in a probabilistic sense as illustrated by an event tree in Figure
6.4.
Figure 6.4 Event tree for possibility for contamination of water supply (IN & SCC,
2000).
Transport through the
unsaturated zone
No infiltration
Transport to a present or
future water supply
Contamination of
water supply
Infiltration
Contaminant release
No consequences
to water supply
No transport through
the unsaturated zone
No transport to a present
or future water supply
No consequences
to water supply
No consequences
to water supply
CHALMERS, Civil and Environmental Engineering, Master’s Thesis 2010:48 33
6.3.1 Methodology
According to the model presented in Groundwater vulnerability for the Windhoek
aquifer (IN & SCC, 2000), the hydrogeological part of the risk depend on the
possibilities for pollutant transport through the “three major components of the
hydrogeological system, i.e. the land surface, the unsaturated zone, and the saturated
zone” (Figure 6.5).
The vulnerability assessment was based on the above mentioned three
hydrogeological zones and determined by the identification of the following factors;
Pi: “The probability for infiltration of pollutants at the land surface, given
that a pollutant release has taken place.”
Pu: “The probability for transport of pollutants through the unsaturated
zone, given that pollutant release and infiltration have taken place.”
Ps: “The probability for transport of pollutants in the saturated zone to
existing or potential future groundwater abstraction points, given that
pollutant release, infiltration and transport through the unsaturated
zone have taken place.”
These factors were then given a rating based on information derived in the report of
Groundwater Vulnerability of the Windhoek aquifer (IN & SCC, 2000) and specific
estimations regarding the ground conditions of the Gross Haigamas area. The three
values were multiplied to provide a value for the vulnerability, the process is shown in
Figure 6.5 below and the equation used is presented in equation 6.1.
Vulnerability = Pv = Pi x Pu x Ps (6.1)
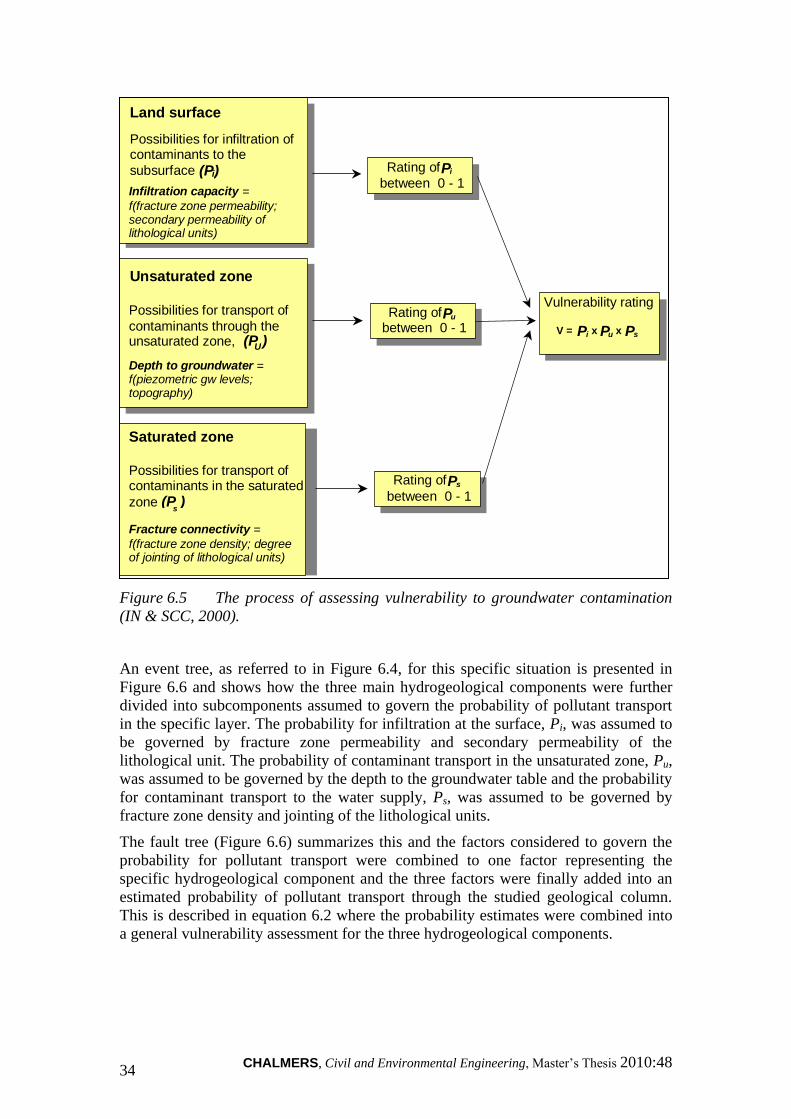
CHALMERS, Civil and Environmental Engineering, Master’s Thesis 2010:48 34
Figure 6.5 The process of assessing vulnerability to groundwater contamination
(IN & SCC, 2000).
An event tree, as referred to in Figure 6.4, for this specific situation is presented in
Figure 6.6 and shows how the three main hydrogeological components were further
divided into subcomponents assumed to govern the probability of pollutant transport
in the specific layer. The probability for infiltration at the surface, Pi, was assumed to
be governed by fracture zone permeability and secondary permeability of the
lithological unit. The probability of contaminant transport in the unsaturated zone, Pu,
was assumed to be governed by the depth to the groundwater table and the probability
for contaminant transport to the water supply, Ps, was assumed to be governed by
fracture zone density and jointing of the lithological units.
The fault tree (Figure 6.6) summarizes this and the factors considered to govern the
probability for pollutant transport were combined to one factor representing the
specific hydrogeological component and the three factors were finally added into an
estimated probability of pollutant transport through the studied geological column.
This is described in equation 6.2 where the probability estimates were combined into
a general vulnerability assessment for the three hydrogeological components.
Land surface
(Pi).
Rock type, fracture setting
Land surface
Possibilities for infiltration ofcontaminants to the
subsurface (Pi)
Infiltration capacity =
f(fracture zone permeability;secondary permeability oflithological units)
Unsaturated zone
Possibilities for transport ofcontaminants through theunsaturated zone (Pu).
Depth to groundwater
Unsaturated zone
Possibilities for transport of
contaminants through theunsaturated zone, (P )U
Depth to groundwater =f(piezometric gw levels;topography)
Saturated zone
Possibilities for transport of
zone (Ps).
Fracture density (connectivity)
Saturated zone
Possibilities for transport ofcontaminants in the saturated
zone (P )s
Fracture connectivity =
f(fracture zone density; degreeof jointing of lithological units)
Rating ofPi
between 0 - 1
Rating ofPi
between 0 - 1
Rating ofPu
between 0 - 1
Rating ofPu
between 0 - 1
Rating ofPs
between 0 - 1
Rating ofPs
between 0 - 1
Vulnerability rating,
V = Pi x Pu x Ps
Vulnerability rating
V = Pi x Pu x Ps

CHALMERS, Civil and Environmental Engineering, Master’s Thesis 2010:48 35
Figure 6.6 Fault tree of vulnerability to groundwater pollution through the
geological column of the Omeya aquifer (Developed for this specific
project).
Vulnerability = PV = (1-(1-PFZ)(1-PLU) x PU x (1-(1-PFD)(1-PJU)) (6.2)
PV Probability of contaminant transport
PFZ Probability of transport due to fracture zone permeability
= OR-gate
P = Probability value
Vulnerability of infiltration
PI = x
PFZ = x PLU = x
Vulnerability for transport in the unsaturated zone
PU = x
PU = x
Vulnerability for transport in the saturated zone
PS = x
PFD = x PJU = x
Transport
through the
unsaturated
zone, PU
Depth to water
table, PU
Transport
through the
saturated zone,
Fracture zone
density, PFD
Degree of
jointing of
lithological
units, PJU
Fracture zone
permeability,
PFZ
Secondary
permeability of
lithological
units, PLU
Infiltration, PI

CHALMERS, Civil and Environmental Engineering, Master’s Thesis 2010:48 36
PLU Probability of transport due to secondary permeability due to jointing in the
surficial lithological unit
PU Probability of transport through the unsaturated zone
PFD Probability of transport due to fracture zone permeability
PJU Probability of transport due to secondary permeability due to jointing in the
lithological unit
The estimated probabilities, Pi, Pu and Ps, are presented as three maps covering the
Omeya golf and residential oasis by using a GIS software, ArcGIS 9 Spatial Analyst.
Each map shows the probabilities of the specific event, infiltration through land
surface, infiltration through the unsaturated zone and the probability for transport of
pollutants through the saturated zone. The maps further constitute layers added on top
of each other and multiplied to show the final vulnerability estimation for pollutants
reaching the groundwater in the area. Figure 6.6 describes the process of adding layers
of probability to produce a final vulnerability rating.
6.3.1.1 Assumptions
General assumptions made in the report on Groundwater vulnerability of the
Windhoek aquifer (IN & SCC, 2000) were that the lithological conditions observed at
the surface were continuous through the unsaturated zone. That was considered an
underestimation of the vulnerability since the permeability likely was higher at the
surface than at depth. For the Gross Haigamas area, the soil cover was considered to
make up a small part of the total thickness of the unsaturated zone and therefore the
same assumptions as for Windhoek were made. The soil type was included when
estimating the vulnerability for contaminant percolation through the surface layer.
Further down the dominating rock type in the column was considered the main
governing material in the unsaturated zone. Other assumptions were that pathways for
pollutants to reach the unsaturated zone depended mainly on fracture zone
permeability and jointing in the lithological unit. This was considered relevant since
fracture zones were the main conductors of water in the aquifer and small distances to
a fracture zone increases the probability for contaminants to reach the aquifer. Where
fracture density is high, the probability for infiltration is high. Quartzitic rocks were
considered more permeable than schist due to a higher secondary permeability
(jointing).
The distance to the groundwater table governs the probability for transport of
pollutants through the unsaturated zone. It was assumed that a longer distance to
groundwater increases the possibility for contaminant retardation and sorption. The
surface was assumed to be flat and the groundwater level given a constant level at 60
m below land surface. The chosen level was based on test pumping information (see
Table 8.1).
The last step in the transport cycle to be considered, transport in the aquifer and
possible to wells, was in the Windhoek study (see IN & SCC, 2000) assumed to be
governed by the connectivity of the fracture network. This seemed to be the case also
for the Omeya aquifer and this assumption was considered relevant also on the
Haigamas vulnerability assessment.
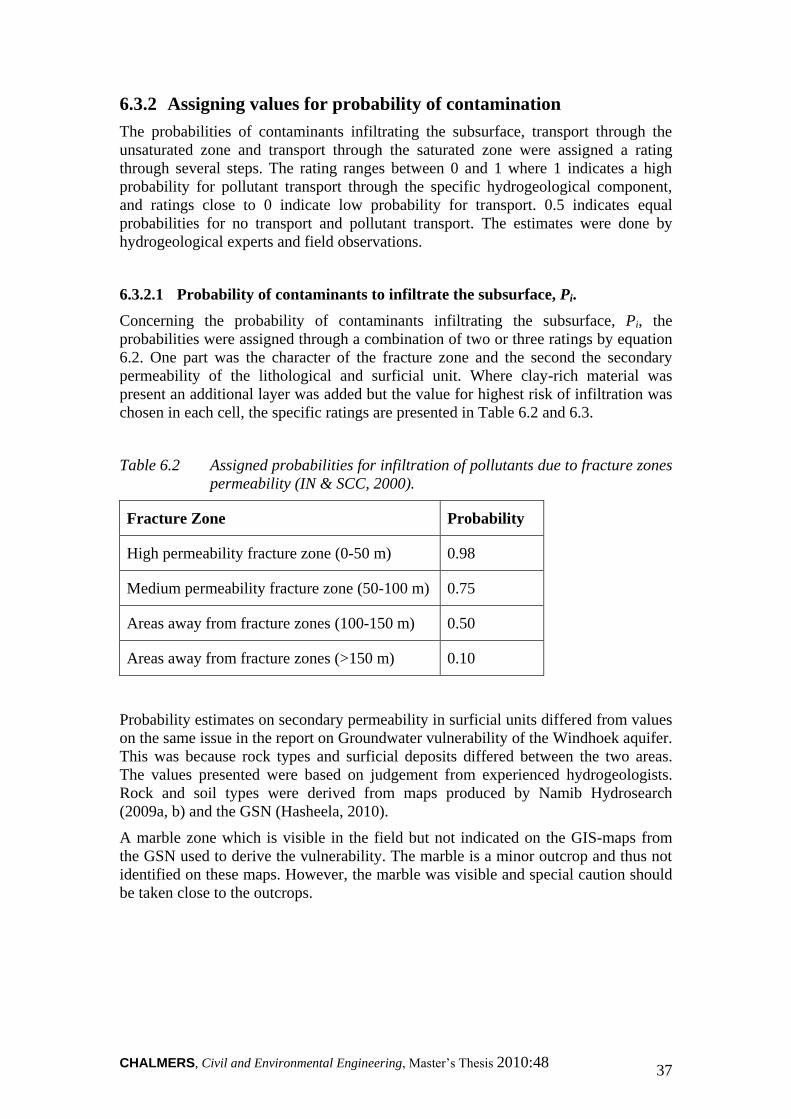
CHALMERS, Civil and Environmental Engineering, Master’s Thesis 2010:48 37
6.3.2 Assigning values for probability of contamination
The probabilities of contaminants infiltrating the subsurface, transport through the
unsaturated zone and transport through the saturated zone were assigned a rating
through several steps. The rating ranges between 0 and 1 where 1 indicates a high
probability for pollutant transport through the specific hydrogeological component,
and ratings close to 0 indicate low probability for transport. 0.5 indicates equal
probabilities for no transport and pollutant transport. The estimates were done by
hydrogeological experts and field observations.
6.3.2.1 Probability of contaminants to infiltrate the subsurface, Pi.
Concerning the probability of contaminants infiltrating the subsurface, Pi, the
probabilities were assigned through a combination of two or three ratings by equation
6.2. One part was the character of the fracture zone and the second the secondary
permeability of the lithological and surficial unit. Where clay-rich material was
present an additional layer was added but the value for highest risk of infiltration was
chosen in each cell, the specific ratings are presented in Table 6.2 and 6.3.
Table 6.2 Assigned probabilities for infiltration of pollutants due to fracture zones
permeability (IN & SCC, 2000).
Fracture Zone Probability
High permeability fracture zone (0-50 m) 0.98
Medium permeability fracture zone (50-100 m) 0.75
Areas away from fracture zones (100-150 m) 0.50
Areas away from fracture zones (>150 m) 0.10
Probability estimates on secondary permeability in surficial units differed from values
on the same issue in the report on Groundwater vulnerability of the Windhoek aquifer.
This was because rock types and surficial deposits differed between the two areas.
The values presented were based on judgement from experienced hydrogeologists.
Rock and soil types were derived from maps produced by Namib Hydrosearch
(2009a, b) and the GSN (Hasheela, 2010).
A marble zone which is visible in the field but not indicated on the GIS-maps from
the GSN used to derive the vulnerability. The marble is a minor outcrop and thus not
identified on these maps. However, the marble was visible and special caution should
be taken close to the outcrops.
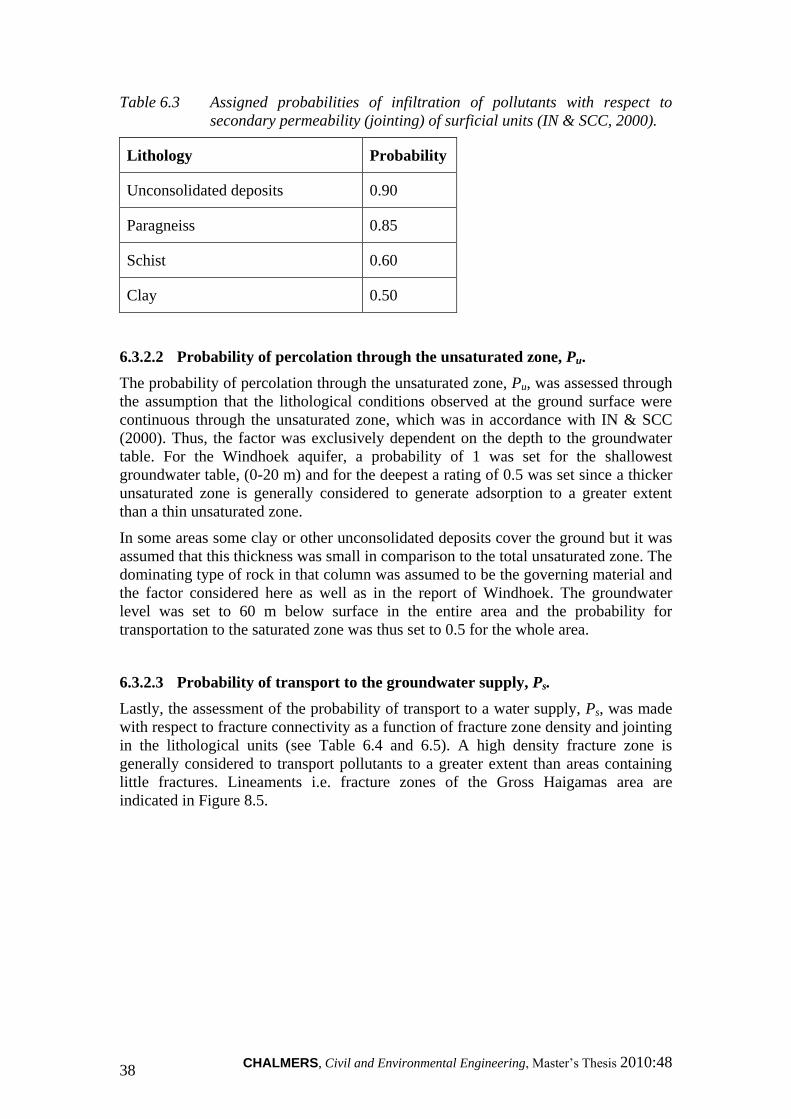
CHALMERS, Civil and Environmental Engineering, Master’s Thesis 2010:48 38
Table 6.3 Assigned probabilities of infiltration of pollutants with respect to
secondary permeability (jointing) of surficial units (IN & SCC, 2000).
Lithology Probability
Unconsolidated deposits 0.90
Paragneiss 0.85
Schist 0.60
Clay 0.50
6.3.2.2 Probability of percolation through the unsaturated zone, Pu.
The probability of percolation through the unsaturated zone, Pu, was assessed through
the assumption that the lithological conditions observed at the ground surface were
continuous through the unsaturated zone, which was in accordance with IN & SCC
(2000). Thus, the factor was exclusively dependent on the depth to the groundwater
table. For the Windhoek aquifer, a probability of 1 was set for the shallowest
groundwater table, (0-20 m) and for the deepest a rating of 0.5 was set since a thicker
unsaturated zone is generally considered to generate adsorption to a greater extent
than a thin unsaturated zone.
In some areas some clay or other unconsolidated deposits cover the ground but it was
assumed that this thickness was small in comparison to the total unsaturated zone. The
dominating type of rock in that column was assumed to be the governing material and
the factor considered here as well as in the report of Windhoek. The groundwater
level was set to 60 m below surface in the entire area and the probability for
transportation to the saturated zone was thus set to 0.5 for the whole area.
6.3.2.3 Probability of transport to the groundwater supply, Ps.
Lastly, the assessment of the probability of transport to a water supply, Ps, was made
with respect to fracture connectivity as a function of fracture zone density and jointing
in the lithological units (see Table 6.4 and 6.5). A high density fracture zone is
generally considered to transport pollutants to a greater extent than areas containing
little fractures. Lineaments i.e. fracture zones of the Gross Haigamas area are
indicated in Figure 8.5.
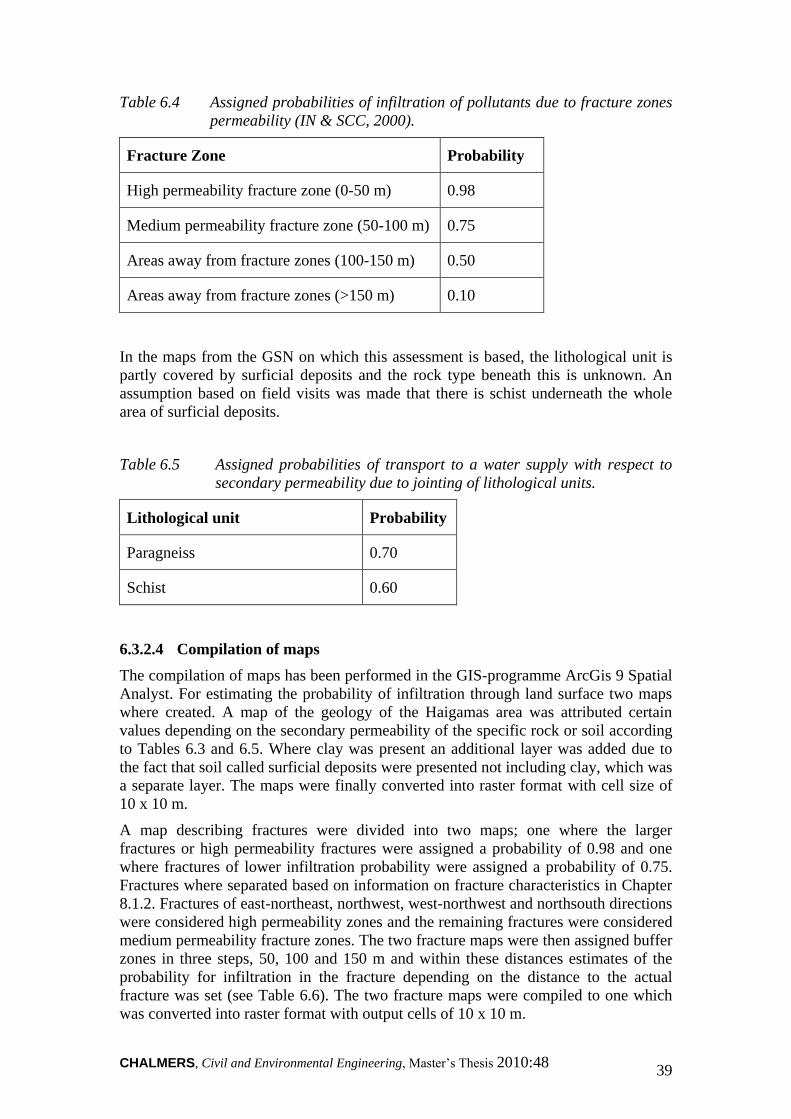
CHALMERS, Civil and Environmental Engineering, Master’s Thesis 2010:48 39
Table 6.4 Assigned probabilities of infiltration of pollutants due to fracture zones
permeability (IN & SCC, 2000).
Fracture Zone Probability
High permeability fracture zone (0-50 m) 0.98
Medium permeability fracture zone (50-100 m) 0.75
Areas away from fracture zones (100-150 m) 0.50
Areas away from fracture zones (>150 m) 0.10
In the maps from the GSN on which this assessment is based, the lithological unit is
partly covered by surficial deposits and the rock type beneath this is unknown. An
assumption based on field visits was made that there is schist underneath the whole
area of surficial deposits.
Table 6.5 Assigned probabilities of transport to a water supply with respect to
secondary permeability due to jointing of lithological units.
Lithological unit Probability
Paragneiss 0.70
Schist 0.60
6.3.2.4 Compilation of maps
The compilation of maps has been performed in the GIS-programme ArcGis 9 Spatial
Analyst. For estimating the probability of infiltration through land surface two maps
where created. A map of the geology of the Haigamas area was attributed certain
values depending on the secondary permeability of the specific rock or soil according
to Tables 6.3 and 6.5. Where clay was present an additional layer was added due to
the fact that soil called surficial deposits were presented not including clay, which was
a separate layer. The maps were finally converted into raster format with cell size of
10 x 10 m.
A map describing fractures were divided into two maps; one where the larger
fractures or high permeability fractures were assigned a probability of 0.98 and one
where fractures of lower infiltration probability were assigned a probability of 0.75.
Fractures where separated based on information on fracture characteristics in Chapter
8.1.2. Fractures of east-northeast, northwest, west-northwest and northsouth directions
were considered high permeability zones and the remaining fractures were considered
medium permeability fracture zones. The two fracture maps were then assigned buffer
zones in three steps, 50, 100 and 150 m and within these distances estimates of the
probability for infiltration in the fracture depending on the distance to the actual
fracture was set (see Table 6.6). The two fracture maps were compiled to one which
was converted into raster format with output cells of 10 x 10 m.

CHALMERS, Civil and Environmental Engineering, Master’s Thesis 2010:48 40
Table 6.6 Description of the assigned probabilities of infiltration of fractures
depending of character of and distance to the fracture.
P = 0.98 P = 0.75
0-50 m 0.98 0.75
50-100 m 0.75 0.50
100-150 m 0.50 0.50
>150 m 0.10 0.10
Concerning the probability of infiltration of the unsaturated zone the distance to the
groundwater table was assumed to be the governing factor. A raster layer of the level
60 m was created because this is where the ground water level was estimated to be
situated. The depth to the groundwater table was assumend to be constant in contrast
to the similar analysis in Windhoek on which this method was based. The entire layer
was assigned the probability of 0.5. The output cells are 10 x 10 m.
When compiling the layers of the probability of transport of pollutants to a possible
source, the method was similar as for the surface layer. The differences was that no
soil was assumed to be present at this depth and what was indicated as surficial
deposits at surface was assumed to be schist. This assumption was based on field
visits. The rock types were assigned probability ratings according to Tables 6.4 and
6.5, and the permeability due to fractures were assigned ratings as described above.
6.3.3 Possible sources of pollution and estimated degree of
contamination
To assess the potential pollution load a method developed by Foster and Hirata (1987,
cited in IN & SCC, 2000) and later further developed by Johansson et al (1999, cited
in IN & SCC, 2000) was used. This method consists of three parts;
Identification of pollution sources
Screening of identified sources
Characterisation of sources
Sources of pollution and related release of contaminants were mainly identified
through a field visit guided by one of the developers of the Omeya golf and residential
oasis, Mr. P. Du Plessis (2010), and studies of the proposed layout and plan of
activities. Screening of identified sources aims to categorise the identified sources of
pollution and in this case where the number of sources is small, the sources were
divided into a construction- and an operational phase. The sources were then
characterised according to the following parameters;

CHALMERS, Civil and Environmental Engineering, Master’s Thesis 2010:48 41
L1 Toxicity
L2 Release quantity
L3 Probability of release
L4 Type of release
L5 Possibility for remediation
Each factor was given a rating between 1 and 0, where 1 indicates a high probability and 0 a low probability. Factors were assessed based on Table 6.7, which also shows the applied intervals of each one of the characteristic groups.
Table 6.7 Rating characterisation of potential pollution sources (IN & SCC,
2000).
The five ratings were then compiled into a final rating of potential pollution load, Lfin, by addition of the values for the different characteristic groups, L1- L5. The numbers where then divided by the number of groups to derive a mean value and from this a value between 0 and 1 was provided for each source of pollution (see Equation 6.3).
(6.3)
6.3.4 Risk estimation of groundwater pollution
For each source of pollution a preliminary risk value was calculated. The risk (R) was defined as a product of the vulnerability (V), and the potential pollution load, (L), see equation 6.4.
R = V x L (6.4)
Lfin =
1
5Li
i=1
5
∑
CHALMERS, Civil and Environmental Engineering, Master’s Thesis 2010:48 42
In the report on Groundwater vulnerability of the Windhoek aquifer (IN & SCC,
2000), the risk is extended to be a product of partly vulnerability and potential
pollution load but also the potential resource value representing the negative
consequences (C), of a release. This modification of excluding the consequence was
made to simplify the process and not include economic values into the assessment.
A risk value was calculated for each source of pollution according to equation 6.4. No
risk was assigned in areas where no pollution was expected to be able to take place,
however vehicles releasing pollution during the construction phase may travel all over
the area and pose a threat to the groundwater and were not specifically accounted for
in the risk maps.
The estimated risk values were compiled into a map showing geographically where
most caution has to be taken. This was done by combining the vulnerability map and
the map locating pollution sources and adjacent pollution.
6.4 Identification of advantages
The identification of advantages was based on parts of the questionnaire referred to in
Chapter 6.2 and presented in Appendix A. The method used was interviews with
people familiar to hydrogeology, geology and/or the water supply of the area and the
mentioned questionnaire made up the basis for a brainstorming process leading to a
discussion concerning possible advantages of expanding the Windhoek water supply.

CHALMERS, Civil and Environmental Engineering, Master’s Thesis 2010:48 43
7 FMECA for a possible pipeline
This chapter presents the result of the FMECA methodology described in Chapter 6.2.
All the steps included in the FMECA process are presented with related information,
either as results, discussion or conclusions.
7.1 Scope
The scope of this specific FMECA was to:
Identify limitations in the shape of failure causes with related failure modes,
failure effects, probabilities and consequences to the possible pipeline between
Windhoek and Rehoboth.
Identify the risk for each failure cause by combining the probability and
consequence.
Propose risk reduction options and measures for the identified failure causes.
7.1.1 Boundaries of the study
The boundaries of the studied water system were the two ends of the pipeline, e.g.
where the water from the distribution systems in Windhoek and Rehoboth enters the
pipeline. So when the water enters the pipeline it is either clean or polluted. The
pipeline itself with attached infrastructure was included in this specific FMECA,
while the dams, boreholes and wastewater treatment plants in both Windhoek and
Rehoboth were excluded. A holographic view of the specific elements included in the
studied system is presented in the HHM in Figure 7.1.
This project did not consider the exact stretch of the pipeline, if the pipeline system is
open or closed, the material of the pipeline or if the pipeline will be built above or
below the ground. All those things do of course affect what kind of failure causes that
will be relevant, but the purpose of this study was to discuss the overall risks with a
project like this, without regarding e.g. the specific stretch or material of the pipeline.
If the decision to build a pipeline is made, some of the presented failure causes and
risks will be more relevant than others, depending on the above mentioned
parameters. When the exact parameters are chosen, further investigations should be
performed.
7.2 Hierarchical holographic model (HHM) for the pipeline
Figure 7.1 below shows the studied system with the included elements in a connection
of the water systems in Windhoek and Rehoboth. The pipeline was the studied system
in this particular FMECA, and it consisted of several elements that are needed for the
pipeline to function. The identified elements were as seen below; pumps, valves,
access roads, material, electricity and the water intakes in both Windhoek and
Rehoboth. The HHM enabled an identification of a larger amount and more specific
failure causes that could be a threat to the pipeline.
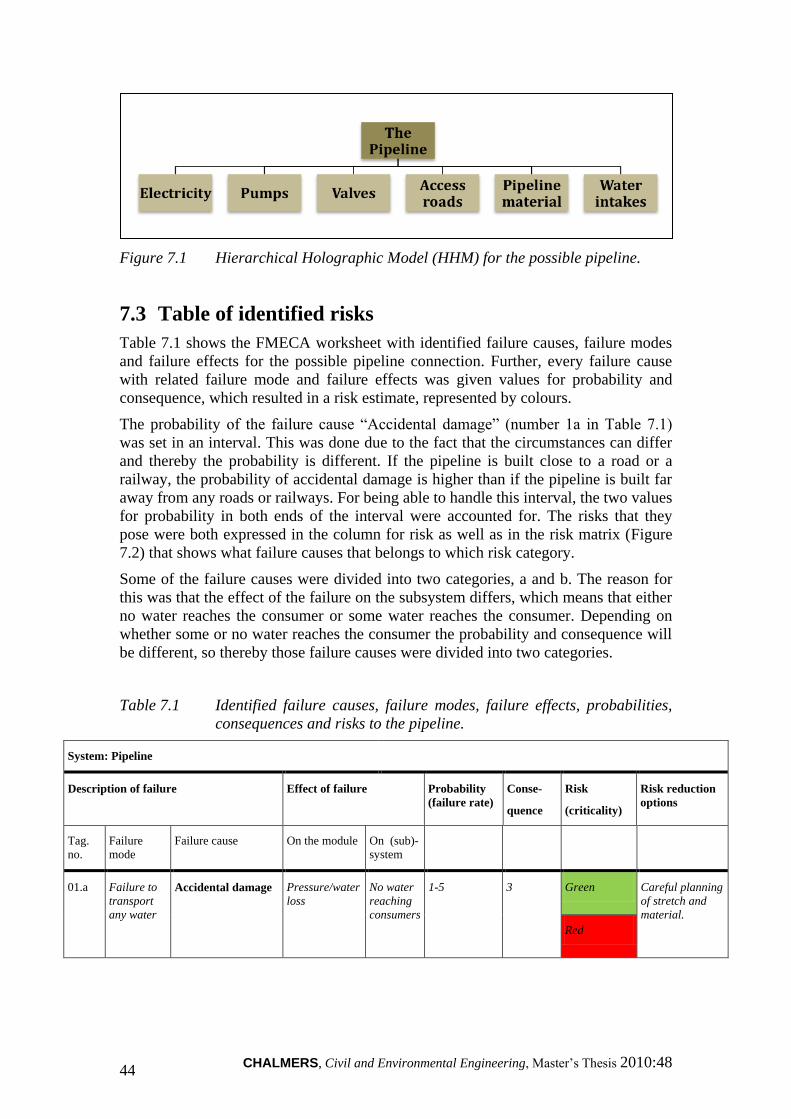
CHALMERS, Civil and Environmental Engineering, Master’s Thesis 2010:48 44
Figure 7.1 Hierarchical Holographic Model (HHM) for the possible pipeline.
7.3 Table of identified risks
Table 7.1 shows the FMECA worksheet with identified failure causes, failure modes
and failure effects for the possible pipeline connection. Further, every failure cause
with related failure mode and failure effects was given values for probability and
consequence, which resulted in a risk estimate, represented by colours.
The probability of the failure cause “Accidental damage” (number 1a in Table 7.1)
was set in an interval. This was done due to the fact that the circumstances can differ
and thereby the probability is different. If the pipeline is built close to a road or a
railway, the probability of accidental damage is higher than if the pipeline is built far
away from any roads or railways. For being able to handle this interval, the two values
for probability in both ends of the interval were accounted for. The risks that they
pose were both expressed in the column for risk as well as in the risk matrix (Figure
7.2) that shows what failure causes that belongs to which risk category.
Some of the failure causes were divided into two categories, a and b. The reason for
this was that the effect of the failure on the subsystem differs, which means that either
no water reaches the consumer or some water reaches the consumer. Depending on
whether some or no water reaches the consumer the probability and consequence will
be different, so thereby those failure causes were divided into two categories.
Table 7.1 Identified failure causes, failure modes, failure effects, probabilities,
consequences and risks to the pipeline.
System: Pipeline
Description of failure
Effect of failure Probability
(failure rate)
Conse-
quence
Risk
(criticality)
Risk reduction
options
Tag.
no.
Failure
mode
Failure cause On the module On (sub)-
system
01.a
Failure to
transport
any water
Accidental damage Pressure/water
loss
No water
reaching
consumers
1-5 3 Green Careful planning
of stretch and
material.
Red

CHALMERS, Civil and Environmental Engineering, Master’s Thesis 2010:48 45
02.a Failure to
transport
any water
Electrical failure Pressure loss No water
reaching
consumers
3 4 Yellow Efficient
maintenance.
Access to
alternative
sources of
electricity, e.g.
diesel-electric
generators.
02.b Failure to
transport
some water
Some
water
reaching
consumers
4 2 Yellow Efficient
maintenance.
Access to
alternative
sources of
electricity, e.g.
diesel-electric
generators.
03.a Failure to
transport
any water
Valve failure Pressure loss No water
reaching
consumers
4 2 Yellow Efficient
maintenance.
Easy access to
spare parts.
03.b Failure to
transport
some water
Some
water
reaching
consumers
4 1 Green Efficient
maintenance.
Easy access to
spare parts.
04.a Failure to
transport
any water
Pump failure Pressure loss No water
reaching
consumers
4 2 Yellow Efficient
maintenance.
Parallel pumps.
04.b Failure to
transport
some water
Some
water
reaching
consumer
4 1 Green Efficient
maintenance.
Parallel pumps.
05.a Failure to
transport
any water
Sabotage Pressure/water
loss
No water
reaching
consumer
2 4 Yellow Solid and well
protected
constructions.
Guards.
Information to
the public.
05.b Failure to
transport
some water
Some
water
reaching
consumer
3 3 Yellow Solid and well
protected
constructions.
Guards.
Information to
the public.
06.a Failure to
transport
water
Flash floods Pressure/Water
loss
No water
reaching
consumer
2 5 Red Well-engineered
constructions.
Proper
protection in the
rivers.

CHALMERS, Civil and Environmental Engineering, Master’s Thesis 2010:48 46
07.a Failure to
transport
water
Illegal connections Pressure/water
loss
No water
reaching
consumer
2 4 Yellow Surveillance
systems.
07.b Some
water
reaching
consumer
5 2 Yellow Surveillance
systems.
08.a Failure to
transport
any water
Poor pipeline
material
Pressure/water
loss
No water
reaching
consumer
1 3 Green Thorough
investigations on
choice of
material.
08.b Failure to
transport
some water
Some
water
reaching
consumer
2 2 Green Thorough
investigations on
choice of
material.
09.a Failure to
transport
water
Bad maintenance Pressure loss,
water quality
degradation
No or
unsafe
water
reaching
consumers
1 4 Yellow Good routines
for an efficient
maintenance.
09.b Some or
unsafe
water
reaching
consumer
2 3 Yellow Good routines
for an efficient
maintenance.
10.a Failure to
deliver safe
water
Polluted water into
the system
Water quality
degradation
Heavily
polluted
water
reaching
consumers
2 5 Red Efficient control
systems for the
water coming
from the possible
extraction
points.
10.b Polluted
water
reaching
consumers
3 4 Yellow Efficient control
systems for the
water coming
from the possible
extraction
points.
11.a Failure to
transport
water
No water into the
system
Lack of water No water
reaching
consumer
2 4 Yellow
12.a Failure to
transport
some water
Some water into the
system
Partly lack of
water
Some
water
reaching
consumers
3 3 Yellow
13.a Failure to
transport
water
Conflicts No water
reaching
consumers
1 3 Green Information to
the public.
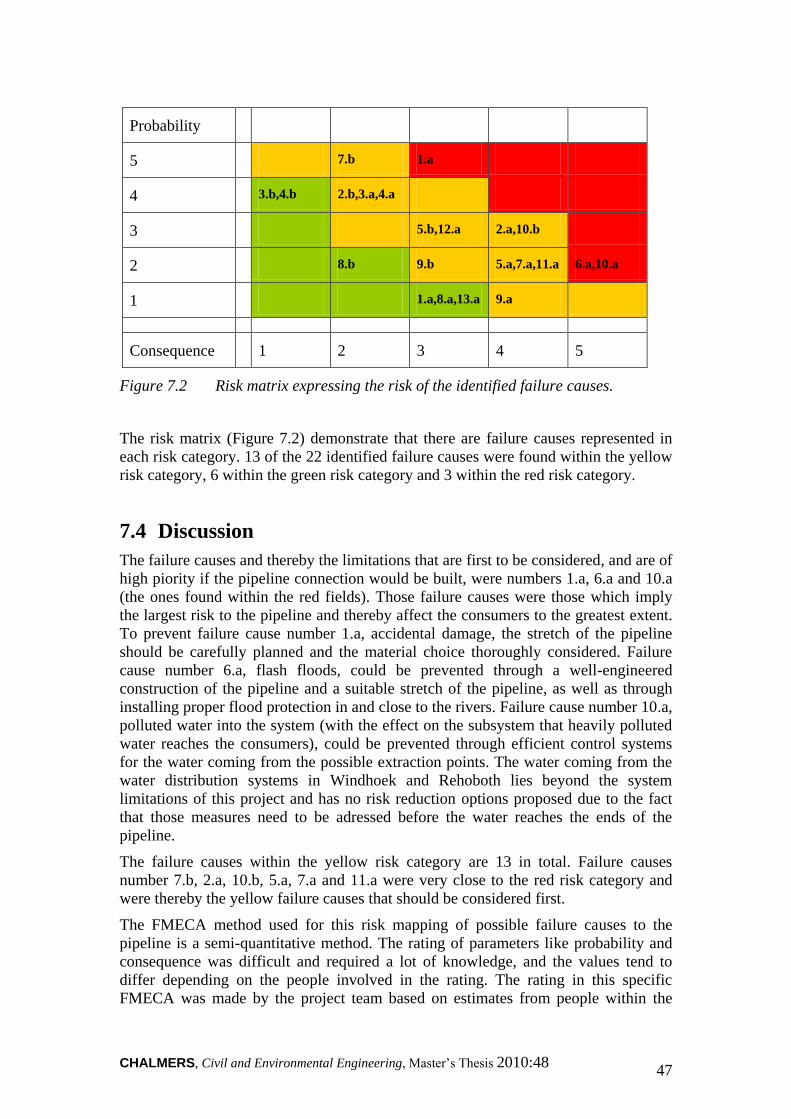
CHALMERS, Civil and Environmental Engineering, Master’s Thesis 2010:48 47
Figure 7.2 Risk matrix expressing the risk of the identified failure causes.
The risk matrix (Figure 7.2) demonstrate that there are failure causes represented in
each risk category. 13 of the 22 identified failure causes were found within the yellow
risk category, 6 within the green risk category and 3 within the red risk category.
7.4 Discussion
The failure causes and thereby the limitations that are first to be considered, and are of
high piority if the pipeline connection would be built, were numbers 1.a, 6.a and 10.a
(the ones found within the red fields). Those failure causes were those which imply
the largest risk to the pipeline and thereby affect the consumers to the greatest extent.
To prevent failure cause number 1.a, accidental damage, the stretch of the pipeline
should be carefully planned and the material choice thoroughly considered. Failure
cause number 6.a, flash floods, could be prevented through a well-engineered
construction of the pipeline and a suitable stretch of the pipeline, as well as through
installing proper flood protection in and close to the rivers. Failure cause number 10.a,
polluted water into the system (with the effect on the subsystem that heavily polluted
water reaches the consumers), could be prevented through efficient control systems
for the water coming from the possible extraction points. The water coming from the
water distribution systems in Windhoek and Rehoboth lies beyond the system
limitations of this project and has no risk reduction options proposed due to the fact
that those measures need to be adressed before the water reaches the ends of the
pipeline.
The failure causes within the yellow risk category are 13 in total. Failure causes
number 7.b, 2.a, 10.b, 5.a, 7.a and 11.a were very close to the red risk category and
were thereby the yellow failure causes that should be considered first.
The FMECA method used for this risk mapping of possible failure causes to the
pipeline is a semi-quantitative method. The rating of parameters like probability and
consequence was difficult and required a lot of knowledge, and the values tend to
differ depending on the people involved in the rating. The rating in this specific
FMECA was made by the project team based on estimates from people within the
Probability
5 7.b 1.a
4 3.b,4.b 2.b,3.a,4.a
3 5.b,12.a 2.a,10.b
2 8.b 9.b 5.a,7.a,11.a 6.a,10.a
1 1.a,8.a,13.a 9.a
Consequence 1 2 3 4 5
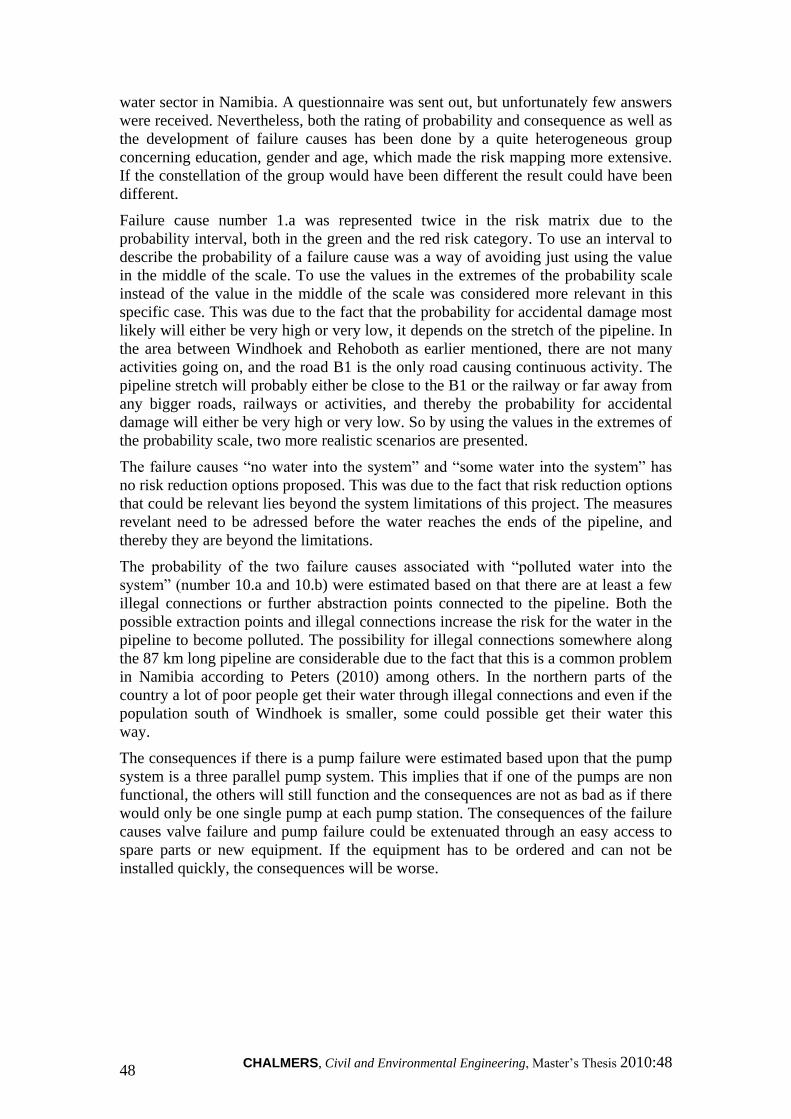
CHALMERS, Civil and Environmental Engineering, Master’s Thesis 2010:48 48
water sector in Namibia. A questionnaire was sent out, but unfortunately few answers
were received. Nevertheless, both the rating of probability and consequence as well as
the development of failure causes has been done by a quite heterogeneous group
concerning education, gender and age, which made the risk mapping more extensive.
If the constellation of the group would have been different the result could have been
different.
Failure cause number 1.a was represented twice in the risk matrix due to the
probability interval, both in the green and the red risk category. To use an interval to
describe the probability of a failure cause was a way of avoiding just using the value
in the middle of the scale. To use the values in the extremes of the probability scale
instead of the value in the middle of the scale was considered more relevant in this
specific case. This was due to the fact that the probability for accidental damage most
likely will either be very high or very low, it depends on the stretch of the pipeline. In
the area between Windhoek and Rehoboth as earlier mentioned, there are not many
activities going on, and the road B1 is the only road causing continuous activity. The
pipeline stretch will probably either be close to the B1 or the railway or far away from
any bigger roads, railways or activities, and thereby the probability for accidental
damage will either be very high or very low. So by using the values in the extremes of
the probability scale, two more realistic scenarios are presented.
The failure causes “no water into the system” and “some water into the system” has
no risk reduction options proposed. This was due to the fact that risk reduction options
that could be relevant lies beyond the system limitations of this project. The measures
revelant need to be adressed before the water reaches the ends of the pipeline, and
thereby they are beyond the limitations.
The probability of the two failure causes associated with “polluted water into the
system” (number 10.a and 10.b) were estimated based on that there are at least a few
illegal connections or further abstraction points connected to the pipeline. Both the
possible extraction points and illegal connections increase the risk for the water in the
pipeline to become polluted. The possibility for illegal connections somewhere along
the 87 km long pipeline are considerable due to the fact that this is a common problem
in Namibia according to Peters (2010) among others. In the northern parts of the
country a lot of poor people get their water through illegal connections and even if the
population south of Windhoek is smaller, some could possible get their water this
way.
The consequences if there is a pump failure were estimated based upon that the pump
system is a three parallel pump system. This implies that if one of the pumps are non
functional, the others will still function and the consequences are not as bad as if there
would only be one single pump at each pump station. The consequences of the failure
causes valve failure and pump failure could be extenuated through an easy access to
spare parts or new equipment. If the equipment has to be ordered and can not be
installed quickly, the consequences will be worse.

CHALMERS, Civil and Environmental Engineering, Master’s Thesis 2010:48 49
7.5 Conclusions
Below, the conclusions from the FMECA performed for the possible pipeline between
Windhoek and Rehoboth are presented.
There were in total 22 failure causes or limitations identified to the possible
pipeline. 13 within the yellow risk category, 6 within the green risk category
and 3 within the red risk category.
The failure causes that were found within the red and unacceptable field and
are the most important to prevent and mitigate are accidental damage (no 1.a),
flash floods (no 6.a) and polluted water into the system (with the effect on the
subsystem that heavily polluted water reaches the consumers, no 10.a).
Suggestions of risk reduction options for preventing accidental damage are to
plan the stretch of the pipeline carefully and to choose a suitable material.
Suggestions of risk reduction options concerning flash floods are to make a
well-engineered construction of the pipeline, to propose a suitable stretch of
the pipeline and to install proper flood protection in and close to the rivers.
A suggestion of a risk reduction option concerning polluted water into the
system (with the effect on the subsystem that heavily polluted water reaches
the consumers), is to install efficient control systems for the water coming
from the possible extraction points.
It is important to work with prevention of all failure causes, not only those
within the red risk category. The failure causes within the yellow risk category
were many, and some of them were as well close to the red risk category,
which implies a relatively high risk.
The stretch of the pipeline, if the pipeline system is open or closed, the
material of the pipeline and whether it will be built above or beneath the
ground affect what kind of failure causes and risks that will be relevant to the
pipeline system. If the decision to build a pipeline between Windhoek and
Rehoboth is made, some of the presented failure causes and risks will thereby
be more relevant than others.
Due to the fact that this master thesis is meant to function as a pre-study and
that the FMECA was an early stage risk assessment, it is important to keep in
mind that more thoroughly investigations are needed if the possible pipeline is
to be built.
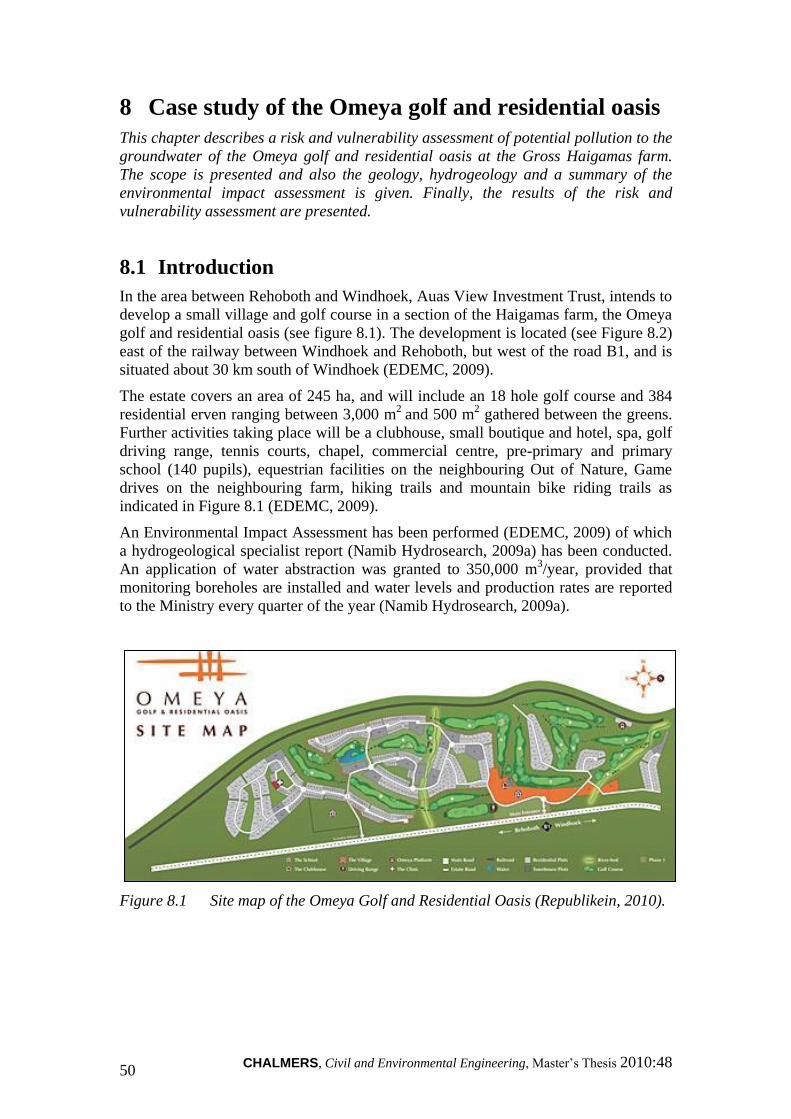
CHALMERS, Civil and Environmental Engineering, Master’s Thesis 2010:48 50
8 Case study of the Omeya golf and residential oasis
This chapter describes a risk and vulnerability assessment of potential pollution to the
groundwater of the Omeya golf and residential oasis at the Gross Haigamas farm.
The scope is presented and also the geology, hydrogeology and a summary of the
environmental impact assessment is given. Finally, the results of the risk and
vulnerability assessment are presented.
8.1 Introduction
In the area between Rehoboth and Windhoek, Auas View Investment Trust, intends to
develop a small village and golf course in a section of the Haigamas farm, the Omeya
golf and residential oasis (see figure 8.1). The development is located (see Figure 8.2)
east of the railway between Windhoek and Rehoboth, but west of the road B1, and is
situated about 30 km south of Windhoek (EDEMC, 2009).
The estate covers an area of 245 ha, and will include an 18 hole golf course and 384
residential erven ranging between 3,000 m2
and 500 m2 gathered between the greens.
Further activities taking place will be a clubhouse, small boutique and hotel, spa, golf
driving range, tennis courts, chapel, commercial centre, pre-primary and primary
school (140 pupils), equestrian facilities on the neighbouring Out of Nature, Game
drives on the neighbouring farm, hiking trails and mountain bike riding trails as
indicated in Figure 8.1 (EDEMC, 2009).
An Environmental Impact Assessment has been performed (EDEMC, 2009) of which
a hydrogeological specialist report (Namib Hydrosearch, 2009a) has been conducted.
An application of water abstraction was granted to 350,000 m3/year, provided that
monitoring boreholes are installed and water levels and production rates are reported
to the Ministry every quarter of the year (Namib Hydrosearch, 2009a).
Figure 8.1 Site map of the Omeya Golf and Residential Oasis (Republikein, 2010).
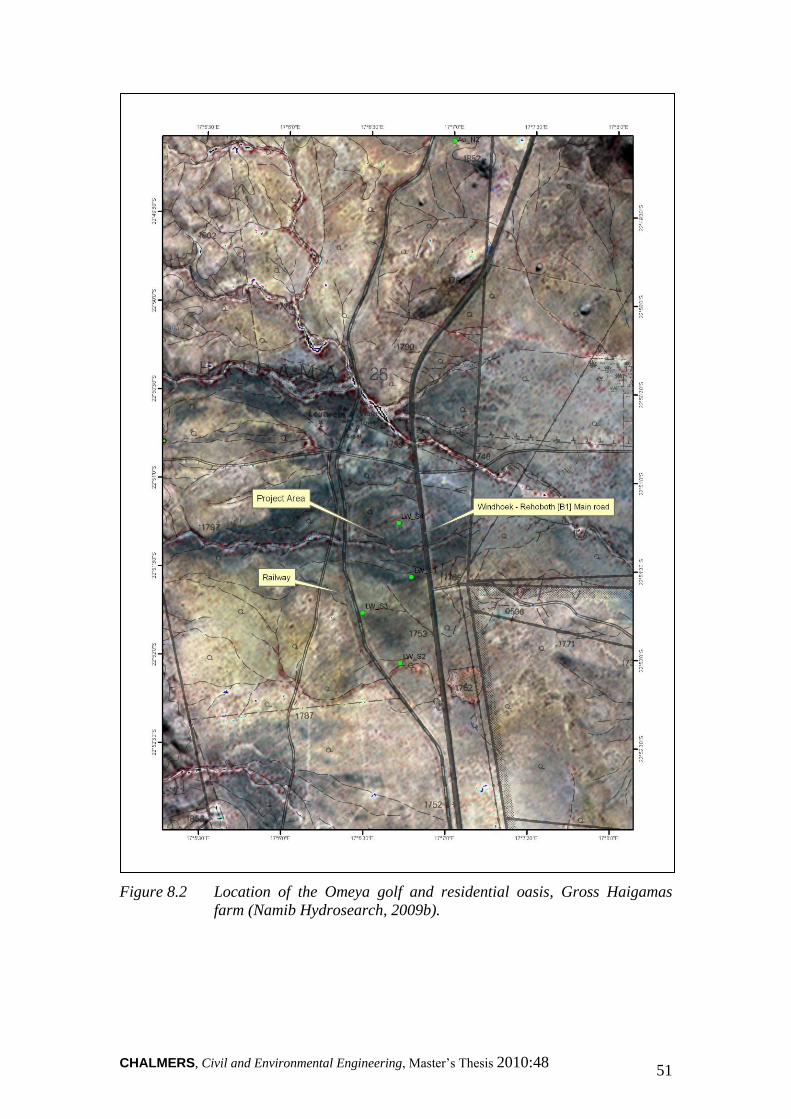
CHALMERS, Civil and Environmental Engineering, Master’s Thesis 2010:48 51
Figure 8.2 Location of the Omeya golf and residential oasis, Gross Haigamas
farm (Namib Hydrosearch, 2009b).

CHALMERS, Civil and Environmental Engineering, Master’s Thesis 2010:48 52
8.1.1 Scope
The scope of this risk assessment was to:
Demonstrate a method for conducting vulnerability and risk assessments of
aquifers to facilitate further investigations of possible groundwater extraction
in the area between Windhoek and Rehoboth.
Provide the Omeya golf and residential oasis with a risk map for decisions
concerning location of hazardous activities to avoid contamination of the
groundwater.
8.1.2 Geology of the Haigamas farm
Rocks of the Hohewarte Complex (age 1,800 Ma and older) with para-gneiss and
meta-sedimentary rocks dominate the area. There are also minor intrusions of
Granites from the Gamsberg Suite (1,100 Ma) and plugs of phonolite and trachite (32
to 39 Ma). The rocks from the Hohewarte complex, the para-gneiss and meta
sedimentary rocks, are generally decomposed close to surface and along fracture
zones and are highly weathered. According to Namib Hydrosearch (2009a), the faults
and fractures are often intruded by the younger trachites and phonolites, and by that to
some extent destroying the secondary porosity, which have an impact on aquifer
performance.
Surficial deposits are derived from the underlying lithology, and are according to the
Atlas of Namibia (2002) classified as leptosol, which refers to shallow soil cover over
hard rocks. Some deposits are also brought in by ephemeral drainage causing deposits
of clay rich material to spread over a wider area, further sand accumulates along the
channels (Namib Hydrosearch, 2009a). There has been an extensive hydrogeological
investigation made (Namib Hydrosearch, 2009b) and from this a number of maps
where derived. Among others a lineament density and surficial deposits map (Figure
8.3 and 8.4).

CHALMERS, Civil and Environmental Engineering, Master’s Thesis 2010:48 53
Figure 8.3 Interpreted surficial geology of the Gross Haigamas area (Sarma,
2010).

CHALMERS, Civil and Environmental Engineering, Master’s Thesis 2010:48 54
Figure 8.4 Surficial deposits, green areas indicate richness of clay (Namib
Hydrosearch, 2009b).
As seen in Figure 8.4, a large part of the area is covered by clay. Other surficial
material is mainly sand which seems to be underlain by further clay (Bochmühl,
2010).
The development is situated in an area of high lineament density (see Figure 8.5) and
high yielding boreholes are located near related fault zones. Major lineament
directions according to Namib Hydrosearch (2009b) are northwest, east-northeast and

CHALMERS, Civil and Environmental Engineering, Master’s Thesis 2010:48 55
west-northwest. Further, larger structures of north south bounding lineaments could
be related to the fault system in the same direction of the Windhoek area (Namib
Hydrosearch, 2009b).
Figure 8.5 Lineament density. Indicated boreholes are not named as in Table 8.1
(Namib Hydrosearch, 2009b).

CHALMERS, Civil and Environmental Engineering, Master’s Thesis 2010:48 56
8.1.3 Hydrogeology
In the Haigamas area, groundwater can be found in secondary fracture zones,
secondary porosity in joints and weathered horizons along faults. There is also
mineralized groundwater at elevated temperatures in deep faults. For the basement
rocks, highly weathered faults yield the most groundwater (Namib Hydrosearch,
2009a).
Existing boreholes in the area yield between 1 and 2 m3/h and amounts up to 10 m
3/h
are known (Namib Hydrosearch, 2009a). Drillings made in Haigamas yielding most
water were located on a thin, dipping (40 to 50°, see Figure 8.6), and grey marble
horizon within the Hohewarte Complex. The marble is exposed in an outcrop in the
northern part of the area and at the northern and southern contacts of the marble unit,
gneisses are exposed. This east-northeast trending fault zone is about 50 m wide
(Namib Hydrosearch, 2009a).
Figure 8.6 Schematic view of the marble horizon.
There are two ephemeral streams running from elevated areas in the west flowing to
the north and south possible over the marble horizon. According to the Namib
Hydrosearch (2009a), there are problems identifying the marble band due to alluvial
deposits covering most of the surrounding area. One of the boreholes presented in the
table below will be used as production borehole (see Figure 8.7). Drilling information
from two boreholes is presented in Table 8.1.
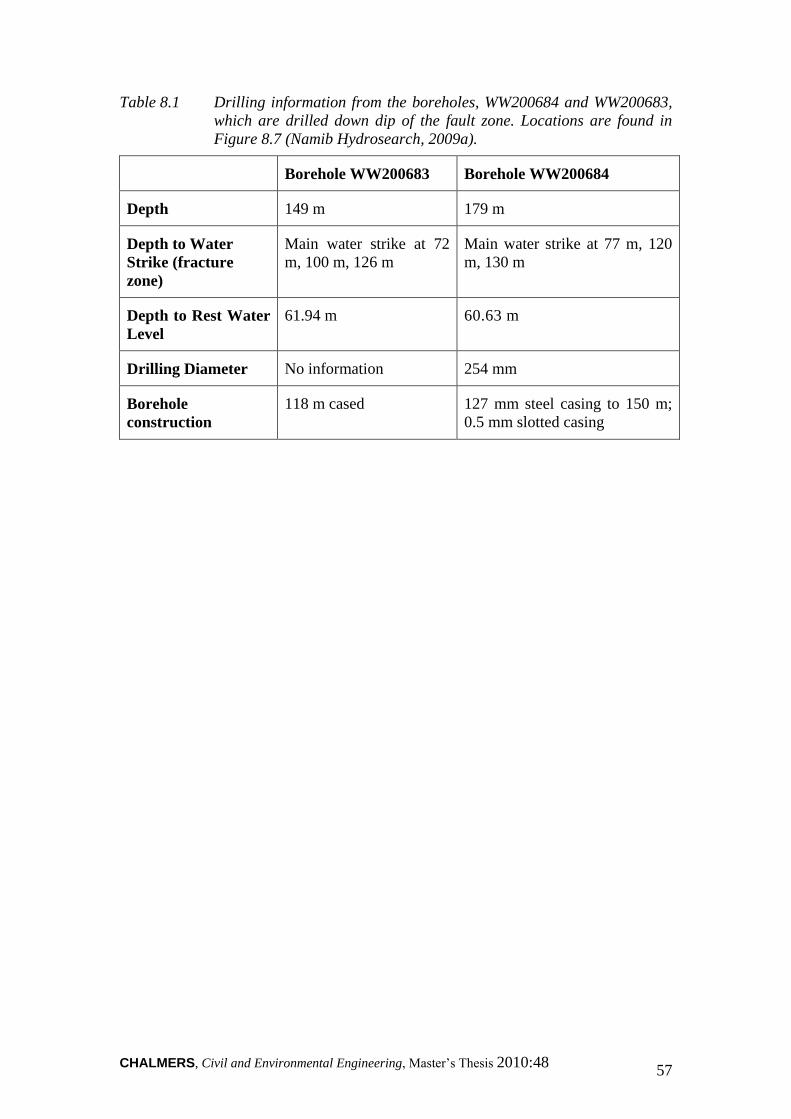
CHALMERS, Civil and Environmental Engineering, Master’s Thesis 2010:48 57
Table 8.1 Drilling information from the boreholes, WW200684 and WW200683,
which are drilled down dip of the fault zone. Locations are found in
Figure 8.7 (Namib Hydrosearch, 2009a).
Borehole WW200683 Borehole WW200684
Depth 149 m 179 m
Depth to Water
Strike (fracture
zone)
Main water strike at 72
m, 100 m, 126 m
Main water strike at 77 m, 120
m, 130 m
Depth to Rest Water
Level
61.94 m 60.63 m
Drilling Diameter No information 254 mm
Borehole
construction
118 m cased 127 mm steel casing to 150 m;
0.5 mm slotted casing

CHALMERS, Civil and Environmental Engineering, Master’s Thesis 2010:48 58
Figure 8.7 Location of the production borehole, in relation to lineaments (Namib
Hydrosearch, 2009a).
!(
!(
!(
!(
!(
!(
!(
!(
!(
!(
!(!(
!(
!(
!(
!(
!(!(
!(
!(
!(
!(
!(
!(
!(
!(!(
!(!(
!(
!(
!(
!(
!(
!(
!( !(
!(
!(
!(
!(
!(
!(
!(
!(
!(
!(
!(
!(
!(
!(
!(!(
!(
!(
!(
!( !(
!(
!(
!(
!(
!(
!(!(
!(!(
Production borehole
GROSS HAIGAMAS
GOCHEGANAS
OAMITES
LICHTENSTEIN
VERDRUK
KRUMHUK
GROSS HAIGAMAS
GROOT AUB
KRANSNEUS
LEOPARD
SUGECK
LICHTENSTEIN SUD
GOCHEGANASGOCHEGANAS
WERDENFELS
LICHTENSTEIN ZUKAUF
KRUMHUKKRUMHUK
GOCHEGANAS
WW8319
WW6849
WW4175
WW1017
WW28298
17°9'15"E
17°9'15"E
17°8'45"E
17°8'45"E
17°8'15"E
17°8'15"E
17°7'45"E
17°7'45"E
17°7'15"E
17°7'15"E
17°6'45"E
17°6'45"E
17°6'15"E
17°6'15"E
17°5'45"E
17°5'45"E
17°5'15"E
17°5'15"E
17°4'45"E
17°4'45"E
17°4'15"E
17°4'15"E
22
°48
'15
"S
22
°48
'15
"S
22
°48
'45
"S
22
°48
'45
"S
22
°49
'15
"S
22
°49
'15
"S
22
°49
'45
"S
22
°49
'45
"S
22
°50
'15
"S
22
°50
'15
"S
22
°50
'45
"S
22
°50
'45
"S
22
°51
'15
"S
22
°51
'15
"S
22
°51
'45
"S
22
°51
'45
"S
22
°52
'15
"S
22
°52
'15
"S
22
°52
'45
"S
22
°52
'45
"S
22
°53
'15
"S
22
°53
'15
"S
22
°53
'45
"S
22
°53
'45
"S
22
°54
'15
"S
22
°54
'15
"S
22
°54
'45
"S
22
°54
'45
"S

CHALMERS, Civil and Environmental Engineering, Master’s Thesis 2010:48 59
8.1.4 Summary of the hydrogeological environmental impact
assessment
A hydrogeological environmental impact assessment (Namib Hydrosearch, 2009a)
was performed to investigate test-pumping and estimate aquifer parameters, assess
sustainable yield and potential affect of pumping. Furthermore, a lineament map was
compiled and a map of the surficial cover was produced. Finally, protection zones
around the production boreholes were suggested.
There will be two production boreholes and protection zones are recommended. Zone
one will be marked by a fence to prevent any immediate activity around the borehole
and a second protection zone aims to protect the groundwater against viruses,
microbial and nitrate pollution (Namib Hydrosearch, 2009b). Furthermore a sanitary
seal is recommended to be placed on the well head (Namib Hydrosearch, 2009a).
Namib Hydrosearch (2009b) also recommends that activities that might result in
leakage of waste and heavy fertilisation should be avoided in the protection zone.
There will be a conventional sewerage disposal system collecting water to a treatment
plant located in the south end of the project area. The sewage plant is based on growth
biological treatment, in this case a trickling filter (EDEMC, 2009). Effluents from this
plant are planned to be used for irrigation and gardening at Omeya. The water is not
suitable for humans and sludge will be dried and used for compost (EDEMC, 2009).
A compost heap will be situated next to the sewerage works, while solid waste will be
sorted and transported to Rehoboth (EDEMC, 2009). It is also stated by Barrie
Watson (EDEMC, 2009) that if fertilizers are used they will be biodegradable. It is
thus appointed by Bochmühl (2009) that all fertilizers contain nitrates and that such
activities should be strictly controlled or forbidden in vulnerable areas.
In a situation of water scarcity, NamWater (EDEMC, 2009) approve water supply
from the Nauaspoort scheme or the Oanob dam but mentions that this is not the best
or only source of water if water scarcity would be reality. What is concluded is that
there is lack of an integrated view including other boreholes in the area. Furthermore
no hydrocensus for a larger area was made, which is seen as important for future
water management. A general conclusion concerning threats to the groundwater is
that the exposed fault zone would need protection to avoid surface contaminant
reaching the water table since it is considered an unconfined aquifer.
Other possible pollution sources to the groundwater are considered to be sewerage
line and sewer treatment facility and percolation of irrigation water. It is thus
mentioned that the planned treatment plant is located 1,500 m south of the borehole,
and that it is unlikely that the aquifer will be affected (Namib Hydrosearch, 2009a).
8.2 Results of the risk assessment of groundwater
contamination
Five maps were produced as a basis for the assessment of the groundwater
vulnerability to pollution. The maps were combined into three maps according to the
methodology described in Chapter 6, describing probability of infiltration through
land surface, probability of infiltration through the unsaturated zone and probability of
infiltration trough the saturated zone. Two maps representing fracture zone
permeability and secondary permeability of the lithological unit were combined into
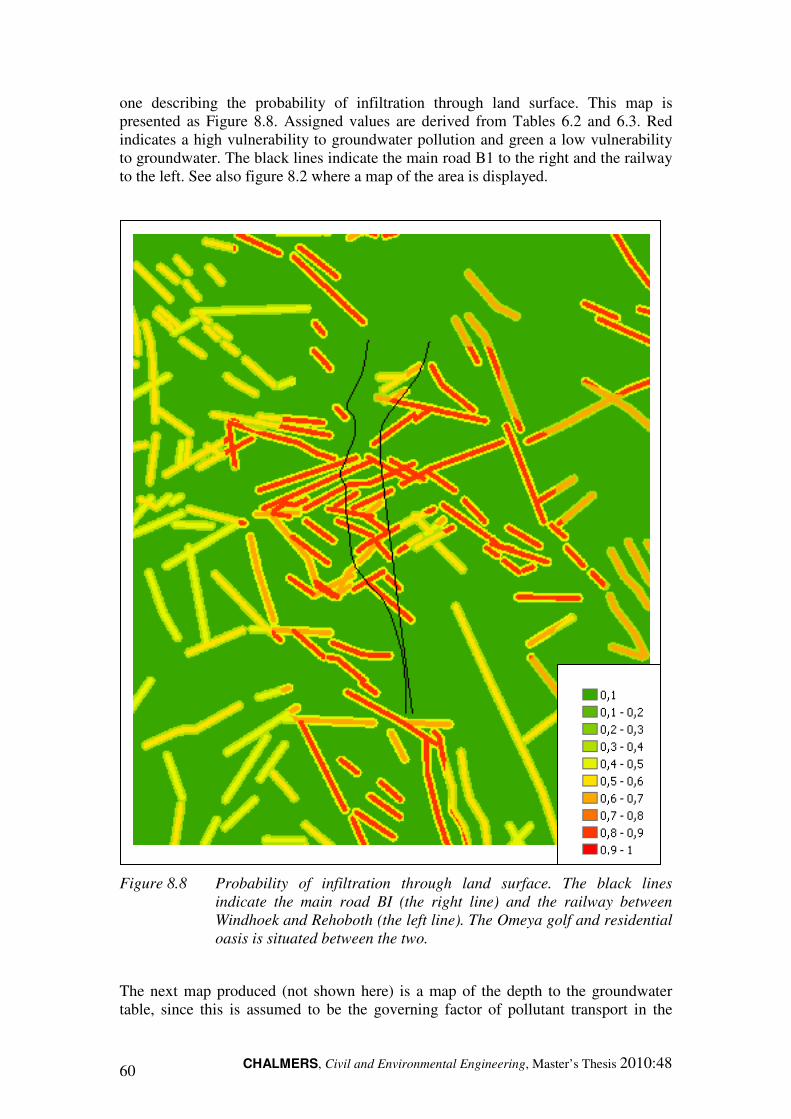
CHALMERS, Civil and Environmental Engineering, Master’s Thesis 2010:48 60
one describing the probability of infiltration through land surface. This map is
presented as Figure 8.8. Assigned values are derived from Tables 6.2 and 6.3. Red
indicates a high vulnerability to groundwater pollution and green a low vulnerability
to groundwater. The black lines indicate the main road B1 to the right and the railway
to the left. See also figure 8.2 where a map of the area is displayed.
Figure 8.8 Probability of infiltration through land surface. The black lines
indicate the main road BI (the right line) and the railway between
Windhoek and Rehoboth (the left line). The Omeya golf and residential
oasis is situated between the two.
The next map produced (not shown here) is a map of the depth to the groundwater
table, since this is assumed to be the governing factor of pollutant transport in the

CHALMERS, Civil and Environmental Engineering, Master’s Thesis 2010:48 61
unsaturated zone. Probability estimates are assigned according to Chapter 6.3.2.2 and
the value is 0.5 for the entire area since the surface is assumed to be flat. The
groundwater level is further assumed to be located 60 m below surface based on the
test drillings presented in Chapter 8.1.3.
The last map is a combination of fracture zone density and degree of jointing of
lithological units and show probability of transport of pollutants in the saturated zone.
This is displayed in Figure 8.9. Estimated values of probability can be seen in Table
6.4 and 6.5. Red indicates a high probability for transport of pollutants and green a
low probability. The black lines again indicate the B1 and the railway.
Figure 8.9 Probability of pollutant transport in the saturated zone.

CHALMERS, Civil and Environmental Engineering, Master’s Thesis 2010:48 62
The three maps were finally combined by equation 6.2 into a map displaying the
vulnerability to groundwater pollution (See Figure 8.10). Red indicates a high
vulnerability to pollution and green a low vulnerability to pollution. Fractures are
main conductors of possible pollution and are therefore indicated as red. The black
lines again indicate the B1 and the railway.
Figure 8.10 Estimated vulnerability to groundwater pollution in the Gross
Haigamas area.
CHALMERS, Civil and Environmental Engineering, Master’s Thesis 2010:48 63
8.3 Identified possible sources of pollution
Several possible sources of pollution were identified in or close to the area of the
resort. Table 8.2 lists the identified sources with related estimates of possible
pollution caused by the specific sources. Due to that no coordinates are available to
specify the exact location of these sources, no map displaying the locations is
presented.
The table was divided into two main categories; sources that might appear during the
constructional phase and sources that might occur during the operational phase. For
the first phase four possible sources of pollution were identified, these are; vehicles,
B1 (the highway running from Windhoek to Rehoboth), the railway and building
material. By specifically mentioning vehicles the intention is to emphasis the possible
accidents and leakages that might occur on the construction site involving vehicles
used in the construction work such as excavation machines and dump trucks.
During the operational phase 10 possible sources were identified: the clinic, the golf
course, sewerage, WWTP, sludge storage, internal roads, the railway, B1, ervens and
waste sorting. The clinic will be a small health care centre and the solid waste produce
from the waste sorting will be transported to Rehoboth to be placed on a waste
disposal site.
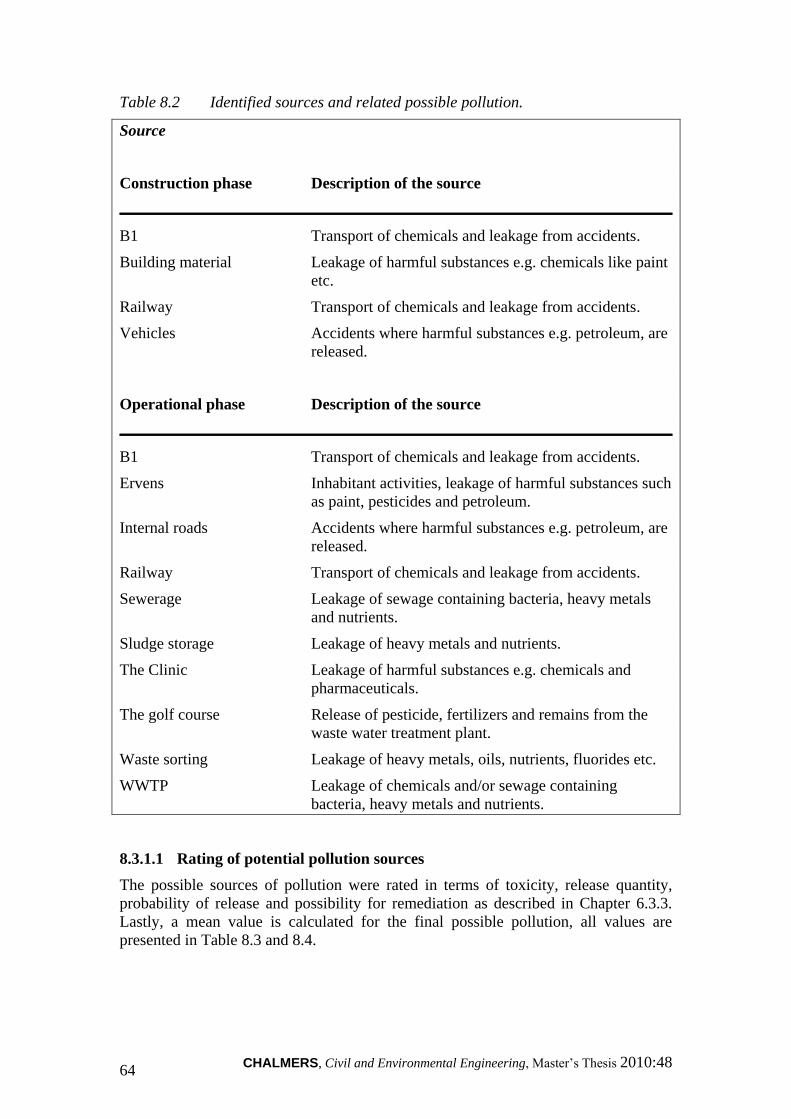
CHALMERS, Civil and Environmental Engineering, Master’s Thesis 2010:48 64
Table 8.2 Identified sources and related possible pollution.
Source
Construction phase Description of the source
B1 Transport of chemicals and leakage from accidents.
Building material Leakage of harmful substances e.g. chemicals like paint
etc.
Railway Transport of chemicals and leakage from accidents.
Vehicles Accidents where harmful substances e.g. petroleum, are
released.
Operational phase Description of the source
B1 Transport of chemicals and leakage from accidents.
Ervens Inhabitant activities, leakage of harmful substances such
as paint, pesticides and petroleum.
Internal roads Accidents where harmful substances e.g. petroleum, are
released.
Railway Transport of chemicals and leakage from accidents.
Sewerage Leakage of sewage containing bacteria, heavy metals
and nutrients.
Sludge storage Leakage of heavy metals and nutrients.
The Clinic Leakage of harmful substances e.g. chemicals and
pharmaceuticals.
The golf course Release of pesticide, fertilizers and remains from the
waste water treatment plant.
Waste sorting Leakage of heavy metals, oils, nutrients, fluorides etc.
WWTP Leakage of chemicals and/or sewage containing
bacteria, heavy metals and nutrients.
8.3.1.1 Rating of potential pollution sources
The possible sources of pollution were rated in terms of toxicity, release quantity,
probability of release and possibility for remediation as described in Chapter 6.3.3.
Lastly, a mean value is calculated for the final possible pollution, all values are
presented in Table 8.3 and 8.4.
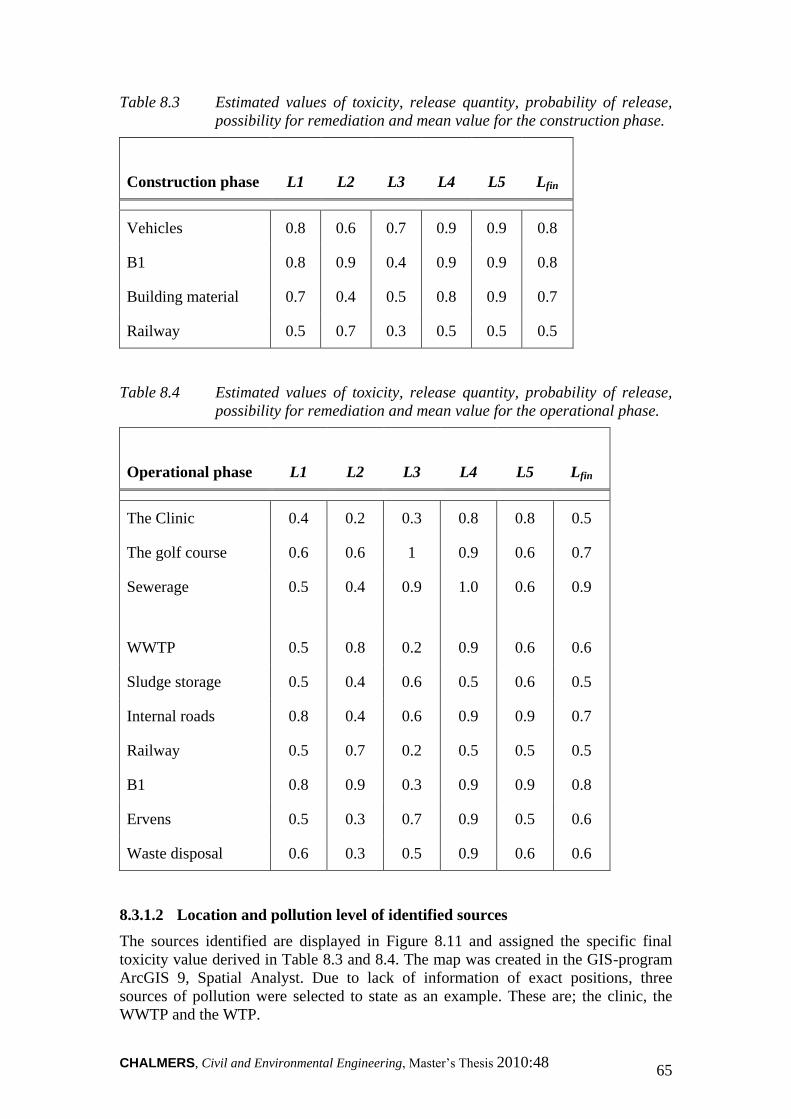
CHALMERS, Civil and Environmental Engineering, Master’s Thesis 2010:48 65
Table 8.3 Estimated values of toxicity, release quantity, probability of release,
possibility for remediation and mean value for the construction phase.
Construction phase
L1
L2
L3
L4
L5
Lfin
Vehicles 0.8 0.6 0.7 0.9 0.9 0.8
B1 0.8 0.9 0.4 0.9 0.9 0.8
Building material 0.7 0.4 0.5 0.8 0.9 0.7
Railway 0.5 0.7 0.3 0.5 0.5 0.5
Table 8.4 Estimated values of toxicity, release quantity, probability of release,
possibility for remediation and mean value for the operational phase.
Operational phase
L1
L2
L3
L4
L5
Lfin
The Clinic 0.4 0.2 0.3 0.8 0.8 0.5
The golf course 0.6 0.6 1 0.9 0.6 0.7
Sewerage
0.5 0.4 0.9 1.0 0.6 0.9
WWTP 0.5 0.8 0.2 0.9 0.6 0.6
Sludge storage 0.5 0.4 0.6 0.5 0.6 0.5
Internal roads 0.8 0.4 0.6 0.9 0.9 0.7
Railway 0.5 0.7 0.2 0.5 0.5 0.5
B1 0.8 0.9 0.3 0.9 0.9 0.8
Ervens 0.5 0.3 0.7 0.9 0.5 0.6
Waste disposal 0.6 0.3 0.5 0.9 0.6 0.6
8.3.1.2 Location and pollution level of identified sources
The sources identified are displayed in Figure 8.11 and assigned the specific final
toxicity value derived in Table 8.3 and 8.4. The map was created in the GIS-program
ArcGIS 9, Spatial Analyst. Due to lack of information of exact positions, three
sources of pollution were selected to state as an example. These are; the clinic, the
WWTP and the WTP.

CHALMERS, Civil and Environmental Engineering, Master’s Thesis 2010:48 66
8.4 Risk estimation
The risk estimation was a combination of the vulnerability of the ground, the ability to
transport pollution and the actual sources and level of pollution at a specific location
(see equation 6.2). The vulnerability map presented in Chapter 8.2 and the map of
location and pollution level of sources in Chapter 8.3.1.2 were combined into one and
displays the estimated risk of groundwater pollution from identified pollution sources
in the Omeya aquifer. The preliminary risk map is displayed in Figure 8.11. High risk
of groundwater pollution is indicated as red and low risk to groundwater pollution is
indicated as green. Black lines indicate the main road B1 to the right and the railway
to the left.
Figure 8.11 Preliminary risk map for the aquifer Omeya golf and residential oasis.
The black lines indicate the main road BI (the right line) and the
railway between Windhoek and Rehoboth (the left line). Omeya is
situated between the two.

CHALMERS, Civil and Environmental Engineering, Master’s Thesis 2010:48 67
8.5 Discussion
The risk of pollution to the Omeya aquifer is indicated in Figure 8.11 which shows
areas where extra caution should be taken. Where large fracture zones coincide with
great potential pollution sources the risk for groundwater pollution is the highest.
Where vulnerability to pollution is low and no sources of pollution are close, the risk
of contaminating the groundwater is lower.
The maps produced indicate relative risk and vulnerability within the area. Little can
be said in comparison to other areas concerning vulnerability and risk to groundwater
contamination unless this specific method is applied on a number of different areas
and is well documented.
Where clay-rich material is indicated, see Figure 8.4, an additional layer is inserted,
thus to the geological layer and the highest probability for infiltration is chosen in
each cell. This gives a slight overestimation of the risk to groundwater pollution since
clay holds and prevents pollutants from further transport. It is, however, unclear how
much clay there is and this was considered the most reliable and safe approach.
A marble zone strikes the area and is the reason for the high water yield. The marble
is thus not indicated on the geological map used to derive the risk and vulnerability
maps and extra caution should be taken where marble is visible or assumed to appear.
Further field investigations and updating of the geological maps should be done and
onsite inspection should assure no hazardous activities take place on or in the vicinity
of marble outcrops.
The risk and vulnerability maps produced are not a final answer to the level of risk in
the area. Further investigations are necessary if more detailed information is required.
These maps should rather provide an overview of risks and serve as basis for
discussion and decisions. It is also necessary to define the specific location of each of
the identified sources of pollution to be able to produce a comprehensive risk
estimation map.
8.6 Conclusions
The conclusions from the risk and vulnerability assessment of potential pollution to
the groundwater of the Omeya golf and residential oasis at the Gross Haigamas farm
are presented below.
Marble outcrops need to be identified and proper protection for pollutant
infiltration is required.
Areas where large fracture zones coincide with sources of pollution pose the
largest risk to groundwater contamination.
The maps indicate relative vulnerability and risk within the area.

CHALMERS, Civil and Environmental Engineering, Master’s Thesis 2010:48 68
9 Advantages of expanding the water supply
This chapter discusses advantages of expanding the water supply for Windhoek.
Several advantages are identified and qualitatively discussed.
9.1 Introduction
Connecting the water supply of Windhoek and Rehoboth is a project of great cost and
to investigate additional purposes for the pipeline could be interesting in the sense of a
possible increase of the economic efficiency and other advantages of the project. The
absolute cost for building a pipeline between Windhoek and Rehoboth, a stretch of
approximately 90 km, cannot be accounted for due to lack of information concerning
pipeline material, stretch, diameter etcetera. An estimated cost has though been
suggested by NamWater for a pipeline that would be 90 km long, have a diameter of
600 mm and be made out of ductile cast iron, which might be the case if the pipeline
would be built in the future. The price suggestion includes transport, excavation,
laying, backfilling, construction supervision, pressure testing etc, while the cost for
pump stations along the pipeline and power lines to the pump stations are excluded in
the cost as well as the VAT. The current cost suggestion is 688 million Namibian
dollars, plus/minus 25 percent (Drews, 2010).
This section aims to evaluate actions that could further increase advantages of
building the pipeline and a number of different suggestions are discussed below. As
there are actions increasing the feasibility of the project there might also be also be
implications by performing these actions, and therefore such measures are also
evaluated below.
9.2 Further extraction points along the pipeline
The area between Windhoek and Rehoboth is generally indicated as having low
potential for groundwater abstraction on the hydrogeological map. It has however
been proven by the Omeya development that there are possibilities for local extraction
of groundwater. However it should be emphasized that no investigations for
extraction in other areas between Windhoek and Rehoboth are included in this report.
Supply figures for Omeya are planned to be 350,000 m3/yr and demand figures for
Rehoboth are 1.2-1.5 Mm3/yr (Strauss, cited in Kullgren & Perdell, 2010). For
Windhoek the corresponding figure is 60,000 m3/day and about 21 Mm
3/yr (Theron,
2010), respectively. If other possible sources would yield in the range of the Omeya
supply, an addition of an example aquifer of 350,000 m3/yr would have an impact of
the yearly total supply for Rehoboth but to a far smaller extent for Windhoek. Thus a
number of such extraction points would have to be found to ensure that the supply is
great enough to contribute to the demand of Windhoek. However, if such extraction
points are found, this water could supply smaller developments without them being
located in the vicinity of the abstraction point.
Nauaspoort Dam is located approximately 50 km south of Windhoek and has supplied
the Oamities mine but now supplies a military camp at the same site (Du Plessis, P.
2010). The dam is small but further investigations of connecting the dam to a possible
pipeline between Rehoboth and Windhoek should be performed in order to increase
the possibilities for further extraction.
CHALMERS, Civil and Environmental Engineering, Master’s Thesis 2010:48 69
A risk of adding further extraction points is that this additional water is exposed to a
risk of being polluted and thus polluting the drinking water for many people if the
dilution in the pipe is not great enough. One way of decreasing this risk is to perform
a risk assessment for the extraction point concerned and as a part of this report, to
state as an example, such risk assessment has been conducted for the Omeya golf and
residential oasis situated south of Windhoek. The results of this can be found in
Chapter 8.
Other risks are that further outlets increase the number of valves, pipe parts, pumps
and other infrastructure such as electricity grids and access roads, which might impact
the system as a whole in case of failure. Floods, sabotage, material failure of the pipe,
impact on the pipe and so forth are also threats to the supply.
9.3 Supply of new developments
In the area between Windhoek and Rehoboth a number of new developments are
taking place like Omeya and Crinium Lake. Omeya has got water supply from
recently drilled boreholes but in case of a water shortage a connection to a pipeline
between Windhoek and Rehoboth could increase the supply. Furthermore,
Gocheganas just south of Windhoek is cut for urban development. This could in the
future increase the water demand of an interconnected system. There are also already
existing settlements like Groot Aub that now depend on groundwater and use pit
latrines for sewage disposal (Bochmühl, 2010).
One risk of the ability to supply further people with water can be the risk of water
shortage due to an increased total demand. Secondly there are risks to the system as a
whole when adding more parts that potentially might fail and cause water hammers
and other related issues as mentioned above.
9.4 Emergency supply for Windhoek and Rehoboth
Construction of a pipeline between the two urban centres could also function as a
backup system if water shortage would occur at one location. This by building either
two pipelines or are two-way pipeline. However, the safe yield of the Oanob dam is
about 4-6 Mm3/yr (Du Plessis, N.P., 2010) and the present demand is 1.2-1.5 Mm
3/yr
(Strauss, cited in Kullgren & Perdell, 2010) but is estimated to reach 4.7 Mm3/yr in
2023/24 (Namib Hydrosearch, 2009c). There have been investigations for artificial
recharge for the Rehoboth aquifer. This water would be taken from the Oanob dam
(SWECO, 2002).
The demand in Windhoek is about 21 Mm3/yr (Theron, 2010). The reclamation plant
is built for 21,000 m3/day (7.7 Mm
3/yr), though now producing 16,000 m
3/day. It is
however estimated that full capacity will be reached at the end of 2010 (Eterhuisen,
2010). The municipality of Windhoek also derives water from boreholes and performs
artificial recharge, which is around 4-5 Mm3/yr (Theron, 2010).
The third source supplying Windhoek with water is the von Bach dam system yielding
20 Mm3/yr (Du Plessis, N.P. 2010). According to Mr Peters (2010) the Municipality
of Windhoek plan to rely on boreholes and artificial recharge along with the
reclamation plant in the future, leaving the supply from the von Bach dam available
for other use. There are numerous risks on using a pipeline between Windhoek and

CHALMERS, Civil and Environmental Engineering, Master’s Thesis 2010:48 70
Rehoboth and these are further investigated in Chapter 7 where an extensive risk
assessment has been performed.
CHALMERS, Civil and Environmental Engineering, Master’s Thesis 2010:48 71
10 Discussion
This chapter is mainly divided into two parts, the first concerning the evaluation of
the methodological implementation of the operational method of this study. The
methodology and included sub-methodologies applied are reviewed step by step and
the application of the method as well as the outcomes is reviewed. The second part is
a discussion on the project as a pre-study for further investigations.
10.1 Evaluation of the methodological implementation
The overall method applied in this project is a risk analysis based on an international
standard (IEC, 1995), which is extended to a risk assessment by including the risk
evaluation steps risk tolerability decisions and analysis of options. To identify hazards
and estimate risk the FMECA and the HHM methods were applied on the pipeline and
for a smaller case study on vulnerability to pollution, a risk assessment method from
the report of Groundwater vulnerability for the Windhoek aquifer (IN & SCC, 2000)
was applied.
10.1.1 Choice of method and level of analysis
Which method to use differs from project to project. The method most suitable for the
specific problem should be used in order to perform an as effective and accurate risk
assessment as possible. The FMECA was not the original choice, rather a number of
methods were discarded before finding the method appearing to be the most suitable
for this specific project.
The case study methodology was earlier used in a similar study in an area close to the
Omeya golf and residential oasis and was therefore considered a reliable method.
Physical parameters were similar as well as the problem formulation.
10.1.2 Scope definition
The scope definition must be defined in order to produce a risk analysis plan and
should include certain steps; the reasons and problems that originated the risk,
including formulation of the objectives of the study and defining the criteria for
success/failure, a definition of the system concerned, and an identification of sources
of details of relevant circumstances, e.g. technical, environmental and legal. Moreover
the assumptions and constraints governing the analysis should be presented and lastly
an identification of the decisions that have to be made, the decision-makers and the
required output from the study (IEC, 1995).
Setting goal and scope for this study was performed in cooperation with the Ministry
of Agriculture, Water and Forestry of Namibia, and specifies in detail what this study
should bring forth. These goals were achieved by applying methods such as the
FMECA and the method for assessing risks to groundwater pollution. Performing this
step of the risk assessment did not generate any problems. Being clear and presenting
specific objectives provided good guidance throughout the project.

CHALMERS, Civil and Environmental Engineering, Master’s Thesis 2010:48 72
10.1.3 Hazard identification and initial consequence evaluation
Hazards should be identified together with how they can be realized. Formal methods
covering the specific situation should be used when identifying hazards not previously
known. A study of the significance of the identified hazards should be conducted
based on a consequence analysis (IEC, 1995).
To identify hazards an FMECA and an HHM method was applied. The FMECA
provides a structured process of identifying and present the identified hazards while
the HMM visualises the system to facilitate hazard identification. Further, to find
hazards a questionnaire was sent out and also interviews were done with people with
deeper knowledge of the water supply in Namibia. The questionnaire did not receive a
high frequency of answers why the results might not be very extensive, though the
group was heterogeneous concerning age and education, which might increase the
reliability of the study. Workshops or similar gatherings where information on the
project is given could by discussions give more reinforced information to base the risk
assessment upon.
One specific hazard, the risk of polluted water into the system because of additional
extraction points connected to the system, was investigated by a separate method
developed in the report Groundwater vulnerability of the Windhoek aquifer (IN &
SCC, 2000).
10.1.4 Risk estimation
The purpose of the risk estimation is to investigate the events of concern, mitigating
features and nature and frequency of possible hazardous events affecting the system.
Further an uncertainty analysis concerning the estimates in the study should be
conducted (IEC, 1995).
There are qualitative and quantitative risk estimates where a qualitative assessment
expresses risk in words while a quantitative measure risk in numbers. Not always is
there sufficient information to perform a quantitative analysis, which is the most
common method in risk assessments. Instead a comparative quality or quantity
analysis can be performed, where experts are involved to estimate levels of risks (IEC,
1995).
As part of the risk estimation a frequency analysis should be carried out, which is
used to estimate the likelihood of a certain hazardous event. A consequence analysis
is further a part of estimating the probable impact of the hazardous event and is based
on the hazardous event selected and describes the consequences of these events. It
should consider both immediate and future consequences as well as secondary
consequences to related equipment and systems (IEC, 1995). This report describes a
semi-quantitative analysis and the values making a base for estimating risk are
opinions rather than facts and as stated in the guidelines they should not be considered
the single answer to the question of risk. For the case study of risk of groundwater
pollution for the Gross Haigamas area the probability values are estimates of expert
judgment and provide a relative vulnerability over the area rather than exact values of
vulnerability and risk.
In the FMECA of the pipeline values of risk for each hazard were calculated and
displayed in a table presenting the chain from hazardous event via effects on the
system to a final risk number. This gives a good overview of risks and allows the
CHALMERS, Civil and Environmental Engineering, Master’s Thesis 2010:48 73
decision maker to quickly go deeper into the consequences of a certain hazard. The
risk assessment for the Haigamas farm present possible sources of pollution in a list
and show the adjacent risk of contamination. This was not specifically described in
the report from where the method is derived, but rather developed to suit this specific
project.
Risks to a pipeline for transportation of water between Windhoek and Rehoboth are
compiled into a risk matrix where the values are placed in the calculated risk range
based on information from the FMECA table. This provides a simple foundation for
prioritisation of mitigation measures.
Risk of groundwater pollution in the Haigamas area is presented as maps indicating
more or less vulnerable areas. This displays where caution have to be taken in case of
planning new activities within the area. The maps are a tool for a first decision of
where to make more thorough investigations and it should be emphasized that
composition of the maps demand knowledge of GIS software.
Risk estimation implies that a number of uncertainties might appear and they should
be well examined. The sources of uncertainties should, to increase clearness, be
expressed in outputs of the risk model. Uncertainties can origin from both data and
model and also parameters sensitive for the analysis should be identified (IEC, 1995).
One important uncertainty when estimating risk is the data collection were expert
knowledge is required to derive values on probability, consequence and finally risk.
Identifying the right people, posing questions to get answers correlating to scope and
goal and reaching a large amount of these people has been a challenge. There has
been no specific uncertainty or sensitivity analysis performed in this project rather
than reasoning and discussion on specific risk estimates.
10.1.5 Verification
Verification of some kind should be carried out to confirm the integrity of the
analysis. A formal reviewing process can function as a verification of the study and if
field experience on the same issue is available, the verification can be conducted by a
comparison of the results. No verification was made in this project due to lack of
adequate data and that the results are relative to each other rather than to other studies.
10.1.6 Documentation
The risk analysis should be well documented and present the risk analysis process and
initial results. It is stated in the (IEC, 1995) standard that technical information is a
critical part of the documentation. This was done as far as possible since very little
technical information was decided on when this report was compiled. Risk estimates
and adjacent uncertainties should further be presented in understandable terms, and
strengths and weaknesses of measures used should be explained. The risks are
presented in tables and maps which gives an accessible view of the risks identified in
this study. Weaknesses of measures are further analyzed in this discussion chapter.
CHALMERS, Civil and Environmental Engineering, Master’s Thesis 2010:48 74
10.1.7 Analysis update
The analysis update is not included in this specific risk assessment. This step is
required if the risk analysis is a continuous process and since this report documents a
pre-study the analysis update was considered not relevant (IEC, 1995).
10.1.8 Risk evaluation
The risk evaluation consists of risk tolerability decisions and an analysis of options
and is a minor part of this study. Decisions on what is tolerable are indirectly done by
the risk ranking procedure placing hazards in the risk matrix. In the matrix, the
specific hazards are divided into groups of high, moderate and low risk based on the
estimated risk value. By this a kind of tolerability assessment is exercised to the group
of hazards posing a moderate and low risk to the system. These intervals can however
be adjusted to suit the specific study. No deeper analysis of options was made.
Mitigation measures were however suggested in the FMECA table and shortly
commented in the discussion of the study.
10.1.9 Concluding discussion of the application of the method
The general risk analysis method presented in the IEC standard (1995) is dynamic and
the inclusion of three further methods for indentifying hazards and estimating risk was
a flexible process. The number of additional methods to choose from is great and the
possibility of finding a suitable method is considerable.
Obstacles are thus the knowledge required to perform such risk analysis. The method
of identifying hazards by interviews and a questionnaire can be further developed.
Rather a meeting gathering key persons within the sector, well distributed in
knowledge, where these people can discuss hazards, consequences and probabilities
would give more information.
This was a pre-study and more thorough investigations are needed if a pipeline for
transport of water should be built between Windhoek and Rehoboth. The results from
this project can constitute a basis for determining focus areas for further
investigations.
10.2 Discussion concerning the project as a pre-study for
further investigations
One of the aims of this report was to constitute a pre-study for a possible expansion of
the Windhoek water supply and a number of advantages and limitations have been
identified. This is a general discussion of all advantages and limitations found.
10.2.1 Advantages
Several advantages concerning the construction of a pipeline for water transport
between Windhoek and Rehoboth has been identified; further extraction points,
supply of new developments and emergency supply for Windhoek and Rehoboth. The
suggested actions could all increase the economic viability of the project.

CHALMERS, Civil and Environmental Engineering, Master’s Thesis 2010:48 75
Nevertheless, the area between Windhoek and Rehoboth is indicated as yielding small
amounts of water on the hydrogeological map and chances of finding more sources
are minor. The aquifer of the Omeya golf and residential resort is high yielding and is
assumed to be sufficient for their needs. Several of such sources need to be found and
yield a sufficient amount of water to be economically interesting. The amount of
water Rehoboth can spare is also of importance for this alternative. If there is no water
to pump from Rehoboth the need of further supply is even greater.
The supply of further developments is a possibility if a pipeline should be built.
Several new developments will shortly be populated and are in need of water. The
possibility to transport water between Windhoek and Rehoboth could also serve as
emergency supply provider for the both urban centres. What needs to be further
investigated is during how long period of time the amount of water in Rehoboth is
enough for being transported to Windhoek. Rehoboth is a smaller community which
means that Windhoek is better prepared for supplying a smaller town during a short
period than the other way around.
There are additional risks to the water supply of Windhoek and the pipeline if these
actions are to be implemented. These will to the extent possible be found in an early
risk assessment and mitigated.
Actual costs were just briefly suggested for the very construction of the pipeline and
need to be further investigated if any alternative should be interesting. Groundwater
recourse value and actual costs of prospecting and extraction of the water as well as
additional infrastructure and pumping costs in relation to produced water need to be
taken into consideration.
10.2.2 Limitations
The FMECA performed on constructing a pipeline between Windhoek and Rehoboth
indicated a number of risks and several mitigation measures should be taken.
Accidental damage, flash floods and polluted water into the system are according to
this study the largest threats to the water supply of Windhoek if the pipeline is to be
built.
Actions to decrease the risk are to carefully select the material to be used and plan the
stretch of the pipeline. This will decrease the risk of accidental damage and a well
considered location of the pipeline can also reduce the risk for flash floods impacting
the pipeline. To reduce the risk of polluted water into the system from possible
extraction points, efficient water control systems could be installed. The water coming
from the water distribution systems in Windhoek and Rehoboth lies beyond the
system limitations of this project. No measures have therefore been proposed due to
the fact that the revelant measures need to be adressed before the water reaches the
intake of the pipeline.
Also reduction of other risks than those unacceptable is needed. A number of
hazardous events can be found in the yellow category and can be realised if no
measures are taken.
If additional sources of water are found along the pipeline a number of risks to the
water supply might occur. The risk of pollution into the pipeline will increase and a
risk assessment to groundwater pollution should be performed.
CHALMERS, Civil and Environmental Engineering, Master’s Thesis 2010:48 76
10.2.3 Concluding discussion of constructing a pipeline for
expanding the Windhoek water supply
The overall aim of this project was to provide a structured operational method for risk
assessments concerning projects for expansion of water supply. The aim was also to
provide a pre-study for a pipeline between Windhoek and Rehoboth.
Advantages were first identified followed by a hazard identification based on the
FMECA methodology and a specific area was also investigated regarding risk of
groundwater pollution. The FMECA resulted in a risk matrix presenting the risks most
urgent to prevent and unacceptable in red and the risk less severe in yellow and green.
The risk analysis for the Omeya golf and residential oasis was presented as maps.
Several activities to improve the economic viablity of the project were presented. Also
a number of hazards and threats to the system were identified. However, many factors
concerning what risks are threatening the system are not yet decided on, such as
material, stretch, and if the pipeline is built over or beneath the ground. Therefore, if
the pipeline is built, some risks will be more relevant than others.
Deeper economic investigations are required to analyse whether this project is
feasible. What is the value of drinking water? What is the value of a secured supply?
Would this connection provide enough water to be considered a safe back-up system?
Several questions need to be answered to decide whether this project is econmically
viable.
As already mentioned there has been no specific uncertainty or sensitivity analysis
performed. There has been reasoning and discussion of values estimating
vulnerability, toxicity, release quantity etc for the vulnerablility analysis as well as
values estimating probability and consequence in the FMECA. None of theese values
can be considered as an absolute fact but rather as well informed estimates which
might of course not be fully accurate. Education of people involved, number of people
involved and so forth all makes a difference in results.
If further investigations are made a sensitivity analysis should be performed in order
to analyse the stability of the assessment. How the output is affected should be tested
in relation to a change of input parameters. If the project is realized, more thorough
investigations should be done. This pre-study may constitute the basis for discussion
and decisions on further action.
CHALMERS, Civil and Environmental Engineering, Master’s Thesis 2010:48 77
11 Conclusions
The conclusions concerning the project as a pre-study but also the methodological
implementations of the project are presented below.
The operational risk analysis method applied to perform this pre-study has
provided dynamic guidelines and could in a flexible manner be combined
with other methods to identify hazards to the system and for the case
study, vulnerability to groundwater pollution.
Advantages of connecting the water distribution system of Windhoek and
Rehoboth via a pipeline are that further extraction points can be found,
further developments can be supplied and the pipeline can provide an
emergency water supply both for Windhoek and Rehoboth.
The limitations i.e. vulnerabilities and hazards which are of highest
priority related to the possible pipeline are accidental damage, the risk of
flash floods and polluted water into the system.
Recommended mitigation measures for an expanded water supply via a
pipeline are careful planning of the pipeline stretch and a well engineered
material and construction. Polluted water into the system from the pipeline
ends was not further discussed since the measures relevant need to be
addressed outside the defined system boundaries.
The investigation of risk to groundwater pollution at the Omeya golf and
residential oasis generated a number of possible sources of pollution.
These sources are related to the vulnerability of the ground where the
source are located and a final risk value for that specific location is
calculated as seen in Figure 8.10.
The area of Gross Haigamas is vulnerable in general and no highly
contaminant activities should take place.
Hopefully, this report can serve as a pre-study for a possible expansion of
the Windhoek water supply and as a basis for further detailed studies. The
report provides insights into the project that should be valuable as a basis
for further investigations and for designing a safe and reliable future
connection of the water supply of Windhoek and Rehoboth.
CHALMERS, Civil and Environmental Engineering, Master’s Thesis 2010:48 78
References
Bochmühl, F. (2010). Meeting on hydrogeology of the Haigamas Farm. Haigamas,
Namibia. Personal communication 2010-03-02 and 2010-03-26.
Burgman, M. (2005). Risks and Decisions for Conservation and Environmental
Management. Cambridge, United Kingdom: Cambridge University Press.
CES (Consulting Engineers Salzgitter, Germany, Lund Consulting Engineers,
Windhoek, Namibia & Windhoek Consulting Engineers) (1993). Central Area
Water Master Plan: Phase 1. Volume 1. Summary Report. (Report number:
DIR/1/93/1) Windhoek, Namibia. Ministry of Agriculture, Water and Rural
Development. Department of Water Affairs.
City of Windhoek (2010). City Life. (Electronic source) Windhoek, Namibia.
Available at: <http://www.windhoekcc.org.na/default.aspx?page=31> (2010-03-
27).
DEA (Directorate of Environmental Affairs) (2002). The Atlas of Namibia.
(Electronic source) Windhoek, Namibia. Available at: <http://www.uni-
koeln.de/sfb389/e/e1/download/atlas_namibia/index_e.htm> Ministry of
Environment and Tourism (2010-03-12).
Drews, H. (2010). Planning & Water Resources at NamWater. Windhoek, Namibia.
Personal communication 2010-03-31.
DWA (The Department of Water Affairs) (1991). The Oanob Dam state water
scheme. (Electronic source) Windhoek, Namibia. Available at:
<www.namwater.com.na/data/The%20Oanob%20Dam.pdf> (2010-03-15).
Christelis, G. (2010). Information concerning: The water supply system in Windhoek,
the legislation concerning water in Namibia and Namibia as a country. Windhoek,
Namibia. Personal communication between 2010-02-23 and 2010-04-09.
Du Plessis, P. (2010). Visit at the Haigamas farm. Haigamas, Namibia. Personal
communication 2010-03-18.
Du Plessis, N.P. (2010). Meeting at NamWater on water supply of Windhoek.
Windhoek, Namibia. Personal communication 2010-03-05.
EDEMC (Enviro Dynamics Environmental Management Consultants) (2009).
Proposed golf and residential estate and ancillary facilities on portion 20 of the
farm Gross Haigamas no. 447. Draft Environmental Impact Assessment.
Windhoek, Namibia.
Eterhuisen, J. (2010). Tour of the Goreangab reclamation plant. Windhoek, Namibia.
Personal communication 2010-03-11.
FAO (FAO Water) (2010). Water Scarcity. (Electronic source) Available at:
<http://www.fao.org/nr/water/issues/scarcity.html> (2010-03-10).
Google maps (2010). Map of Namibia. (Electronic source) Available at:
<http://maps.google.com.na/?utm_campaign=en&utm_medium=ha&utm_source=e
n-ha-emea-na-sk
gm&utm_term=google%20maps&gclid=CPK3vuDYsqACFYoU4wod2DLITw>
(2010-03-12).

CHALMERS, Civil and Environmental Engineering, Master’s Thesis 2010:48 79
Government of Namibia (2010). About Namibia. (Electronic source) Windhoek,
Namibia. Available at: <http://www.grnnet.gov.na/aboutnam.html> (2010-04-08).
GSN (Geological Survey of Namibia) (2006). Summary of Namibia´s geology.
(Electronic source) Windhoek, Namibia. Available at:
<http://www.mme.gov.na/gsn/namibiageology.htm> (2010-03-02).
Harris, M. (2010). Meeting at NamWater. Windhoek, Namibia. Personal
communication 2010-04-01.
Hasheela, I.M. (2010). Informative discussion during a meeting at the Ministry of
mines. Windhoek, Namibia. Personal communication 2010-03-09.
Heyns, P., Montgomery, S., Pallett, J., Seely, M. (1998). Namibia´s Water, A Decision
Maker´s Guide. Windhoek, Namibia. The Desert Research Foundation of Namibia
and the Department of Water Affairs.
IN&SCC (Interconsult Namibia (Pty) Ltd & Scandiaconsult International AB) (2000).
Groundwater vulnerability of the Windhoek aquifer, a planning tool for Windhoek
Municipality, Namibia. Windhoek, Namibia. Windhoek: City of Windhoek.
IEC (International Electrotechnical Commission) (1995). Dependability Management
– Part 3: Application guide – Section 9: Risk Analysis of Technological Systems.
Genève, Suisse. International Electrotechnical Commission. (International
Standard IEC 300-3-9).
Kullgren, E., Perdell, J. (2010). Vulnerability and Risk Assessment of Artificial
Recharge of the Oanob Aquifer. Master´s Thesis. Department of Civil and
Environmental Engineering, Chalmers University of Technology, Gothenburg,
Sweden.
LCE (Lund Consulting Engineers CC) (2008). Report on the principles and
methodology to calculate costs and tariffs for water supply by NamWater.
Windhoek, Namibia. Lund Consulting Engineers CC monitored by the NamWater
Tariffs Committee for the Ministry of Agriculture, Water and Forestry.
MAWF (Ministry of Agriculture, Water and Forestry) (2010). The Ministry of
Agriculture, Water and Forestry. (Electronic source) Windhoek, Namibia.
Available at: <http://www.op.gov.na/Decade_peace/agri.htm> (2010-03-10).
MAWRD (Ministry of Agriculture, Water and Rural Development) (2000). Strategic
water resources assessment: Theme report. Windhoek, Namibia. Water resources
management review: Namibia.
Menge, J. G., du Pisani, P. L., König, E., Theron-Beukes, T. (2009). Drinking Water
Safety in Windhoek, Namibia: routine monitoring, trace organics, pathogenic
indicators and salinity – comparing different water sources. London, Great Britain.
TECHNEAU. London: IWA Publishing.
Namib Hydrosearch (2009a). Hydrogeological impact assessment, Omeya golf and
residential Oasis. Specialist report. Windhoek, Namibia. Namib Hydrosearch.
Namib Hydrosearch (2009b). Report ,1 EIA Hydrogeological component AuasView
Haigamas. Windhoek, Namibia. Namib Hydrosearch.
Namib Hydrosearch (2009c). Hydrocensus, compilation & re-evaluation of available
data on the Oanob and Thermal Basement Aquifers. Windhoek, Namibia. Namib
Hydrosearch.

CHALMERS, Civil and Environmental Engineering, Master’s Thesis 2010:48 80
Namibian (2010). Namibian mountains, guide to the mountains of Namibia.
(Electronic source) Available at:
<http://www.namibian.org/travel/namibia/mountains.html> (2010-03-26).
NamWater (2006). Infrastructure of the dams. (Electronic source) Available at:
<http://www.namwater.com.na/data/dams/oanob.html> (2010-04-02).
NGWRP (New Goreangab Water Reclamation Plant) (2010). New Goreangab Water
Reclamation Plant, Windhoek (NAMIBIA). (Electronic source) Available at: <
http://www.norit.com/import/assetmanager/5/5565/02-
CASE_HISTORY_GoreangabB.pdf> (2010-03-15).
ORASECOM (2007). National water laws in Namibia. (Electronic source) Available
at:<http://www.orangesenqurak.org/governance/water+governance+orange+senqu
+basi/national+water+laws/namibia.aspx> (2010-03-03).
Peters, I. (2010). Tour of the Windhoek water supply system, Gammams wastewater
treatment plant, The Goreangab dam, Otjomuise wastewater treatment plant and
boreholes in the area. Windhoek, Namibia. Personal communication 2010-03-11.
Republikein (2010). Omeya golf and residential Oasis. (Electronic source) Available
at: <http://www.republikein.com.na/politiek-en-nasionale/gholflandgoed-vir-
windhoek.98708.php> (2010-03-12).
Republic of Namibia (2008). The Water Supply and Sanitation Policy. (Electronic
source) Windhoek, Namibia. Available at:
<http://www.mawf.gov.na/Documents/wsaspolicy.pdf> (2010-03-08).
Rosén, L., Hokstad, P., Lindhe, A., Sklet, S., Rostum, J. (2007). Generic Framework
and Methods for Integrated Risk Management in Water Safety Plans. Techneau,
European Commission under the Sixth Framework Programme, Sustainable
Development, Global Change and Ecosystems Thematic Priority Area.
Sarma, D. (2010). Visit at Namib Hydrosearch. Windhoek, Namibia. Personal
communication 2010-03-01.
SWECO (2002). Artificial recharge to aquifers in the central area of Namibia. A
study to determine the economic viability of artificial recharge. Stockholm,
Sweden. SWECO International AB for the Ministry of Agriculture and Water
Resources Development, Department of Water Affairs.
Tarr, J. (2002). Water pollution, a resource book for IGCSE in Namibia. Windhoek,
Namibia. The Ministry of Agriculture, Water and Rural Development.
The Economist (2010a). Opportunity costs. (Electronic source) Available at:
<http://www.economist.com/research/Economics/searchActionTerms.cfm?query=
opportunity+cost> (2010-03-05).
The Economist (2010b). Externalities. (Electronic source) Available at:
<http://www.economist.com/research/Economics/searchActionTerms.cfm?query=e
xternalities> (2010-03-12).
The Australian/New Zealand Standard (2004). Risk management. Sydney, Australia &
Wellington, New Zealand. Standards Australia International Ltd & Standards New
Zealand (International Standard AS/NZS 4360:2004).
Theron, K. (2010). Meeting at NamWater on water supply of the central area of
Namibia. Windhoek, Namibia. Personal communication 2010-03-08.

CHALMERS, Civil and Environmental Engineering, Master’s Thesis 2010:48 81
Tweedale, M. (2003). Managing risk and reliability of process plants, Appendix B.
United States of America. Elsevier Science.
UN (United Nations) (2009). The Millennium Development Goals Report 2009.
(Electronic source) New York, United Nations. Available at:
<http://www.un.org/millenniumgoals/pdf/MDG_Report_2009_ENG.pdf> Reports
(2010-03-05).
UOC (University of Columbia) (2010). Water Scarcity. (Electronic source) Available
at: <http://water.columbia.edu/?id=learn_more&navid=water_scarcity> (2010-02-
25).
UNDP (United Nations Development Programme) (2006). Human Development
Report 2006. (Electronic source) New York, United Nations. Available at: <
http://hdr.undp.org/en/media/HDR06-complete.pdf> Reports (2010-03-07).
UNEP (United Nations Environmental Programme) (2003). Groundwater and its
Susceptibility to Degradation. (Electronic source) Nairobi, Kenya. Available at: <
http://www.unep.org/dewa/water/groundwater/pdfs/Groundwater_INC_cover.pdf>
Reports (2010-03-09).
WHO (World Health Organization) (2008). Guidelines for Drinking- water Quality.
Third Edition, Incorporating the first and second addenda, volume 1,
recommendations. Genève, Suisse. WHO Library Cataloguing-in-Publication Data.
WHO (World Health Organization) (2010). Facts about water scarcity. (Electronic
source) Available at: <http://www.who.int/features/factfiles/water/en/> (2010-02-
25).
WWC (World Water Council) (2009). Water Crisis. (Electronic source) Available at:
<http://www.worldwatercouncil.org/index.php?id=25>(2010-02-25).

CHALMERS, Civil and Environmental Engineering, Master’s Thesis 2010:48 1
Appendix A
Questionnaire
This questionnaire aims to provide information for a risk assessment where one part is
to systematically evaluate the risks concerning connecting the water supplies of
Rehoboth and Windhoek by a pipeline. The second part is to identify hazards for
further possible groundwater extraction points in the area between the two cities.
The questionnaire is divided into three parts. The first part concerning the pipeline,
the second part concerning hazards to potential water extraction points and the third
part concerning costs.
1. The pipeline connection
The method to be used for assessing risks is a risk matrix. You are asked to identify
hazards, estimate the consequence and lastly the frequency of this hazard occurring.
The matrices will be a part of an FMECA (Failure mode and effect critically analysis),
which is a method for risk assessment.
Please note that hazards can be proposed both to the pipeline itself and/or the water
supply as a whole when the connection has been built.
Each hazard will be defined by the two values for probability and consequence and
the risk can be evaluated from the matrix seen below;
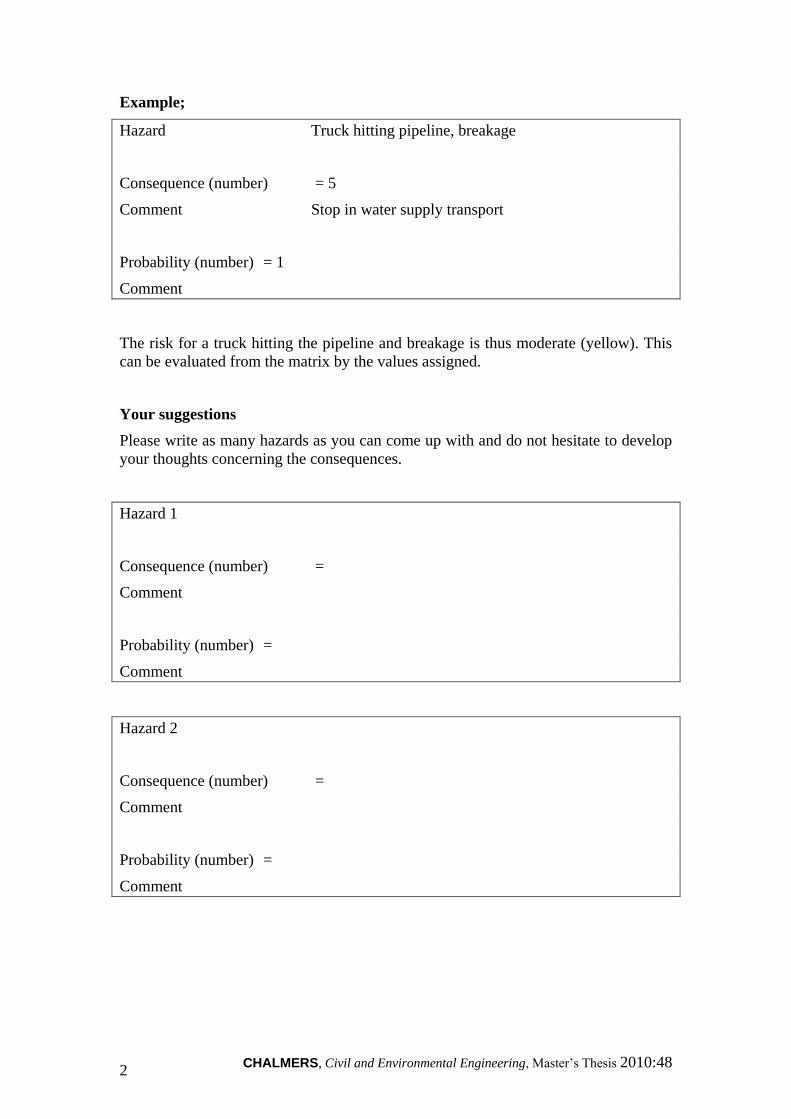
CHALMERS, Civil and Environmental Engineering, Master’s Thesis 2010:48 2
Example;
Hazard Truck hitting pipeline, breakage
Consequence (number) = 5
Comment Stop in water supply transport
Probability (number) = 1
Comment
The risk for a truck hitting the pipeline and breakage is thus moderate (yellow). This
can be evaluated from the matrix by the values assigned.
Your suggestions
Please write as many hazards as you can come up with and do not hesitate to develop
your thoughts concerning the consequences.
Hazard 1
Consequence (number) =
Comment
Probability (number) =
Comment
Hazard 2
Consequence (number) =
Comment
Probability (number) =
Comment
CHALMERS, Civil and Environmental Engineering, Master’s Thesis 2010:48 3
Hazard 3
Consequence (number) =
Comment
Probability (number) =
Comment
Hazard 4
Consequence (number) =
Comment
Probability (number) =
Comment
Hazard 5
Consequence (number) =
Comment
Probability (number) =
Comment

CHALMERS, Civil and Environmental Engineering, Master’s Thesis 2010:48 4
2. Hazards to possible water extraction points between Rehoboth and
Windhoek.
If a pipeline would be realized further possible extraction points could make the
project more cost efficient. The project includes a general discussion concerning these
possible threats why we ask you to repeat the procedure from above on this matter.
Hazard 1
Consequence (number) =
Comment
Probability (number) =
Comment
Hazard 2
Consequence (number) =
Comment
Probability (number) =
Comment
Hazard 3
Consequence (number) =
Comment
Probability (number) =
Comment

CHALMERS, Civil and Environmental Engineering, Master’s Thesis 2010:48 5
Hazard 4
Consequence (number) =
Comment
Probability (number) =
Comment
Hazard 5
Consequence (number) =
Comment
Probability (number) =
Comment
3. Cost
Do you think it would be cost efficient to build a pipeline for water emergency supply
as the water supply situation is today and in the future, why/why not?
Can you estimate the cost of building such a pipeline?

CHALMERS, Civil and Environmental Engineering, Master’s Thesis 2010:48 1
Appendix B