risk and return
TRANSCRIPT
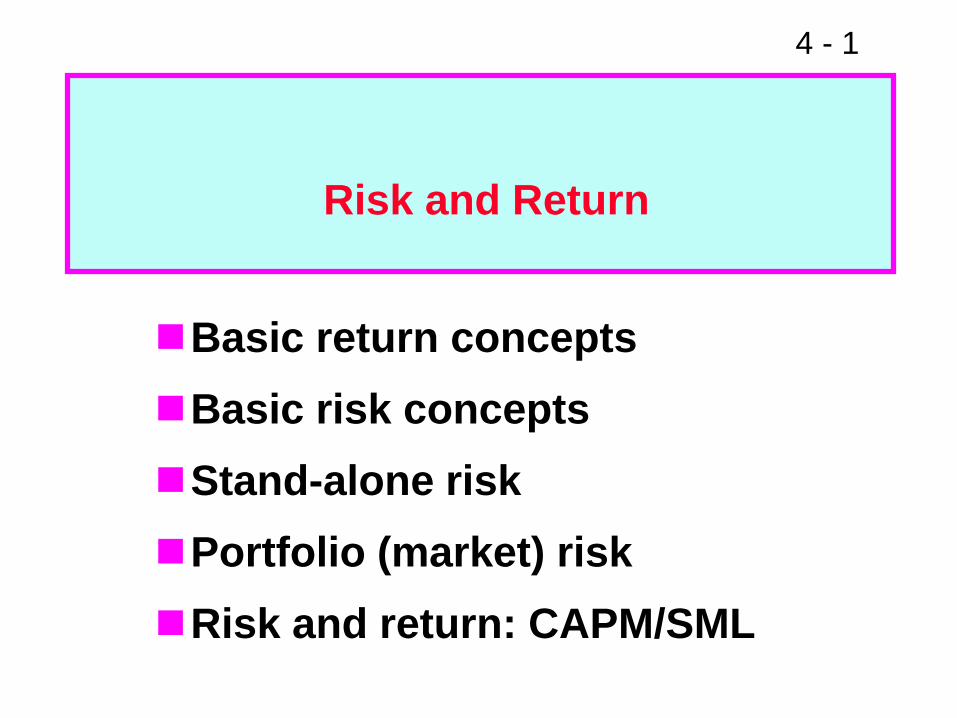
4 - 1
Risk and Return
Basic return concepts
Basic risk concepts
Stand-alone risk
Portfolio (market) risk
Risk and return: CAPM/SML
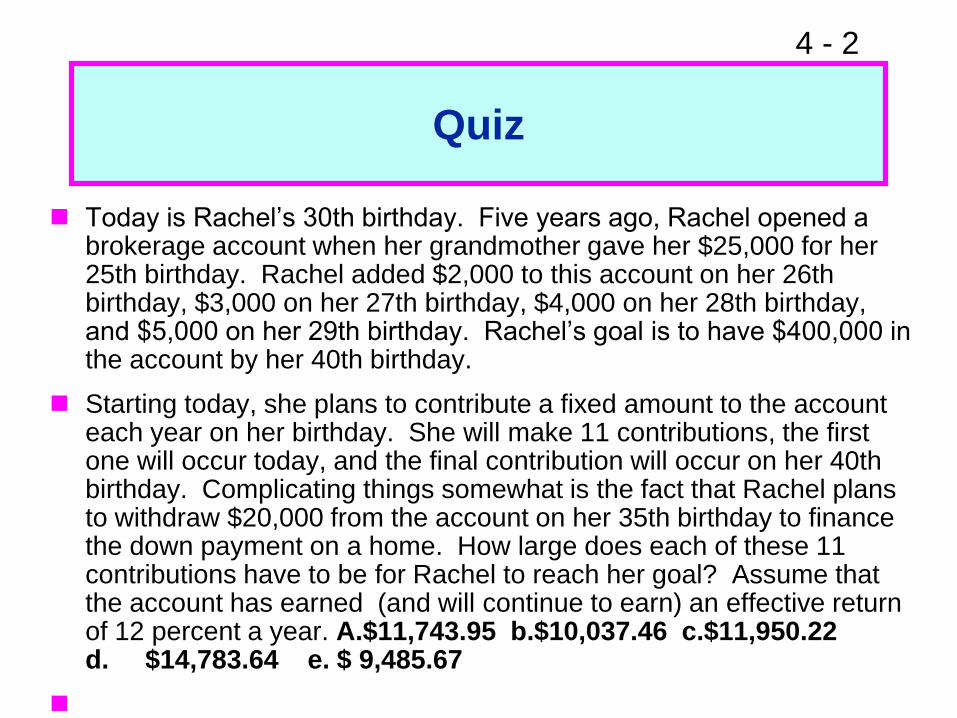
4 - 2
Quiz
Today is Rachel’s 30th birthday. Five years ago, Rachel opened a brokerage account when her grandmother gave her $25,000 for her 25th birthday. Rachel added $2,000 to this account on her 26th birthday, $3,000 on her 27th birthday, $4,000 on her 28th birthday, and $5,000 on her 29th birthday. Rachel’s goal is to have $400,000 in the account by her 40th birthday.
Starting today, she plans to contribute a fixed amount to the account each year on her birthday. She will make 11 contributions, the first one will occur today, and the final contribution will occur on her 40th birthday. Complicating things somewhat is the fact that Rachel plans to withdraw $20,000 from the account on her 35th birthday to finance the down payment on a home. How large does each of these 11 contributions have to be for Rachel to reach her goal? Assume that the account has earned (and will continue to earn) an effective return of 12 percent a year. A.$11,743.95 b.$10,037.46 c.$11,950.22 d. $14,783.64 e. $ 9,485.67

4 - 3
Quiz
You are saving for the college education of your two children. One child will enter college in 5 years, while the other child will enter college in 7 years. College costs are currently $10,000 per year and are expected to grow at a rate of 5 percent per year. All college costs are paid at the beginning of the year. You assume that each child will be in college for four years.
You currently have $50,000 in your educational fund. Your plan is to contribute a fixed amount to the fund over each of the next 5 years. Your first contribution will come at the end of this year, and your final contribution will come at the date at which you make the first tuition payment for your oldest child. You expect to invest your contributions into various investments which are expected to earn 8 percent per year. How much should you contribute each year in order to meet the expected cost of your children's education?
a. $2,894 b. $3,712
c. $4,125 d. $5,343
e. $6,750

4 - 4 A young couple is planning for the education of their two children.
They plan to invest the same amount of money at the end of each of the next 16 years, i.e., the first contribution will be made at the end of the year and the final contribution will be made at the time the oldest child enters college.
The money will be invested in securities that are certain to earn a return of 8 percent each year. The oldest child will begin college in 16 years and the second child will begin college in 18 years. The parents anticipate college costs of $25,000 a year (per child). These costs must be paid at the end of each year. If each child takes four years to complete their college degrees, then how much money must the couple save each year?
a. $ 9,612.10
b. $ 5,071.63
c. $12,507.29
d. $ 5,329.45
e. $ 4,944.84

4 - 5 Your client just turned 75 years old and plans on retiring in
10 years on her 85th birthday. She is saving money today for her retirement and is establishing a retirement account with your office. She would like to withdraw money from her retirement account on her birthday each year until she dies. She would ideally like to withdraw $50,000 on her 85th birthday, and increase her withdrawals 10 percent a year through her 89th birthday (i.e., she would like to withdraw $73,205 on her 89th birthday). She plans to die on her 90th birthday, at which time she would like to leave $200,000 to her descendants. Your client currently has $100,000. You estimate that the money in the retirement account will earn 8 percent a year over the next 15 years.
Your client plans to contribute an equal amount of money each year until her retirement. Her first contribution will come in 1 year; her 10th and final contribution will come in 10 years (on her 85th birthday). How much should she contribute each year to meet her objectives?
a. $12,401.59 b. $12,998.63
c. $13,243.18 d. $13,759.44 e. $14,021.53

4 - 6
What are investment returns?
Investment returns measure the financial results of an investment.
Returns may be historical or prospective (anticipated).
Returns can be expressed in:
Dollar terms.
Percentage terms.

4 - 7
What is the return on an investment
that costs $1,000 and is sold
after 1 year for $1,100?
Dollar return:
Percentage return:
$ Received - $ Invested
$1,100 - $1,000 = $100.
$ Return/$ Invested
$100/$1,000 = 0.10 = 10%.

4 - 8
What is investment risk?
Typically, investment returns are not known with certainty.
Investment risk pertains to the probability of earning a return less than that expected.
The greater the chance of a return far below the expected return, the greater the risk.
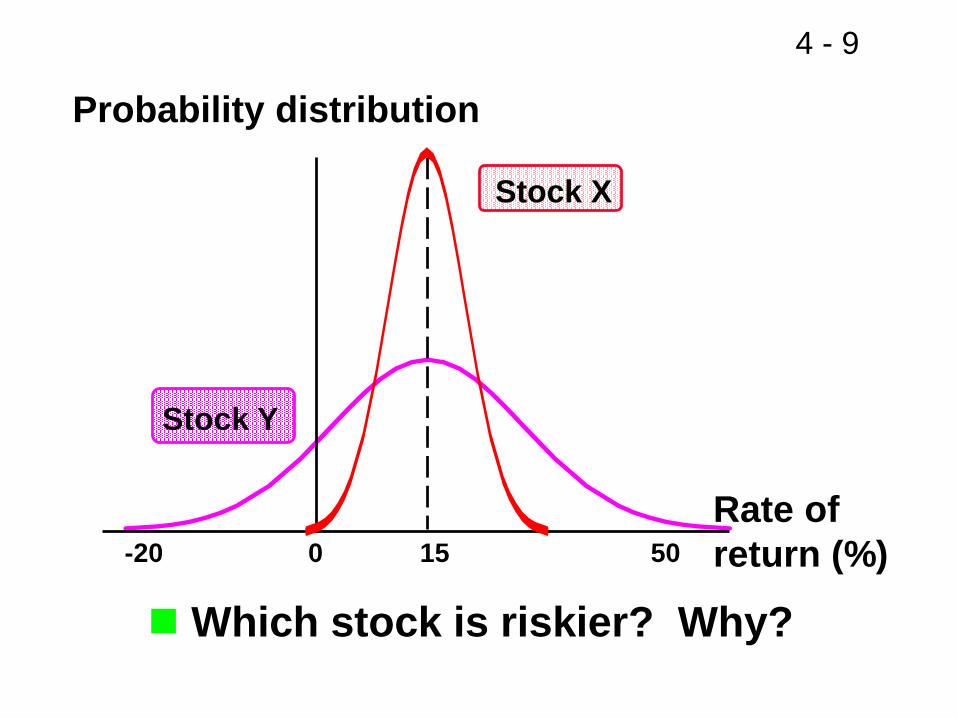
4 - 9
Probability distribution
Rate of
return (%)50150-20
Stock X
Stock Y
Which stock is riskier? Why?

4 - 10
Assume the Following
Investment Alternatives
Economy Prob. T-Bill Alta Repo Am F. MP
Recession 0.10 8.0% -22.0% 28.0% 10.0% -13.0%
Below avg. 0.20 8.0 -2.0 14.7 -10.0 1.0
Average 0.40 8.0 20.0 0.0 7.0 15.0
Above avg. 0.20 8.0 35.0 -10.0 45.0 29.0
Boom 0.10 8.0 50.0 -20.0 30.0 43.0
1.00

4 - 11
What is unique about
the T-bill return?
The T-bill will return 8% regardless of the state of the economy.
Is the T-bill riskless? Explain.

4 - 12
Do the returns of Alta Inds. and Repo
Men move with or counter to the
economy?
Alta Inds. moves with the economy, so it is positively correlated with the economy. This is the typical situation.
Repo Men moves counter to the economy. Such negative correlation is unusual.

4 - 13
Calculate the expected rate of return
on each alternative.
. n
1=i
iiPr = r
r = expected rate of return.
rAlta = 0.10(-22%) + 0.20(-2%)
+ 0.40(20%) + 0.20(35%)
+ 0.10(50%) = 17.4%.
^
^

4 - 14
Alta has the highest rate of return.
Does that make it best?
r
Alta 17.4%
Market 15.0
Am. Foam 13.8
T-bill 8.0
Repo Men 1.7
^

4 - 15
What is the standard deviation
of returns for each alternative?
.
Variance
deviation Standard
1
2
2
n
i
ii Prr
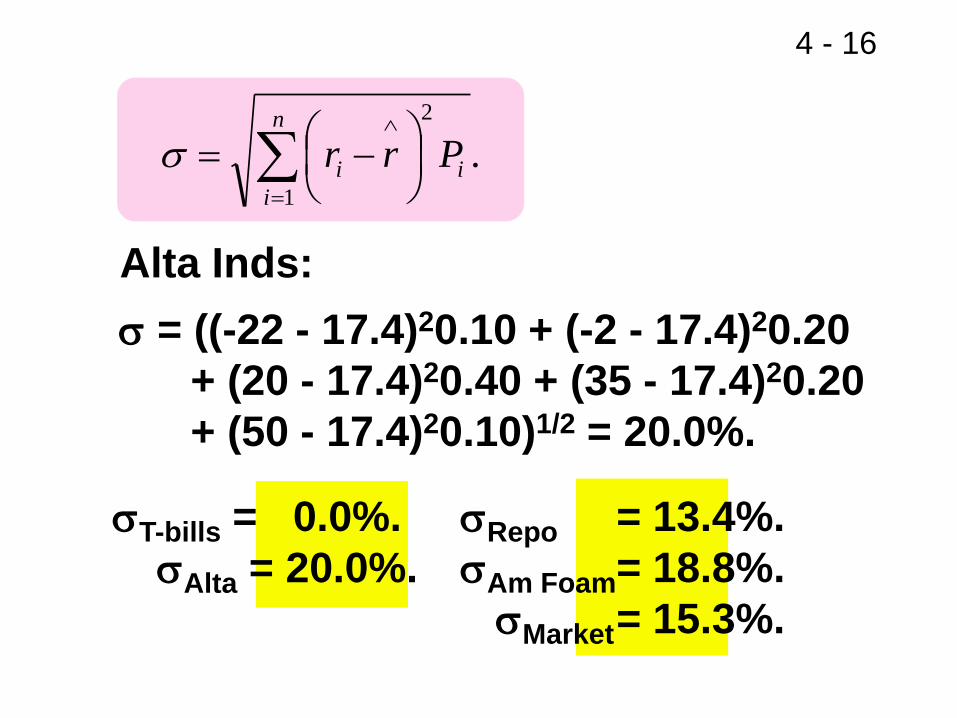
4 - 16
T-bills = 0.0%.
Alta = 20.0%.
Repo = 13.4%.
Am Foam= 18.8%.
Market= 15.3%.
.1
2
n
i
ii Prr
Alta Inds:
= ((-22 - 17.4)20.10 + (-2 - 17.4)20.20
+ (20 - 17.4)20.40 + (35 - 17.4)20.20
+ (50 - 17.4)20.10)1/2 = 20.0%.
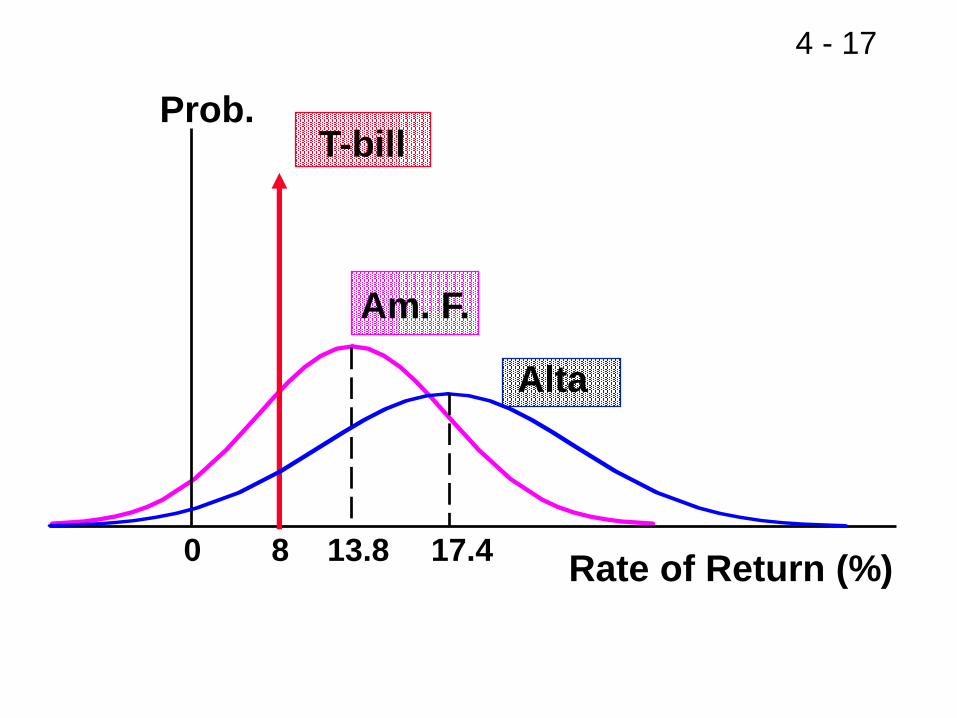
4 - 17
Prob.
Rate of Return (%)
T-bill
Am. F.
Alta
0 8 13.8 17.4

4 - 18
Standard deviation measures the stand-alone risk of an investment.
The larger the standard deviation, the higher the probability that returns will be far below the expected return.
Coefficient of variation is an alternative measure of stand-alone risk.

4 - 19
Expected Return versus Risk
Expected
Security return Risk,
Alta Inds. 17.4% 20.0%
Market 15.0 15.3
Am. Foam 13.8 18.8
T-bills 8.0 0.0
Repo Men 1.7 13.4

4 - 20
Coefficient of Variation:
CV = Standard deviation/expected return
CVT-BILLS = 0.0%/8.0% = 0.0.
CVAlta Inds = 20.0%/17.4% = 1.1.
CVRepo Men = 13.4%/1.7% = 7.9.
CVAm. Foam = 18.8%/13.8% = 1.4.
CVM = 15.3%/15.0% = 1.0.

4 - 21
Expected Return versus Coefficient of
Variation
Expected Risk: Risk:
Security return CV
Alta Inds 17.4% 20.0% 1.1
Market 15.0 15.3 1.0
Am. Foam 13.8 18.8 1.4
T-bills 8.0 0.0 0.0
Repo Men 1.7 13.4 7.9

4 - 22
T-bills
Repo
MktAm. Foam
Alta
0.0%
2.0%
4.0%
6.0%
8.0%
10.0%
12.0%
14.0%
16.0%
18.0%
20.0%
0.0% 5.0% 10.0% 15.0% 20.0% 25.0%
Risk (Std. Dev.)
Retu
rn
Return vs. Risk (Std. Dev.):
Which investment is best?

4 - 23
Portfolio Risk and Return
Assume a two-stock portfolio with
$50,000 in Alta Inds. and $50,000 in
Repo Men.
Calculate rp and p.^

4 - 24
Portfolio Return, rp
rp is a weighted average:
rp = 0.5(17.4%) + 0.5(1.7%) = 9.6%.
rp is between rAlta and rRepo.
^
^
^
^
^ ^
^ ^
rp = wirin
i = 1

4 - 25
Alternative Method
rp = (3.0%)0.10 + (6.4%)0.20 + (10.0%)0.40
+ (12.5%)0.20 + (15.0%)0.10 = 9.6%.
^
Estimated Return
(More...)
Economy Prob. Alta Repo Port.
Recession 0.10 -22.0% 28.0% 3.0%
Below avg. 0.20 -2.0 14.7 6.4
Average 0.40 20.0 0.0 10.0
Above avg. 0.20 35.0 -10.0 12.5
Boom 0.10 50.0 -20.0 15.0

4 - 26
p = ((3.0 - 9.6)20.10 + (6.4 - 9.6)20.20 +
(10.0 - 9.6)20.40 + (12.5 - 9.6)20.20
+ (15.0 - 9.6)20.10)1/2 = 3.3%.
p is much lower than:
either stock (20% and 13.4%).
average of Alta and Repo (16.7%).
The portfolio provides average return but much lower risk. The key here is negative correlation.

4 - 27
Two-Stock Portfolios
Two stocks can be combined to form a riskless portfolio if r = -1.0.
Risk is not reduced at all if the two stocks have r = +1.0.
In general, stocks have r 0.65, so risk is lowered but not eliminated.
Investors typically hold many stocks.
What happens when r = 0?

4 - 28
What would happen to therisk of an average 1-stock
portfolio as more randomlyselected stocks were added?
p would decrease because the added
stocks would not be perfectly correlated,
but rp would remain relatively constant.^

4 - 29
Large
0 15
Prob.
2
1
1 35% ; Large 20%.
Return

4 - 30
# Stocks in Portfolio
10 20 30 40 2,000+
Company Specific
(Diversifiable) Risk
Market Risk
20
0
Stand-Alone Risk, p
p (%)
35

4 - 31
Stand-alone Market Diversifiable
Market risk is that part of a security’s stand-alone risk that cannot be eliminated by diversification.
Firm-specific, or diversifiable, risk is that part of a security’s stand-alone risk that can be eliminated by diversification.
risk risk risk = + .

4 - 32
Conclusions
As more stocks are added, each new stock has a smaller risk-reducing impact on the portfolio.
p falls very slowly after about 40 stocks are included. The lower limit for p is about 20% = M .
By forming well-diversified portfolios, investors can eliminate about half the riskiness of owning a single stock.
4 - 33
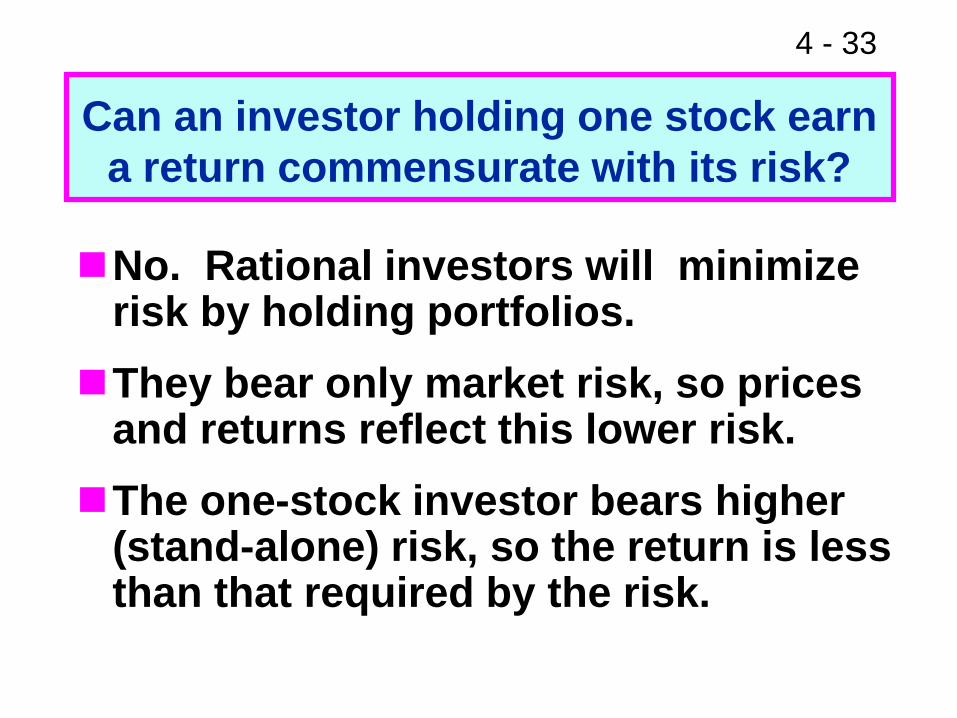
No. Rational investors will minimize risk by holding portfolios.
They bear only market risk, so prices and returns reflect this lower risk.
The one-stock investor bears higher (stand-alone) risk, so the return is less than that required by the risk.
Can an investor holding one stock earn
a return commensurate with its risk?

4 - 34
Market risk, which is relevant for stocks held in well-diversified portfolios, is defined as the contribution of a security to the overall riskiness of the portfolio.
It is measured by a stock’s beta coefficient. For stock i, its beta is:
bi = (riM i) / M
How is market risk measured for
individual securities?

4 - 35
How are betas calculated?
In addition to measuring a stock’s contribution of risk to a portfolio, beta also which measures the stock’s volatility relative to the market.

4 - 36
Using a Regression to Estimate Beta
Run a regression with returns on the stock in question plotted on the Y axis and returns on the market portfolio plotted on the X axis.
The slope of the regression line, which measures relative volatility, is defined as the stock’s beta coefficient, or b.

4 - 37
Use the historical stock returns to
calculate the beta for PQU.
Year Market PQU1 25.7% 40.0%2 8.0% -15.0%3 -11.0% -15.0%4 15.0% 35.0%5 32.5% 10.0%6 13.7% 30.0%7 40.0% 42.0%8 10.0% -10.0%9 -10.8% -25.0%
10 -13.1% 25.0%

4 - 38
Calculating Beta for PQU
r PQU = 0.83r M + 0.03
R2
= 0.36-40%
-20%
0%
20%
40%
-40% -20% 0% 20% 40%
r M
rKWE

4 - 39
What is beta for PQU?
The regression line, and hence beta, can be found using a calculator with a regression function or a spreadsheet program. In this example, b = 0.83.

4 - 40
Calculating Beta in Practice
Many analysts use the S&P 500 to find the market return.
Analysts typically use four or five years’ of monthly returns to establish the regression line.
Some analysts use 52 weeks of weekly returns.

4 - 41
If b = 1.0, stock has average risk.
If b > 1.0, stock is riskier than average.
If b < 1.0, stock is less risky than average.
Most stocks have betas in the range of 0.5 to 1.5.
Can a stock have a negative beta?
How is beta interpreted?

4 - 42
Finding Beta Estimates on the Web
Go to www.thomsonfn.com.
Enter the ticker symbol for a “Stock Quote”, such as IBM or Dell, then click GO.
When the quote comes up, select Company Earnings, then GO.

4 - 43
Expected Return versus Market Risk
Which of the alternatives is best?
Expected
Security return Risk, b
Alta 17.4% 1.29
Market 15.0 1.00
Am. Foam 13.8 0.68
T-bills 8.0 0.00
Repo Men 1.7 -0.86

4 - 44
Use the SML to calculate each
alternative’s required return.
The Security Market Line (SML) is part of the Capital Asset Pricing Model (CAPM).
SML: ri = rRF + (RPM)bi .
Assume rRF = 8%; rM = rM = 15%.
RPM = (rM - rRF) = 15% - 8% = 7%.
^

4 - 45
Required Rates of Return
rAlta = 8.0% + (7%)(1.29)
= 8.0% + 9.0% = 17.0%.
rM = 8.0% + (7%)(1.00) =
15.0%.
rAm. F. = 8.0% + (7%)(0.68) =
12.8%.
rT-bill = 8.0% + (7%)(0.00) = 8.0%.
rRepo = 8.0% + (7%)(-0.86) = 2.0%.

4 - 46
Expected versus Required Returns
r̂ r
Alta 17.4% 17.0% Undervalued
Market 15.0 15.0 Fairly valued
Am. F. 13.8 12.8 Undervalued
T-bills 8.0 8.0 Fairly valued
Repo 1.7 2.0 Overvalued
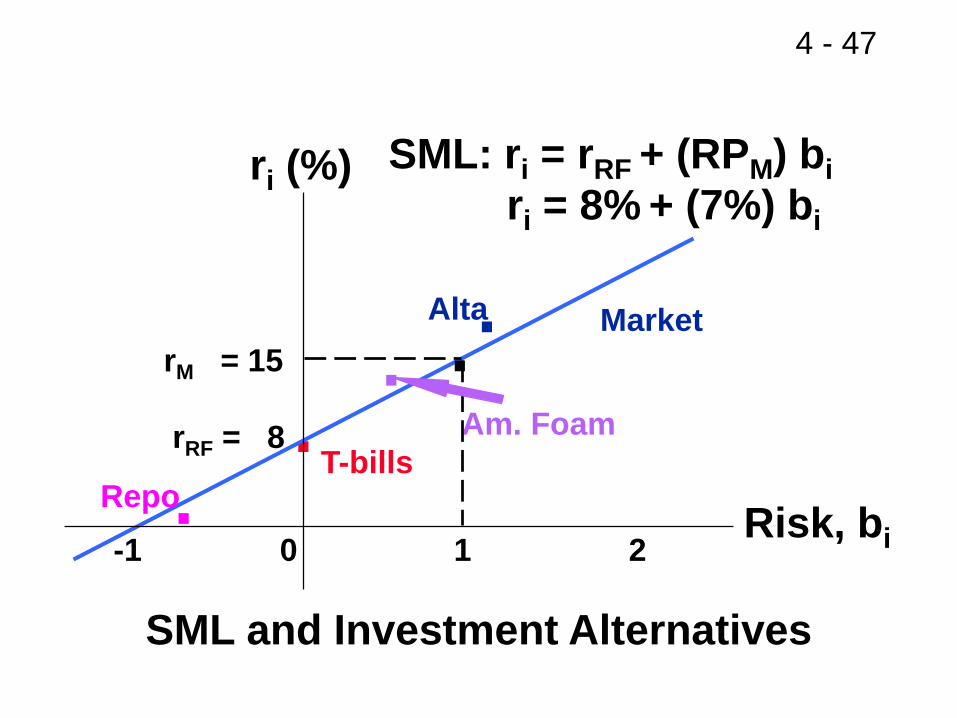
4 - 47
..Repo
.Alta
T-bills
.Am. Foam
rM = 15
rRF = 8
-1 0 1 2
.
SML: ri = rRF + (RPM) bi
ri = 8% + (7%) bi
ri (%)
Risk, bi
SML and Investment Alternatives
Market
4 - 48
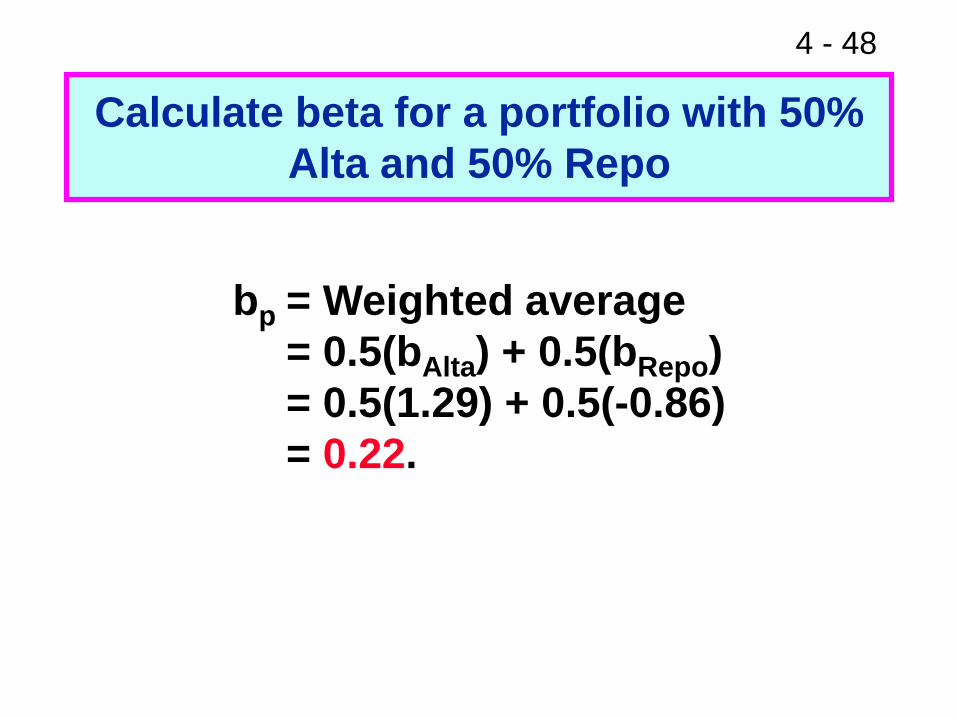
Calculate beta for a portfolio with 50%
Alta and 50% Repo
bp = Weighted average
= 0.5(bAlta) + 0.5(bRepo)
= 0.5(1.29) + 0.5(-0.86)
= 0.22.

4 - 49
What is the required rate of return
on the Alta/Repo portfolio?
rp = Weighted average r
= 0.5(17%) + 0.5(2%) = 9.5%.
Or use SML:
rp = rRF + (RPM) bp
= 8.0% + 7%(0.22) = 9.5%.

4 - 50
SML1
Original situation
Required Rate
of Return r (%)
SML2
0 0.5 1.0 1.5 2.0
18
15
11
8
New SML
I = 3%
Impact of Inflation Change on SML

4 - 51
rM = 18%
rM = 15%
SML1
Original situation
Required Rate of Return (%)
SML2
After increasein risk aversion
Risk, bi
18
15
8
1.0
RPM =
3%
Impact of Risk Aversion Change

4 - 52
Has the CAPM been completely confirmed
or refuted through empirical tests?
No. The statistical tests have problems that make empirical verification or rejection virtually impossible.
Investors’ required returns are based on future risk, but betas are calculated with historical data.
Investors may be concerned about both stand-alone and market risk.

4 - 53
Portfolio Theory
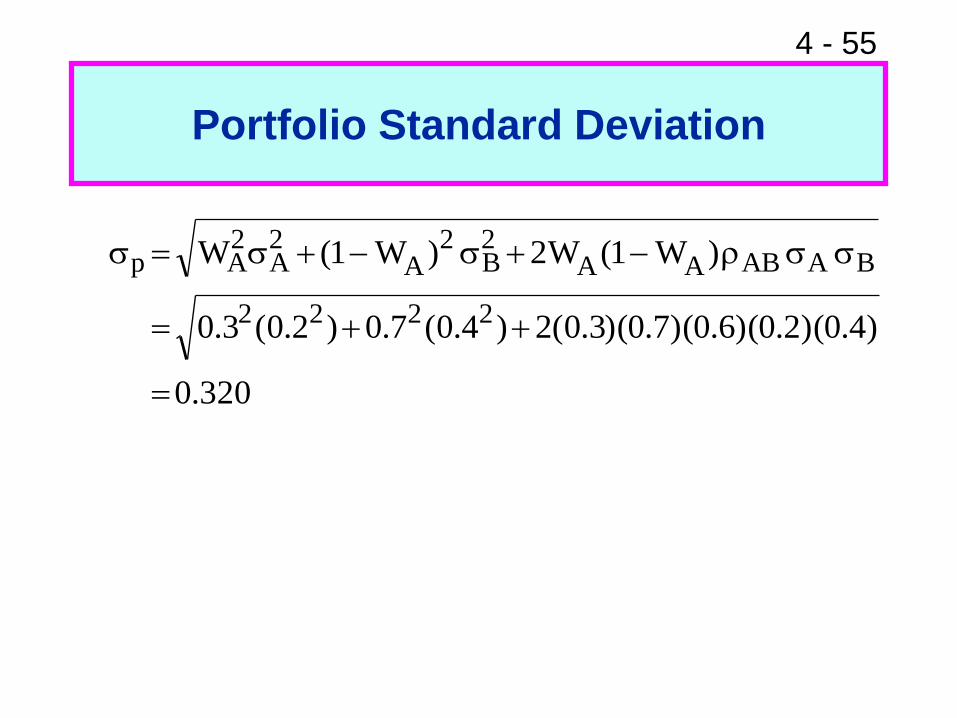
Suppose Asset A has an expected return of 10 percent and a standard deviation of 20 percent. Asset B has an expected return of 16 percent and a standard deviation of 40 percent. If the correlation between A and B is 0.6, what are the expected return and standard deviation for a portfolio comprised of 30 percent Asset A and 70 percent Asset B?

4 - 54
Portfolio Expected Return
%.2.14142.0
)16.0(7.0)1.0(3.0
r̂)w1(r̂wr̂ BAAAP
4 - 55
Portfolio Standard Deviation
320.0
)4.0)(2.0)(6.0)(7.0)(3.0(2)4.0(7.0)2.0(3.0
)W1(W2)W1(W
2222
BAABAA2B
2A
2A
2Ap
r