risk and economic feasibility of countermeasures for rainfall … · risk and economic feasibility...
TRANSCRIPT

Risk and Economic Feasibility of Countermeasures for
Rainfall-Induced Disasters
in El Salvador
- Development of simplified tool for disaster risk
management -
Mikihiro MORI1*
, Isao TANABE2, Emilio M. VENTURA
3,
Claribel A. TEJADA4, Aleyda M. MONTOYA
5, Sonia C. CALDERÓN
6, Dera I. CORTES
7,
Alonso A. ALFARO8, William R. GUZMÁN
9, Juan C. GARCÍA
10, Deyman V. PASTORA
11,
Jonathan J. ALVARADO12
, Héctor E. GONZÁLEZ13
, Jaime A. RODRÍGUEZ14
,
Daniel E. Zúniga15
, Delmy V. Aguilar16
1-2 Overseas Consulting Administration, Nippon Koei Co., Ltd. Japan (5-4 Kojimachi Chiyoda-ku, Tokyo 1028539,
Japan)
3-16 Department of Climate Change Adaptation and Strategic Risk Management (DACGER, abbreviation in Spanish),
Ministry of Public Works, Transportation, Housing and Urban Development (MOPTVDU, abbreviation in Spanish), El
Salvador (Plantel La Lechuza, Carretera a Santa Tecla Km. 5 1/2, San Salvador, Republic of El Salvador)
*Corresponding author. E-mail: [email protected]
The simplified sequence spreadsheet assessment tools for hazard vulnerability, disaster risk, and economic
feasibility of disaster mitigation project for rainfall-induced disasters for bridge, slope, and river/storm water
drainage basins have been developed by the Technical Assistance Project of the Japan International
Cooperation Agency (JICA) in El Salvador. The method was formulated based on the theory of risk curves,
which are derived from the plots of exceedance probability per year of disaster occurrence on the vertical
axis and potential economic loss of disaster event on the horizontal axis. The authors adapted the theory because it can enables the estimate of potential annual loss for sites/areas through the integral computation
of the area between the risk curve and the axis to help prioritize disaster mitigation sites/areas. Furthermore,
annual benefit achieved through the countermeasures can be estimated by determining the difference of
potential annual loss with and without countermeasures. In the hazard vulnerability assessment, the authors
selected inductive statistical approaches because deductive methods such as hydrological simulation, etc.,
are too laborious for the preliminary assessment. The advantage of the authors' procedure is the adoption of
the return period rating for hazard vulnerability assessment, which can be easily applied to the risk estimate
tool. Whereas the customary practice of dimensionless rating requires a complicated process to determine
the exceedance probability per year. The authors are aware of the limitations of this procedure, as the
accuracy of the assessment is dependent on the quality of data entered for disaster events and rainfall, which
need further improvement.
Key words: risk assessment, risk estimation, potential annual loss, rainfall-induced disasters, risk curve
1. INTRODUCTION
The simplified sequence spreadsheet assessment
tools for hazard vulnerability, disaster risk, and
economic feasibility of risk mitigation projects for
rainfall-induced disasters for bridge, slope and
river/storm water drainage basins have been
developed by the Technical Assistance Project of the
Japan International Cooperation Agency (JICA) in
El Salvador. The project was named GENSAI,
meaning “disaster mitigation” in Japanese.
709

2. DISCUSSION ON RAINFALL INDEX
TO ASSESS OF POTENTIAL DISASTER
The authors recognized that each bridge, slope,
and flood-risk site has a different rainfall index
relating to disaster occurrence, calculated by a
formula or numerical model.
A two-day rainfall amount was observed for the
macroscopic analysis relation between the return
period of rainfall index and disaster occurrence
based on the following conditions and reasons:
a) A more precise time period of rainfall amount
other than daily rainfall amount over the past 10
years are not available for a statistically
significant return period analysis.
b) Single value rainfall indexes (not combined
rainfall indexes) which enable the return period
analysis, are required for the assessment of the
probability of disaster occurrence.
c) One-day rainfall is the result of the subdivision
of continuous rainfall amount which extends
into the following day, and such underestimation
should be avoided.
d) As an overview, most disasters likely to be
caused by intense rainfall in a day.
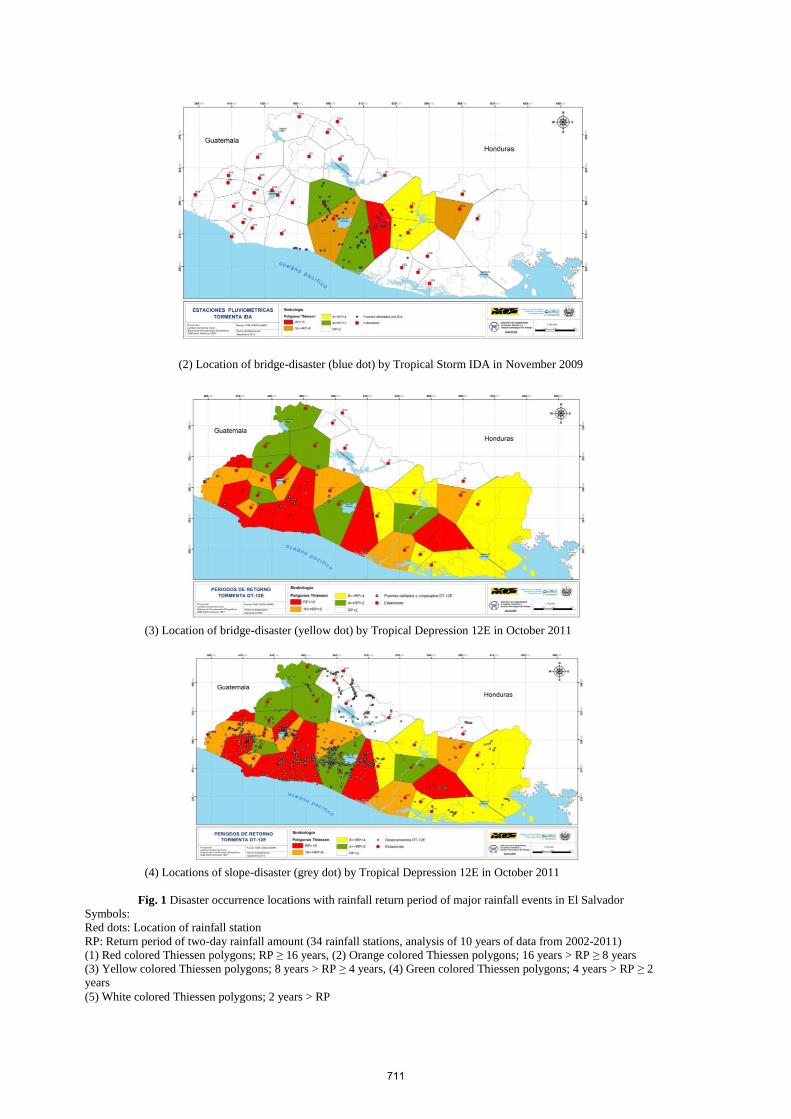
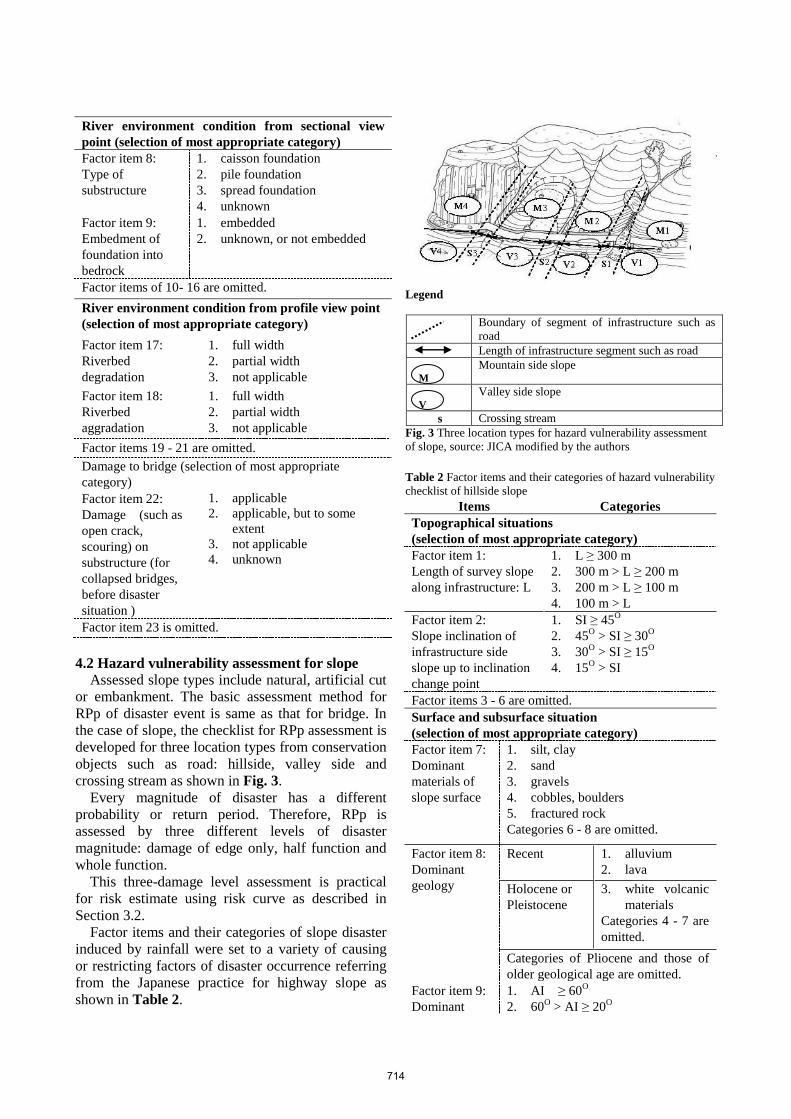
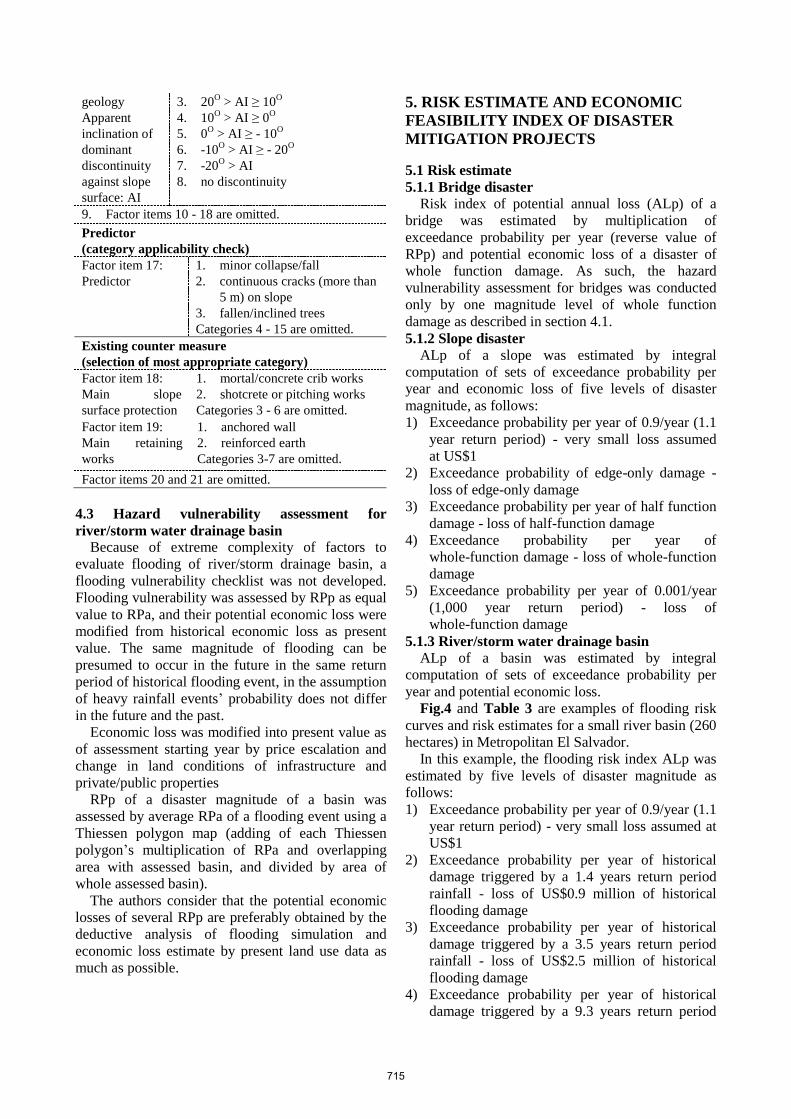
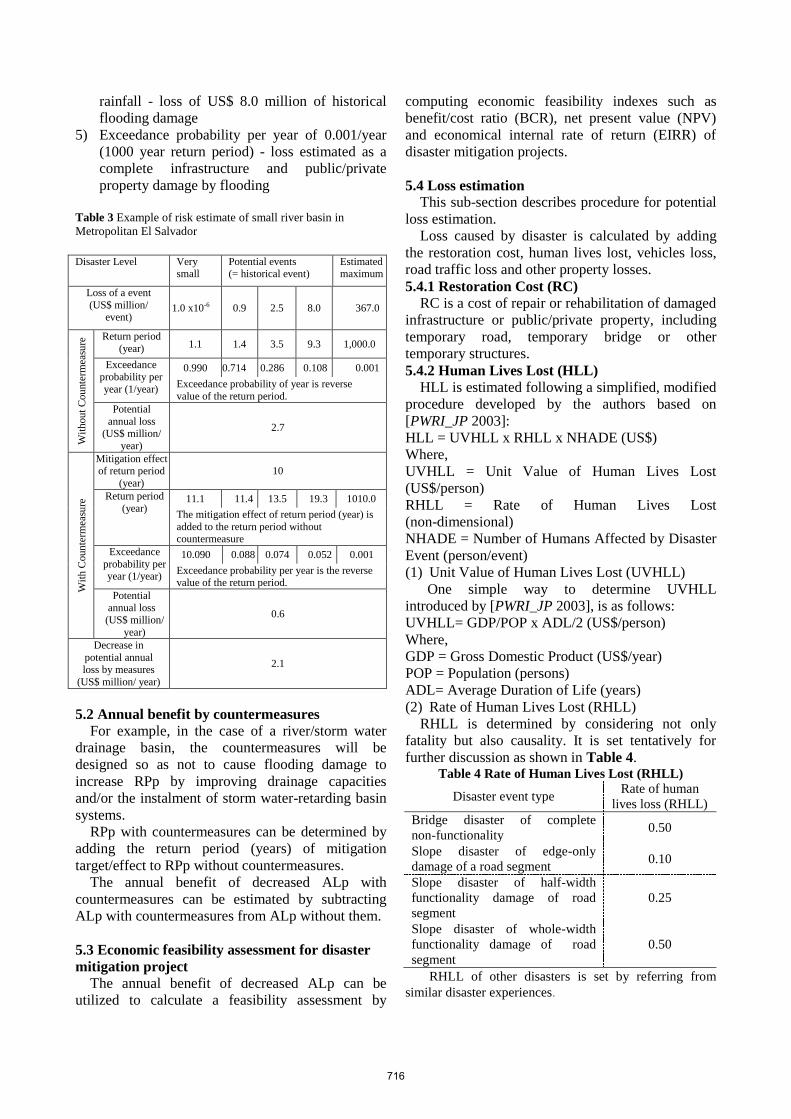
The maps in Fig.1 show the location of 34 rainfall
stations, which can provide daily rainfall amounts
for 10 years (from 2002-2011), and the appurtenant
Thiessen polygons. The polygons are color-coded to
show five return-periods categories of two-day
rainfall amount totals during past severe rainfall
events. Categorizing the two-day rainfall amounts
into five levels like this is similar to the early
warning system used in El Salvador.
The range of each category is set by a geometric
series that considers the geometric characteristics of
the return period, where reverse value is the
exceedance probability per year. Since the maximum
return period for two-day rainfall, from 2002-2011,
is 30.5 years amongst the 34 rainfall stations, the
maximum category is set to ‘equal or greater than 16
years’.
The location of disaster events relating to bridges,
slopes and flooding are plotted on the Thiessen
polygon maps. The disaster locations are relatively
concentrated by greater return period categories of
Thiessen polygons for each rain event.
In this paper, a two-day rainfall amount was used
as the rainfall index for hazard vulnerability
assessment, unless otherwise specified.
The authors recognized that a more appropriate
rainfall index for each disaster type should be
researched, after collecting statistically significant
rainfall data. This data should include a precise
period such as 10-minute rainfall amounts, as well as
dense locations of rainfall stations.
(1) Location of flood-disaster (blue dot), and slope disasters (purple dot) by Hurricane STAN in October 2005
710
(2) Location of bridge-disaster (blue dot) by Tropical Storm IDA in November 2009
(3) Location of bridge-disaster (yellow dot) by Tropical Depression 12E in October 2011
(4) Locations of slope-disaster (grey dot) by Tropical Depression 12E in October 2011
Fig. 1 Disaster occurrence locations with rainfall return period of major rainfall events in El Salvador
Symbols:
Red dots: Location of rainfall station
RP: Return period of two-day rainfall amount (34 rainfall stations, analysis of 10 years of data from 2002-2011)
(1) Red colored Thiessen polygons; RP ≥ 16 years, (2) Orange colored Thiessen polygons; 16 years > RP ≥ 8 years
(3) Yellow colored Thiessen polygons; 8 years > RP ≥ 4 years, (4) Green colored Thiessen polygons; 4 years > RP ≥ 2
years
(5) White colored Thiessen polygons; 2 years > RP
711

3. FORMULATION OF A SEQUENCE OF
SIMPLIFIED ASSESSMENT TOOLS
BASED ON RISK CURVE THEORY
3.1 Formulation of simplified assessment tools
The sequence of simplified assessment tools for
hazard vulnerability, disaster risk and economic
feasibility of disaster mitigation projects was formulated based on the Draft Manual for Risk
Analysis and Risk Management Support of Road
Slope Disaster (in Japanese), proposed by the
[Public Works Research Institute Japan, 2003]
(hereafter referred to as” [PWRI_JP 2003]”), for the
construction of resilient infrastructure against
rainfall - induced disasters.
3.2 Risk estimate by risk curve theory
The risk curve theory was proposed by
[PWRI_JP, 2003], with the purpose of estimating
slope-disaster risk. And the risk curve theory has
been adapted for several disaster mitigation plans,
including flooding disasters in Japan.
Disasters may occur repeatedly at the same site or
area, with every specific event having its own
particular magnitude. Disaster magnitude is assumed
to be different depending on the magnitude of
induced cause (heavy rains, etc.). To obtain the risk
index of potential annual loss, a risk curve as shown
in Fig. 2 would be useful. The risk curve is derived
from the plots of exceedance probability per year of
disaster occurrence on the vertical axis and potential
economic loss of disaster event on the horizontal
axis.
The reason the authors adapted risk curve theory
to develop a risk estimate spreadsheet tool is that the
theory can enable the estimate of a single value of
potential annual loss of site/area to help prioritize
the site/area for disaster mitigation. Furthermore, the
annual benefit by the countermeasures can be
estimated by determining the area between the risk
curves with and without countermeasures and the
coordinate axis. The annual benefit can then be
directly entered into the computation of economic
feasibility indexes, such as the cost/benefit ratio of
disaster mitigation project.
The draft manual by [PWRI_JP 2003] adopted a
hazard vulnerability rating procedure by using a
checklist of factor/category of disaster occurrence as
an inductive method of statistical approach. The
authors adopted the hazard vulnerability rating
procedure, because deductive methods of
computation of bridge foundation scoring analysis,
slope stability analysis, hydrological simulation, etc.,
are too laborious for the preliminary assessment.
Legend
Risk curve without countermeasures
Risk curve with countermeasures
Annual benefit by countermeasures
= integral computation of an area
between both risk curves with and
without countermeasures, and the
coordinate axis
Fig. 2 Example of risk curve for rainfall-induced disaster
3.3 Improvement points from the risk assessment
procedure of [PWRI_JP, 2003]
As [PWRI_JP, 2003] provides only the theory for
risk estimate and risk management for road slope
disasters, and does not provide detailed assessment
format and/or software. The authors developed
simplified spreadsheet tools for hazard vulnerability,
disaster risk estimates and economic feasibility of
disaster countermeasures for bridges, slopes and
river/storm water drainage basins.
In [PWRI_JP, 2003] and the other customary
procedures, the hazard vulnerability rating is
assessed by adding scores of dimensionless numbers
of integer or decimal value, assigned to each
category of factor item of disaster occurrence. The
dimensionless rate requires complicated processes to
determine the exceedance probability per year of
specific disaster magnitude of a site/area for the risk
estimate as potential annual loss (ALp). The main
advantage in what the authors adopted is the return
period rating for vulnerability assessment tool to
improve the interface for risk estimate, because the
return period (year/event) is the reverse value of
exceedance provability per year (event/year).
Additionally, the return period rate is more tangible
or imaginable than dimensionless rate.
The developed method uses hazard vulnerability
checklist of factor item/category of disaster
occurrence. Potential disaster return period (RPp) of
bridge and slope are derived by adding return period
0.001
0.010
0.100
1.000
1.E+00 1.E+02 1.E+04 1.E+06 1.E+08
Economic loss of disaster event
(US$)
Ex
ceed
ance
Pro
bab
ilit
y p
er y
ear
(1/y
ear)
1 100 10 thousand 1 million 10 million
712

scores (RPS, measured in year/event) assigned to
each category of factor item for disaster occurrences.
The return period is the reverse value of
exceedance probability per year, and can be utilized
for computation of ALp of a site/area by means of
integral computation of exceedance probability per
year and economic loss of disaster event.
The return period rating is key for formulation of
the sequence simplified assessment tools of hazard
vulnerability, disaster risk and economic feasibility
of disaster mitigation projects.
In case of ALp estimation of river/storm water
basins, hazard vulnerability assessment can be
simplified to just assessment data sets of return
period of triggered rainfall and economic loss of
historical flooding event.
4. HAZARD VULNERABILITY
ASSESSMENT 4.1 Hazard vulnerability assessment for bridge
The vulnerability assessment for a bridge was
conducted only by one magnitude of disaster of
whole function damage (completely impassable of
traffic), because it is difficult to define the damage
level in any other way. The vulnerability was
assessed by rating as potential return period (RPp) of
disaster occurrence of whole function damage of a
bridge. RPp was rated by adding return period
score (RPS) which assign to each category of factor
item of disaster occurrence in checklist as shown in
Table 1. Each RPS was determined by multivariate
analysis minimizing residual sum of squares
between actual return period (RPa) of historical
disaster events and RPp as shown in Fig. 2.
The Microsoft Excel solver tool was used for the
multivariate analysis. Because the sample size of a
bridge which has a historical disaster event was not
enough for statistically significant analysis, the data
from bridges without any historical disasters also
was used. In that case, RPa of bridges without a
disaster history, albeit conservative, was set to the
historical maximum return period of rainfall index.
In this solver tool, category merge function and item
neglecting function are included to search for the
most suitable regression model.
RPa of a bridge disaster of whole function
damage was determined by the return period of the
rainfall index of the nearest rainfall station which
has enough data for the return period analysis at
historical disaster occurrence date/time. The tool
provided by the Central American Probabilistic Risk
Assessment Program (CAPRA) under the United
Nations’ International Strategy for Disaster
Reduction (UNISRD) was also referred to determine
the RPa.
Factor items and their categories of bridge disaster
induced by rainfall were set as considerable causing
or restraining factors of disaster occurrence, as
shown in Table 1., referring from checkup
item/category for both highway/railway bridge of
Japanese and/or Central American Secretary for
Economic Integration (SIECA).
RPS of checklist was initially set by referring
from dimensionless score (integer or decimal values)
of the Japanese checklist.
Table 1 Item/category of hazard vulnerability checklist of
bridge disaster Items Categories
River environment condition from ground plan view
point (selection of most appropriate category)
Factor item 1:
General
geomorphology
1. alluvial plane
2. alluvial fan
3. valley plane
4. mountain area
Factor item 2:
Historical change
of river course
1. outside the bridge length
2. inside the bridge length
3. not applicable
Factor items 3 - 7 are omitted
Searching the most suitable regression model by
minimizing residual sum of squares of actual –
potential return period of disaster events
• RPp = ∑ RPS
RPp: Return period of potential disaster
event for a site/area [year/event]
RPS: Return period scores assigned to each
category of factor item for disaster
occurrences in the hazard vulnerability
checklist.
• RPa: Return period of an actual disaster
event of a site/area [ year/event]
Fig. 2 Setting of the return period score
713
River environment condition from sectional view
point (selection of most appropriate category)
Factor item 8:
Type of
substructure
1. caisson foundation
2. pile foundation
3. spread foundation
4. unknown
Factor item 9:
Embedment of
foundation into
bedrock
1. embedded
2. unknown, or not embedded
Factor items of 10- 16 are omitted.
River environment condition from profile view point
(selection of most appropriate category)
Factor item 17:
Riverbed
degradation
1. full width
2. partial width
3. not applicable
Factor item 18:
Riverbed
aggradation
1. full width
2. partial width
3. not applicable
Factor items 19 - 21 are omitted.
Damage to bridge (selection of most appropriate
category)
Factor item 22:
Damage (such as
open crack,
scouring) on
substructure (for
collapsed bridges,
before disaster
situation )
1. applicable
2. applicable, but to some
extent
3. not applicable
4. unknown
Factor item 23 is omitted.
4.2 Hazard vulnerability assessment for slope Assessed slope types include natural, artificial cut
or embankment. The basic assessment method for
RPp of disaster event is same as that for bridge. In
the case of slope, the checklist for RPp assessment is
developed for three location types from conservation
objects such as road: hillside, valley side and
crossing stream as shown in Fig. 3.
Every magnitude of disaster has a different
probability or return period. Therefore, RPp is
assessed by three different levels of disaster
magnitude: damage of edge only, half function and
whole function.
This three-damage level assessment is practical
for risk estimate using risk curve as described in
Section 3.2.
Factor items and their categories of slope disaster
induced by rainfall were set to a variety of causing
or restricting factors of disaster occurrence referring
from the Japanese practice for highway slope as
shown in Table 2.
Legend
Boundary of segment of infrastructure such as
road
Length of infrastructure segment such as road
M
Mountain side slope
V
Valley side slope
s Crossing stream
Fig. 3 Three location types for hazard vulnerability assessment
of slope, source: JICA modified by the authors
Table 2 Factor items and their categories of hazard vulnerability
checklist of hillside slope Items Categories
Topographical situations
(selection of most appropriate category)
Factor item 1:
Length of survey slope
along infrastructure: L
1. L ≥ 300 m
2. 300 m > L ≥ 200 m
3. 200 m > L ≥ 100 m
4. 100 m > L
Factor item 2:
Slope inclination of
infrastructure side
slope up to inclination
change point
1. SI ≥ 45O
2. 45O > SI ≥ 30
O
3. 30O > SI ≥ 15
O
4. 15O > SI
Factor items 3 - 6 are omitted.
Surface and subsurface situation
(selection of most appropriate category)
Factor item 7:
Dominant
materials of
slope surface
1. silt, clay
2. sand
3. gravels
4. cobbles, boulders
5. fractured rock
Categories 6 - 8 are omitted.
Factor item 8:
Dominant
geology
Recent
1. alluvium
2. lava
Holocene or
Pleistocene
3. white volcanic
materials
Categories 4 - 7 are
omitted.
Categories of Pliocene and those of
older geological age are omitted.
Factor item 9:
Dominant
1. AI ≥ 60O
2. 60O > AI ≥ 20
O
714
geology
Apparent
inclination of
dominant
discontinuity
against slope
surface: AI
3. 20O > AI ≥ 10
O
4. 10O > AI ≥ 0
O
5. 0O > AI ≥ - 10
O
6. -10O > AI ≥ - 20
O
7. -20O > AI
8. no discontinuity
9. Factor items 10 - 18 are omitted.
Predictor
(category applicability check)
Factor item 17:
Predictor
1. minor collapse/fall
2. continuous cracks (more than
5 m) on slope
3. fallen/inclined trees
Categories 4 - 15 are omitted.
Existing counter measure
(selection of most appropriate category)
Factor item 18:
Main slope
surface protection
1. mortal/concrete crib works
2. shotcrete or pitching works
Categories 3 - 6 are omitted.
Factor item 19:
Main retaining
works
1. anchored wall
2. reinforced earth
Categories 3-7 are omitted.
Factor items 20 and 21 are omitted.
4.3 Hazard vulnerability assessment for
river/storm water drainage basin Because of extreme complexity of factors to
evaluate flooding of river/storm drainage basin, a
flooding vulnerability checklist was not developed.
Flooding vulnerability was assessed by RPp as equal
value to RPa, and their potential economic loss were
modified from historical economic loss as present
value. The same magnitude of flooding can be
presumed to occur in the future in the same return
period of historical flooding event, in the assumption
of heavy rainfall events’ probability does not differ
in the future and the past.
Economic loss was modified into present value as
of assessment starting year by price escalation and
change in land conditions of infrastructure and
private/public properties
RPp of a disaster magnitude of a basin was
assessed by average RPa of a flooding event using a
Thiessen polygon map (adding of each Thiessen
polygon’s multiplication of RPa and overlapping
area with assessed basin, and divided by area of
whole assessed basin).
The authors consider that the potential economic
losses of several RPp are preferably obtained by the
deductive analysis of flooding simulation and
economic loss estimate by present land use data as
much as possible.
5. RISK ESTIMATE AND ECONOMIC
FEASIBILITY INDEX OF DISASTER
MITIGATION PROJECTS
5.1 Risk estimate
5.1.1 Bridge disaster
Risk index of potential annual loss (ALp) of a
bridge was estimated by multiplication of
exceedance probability per year (reverse value of
RPp) and potential economic loss of a disaster of
whole function damage. As such, the hazard
vulnerability assessment for bridges was conducted
only by one magnitude level of whole function
damage as described in section 4.1.
5.1.2 Slope disaster
ALp of a slope was estimated by integral
computation of sets of exceedance probability per
year and economic loss of five levels of disaster
magnitude, as follows:
1) Exceedance probability per year of 0.9/year (1.1
year return period) - very small loss assumed
at US$1
2) Exceedance probability of edge-only damage -
loss of edge-only damage
3) Exceedance probability per year of half function
damage - loss of half-function damage
4) Exceedance probability per year of
whole-function damage - loss of whole-function
damage
5) Exceedance probability per year of 0.001/year
(1,000 year return period) - loss of
whole-function damage
5.1.3 River/storm water drainage basin
ALp of a basin was estimated by integral
computation of sets of exceedance probability per
year and potential economic loss.
Fig.4 and Table 3 are examples of flooding risk
curves and risk estimates for a small river basin (260
hectares) in Metropolitan El Salvador.
In this example, the flooding risk index ALp was
estimated by five levels of disaster magnitude as
follows:
1) Exceedance probability per year of 0.9/year (1.1
year return period) - very small loss assumed at
US$1
2) Exceedance probability per year of historical
damage triggered by a 1.4 years return period
rainfall - loss of US$0.9 million of historical
flooding damage
3) Exceedance probability per year of historical
damage triggered by a 3.5 years return period
rainfall - loss of US$2.5 million of historical
flooding damage
4) Exceedance probability per year of historical
damage triggered by a 9.3 years return period
715
rainfall - loss of US$ 8.0 million of historical
flooding damage
5) Exceedance probability per year of 0.001/year
(1000 year return period) - loss estimated as a
complete infrastructure and public/private
property damage by flooding
Table 3 Example of risk estimate of small river basin in
Metropolitan El Salvador Disaster Level Very
small Potential events (= historical event)
Estimated maximum
Loss of a event
(US$ million/ event)
1.0 x10⁻⁶ 0.9 2.5 8.0 367.0
Wit
hou
t C
ou
nte
rmea
sure
Return period
(year) 1.1 1.4 3.5 9.3 1,000.0
Exceedance
probability per
year (1/year)
0.990 0.714 0.286 0.108 0.001
Exceedance probability of year is reverse
value of the return period.
Potential
annual loss (US$ million/
year)
2.7
Wit
h C
oun
term
easu
re
Mitigation effect of return period
(year)
10
Return period
(year) 11.1 11.4 13.5 19.3 1010.0
The mitigation effect of return period (year) is
added to the return period without countermeasure
Exceedance
probability per year (1/year)
10.090 0.088 0.074 0.052 0.001
Exceedance probability per year is the reverse value of the return period.
Potential
annual loss
(US$ million/
year)
0.6
Decrease in
potential annual loss by measures
(US$ million/ year)
2.1
5.2 Annual benefit by countermeasures
For example, in the case of a river/storm water
drainage basin, the countermeasures will be
designed so as not to cause flooding damage to
increase RPp by improving drainage capacities
and/or the instalment of storm water-retarding basin
systems.
RPp with countermeasures can be determined by
adding the return period (years) of mitigation
target/effect to RPp without countermeasures.
The annual benefit of decreased ALp with
countermeasures can be estimated by subtracting
ALp with countermeasures from ALp without them.
5.3 Economic feasibility assessment for disaster
mitigation project
The annual benefit of decreased ALp can be
utilized to calculate a feasibility assessment by
computing economic feasibility indexes such as
benefit/cost ratio (BCR), net present value (NPV)
and economical internal rate of return (EIRR) of
disaster mitigation projects.
5.4 Loss estimation
This sub-section describes procedure for potential
loss estimation.
Loss caused by disaster is calculated by adding
the restoration cost, human lives lost, vehicles loss,
road traffic loss and other property losses.
5.4.1 Restoration Cost (RC)
RC is a cost of repair or rehabilitation of damaged
infrastructure or public/private property, including
temporary road, temporary bridge or other
temporary structures.
5.4.2 Human Lives Lost (HLL)
HLL is estimated following a simplified, modified
procedure developed by the authors based on
[PWRI_JP 2003]:
HLL = UVHLL x RHLL x NHADE (US$)
Where,
UVHLL = Unit Value of Human Lives Lost
(US$/person)
RHLL = Rate of Human Lives Lost
(non-dimensional)
NHADE = Number of Humans Affected by Disaster
Event (person/event)
(1) Unit Value of Human Lives Lost (UVHLL)
One simple way to determine UVHLL
introduced by [PWRI_JP 2003], is as follows:
UVHLL= GDP/POP x ADL/2 (US$/person)
Where,
GDP = Gross Domestic Product (US$/year)
POP = Population (persons)
ADL= Average Duration of Life (years)
(2) Rate of Human Lives Lost (RHLL)
RHLL is determined by considering not only
fatality but also causality. It is set tentatively for
further discussion as shown in Table 4. Table 4 Rate of Human Lives Lost (RHLL)
Disaster event type Rate of human
lives loss (RHLL)
Bridge disaster of complete
non-functionality 0.50
Slope disaster of edge-only
damage of a road segment 0.10
Slope disaster of half-width
functionality damage of road
segment
0.25
Slope disaster of whole-width
functionality damage of road
segment
0.50
RHLL of other disasters is set by referring from
similar disaster experiences.
716
(3) Number of Humans Affected by a Disaster
Event (NHADE)
NHADE of bridge and road slope disaster is
determined by the following formula:
NHADE = LN/ AVVA/24 x AADT x ANPOPV
(persons)
Where:
LN = (probable) Length of the Road Damaged (km)
AVVA = Average Velocity of Vehicles in the
Assessed Road Section (km/hour)
AADT = Annual Average Daily Traffic
(vehicles/day)
ANPOPV= Average Number of Passengers and
Operators per Vehicles (person/vehicle)
NHADE of other disasters is set by referring from
similar disaster experiences.
5.4.3 Vehicle Loss (VL)
VL is estimated using the following formula,
developed by the authors, after referring to The
World Bank’s tool "Highway Development and
Management Model" (HDM-4).
VL = AVVA x RVL x NVADE (US$)
Where,
AVVA = Average Value of Vehicles Affected
(US$/vehicle)
RVL = Rate of Vehicles Loss (non-dimensional)
NVADE = Number of Vehicles Affected by Disaster
Event (vehicle/event)
(1) Average Value of Vehicles Affected (AVVA)
AVVA is 1/2 of the average new vehicle price
prorating traffic volume of the assessed road section,
by vehicle type.
(2) Rate of Vehicles Loss (RVL)
RVL is set tentatively for further discussion as
shown in Table 5.
Table 5 Rate of Vehicle Loss (RVL)
Disaster event type Rate of Vehicle
Loss (RVL)
Bridge disaster of complete
non-functionality 0.50
Slope disaster of edge-only
damage of a road segment 0.10
Slope disaster of half-width
functionality damage of a road
segment
0.25
Slope disaster of whole-width
functionality damage of a road
segment
0.50
RVL of the other disaster is set by referring
similar type disaster experiences.
(3) Number of Vehicles Affected by a Disaster
Event: (NVADE)
NVADE of bridge and road slope disaster is
determined by the following formula:
NVADE = LN/ AVVA/24 x AADT (vehicles)
Where,
LN = (probable) Length of Road Damaged (km)
AVVA = Average Velocity of Vehicles of Assessed
road section (km/hour)
AADT = Annual Average Daily Traffic
(vehicles/day)
NVADE of other disasters is set by referring from
similar disaster experiences.
5.4.4 Road Traffic Loss (RTL)
RTL is estimated using the following formulas,
developed by the authors, after referring to The
World Bank's tool HDM-4. The data was obtained
from The Ministry of Public Works, Transportation,
Housing and Urban Development (MOPTVDU,
abbreviation in Spanish), El Salvador records and/or
project reports.
(1) In case of no full width vehicular closure or
incomplete vehicular closure due to flooding
RTI is estimated using the following formula:
RTI = AADT x NDTD x LN/ASVA x ATVVA x
CTL
Where,
AADT = Annual Average Daily Traffic
(vehicles/day)
NDTD = (probable) Number of Days of Traffic
Disturbance (days)
LN = (probable) Length of Road Damaged (km)
ASVA = Average Speed of Vehicles in the Assessed
Road Section (km/hour)
CTL = Coefficient of Time Loss (non-dimensional)
(CTL is tentatively set at 8 for edge-only damage
and 16 for half-function damage. It is set for each
flooding event, considering water depth and/or water
flow rate)
ATVVA = Average Time Value of Vehicles
(US$/hour) in the Assessed Road Section (time
value of the vehicle is set for each vehicle type for
traffic planning, usually to estimate travel time)
(2) In case of full width vehicular closure
RTL adopts the lesser value between Loss for
Waiting (LW) and Loss for Detour (LD).
LW is estimated using the following formula:
LW = AADT x NCD x NCD x 24/2 x ATVVA
(US$)
Where:
AADT = Annual Average Daily Traffic
(vehicles/day)
NCD = (probable) Number of Closure Days (days)
ATVVA = Average Time Value of Vehicle
(US$/hour) in the Assessed road section
LD is estimated by following formula:
LD = AADT x NCD x ((AVOCD x LRD - AVOCA
x LRA) + (LRD/ASVD - LRA/ASVA) x ATVVA)
(US$)
Where,
717
AADT = Annual Average Daily Traffic
(vehicles/day)
NCD = (probable) Number of Closure Days (days)
AVOCD = Average Vehicle Operation Cost of
Detour Road (USD/km) (vehicle operation cost is set
for each vehicle type, road surface condition and
road type for traffic planning)
LRD = Length of Road Detoured (km)
AVOCA = Average Vehicle Operation Cost in the
Assessed Road Section (US$/km)
LRA = Length of Road Assessed (km)
ASVD = Average Speed of Vehicles on Detour
Road (km/hour)
ASVA = Average Speed of Vehicles in the Assessed
Road Section (km/hour)
ATVVA = Average Time Value of Vehicles
(US$/hour) in the Assessed Road Section
5.4.5 Other public /private property losses
Other public/private property losses are estimated
by adding the asset value of property. In the case of
flooding, the rate of loss (loss percentage of asset
value) varies depending on water depth and property
type. At this time, the authors adopted the same rate
of [Ministry of Land, Infrastructure, Transport and
Tourism Japan 2005], because neither El Salvador
nor the Central American region has such
guidelines.
6. DISCUSSIONS AND CONCLUSIONS
The authors have developed the assessments of
hazard vulnerability, disaster risk and economic
feasibility of disaster countermeasures under the
GENSAI project. The developed assessment
procedure has been presented to over 200 engineers
in El Salvador and other Central American countries
since July 2014.
However, the authors are aware of the limitations
of this procedure and requirement of further
improvement as follows.
a) The accuracy of assessment results depends on
the quality of data entered for disasters and
rainfall, which needs further improvement.
b) The precise disaster records (occurrence time,
magnitude, damage assessment including
economical loss estimate), dense distribution of
rainfall stations, and automatic recording of the
precise time period of rainfall amount are
essential to improving the accuracy of the
assessment results.
ACKNOWLEDGMENT: The authors wish to
thank the persons involved from the Japan
International Cooperation Agency (JICA) for their
support and advice, through the Japanese technical
cooperation for the Project for Capacity
Development of Climate Change Adaptation and
Strategic Risk Management for Strengthening of
Public Infrastructure in El Salvador.
Acknowledgments also are given to the persons
involved in the projects, to the Ministry of Public
Works, Transportation, Housing and Urban
Development (MOPTVDU, abbreviation in
Spanish), El Salvador and to other organizations.
REFERENCES
Aguilar, D. V. (2012): Inventory of Susceptible Areas to
Landslides Using GIS in El. Salvador, First Central
American and Caribbean Congress, Tegucigalpa, Honduras.
Cortes, D. I. et al. (2012): Geotechnical Problems in El Salvador
Related to Tropical Depression 12E, First Central American
and Caribbean landslide Congress, Tegucigalpa, Honduras.
Hirano J. and Dairaku K.. (2014): A New Methodology to
Assess the Impacts of Precipitation Change on Flood Risk in
the 23 words of Tokyo, National Research Institute for Earth
Science and Deserter Prevention, Japan, Research Report
N.81 January 2014 (in Japanese with English Abstract)
Ministry of Land, Infrastructure, Transport and Tourism Japan
(2005): Draft Manual of Economical Study of Flood
Management (in Japanese).
Mori M. et al. (2008): A Study on Simple Potential Annual Loss
Estimation for Road Slope and Pavement, Koei-forum
No.17 (in Japanese with English abstract).
Mori M. (2010): Efficient Road Asset Management by
Integrated Consideration of Roadway, Bridge and Road
Slope, Fifth Civil Engineering Conference in the Asian
Region and Australasian Structural Engineering Conference.
SIECA/CEPREDENAC/SICA (2010): Manual Centroamericano
de Gestión del Riesgo en Puentes (Central America Risk
Management Manual for Bridges).
SIECA/CEPREDENAC/SICA (2010): Manual Centroamericano
deMmantenimiento de Carreteras con Enfoque de Gestión
de Riesgo y Seguridad Vial (Central American Highway
Maintenance Manual with Focus on Road Risk Management
and Driver Safety).
Calderón, S. C. et al. (2012): Rainfall analysis and its
relationship with landslides: Working Rainfall and Soil
Water Index", First Central American and Caribbean
landslide Congress, Tegucigalpa, Honduras.
Tsunaki R., Koga S. and Nishimoto H. (2010): Development of
Damage Estimation Methods for Infrastructuers and the
Application for Disater Mitigation Projects, Report of
National Institute for Land and Infrastracuture Management
(NILIM), Ministry of Land, Infrastructure, Transport and
Tourisum, Japan, No.30 Feburaly 2013 (in Japanese with
English Title)
Japan Public Works Research Institute (2010): Draft Manual on
Risk Analysis and Risk Management Support of Road Slope
Disasters (in Japanese).
718