risk and consequence analyses of hazardous chemicals … and consequence analyses of hazardous...
TRANSCRIPT

Journal of Loss Prevention in the Process Industries 15 (2002) 531–544www.elsevier.com/locate/jlp
Risk and consequence analyses of hazardous chemicals inmarshalling yards and warehouses at Ikonio/Piraeus harbour,
Greece
Fotis Rigas∗, Spyros SklavounosNational Technical University of Athens, Department of Chemical Engineering, 15700 Athens, Greece
Abstract
The risk and the consequences of possible accidents at Ikonio (Piraeus harbour, Greece) are investigated and analyzed in thispaper. At this harbour large cargoes of dangerous chemicals (toxic or flammable) are unloaded and stored in warehouses or inmarshalling yards. Houses and a school are located near the plant and are directly exposed to danger in the case of an accident.The results were obtained by Breeze Hazard Professional software package, which contains several models for performing conse-quence modeling through quantitative risk assessment. 2002 Elsevier Science Ltd. All rights reserved.
Keywords:Risk analysis; Consequence assessment; Hazardous chemicals; Marshalling yards; Chemical warehouses
1. Introduction
Huge quantities of dangerous chemicals are handledand kept for intermediate temporary storage in docks,marshalling yards and port areas for further transport.Some goods are present for years in these sites, due toenterprising problems (usually financial difficulties ofclaiming companies) or forever (bankruptcies). Thus,many incidents have occurred in chemical storage sitesduring the past few years with considerable conse-quences to neighboring populations (Drogaris, 1993;Christou, 1999). As a result, a large number of studieshave been carried out to assess the level of risk and theprobable impact to the surroundings for certain portareas (Egidi, Foraboschi, Spadoni, & Amendola, 1995;Hubert & Pages, 1989; Deaves, Gilham, Mitchell,Woodburn, & Shepherd, 2001; Rao & Raghavan, 1996).
In Piraeus harbour and Ikonio, its main goods depot,numerous hazardous chemicals are stored near inhabitedareas, totaling a 4.5 million people conglomeration ofthe now connected cities of Piraeus and Athens. Theindustrial and commercial activities in the area heavilypollute the environment, at the same time jeopardizing
∗ Corresponding author. Fax:+30107723163.E-mail address:[email protected] (F. Rigas).
0950-4230/02/$ - see front matter 2002 Elsevier Science Ltd. All rights reserved.PII: S0950-4230 (02)00030-X
the adjacent population in the case of a major accident.Above all, the storage area of the Piraeus HarbourOrganization (PHO) is in close proximity with aninhabited zone in Ikonio, where schools and other youthactivities are found.
Great attention has recently been focused on predic-tion and estimation of risk and possible damage atdangerous installations. For this purpose, accident pre-vention strategies have been developed that reduce thepossibility of an accidental event followed by undesir-able consequences. Thus, many studies have been pub-lished aiming at hazard assessment through the quantitat-ive risk analysis (Papazoglou, Christou, Nivoliantou, &Aneziris, 1992; Khan & Abbasi, 1997; Nivolianitou,1998; Khan & Abbasi, 1999).
By its nature, any plant, in which dangerous chemicalsare treated (storage/transportation), carries the prob-ability of an accident and gives rise to the laying out ofaccident scenarios. In this work, four probable scenarioswere analyzed engaging hazardous substances usuallypresent in the PHO’s storage area at their maximal quan-tities. These scenarios are ethylene oxide release and dis-persion, ethylene oxide fireball, ethylene oxide vapourcloud explosion and release of toxic substances duringcombustion of an organophosphorous pesticide.
The thermal/toxic compound doses were first com-puted. Then, these values were used to obtain approxi-

532 F. Rigas, S. Sklavounos / Journal of Loss Prevention in the Process Industries 15 (2002) 531–544
Nomenclature
IS specific impulse as a function of overpressure PS and positive phase durationtP
expressed by the integration: is � �tP
PS(t)dt
IDLH immediately dangerous to life and health concentration limit for toxic gaseous compound or vapours.These levels have been established by NIOSH as the concentrations from which one could escapewithin 30 min without any escape-impairing symptoms or any irreversible health effects
LC50 lethal concentration 50%: a concentration by which 50% of the exposed population will be fatallyinjured for a particular time of exposure.
LD50 lethal dose 50%: a dose value by which 50% of the exposed population will be fatally injured.positive phase duration a particular time in which overpressure decreases to zero after increasing and taking
the maximum value by a shock or pressure waveRD radiation dose: function of heat radiation intensity (q) and time of exposure (t) given by the equation
RD � t × q4/3
TD total dose: function of concentration (C) and exposure duration (t�t0) given by the integration:
TD � �t
t0
Cdt
Tox.C toxic concentration: lowest measured concentration by which a degree of toxic effect is still possiblefor a particular time of exposure.
Tox.D toxic dose: the lowest dose value by which a degree of toxic effect is still possible.Toxic endpoint The threshold concentration value for serious injury from exposure to a toxic substance in
the air.
mate percentages of injured people out of the totallyaffected population due to the accidental events. Thetypes of damage investigated were burns of variousdegrees, acute poisoning, or even death. Theresponse/dose correlations were expressed by probitfunctions (Green Book, 1989). The toxicity data givenin the latter report for many chemicals and derived fromlab animal experimentation, lead to total dose calcu-lations and to poisoning or lethal effect estimations fora defined percentage of the affected population.
2. Types of accident investigated
Generally, the types of accident that may take placeare: fire, explosion, release and dispersion of toxicgases/vapors or a combination of these. The types ofaccident considered in the scenarios of this study areanalyzed below.
2.1. Bleve
Bleve (boiling liquid expanding vapour explosion) isa phenomenon resulting from the failure of a vessel con-taining a liquid at a temperature significantly above itsboiling point at normal atmospheric pressure. The main
hazard posed by Bleve (Yellow Book, 1997) of a con-tainer filled with a flammable volatile liquid is a fireballand the resulting radiation, due to instantaneous ignitionof the flammable vapour cloud. The initiator for thisignition could be a hot source (e.g. the hot point of amotor), a spark of electrostatic origin, friction or a ther-mal source.
2.2. Unconfined vapour cloud explosion (UVCE)
This type of explosion (American Institute for Chemi-cal Engineers, 1994) takes place when a sufficientamount of flammable material (gas or liquid having highvapor pressure) is released and mixed with air to forma flammable cloud, such that the average concentrationof the compound in the cloud is higher than the lowerlimit of explosion. The explosion occurs in an openspace and the resulting overpressure affects humans andbuildings through a blastwave covering large distances.
2.3. Pool fire
The continuous release of a flammable liquid usuallyresults in a pool fire. When the liquid is spilled in aconfined space (e.g. in a warehouse), the pool size isalso confined and the amount of air that sustains the fire

533F. Rigas, S. Sklavounos / Journal of Loss Prevention in the Process Industries 15 (2002) 531–544
is limited, because the ventilation is controlled by theventducts (Atkinson & Jagger, 1994). In this case thetype of the fire is characterized as ‘confined’ . When theliquid is spilled in an open area, it covers a large surfacearea and the amount of air is unlimited. Then the fire isreferred to as ‘unconfined’ .
2.4. Release and dispersion of toxic gases and vapors
During the combustion of a flammable material a lotof chemical compounds are produced and travel largedistances downwind, forming a combustion gas cloud.Some of them (CO, NOx) are toxic and even fatal tohumans at sufficiently high doses. Moreover, the fractionof toxic material surviving fire is 1.5–10%. In theabsence of more accurate estimations, one can assumethat particulate matter absorbs approximately 50% of thekinetic energy of the combustion gaseous products. Inthis way the particles are carried away by these gasestraveling some distance into the heavy gas cloud andaffect inhabitants before they meet the ground. Thus, thecurve, which represents the change of particulate con-centration with time at a specific point, is similar to thatfor gaseous combustion products.
3. Computational tools
The software mainly used in this work was “BREEZEHAZ PRO” developed by Trinity Consultants, which isa fully integrated family of consequence models for per-forming offsite consequence modelling and emergencyresponse planning through quantitative risk assessment.There are in total 12 models in this package: EXPERT,DEGADIS, SLAB, AFTOX, INPUFF (all used to modelgas releases), JET FLAME, CONFINED POOL FIRE,UNCONFINED POOL FIRE, BLEVE (all used to calcu-late the thermal radiation flux levels at various specifieddistances in case of blaze), TNT EQUIVALENCYEXPLOSION, TNO MULTI-ENERGY EXPLOSIONand BAKER STREHLOW EXPLOSION (all used tocalculate the overpressure levels at specified distances inthe case of explosion). The models used in this task aredescribed below.
3.1. EXPERT model
The EXPERT model determines the key model inputparameters based on user specified physical processinformation, chemical property data, storage and ambi-ent conditions. It is integrated with each dispersionmodel to simplify the process of source term analysisand consequences modeling. EXPERT estimates the gasstate of a release entering the atmosphere. It calculatesrelease duration, exit velocity and pressure and density
in addition to emission rate of the gas or aerosol injec-tion into the atmosphere.
3.2. SLAB model
The SLAB computer model simulates the dispersionof denser-than air releases. The types of releases treatedby this model include ground level evaporating pool, aninstantaneous volume source, a stack (or generally elev-ated vertical jet) and an elevated horizontal jet.
3.3. DEGADIS+ model
DEGADIS+ is a chemical-specific model that predictsdispersion from instantaneous, steady state or transientreleases of dense gases. This powerful model is usefulfor determining toxic gas concentrations of episodicreleases from single sources over flat terrain and at parti-cular meteorological conditions for the duration of therelease.
3.4. BLEVE model
The BLEVE model estimates the parameters associa-ted with a fireball phenomenon, which usually followsa BLEVE event or generally a sudden release of aflammable gas. In addition to fireball diameter and dur-ation, this model calculates the thermal dose, whichaffects thermal radiation receptors at specified distances(points of interest).
3.5. TNO MULTI-ENERGY and TNT EQUIVALENCYEXPLOSION models
The TNO MULTI-ENERGY EXPLOSION modelcalculates the distance to various overpressure levelsspecified by the user for an unconfined vapour cloudexplosion. It takes into account the variability of theblast strength by expressing the explosion as a numberof fuel–air charges, each with individual characteristics.By modeling the vapour cloud explosion as the numberof smaller blasts in each centre on confined sections ofthe cloud, this model is appropriate for estimating near-field damage.
The TNT EQUIVALENCY EXPLOSION model cal-culates the distance to various over-pressure levels speci-fied by the user for an unconfined vapor cloud explosion.It uses a proportional relationship between the flam-mable mass in the cloud and an equivalent weight ofTNT. It is assumed that the entire flammable mass isinvolved in the explosion and that the explosion is cent-ered at a single location. The TNT equivalency methodis simple and tends to be better for estimating far-fielddamage. Both these models are able to calculate theoverpressure developing at specified distances (pointsof interest).

534 F. Rigas, S. Sklavounos / Journal of Loss Prevention in the Process Industries 15 (2002) 531–544
4. Risk analysis and impact assessment
4.1. Methodology
Risk analysis deals with the hazard spotting of danger-ous chemicals and constitutes the first step in impactevaluation and preventive measures establishment.
The methodology followed in this study was:
1. Identification of hazards and high risk points in theinstallations in addition to possible affected points.
2. Consideration of suitable accident scenarios andsimulation of the resulting accidents (use of theappropriate model involved in Breeze HAZ PROsoftware package).
3. Estimation of the impact that the accidents may have(use of steps (1) and (2)).
Regarding the hazard identification, the points ofinterest in the plant are shown in Fig. 1, while the algor-ithm including the above steps is presented in Fig. 2.
4.2. Input data
Among the dangerous chemicals frequently unloadedin the docks of PHO at Ikonio are ethylene oxide(maximal quantity per batch: 1000 kg) and the pesticideAzinphos-methyl (maximal quantity per batch: 10000kg). The former is highly flammable and the latter pro-
Fig. 1. Aerial photo of Ikonio area. Installation limits, blocks and the school are presented. nos. 1 and 2: warehouses; no. 3: school; nos. 4 and5: blocks; no. 6: street.
Fig. 2. Algorithm of risk and consequence assessment.

535F. Rigas, S. Sklavounos / Journal of Loss Prevention in the Process Industries 15 (2002) 531–544
duces toxic gaseous products when burning (Smith-Hansen & Jorgensen, 1994). Both of them are toxic andthey can even cause death in humans at certain doses.The fact that the area around the installation is inhabitedgives a particular interest to the evaluation of the conse-quences in the case of an accident. More specifically,next to the storage area many houses are located (Fig.1, blocks no. 4 and no. 5), as well as a public school (Fig.1, no. 3). In the same figure, no. 1 and no. 2 represent thewarehouses of the installation and no. 6 the street thatconnects Ikonio with Piraeus. The scale (1/10000) andthe North direction are also shown in Fig. 1. Many con-tainers are also yarded outside warehouses no. 1 andno. 2.
Ethylene oxide is usually stored in warehouse 1 oroutside, while Azinphos-methyl containers are stored inwarehouse 2. Analysis of the subsequent accident scen-arios aims chiefly at the prediction of the effects on stu-dents (school, no. 3) and on residents (blocks no. 4 andno. 5).
Moreover, a dispersion model demands a value of thewind speed in order to run. Therefore, related statisticaldata for the Piraeus area were obtained from the HellenicNational Meteorological Service. With reference to thesedata, an average value of wind speed in the months ofApril and May (see Section 4.3) is 1.8 m/s. In addition,a typical value of relative humidity of the air is required.Through the same data, the average value was calculatedto be equal to 62.5%.
4.3. Prevailing winds
The continuous change of wind direction during a dayrequires the use of meteorological data in order to ascer-tain the major winds that blow in the greater area ofIkonio. In the case of a toxic gas release, the wind favorsthe movement of the toxic cloud onto the school and thesurrounding blocks when it is moving in a Southeast orSouth direction. Analytically, with regard to gas releasein a Southeast wind (direction 100–110°), the cloud willaffect the school (no. 3) and the nearest to the schoolhouses in the same direction (no. 4). In the case of aSouth wind (direction 175–185°), the cloud will affectthe areas nearest to the warehouse block (no. 5). Ware-house no. 1 is 71 m away from block no. 5, 80 m fromthe school and 300 m from block no. 4. Warehouse no.2 is 182 m away from block no. 5, 133 m from theschool and 310 m from block no. 4.
The information given by the obtained data shows thatthe South wind prevails in the months of April, May andJune, while a Southeast wind blows mainly in April andMay. All the other monthly frequencies of the Southwind are moderate to low and for the Southeast windthey are low.
Table 1Results obtained via the EXPERT source term model
Result Value
Emission rate 15.586 kg/sExit velocity 9.37 m/sUsed release duration 64.16 sVapor fraction 5.860E�02Exit pressure 115 kPa
5. Illustration of accident scenarios andconsequence estimation
5.1. Scenario 1: ethylene oxide dispersion
5.1.1. Southeast windIn this scenario an amount of 1000 kg of ethylene
oxide is assumed to be released into the atmosphere asa horizontal jet after the fall and rupture of the containerin which the ethylene oxide is stored under pressure. Theresulting ethylene oxide cloud will travel a long distanceuntil fully mixed with the air by the wind and will coverthe school when the wind has a Southeast direction. Theappropriate model for this type of release is SLAB,which requires the emission rate of the substance. TheEXPERT model can calculate this parameter. Thus, fora hole diameter equal to 0.05 m, the EXPERt modelgives the results found in Table 1. These results are auto-matically transferred to the SLAB model, which givesthe final results regarding the change of ethylene oxideconcentration with time at a specified point. Further-more, isorisk curves and covered areas are shown in Fig.3. With regard to the school and block no. 4 this vari-ation is described in Fig. 4. Then, by using the EXCELprogram, it is possible for the total dose (TD) to be cal-culated via the equation:
TD � �t
t0
Cdt
where C is the concentration of dispersed compound, t0is the time the cloud starts to pass above a particularpoint, t is the time it takes for the cloud to entirely passabove that particular point (t0 � t). The TD for eachpoint was calculated by integration of the correspondingcurve (Fig. 4):
TDs � �410
0
Cdt � �100
0
C1dt � �240
100
C2dt � �410
240
C3dt
� 145 (g × s) /m3
TD4 � �435
136
Cdt � �240
136
C1dt � �435
240
C2dt � 9.9 (g × s) /m3.

536 F. Rigas, S. Sklavounos / Journal of Loss Prevention in the Process Industries 15 (2002) 531–544
Fig. 3. Isorisk curves representing the concentrations: toxic end point (90 mg/m3)—outer white contour; IDLH (1460 mg/m3)—middle blackcontour; LFL (54 017 mg/m3)—inner white contour. Snapshot at 60 s elapsed time with Southeast wind.
Fig. 4. Change of ethylene oxide concentration with time at pointsof interest.
The LD50 value for ethylene oxide is 12038 (g×s)/m3
which is higher than the value of TDs calculated. On theother hand the toxic dose (Tox.D) is equal to Tox.D=108(g×s)/m3 which is less than the TDs value calculatedabove. As a result, it can be inferred that the ethyleneoxide cloud will not affect students fatally, but they willappear to have symptoms such as dizziness, nausea, dif-ficulty in breathing and vomiting (Sax, 1957). More-over, TD4 � � Tox.D, which means that block no. 4is beyond the dangerous zone.
5.1.2. South windThe areas nearest to the warehouse block (no. 5) will
be affected by a South wind. In this case, the change ofethylene oxide concentration with time at this point dur-ing the cloud travel is shown in Fig. 4. Furthermore,isorisk curves and covered areas are shown in Fig. 5.The TD5 is then calculated with the integral:
TD5 � �330
0
Cdt � �86
0
C1dt � �196
86
C2dt � �330
196
C3dt
� 125 (g × s) /m3.
Comparing again the TD5 value with Tox.D and LD50
values, it is apparent that Tox.D � TD5 � LD50.Namely, there will be poisoning symptoms as pre-viously.
5.2. Scenario 2: ethylene oxide fireball
Due to the high exit velocity and brief release time(Table 1) of ethylene oxide from the vessel, its concen-tration immediately after the entire amount has beenreleased is above the lower flammability limit (Figs. 3and 5, inner contour). As a result, the formed cloud willturn into a fireball when meeting an ignition source. The

537F. Rigas, S. Sklavounos / Journal of Loss Prevention in the Process Industries 15 (2002) 531–544
Fig. 5. Isorisk curves and impact area for South wind. The contours represent the same as Fig. 2 values of ethylene oxide concentration.
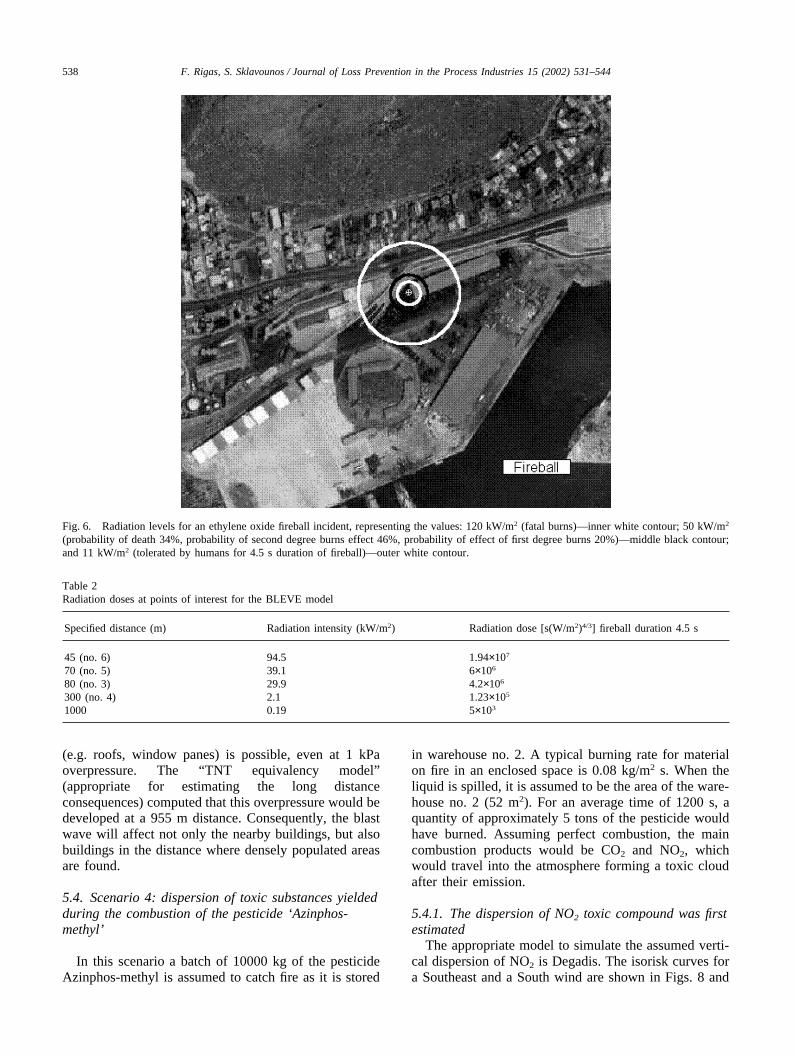
appropriate simulation model for this phenomenon isBLEVE, which can estimate the radiation levels andthermal doses for the amount of ethylene oxide (1000kg). The diameter of the fireball provided by the modelis equal to 58 m and its duration is equal to 4.5 s. Theaffected area is presented in Fig. 6 and the results regard-ing radiation doses at several distances are shown inTable 2. From this table one can see that block no. 4 isnot endangered. The radiation dose at this distance is toolow to cause burns even of the first degree. The ped-estrians walking along the avenue (no. 6) at the time ofthe accident will be surely fatally injured because of theexcess thermal intensity (Table 2). At block no. 5 thevalue of thermal radiation dose corresponds to 6% prob-ability for third degree burns, 20% for second degreeburns and 74% for first degree burns. At the school area(no. 3), the probabilities of injury due to thermal radi-ation are 2% for third degree, 5% for second degree and93% for first degree burns. Eventually, the thermal radi-ation will be perceptible over 1 km away from the pointof the accident.
5.3. Scenario 3: ethylene oxide vapour cloudexplosion (VCE)
This type of accident has been simulated by the multi-energy explosion model. Three levels of overpressurewere given as input data, namely, 300 kPa (upper
contour), 51 kPa (middle contour) and 3.5 kPa (lowercontour). The first value of overpressure is fatal, thesecond one results in a 5% probability of fatal injury dueto collision of the victim with a stable surface and thethird value sets an overpressure level tolerated byhumans (see Fig. 7). To estimate the overpressure levelsat point nos. 3, 4, 5 and 6 where overpressure will affectpoints 3, 4, 5, 6 almost simultaneously, the correspond-ing distances were logged as input data and the pro-gramme calculated the overpressure values in additionto positive phase duration at these points (Table 3).
The results gave rise to the following conclusions.With regard to the avenue (no. 6), there is a 15% prob-ability of fatal collision of a victim with a stable surfaceand a 50% probability of eardrum rupture. Moreover,taking into account that even loaded train carriages turnover just at 51 kPa overpressure, passing cars will turnover.
Regarding block no. 5 and the school no. 3 the effectswill be similar. A percentage of about 50–75% of allouter walls will be lightly to heavily damaged. The dam-age will not be repairable because most of the houses inthe area are old. For those found in one of these housesor in the school building, there is a 50–80% probabilityof injury and a 20–50% probability of being fatallysquashed by the crumbling walls. As far as block no. 4is concerned, minor damage is expected, such as break-age of windowpanes. Furthermore, damage to buildings
538 F. Rigas, S. Sklavounos / Journal of Loss Prevention in the Process Industries 15 (2002) 531–544
Fig. 6. Radiation levels for an ethylene oxide fireball incident, representing the values: 120 kW/m2 (fatal burns)—inner white contour; 50 kW/m2
(probability of death 34%, probability of second degree burns effect 46%, probability of effect of first degree burns 20%)—middle black contour;and 11 kW/m2 (tolerated by humans for 4.5 s duration of fireball)—outer white contour.
Table 2Radiation doses at points of interest for the BLEVE model
Specified distance (m) Radiation intensity (kW/m2) Radiation dose [s(W/m2)4/3] fireball duration 4.5 s
45 (no. 6) 94.5 1.94×10⁷
70 (no. 5) 39.1 6×10⁶
80 (no. 3) 29.9 4.2×10⁶
300 (no. 4) 2.1 1.23×10⁵
1000 0.19 5×10³
(e.g. roofs, window panes) is possible, even at 1 kPaoverpressure. The “TNT equivalency model”(appropriate for estimating the long distanceconsequences) computed that this overpressure would bedeveloped at a 955 m distance. Consequently, the blastwave will affect not only the nearby buildings, but alsobuildings in the distance where densely populated areasare found.
5.4. Scenario 4: dispersion of toxic substances yieldedduring the combustion of the pesticide ‘Azinphos-methyl’
In this scenario a batch of 10000 kg of the pesticideAzinphos-methyl is assumed to catch fire as it is stored
in warehouse no. 2. A typical burning rate for materialon fire in an enclosed space is 0.08 kg/m2 s. When theliquid is spilled, it is assumed to be the area of the ware-house no. 2 (52 m2). For an average time of 1200 s, aquantity of approximately 5 tons of the pesticide wouldhave burned. Assuming perfect combustion, the maincombustion products would be CO2 and NO2, whichwould travel into the atmosphere forming a toxic cloudafter their emission.
5.4.1. The dispersion of NO2 toxic compound was firstestimated
The appropriate model to simulate the assumed verti-cal dispersion of NO2 is Degadis. The isorisk curves fora Southeast and a South wind are shown in Figs. 8 and

539F. Rigas, S. Sklavounos / Journal of Loss Prevention in the Process Industries 15 (2002) 531–544
Fig. 7. Isorisk curves showing the impact area and representing the following overpressure values: 300 kPa (severe risk—inner white contour);51 kPa (high risk—middle black contour) and 3.5 kPa (moderate risk—outer white contour).
Table 3Calculated overpressures at specified distances for the vapour cloud explosion
Distance (m) Overpressure (kPa) Positive duration (s) IS (Pa×s) Damage to structures
45 (no. 6) 95 0.032 3034 Cars turned over70 (no. 5) 45 0.043 1926 50–75% of walls destroyed or unsafe80 (no. 3) 40 0.046 1831 Threshold for partial demolition300 (no. 4) 5.6 0.077 431 Threshold for minor damage
9, respectively. The change of NO2 concentration withtime at points 3, 4 and 5 is shown in Fig. 10. The totaldoses at these points were calculated with the integral:
Point 3: TD3 � �1530
0
C dt � �277
0
C1 dt � 701ppm × (1300
�277)s � �1530
1300
C3 dt � 837,360 ppm × s
where 701 ppm is the average NO2 concentration abovethe school during the time period 277–1300 s, in whichthe concentration is approximately stable.
Point 4: TD4 � �1600
130
C dt � �400
130
C1 dt � 310ppm × (1411
�400)s � �1600
1411
C3 dt � 379,070 ppm × s
where 310 ppm is the average NO2 concentration as pre-viously.
Point 5: TD5 � �1430
0
C dt � �330
0
C1 dt � 538ppm × (1280
�330)s � �1430
1280
C3 dt � 623,300 ppm × s
where 538 ppm is the average NO2 concentration as pre-viously. The comparison between TDi values (i �1, 2, 3) and LD50 � 283,500 ppm s leads us to con-

540 F. Rigas, S. Sklavounos / Journal of Loss Prevention in the Process Industries 15 (2002) 531–544
Fig. 8. Isorisk curves showing the travel of dispersed NO2 as a cloud for Southeast wind. The cloud is passing above the school (no. 3) andblock (no. 4). Outer white contour: 50 ppm; middle black contour: 215 ppm; inner white contour: 500 ppm.
clude that NO2 doses will be lethal at all points 3, 4and 5 for a higher percentage than 50% of the totallyaffected population.
5.4.2. Vapor droplets or particles of the burningliquid would be carried away by the gaseous productsof combustion
It is assumed that the curve of Azinphos-methylvapors follows the curve of CO2 during the cloud travelat a proportion of 10%. As a result one can simulate thedispersion of CO2 with a gas dispersion model andassume the Azinphos-methyl concentration to be equalto 10% of the CO2 concentration. The isorisk curvesgiven by the Degadis model are presented in Figs. 11and 12, while the change of Azinphos-methyl concen-tration with time at points of interest is shown in Fig.13. The total Azinphos-Methyl doses at points 3, 4 and5 were calculated with the integral:
Point 3: TD3 � �1460
0
C dt � �260
0
C1 dt
� 269mg/m3 × (1300�260)s � �1460
1300
C3 dt
� 641 (g × s) /m3
where 269 mg/m3 is the average Azinphos-methyl con-centration above the school during the time period 240–1260 s.
Point 4: TD4 � �1560
140
Cdt � �360
140
C1 dt
� 123.5mg/m3 × (1380�360)s � �1560
1380
C3 dt
� 135 (g × s) /m3
where 123.5 mg/m3 is the average Azinphos-methyl con-centration as previously.
Point 5: TD5 � �1500
0
Cdt � �280
0
C1 dt
� 222mg/m3 × (1300�280)s � �1500
1300
C3 dt
� 452 (g × s) /m3

541F. Rigas, S. Sklavounos / Journal of Loss Prevention in the Process Industries 15 (2002) 531–544
Fig. 9. Isorisk curves showing the travel of dispersed NO2 as a cloud for South wind. The cloud is passing above block no. 5 and contoursrepresent the same as Fig. 6 values of NO2 concentration.
Fig. 10. Change of NO2 concentration with time at points of interest.
where 222 mg/m3 is the average concentration as pre-viously. The LD50 for Azinphos-methyl is equal to:LD50 � 45 (g × s) /m3.
Comparing the LD50 value with TDi, one can easilyconclude that a percentage greater than 50% of the tot-ally influenced people would be fatally affected. Theresults of consequence analysis for the scenarios con-sidered are shown in Table 4 whereas their lethalityeffects are shown in Table 5.
6. Conclusions
This risk analysis and impact assessment applied forfour accident scenarios that may occur at Ikonio mar-shalling yard close to Piraeus harbour resulted in the fol-lowing conclusions:
� The toxic gas dispersion (scenarios 1 and 4) wouldacutely affect the pupils of the nearby school andlocal inhabitants. The consequences would be poison-ing (symptoms such as nausea, vomiting, coughingand pulmonary diseases, probably long lasting) oreven fatal for a large part of the affected population.
� A fireball event (scenario 2), emitting high amountsof thermal radiation, would cause burns to humans ata distance less than 132 m. The pupils of the nearbyschool and inhabitants would be endangered in thiscase.
� In the event of a vapor cloud explosion (scenario 3)the blast wave would cause fatal consequences to thenearby population. Moreover, it would induce damageto houses within a radius of approximately 1 km.
� Generally, the distances between warehouses 1, 2 andthe residential blocks or the school are too short. Thisis the reason for the school area and the surrounding

542 F. Rigas, S. Sklavounos / Journal of Loss Prevention in the Process Industries 15 (2002) 531–544
Fig. 11. Isorisk curve representing the LC50 value (25 mg/m3) for Azinphos-methyl and showing the travel of its droplets in the Southeast wind.
Fig. 12. Isorisk curve representing the LC50 value (25 mg/m3) for Azinphos-methyl and showing the travel of its droplets in the South wind.

543F. Rigas, S. Sklavounos / Journal of Loss Prevention in the Process Industries 15 (2002) 531–544
Fig. 13. Change of Azinphos-methyl vapor concentration with timeat points of interest.
houses being affected in a very short time, and in away that emergency response planning could not beapplied.
Based on the above conclusions the following rec-ommendations for protection measures could bededuced:
� Exclusion or at least reduction of the quantities of thehazardous cargoes that are unloaded and stored at themarshalling yard of Ikonio.
� Indoor storage of containers with hazardous materialsin the warehouses. Thus, in the event of a fire, suf-ficient time would be given for the firemen to arriveat the site and take over, or the emergency plan forthe evacuation of the inhabitants of Ikonio to be putinto practice.
� Due to the eventuality of toxic or flammable gasrelease from a warehouse into the atmosphere, suf-ficient quantities of inert gases should be kept for thepurpose of dilution of the hazardous gases to belowa toxic level or to below the lower flammability limit(fireball and vapour cloud explosion avoidance).
Table 4Results of consequence analysis for the scenarios considered at Ikonio’s marshalling yards and warehouses
Scenarios and damaging Points of interest Limiting valuesevents
School no. 3 Block no. 4 Block no. 5
1. Ethylene oxide release Acute poisoning None Acute poisoning 108 (g×s)/m3
145 (g×s)/m3 9.9 (g×s)/m3 125 (g×s)/m3
2. Ethylene oxide fireball 1st, 2nd degree burns Perceptible radiation Serious injuries 11 kW/m2
29.9 kW/m2 2.1 kW/m2 39.1 kW/m2 (fireball duration 4.5 s)3. Ethylene oxide UVCE Partial demolition Minor damage Partial demolition 1 kPa
40kPa 5.6 kPa 45 kPa4. NO2 dispersion Fatal effect Fatal effect Fatal effect 283,500 ppm×s
837,360 ppm×s 379,082 ppm×s 623,294 ppm×s5. Vapours dispersion Fatal effect Fatal effect Fatal effect 45 (g×s)/m3
641 (g×s)/m3 135 (g×s)/m3 452 (g×s)/m3
Table 5Leathality effect of various scenarios at the Ikonio’s installations
Lethality effect of Points of Interestconsidered scenarios
School No. 3 Block No. 4 Block No. 5
Ethylene oxide release No No NoEthylene oxide fireball No No NoEthylene oxide UVCE Yes No YesNO2 dispersion Yes Yes YesVapours dispersion Yes Yes Yes
References
American Institute for Chemical engineers (1994). Guidelines for eval-uating the characteristics of vapor cloud explosions, flash fires andBLEVES. New York.
Atkinson, G. T., & Jagger, S. F. (1994). Assessment of hazards fromwarehouse fires involving toxic materials. Fire Safety Journal, 22,107–123.
Christou, M. (1999). Analysis and control of major accidents from theintermediate temporary storage of dangerous substances in mar-shalling yards and port areas. Journal of Loss Prevention in theProcess Industries, 12, 109–119.
Deaves, D. M., Gilham, S., Mitchell, B. H., Woodburn, P., &Shepherd, A. M. (2001). Modeling of catastrophic flashing releases.Journal of Hazardous Materials, A88, 1–32.
Drogaris, G. (1993). Learning from major accidents involving danger-ous substances. Safety Science, 16, 89–113.
Egidi, D., Foraboschi, F. P., Spadoni, G. E., & Amendola, A. (1995).The ARIPAR project: analysis of the major accident risks connec-ted with industrial and transportation activities in the Ravenna area.Reliability Engineering and System Safety, 49, 75–89.
Green Book (1989). Methods for the determination of possible dam-age. Rep CPR 16E. Voorburg, The Netherlands.
Hubert, P., & Pages, P. (1989). Risk management for hazardousmaterials transportation: a local study in Lyons. Risk Analysis, 9(4),445–451.
Khan, F. I., & Abbasi, S. A. (1997). Risk analysis of an epichlorohyd-rin manufacturing industry using the new computer automated toolMAXCRED. Journal of Loss Prevention in the Process Industries,10, 91–100.

544 F. Rigas, S. Sklavounos / Journal of Loss Prevention in the Process Industries 15 (2002) 531–544
Khan, I., & Abbasi, S. A. (1999). Assessment of risks posed by chemi-cal industries—application of a new computer automated toolMAXCRED-III. Journal of Loss Prevention in the Process Indus-tries, 12, 455–469.
Nivolianitou, S. Z. (1998). Hazard review of a pesticide formulationplant and consequence assessment of accident scenarios in it. Jour-nal of Loss Prevention in the Process Industries, 11, 123–134.
Papazoglou, I. A., Christou, M., Nivolianitou, Z., & Aneziris, O.(1992). On the management of severe chemical accidents,DECARA: a computer code for consequence analysis in chemicalinstallations—case study in Ammonia plant. Journal of HazardousMaterials, 31, 135–153.
Rao, P. G., & Raghavan, K. V. (1996). Hazard and risk potential ofchemical handling at ports. Journal of Loss Prevention in the Pro-cess Industries, 1996, 9(3), 199–204.
Sax, N. I. (1957). Dangerous properties of industrial materials. NewYork: Reinhold Publishing Corporation.
Smith-Hansen, L., & Jorgensen, K. (1994). Combustion products frompesticides and other chemical substances determined by use of DIN53 436. Fire Safety Journal, 23, 51–66.
Yellow Book (1997). Methods for the calculation of physical effects(3rd ed.), Part 2. Rep CPR 14E. Voorburg, The Netherlands.