rising to the challenge - investis cms
TRANSCRIPT

Annual Report & Financial Statements 2009
RISING TOTHE CHALLENGE

2
FINANCIAL HIGHLIGHTSFor the year ended 31 December 2009
2009 2008 % Change
Turnover €1,125.5mn €1,672.7mn -33%
Operating profit €62.7mn €157.1mn* -60%
Profit before tax €56.7mn €68.1mn -17%
Basic earnings 28.7c 26.7c +7%per share
Dividend per share nil 8.0cfor the year
Interest cover 9.4 times 14.6 times(EBITDA/Net Interest)
Gearing ratio 28.1% 57.7%(net debt as %shareholders funds)
* before non-trading items
Kingspan InsulationAngsana Hotel, Dubai, UAE

3
2009
Financial Highlights 2
Chairman’s Statement 5
Chief Executive’s Review 8
Financial Review 16
Business Risk Analysis 22
The Board 26
Directors’ Report 27
Report of the Directors 27Report of the Remuneration Committee 30Report of the Audit Committee 35Corporate Governance Statement 37
Corporate Social Responsibility 40
Statement Of Directors’ Responsibilities 44
Independent Auditors’ Report 45
Financial Statements 47
Consolidated Income Statement 48Consolidated Statement of Comprehensive Income 49Consolidated Statement of Financial Position 50Consolidated Statement of Changes in Equity 51Consolidated Cash Flow Statement 53Company Statement of Financial Position 54Company Statement of Changes in Equity 55Company Cash Flow Statement 56Notes to the Financial Statements 57Group Five Year Summary 98
“Rising to the challenge...”...in the current business climateand the delivery of energy saving buildings.
44
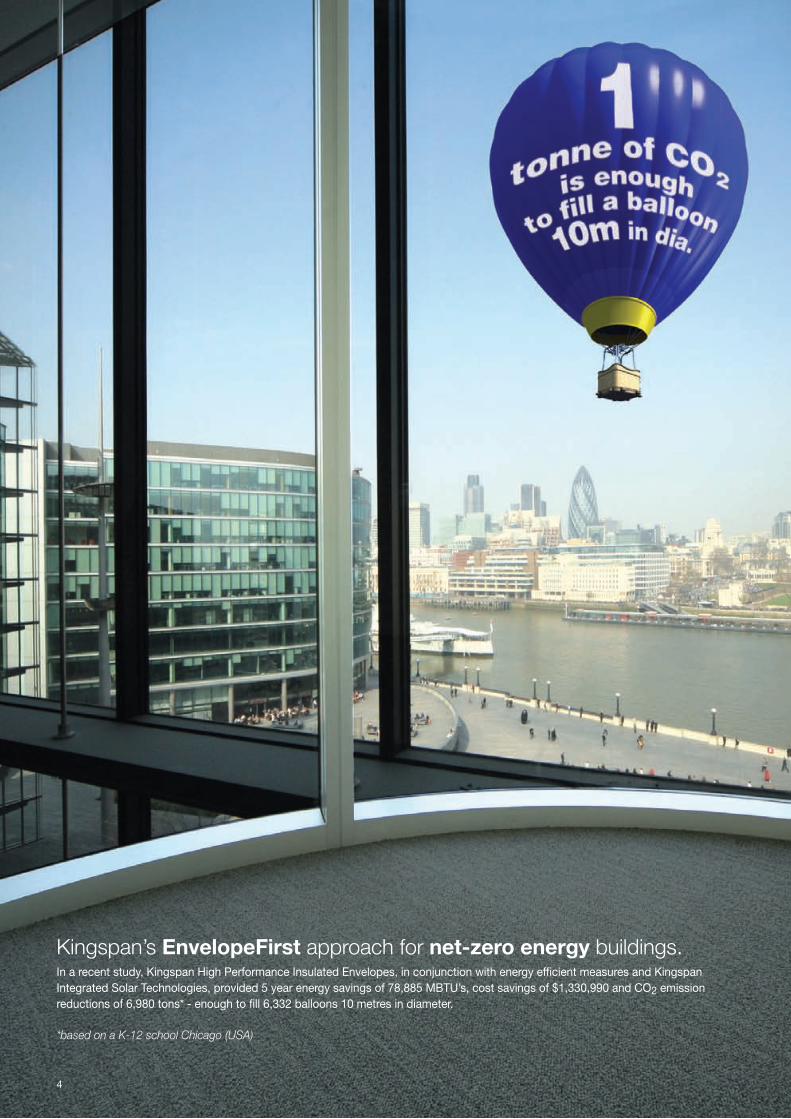
Kingspan’s EnvelopeFirst approach for net-zero energy buildings.In a recent study, Kingspan High Performance Insulated Envelopes, in conjunction with energy efficient measures and KingspanIntegrated Solar Technologies, provided 5 year energy savings of 78,885 MBTU’s, cost savings of $1,330,990 and CO2 emissionreductions of 6,980 tons* - enough to fill 6,332 balloons 10 metres in diameter.
*based on a K-12 school Chicago (USA)

5
A strong balance sheet, a considerably reduced debt, and a substantial
streamlining of operations, were all achieved in the face of the toughest
business environment the Group has ever faced. Certainly 2009 provided
a tough challenge, with turnover dropping 33% to €1.125bn, and
operating profit falling 60% to €62.7mn, but the energy and focus of the
management team in facing these challenges has left Kingspan in very
good shape facing into 2010.
During 2009 Kingspan accelerated itsprogramme of product innovation to bringnew products to market, such as theKingspan powerpanel, a buildingintegrated insulated photovoltaic panel.This is a key element of the Group’s“Insulate and Generate” theme, and isgeared towards investors and buildingoccupiers who increasingly demand higherrenewable content in their building fabric.At the same time, Kingspan has expandedits product offering in several territories. InNorth America, there were encouragingearly signs of market entry for KingspanThermomax solar thermal solutions, and inAustralia the acquisition of AIR-CELLInnovations, the insulation materialbusiness, bolstered our existing rigid boardand panel businesses in that region. Goodprogress was also made during the year inbuilding the Insulated Panels business inNorth America which is now substantiallyintegrated into the Kingspan model. Inparticular, the class leading KingspanBenchmark architectural façade systemwhich has been very successful in the USwill shortly be launched in the WesternEuropean market in 2010.
“...BUILDING INSULATION IS THE MOSTCOST-EFFECTIVE SOLUTION TO REDUCEENERGY AND GREENHOUSE GASES.”Source: McKinsey Global Institute
With building energy standards set toincrease in many of our key markets,including the UK, Western & CentralEurope, the US and Australia, Kingspan willbenefit from its transformed cost structureand from significant efficiencies at its newworld class manufacturing facilities, whenthe upturn in these markets begins take hold.
DividendIn the context of the Company’s focus onreduction of debt and strengthening thebalance sheet, the Board is notrecommending that a final dividend be paidfor the year ended 31 December 2009.However, resumption of a dividend will beconsidered by the Board based onperformance meeting expectations in 2010.
Board changesAfter more than 37 years with Kingspan,Brendan Murtagh has indicated hisintention to retire after this year’s AnnualGeneral Meeting, when his term ofappointment as a non-executive directorexpires. I would like to thank Brendan forhis tremendous contribution to the Groupover those years, both as an executive andlatterly as a non-executive director.
Chairman’s Statement

6
Chairman’s Statement
During the year there were several Boardchanges. Brian Joyce and Eoin McCarthyboth retired as non-executive directors,and Louis Eperjesi resigned as anexecutive director. I thank each of them forthe role they played in the development ofKingspan during their periods of office. Wealso welcomed back Danny Kitchen as anon-executive director, who brings thebenefit of his broad experience and anindependent viewpoint to the Board.These changes reflect our commitment torefresh and strengthen the independentrepresentation on the Board.
Management and employeesI also wish to express my thanks to themanagement and employees throughoutthe Group, for their hard work and focuseddetermination during the year. We arefortunate to have such a high qualitymanagement team leading the business aswe face the tough challenges posed by theglobal economic environment.
To the futureAs a degree of stability now begins toreturn in most of our markets, we lookonce again to drive the business forward.With the global community committing tomore and more energy conservationinitiatives, Kingspan remains firmly focusedon its strategy of providing a range ofenergy efficient and sustainable buildingsolutions. And whilst there remain manychallenges ahead, Kingspan’s solidperformance in 2009 means that it is nowwell positioned to capitalise on futureopportunities as they arise.
Eugene MurtaghChairman1 March 2010

7
2009
Transportation
28%
In the U.S. alone, buildings account for almost 39%of total energy consumption and 38% of CO2 emissions.*
*Source: U.S. Department of Energy, 2009 Buildings Energy Data Book, Section 1.1.1, 2009.
Industry
33%Buildings
39%
Buildings - the biggest consumer of energy
Kingspan InsulationArsenal Emirates Stadium, London, UK
Kingspan EnvelopeFirst:From its position as a global market leader, Kingspan is best positioned toprovide high performance building envelope systems across the worldwideconstruction sector, delivering the largest energy savings and greenhousegas CO2 reductions.

8
Chief Executive’s Review
In the immediate aftermath ofthe international financial crisis,the global economy wasexceptionally weak, particularlyin early 2009. These difficultiestranspired to be a sign of thingsto come and as the yearprogressed, pressures in manysectors continued to mount,and were acutely evident inthe construction environment.However, the closing quartergave some reprieve, andtangible evidence of stabilitybegan to emerge.
The closing quarter of 2009 gave some reprieve,and tangible evidence of stability began to emerge.
It is the ability of a building
to be energy neutral, that is,
the building produces
enough of its own power
so that it does not consume
power from the grid.
Kingspan provideNet-zero energysolutions.
In all, the current environment has beenthe toughest experienced by Kingspan inmodern times. It has necessitated a shiftin management priorities, which wereeffected without impacting the business’longer term positioning within the growingglobal theme of greater energy efficiency,lower emissions, and lower energy costs.
Widespread reorganisation and cost-outprogrammes led to an underlying reductionof €66mn in the Group’s fixed cost basesince peak. Over the past 18 months,more than ten plants were consolidatedinto larger more efficient operations, andthe relentless focus on cash drove areduction in net debt of over €135mn,leaving the balance sheet considerablystronger than a year earlier. The profitperformance of the business naturallysuffered with revenue falling 33% to€1.1bn, but EBITDA and operating profitsof €102.8mn and €62.7mn respectively,were solid given the times.
Operational Performance
− Solid performance in 2009 from the overall Group, despite hostile economic conditions.
− Excellent progress was made in debt reduction, with net debt at year-end of €164.3mn, down from €299.6mn.Operating working capital was €99mn lower than a year earlier.
− Insulation Boards total sales volumes were down 23%, but with growing sales and penetration in Western Europe.
− Insulated Panel sales volumes in the UK, Ireland and Western Europe were down 33%, with particular weakness inthe speculative development segment.
− Insulated Panel sales volumes in North America were down 23%. Architectural façade products remained strongand the former Metecno business performed robustly in the circumstances.
− Central & Eastern Europe panel volumes were also weaker, down 25%. A substantial reorganisation of this unit wasimplemented, which will be completed in H1 2010.
− Access Floors sales volumes were down 31% globally, however margins improved from 14% to 17.5%.
− Across the Group, fixed cost reductions in the year of €50mn brings the total since peak to €66mn.This process is largely complete.
− Total investment in the year was €48.1mn. The main projects were the completion of a new Kooltherm® phenolicinsulation facility in the Netherlands, and the completion of a new solar thermal collector plant in Northern Ireland.The Group also entered the Australian thermal insulation market with the acquisition of AIR-CELL Innovations inDecember, complementing Kingspan’s already growing Insulated Panel business in that region.
What is net-zeroenergy?

9
2009
Insulated PanelsSales volumes in the UK suffered heavilyin the early part of the year, but broadlyflattened out for the latter six months. In all,sales volumes were down 35%, and orderintake was down 34% on prior year.This downward spiral eased towards yearend and was reflected in improved orderintake. A significant portion of the activitywas both food and retail led, whilespeculative development, a key driver inthe past, practically ceased. The result wasa smaller average order size, and a shiftingmix which in future will see a growingportion of sales in the higher value“Benchmark” architectural façade systems.This product suite, already marketed inNorth America, has now been tailored forthe European markets.
2009’s PERFORMANCE BY OPERATIONS SEGMENT WAS AS FOLLOWS:
This higher value-added range will belaunched by mid 2010 and we anticipatethat the medium to longer term penetrationgrowth potential is significant. Nearer term,the project pipeline has trended verymarginally up in recent months, quotationlevels are robust, and order intake in thefirst two months of 2010 is up 20% versus2009. Volumes in the Benelux were down14%, reflecting the relatively stableenvironment in the region, which appearsto be continuing into 2010.
Ireland volumes, now representing 5% ofthis category’s revenue, continued to reach
new lows as the year drew to a close.Newbuild activity in this sector has fallen tolevels not seen in Ireland for 30 years, asa direct result of excess non-residentialinventory resulting from the overbuild in2007 and early 2008. The strangleholdcaused by lack of general business lendingwill compound this trend for some time,and is evidenced by declining architects’workloads. Order intake levels in thissector were down 60% year on year,or down 73% since the peak of 2007.
Sales % of Group Turnover2009 2008 % change 2009 2008
€593.9mn €862.1mn -31% 53% 51%
Imag
e co
urte
sy o
f Gaz
eley
and
Cen
tral
Pho
togr
aphy
Insulated Insulation Environmental AccessSegment Result Panels Boards & Renewables Floors Total(profit before finance costs) €’mn €’mn €’mn €’mn €’mn
Trading profit 26.3 13.5 1.8 25.5 67.1Intangible amortisation (2.8) (0.7) (0.8) (0.1) (4.4)Operating profit 2009 23.5 12.8 1.0 25.4 62.7Finance costs (net) (6.0)Profit for the period before tax 56.7Income tax expense (8.7)Net profit for the year 48.0
Kingspan Insulated PanelsChatterley Valley, UK
INSULATED PANELS

10
The fundamental overhaul of this business’cost base and work practices will beessential in ensuring its longer term recovery.
Across Central & Eastern Europe, salesvolumes were down 25% in 2009, a patternwhich also eased in the final quarter.The business’ performance in Poland andGermany was relatively strong, with volumesin these markets down only slightly. CzechRepublic, Hungary, the Baltics, and Romaniawere exceptionally weak as funds availabilityand confidence both took a knock.Coinciding with this weakness has beenoverinvestment in the industry’s capacitylevels, which is likely to continue exertingpressure on margins for the foreseeablefuture. In light of this, more new productintroductions and a longer term move into thehigher end insulated architectural façades willbe key. In the meantime, the order book atyear end stood 3% lower than a year earlier,
although quarter one 2010 is expected to besomewhat down year on year due mainly toadverse weather conditions.
In Turkey and the Middle East, the operatingperformance of the business improved duringthe year, largely due to enhanced margins.Volumes were similar to a year earlier, and therun rate is likely to remain at similar levels forat least the first half of 2010.
In North America, non-residentialconstruction tapered off sharply during theyear, and underlying sales were down 23%on 2009. Volumes in Canada were moreseverely impacted, a situation that wasexacerbated by the fall-off in developmentsin the oil producing regions. In the US,architectural sales were strong andnotwithstanding the pressures on volume,it was a year of solid progress in building theteam and the model for the longer term.
Kingspan InsulationDundrum Shopping Centre, Ireland
Chief Executive’s Review

11
2009
Kingspan’s thermally efficient airtight building envelope systems, in conjunction withKingspan renewable technologies, are ideally suited to the refurbishment of existingbuildings, breathing new life and creating modern affordable energy efficient buildings.
Kingspan Insulated PanelsCaterpillar, US
23% 31%
46%
Kingspan Modernisation Programmefor existing building stock
• 1.8 million buildings• 18% of total UK emissions CO2• 300 TWh per annum energy usage
UK building stock
Pre 1940
1940-1985
1985 onwards
Source: Carbon Trust, 2009
Higher energy usagedue to age ofnon-domesticbuilding stock

12
Chief Executive’s Review
Kingspan High Performance Insulated Panels and Boards are already saving:
5,060 GWh per annum of heating energy.
1,037,000 tonnes per annum of CO2 emissions,equivalent to 228,297 balloons.
Future savings:Governments have set ambitious, legally binding targets to reduce greenhouse gas emissions,therefore significant energy efficiency improvements for new and existing buildings are requiredto meet these goals.
Kingspan’s high performance insulated products and renewable technologies are ideally positionedto deliver these net-zero energy and CO2 objectives.
Base building -25%*
20102006 2013 2016 2019
-44%* -70%*
ZeroCarbonBuildings*
Delivering low / zero energy and CO2 emission buildings
Kingspan ‘EnvelopeFirst’ approach
Energy efficiency measures
Kingspan renewable technologies * Carbon emission reductionsrelate to UK Governmentlegislation for non-domesticbuildings.

13
2009
In 2010, the focus will be on achievinghigher levels of operational efficiency in theUS facilities, fully commissioning the twonew plants in Canada, and continuing todrive the brand through the distinctlydifferent channels of Architectural,Commercial and Industrial, and ColdStorage segments. 2010 is also likely tosee the ratification of what will essentiallyamount to the first ever US wide buildingenergy code. The Department of Energy’sNet Zero Energy programme will effectivelyestablish an allowable base building energyperformance that will ultimately culminatein grid neutral buildings by 2025.This legislative roadmap presents greatopportunities for Kingspan’s model.
Australia and New Zealand showed animproved performance in 2009 over prioryear, and the current year should buildupon that progress.
KINGSPANGLOBALENERGY SAVINGS
In Britain, newbuild housing activity wasapproximately 50% lower than it has beenfor decades. In the Insulation businessvolumes were down 25%, a better outturnthan for the general market activity.Growing penetration of rigid highperformance insulation was furthercomplemented by Kingspan’s Kooltherm®
phenolic insulation which continued togrow its underlying share of the market.From October 2010, building codes in theUK will be upgraded once again, and thetargeted decreases in carbon emissionsfrom new buildings will be in the order of25%. The related increase in thermalinsulation required will be a similarpercentage, and will be implemented frommid 2011. As the codes become morestringent, the attractiveness of thinner andmore thermally efficient rigid insulation likeKooltherm® becomes greater.
In Ireland (including Northern Ireland),the Insulation Boards business is primarilyexposed to the residential market in bothnewbuild and, increasingly, RMI.
Refurbishment activity provided a solidbase for the business in 2009 given thecollapse of the newbuild segment. Thispattern is likely to prevail over the mediumterm, and much of the product strategy willbe focused on the growing refurbishmentsegment.
Sales % of Group Turnover2009 2008 % change 2009 2008
€215.3mn €345.2mn -38% 19% 21%
INSULATION BOARDS

14
Chief Executive’s Review
Access FloorsGiven the late cycle nature of officeconstruction, the weakness of the generaleconomy wasn’t particularly evident in thisbusiness during the first half of 2009.Underlying conditions were deterioratinghowever, and in the second half, the yearon year volume decline accelerated in bothNorth America and Europe. Overall, firsthalf volumes were down 25% on prior year,and the second half down 36%.
Mainland Europe was comparatively stableduring 2009, and volumes were down 7%.At present, the business’ primary marketson the continent are the Netherlands,Belgium and Germany. The productsmarketed are rigid foam, produced in theUK, and Kooltherm®, produced in theNetherlands. This latter facility wascommissioned in late 2009, and willpredominately serve the German andDutch markets. The product is beingfocused most specifically on the externalwall insulation refurbishment opportunity inGermany, and in the future, across Central& Eastern Europe. The current incumbentin these markets is fibrous insulation, likestone and glasswool, which will beincreasingly inefficient given its relativethickness and poor over-life performance.The penetration in Continental Europe ofhigh performance rigid insulation iscurrently less than 5%, offering clearopportunities for this business to developand grow.
Towards the end of the year, AIR-CELLInnovations in Australia was acquired byKingspan. This business provides anexcellent platform and network from whichto build our presence across Australia andNew Zealand, not only with its own rangeof insulations, but also with the broadrange of products that Kingspan will bringto the venture.
Environmental & RenewablesWith approximately 75% of this division’ssales coming from the UK and Ireland, thisbusiness bore the brunt of the recessionaryslide in both markets.
This business’ product range is extensive,and includes solar thermal hot watersystems, heat pumps, rainwaterharvesting, water storage, fuel storageand wastewater treatment systems. Many are destined for the residentialsector, hence the current pressures onvolumes. These pressures will ease as theUK housing market, in particular, begins torecover, and evidence of this was alreadyvisible towards the end of 2009.
During the first quarter of 2010, a newentirely automated manufacturing facilityfor the production of solar thermalcollectors is being commissioned inNorthern Ireland. The plant will produce thehighly effective solar thermal vacuum tubesmore efficiently than any other comparableoperation globally, and the current marketfocus is in Mainland Europe and North
America, where our routes to market havedeveloped rapidly in the past year.
On an underlying basis, this divisionreturned a profit although as in other years,the figures are substantially impacted bythe ongoing polyethylene raw materialrelated warranty issues dating back to2002/2003. Proceedings have been issuedagainst the supplier of the material,Borealis, based on specialist legal andtechnical advice, in which the full recoveryof past and future losses is being sought.A conclusion to the case is anticipatedsometime in 2011.
Kingspan Insulated PanelsPhoenix Palace, UK
Sales % of Group Turnover2009 2008 % change 2009 2008
€168.7mn €266.7mn -37% 15% 16%
ENVIRONMENTAL & RENEWABLES
INSULATE AND GENERATE
UK Feed-in Tariff (FiT) Solar Panel Generation Incentive Scheme
Feed-in Tariff (FiT) for renewable electricity comes into force in the UK on the1 April 2010. The FiT is the rate that the energy companies will pay to thosegenerating electricity from a renewable source, for example:
>4 - 10kW @ 36.1 pence per kWh*
>10 - 100kW @ 31.4 pence per kWh*
>100kW - 5MW @ 29.3 pence per kWh*
The FiT rates are paid regardless of whether building owners/occupiers use theelectricity or export it into the national grid. The FiT will be a significant marketdriver for the Kingspan powerpanel.
* Figures based on year one of a 25 year tariff lifetime with tariffs inflating annually.

15
2009
We expect office construction starts will hita low in 2010, driven largely by the excesscapacity currently in the market. Vacancyrates in major US and European cities areat a five-year high, and developmentactivity will therefore remain weak beforeany resumption of growth, possibly in late2011 or 2012.
Despite the weakening completions,Kingspan’s businesses performedexceptionally well during 2009, andmargins were strong at 17.5%. Firmmanagement of controllable costs was thelargest contributor to this, a theme that willcontinue to run through the current yearthroughout the Group.
Capital Expenditureand AcquisitionsTotal investment during the year was€48.1mn. This figure is significantly lowerthan that of recent years during which theGroup substantially expanded its overallcapacity, and it is above the run rateanticipated to maintain the business duringthe current year.
Investments of note in the year were thecompletion of the Kooltherm® insulationfacility in the Netherlands, the completionof a new, relocated insulated panel plant inToronto, Canada, and a new relocatedsolar thermal facility in Northern Ireland.In December, the acquisition of AIR-CELLInnovations in Australia was alsocompleted.
Looking AheadIn the near term, it is likely that theoverall building environment will be morepredictable than in the recent past.The virtual collapse in activity experiencedin late 2008 and 2009 should be replacedwith a more stable, albeit notably lowerbase from which to build businesses onceagain.
The Group has and will continue to benefitfrom its overhauled cost structure, and itsmore streamlined operations which are theresult of substantial internal consolidationover the past two years. This has beenachieved without damage to the coretenets of Kingspan’s competitiveadvantage being undermined.
An increased focus on a number of newproducts which were brought to marketduring this period, in addition to thebroader palette of Kingspan solutions,will continue to generate long termpotential across a wider geographythan at any time in the past.
Notwithstanding these opportunities,the current year will continue to posechallenges for Kingspan as someeconomies climb slowly out of recession,leaving behind a construction environmentthat has not yet fully caught up with thegeneral contraction of last year. In somemarkets building activity is therefore stilllikely to have further to fall.
Globally, the energy conservation agendacontinues to gain impetus, which willbecome more evident when furthertangible national and international energysaving commitments are firmed up.Kingspan’s strategy remains fully alignedwith that global theme.
Gene MurtaghChief Executive1 March 2010
Sales % of Group Turnover2009 2008 % change 2009 2008
€147.6mn €198.7mn -26% 13% 12%
Kingspan Insulated PanelsHillsborough Congress Center, US
ACCESS FLOORS

16
Financial Review
The gross margin (gross profit as %of turnover) was 27.4% for the year,compared to 27.9% in 2008. There wasa slight improvement in H2 over H1(H1 27.2%, H2 27.4%) as raw materialprices stabilised.
Fixed overheads were reduced byapproximately €50mn in the yearcompared to 2008. This is a like-for-likecomparison at constant currency,excluding the acquisition of the Panelsbusiness in the United States, and is areduction of €66mn from the peak.There were rationalisation costs in the yearof €6.5mn which are included in operatingcosts.
The weakness of Sterling against the Euro(average rate 2008: 0.796 v average rate2009: 0.8917) has had a negative impacton the translation of results whencompared with last year. The overall impactof all currency movements on Euroreported turnover was €71mn andoperating profit was €4mn.
There was capital investment of €48.1mnin the year including the acquisition ofAIR-CELL Innovations. Based in Perth inAustralia, AIR-CELL is a market leading
distributor of flexible reflective insulation foilproducts with inter-state presence acrossthe Australian market. Other capitalinvestment mainly related to thecompletion of projects from 2008 andmaintenance capital. Operating workingcapital at year end of €123.3mn wasreduced by €99mn compared to 2008,due to increased focus and lower activitylevels.
DividendThe Board is recommending that no finaldividend in respect of 2009 be paid.Resumption of dividend payments will beconsidered by the Board in 2010 in lightof debt reduction achieved in 2009, andongoing cash flow and operatingperformance reaching expectations.
Segment ReportingFollowing on from the restructuring of thebusinesses and the requirements ofIFRS 8, the segmental reporting of theresults has been changed. From 1 January2009 the following four business segmentsare reported on:
Insulated PanelsManufacture of insulated panels, structuralframing and metal façades;
Insulation BoardsManufacture of rigid insulation boards,building services insulation and engineeredtimber systems;
Environmental & RenewablesManufacture of environmental, pollutioncontrol and renewable energy solutions;
Access FloorsManufacture of raised access floors.
INCOME STATEMENT
2009 2008€’mn €’mn
Sales Revenue 1,125.5 1,672.7Gross Profit 308.9 467.5Gross Profit % 27.4% 27.9%Operating Profit (241.8) (305.8)
Trading Profit 67.1 161.7
Amortisation (4.4) (4.6)
Non Trading Items - (75.1)
Operating Profit 62.7 82.0
OVERVIEW2009 saw a fall in Group turnover of 33% and a decrease in operatingprofits (before non-trading items) of 60%. At a constant currency,sales were down 28% and operating profits were down 57%.The trend in sales has improved somewhat being down 35% in H12009 vs H1 2008 and 30% in H2. Overall from peak (H1 2007) to trough(H2 2009), Group sales suffered a decline of 42%. Given the Group’srelatively high operational gearing in certain products, this fall-off insales has had a disproportionate impact on operating profits, whichwas mitigated somewhat by a rapid response through fixed costreductions and rationalisation of some manufacturing facilities.
17
2009
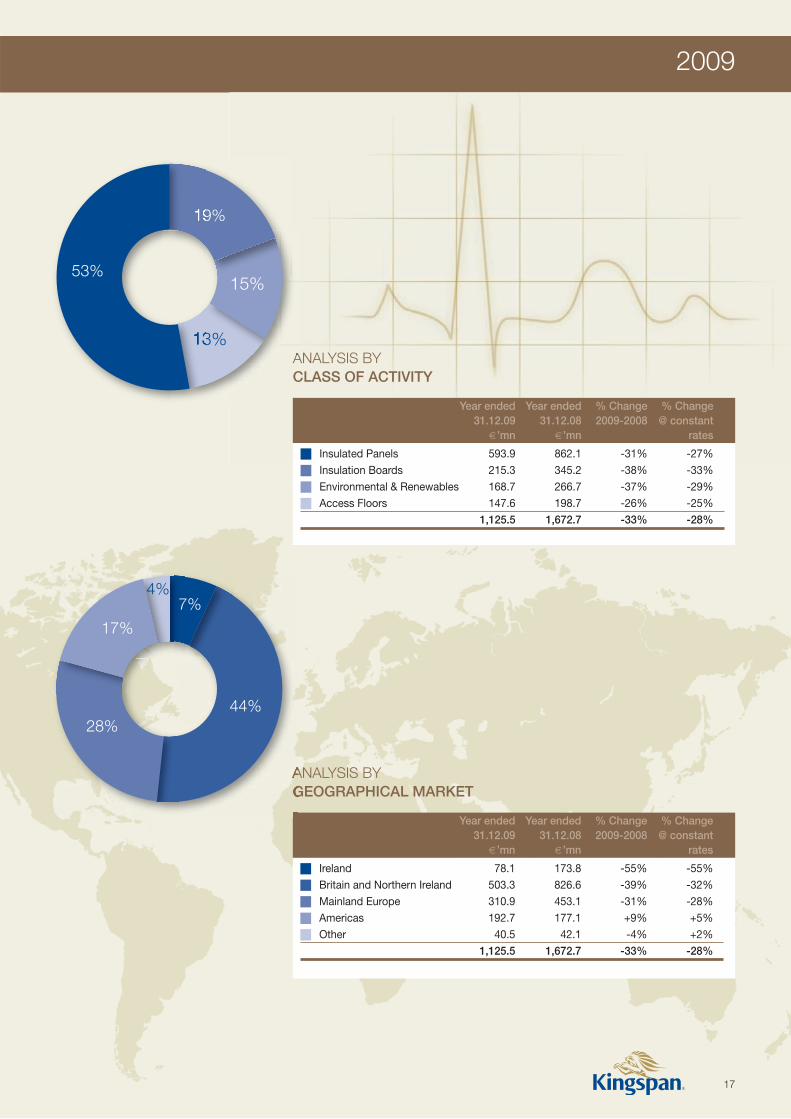
Year ended Year ended % Change % Change31.12.09 31.12.08 2009-2008 @ constant
€’mn €’mn rates
� Insulated Panels 593.9 862.1 -31% -27%
� Insulation Boards 215.3 345.2 -38% -33%
� Environmental & Renewables 168.7 266.7 -37% -29%
� Access Floors 147.6 198.7 -26% -25%
1,125.5 1,672.7 -33% -28%
Year ended Year ended % Change % Change31.12.09 31.12.08 2009-2008 @ constant
€’mn €’mn rates
� Ireland 78.1 173.8 -55% -55%
� Britain and Northern Ireland 503.3 826.6 -39% -32%
� Mainland Europe 310.9 453.1 -31% -28%
� Americas 192.7 177.1 +9% +5%
� Other 40.5 42.1 -4% +2%
1,125.5 1,672.7 -33% -28%
ANALYSIS BY CLASS OF ACTIVITY
ANALYSIS BY GEOGRAPHICAL MARKET
19%
15%
13%
53%
7%
44%28%
17%
4%

18
Financial Review
Currency Volume Price & Mix Total
-4% -33% -3% -40%
Sales Trends
Insulated Panels in the UK, Irish and Western European markets
Up to December 2008 Insulated Panelsand Insulation Boards were reported on asone combined segment. In addition, Offsite& Structural was reported as a segment inits own right. Following the restructuring ofthis business unit, the part of Offsite &Structural that relates to timber framingand engineered timber systems has beentransferred to Insulation Boards and therest of the business (relating to metalframing, façades and structural products)has been transferred to Insulated Panels.
Note 6 of the supplementary information inthe attached accounts gives furtheranalysis of the segments and the rest ofthis report deals with the results analysedunder the new segments andcorresponding comparisons.
TurnoverTurnover for the year ended 31 December2009 was €1,125.5mn, a drop of 33% on2008. The acquisition of Metecno Inc. inAugust 2008 generated incrementalturnover in 2009 of €41.3mn. In 2009,the decline in the value of Sterling againstthe Euro continued and the average rate in2009 was 0.8917 versus an average rate in2008 of 0.796. Approximately 45% ofGroup turnover was in the Sterling areaand this, combined with movements inaverage exchange rates for other operatingcurrencies, resulted in an adversetranslation impact on turnover of €71mn.Stripping out the impact of the adverseeffect of movement in translation and theincremental impact of the acquisition ofMetecno Inc., underlying turnover wasdown by 31%. This reduction results froman overall volume decline of approximately25% and price/product mix decline of 6%.
Trading ProfitTrading profit, before amortisation and non-trading items, was €67.1mn compared to€161.7mn in 2008, a decline of 59%.There was a negative impact of thetranslation of trading profits from non-Eurocurrencies at the average exchange ratesof €4mn. Stripping out the translationimpact the decline in operating profit was57%.
The return on sales in 2009 was 5.6%compared to 9.4% in 2008.
Currency Volume Price & Mix Total
-5% -25% -3% -33%
Insulated Panels in Central & Eastern European markets
Currency Volume Acquisitions Total
+5% -23% +62% +44%
Insulated Panels in the North American markets
Currency Volume Price & Mix Total
-6% -23% +4% -25%
Insulation Boards
Currency Price & Volume Total
-3% -69% -72%
Engineered Timber Systems
Currency Price & Volume Disposals Total
-8% -21% -8% -37%
Environmental & Renewables
Currency Volume Price & Mix Total
-1% -31% +6% -26%
Access Floors
• Sales were down 40% for the year. Volume, down 33% overall, was 37% lower in the firsthalf and 27% in the second half.
• Order intake was down 40% in the first half, down 18% in the second half and down 32%for the full year.
• Sales were down 33% for the year. Volume was down 28% in the first half and down 21%in the second half, down 25% overall.
• Order intake was down 28% year-on-year being down 40% in the first half but down 11%in the second half.
• Metecno Inc. was acquired by the Group in August 2008. Turnover for the year 2009 was$111.2mn (€79.7mn), down 25% on the same period in 2008.
• In Canada sales were down approximately 23% year-on-year.
• Sales of Off-site/Engineered Timber Systems were down 72% versus 2008 (down 69%on constant currency).
• Sales were down 37% of which price/volume was down 21% year-on-year, being down23% in the first half and 18% in the second half.
• Sales were down 26% in the year. 31% of this reduction was represented by volume,being down 25% in the first half and down 36% in the second half.
• Order intake, declined by 25% in the North American market and by 44% in the Europeanmarkets compared to 2008.
With the exception of Access Floors, which is mainly into a late cycle market, the downwardtrend in order intake and sales showed a significant abatement in the second half of the year,continuing into 2010.
• Insulation sales volumes were down 23% for the year, down 32% in the first half, anddown 13% in the second half. This decline in volumes was offset by increased value ofsales of 4%.
19
2009
Cost of sales comprises variable costs i.e.raw material and direct labour plus otherproduction overheads which are fixed orsemi-fixed. Variable costs as a percentageof sales reduced by approximately 1%compared to last year. While productionoverheads were reduced by €28mn, as apercentage of sales they increased byapproximately 1.5%. As a result the grossprofit at €308.9mn representing a return of27.4% on sales, compares to 27.9% lastyear.
Operating costs (including amortisation)at €246.2mn are down by €64.2mncompared to 2008. Excluding the effectof the acquisition of Metecno on 2009overheads and the effect of exchange ratemovements between the two periods,the net overhead reduction in the yearwas €50mn.
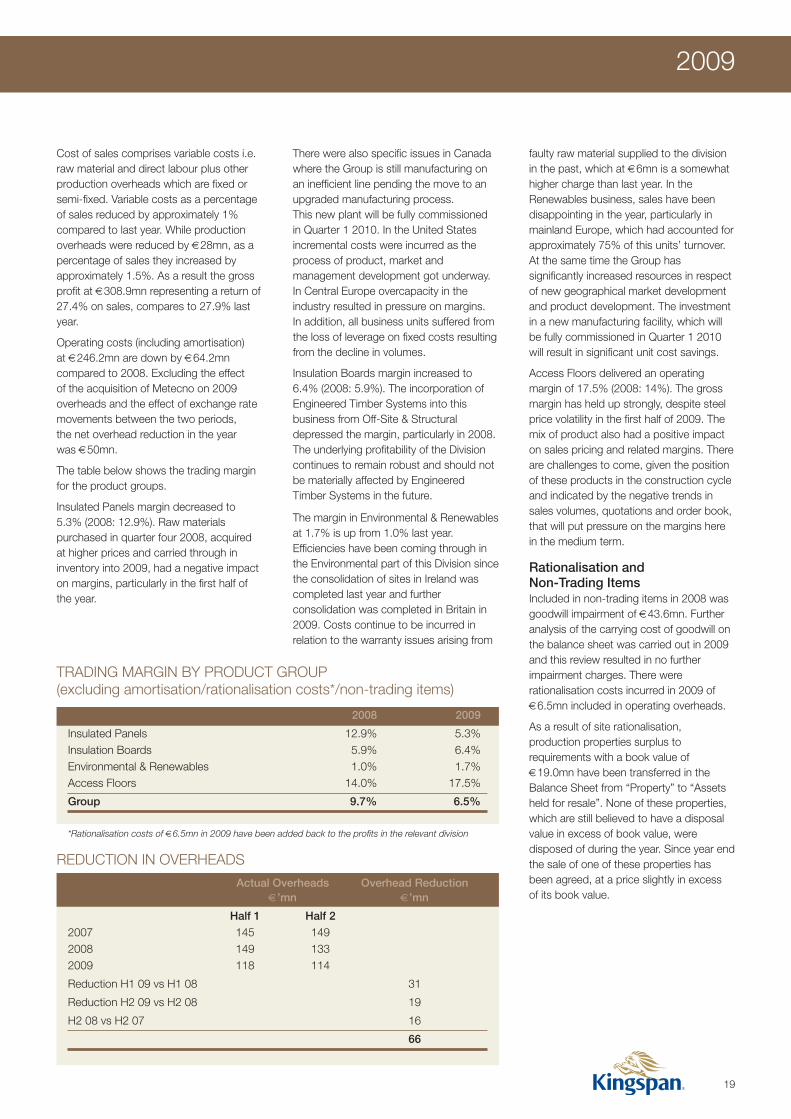
The table below shows the trading marginfor the product groups.
Insulated Panels margin decreased to5.3% (2008: 12.9%). Raw materialspurchased in quarter four 2008, acquiredat higher prices and carried through ininventory into 2009, had a negative impacton margins, particularly in the first half ofthe year.
The margin in Environmental & Renewablesat 1.7% is up from 1.0% last year.Efficiencies have been coming through inthe Environmental part of this Division sincethe consolidation of sites in Ireland wascompleted last year and furtherconsolidation was completed in Britain in2009. Costs continue to be incurred inrelation to the warranty issues arising from
faulty raw material supplied to the divisionin the past, which at €6mn is a somewhathigher charge than last year. In theRenewables business, sales have beendisappointing in the year, particularly inmainland Europe, which had accounted forapproximately 75% of this units’ turnover.At the same time the Group hassignificantly increased resources in respectof new geographical market developmentand product development. The investmentin a new manufacturing facility, which willbe fully commissioned in Quarter 1 2010will result in significant unit cost savings.
Access Floors delivered an operatingmargin of 17.5% (2008: 14%). The grossmargin has held up strongly, despite steelprice volatility in the first half of 2009. Themix of product also had a positive impacton sales pricing and related margins. Thereare challenges to come, given the positionof these products in the construction cycleand indicated by the negative trends insales volumes, quotations and order book,that will put pressure on the margins herein the medium term.
Rationalisation andNon-Trading ItemsIncluded in non-trading items in 2008 wasgoodwill impairment of €43.6mn. Furtheranalysis of the carrying cost of goodwill onthe balance sheet was carried out in 2009and this review resulted in no furtherimpairment charges. There wererationalisation costs incurred in 2009 of€6.5mn included in operating overheads.
As a result of site rationalisation,production properties surplus torequirements with a book value of€19.0mn have been transferred in theBalance Sheet from “Property” to “Assetsheld for resale”. None of these properties,which are still believed to have a disposalvalue in excess of book value, weredisposed of during the year. Since year endthe sale of one of these properties hasbeen agreed, at a price slightly in excessof its book value.
Actual Overheads Overhead Reduction€’mn €’mn
Half 1 Half 22007 145 1492008 149 1332009 118 114
Reduction H1 09 vs H1 08 31
Reduction H2 09 vs H2 08 19
H2 08 vs H2 07 16
66
2008 2009
Insulated Panels 12.9% 5.3%Insulation Boards 5.9% 6.4%Environmental & Renewables 1.0% 1.7%Access Floors 14.0% 17.5%
Group 9.7% 6.5%
*Rationalisation costs of €6.5mn in 2009 have been added back to the profits in the relevant division
TRADING MARGIN BY PRODUCT GROUP(excluding amortisation/rationalisation costs*/non-trading items)
There were also specific issues in Canadawhere the Group is still manufacturing onan inefficient line pending the move to anupgraded manufacturing process.This new plant will be fully commissionedin Quarter 1 2010. In the United Statesincremental costs were incurred as theprocess of product, market andmanagement development got underway.In Central Europe overcapacity in theindustry resulted in pressure on margins.In addition, all business units suffered fromthe loss of leverage on fixed costs resultingfrom the decline in volumes.
Insulation Boards margin increased to6.4% (2008: 5.9%). The incorporation ofEngineered Timber Systems into thisbusiness from Off-Site & Structuraldepressed the margin, particularly in 2008.The underlying profitability of the Divisioncontinues to remain robust and should notbe materially affected by EngineeredTimber Systems in the future.
REDUCTION IN OVERHEADS

20
Financial Review
Net Finance Costs The net finance costs in the year were€5.9mn. This comprises interest paid orpayable of €12.7mn and interest receivedof €1.8mn giving a net interest charge of€10.9mn. In addition there was atranslation gain on the private placementdebt of €11.8mn and the fair valuemovement on the related cross currencyinterest rate swaps resulted in a loss of€6.9m. These two non-cash adjustments,a net credit of €4.9mn, have been creditedoff the net interest charge of €10.9mn.
The circumstances of this credit to theprofit and loss account are set out below:
The Group had a private placement ofUS$158mn fixed interest 10-year bulletrepayment loan notes maturing on29 March 2015 and US$42mn fixedinterest 12-year bullet repayment loannotes maturing on 29 March 2017.The Group, being Euro denominated andwith mostly Euro cash flows, wished toeconomically hedge the risk and thereforeentered into US dollar fixed/Euro fixedcross currency interest rate swaps for thefull amount of the private placement withsemi-annual interest payments.The weighted average interest rate is4.15%. The maturity date of these crosscurrency interest rate swaps is identical tothe maturity date of the private placementdebt.
These cross currency interest rate swapshad not been designated under the IAS39hedge accounting rules. Consequently thechange in fair value of the cross currencyinterest rate swaps is recognised in theIncome Statement (€6.9mn above)and the translation gain on the privateplacement debt is also recognised in theIncome Statement in accordance withIAS21 (€11.8mn above).
On 26 February 2010, these crosscurrency interest rate swaps weredesignated under IAS39 hedge accountingrules, thus removing any significant volatilityfrom reported earnings.
2009 2008€’mn €’mn
Operating profit 62.7 82.0
Depreciation 35.8 40.6
Amortisation 4.3 4.6
Working capital decrease/(increase) 105.4 43.6
Pension contributions (2.9) (2.6)
Interest (12.9) (12.7)
Taxation paid (10.1) (18.1)
Others 5.4 60.3
Free cash 187.7 197.7
Acquisitions (8.0) (92.6)
Net capital expenditure (45.9) (97.5)
Dividends paid (0.3) (42.3)
Share buy-back - (32.6)
(54.2) (265.0)
Cash flow movement 133.5 (67.3)
Debt translation 1.8 (7.3)
Decrease/(Increase) in net debt 135.3 (74.6)
Net debt at start of year (299.6) (225.0)
Net debt at end of year (164.3) (299.6)
TaxationTaxation provided for on profits is €8.7mnafter adjustment in respect of prior years of€6.3mn, or a composite rate of 15.4% ofprofit. This compares with an equivalentrate of 14.6% in 2008.
Earnings Per Share Basic earnings per share at 28.7 €centcompares with 26.7 €cent last year, anincrease of 7%. This includes the net creditof €4.9mn in relation to the cross currencyswaps and revaluation of the US$ loandescribed above. In the absence of thiscredit the underlying earnings per share inthe year was 25.7 €cent, a fall of 4% on2008.
The Group’s shares traded in a range of€2.02 to €7.00 during 2009 and at yearend the share price was €6.00.
Funds FlowThe table below summarises the Group’sfunds flow for 2009 and 2008:
Earnings before finance costs, tax,deprecation, amortisation (EBITDA) andbefore Non-Trading Items was €102.8mn(2008: €202.3mn). In 2009, the Groupdelivered free cash flow of €187.7mn.This included a positive contribution of€105.4mn from working capitalreductions. This was used to fundinvestment of €8.0mn in acquisitions andnet capital expenditure of €45.9mn.
Net debt, including amounts outstanding inrespect of acquisitions, at the end of yearwas €164.3mn, a decrease of €135.3mnon 2008.
Operational working capital at the year endwas €123.3mn (2008: €222.3mn),a reduction of €99mn and represented11.0% of turnover (2008: 13.3%).Approximately €58mn of this reductionwas due to the fall off in the level of activityand the balance resulted from improvedmanagement of the components ofworking capital. There can be expected tobe some increase in the general level ofworking capital requirements during 2010but the target remains to manage this onaverage at about 15% of sales.
GROUP FUNDS FLOW

21
2009
Financial Performance Indicators There are three principle financialcovenants relating to the funding facilities:EBITDA/net interest cover of not lower than4 times; Net Debt/EBITDA no higher than3.5 times; Net Assets greater than€400mn. These covenants are tested atJune and December each year.At 31 December 2009 the Group wascomfortably within these covenants withinterest cover of 9.4, Net Debt/EBITDA of1.6 and Net Assets of €585.5mn.
Some key financial performance indicatorswhich measure performance and thefinancial position of the Group are set outin the table below.
Pension Deficit The Group has three legacy defined benefitpension schemes in the UK, two of whichwere merged during the year.These schemes have been closed and theliability relates only to past service. Detailson the movement during 2009 on thescheme deficits are set out below:
SummaryThe Group goes into 2010 with a strongbalance sheet, with a streamlined businessand a business model very much intact.There is capacity in the Group to serviceturnover of a figure in the order of €2bnwithout any significant capital investment.Given the operational leverage in thebusiness, in the short term any incrementalincrease in sales should be relativelyprofitable. The Group continues to investselectively in product, process and marketdevelopment and will be ready to capitaliseon any up-tick in markets and anyopportunities that arise.
Dermot MulvihillFinance Director1 March 2010
31.12.09 31.12.08€’mn €’mn
Cash and cash equivalents 83.9 75.3
Bank debt < 1 year (31.9) (16.8)
Private placement debt > 5 years (151.4) (151.4)
Bank debt 2-5 years (61.6) (194.0)
Contingent deferred consideration (3.3) (12.7)
Total Net debt (164.3) (299.6)
2009 2008 2007
EBITDA/interest cover 9.4x 14.6x 22.8xNet debt/EBITDA 1.6x 1.48x 0.79xEffective tax rate 15.4% 14.6%* 16.4%Net debt as % of total equity 28.1% 57.7% 33.4%Return on capital employed 8.4% 19.2% 26.4%Return on Equity 8.6% 7.6% 30.7%Gross margin 27.4% 27.9% 30.2%Trading margin 6.5% 9.7% 12.9%
*yoy rate is 14.6%, including non-trading costs the rate was 35.4%
€’mn
Opening net deficit (3.7)
Translation (0.32)
Contributions paid 2.9
Actuarial gains/(losses) (3.9)
Net finance (charge)/credit (0.08)
Closing deficit (5.1)
NET DEBT
FINANCIAL PERFORMANCE INDICATORS
PENSION DEFICIT

22
Business Risk Analysis
Foreign exchange riskThere are three types of foreign exchangerisks to which the Group is exposed:
1. Transactional - where a business unit hasinput costs or sales in currency other thanits local currency; 2. Translational - whereprofits are earned in a currency other thanEuro, which is the reporting currency for theGroup; and 3. Balance Sheet - where theGroup has net assets in non-Eurocurrencies. The first two affect the Earningsof the Group and the latter goes directly toReserves and affects the Net Assetsposition.
Transactional - transaction exposures areinternally hedged as far as possible and tothe extent that they are not, such materialresidual exposures are hedged on a rolling12 month basis. Based on current cash flowprojections for the existing businesses to31 December 2010, it is estimated that theGroup will have surplus sterling ofapproximately £44mn which will be requiredto be converted to Euro during the year.
At the current date £26mn, or 60% of thesurplus, has been sold forward at anaverage rate of 0.8840 compared to theaverage rate in 2009 of 0.892. The Groupwill also need to sell the equivalent ofUS$12mn in Sterling for US Dollar and atthe current date this amount wassubstantially hedged at an average rate of1.58 compared to the average rate in 2009of 1.395.
Translational - it is Group policy not to hedgetranslational exposure, which is effectively anon cash transaction in the accounts. Therewas a negative impact on non-Euro profitsof circa €4mn due to adverse movements inaverage rates used for translation in 2009versus 2008.
Funding and liquidity risksThe Group operates a prudent approach toliquidity management using a mixture oflong-term debt together with short-termdebt, cash and cash equivalents, to meet itsliabilities when due. This is in addition to theGroup’s high level of free-cashflowgeneration.
The Group’s core funding is provided by aprivate placing of $200mn converted into€151mn at the time of the placing. Of thisdebt, €119mn (79%) matures in March2015 and the balance in March 2017.The Group also has a five year committedbanking facility of €330mn which was put inplace in September 2008. At year end thePrivate Placement debt was drawn down infull and €56.8mn of the banking facility wasdrawn. The Group also has in place anumber of uncommitted bilateral workingcapital/overdraft facilities amounting to circa€65mn at year end.
The Group’s committed facilities are subjectto covenants which are based on NetDebt/EBITDA no higher than 3.5 times,EBITDA/net interest cover of not lower than4 times. In addition the Group’s €330mnbanking facility has a Net Asset covenant ofnot less than €400mn. These covenants areless restrictive than the Group’s internaltargets. At 31 December 2009 the Groupwas comfortably within these covenantswith interest cover of 9.4, Net Debt/EBITDAof 1.6 and Net Assets of €585.5mn.
Balance Sheet – as the bulk of the Group’snon-Euro investments are Sterlingdenominated, the translation of theseinvestments into Euro has given rise to anexchange gain of €22mn which has beentaken directly to reserves, thereby increasingthe Group net assets. This annual translationadjustment can be positive or negativedepending on the movement between theopening and closing currency exchangerates. The sharp fall in Sterling was thesingle biggest contributory factor to thistranslation adjustment in 2008. Balancesheet exchange exposure is mitigated wherepossible by denominating debt in thosecurrencies where such exposure lies, prorata to the assets in those currencies.
Foreign exchange rates have recentlyundergone a period of exceptional volatilitydue to economic situations of individualcountries, the current global economicdownturn, and political considerations.While the Group hedging policy attempts tomitigate this risk, a net exposure will remainto currencies which may depreciate againstthe Euro in the future.
Interest rate riskThe Group adopts a policy of ensuring thatan appropriate proportion of its exposure tochanges in interest rates on borrowings iscovered by effective conversion to a fixedrate. Interest rate swaps are entered into toachieve an appropriate mix of fixed andfloating exposure that is consistent with theGroup’s policy.
The Private Placement loan notes, whichrepresent 73% of the drawn down facilities,are fixed out to maturity at a weightedaverage interest rate of 4.15%. €14mn offurther USD borrowings have been fixed at1.675% bringing the total fixed debt to 79%.The remainder of the drawn down facilitiesare subject to floating rates.
FINANCIAL RISK MANAGEMENTIn the normal course of business Kingspan Group has exposures to foreign currency, interestrate and credit risks. The Group’s focus is to understand these risks and to put in place policiesthat minimise the economic impact of an adverse event on the Group’s performance. Meetingsare held on a regular basis to review the results of the risk assessment, approve recommendedrisk management strategies and monitor the effectiveness of such polices.

23
2009
Kingspan Insulated PanelsMajura Park, Canberra, Australia

24
Business Risk Analysis
OTHER RISKS ANDUNCERTAINTIESThere are a number of other risks anduncertainties that can impact theperformance of the Group, many of whichare beyond the control of Kingspan and itsBoard. The Group’s businesses closelymonitor market trends and risks on anongoing basis and such trends and risks arethe focus of monthly management meetingswhere the business unit’s performance isassessed versus budget, forecast and prioryear. Such meetings are rotated around thedifferent locations of the business unit and atleast one executive board director ispresent. An annual assessment of trendsand risks is also an integral part of thebusiness unit’s annual review of its strategicplan and budget, which are submitted to theGroup Board for consideration and approval.
Market conditionsKingspan’s products are targeted to boththe residential and non-residential (includingretail, commercial, public sector and high-rise offices) construction sectors. As a resultdemand is dependent on activity levels inthese respective segments, which vary bygeographic market and are subject to theusual drivers of construction activity(i.e. general economic conditions, interestrates, business/consumer confidence levels,unemployment, population growth etc).While construction markets are inherentlycyclical, changing building andenvironmental regulations continue to act asan underlying positive structural trend fordemand for many of the Group’s products.The exposure to the cyclicality of any oneconstruction market is partially mitigated bythe Group’s diversification, bothgeographically and by product, and by theGroup’s portfolio of products, which areheavily oriented towards sustainable andenergy efficient construction.
Over the past 18 months the Group hasexperienced weakening of demand inseveral markets, notably in Ireland and theUK. This weakening has been particularlyacute in the residential and commercialsectors, and this has had an impact on theresults of the Group for the current year.Further weakening of the key markets for theGroup is likely in the current year, andconsequently this weakness is likely to havean adverse impact on the results of theGroup in the near future.
Input prices and availabilityThe Group’s operating performance isimpacted by the pricing and availability ofits key inputs, which include steel andchemicals (the key chemicals are MDI andpolyols). Pricing of such goods can be quitevolatile at times due to the respectiveindustries’ limited ability to adjust supply tochanges in demand, capacity and inputcosts. The Group looks to minimise theadverse effect of such movements throughstrong long-term relationships withsuppliers, economies of purchasing, multiplesuppliers and inventory management.
In 2009, input prices have varied significantlydue to volatility in response to global supplyand demand imbalances. However to theextent that the Group has or assumesexposure to fixed price contracts, surplusinventory, or experiences demand levelswhich differ from forecasts, the Group mayassume risk that replacement cost of rawmaterials may be higher or lower than thecosts of the raw materials purchased.
There is a further risk to the Group givenrecent consolidation in many suppliermarkets, particularly steel, whereby thenumber of supply options has shrunk, andthe Group is continually exploring ways ofmitigating this risk.
Competitive pressuresKingspan continually faces competition ineach of the markets in which it has apresence. The competitive environment inany one market is a function of a number offactors including the number of competitors,production capacity, the demandcharacteristics of that market, the ease ofimports from third countries and theavailability of substitute products. While suchcompetitive forces can impact profitability inthe short-term, each of Kingspan’soperations looks to offset such adverseeffects by: (i) ensuring a low costmanufacturing base through economies ofscale, investment in modern and efficientplant and a programme of continuousprocess improvement; (ii) a permanentemphasis on product development whichallows the Group’s companies to be leadingedge providers of innovative buildingsolutions and, therefore, helps todifferentiate itself from competitors; and(iii) providing a best in class service tocustomers by offering expert technicalsupport, short delivery times and productsthat come with a guaranteed performance.In recent months, competitive pressure has
intensified due to contraction in the overallmarket size. This has lead in some cases tolower margins, although the Group’s focus isto improve and differentiate the productfurther. Should such pressures continue,it may have a further adverse impact onmargins. Furthermore, due to capacityrestrictions in some raw material markets,input prices are subject to upwardpressures. Should input costs rise,competitive pressures in the market placemay make it difficult to pass on some or allof these increases, thereby adverselyaffecting margins.
Customer credit riskAs part of the overall service packageKingspan provides credit to customers andas a result there is an associated risk thatthe customer may not be able to payoutstanding balances. Each of the businessunits has established procedures and creditcontrol policies around managing itsreceivables and takes action wherenecessary. Trade receivables are alsomanaged by having credit insurancepolicies, to the extent that these areavailable, and credit limits. All majoroutstanding and overdue balances togetherwith significant potential exposures arereviewed regularly and concerns arediscussed at monthly meetings at whichgroup executive directors are present.Control systems are in place to ensure thatauthorisation requests are supported withappropriate and sufficient documentationand are approved at appropriate levels in theorganisation.
At the year end, the Group was carrying areceivables book of €181mn expressed netof provisions for default in payment. Of thesereceivables approximately 55% werecovered by credit insurance or other formsof collateral such as letters of credit andbank guarantees.
RegulationFollowing the expansion of Kingspan overthe last decade the Group hasmanufacturing and distribution operations inover 32 countries, each having its ownstatutes, taxes, regulations and laws. Eachbusiness unit closely monitors regulationsacross its markets to ensure any adverseimpacts are minimised. However, certainchanges are positive for the Group, inparticular those pertaining to building andenvironment regulations which are becomingever more stringent and harmonised across

25
2009
countries, especially in Europe, and as aresult are increasing the demand for theGroup’s products. More recently, authoritiesin several countries have introduced grantaid for many of the Group’s sustainable andenergy efficient products such as insulationand evacuated solar tubes. As theintroduction of such assistance has beenpositive for some Kingspan businesses, anyfuture withdrawal of such assistance mayhave a negative effect.
Research & development andquality controlA key risk to Kingspan’s business and itsreputation is the potential for functionalfailure of products when put to use, therebyleading to warranty costs and potentialreputational damage. Quality controlprocedures in relation to both raw materialinputs and Kingspan’s own manufacturingprocesses are, therefore, an essential partof the quality control before a Kingspanproduct is delivered to the customer. Withthe support of external audits, quality controlsystems are reviewed and improved on anongoing basis to ensure each business unitis addressing the whole control environmentaround product and process developmentand the formal signing off from developmentto manufacturing. The majority of newproducts have also to go through acertification process which is undertaken bya recognised and reputable authority (forexample, in the UK it is the BuildingResearch Establishment, BRE) before it isbrought to the market. To ensure thatKingspan meets the highest standards ISOaccreditation is a tool that is used across theGroup. At any one time 100% accreditationis unlikely as several of the sites are smalloperations which may be rationalised,restructured or amalgamated in the shortto medium term. In addition Kingspan willgenerally have sites that have recently beenacquired and therefore are still in theprocess of being integrated into theKingspan model.
Expansion and acquisitionA key element of the Group’s strategy is togrow the business through both broadeningits product offering and geographicexpansion. This requires management toidentify suitable investment opportunitiesboth in the form of capital investmentprojects and acquisitions. Such expansionhas its associated risks in terms of valuation,timing, integration / set-up and managementresources. All investment proposals undergo
a rigorous internal evaluation processincorporating a detailed market / competitiveanalysis, strategic rationale, external duediligence and pay-back valuation whichtargets double-digit pre-tax returns by yeartwo, in accordance with set criteria forapproving investments.
Information technology / businesscontinuityKingspan uses a range of computer systemsacross its business units for efficientprocessing of orders, control proceduresand financial management. These systemsare constantly reviewed and updatedaccordingly to meet the growing needs ofthe Group. Business continuity planning isregularly being assessed and tested acrossthe Group and addresses issues likepersonnel, manufacturing and disastermanagement. The Group is currently movingsome of its similar business units to thesame core operating platform in order todevelop an in-house expertise in thissystem, and to generate scalability andmobility.
TaxationKingspan carries on significant levels ofinternational trade and finance betweenmembers of the Group. The basis of thisinter-group trade/finance is at arm’s length,and documented by agreement. Suchagreements are open to challenge by thetax authorities in each member company’sjurisdiction, and the Group maintains anopen dialogue with revenue authorities invarious jurisdictions. An adverse view onthese arrangements could give rise toincreased taxation payments.
Dermot MulvihillFinance Director

The Board
26
ChairmanEugene Murtagh Eugene Murtagh is the founder and non-executive chairman of the Group.
(Age 67)
ExecutivesGene M. Murtagh Gene Murtagh is the Group chief executive, having previously been chief operating officer from 2003 to 2005. Prior to that he was
(Age 38) managing director of the Group’s Insulated Panel business and of the Environmental business. He joined the Group in 1993, and wasappointed to the Board in 1999.
Dermot Mulvihill Dermot Mulvihill is the Group finance director. He is a qualified chartered accountant (F.C.A., M.B.A.), having worked in a leading (Age 60) professional practice prior to this appointment to his current position in 1986.
Peter Wilson Peter Wilson is managing director of the Group’s Insulation business. He has been with the Group since 1981, and was appointed(Age 53) to the Board in 2003.
Russell Shiels Russell Shiels is president of the Group’s Access Floors and Insulated Panels businesses in North America. He was previously (Age 48) managing director of the Group’s Building Components and Raised Access Floors businesses in the UK. He was appointed to
the Board when he joined the Group in 1996.
Noel Crowe Noel Crowe is managing director of the Group’s Environmental & Renewables division. He joined the Group in 2001, having previously(Age 51) held a number of senior management positions in the ABB Group, and was appointed to the Board in 2004.
Non-executivesBrendan Murtagh Brendan Murtagh has been with the Group for 37 years, during which time he held a number of senior executive roles.
B.Comm. Since his retirement from his executive role in December 2007, he has continued as a non-executive director.(Age 64)
Tony McArdle Tony McArdle joined the Board in 2003. He was previously a director of Ulster Bank where he had been head of corporate banking (Age 61) and chief executive of retail banking as well as holding a number of other senior positions. He is a non-executive director of several
large private companies.
David Byrne David Byrne was appointed to the Board in January 2005. He served as EU Commissioner with responsibility for Health and Consumer S.C. Protection from 1999 to 2004. Prior to becoming EU Commissioner, he served as Attorney General for two years. Currently he is a
(Age 62) Deputy Chairman of DCC plc., Chairman of the Advisory Committee to the National Treasury Management Agency and of the Board of the National Concert Hall, and Chancellor of Dublin City University.
Brian Hill Brian Hill joined the Board in 2005. He was formerly a director of CRH Plc where he was Head of the Europe Products & Distribution B.E., C.Eng., F.I.Mech.E., division. He is also a non-executive director of Wavin NV.
M.Eng.Sc., M.B.A.(Age 65)
Helen Kirkpatrick Helen Kirkpatrick joined the Board in 2007. She is also a non-executive director of UTV Plc and of a number of private and not forB.A., F.C.A. profit companies, and was formerly a non-executive director of the International Fund for Ireland, Enterprise Equity and NI-CO Ltd.
(Age 52) She is a fellow of the Institute of Chartered Accountants in Ireland and is a member of the Chartered Institute of Marketing.
Danny Kitchen Danny Kitchen rejoined the Board in March 2009, having previously been a director of Kingspan from 1994 to 2003. He is also B.Sc., F.C.C.A. appointed by the Irish Stock Exchange as its nominated director on the Irish Takeover Panel, and is a non-executive director of the
(Age 57) Irish Nationwide Building Society since October 2008. Previously, he held a number of senior executive positions including as director of IBI Corporate Finance, finance director of Green Property Plc. and Deputy CEO of Heron International Limited.
SecretaryLorcan Dowd Lorcan Dowd qualified as a solicitor in 1992. He was appointed Group company secretary in 2005. Before joining the Group he was
(Age 41) director of Corporate Legal Services in PricewaterhouseCoopers in Belfast, having previously worked in private practice.
Committees
Name Role Independent Acquisitions Audit Nomination Remuneration
Eugene Murtagh Chairman No - - Chair -Gene M. Murtagh Chief Executive No Member - Member -Dermot Mulvihill Finance Director No Member - - -Peter Wilson MD Insulation No - - - -Russell Shiels President North America No - - - -Noel Crowe MD E&R No - - - -Brendan Murtagh Non-executive No - - - -Tony McArdle Senior Independent Yes Member Member Member -David Byrne Non-executive Yes - Member Member ChairBrian Hill Non-executive Yes Chair Member - MemberHelen Kirkpatrick Non-executive Yes - Chair Member MemberDanny Kitchen Non-executive Yes Member Member - Member
BOARD MEMBERSHIP

27
Report of the Directors 2009
• Insulated Panel sales volumes in NorthAmerica were down 23%. Architecturalfaçade products remained strong and theformer Metecno business performedrobustly in the circumstances.
• Central & Eastern Europe panel volumeswere also weaker, down 25%.A substantial reorganisation of this unitwas implemented, which will becompleted in H1 2010.
• Access Floors sales volumes were down31% globally, however, margins improvedfrom 14% to 17.5%.
• Across the Group, fixed cost reductions inthe year of €50mn brought the total sincepeak to €66mn. This process is nowlargely complete.
• Total investment in the year was€48.1mn. The main projects were thecompletion of a new Kooltherm® phenolicinsulation facility in the Netherlands, andthe completion of a new solar thermalcollector plant in Northern Ireland.The Group also entered the Australianthermal insulation market with theacquisition of AIR-CELL Innovations inDecember, complementing Kingspan’salready growing Insulated Panel businessin that region.
Research & developmentThe Group continues to place considerableemphasis on research and development ofexisting and new products and on theimprovement of the production process.Kingspan will continue to invest in research& development through 2010, with particularemphasis on renewable energy and highperforming insulation products. Furtherdetails of research & development arecontained in the Chief Executive’s Review.
Corporate governanceThe directors are committed to achieving thehighest standards of corporate governanceand a detailed statement describing how theprinciples of good governance set out in theCombined Code on Corporate Governancehave been applied by the Company isincluded in this Annual Report.
Corporate social responsibilityKingspan recognises the importance ofconducting its business in a sociallyresponsible manner. Its Corporate SocialResponsibility Statement is available on theGroup’s website www.kingspan.com in thesection “Our Responsibilities”, with somefurther details included in this Annual Report.
Share capitalThe Company’s total authorised sharecapital comprises 220,000,000 ordinaryshares of €0.13 each. At the 31 December2009 the Company’s total issued share
The directors have pleasure in presentingtheir report with the audited financialstatements for the year ended31 December 2009.
Principal activitiesKingspan Group is a leading manufacturer ofan integrated range of energy conservingbuilding solutions. Kingspan Group plc is aholding company for the Group’ssubsidiaries and other entities. The Group'sprincipal activities comprise the manufactureof insulated panels, rigid insulation boards,architectural facades, raised access floors,engineered timber systems, solar thermalhot water systems and fuel & water storagesolutions.
Results and dividendsGroup turnover was €1,125.5mn (2008:€1,672.7mn), operating profit was €62.7mn(2008: €157.1mn before non-trading itemsof €75.1mn), and earnings per share were28.7cent (2008: 26.7cent).
No dividend was paid during the year, andthe directors are not recommendingpayment of a final dividend for the yearended 31 December 2009 (2008: 8.0 cent).Resumption of dividend payments will beconsidered by the Board in 2010 in light ofdebt reduction achieved in 2009, ongoingcash flow and operating performancereaching expectations.
Some key financial performance indicatorsare set out in the Financial Review, and thefinancial statements for the year ended31 December 2009 are set out in detail inthis Annual Report. Other non-financialperformance indicators relating to wastemanagement and employee health andsafety are set out in the CorporateSocial Responsibility Statement in thisAnnual Report.
Business reviewThe Chief Executive’s Review and theFinancial Review set out management’sreview of the Group’s business during 2009.The key points include:
• A solid performance in 2009 from theoverall Group, despite hostile economicconditions.
• Excellent progress was made in debtreduction, with net debt at year-end of€164.3mn, down from €299.6mn.Operating working capital was €99mnlower than a year earlier.
• Insulation Boards total sales volumeswere down 23%, but with growing salesand penetration in Western Europe.
• Insulated Panel sales volumes in the UK,Ireland and Western Europe were down33%, with particular weakness in thespeculative development segment.
capital comprised 171,503,951 ordinaryshares of €0.13 each, of which theCompany held 5,237,017 treasury shares.
All ordinary shares rank pari passu, and therights attaching to the ordinary shares(including as to voting and transfer) are asset out in the Company’s articles ofassociation (“the Articles”). There are nounusual restrictions on voting rights exceptin circumstances where a Specified Event(as defined in the Articles) shall haveoccurred and the directors have served arestriction notice on the shareholder. The directors may decline to register anytransfer of a partly-paid share to a person ofwhom they do not approve. The directorsmay also decline to register any transfer of ashare on which the Company has a lien.Subject to the Articles, any member maytransfer all or any of his uncertificated sharesin the manner provided for in the CRESTRegulations. The directors may refuse toregister a transfer of uncertificated sharesonly in such circumstances as may bepermitted or required by the CRESTRegulations.
The directors are currently authorised toissue number of shares equal to theauthorised but as yet unissued share capitalof the Company under an authority that wasconferred on them at the Annual GeneralMeeting held on 14 May 2009.
The directors are also authorised to disapplythe strict statutory pre-emption provisionsrelating to the issue of new equity for cash,provided that the disapplication is limited tothe allotment of equity securities inconnection with any rights issue or any openoffer to shareholders, or the allotment ofshares not exceeding in aggregate 5% ofthe nominal value of the Company's issuedshare capital. Both these authorities expireon 13 May 2010 unless renewed andresolutions to that effect are being proposedat the Annual General Meeting to be held on13 May 2010.
At the Annual General Meeting held on14 May 2009, shareholders passed aresolution giving the Company, or any of itssubsidiaries, the authority to purchase upto 10% of its own shares, subject to therestrictions set out in that resolution. At theAnnual General Meeting to be held on13 May 2010, shareholders are being askedto renew this authority. The directors do nothave any current intention to exercise thepower to purchase the Company's ownshares.
The Company’s Standard Share OptionScheme, Long Term Incentive Plan andPerformance Share Plan, each contain

28
Report of the Directors
31 December 2009 31 December 2008
Eugene Murtagh 35,120,000 35,120,000Gene M. Murtagh 1,128,103 1,128,103Brendan Murtagh 4,626,629 5,126,629Dermot Mulvihill 812,961 812,961Russell Shiels 353,307 353,307Peter Wilson 217,656 217,656Noel Crowe 10,000 10,000Tony McArdle 30,000 20,000Helen Kirkpatrick 17,511 9,234Brian Hill 11,000 11,000David Byrne 3,000 3,000Danny Kitchen 3,000 -Lorcan Dowd 2,672 2,672
42,335,839 42,824,562
As at the 12 March 2010 the Company had been notified of the following substantial holdingsin its issued share capital, in accordance with the Disclosure and Transparency Rules (DTR5):
NotificationDate Institution Shares held %
11.03.10 Governance for Owners LLP 9,695,989 5.8006.10.09 Generation Investment Management LLP 19,975,011 12.0328.07.09 Investec Asset Management Limited 6,865,931 4.0106.05.09 Invesco Limited 11,558,276 6.96
Political donationsNeither the Company nor any of itssubsidiaries have made any politicaldonations in the year which would berequired to be disclosed under the ElectoralAct 1997.
Subsidiary companiesThe Group operates from 42 manufacturingsites, and bases in 32 countries worldwide.
The Company’s principal subsidiaryundertakings at 31 December 2009, countryof incorporation and nature of business arelisted in Note 42 of the financial statements.
OutlookThe Board fully endorses the outlook(“Looking Ahead”) expressed by theChief Executive in his Review.
Significant events since year endThere have been no significant events sincethe year end.
Principal risks and uncertaintiesThe principal risks and uncertainties facingthe Group’s business are set out in theBusiness Risk Analysis, as well as beingaddressed in the Chief Executive’s Reviewand the Financial Review. In particular theprincipal risks include:
• Competitive pressure affecting marginand profitability;
• Deterioration in market conditionsresulting in weakening of demand;
• Product failure in the event of a breach inthe quality controls in the manufacturingprocess.
Going concernThe directors have reviewed budgets andprojected cash flows for a period of not lessthan 12 months from the date of this AnnualReport, and considered other relevantinformation including the economicconditions currently affecting the buildingenvironment generally. On the basis of thisreview, the directors have concluded thatthere are no material uncertainties that maycast significant doubt about the Company’sand the Group’s ability to continue as agoing concern. For this reason, the directorsconsider it appropriate to adopt the goingconcern basis in preparing the financialstatements.
AuditorsIn accordance with Section 160(2) ofthe Companies Act, 1963 the auditors,Grant Thornton, Registered Auditors,will continue in office.
disposed of 4,493,750 shares, and PeterWilson exercised 14,482 options, apart fromwhich there have been no other changes inthe directors’ and secretary’s interests.
Accounting recordsThe directors are responsible for ensuringthat proper books and accounting records,as outlined in Section 202 of the CompaniesAct 1990, are kept by the Group.The directors have appointed suitableaccounting personnel, including aprofessionally qualified Finance Director, inorder to ensure that those requirements arecomplied with. The books and accountingrecords of the Group are maintained at theprincipal executive offices located at DublinRoad, Kingscourt, Co. Cavan.
Conflicts of interestSave as set out in this Annual Report, noneof the directors has any direct or indirectinterest in any contract or arrangementsubsisting at the date hereof which issignificant in relation to the business of theCompany or any of its subsidiaries nor in theshare capital of the Company or any of itssubsidiaries.
DIRECTORS’ & SECRETARY’S INTERESTS IN SHARES
change of control provisions which allow forthe acceleration of the exercise of shareoptions/awards in the event of a change ofcontrol of the Company.
Directors and secretaryThe directors and secretary of the Companyat the date of this report are as shown inthis Annual Report. Danny Kitchen wasappointed as a non-executive director onthe 1 March 2009. Brian Joyce andEoin McCarthy both retired asnon-executive directors, on the 30 January2009 and the 14 May 2009 respectively,and Louis Eperjesi resigned as an executivedirector on the 31 July 2009.
Directors’ & secretary’s interestsin sharesThe beneficial interests of the directors andsecretary and their spouses and minorchildren in the shares of the Company atthe end of the financial year are as shown inthe table above.
Details of the directors’ and secretary’sshare options are set out in the report ofthe Remuneration Committee. Since the31 December 2009 Brendan Murtagh
The Directors have been notified of the following substantial shareholdings in the Company:

29
2009
meeting (other than the Annual GeneralMeeting or a meeting to consider a specialresolution requiring a 75% majority vote) on14 days’ notice. The directors consider that it isin the interests of the Company to retain thisflexibility should circumstances arise whichwould require it.
Finally, the last item of special businessconcerns a number of proposed amendmentsto the articles of association of the Company,to reflect more comprehensively than has beendone to date certain provisions of theCompanies Acts (as amended by theShareholder Rights (Directive 2007/36/EC)Regulations 2009) relating to proxies, generalmeetings and electronic communications. Theproposed amendments are necessary for themanagement and good order of electroniccommunications between the Company andshareholders. Full details of the proposedamendments to the Company’s articles ofassociation are set out in the Notice of theAnnual General Meeting.
RegistrarAdministrative enquiries about the holdingof Kingspan Group Plc shares should bedirected to:The Company Registrar:Computershare Investor Services(Ireland) LimitedHeron House, Corrig RoadSandyford Industrial Estate Dublin 18
Shareholders who receive duplicate sets ofCompany mailings due to multiple accountsin their name should write to the Company’sRegistrar to have their accounts amalgamated.
Company InformationRegistered Office:Dublin Road, Kingscourt, County CavanPrinciple Bankers:KBC Bank Ireland Ulster Bank LimitedAllied Irish Banks Bank of IrelandBNP Paribas HSBC Bank plcBarclays BankAuditors:Grant Thornton, 24-26 City Quay, Dublin 2.Solicitors:McCannFitzgerald, Riverside One,Sir John Rogerson’s Quay, Dublin 2.Macfarlanes, 20 Cursitor Street,London, EC4A 1LT.Stockbrokers:Goodbody Stockbrokers, Ballsbridge Park,Ballsbridge, Dublin 4.UBS Investment Bank, 1 Finsbury Avenue,London, EC2M 2PP, England.
On behalf of the Board
Eugene Murtagh, ChairmanGene M Murtagh, Chief Executive
Shareholding Number % of Number of %range of accounts total shares held of total
1 - 1,000 3,635 57.7 1,816,71 1.051,001 - 10,000 2,271 36.05 6,780,196 3.9810,001 - 100,000 278 4.43 7,676,642 4.47100,001 - 1,000,000 83 1.32 22,481,695 13.10Over 1,000,000 32 0.5 132,749,147 77.40
6,299 100.00 171,503,951 100.00
SHAREHOLDER ANALYSIS AS AT 31 DECEMBER 2009
Special Business at the AnnualGeneral MeetingShareholders are being asked to renew,until the Annual General Meeting in 2011, theauthority to allot any unissued share capital ofthe Company. No issue of shares will bemade which could effectively alter control ofthe Company without prior approval of theshareholders in general meeting. At presentthe directors do not intend to issue anyshares other than in connection with theGroup’s previously approved share optionschemes.
Shareholders are being asked to renew, untilthe Annual General Meeting in 2011, thepower of the directors to disapply thestatutory pre-emption provisions applying toordinary shares in the event of a rights issueor in any other issue for cash up to anaggregate of 5% of the nominal value of theCompany’s issued ordinary share capital.Shareholders are also being asked toapprove, until the Annual General Meeting in2011, the authority for the Company, or any ofits subsidiaries, to purchase up to 10% of theCompany’s own shares and to reissue suchshares purchased by it and not cancelled.The directors would only exercise the powerto purchase the Company’s own shares atprice levels which they considered to be inthe best interests of the shareholdersgenerally, after taking account of theCompany’s overall financial position.The minimum price which may be paid fora purchase of the Company’s own sharesshall be the nominal value of the ordinaryshares, and the maximum price which maybe paid shall be 105% of the then averagemarket price of the ordinary shares.Shareholders are being asked to approvethat, where the Company’s shares havebeen repurchased, (such shares beingknown as Treasury Shares), these sharesmay be sold off-market at a maximum priceof 120% of the Appropriate Price (as definedin the resolution), and a minimum price of95% of the Appropriate Price.
Shareholders are being asked to renew,until the Annual General Meeting in 2011,the power of the directors to call a general
Annual General MeetingThe Annual General Meeting of theCompany will be held at The Herbert ParkHotel, Ballsbridge, Dublin 4 on Thursday13 May 2010 at 11.00 a.m. The Notice ofthe Meeting is available on the Company’swebsite www.kingspan.com, and ProxyForms are being sent to all shareholders bypost.
Shareholders registered in the register ofmembers of the Company as at 6.00 pmon Tuesday 11 May 2010 shall be entitledto attend and vote at the Annual GeneralMeeting in respect of the number of sharesregistered in their names at the time.A shareholder may ask any questionsrelating to the business being dealt with atthe Annual General Meeting. A memberentitled to attend, speak and vote at theabove meeting is entitled to appoint a proxyto attend, speak and vote on his/her behalf.The ordinary resolutions require a simplemajority of votes cast by shareholders votingin person or by proxy to be passed.The special resolutions require a majority ofnot less than 75% of votes cast by thosewho vote either in person or by proxy to bepassed. A shareholder or a group ofshareholders holding 3% of the issued sharecapital have a right to table a draft resolutionto put an item on the agenda of the meetingsubject to any contrary provisions incompany law.
Re-election of directorsNoel Crowe, Tony McArdle and HelenKirkpatrick each retire by rotation, and offerthemselves for re-election at the AnnualGeneral Meeting.
Eugene Murtagh and Danny Kitchen, non-executive directors who have each served onthe Board for a period greater than nine years,also offer themselves for re-election.
The Chairman, having regard to theperformance and contribution of all of theabove directors during the year, is of the viewthat each of the above directors continues tobe effective and committed to the role, andrecommends their re-election.

30
Report of the Remuneration Committee
Policy on remuneration ofexecutive directorsIn setting remuneration levels theRemuneration Committee aims to ensurethat the executive directors’ remunerationreflects market rates, and takes intoconsideration the remuneration practices ofother Irish and European quoted companiesof similar size and scope. It takesindependent professional advice in thisregard.
The various elements of the remunerationpackage for executive directors comprisethe following:
• Basic salary and benefits. There was noincrease in the basic salaries of theexecutive directors in 2009. In addition totheir basic salary, executive directors’benefits relate to health insurancepremiums and to the use by the executivedirectors of company cars.
• Annual bonus. Executive directors receivebonus payments of up to 100% of basicsalary based on the attainment of annualperformance targets set at the start ofeach year by the RemunerationCommittee, with bonuses paid on asliding scale if the targets are met. In2009, the selected performance targetswere a combination of Group anddivisional profit targets. Russell Shiels andPeter Wilson were awarded bonuses onthe basis of divisional profit targets beingmet, but no other executive directorearned any bonus in the year.
The principle terms of reference ofthe Remuneration Committee are:
• to establish the remuneration policyapplicable to the executive directors,including bonuses and other incentivearrangements, to encourage an enhancedperformance, and reward individuals fortheir contribution to the success of theGroup;
• to approve the grant of shareoptions/awards to executive directors;
• to determine the policy and scope ofpension arrangements for the executivedirectors;
• to set performance objectives for theChief Executive and other executivedirectors;
• to report to shareholders on theCompany’s compliance with theCombined Code, and best practice,in so far as concerns the company'sremuneration policies.
The Remuneration Committee consistsentirely of non-executive directors.The Committee invites the Chairman andChief Executive to attend committeemeetings when deemed appropriate.
• Pension scheme. The Group operates adefined contribution pension scheme forexecutive directors. Pension contributionsare calculated on basic salary only.Contributions are determined on anindividual basis and take into account anumber of factors including age, length ofservice, and number of years toretirement.
• Share options. Executive directors areentitled to participate in the several Groupshare option and long-term incentiveschemes, details of which are set outbelow. Participation in the schemes issubject to individual award limits whichwere approved by shareholders, andcomply with IAIM guidelines.
The bonus and share option incentives aredesigned to provide rewards for achievingobjectives that will increase shareholdervalue. The Remuneration Committeeconsiders that a significant proportion of theexecutive directors’ total package is linkedto corporate and individual performance.The overall packages are reviewed annuallyby the Remuneration Committee, havingregard to personal performance, competitivemarket practice and comparativeinformation.
Role and composition of the Remuneration CommitteeResponsibility for determining the levels of remuneration of the executive directors has been delegated bythe Board to the Remuneration Committee. It is the aim of the Remuneration Committee to ensure that theremuneration policy attracts, retains and motivates the executive directors, and links rewards to corporateand individual performance and enhanced shareholder value.

31
2009
2009 2008Non-executive Non-executive
fees feesNon-executive directors €’000 €’000
Eugene Murtagh6 191 191Brendan Murtagh 70 70Tony McArdle 70 70David Byrne 70 70Brian Hill 70 70Helen Kirkpatrick 70 70Danny Kitchen7 58 -Brian Joyce8 6 70Eoin McCarthy9 29 70
634 681
1 Benefits relate to health insurance premiums and the use by directors of company cars.2 All executive directors participate in defined contribution pension schemes operated by the Group.3 The Group made a contribution of €1,417,000 during 2009 to the Group’s occupational pension plan in respect of
Dermot Mulvihill, representing accelerated pension contributions up to the date of his retirement at age 62.The proportion charged to the Consolidated Income Statement in respect of this payment for 2009 is€605,000, and the prepayment for 2010 is €406,000, and for 2011 is €406,000. There are claw backarrangements in place should he retire early.
4 The 2009 salaries and remuneration have been converted to Euro at the following rates USD: 1.3946; STG: 0.8917.Russell Shiels’ basic salary was $388,000 (2008: $388,000).Peter Wilson’s basic salary was £220,000 (2008: £220,000).Louis Eperjesi’s basic salary was £128,333 (2008: £220,000).
5 Louis Eperjesi resigned as an executive director on 31 July 2009.On termination of his employment he also received €298,000 as compensation for loss of office.
6 Eugene Murtagh also received a contribution to his personal pension scheme of €143,250.7 Danny Kitchen was appointed as a non-executive director on 1 March 2009.8 Brian Joyce retired as a non-executive director on 30 January 2009.9 Eoin McCarthy retired as a non-executive director on 14 May 2009.
Directors’ remuneration
Benefitin kind
Basic and other Performance Pension 2009 2008salary allowances1 related bonus contributions2 Total Total
Executive directors €‘000 €‘000 €‘000 €‘000 €‘000 €‘000
Gene M. Murtagh 635 26 - 95 756 756Dermot Mulvihill3 340 24 - 605 969 851Russell Shiels4 279 25 220 67 591 504Peter Wilson4 247 13 148 52 460 344Noel Crowe 280 16 - 42 338 338Louis Eperjesi4 & 5 144 16 - 60 220 350
1,925 120 368 920 3,334 3,143
Charge to ConsolidatedIncome Statementre share options 207 1,050
3,541 4,193

32
Report of the Remuneration Committee
Service contractsNo director has a service contract in excessof one year.
Non-executive directorsThe non-executive directors each receive afee which is is set by the RemunerationCommittee on advice from independentprofessional advisors, and reflects the timecommitment involved in the performance oftheir duties. The non-executive directors donot have service contracts and do notparticipate in any bonus or share optionschemes. The non-executive directors donot receive any pension or other benefitsapart from Mr Eugene Murtagh in respect ofwhom the Company paid a contribution tohis personal pension scheme.
Standard Share Option SchemeUnder the terms of the share option schemeapproved by shareholders in May 1998,(the Standard Share Option Scheme), shareoptions were awarded to executive directorsand senior management. Since May 2008,no more options can be awarded under theStandard Share Option Scheme, but optionsawarded before that date can be exercisedin accordance with the conditions underwhich they were granted, up to ten yearsafter the date of grant.
Such options are exercisable only whenearnings per share (EPS) growth in the threeyear period commencing with theaccounting period in which the optionswere granted (or any subsequent period),exceeds the growth in the Irish ConsumerPrice Index by at least 2% per annumcompound. Grants of options under theStandard Share Option Scheme areawarded at the market price of theCompany’s shares at the time of the grant.Under the Standard Share Option Scheme,options become exercisable three yearsafter they are granted (at the earliest) andremain exercisable for ten years. Thepercentage of share capital which can beissued under the scheme and individualgrant limits comply with IAIM guidelines.Details of the options granted to theexecutive directors under the StandardShare Option Scheme are set out in thetable later in this Remuneration Report.
Long Term Incentive PlanThe objective of the long-term incentive plan(LTIP), approved by shareholders in May2001, is to motivate and reward executive
directors and senior executives forexceptional performance. Share optionsgranted to an individual under the termsof the LTIP are exercisable only if certainperformance criteria are achieved in thethree year period commencing with theaccounting period in which the optionswere granted. These conditions are:
• EPS growth must increase by at least theIrish Consumer Price Index plus 10% perannum compound over the three years;and
• For 100% of the award to vest, EPSgrowth must be at or above the 75thpercentile compared to a selected peergroup of companies. If EPS growth is atthe 25th percentile point, 50% of theaward will vest, and if EPS growth isbetween the 25th and 75th percentilepoint, between 50% and 100% of theaward will vest on a sliding scale.
Otherwise the shares do not vest.The percentage of share capital which canbe issued under the LTIP and individualgrant limits comply with IAIM guidelines.
Performance Share PlanThe Performance Share Plan (PSP),approved by shareholders in May 2008,rewards the performance of managers andexecutives based on the overallperformance of the Company, thus aligningthe interests of management and executivedirectors with the interests of shareholders.The PSP has replaced the Standard ShareOption Scheme which has now expired.Under the terms of the PSP, performance
shares are awarded to the executivedirectors and senior management team.The performance shares will vest only ifcertain performance criteria are achieved inthe three year period commencing with theaccounting period in which the awards aregranted. These conditions are:
• Up to 50% of the award will vest (on asliding scale) on achievement of averageEPS growth of between CPI plus 3.5%and CPI plus 7%;
• Up to 50% of the award will vest (on asliding scale) on achievement of totalshareholder return (TSR) compared to aselected peer group, where noperformance shares vest if performanceis at or below the median compared withthe selected peer group, and 50% vestif performance is at or above 75thpercentile point compared with theselected peer group.
• A further Exceptional Performance Award(not exceeding 25% of any individual’stotal award) can be awarded which onlyvests (on a sliding scale) if the Company’sTSR ranking is above the 75th percentilepoint compared with the selected peergroup.
The percentage of share capital which canbe issued under the PSP and individualgrant limits comply with IAIM guidelines.
Performance graphThis graph shows the Company's TSRperformance against the performance ofthe ISEQ and the FTSE 250 Indices overthe five-year period to 31 December 2009.
20052004
350
300
250
200
150
100
50
02006 2007 2008 2009
Kingspan
ISEQ
FTSE 250
Total Shareholder Returns

33
2009
Details of share options granted to the directors and secretary under the Standard Share Option Scheme,the Long-Term Incentive Plan and the Performance Share Plan
ExercisedAt Granted or cancelled At Option Average Earliest Latest
31 Dec during during 31 Dec price option price exercise expiryDirector 2008 year year 2009 €Cent €Cent date date
Gene M. MurtaghStandard Share 200,000 200,000 565 23/09/2007 23/09/2014Option Scheme 36,195 36,195 1090 05/09/2008 05/09/2015
48,115 48,115 1418 05/09/2009 05/09/201693,650 93,650 1900 03/09/2010 03/09/201780,000 80,000 810 05/03/2011 05/03/2018
457,960 457,960 1012
Long TermIncentive Plan 124,052 (23,526)2 100,526 13 13 05/09/2009 05/03/2015
Performance - 20,0001 20,0001 13 27/03/2012 27/03/2019Share Plan - 128,000 128,000 13 27/03/2012 27/03/2019
148,000 148,000 13
Brendan MurtaghStandard Share 10,097 (10,097)3 - 1090 05/09/2008 05/09/2015Option Scheme
Dermot MulvihillStandard Share 115,000 115,000 565 23/09/2007 23/09/2014Option Scheme 10,856 10,856 1090 05/09/2008 05/09/2015
29,930 29,930 1418 05/09/2009 05/09/201690,000 90,000 1900 03/09/2010 03/09/201750,000 50,000 810 05/03/2011 05/03/2018
295,786 295,786 1118
Long TermIncentive Plan 94,595 (16,415)2 78,180 13 13 05/09/2008 05/03/2015
PerformanceShare Plan 82,800 82,800 13 27/03/2012 27/03/2019
Russell ShielsStandard Share 50,000 50,000 565 23/09/2007 23/09/2014
22,571 22,571 1090 05/09/2008 05/09/201515,562 15,562 1418 05/09/2009 05/09/201670,000 70,000 1900 03/09/2010 03/09/201732,461 32,461 810 05/03/2011 05/03/2018
190,594 190,594 1229
Long TermIncentive Plan 59,234 (13,338)2 45,896 13 13 05/09/2009 05/03/2015
PerformanceShare Plan 64,400 64,400 13 27/03/2012 27/03/2019
Peter WilsonStandard Share 97,014 97,014 565 23/09/2007 23/09/2014Option Scheme 11,884 11,884 1090 05/09/2008 05/09/2015
20,462 20,462 1418 05/09/2009 05/09/201670,000 70,000 1900 03/09/2010 03/09/201710,742 10,742 810 05/03/2011 05/03/2018
210,102 210,102 1135
Long TermIncentive Plan 73,992 (12,920)2 61,072 13 13 05/09/2008 05/03/2015
PerformanceShare Plan 64,400 64,400 13 27/03/2012 27/03/2019

34
Report of the Remuneration Committee
ExercisedAt Granted or cancelled At Option Average Earliest Latest
31 Dec during during 31 Dec price option price exercise expiryDirector 2008 year year 2009 €Cent €Cent date date
Noel CroweStandard Share 20,000 20,000 135 09/10/2005 09/10/2012Option Scheme 30,000 30,000 330 18/09/2006 18/09/2013
50,000 50,000 565 23/09/2007 23/09/201438,192 38,192 1090 05/09/2008 05/09/201540,000 40,000 1418 05/09/2009 05/09/201637,726 37,726 1900 03/09/2010 03/09/201716,199 16,199 810 05/03/2011 05/03/2018
232,117 232,117 965
Long TermIncentive Plan 78,189 (11,532)2 66,657 13 13 23/09/2007 05/03/2015
PerformanceShare Plan 36,800 36,800 13 27/03/2012 27/03/2019
Company secretaryLorcan DowdStandard Share 7,638 7,638 1090 05/09/2008 05/09/2015Option Scheme 10,000 10,000 1418 05/09/2009 05/09/2016
15,000 15,000 1900 03/09/2010 03/09/201715,000 15,000 810 05/03/2011 05/03/201847,638 47,638 1326
Long TermIncentive Plan 12,000 12,000 13 13 03/09/2010 05/03/2015
PerformanceShare Plan 27,600 27,600 13 27/03/2012 27/03/2019
1 Exceptional Performance Award2 Cancelled 6 November 20093 Cancelled 31 December 2009
David Byrne S.C.Chairman, Remuneration Committee

35
Report of the Audit Committee 2009
The Head of Internal Audit reports directly tothe chairman of the Audit Committee andboth internal audit and external auditorshave direct access to the committeechairman at all times.
Functions of the Audit CommitteeThe committee discharges its responsibilitiesby reviewing:
• prior to their release, the preliminarystatement of annual results and questionsthe external auditor, the internal auditorsand the Group Finance Director on these.It compares the results with managementaccounts and budgets, and reviewsreconciliations between these and finalresults. It receives a report from theexternal auditors at that meetingidentifying any accounting or judgmentalissues arising from the audit requiring itsattention;
• prior to their release, Half-year Resultsand compares the results withmanagement accounts and budgets;
• the Group accounting policies on anongoing basis;
• the performance of the external auditors,considering the quality of the reports andadvice provided to the committee. It alsoconsiders their level of understanding ofthe Group’s business, the objectivity ofthe auditors’ views of the Group’s internalcontrols and their ability to complete theaudit within specified deadlines;
• the external auditors’ work plan bothbefore and after the audit. It reviews auditfindings, adjustments, managementletters and recommendations togetherwith monitoring action taken bymanagement as a result of anyrecommendations;
• management representation lettersrequested by the auditors for anynon-standard issues (if any);
The main responsibilities of the AuditCommittee include:• Monitoring the integrity of the Group’s
Financial Statements and reviewingsignificant financial reporting judgementscontained in them;
• Reviewing the Group’s internal controlsand risk management systems;
• Monitoring and reviewing the effectivenessof the Group’s internal audit function;
• Making recommendations to the Boardin relation to the re-appointment or,if considered appropriate, removal ofthe external auditors and approving theremuneration and terms of engagementof the external auditors;
• Monitoring the independence andobjectivity of the external auditors and theeffectiveness of the audit process, takinginto consideration relevant professionaland regulatory requirements;
• Determining policy for the engagement ofthe external auditors to supply non-auditservices;
• Reporting to the Board, identifying anymatters in respect of which it considersthat action is needed and makingrecommendations as to the steps tobe taken.
The Audit Committee consists entirely ofnon-executive directors including the SeniorIndependent Director, and the Chairman ofthe committee has recent and relevantfinancial experience. During the year, thecommittee met 4 times. The externalauditors attended these meetings asrequired and have direct access to thecommittee at all times. The Finance Directorand Head of Internal Audit attended eachmeeting and other Group executives attendthese meetings as and when required.
The committee also met the externalauditors without management present todiscuss matters relating to its remit and anyissues arising from the audit generally.The committee also periodically meets theHead of Internal Audit independent of Groupmanagement.
• approving the annual internal audit plan,and carrying out a regular assessment ofthe resources available to deliver on theplan in a timely fashion;
• reports from the internal auditors andmanagement responses to such reportstogether with action points arising fromthem;
• relevant reports and recommendationsfrom external consultants on an exceptionbasis;
• the Group risk analysis and managementresponses annually together with thestrategy to deal with identified risks.
Appointment of auditors andaudit feesThe Audit Committee has assessed thequalification, expertise, resources andindependence of the external auditors andthe effectiveness of the audit process asfollows:
• information as to qualifications, expertise,resources and internal quality control wasprovided by the auditors themselves;
• the assessment of the effectiveness of theaudit process was carried out throughdiscussions with Group Management,Head of Internal Audit and throughfeedback provided by divisionalmanagement;
• Independence is discussed separatelybelow.
The Audit Committee reviews the terms ofengagement of the auditors, the scope ofthe audit, and the audit fees. Any differentialbetween approved audit fees and actualinvoiced fees is reported to the AuditCommittee. On an annual basis audit feesare benchmarked against audit fees incurredby peer listed companies.
Role and composition of the Audit CommitteeThe Board has delegated responsibility for reviewing its financial reporting arrangementsand internal control principles, together with monitoring the relationship with theCompany's external auditors, to the Audit Committee.

36
• regular assessment of major business,investment and financing risks;
• a comprehensive annual budgetingprocess and a review by the Board ofactual performance compared withbudget on a monthly basis;
• clearly defined and appropriate levels ofauthorisation for all transactions;
• the Audit Committee and the internalaudit function;
• the chairman of the Audit Committeereports to the Board on significant issuesconsidered by the committee, and theminutes of its meetings are circulated toall Board directors;
• systematic monitoring and assessment ofrisk areas through management andBoard reviews.
The committee conducts on-going reviewsof the effectiveness of the system of internalcontrol throughout the year. The processused by the Board for this review includes:
• the review by the Audit Committee of theexternal and internal auditors’ work plans,reports and internal controlrecommendations;
• review by the Board and Audit Committeeof the specific identified risk areas;
• consideration of reports frommanagement, internal and externalauditors on the system of internal controland on material control weaknesses;
• discussions with management on theimplementation of strategies on anyinternal control and risk areas identified;
• consideration by the Board on the impactof relevant legislation on the Group.
The approach by the Board is proactive inidentifying possible weaknesses andobtaining the relevant degree of assuranceon specific areas of internal control and notmerely reporting by exception. During theyear, internal audit carried out reviews ofinternal controls across all divisions coveringa number of identified areas of risk, andthese reviews were discussed andconsidered by the committee.
In addition to the above, the main featuresof the Group’s internal control and riskmanagement systems that relate specificallyto the Group’s financial reporting and
Audit objectivity and independenceThe auditors are permitted to provide non-audit services that are not, or are notperceived to be, in conflict with auditorindependence, provided that they have theskills and integrity to carry out the work andare considered subject to Group policy to bethe most appropriate to undertake suchwork in the best interests of the Group.The Audit Committee ensures that theindependence of the external audit is notcompromised by:
• seeking confirmation from the externalauditors that in their professionaljudgement they are independent fromthe Group;
• obtaining an account of all relationshipsbetween the external auditors and Group;
• reviewing the economic importance of theGroup to the external auditors bymonitoring the audit fees as a percentageof total fee income generated from therelationship with the Group in light ofethical guidelines set down by theInstitute of Chartered Accountants inIreland.
Internal ControlThe Board has overall responsibility for theGroup’s system of internal control andhas delegated responsibility for theimplementation of this system to executivemanagement.
This delegation ensures the embedding ofthe system of internal control throughout theGroup’s operations, and ensures that theorganisation is capable of respondingquickly to evolving business risks, and thatsignificant internal control issues, shouldthey arise, are reported quickly toappropriate levels of management. Such asystem of internal control by its nature isdesigned to manage rather than eliminatethe risk of failure to achieve businessobjectives, and can provide reasonable, butnot absolute, assurance against materialmisstatement or loss.
The key elements of the Group’s system ofinternal control include the following:
• a clearly defined organisation structurewith formal lines of authority,accountability and responsibility;
• a formal schedule of matters specificallyreserved for decision by the Board;
accounts consolidation process are set outin the Corporate Governance Statement inthis Annual Report.
Code of conductThe Group has a Code of Conduct, settingthe standard by which all employees acrossthe Group are expected to conductthemselves. The Code of Conduct isavailable on the Group's websitewww.kingspan.com. Reporting procedureshave been adopted and notified to allemployees, by which staff are encouragedto raise any concerns about possibleimproprieties or breaches of the Code ofConduct in any area of the Group.All breaches are obliged to be reported tothe head of internal audit, who reports to theAudit Committee.
Risk assessmentThe Directors confirm that the Group’songoing process for identifying, evaluatingand managing its significant risks is inaccordance with Corporate Governancerequirements (including Turnbull guidancefor Directors on the Combined Code).The process has been in place throughoutthe accounting period and up to the date ofapproval of the Annual Report and FinancialStatements, and is regularly reviewed by theBoard.
As part of the annual risk assessment, theAudit Committee assesses the risks to thebusiness under the following headings:business; financial; compliance; humanresources; operational; inventory;Research & Development / Quality Control;purchasing; sales; fixed assets; IT; and other.The principal risks facing the businessidentified by the Committee are included inthe Business Risk Analysis in this AnnualReport.
ComplianceThis report has been prepared inaccordance with the requirements ofSection C of the 2008 Combined Code onCorporate Governance, as appended to theListing Rules of the Irish Stock Exchangeand the UK Listing Authority.
Helen Kirkpatrick, F.C.A.Chairman, Audit Committee
Report of the Audit Committee

37
Corporate Governance Statement 2009
All of the directors bring an objectivejudgement to bear on issues of strategy,resources and standards of performance.
The directors believe that the Board includesan appropriate balance of skills and ability toprovide effective leadership and control tothe Group.
The Board met formally 9 times during theyear, as well as informally as and whenrequired. Attendance at Board andcommittee meetings is set out in the tablebelow. The Board reserves for itself a formalschedule of matters on which it takes theultimate decision. These include adoptingthe Group’s rolling 5 year strategic plan andthe annual budget, approving all majorcapital expenditure and material contracts,acquisitions and disposals of businessesand other assets, and appointment of senior
The BoardThe Board of the Company is responsiblefor the leadership, strategic direction andoverall management of the Group. It setsthe Company’s strategic aims, establishesthe Company’s values and standards, andmonitors compliance within a framework ofeffective controls.
The Board currently consists of 12 directorswhose names and other details are as setout in this Annual Report. Five of thedirectors are executives, and sevenincluding the Chairman are non-executivedirectors. Each of the executive directorshas a combination of general business skills,and experience in the construction materialsmarket. The non-executive directorsrepresent a diverse business backgroundcomplementing the executive director'sskills.
executives and succession planning,reviewing management’s corporate andfinancial performance, and overall review ofthe Group’s internal controls. Certain othermatters are delegated to the Boardcommittees, the roles and responsibilities ofwhich are set out below.
As part of the performance evaluationprocess the Chairman meets at least onceannually with the non-executive directorswithout the executive directors beingpresent to review the performance of theBoard, the conduct of Board meetings andcommittee meetings, and the generalcorporate governance of the Group.In addition, the non-executive directors,led by the senior independent director, meetannually without the Chairman present toappraise the workings of the Board.
Board Acquisition Audit Nomination Remuneration
A B A B A B A B A B
Eugene Murtagh 9 9 3 3Gene M. Murtagh 9 9 2 2 3 3Dermot Mulvihill 9 9 2 2Russell Shiels 9 6Peter Wilson 9 9Noel Crowe 9 9Louis Eperjesi 5 4Brendan Murtagh 9 8Tony McArdle 9 9 2 2 4 4 3 3David Byrne 9 9 4 3 3 3 4 4Brian Hill 9 8 2 2 4 4 4 3Helen Kirkpatrick 9 9 4 4 3 3 4 4Danny Kitchen 7 6 2 2 4 3 3 2Eoin McCarthy 3 3Brian Joyce 1 1
Column A - indicates the number of meetings held during the period the director was a member of the Board and/or CommitteeColumn B - indicates the number of meetings attended during the period the director was a member of the Board and/or Committee
The directors continue to endorse and apply the principles of goodcorporate governance set out in the Combined Code. This statementdescribes how the principles of the 2008 FRC Combined Code onCorporate Governance have been applied by the Company.
ATTENDANCE AT BOARD AND COMMITTEE MEETINGSDURING THE YEAR ENDED 31 DECEMBER 2009
38
Corporate Governance Statement
The Chairman andChief ExecutiveThere is a clear division of responsibility setout in writing between the non-executiveChairman, Eugene Murtagh, and the ChiefExecutive, Gene M Murtagh.
The Chairman’s primary responsibility is tolead the Board. He is responsible for theefficient and effective working of the Board,and ensures that all members of the Board,including in particular the non-executivedirectors, have an opportunity to contributeeffectively. He is also responsible forensuring that there is appropriate and timelycommunication with shareholders.
The Board has delegated executiveresponsibility for running the Company tothe Chief Executive and the executivemanagement team. The Chief Executive isresponsible for the strategic direction andthe overall performance of the Group, and isaccountable to the Board for all authority sodelegated.
Board balance and independenceThe Board has determined the followingnon-executive directors to be independent:David Byrne, Brian Hill, Helen Kirkpatrick,Danny Kitchen and Tony McArdle.Tony McArdle is nominated as the seniorindependent director of the Company, andis available to shareholders who haveconcerns that cannot be addressed throughthe Chairman, Chief Executive or ChiefFinancial Officer. The directors consider thatthere is a strong independent representationon the Board, and are committed torefreshing and strengthening theindependent representation on the Boardon an on-going basis.
In determining the independence of DannyKitchen, the Board considered whether hisprevious tenure as a non-executive directorof the Company might appear to affect hisindependence. The Board concluded basedon a number of factors, including hisexperience and knowledge from his othersenior executive roles, the significantchanges in the economic and commercialenvironment since his previous appointmentto the Board, and the fact that throughouthis previous tenure on the Board he alwaysexercised a strongly independent judgment,that the independence of his character andjudgement was not compromised.
Appointments to the BoardAll appointments to the Board are made onthe recommendation of the NominationCommittee. In addition the NominationCommittee reviews the various committeesand makes recommendations to the Boardon the appointment of the chairman and themembership of each. The standard terms ofappointment of non-executive directors areavailable, on request, from the CompanySecretary.
Information and professionaldevelopmentAll directors are supplied with appropriateand timely information for Board andcommittee meetings, and are given theopportunity to probe and question theexecutives and to seek such furtherinformation as they consider appropriate.The Group’s professional advisors areavailable for consultation with the Board andattend Board meetings as required.All directors have access to the advice andservices of the Company Secretary who isresponsible for ensuring that Boardprocedures are followed. He is alsoresponsible for advising the Board, throughthe Chairman, on all governance matters.Individual directors may seek independentprofessional advice at the expense of theCompany in furtherance of their duties as adirector. The Group has arrangedappropriate insurance cover in respect oflegal action against its directors.
The Company has procedures wherebydirectors (including non-executive directors)receive formal induction and familiarisationabout the Company’s business operationsand systems, and continuing training relatingto the discharge of their duties as directorsand (as appropriate) management.This includes Board visits to the Group’smanufacturing facilities on a regular basis.
Performance evaluationDuring the year the Chairman carried out areview of the performance of individualdirectors. The Senior Independent Directorthrough discussions with other directorsconducted a review of the Board, itscommittees and its corporate governance.
Re-election of directorsThe Company’s Articles of Associationprovide that newly appointed directors aresubject to election at the Annual General
Meeting following their appointments.Excluding any such newly appointeddirectors, one third of the Board is subject tore-election at each Annual General Meeting.Non-executive directors are appointed to theBoard for an initial term of three years,renewable with the Board’s agreement, butsubject to re-election by the shareholders onthe normal rotation basis. Any non-executivedirector who has served more than nineyears from the time of first election is subjectto annual re-election thereafter.
Board CommitteesThe Board has established the followingcommittees: Acquisitions, Audit,Nominations and Remuneration committees.All committees of the Board have writtenterms of reference setting out theirauthorities and duties and these terms areavailable on the Company's websitewww.kingspan.com. The chairman andmembers of each committee are set out inthis Annual Report.
Acquisitions CommitteeThe Acquisitions Committee has beenestablished by the Board to consider andappraise all acquisition proposals made bythe Group within its authorised limits, and toapprove any investments, joint ventures, andcapital expenditure within those limits whichit considers to promote the Group strategy.The committee also carries out a periodicreview of investments made within theprevious year to review actual performanceagainst forecast targets.
Audit CommitteeThe Board has established an AuditCommittee to monitor the integrity of theCompany's financial statements, and theeffectiveness of the Company’s internalfinancial controls. The members of the AuditCommittee bring considerable financial andaccounting experience to the committee’swork, and in particular the Board considersthat the chairman of the Audit Committee,Helen Kirkpatrick B.A., F.C.A., hasappropriate recent and relevant financialexperience. The Board is satisfied that thecombined qualifications and experience ofthe members give the committee collectivelythe financial expertise necessary todischarge its responsibilities. The reportof the Audit Committee is set out in thisAnnual Report.

39
2009
Nominations CommitteeThe Nominations Committee assists theBoard in ensuring that the composition ofthe Board and its committees is appropriatefor the needs of the Group. The committeemeets at least once a year, and additionallyif required, to consider the Board’smembership, to identify any additional skillsor experience which might benefit theBoard’s performance and recommendappointments to or, where necessary,removals from, the Board.
Remuneration CommitteeThe Remuneration Committee hasresponsibility for setting remuneration for allexecutive directors and for the Chairman,including pension contributions and anycompensation payments. The committeealso monitors the level and structure ofremuneration for senior management.The report of the Remuneration Committeeis set out in this Annual Report.
Communication with shareholdersThe Company places great emphasis onmaintaining regular and responsible dialoguewith shareholders. This is achieved throughmeetings with institutional investors,presentations to brokers and analysts, andmaking relevant information available on theCompany’s website, www.kingspan.com ina timely fashion. Twice a year, followingpublication of the annual and half-yearresults, the Chief Executive and the FinanceDirector meet with institutional investorsduring a formal results roadshow.In addition, the Company encouragescommunication with all shareholders, andwelcomes their participation at AnnualGeneral Meetings. All shareholders whoattend the Company’s Annual GeneralMeeting are given the opportunity toquestion the Chairman and other membersof the Board, including the chairmen of thecommittees, on any aspect of the Group’sbusiness.
Internal control and riskmanagement systemsThe Group’s internal control system areidentified in the Report of the AuditCommittee. The main features of theGroup’s internal control and riskmanagement systems that relate specificallyto the Group’s financial reporting andaccounts consolidation process are:
• the review of reporting packages for eachentity as part of the year-end auditprocess;
• the reconciliation of reporting packages tomonthly management packs as part ofthe audit process and as part ofmanagement review;
• the validation of consolidation journals aspart of the management review processand as an integral component of the year-end audit process;
• the review and analysis of results by theGroup Finance Director and the Auditorswith the management of each division;
• the review of audit management lettersby the Group Finance Director, Head ofInternal Audit and the Audit Committee;and the follow up of any criticalmanagement letter points to ensureissues highlighted are addressed.
Statement of complianceThe directors confirm that the Company,except in the respects more fully describedbelow, has throughout the accountingperiod ended 31 December 2009 compliedwith the provisions of the 2008 FRCCombined Code on Corporate Governance:
• During the year less than half theBoard, excluding the Chairman, wereindependent non-executive directors.It is the view of the Board that the rangeand blend of skills match the needs of thebusiness and facilitate a sound decision-making process and control environment.It is also their view that there is sufficientbalance in the Board, including a strongand independent non-executive element,so that no individual or group ofindividuals can dominate decisionmaking. The Board is committed torefreshing and strengthening theindependent representation on theBoard on an on-going basis.
• The Nominations Committee did not useexternal consultants or open advertisingwhen appointing Danny Kitchen as a non-executive director to the Board. It utilisedindustry and professional contacts toidentify suitable candidates and consultedwith the IAIM regarding the appointment.
• The remuneration of the non-executivedirectors is set by the RemunerationCommittee on advice from independentprofessional advisors, rather than by theBoard as a whole, and is benchmarkedagainst other Irish and European quotedcompanies of similar size.

40
Corporate Social Responsibility
long-term objectives and targets relatedto sustainability and review progressregularly;
• comply or exceed applicable legal andpolicy requirements related to theenvironmental and social aspects ofthe organisation;
• optimise energy and raw material usageand prevent or minimise pollution andenvironmental damage;
• develop a framework to continuallymonitor sustainability performance andactively communicate progress annuallyin the form of a published sustainabilityreport, using the Global ReportingInitiative (GRI) guidelines;
• communicate and actively promoteawareness and acceptance of this policyto everyone working for or on behalf ofKingspan (including employees,shareholders, suppliers / sub-contactorsand customers);
• ensure employees are given adequatetraining in sustainability issues and arefully involved in helping deliver theKingspan Group Sustainability Vision& Policy; and
To this end, Kingspan has adopted asustainability policy which is beingimplemented across the Group.The ambition is for Kingspan:
“To be a global leader in sustainablebusiness and establish a leading position inproviding ethical, renewable and affordablebest practice solutions for the constructionsector.”
Striving for sustainability in all our businessproducts and operations is our corporateand personal responsibility. Kingspan aimsto adopt and apply best practicesustainability principles by ensuringenvironmental, social and economicparameters are considered in an integratedway in product and service delivery.
To deliver on this vision Kingspan will:
• incorporate the ethos of sustainability intothe vision and values of the organisation;
• continue to invest in research anddevelopment in the area of maximisinginsulation values in products, and theintegration of renewable energy productsinto the Kingspan solution;
• continually improve operationalperformance through the setting of
• implement a Code of Conduct andsupporting sustainability guidelines forkey suppliers and contractors and otherinterested parties to ensure they complywith the Kingspan Group SustainabilityPolicy.
Full details of Kingspan’s Corporate SocialResponsibility activities can be found onour website at www.kingspan.com.
Energy/carbon reductionsSince 2005 almost 250 million tonnes a yearof CO2 were emitted as a result of energyuse in UK buildings, and globally residential,commercial and industrial buildings areresponsible for 40% of total carbonemissions. Much of the building stock hasbeen in existence for many years and inorder to reduce the overall energy demandarising from the built environment it isessential that energy efficiency is addressednot just in new build, but also in therefurbishment of existing buildings.
Kingspan’s sustainable Energi Centre inHolywell is a show piece of energy efficiency.It is constructed primarily with products fromthe Kingspan range, demonstrating keyelements of Kingspan’s “Insulate andGenerate” theme, including:
• Insulated Panels - on the roof and walls,providing maximum insulation andair-tightness in a completely fibre freeenvironment without any degradation ofthe insulation effectiveness during the lifeof the building;
• Solar Heating System – Thermomaxvacuum tubes from KingspanRenewables are mounted on the roof.The solar generated heat is transferred viaa heat exchanger coil into the buildingshot water system, which is used to heatthe gas fired hot water generator.This ensures that hot water is available atall times at the lowest cost and minimumcarbon emissions;
• Rainwater Recovery Technology - fromKingspan’s Environmental range.A 10,000 litre underground tank collectsrainwater from the Kingspan roof drainagesystem. The tank incorporates a lowenergy pump to raise the collected waterto a water storage tank from where it isdistributed for use in the building;
• Solar Photovoltaic Panels - ten Kingspanpowerpanels, comprising buildingintegrated insulated photovoltaic panelswith peak out put of 210 watts, havebeen installed on the Kingspan roof andare connected to the national grid;
Kingspan’s Energi Centre, Holywell, North Wales
Our ambitionKingspan recognises the importance of conducting its business in a sociallyresponsible manner. This is demonstrated in the way we deal with our employees,customers and the wider community where we operate. Kingspan considers thatcorporate social responsibility is an integral element of good business management.

41
2009
These are the first reports in an annualsustainability reporting cycle which we hopewill demonstrate performance improvementsacross the Group. The scope of these GRIreports will be expanded progressivelythroughout Kingspan’s other divisions inover the coming years.
Sustainable product stewardshipThe Building Research Establishment(BRE) has developed an environmentalassessment tool (BREEAM) which helpsconstruction professionals calculate theenvironmental impacts of their buildingdevelopments. Greater importance will begiven to energy, transport, material andwaste in the weighting system with the aimof making it more difficult to achieve thepoints needed to achieve BREEAM Excellentand the new BREEAM Outstanding. TheBRE environmental profiling methodology,which is ISO 14041 compliant, was originallydeveloped to enable robust and reliablecomparison between different constructionsystems. “A” rated products gain additionalcredits for buildings assessed byenvironmental assessment methodologiessuch as BREEAM. To date certifiedenvironmental profiles have been awarded tomany of Kingspan’s key Insulated Panel andInsulation Board products, and work isongoing to extend certification to all keyproducts. Such a rating will enablecustomers of Kingspan to compare theenvironmental impact of Kingspan’sproducts with alternatives, and it will allowKingspan to identify areas of potentialimprovement.
Kingspan Insulated Panels has adopted theBRE’s Environmental Profiles AssessmentMethodology to quantify the environmentalimpact of its Insulated Panels. To this endthe BRE analysed data across a range ofenvironmental issues, from cradle (inceptionand raw materials) to grave (disposal) ofsome of Kingspan Insulated Panels’ keyproducts. This is known as lifecycleassessment (LCA) and is becomingincreasingly important given the pressuresbeing placed upon the global environment.Kingspan’s is delighted that its architecturalwall panel and trapezoidal roof and wallproduct range have all been reassessedunder the new BRE Green Guide toSpecification and achieved ‘A+’ ratings.
Kingspan Insulation obtained a BRE certifiedLife Cycle Assessment for its Therma™
• Access Floors - from Kingspan AccessFloors have been installed throughout thebuilding. These floors facilitate underfloorair conditioning which is significantly cheaper to run and creates a healthierenvironment than overhead systems aswell as facilitating the cable managementfor the whole building;
• Kooltherm® - pipe and ducting insulationfrom Kingspan Insulation was usedthroughout. This provides totally fibre freeinsulation to the pipework and ducting tocreate a healthy environment for staff andof course the insulation will be effective forthe life of the building.
Through the development of the ZeroCarbon home (the technology in which canequally be applied in commercial buildings),which in itself already meets the 2016 zeronet carbon target outlined in the UK’s Codefor Sustainable Homes, Kingspandemonstrated the innovation that it candeliver to investors and building occupierswho are increasingly demanding higherrenewable content in their building fabric.The spirit of the UK code is being replicatedthrough industry initiatives and legislativeframeworks around the globe as theimportance of the climate challenge gainsmomentum, and with this will come muchhigher insulation standards, rainwaterrecovery, use of renewables such as solarhot water and power generation, allproducts currently in the Kingspan suite.
Performance & measurementKingspan has for many years promoted andsponsored CSR reporting across all itsbusiness divisions.
Kingspan Insulation has been producingfull sustainability reports since 2004. Theprocess of assessment by accredited thirdparties began in 2003, when KingspanInsulation was the first insulationmanufacturer to complete an independentlycertified Life Cycle Assessment (LCA) onone of its products. However, the companywas quick to recognise that, valuable thoughthe LCA process was in assessing theenvironmental impact of the product, it wasonly one aspect of the whole issue ofsustainability. Kingspan Insulationdetermined to put sustainability at the heartof its operations and so commissioned a fullassessment of its performance using theSustainable Project Appraisal Routine(SPeAR®) developed by Ove Arup &Partners Ltd. For the last five years SPeAR®
has been central to how the company
assesses and forms its sustainability actionplan. The whole spectrum of itsmanufacturing activities was examined foreconomic, social, environmental and naturalresource impact and an action plan forimprovement agreed. The exercise has beenrepeated on an annual basis since, toassess progress and continue thesustainable development of the business.
The annual SPeAR® appraisal continuesto be undertaken, whilst the latest report(2008) has been enhanced by the use ofthe Global Reporting Initiative (GRI) G3Sustainability Reporting Guidelines to ensurea robust reporting procedure. The GRIguidelines provide a globally recognisedframework for reporting on an organisation’seconomic, social and environmentalperformance. The report achieves a Level Bin accordance with GRI reportingrequirements. The Insulation businessescovered by this GRI report accounted forapproximately 10% of Group turnover lastyear.
Kingspan Insulated Panels division has beenproducing sustainability reports using theGRI guidelines since 2006. The latest report(2008) has achieved a Level C standard, andits scope has been expanded from the initialUK & Ireland sites, to include all itsmanufacturing and sales offices in WesternEurope, Australia and New Zealand.The businesses covered by this reportaccounted for approximately 30% of the
Group turnover in 2009. Lastyear Kingspan Insulated Panelsachieved 1st place for Walesfor the second year running,and 21st place overall, in theSunday Times Green List.

42
Corporate Social Responsibility
As part of our ISO 14001 managementsystem, Kingspan is also committed toreducing the levels of waste generated byproducts when they reach constructionsites, and ultimately to providing an end-of-life solution for the disposal of all non-reusable products. Certain facilities in theGroup now offer a full pallet return serviceand we have also launched trials onrecycling all Kingspan Insulated Panels’packaging from construction sites. In currentproduction, waste PIR is now being recycledback into the manufacturing process at ourInsulated Panel site in Ireland, and in thecase of Insulation Boards, off-cuts fromwaste are used in substitution for pallets.
In recognition of the environmental impactsassociated with the chemicals industry,Kingspan Insulation’s Environmental
Purchasing Policy and Resource Use Policystate that every effort will be made toreplace all or part of the base chemicalinputs with materials derived from wastestreams from other chemical or productionprocesses, by utilising other recyclablewaste, or from sources with an otherwiselower environmental impact. The company iscontinually looking for opportunities to utilisere-used or recycled materials in theproduction process, where they will notcompromise product quality. All polyols usedare made from recycled industrial wastestream, 23% of the steel Kingspan uses isfrom a recycled source, and the timber usedin the off-site business is all sourced fromsustainable managed forests.
range of products in 2002. Annualimprovements and assessments have beenundertaken for Therma™ since then, withthe range now achieving an ‘A’ rating inthe BRE Green Guide to Specification.A certified Life Cycle Assessment is nowalso in preparation for the Kooltherm® rangeaccording to the criteria of the new BREGreen Guide to Specification which it ishoped to achieve in 2010.
In 2008, Kingspan Insulation commencedwork towards certification against the BREEnvironmental and Sustainability Standard(BES) 6001: Framework Standard forResponsible Sourcing of ConstructionProducts. The company began to engagewith key first tier materials suppliers to raiseawareness of sustainability issues down thesupply chain and to encourage highstandards of environmental, quality, andhealth and safety performance.
Managing wasteKingspan is committed to the principles ofthe waste hierarchy: avoid, reduce, re-use,recycle, and dispose responsibly. Kingspan’sEnvironmental Purchasing Policy ensuresthat the focus remains on waste elimination,but where the scope for improvementremains limited, waste will be disposed of bythe most environmentally sustainablemeans. The company aims to ensure thatthe Best Practical Environmental Option(BPEO) is applied to all waste streams.The purchasing department actively pursuesthe most appropriate materials andtechnologies which reduce overall wasteand the company’s environmental impact.We currently recycle steel, paper, cardboard,wood and plastic at all Kingspanmanufacturing sites.
Commercial Cradle to Grave Diagrams
Best Performing Roof Specifications
Worst Performing Roof Specifications
High Performing Specifications Poor Performing Specifications
A+ A B C D E
Best Performing Wall Specifications
Worst Performing Wall Specifications
High Performing Specifications Poor Performing Specifications
A+ A B C D E
Roof Specification*
Wall Specification†
KS600/900/1000 AWP0.52 Ecopoints
Kingspan KS1000 RW0.45 Ecopoints
Kingspan KS1000 RW0.45 Ecopoints
* Low Pitched Roof: KS1000 RW Panel with insulation core manufactured at Holywell. Supported on cold rolled steelpurlins and structural sections. Steel facings; generic organic coatings. Insulation 120mm core thickness.
† External Wall: KS1000 RW Panel with insulation core manufactured at Holywell vertically laid. Supported on coldrolled steel rails. Steel facings; generic organic coatings. Insulation 70mm core thickness. KS600/900/1000 AWP Panel with
insulation core manufactured at Holywell horizontally laid. Supported on cold rolled steel rails and structural frame.Steel facings; generic organic coatings. Insulation 80mm core thickness.
An ambitious waste to landfill reduction target of 20.0% was set for 2008.Kingspan did achieve this target with an overall reduction of waste to landfillof 20.0%. An ambitious target of a 20.0% reduction has again been set for 2009.
Insulated PanelsTotal weight of waste in tonnes (landfill)
The decrease in % of waste downcycled is a reflectionof a downturn in the market for the products into whichinsulation waste it is processed.
Insulation BoardsPercentage of waste recycled,downcycled or reused
2008
Target
2007

43
2009
Kingspan also recognises the necessity tominimise consumption of water resourceson-site, particularly from municipal supplies.The company aims to act responsibly andcomply with all relevant legislation inconserving water, managing water suppliesto site, and monitoring water that escapesfrom site in diffuse form and from pointsources. Kingspan aspires to best practicewater management and aims for continualimprovement in water use.
Employee safety and skillsKingspan values its staff and strives toprovide excellent working conditions andcareer development prospects for allemployees. Annual investments are madein staff training and development to ensureindividuals’ continual learning anddiversification of skills. Kingspan recognisesits influence in local employment marketsand seeks to bolster the economic welfareof surrounding communities through therecruitment of local people.
Kingspan has a strong reputation for healthand safety in the workplace and takesseriously its responsibility for staff welfare.
In the UK, reviews carried out as part of theInvestor in People framework have noted thecompany’s approach to occupational healthand wellbeing as a particular strength, andinvestments continue to be made to ensurethese high standards are maintained.Provision of a high quality workingenvironment is viewed as fundamental tomaintaining healthy and motivated staff,and to retaining staff for the long-term.
OHSAS 18001, in conjunction withincreased resources applied to themanagement of health and safety, hashelped to deliver significant improvementin performance. Since 2006 KingspanInsulated Panels has achieved OHSAS18001 at all of its UK, Ireland and WesternEurope manufacturing sites, and KingspanInsulation is working towards achievingOHSAS 18001 at its new Selby site, and hasalready achieved it on its other sites since2005. Kingspan Insulated Panels recentlywon the ROSPA Gold Award for Safety forthe second year running, recognising its welldeveloped occupational health and safetymanagement systems and culture,outstanding control of risk and very lowlevels of error, harm and loss.
* Rates for our Holywell, Kingscourt & Sherburn facilities. † Whole division.
Insulated PanelsAccident rate(per 1000 hours worked)
Insulated PanelsDays lost due to accidents
Insulation Boards Accident rate(per 1000 hours worked)
Insulation BoardsDays lost due to accidents
Lost Days as a % of total man days workedduring the year
Social & community responsibilityKingspan acknowledges the importanceof fostering strong relationships with thecommunities in which it operates, and takesa proactive approach to be a responsibleneighbour to local groups.
The Kingspan Insulation Community Trustwas established in 2006 as a registeredcharity, through which the company donatesto community initiatives in Shobdon,Pembridge and Kingsland, Herefordshire.To date, almost £75,000 has been awardedfor projects supporting conservation andbiodiversity, health and fitness of youngpeople, or promotion of road safety in thelocal community. Further details on thisTrust can be found on its website:
2008
Target
2007
www.kingspaninsulationcommunitytrust.org
Kingspan is also proud to support thework of the Irish Hospice Foundation,by sponsoring its fundraising Dublin toParis/Paris to Geneva cycle challenges.The Irish Hospice Foundation is a fantasticorganisation which supports thedevelopment of hospice care and promotesthe hospice philosophy in Ireland.More information on its good work can befound at its website:
www.hospice-foundation.ie
44
Statement of Directors’ Responsibilities
The directors are responsible for preparingthe Annual Report and the financialstatements in accordance with applicableIrish law and regulations.
Company law in Ireland requires thedirectors to prepare financial statements foreach financial year. Under that law thedirectors have to prepare financialstatements in accordance with InternationalFinancial Reporting Standards as adoptedby the European Union (IFRSs). The financialstatements are required by law to give a trueand fair view of the state of affairs of theGroup and parent company and of the profitor loss of the Group for that period.
In preparing those financial statements,the directors are required to:
• select suitable accounting policies andthen apply them consistently;
• make judgements and estimates that arereasonable and prudent;
• state whether applicable IFRSs have beenfollowed, subject to any materialdepartures disclosed and explained inthe financial statements; and
• prepare the financial statements on thegoing concern basis unless it isinappropriate to presume that theCompany, and the Group as a whole,will continue in business.
The directors are responsible for keepingproper accounting records which disclosewith reasonable accuracy at any time thefinancial position of the Company and whichenable them to ensure that the financialstatements are prepared in accordance withaccounting standards generally accepted inIreland, and comply with the CompaniesActs 1963 to 2009 and Article 4 of the IASRegulation.
They are responsible for safeguarding theassets of the Group and hence for takingreasonable steps for the prevention anddetection of fraud and other irregularities.
In so far as each of the directors is aware:
• there is no relevant audit information ofwhich the Company's auditors areunaware; and
• the directors have taken all steps that theyought to have taken to make themselvesaware of any relevant audit informationand to establish that the auditors areaware of that information.
The directors are responsible for themaintenance and integrity of the corporateand financial information on the Company’swebsite. Legislation in the Republic ofIreland governing the preparation anddissemination of financial statements maydiffer from legislation in other jurisdictions.
In accordance with Transparency (Directive2004/109/EC) Regulations, we confirm thatto the best of our knowledge:
• the financial statements, prepared inaccordance with the applicable set ofaccounting standards, give a true andfair view of the assets, liabilities, financialposition and profit or loss of the Companyand the undertakings included in theconsolidation taken as a whole; and
• the management report includes a fairreview of the development andperformance of the business and theposition of the Company and theundertakings included in the consolidationtaken as a whole, together with adescription of the principal risks anduncertainties that they face.
By order of the Board
Gene Murtagh Dermot MulvihillChief Executive Group Finance Officer Director
1 March 2010

45
Independent Auditors’ Report to the Members of Kingspan Group plc 2009
We have audited the Group and parentcompany Financial Statements of KingspanGroup plc for the year ended 31 December2009 which comprise the ConsolidatedIncome Statement, Consolidated Statementof Comprehensive Income, Consolidatedand Parent Company Statements ofFinancial position, Consolidated and ParentCompany Statements of Changes in Equity,Consolidated and Parent Cash FlowStatements and the related notes. TheseFinancial Statements have been preparedunder the accounting policies set outtherein.
Respective Responsibilitiesof Directors and IndependentAuditorsThe Directors’ responsibilities for preparingthe Annual Report and the FinancialStatements in accordance with applicablelaw and International Financial ReportingStandards (IFRSs), as adopted for use inthe European Union, are set out in theStatement of Directors' Responsibilities.
Our responsibility is to audit the FinancialStatements in accordance with relevantlegal and regulatory requirements andInternational Standards on Auditing(UK and Ireland).
This report is made solely to the Company’smembers, as a body, in accordance withSection 193 of the Companies Act, 1990and Regulations 9 and 13 of the EuropeanCommunities (Directive 2006/46/EC)Regulations, 2009 and for no other purpose.We do not, in giving this opinion, accept orassume responsibility for any other purposeor to any other person to whom this report isshown or into whose hands it may comesave where expressly agreed by our priorconsent in writing.
We report to you our opinion as to whetherthe Group Financial Statements give a trueand fair view, in accordance with IFRSs asadopted for use in the European Union. Wereport to you our opinion as to whether theparent Financial Statements give a true andfair view in accordance with IFRSs asadopted for use in the European Union, asapplied in accordance with the provisions ofthe Companies Acts, 1963 to 2009. We alsoreport to you whether the FinancialStatements have been properly prepared inaccordance with the Companies Acts, 1963to 2009 and Article 4 of the IAS Regulation.We also report to you whether, in ouropinion: proper books of account have beenkept by the Company; whether, at thestatement of financial position date, thereexists a financial situation requiring theconvening of an Extraordinary GeneralMeeting of the Company; and whether theinformation given in the directors’ report isconsistent with the Financial Statements.In addition, we state whether we haveobtained all the information and explanationswe consider necessary for the purposes ofour audit, and whether the FinancialStatements are in agreement with the booksof account.
We also report to you if, in our opinion, anyinformation specified by law or the ListingRules of the Irish Stock Exchange regardingdirectors’ remuneration and directors’transactions is not disclosed and, wherepracticable, include such information in ourreport. We are required by law to establishthat the Company has produced aCorporate Governance Statement andwhether the Statement contains theinformation required by law. We reviewwhether the Corporate GovernanceStatement reflects the Company’s
compliance with the nine provisions of theJune 2008 Combined Code specified for ourreview by the Listing Rules of the Irish StockExchange, and we report if it does not. Weare also required to report to you if, in ouropinion, the description in the Statement ofthe main features of the internal control andrisk management systems in relation to theprocess for preparing consolidatedaccounts, is consistent with the FinancialStatements. We are not required to considerwhether the Board's statements on internalcontrol cover all risks and controls, or forman opinion on the effectiveness of theGroup’s corporate governance proceduresor its risk and control procedures.We also consider and report to you whetherthe information required under sub-paragraphs (c), (d), (f), (h) and (i) ofparagraph (2) of Regulation 21 of theEuropean Communities (Takeover Bids(Directive 2004/25/EC)) Regulations 2006about share capital structures, and includedin the Corporate Governance Statement, isconsistent with the Financial Statements.
We read the other information contained inthe Annual Report and consider whether itis consistent with the audited FinancialStatements. This other informationcomprises only the Chairman’s Statement,the Chief Executive’s Review, the FinancialReview, the Business Risk Analysis, theDirectors’ Report,the Corporate GovernanceStatement and the Corporate SocialResponsibility Statement. We consider theimplications for our report if we becomeaware of any apparent misstatements ormaterial inconsistencies with the FinancialStatements. Our responsibilities do notextend to any other information.

Independent Auditors’ Report to the Members of Kingspan Group plc
46
Basis of Audit OpinionWe conducted our audit in accordance withInternational Standards on Auditing (UK andIreland) issued by the Auditing PracticesBoard. An audit includes examination, ona test basis, of evidence relevant to theamounts and disclosures in the FinancialStatements. It also includes an assessmentof the significant estimates and judgmentsmade by the Directors in the preparation ofthe Financial Statements, and of whether theaccounting policies are appropriate to theGroup's and parent Company’scircumstances, consistently applied andadequately disclosed.
We planned and performed our auditso as to obtain all the information andexplanations which we considerednecessary in order to provide us withsufficient evidence to give reasonableassurance that the Financial Statements arefree from material misstatement, whethercaused by fraud or other irregularity or error.In forming our opinion, we also evaluatedthe overall adequacy of the presentation ofinformation in the Financial Statements.
OpinionIn our opinion:• the Group Financial Statements give a
true and fair view, in accordance with theIFRSs as adopted for use in the EuropeanUnion, of the state of the Group’s affairsas at 31 December 2009 and of its resultfor the year then ended;
• the parent company Financial Statementsgive a true and fair view in accordancewith the IFRSs as adopted for use in theEuropean Union as applied in accordancewith the provisions of the CompaniesActs, 1963 to 2009, of the state ofthe parent company’s affairs as at31 December 2009;
• the Financial Statements have beenproperly prepared in accordance with theCompanies Acts, 1963 to 2009 andArticle 4 of the IAS Regulation; and
• the information given in the CorporateGovernance Statement set out in theAnnual Report:
- with respect to the description of themain features of the internal control andrisk management systems in relation tothe process for preparing theconsolidated Financial Statements; and
- about share capital structures inaccordance with sub-paragraphs (c),(d), (f), (h) and (i) of paragraph (2) ofRegulation 21 of the EuropeanCommunities (Takeover Bids (Directive2004/25/EC)) Regulations 2006
is consistent with the Financial Statements.We have obtained all the information andexplanations we consider necessary for thepurposes of our audit. In our opinion, properbooks of account have been kept by theCompany. The Company balance sheet isin agreement with the books of account.
In our opinion, the information given in theDirectors’ Report is consistent with theFinancial Statements.
The net assets of the Company, as statedin the Company Statement of FinancialPosition, are more than half of the amountof its called–up share capital and, in ouropinion, on that basis, there did not existat 31 December 2009 a financial situationwhich, under Section 40 (1) of theCompanies (Amendment) Act, 1963, wouldrequire the convening of an extraordinarygeneral meeting of the Company.
GRANT THORNTONChartered Accountants andRegistered Auditors24-26 City QuayDublin 223 March 2010

Financial Statements 47
Consolidated Income Statement 48Consolidated Statement of Comprehensive Income 49Consolidated Statement of Financial Position 50Consolidated Statement of Changes in Equity 51Consolidated Cash Flow Statement 53Company Statement of Financial Position 54Company Statement of Changes in Equity 55Company Cash Flow Statement 56Notes to the Financial Statements 57Group Five Year Summary 98
47
Financial Statements 2009

48
Financial Statements 2009
Total Total2009 2008
Note €‘000 €‘000
6 REVENUE 1,125,523 1,672,714
COST OF SALES (816,610) (1,205,239)
GROSS PROFIT 308,913 467,475
Operating costs (241,858) (305,739)
TRADING PROFIT 67,055 161,736Intangible amortisation (4,396) (4,615)Non trading items - (75,077)
OPERATING PROFIT 62,659 82,0448 Finance cost (12,750) (15,466)8 Finance income 6,770 1,556
9 PROFIT FOR THE YEAR BEFORE TAX 56,679 68,13411 Income tax expense (8,712) (24,151)
NET PROFIT FOR THE YEAR 47,967 43,983
Attributable to shareholders of Kingspan Group plc 47,658 44,990Attributable to minority interest 309 (1,007)
47,967 43,983
EARNINGS PER SHARE FOR THE YEAR12 Basic 28.7c 26.7c12 Diluted 28.3c 26.5c
Gene M. Murtagh, Chief ExecutiveDermot Mulvihill, Finance Director1 March 2010
Consolidated Income Statementfor the year ended 31 December 2009

49
Financial Statements 2009
Total Total2009 2008
Note €‘000 €‘000
Net result for financial period 47,967 43,983
Other comprehensive income:29 Cash flow hedging in equity - current year (389) 6,65829 Cash flow hedging in equity - reclassification to profit and loss (6,658) (1,702)39 Actuarial losses in defined benefit pension scheme (3,951) (1,640)29 Currency translation 22,341 (131,424)
Income taxes relating to items charged or credited to equity 1,106 452
Total comprehensive income for the year 60,416 (83,673)
Attributable to shareholders of Kingspan Group plc 60,107 (82,666)Attributable to minority interest 309 (1,007)
60,416 (83,673)
Consolidated Statement of Comprehensive Incomeas at 31 December 2009

50
Financial Statements 2009
2009 2008Note €‘000 €‘000
ASSETSNON-CURRENT ASSETS
13 Goodwill 300,021 279,77714 Other intangible assets 10,305 13,16816 Property, plant and equipment 399,989 411,06817 Long term financial assets 10 21026 Deferred tax assets 2,950 1,228
713,275 705,451
CURRENT ASSETS18 Inventories 110,821 159,11619 Trade and other receivables 203,505 299,189
Cash and cash equivalents 83,886 75,254398,212 533,559
20 Non-current assets classified as held for sale 19,010 -417,222 533,559
TOTAL ASSETS 1,130,497 1,239,010
LIABILITIESCURRENT LIABILITIES
21 Trade and other payables 191,071 236,02925 Provisions for liabilities 59,059 56,467
Derivative financial instrument 917 -23 Contingent deferred consideration 698 4,980 22 Interest bearing loans and borrowings 31,863 16,857
Current tax liabilities 32,914 34,314 316,522 348,647
NON-CURRENT LIABILITIES39 Retirement benefit obligations 3,666 3,738 22 Interest bearing loans and borrowings 201,141 345,249
Derivative financial instrument 6,042 -26 Deferred tax liabilities 14,982 14,50423 Contingent deferred consideration 2,609 7,790
228,440 371,281
TOTAL LIABILITIES 544,962 719,928
NET ASSETS 585,535 519,082
EQUITYEQUITY ATTRIBUTABLE TO SHAREHOLDERS OF KINGSPAN GROUP PLC
27 Share capital 22,296 22,26528 Share premium account 36,486 35,75129 Other reserves (178,742) (194,036)30 Revaluation reserve 713 71331 Capital redemption reserve 723 72332 Retained earnings 699,373 651,841
580,849 517,257
34 Minority interest 4,686 1,825
TOTAL EQUITY 585,535 519,082
Gene M. Murtagh, Chief ExecutiveDermot Mulvihill, Finance Director1 March 2010
Consolidated Statement of Financial Positionas at 31 December 2009

51
Financial Statements 2009
Capital Share Redemption & Total
Share Premium Other Revaluation Retained Attributable Minority TotalCapital Account Reserves Reserves* earnings to Owners Interest Equity€‘000 €‘000 €‘000 €‘000 €‘000 €‘000 €‘000 €‘000
At 1 January 2009 22,265 35,751 (194,036) 1,436 651,841 517,257 1,825 519,082
Shares issued 31 654 - - - 685 - 685
Employeeshare basedcompensation - - - - 2,800 2,800 - 2,800
Exercise ofemployeeshare basedcompensation - 81 - - (81) - - -
Transaction withowners 31 735 - - 2,719 3,485 - 3,485
Profit for the period - - - - 47,658 47,658 309 47,967
Other comprehensiveincome:
Cash flow hedgingin equity
- current year - - (389) - - (389) - (389)
- reclassification to profitand loss - - (6,658) - - (6,658) - (6,658)
Defined benefit pensionscheme - - - - (3,951) (3,951) - (3,951)
Tax on defined benefitpension scheme - - - - 1,106 1,106 - 1,106
Currency translation - - 22,341 - - 22,341 - 22,341
Total comprehensiveincome for the period - - 15,294 - 44,813 60,107 309 60,416
Other transactionswith minority interest:
Currency translation - - - - - - 339 339
Movement in minorityinterest - - - - - - 2,213 2,213
At 31 December 2009 22,296 36,486 (178,742) 1,436 699,373 580,849 4,686 585,535
* Capital Redemption and Revaluation reserves are €723,000 and €713,000 respectively. There were no movements on thesebalances since 31 December 2008.
Consolidated Statement of Changes in Equity

52
Financial Statements 2009
Consolidated Statement of Changes in Equity
Capital Share Redemption & Total
Share Premium Other Revaluation Retained Attributable Minority TotalCapital Account Reserves Reserves earnings to Owners Interest Equity€‘000 €‘000 €‘000 €‘000 €‘000 €‘000 €‘000 €‘000
At 1 January 2008 22,146 31,917 (67,568) 1,436 681,755 669,686 3,230 672,916
Shares issued 119 2,574 - - - 2,693 - 2,693
Employeeshare basedcompensation - - - - 2,372 2,372 - 2,372
Exercise ofemployeeshare basedcompensation - 1,260 - - (1,260) - - -
Share buyback - - - - (32,565) (32,565) - (32,565)
Dividends - - - - (42,262) (42,262) - (42,262)
Transaction withowners 119 3,834 - - (73,716) (69,763) - (69,763)
Profit for the period - - - - 44,990 44,990 (1,007) 43,983
Other comprehensiveincome:
Cash flow hedgingin equity
- current year - - 6,658 - - 6,658 - 6,658
- reclassification to profitand loss - - (1,702) - - (1,702) - (1,702)
Defined benefit pensionscheme - - - - (1,640) (1,640) - (1,640)
Tax on defined benefitpension scheme - - - - 452 452 - 452
Currency translation - - (131,424) - - (131,424) - (131,424)
Total comprehensiveincome for the period - - (126,468) - 43,802 (82,666) (1,007) (83,673)
Other transactionswith minority interest:
Currency translation - - - - - - (288) (288)
Movement in minorityinterest - - - - - - (110) (110)
At 31 December 2008 22,265 35,751 (194,036) 1,436 651,841 517,257 1,825 519,082

53
Financial Statements 2009
Consolidated Cash Flow Statementfor the year ended 31 December 2009
2009 2008Note €‘000 €‘000
OPERATING ACTIVITIES
Profit for the year before tax 56,679 68,134 35 Adjustments 50,967 107,692
Change in inventories 50,723 (4,218)Change in trade and other receivables 108,398 52,018Change in trade and other payables (53,958) 4,715Pension contributions (2,927) (2,611)
Cash generated from operations 209,882 225,730Taxes paid (10,119) (18,121)
Net cash flow from operating activities 199,763 207,609
INVESTING ACTIVITIESAdditions to property, plant and equipment (48,592) (100,044)Proceeds from disposals of property, plant and equipment 2,715 2,470Proceeds from sale of financial assets 200 -Purchase of subsidiary undertakings (6,566) (87,700)Net (loans)/cash acquired with acquisitions (183) 3,184Payment of deferred consideration in respect of acquisitions (11,196) (2,521)Interest received 1,840 1,587
Net cash flow from investing activities (61,782) (183,024)
FINANCING ACTIVITIES(Repayment)/increase of bank loans (139,093) 84,577Discharge of finance lease liability (574) (1,350)Proceeds from share issues 685 2,693Buyback of own shares - (32,565)Interest paid (14,752) (14,255)Dividends paid to minorities (340) (71)Dividends paid - (42,262)
Net cash flow from financing activities (154,074) (3,233)
CASH AND CASH EQUIVALENTS AT THE BEGINNING OF THE YEAR 74,272 62,938
(Decrease)/increase in cash and cash equivalents (16,093) 21,352Translation adjustment 1,738 (10,018)
CASH AND CASH EQUIVALENTS AT THE END OF THE YEAR 59,917 74,272
Cash and cash equivalents as at 1 January were made up of:Cash and cash equivalents 75,254 66,626Overdrafts (982) (3,688)
74,272 62,938
Cash and cash equivalents as at 31 December were made up of:Cash and cash equivalents 83,886 75,254Overdrafts (23,969) (982)
59,917 74,272

54
Financial Statements 2009
Company Statement of Financial Positionas at 31 December 2009
Restated Restated2009 2008 2007
Note €‘000 €‘000 €‘000
ASSETS
NON-CURRENT ASSETS17 Investments in subsidiaries 1,077,459 26,943 25,070
CURRENT ASSETS19 Trade and other receivables 263,652 60,740 79,583
263,652 60,740 79,583
TOTAL ASSETS 1,341,111 87,683 104,653
LIABILITIES
CURRENT LIABILITIES21 Trade and other payables - - 6,490
TOTAL LIABILITIES - - 6,490
NET ASSETS 1,341,111 87,683 98,163
EQUITY
Equity attributable to Shareholders of Kingspan Group plc27 Share capital 22,296 22,265 22,14628 Share premium account 36,486 35,751 31,51031 Capital redemption reserve 723 723 72332 Retained earnings 1,281,606 28,944 43,784
TOTAL EQUITY 1,341,111 87,683 98,163
Gene M. Murtagh, Chief ExecutiveDermot Mulvihill, Finance Director1 March 2010

55
Financial Statements 2009
Company Statement of Changes in Equity
Share TotalShare Premium Redemption Retained Attributable
Capital Account Reserves Earnings to Owners€‘000 €‘000 €‘000 €‘000 €‘000
At 1 January 2009 22,265 35,751 723 28,943 87,682
Shares issued 31 654 - - 685
Employee share based compensation - - - 1,199 1,199
Exercise of employee share based compensation - 81 - (81) -
Transactions with owners 31 735 - 1,118 1,884
Profit for the period - - - 1,251,545 1,251,545
Total comprehensive income for the period - - - 1,251,545 1,251,545
At 31 December 2009 22,296 36,486 723 1,281,606 1,341,111
TotalShare Retained
Share Premium Redemption Earnings AttributableCapital Account Reserves Restated* to Owners€‘000 €‘000 €‘000 €‘000 €‘000
At 1 January 2008 22,146 31,510 723 43,784 98,163
Shares issued 119 2,981 - - 3,100
Employee share based compensation - - - 2,372 2,372
Exercise of employee share based compensation - 1,260 - (1,260) -
Share buyback - - - (32,565) (32,565)
Dividends - - - (42,262) (42,262)
Transactions with owners 119 4,241 - (73,715) (69,355)
Profit for the period - - - 58,875 58,875
Total comprehensive income for the period - - - 58,875 58,875
At 31 December 2008 22,265 35,751 723 28,944 87,683
* See Note 32 for impact of prior year adjustment.

56
Financial Statements 2009
Company Cash Flow Statementfor the year ended 31 December 2009
Restated2009 2008€‘000 €‘000
OPERATING ACTIVITIES
Profit for the year before tax 1,251,545 58,874 Adjustments - Employee equity-settled share options 1,199 2,372Profit on disposal of financial assets (1,049,316) - Change in trade and other receivables (202,912) 18,843Change in trade and other payables - (6,490)
Net cash flow from operating activities 516 73,599
INVESTING ACTIVITIES
Proceeds from sale of financial assets 1,058,999 500Purchase of financial assets (1,060,200) (2,372)
Net cash flow from investing activities (1,201) (1,872)
FINANCING ACTIVITIES
Proceeds from share issues 685 3,100Buyback of own shares - (32,565)Dividends paid - (42,262)
Net cash flow from financing activities 685 (71,727)
CASH AND CASH EQUIVALENTS AT BEGINNING OF YEARNet increase in cash and cash equivalents - -
CASH AND CASH EQUIVALENTS AT END OF YEAR - -
57
Financial Statements 2009
1. BASIS OF COMPLIANCE
The consolidated financial statements have been prepared in accordance with International Financial Reporting Standards (IFRS)as adopted by the European Union (EU), which comprise standards and interpretations approved by International AccountingStandards Board (IASB) and International Accounting Standards and Standing Interpretations Committee interpretations that havebeen subsequently adopted by the EU.
The Company financial statements have been prepared in accordance with International Financial Reporting Standards (IFRS) asadopted by the European Union (EU) and as applied in accordance with the Companies Acts, 1963 to 2006. The Company hastaken advantage of the exemption in Section 148(8) of the Companies Act 1963 from presenting to its members the CompanyIncome Statement and related notes which forms part of the approved financial statements of the Company as the Companypublishes Company and Group financial statements together.
Kingspan Group plc is a public limited company registered and domiciled in Ireland, with its registered office being held at DublinRoad, Kingscourt, Co Cavan.
Changes to the primary statements published in the Preliminary AnnouncementThe following charges have been made to the primary statements which were included in the Preliminary Announcement publishedon 1 March 2010:- Net finance costs have now been disclosed as two separate items, Finance Cost and Finance Income, in the Consolidated
Income Statement.- Minority interest movements have been excluded from the Consolidated Statement of Comprehensive Income.
Standards adopted during the financial yearThe Group has adopted the following standards and intrepretations during the financial year ended 31 December 2009:
IFRS 7 Financial Instruments Disclosure
The amendments require additional disclosures for financial instruments that are measured at fair value in the Statement ofFinancial Position. A separate quantitative maturity analysis must be presented for the derivative financial liabilities that shows theremaining contractual maturities, where these are essential for an understanding of the timing of cash flows. The Group has takenadvantage of the transitional provisions in the amendments and has not provided comparative information in respect of the newrequirements.
IAS 1 Presentation of Financial StatementsChanges in this Standard required a number of terminology changes. The term "equity holders" has been replaced by "owners".Owners are classified as "holders of instruments classified as equity". All changes in equity arising from transactions with owners intheir capacity as holders of equity instruments are termed "owner changes in equity".
The following terminology changes have been applied:
- "Statement of Financial Position" replace the heading "Balance Sheet"
- "Consolidated Cash Flow Statement" replace "Cash Flow Statement" and;
- "Statement of Comprehensive Income" replace "Statement of Recognised Income and Expenditure"
The Group has adopted the option to include two statements: an "Income Statement" and a "Statement of ComprehensiveIncome". Changes in equity arising from transactions with owners are excluded from the Statement of Comprehensive Income andhave been included in a "Statement of Changes in Equity".
IFRS 8 Operating SegmentsThis IFRS contains requirements for additional disclosures on operating segments and replaces IAS 14 Segemental Reporting.The standard is concerned with disclosure only and will not have an impact on measurement in the Group Financial Statements.The application of the standard has however led to the segregation of Insulated Panels and Boards Segment into two segments,Insulated Panels and Insulation Boards and elimination of the Offsite and Structural segments.
IAS 23 Borrowing Costs (revised)The standard requires the capitalisation of borrowing costs to the extent that they are directly attributable to the acquisition,production or construction of qualifying assets that need a substantial time to get ready for their intended use or sale. In priorperiods, the Group's policy was to immediately expense these borrowing costs. In accordance with the transitional requirementsof the revised standard, the Group capitalises borrowing costs relating to qualifying assets, if any, for which commencement datefor capitalisation was on or after the effective date, being 1 January 2009. No retrospective restatement has been made forborrowing costs that have been expensed for qualifying assets with a commencement date before the effective date. For theimpact in 2009, refer to note 8.
IFRIC 11 IFRS 2 Group and Treasury transactionsThis Intrepretation requires for share based arrangements accounted for as equity-settled in the Consolidated Financial Statementsof the parent, the subsidiary should measure settled share-based payment transactions, with a corresponding increase recognisedin equity as contribution from the parent. In turn the parent company should record the granting of the equity-settled share-basedtransaction to a subsidiary’s employee as further investment in the subsidiary.
Notes to the Financial Statementsas at 31 December 2009

58
Financial Statements 2009
1. BASIS OF COMPLIANCE (cont’d)
The Interpretation has been applied retrospectively in accordance with IAS 8. The impact was an increase in the investment in thesubsidiaries of €1,199,000 in 2009, €2,372,000 in 2008 and for prior years was €11,912,000.
The following standards and interpretations which are effective for the current financial year have been reviewed and deemed to benon applicable:
IFRIC 16 Hedges of Net Investment in a Foreign OperationIFRS 2 Amendments to IFRS 2 Share-Based Payment: Conditions & Cancellations
IFRSs and IFRIC Interpretations which are not yet effectiveAt the date of authorisation of these financial statements, certain new Standards, amendments and Interpretations of existingstandards have been published but are not yet effective. The Group has not early adopted any of these pronouncements. The newStandards, amendments and Interpretations that are expected to be relevant to the Group's Financial Statements and their likelyimpact are as follows:
IFRS 3 Business Combinations (Revised 2008) (effective from 1 July 2009)The main changes required under this standard are:
- non controlling interests in the acquiree can be measured either at fair value or the proportionate interest in the identifiable netassets. If fair value is used the effect is that 100% of the goodwill of the acquiree is recognised even if the parent's interest in theacquiree is less than 100%.
- contingent consideration is measured at fair value at the acquisition date. If the contingent consideration arrangment gives rise toa financial liability, any subsequent changes are recorded in the Consolidated Income Statement.
- costs of the combination are recorded in the Consolidated Income Statement.
This standard is applicable of reporting periods beginning on or after 1 July 2009 and will be applied prospectively. It will have animpact on future Consolidated Income Statements due to the requirement to expense acquisition costs.
IAS 27 Consolidated and Separate Financial Statements (effective from 1 July 2009)The changes effected by the new version of this Standard are that:
-transactions with non controlling interests in which control is not gained or lost are accounted for as equity transactions. Noincome statement gain or loss is recorded and no adjustment is made to goodwill.
-on loss of control of a subsidiary, any retained investment is recognised at its fair value at the date control is lost. This fair value is included in the calculation of the gain or loss.
Management do not expect the impact of the changes in this Standard to be material.
2. BASIS OF PREPARATION
The Consolidated and Company Financial Statements, which are presented in euro rounded to the nearest thousand exceptNote 6, have been prepared under the historical cost convention, as modified by the measurement at fair value of share basedpayments at initial date of award and derivative financial instruments.
The accounting policies set out below have been applied consistently by all the Group’s companies in the periods presented inthese consolidated financial statements.
The preparation of financial statements in conformity with IFRS as adopted by the EU requires management to exercise judgmentin the process of applying the Company’s accounting policies. The areas involving a high degree of judgment or complexity, orareas where assumptions and estimates are significant in relation to the consolidated financial statements, relate primarily toaccounting for defined benefit pension schemes, share based payments, guarantees and warranties, impairment and deferredconsideration (Note 5).
The financial year-ends of the Group’s subsidiaries are coterminous.
3. BASIS OF CONSOLIDATION
The Consolidated Financial Statements incorporate the Financial Statements of the Company and its subsidiary undertakings aswell as the proportionally consolidated joint venture drawn up to 31 December each year.
SubsidiariesSubsidiaries are those entities controlled by the Company. Control exists when the Company has the power, directly or indirectly,to govern the financial and operating policies of an entity so as to obtain benefits from its activities.
Where a subsidiary is acquired or disposed of during the financial year, the Consolidated Financial Statements include theattributable results from or to the effective date of acquisition or disposal respectively.
Notes to the Financial Statementsas at 31 December 2009

59
Financial Statements 2009
3. BASIS OF CONSOLIDATION (cont’d)
Joint venturesIn line with the benchmark accounting methodology in IAS 31 Interests in Joint Ventures, the Group’s share of results and netassets of joint ventures, which are entities in which the Group holds an interest on a long-term basis and which are jointly controlledby the Group and one or more other venturers, are accounted for on the basis of proportionate consolidation from the date onwhich joint control is finalised and are derecognised when joint control ceases. The Group combines its share of the joint venturesindividual income and expenses, assets and liabilities and cash flows on a line by line basis with similar items in the ConsolidatedFinancial Statements.
Loans to joint ventures are classified as loans and receivables within financial assets.
Transactions eliminated on consolidationAll intra-group balances and transactions, including unrealised profit arising from intra-group transactions, are eliminated onconsolidation.
Foreign currency exchange ratesItems included in the financial statements of each of the Group's entities are measured using the currency of the primary economicenvironment in which the entity operates ("the functional currency").
The Consolidated Financial Statements are expressed in Euro which is the presentation currency of the Group and the functionalcurrency of the Company. Results and cash flows of foreign subsidiary undertakings have been translated into Euro at the averageexchange rates, and the related statements of financial postion have been translated at the rates of exchange ruling at thereporting date. The average rate is a reasonable approximation of the actual rate.
Exchange rates applied for material entities used were as follows:
Average rate Closing Rate2009 2008 2009 2008
Euro =Pound Sterling 0.892 0.796 0.890 0.951US Dollar 1.395 1.471 1.433 1.381Canadian Dollar 1.587 1.560 1.510 1.750Australian Dollar 1.776 1.743 1.600 2.050Czech Koruna 26.478 24.990 26.000 26.550Polish Zloty 4.337 3.523 4.100 4.120Hungarian Forint 281.151 252.430 270.000 265.000
4. SIGNIFICANT ACCOUNTING POLICIES
Business combinationsThe purchase method of accounting is employed in accounting for the acquisition of subsidiaries and joint ventures by the Group.
The cost of a business combination is measured as the aggregate of the fair values at the date of exchange of assets given,liabilities incurred or assumed and equity instruments issued in exchange for control together with any directly attributableexpenses. To the extent that settlement of all or any part of a business combination is deferred, the fair value of the deferredcomponent is determined through discounting the amounts payable to their present value at the date of exchange. The discountcomponent is unwound as an interest charge in the Consolidated Income Statement over the life of the obligation.
Where a business combination agreement provides for an adjustment to the cost of the combination contingent on future events,the amount of the adjustment is included in the cost at the acquisition date if the adjustment is probable and can be reliablymeasured. Contingent consideration is included in the acquisition Statement of Financial Position on a discounted basis.
In the case of a business combination which is completed in stages, the fair values of the identifiable assets, liabilties andcontingent liabilities are determined at the date of each exchange transaction.
When the initial accounting for a business combination is determined provisionally, any adjustments to the provision valuesallocated to the identifiable assets, liabilities and contingent liabilities are made within twelve months of the acquisition date.
The interest of minority shareholders is initially stated at the minority’s proportion of the fair values of the assets and liabilitiesrecognised; goodwill is not allocated to the minority interest. After the date of combination, the minority is allocated its share ofchanges in equity. Any losses applicable to the minority interest in excess of the minority interest are allocated against the interestsof the parent.
GoodwillGoodwill is the excess of the consideration paid over the fair value of the identifiable assets, liabilites and contingent liabilites in abusiness combination and relates to the future economic benefits arising from assets which are not capable of being individuallyidentified and separately recognised.
Notes to the Financial Statementsas at 31 December 2009

60
Financial Statements 2009
4. SIGNIFICANT ACCOUNTING POLICIES (cont’d)
Goodwill arising in respect of acquisitions completed prior to 1 January 2004 (being the transition date to IFRS) is included at itsdeemed cost, which equates to its net book value recorded under previous GAAP. In line with the provisions applicable to a first-time adopter under IFRS, the accounting treatment of business combinations undertaken prior to the transition date has not beenreconsidered in preparing the opening IFRS Statement of Financial Position as at 1 January 2004, and goodwill amortisation hasbeen ceased with effect from the transition date.
Goodwill on acquisition is initially measured at cost being the excess of the cost of the business combination over the acquirer’sinterest in the net fair value of the identifiable assets, liabilities and contingent liabilities. Following initial recognition, goodwill ismeasured at cost less any accumulated impairment losses.
As at the acquisition date, any goodwill acquired is allocated to each of the cash-generating units expected to benefit from thecombination’s synergies. The cash-generating units represent the lowest level within the Group at which goodwill is monitored forinternal management purposes and these units are not larger than the reporting segments determined in accordance with IFRS 8Operating Segments.
Impairment is determined by assessing the recoverable amount of the cash-generating unit, to which the goodwill relates.The impairment testing review is performed annually and at any time where an indicator of impairment is considered to exist. Wherethe recoverable amount of the cash-generating unit is less than the carrying amount, an impairment loss is recognised.
Where goodwill forms part of a cash-generating unit and part of the operation within that unit is disposed of, the goodwillassociated with the operation disposed of is included in the carrying amount of the operation when determining the gain or loss ondisposal of the operation.
Goodwill disposed of in this circumstance is measured on the basis of the relative values of the operation disposed of and theportion of the cash-generating unit retained.
Intangible Assets (other than goodwill)Intangible assets acquired separately are capitalised at cost. Intangible assets acquired from a business acquisition are capitalisedat fair value as at the date of acquisition. Following initial recognition, the intangible asset is carried at its cost (if acquiredseparately) / fair value (through a business combination) less any accumulated amortisation and accumulated impairment losses.Amortisation is charged on assets with finite lives and this expense is taken to the income statement where it is included as anoperating cost.
The amortisation rates generally applied are:
Trademark & Brands 2-10 years on a straight line basisTechnological know how 5-10 years on a straight line basisPatents 8 years on a straight line basis
Intangible assets, created within the business are not capitalised and expenditure is charged against profits in the year in which theexpenditure is incurred.
ImpairmentFor the purposes of assessing impairment, assets are grouped at the lowest levels for which there are largely independent cashflows (cash-generating units). As a result some assets are tested individually for impairment and some are tested at cash-generating unit level.
Cash-generating units to which goodwill has been allocated are tested for impairment at least annually. All other individual assets orcash-generating units are tested for impairment whenever events or changes in circumstances indicate that the carrying amountmay not be recoverable.
An impairment loss is recognised for the amount by which the asset's or cash-generating unit's carrying amount exceeds itsrecoverable amount, which is the higher of value in use and fair value less costs to sell. To determine the recoverable amount,management estimates expected furture cash flows from each cash-generating unit and determines a suitable interest rate in orderto calculate the present value of those cash flows. The data used for impairment testing procedures are directly linked to thegroup's latest approved budget, adjusted as necessary to exclude the effects of future reorganisations and asset enhancements.Discount factors are determined individually for each cash-generating unit and reflect their respective risk profiles as assessed bymanagement.
Impairment losses for cash-generating units reduce first the carrying amount of any goodwill allocated to that cash-generating unit.Any remaining impairment loss is charged pro rata to the other assets in the cash-generating unit. With the exception of goodwill,all assets are subsequently reassessed for indications that an impairment loss previously recognised may no longer exist.An impairment charge is reversed if the cash-generating unit's recoverable amount exceeds its carrying amount.
Impairment losses, if applicable, are included within the operating costs line of the Consolidated Income Statement.
Notes to the Financial Statementsas at 31 December 2009

61
Financial Statements 2009
4. SIGNIFICANT ACCOUNTING POLICIES (cont’d)
Contingent deferred considerationContingent deferred consideration relating to acquisitions represents the liability associated with a performance related target asevaluated by management, taking into account the tems of the earn out.
Any revision in deferred consideration provision is accounted for by an adjustment to the carrying value of goodwill.
Segment ReportingThe Group’s accounting policy for identifying segments is now based on internal management reporting information that is routinelyreviewed by the Chief Operating Decision Maker. The measurement policies used for segment reporting under IFRS 8 are the sameas those used in the Consolidated Financial Statements. Refer to note 6 of the Financial Statements for further information aboutthe Group’s segment reporting accounting policy under IFRS 8.
InventoriesInventories are stated at the lower of cost and net realisable value. In the case of raw materials, cost means purchase priceincluding transport and handling costs, less trade discounts, calculated on a first in first out basis. For work in progress andfinished goods, cost consists of direct materials, direct labour and directly attributable production overheads.
Net realisable value comprises the actual or estimated selling price (less trade discounts), less all further costs to completion, andless all costs to be incurred in marketing, selling and distribution.
Income TaxesThe tax expense recognised in the Consolidated Income Statement comprises the sum of current income tax and deferred tax notrecognised directly in equity.
Current tax:Current income tax assets and/or liabilities comprise of those obligations to, or claims from, fiscal authorities relating to the currentor prior reporting periods that are unpaid at the reporting date. Current tax is payable on taxable profit, which differs from profit orloss in the financial statements. Calculation of current tax is based on tax rates and tax laws that have been enacted orsubstantively enacted by the end of the reporting period.
Deferred tax:Deferred tax is provided on the basis of the Statement of Financial Position liability method on all temporary differences at theConsolidated Statement of Financial Position date. Temporary differences are defined as the difference between the tax bases ofassets and liabilities and their carrying amounts in the financial statements. Deferred tax assets and liabilities are not subject todiscounting and are measured at the tax rates that are anticipated to apply in the period in which the asset is realised or the liabilityis settled based on tax rates and tax laws that have been enacted or substantively enacted at the Consolidated Statement ofFinancial Position date.
Deferred tax liabilities are recognised for all taxable temporary differences (i.e. differences that will result in taxable amounts in futureperiods when the carrying amount of the asset or liability is recovered or settled) with the exception of the following:
- where the deferred tax liability arises from the initial recognition of goodwill or the initial recognition of an asset or a liability in atransaction that is not a business combination and affects neither the accounting profit nor the taxable profit or loss at the timeof the transaction; and
- where, in respect of taxable temporary differences associated with investments in subsidiaries and joint ventures, the timing ofthe reversal of the temporary difference is subject to control by the Group and it is probable that reversal will not materialise inthe forseeable future.
Deferred tax assets are recognised in respect of all deductible temporary differences (i.e. differences that give rise to amountswhich are deductible in determining taxable profits in future periods when the carrying amount of the asset or liability is recoveredor settled), carry-forward of unused tax credits and unused tax losses to the extent that it is probable that taxable profits will beavailable against which to offset these items. The following exceptions apply in this instance:
- where the deferred tax asset arises from the initial recognition of an asset or a liability in a transaction that is not a businesscombination and affects neither the accounting profit nor the taxable profit or loss at the time of the transaction; and
- where, in respect of deductible temporary differences associated with investments in subsidiaries and joint ventures, a deferredtax asset is recognised only if it is probable that the deductible temporary difference will reverse in the forseeable future and thatsufficient taxable profits will be available against which the temporary difference can be utilised.
The carrying amounts of deferred tax assets are subject to review at each Statement of Financial Position date and reduced to theextent that future taxable profits are considered to be inadequate to allow all or part of any deferred tax asset to be utilised.
Where items are accounted for directly through equity (for example, actuarial gains and losses on defined benefit pensionschemes), the related income tax is charged or credited to equity. In all other circumstances, income tax is recognised in theConsolidated Income Statement.
Notes to the Financial Statementsas at 31 December 2009

62
Financial Statements 2009
4. SIGNIFICANT ACCOUNTING POLICIES (cont’d)
GrantsCapital grants received in respect of the purchase of tangible assets are treated as a reduction in the purchase price of the tangible asset.
Property, Plant and EquipmentProperty, plant and equipment is stated at historical cost or deemed cost less accumulated depreciation and any impairment invalue. Certain items of property that had been revalued to fair value prior to the date of transition to IFRS (1 January 2004) aremeasured on the basis of deemed cost, being the revalued amount as at the date the revaluation was performed.
An item of property, plant and equipment is derecognised upon disposal or when no future economic benefits are expected toarise from the continued use of the asset. Any gain or loss arising on derecognition of the asset (calculated as the differencebetween the net disposal proceeds and the carrying amount of the item) is included in the Consolidated Income Statement in theyear the item is derecognised.
Property, plant and equipment, excluding freehold land, are depreciated at appropriate rates in order to write them off over theirexpected useful life. The depreciation rates generally applied are:
Freehold buildings 2% on costPlant and machinery 5% to 20% on costFixtures and fittings 10% to 20% on costComputer hardware and software 25% to 33% on costMotor vehicles 20% to 25% on costLeased assets 10% to 25% on costLeasehold property improvements Over the period of the leaseUseful lives and residual values are re-assessed annually.
Assets held for saleNon-current assets classified as held for sale are measured at the lower of the carrrying amount and the fair value less disposalcosts. Non-current assets are classified as held for sale if their carrying amounts will be recovered through a sale transaction ratherthan continued use. This condition is regarded as satisfied only when the sale is highly probable (to be completed within one yearfrom date of classification) and the asset is available for immediate sale in its present condition. Property, plant and equipment onceclassified as held for sale are not depreciated.
LeasingAssets held under finance leases, which are leases where substantially all the risks and rewards of ownership of the asset havetransferred to the Group, and hire purchase contracts are capitalised in the Consolidated Statement of Financial Position and aredepreciated over their useful lives with any impairment being recognised in accumulated depreciation. The asset is recorded at anamount equal to the lower of its fair value and the present value of the minimum lease payments at the inception of the financelease. The capital elements of future obligations under leases and hire purchase contracts are included in liabilities in theConsolidated Statement of Financial Position and analysed between current and noncurrent amounts. The interest elements of therental obligations are charged to the Consolidated Income Statement over the periods of the relevant agreements and represent aconstant proportion of the balance of capital repayments outstanding in line with the implicit interest rate methodology.
Leases where the lessor retains substantially all the risks and rewards of ownership are classified as operating leases. Operatinglease rentals are charged to the Consolidated Income Statement on a straight-line basis over the lease term.
Pension costsObligations to the defined contribution pension plans are recognised as an expense in the income statement as service is receivedfrom the relevant employees. The Group has no obligations to make further contributions to these schemes. The Group operates anumber of defined benefit pension schemes which require contributions to be made to separately administered funds. The Group’snet obligation in respect of defined benefit pension schemes is calculated separately for each plan by estimating the amount offuture benefits that employees have earned in return for their service in the current and prior periods. That benefit is discounted todetermine its present value, and the fair value of any plan asset is deducted. The discount rate employed in determining thepresent value of the schemes’ liabilities is determined by reference to market yields at the reporting date on high quality corporatebonds for a term consistent with the currency and term of the associated post-employment benefit obligations.
The net surplus or deficit (net of deferred tax) arising in the Group’s defined benefit pension schemes are shown within either non-current assets or liabilities on the face of the Consolidated Statement of Financial Position. The Group recognises post transitiondate actuarial gains and losses immediately in the Consolidated Statement of Comprehensive Income.
Any increase in the present value of plans’ liabilities expected to arise from employee service during the period is charged tooperating profit. The expected return on the plans’ assets and the expected increase during the period in the present value of theplans’ liabilities arising are included in finance income and expense respectively.
When the benefits of a defined benefit plan are improved, the portion of the increased benefit relating to past service by employeesis recognised as an expense in the income statement over the remaining average period until the benefits vest. To the extent thatthe benefits vest immediately, the expense is recognised immediately in the Income Statement.
Notes to the Financial Statementsas at 31 December 2009

63
Financial Statements 2009
4. SIGNIFICANT ACCOUNTING POLICIES (cont’d)
ProvisionsA provision is recognised in the Consolidated Statement of Financial Position when the Group has a constructive or legal obligationas a result of a past event and it is probable that an outflow of economic benefit will be required to settle the obligation.
Foreign currency translation
Transactions and balancesTransactions in foreign currencies are recorded at the rate of exchange ruling at the date of the transaction. Monetary assets andliabilities denominated in foreign currencies are retranslated to the relevant functional currency at the rate of exchange ruling at theStatement of Financial Position date. All currency translation differences on monetary assets and liabilities are taken to theConsolidated Income Statement.
Group companiesResults and cash flows of subsidiaries which do not have the Euro as their functional currency are translated into Euro at averageexchange rates for the year and the related Statement of Financial Positions are translated at the rates of exchange ruling at theStatement of Financial Position date. Average rates are a reasonable approximation to actual rates. Adjustments arising ontranslation of the results of such subsidiaries at average rates and on the restatement of the opening net assets at closing rates aredealt with in a separate translation reserve within equity.
DividendsFinal Dividend on Ordinary Shares will be recognised in the Consolidated Financial Statements as a charge once they have beenapproved.
HedgingCash flow hedgesThe Group utilises cash flow hedges in its treasury activities. For the purposes of hedge accounting, hedges are classified as cashflow hedges if they hedge exposure to fluctuations in future cash flows derived from a particular risk associated with a recognisedasset or liability, a firm commitment or a highly probable forecast transaction.
Where a derivative financial instrument is designated as a hedge of the variability in cash flows of a recognised asset or liability, afirm commitment or a highly probable forecasted transaction, the effective part of any gain or loss on the derivative financialinstrument is recognised as a separate component of equity with the ineffective portion being reported as finance expense orincome in the Consolidated Income Statement. If a hedge of a forecasted transaction subsequently results in the recognition of afinancial asset or a financial liability, the associated gains and losses that were recognised directly in equity are reclassified intoprofit or loss in the same period or periods during which the asset acquired or liability assumed affects profit or loss. For cash flowhedges, other than those covered by the preceding statements, the associated cumulative gain or loss is removed from equity andrecognised in the Consolidated Income Statement in the same period or periods during which the hedged forecast transactionaffects profit or loss. The ineffective part of any gain or loss is recognised immediately in the Consolidated Income Statement.
Hedge accounting is discontinued when a hedging instrument expires or is sold, terminated or exercised, or no longer qualifies forhedge accounting. The cumulative gain or loss at that point remains in equity and is recognised in accordance with the abovepolicy when the transaction occurs. If a hedged transaction is no longer expected to occur, the net cumulative gain or lossrecognised in equity is transferred to the income statement in the period.
Cash and cash equivalentsCash and cash equivalents mainly comprise cash on hand, bank accounts, and highly liquid investments that are readilyconvertible into known amounts of cash and which are subject to an insignificant risk of change in value.
Financial AssetsFinancial assets other than hedging instruments are divided into the following categories:
- loans and receivables- investments held at fair value through profit and loss
Trade and other receivables are stated at cost, which approximates fair value given the short-dated nature of these assets andliabilties. Generally, the Group recognises all financial assets using settlement day accounting. An assessment of whether a financialasset is impaired is made at least at each reporting date. Receivables are non derivative financial assets with fixed or determinablepayments that are not quoted in an active market. Receivables are considered for impairment on a case by case basis (with dueregard to credit insurance where in place) when they are past due at the Statement of Financial Position date or when objectiveevidence is received that a specific counterparty will default.
Notes to the Financial Statementsas at 31 December 2009

64
Financial Statements 2009
4. SIGNIFICANT ACCOUNTING POLICIES (cont’d)
Gains or losses on investments held at fair value through profit and loss are recognised directly in the Income Statement.
A financial asset is derecognised only where the contractual rights to the cash flows from the asset expire or the financial asset istransferred and that transfer qualifies for rerecognition. A financial asset is transferred if the contractual rights to receive the cashflows of the asset have been transferred or the Group retains the contractual rights to receive the cash flows of the asset butassumes a contractual obligation to pay the cash flows to one or more recipients. A financial asset that is transferred qualifies forderecognition if the Group transfers substantially all the risks and rewards of ownership of the asset, or if the Group neither retainsnor transfers substantially all the risks and rewards of ownership but does not transfer control of that asset.
Financial LiabilitiesFinancial liabilities are classified as either financial liabilities at fair value through profit or loss or other financial liabilities. Financialliabilities at fair value through profit or loss are initially measured at fair value and subsequently stated at fair value, with any resultantgain or loss recognised in profit or loss. The net gain or loss recognised in profit or loss incorporates any interest paid on thefinancial liability.
Other financial liabilities (including trade payables) are initially measured at fair value, net of transaction costs, and are subsequentlymeasured at amortised cost using the effective interest method. When determining the fair value of financial liabilities, the expectedfuture cash flows are discounted using an appropriate interest rate.
A financial liability is derecognised only when the obligation is extinguished, that is, when the obligation is discharged or cancelledor expires.
Revenue recognitionRevenue comprises the total amount receivable by the Group in the ordinary course of business with outside customers for goodsand services supplied, exclusive of trade discounts and value added tax.
In general, revenue is recognised to the extent that it is subject to reliable measurement, that it is probable that economic benefitswill flow to the Group and that the significant risks and rewards of ownership have passed to the customer, whether that be atpoint of delivery or collection.
Research and DevelopmentExpenditure on research (or the research phase of an internal project) is recognised as an expense in the period in which it isincurred.
Share-Based Payment TransactionsEmployees (including directors) of the Group receive remuneration in the form of share-based payment transactions, wherebyemployees render services in exchange for shares or rights over shares (‘equity-settled transactions’).
The cost of equity-settled transactions with employees is measured by reference to the fair value at the date at which they aregranted. The fair value is determined using a recognised valuation methodology for the pricing of financial instruments.
The cost of equity-settled transactions is recognised over the period in which the performance conditions are fulfilled, ending onthe date on which the relevant employees become fully entitled to the award (‘vesting date’). The cumulative expense recognisedfor equity-settled transactions at each reporting date until the vesting date reflects the extent to which the vesting period hasexpired and the number of awards that, in the opinion of the directors of the Group and based on the best available estimates atthat date, will ultimately vest. The income statement charge or credit for a period represents the movement in cumulative expenserecognised as at the beginning and end of that period. No expense is recognised for awards that do not ultimately vest. The costof all equity settled transactions is recognised in the income statements of the subsidiaries where the employees have renderedservices in exchange for the grant of equity-settled share based remuneration.
Upon exercise of share options, the proceeds received net of any directly attributable transaction costs up to the nominal value ofthe shares issued are allocated to share capital with any excess being recorded as share premium.
Borrowing costsBorrowing costs primarily comprise interest on the Group's borrowings. Borrowing costs directly attributable to the acquisition,construction, or production of a qualifying assets (as defined in IAS 23 Borrowing Costs), are capitalised during the period of timethat is necessary to complete and prepare the asset for its intended use or sale. Other borrowing costs are expensed in the periodin which they are incurred and reported in "Net Finance Costs".
Credit insurance recoveriesRecoveries under the Group's credit insurance policy are accounted for on a receipts basis only.
Notes to the Financial Statementsas at 31 December 2009

65
Financial Statements 2009
5. SIGNIFICANT JUDGMENTS AND ESTIMATION UNCERTAINTY
All of the following areas require the use of significant estimates:
Impairment (Note 13)The Group is required to review non financial assets for objective evidence of impairment.
In accordance with IFRS the Group has performed impairment reviews on those cash generating units which have a carryingvalue of goodwill or intangible assets with indefinite useful life. The key assumptions associated with these reviews are detailed innote 13.
It does this on the basis of a review of the budget and rolling 5 year strategic plans (where appropriate), which by their nature arebased on a series of assumptions and estimates.
Guarantees & warranties (Note 25)Certain products carry formal guarantees of satisfactory functional and aesthetic performance of varying periods following theirpurchase. Local management evaluate the constructive or legal obligation arising from customer feedback and assess therequirement to provide for any probable outflow of economic benefit arising from a settlement. The benefit of any insurance coverand any relevant guarantees from suppliers of inputs to the Group are accounted for once the relevant recognition criteria are met.
These provisions are reviewed on a regular basis by members of the Group executive and the overall warranty performance andrequired provisions are incorporated into the Group board papers.
Defined benefit pension scheme (Note 39)The Group has a number of legacy defined benefit pension schemes which, whilst closed to new entrants and further accruedservice, are required to be valued. The Group use the services of professional actuaries to determine the assets and liabilities of theschemes, and as part of this review certain estimates are required to produce the valuation.
Share based payments (Note 7)The Group grants options as part of certain employee's remuneration which under IFRS 2 are subject to valuation. The Groupemploys a professional valuer to assess the cost of each option grant, and the key assumptions are set out in note 7.
Contingent deferred consideration (Note 23)The Group is required to judge the probable liability relating to post completion performance related payments to vendors underthe terms of the relevant acquisition sale and purchase agreement. Unless disclosed in the relevant note, management do notbelieve that any of the estimates used in the calculation of the provisions are so sensitive as to represent a significant risk of amaterial adjustment.
6. SEGMENT REPORTING
In identifying the operating segments, management based their decision on the product supplied by each segment and the factthat each segment is managed separately and reported to the Chief Operating Decision Maker in this manner. These operatingsegments are monitored and strategic decisions are made on the basis of segment operating results.
The measurement policies the Group uses for segment reporting under IFRS 8 are the same as those used in its financialstatements. The requirements of IFRS 8 are applied retrospectively and comparative figures have been restated to reflect thesegments identified.
Operating segmentsThe Group operates in the following four business segments:
Insulated Panels Manufacture of insulated panels, structural framing and metal façades.Insulation Boards Manufacture of rigid insulation boards, building services insulation and
engineered timber systems.Environmental & Renewables Manufacture of environmental, pollution control and renewable energy solutions.Access Floors Manufacture of raised access floors.
Notes to the Financial Statementsas at 31 December 2009

66
Financial Statements 2009
Notes to the Financial Statementsas at 31 December 2009
6. SEGMENT REPORTING (cont’d)
Analysis by class of business
Environ-Insulated Insulation mental & Access
Segment Revenue Panels Boards Renewables Floors TOTAL€mn €mn €mn €mn €mn
Total Revenue - 2009 593.9 215.3 168.7 147.6 1,125.5Total Revenue - 2008 862.1 345.2 266.7 198.7 1,672.7
Inter-segment revenue is not material and is thus not subject to separate disclosure in the above analysis.Inter-segment transfers are carried out at arm’s length prices and using an appropriate transfer pricing methodology.
Segment Result (profit before finance costs)Environ-
Insulated Insulation mental & Access TOTAL TOTALPanels Boards Renewables Floors 2009 2008€mn €mn €mn €mn €mn €mn
Trading profit 26.3 13.5 1.8 25.5 67.1Intangible amortisation (2.8) (0.7) (0.8) (0.1) (4.4)
Operating result - 2009 23.5 12.8 1.0 25.4 62.7
Trading profit 110.9 20.3 2.6 27.9 161.7Intangible amortisation (2.4) (0.9) (1.2) (0.1) (4.6)Non-trading items (15.5) (10.4) (5.6) - (31.5)Goodwill & intangibles impairment (4.2) (40.0) 0.6 - (43.6)
Operating result - 2008 88.8 (31.0) (3.6) 27.8 82.0
Finance costs (net) (6.0) (13.9)
Result for the year before tax 56.7 68.1Tax expense, net (8.7) (24.2)Minority interest (0.3) 1.0
Net result for the year 47.7 45.0
Segment AssetsEnviron-
Insulated Insulation mental & Access TOTAL TOTALPanels Boards Renewables Floors 2009 2008€mn €mn €mn €mn €mn €mn
Assets - 2009 494.8 247.7 182.7 118.3 1,043.5Assets - 2008 591.4 251.4 183.1 136.4 1,162.3
Cash and cash equivalents 83.9 75.3Deferred tax asset 3.0 1.2
Total Assets as reported in Consolidated Statement of Financial Position 1,130.4 1,238.8

67
Financial Statements 2009
6. SEGMENT REPORTING (cont’d)
Segment Liabilities
Environ-Insulated Insulation mental & Access TOTAL TOTAL
Panels Boards Renewables Floors 2009 2008€mn €mn €mn €mn €mn €mn
Liabilities - 2009 (123.0) (48.8) (65.4) (24.8) (262.0)Liabilities - 2008 (156.8) (73.3) (40.0) (26.0) (296.1)
Financial liabilities (current and non-current) (233.0) (362.1)Contingent deferred consideration (current and non-current) (3.3) (12.8)Income tax liabilities (current and deferred) (46.5) (48.8)
Total liabilities as reported in Consolidated Statement of Financial Position (544.8) (719.8)
Other Segment Information
Environ-Insulated Insulation mental & Access
Segment Revenue Panels Boards Renewables Floors TOTAL€mn €mn €mn €mn €mn
Capital Investment - 2009 12.0 24.5 9.4 0.9 46.8Capital Investment - 2008 162.6 (38.0) 9.4 3.6 137.6
Depreciation included in segment result - 2009 (19.3) (8.4) (5.2) (2.9) (35.8)Depreciation included in segment result - 2008 (20.2) (11.2) (6.2) (3.0) (40.6)
Amortisation & intangibles impairment (2.8) (0.7) (0.8) (0.1) (4.4)included in segment result - 2009Amortisation & intangibles impairment (6.7) (40.8) (0.6) (0.1) (48.2)included in segment result - 2008
Non-cash items included in segment result - 2009 (2.8) 2.9 0.6 - 0.7Non-cash items included in segment result - 2008 (0.4) - 0.6 - 0.2
Analysis of Segmental Data by Geography
Republic of United Rest of Ireland Kingdom Europe Americas Others TOTAL€mn €mn €mn €mn €mn €mn
Income Statement ItemsRevenue - 2009 78.1 503.3 310.9 192.7 40.5 1,125.5Revenue - 2008 173.8 826.6 453.1 177.1 42.1 1,672.7
Balance Sheet ItemsAssets - 2009 117.9 468.0 223.2 197.4 37.0 1,043.5Assets - 2008 128.1 549.8 246.6 218.4 19.5 1,162.3
Other segmental informationCapital Investment - 2009 3.6 12.9 16.5 5.0 8.8 46.8Capital Investment - 2008 (22.2) 30.3 46.0 76.9 6.6 137.6
Notes to the Financial Statementsas at 31 December 2009

68
Financial Statements 2009
Notes to the Financial Statementsas at 31 December 2009
7. EMPLOYEES
a) Employee Numbers
The average number of persons employed by the Group in the financial year was:
2009 2008
Production 3,183 4,450Sales and distribution 937 1,156Management and administration 929 1,086
5,049 6,692
At year end, the total numbers employed by the Group were 4,758 (2008: 5,340).
b) Employee Costs
The staff costs were: 2009 2008€‘000 €‘000
Wages and salaries 167,066 222,223Social welfare costs 18,284 21,548Pension contributions - defined contribution 6,271 7,633Pension contributions - defined benefit (Note 39) 103 (367)Share based payments 2,800 2,372
194,524 253,409
c) Employee Share Based Compensation
As at 31 December 2009 the Group maintained three share-based payment schemes for employee compensation.
The first arrangement, the Long-Term Incentive Plan, is part of the remuneration package of Kingspan’s executive directors andsenior executives.
The second arrangement, the Standard Share Option Scheme, is part of the remuneration package of Kingspan’skey personnel.
The third arrangement, the Performance Share Plan, is a new scheme which will replace the Standard Share Option Schemewhich has now expired.
Further details of all schemes are outlined in the Report of the Remuneration Committee.
All share-based employee compensation will be settled in equity. The Group has no legal or constructive obligation torepurchase or settle the options.
Share options and weighted average exercise price are as follows for the reporting periods presented:
2009 2009 2008 2008Number Weighted Number Weighted
of options average of options averageexercise price exercise price
€ €
Outstanding at 1 January 7,860,391 10.11 7,557,471 10.15Granted LTIP - - 257,000 0.13Granted SSOS - - 1,267,566 8.01Granted PSP 1,718,148 0.13 - -Cancelled LTIP (77,731) 0.13 - -Cancelled SSOS (211,080) 12.35 (353,543) 13.41Cancelled PSP - - - -Exercised LTIP - - (168,103) -Exercised SSOS (234,000) 2.93 (700,000) 3.68Exercised PSP - - - 0.13Outstanding at 31 December 9,055,728 8.43 7,860,391 10.11
The weighted average share price at date of exercise of options during the year was €4.67.

69
Financial Statements 2009
7. EMPLOYEES (cont’d)
Earliest exercise date 2009 2009 2009Number of options Weighted average Weighted average
exercise price € remainingcontractual life
2010 Option range
LTIP €0.13 198,661 0.13 3.65
SSOS €1.35 - €2.95 240,900 1.97 2.11€3.10 - €5.65 1,646,210 5.21 4.67€9.35 - €10.90 933,302 10.65 5.72€12.26 - €14.18 1,117,383 14.09 6.77€17.82 - €21.20 1,728,558 18.28 7.76
5,865,014 11.31 6.012011 Option rangeLTIP €0.13 257,000 0.13 5.2
SSOS €7.99 - €8.10 1,215,566 8.01 8.31,472,566 6.63 7.7
2012 Option rangePSP €0.13 1,718,148 0.13 9.3
Earliest exercise date 2008 2008Number of options Weighted average
exercise price €2009 Option rangeLTIP €0.13 142,831 0.13
SSOS €1.35 - €2.95 360,900 2.04€3.10 - €5.65 1,800,210 5.10€9.35 - €10.90 964,704 10.66€12.26 - €14.18 1,141,202 14.09
4,409,847 8.232010 Option rangeLTIP €0.13 133,561 0.13
SSOS €17.82 - €21.20 1,813,417 18.271,946,978 17.02
2011 Option rangeLTIP €0.13 257,000 0.13
SSOS €7.99 - €8.10 1,246,566 8.011,503,566 6.66
7,860,391 10.11
Of the 2009 options, the following were exercisable at the year end:
2009 2009 2009Number of options Weighted average Weighted average
exercise price € remainingcontractual life
LTIP €0.13 65,100 0.13 2.5
SSOS €1.35 - €2.95 240,900 1.97 2.1€3.10 - €5.65 1,646,210 5.21 4.7€9.35 - €10.90 933,302 10.65 5.7€12.26 - €14.18 1,117,383 14.09 6.8
Notes to the Financial Statementsas at 31 December 2009

70
Financial Statements 2009
7. EMPLOYEES (cont’d)
The fair value of options granted during the year were determined using the Monte Carlo Pricing Model. The key assumptionsused in the model were as follows:
At a grant dateShare price at grant date €2.78
Exercise price per share 13.0 cent
Expected volatility 39%
Expected dividend yield 1.50%
Risk-free rate 3.50%
Expected life 3 years
Expected volatility was determined by calculating the historical volatiilty of the Group and peer company share prices over theprevious 3 years.
The Group recognised an expense of €2,800,000 (2008: expense of €2,372,000) related to equity settled share-basedpayment transactions in the Consolidated Income Statement during the year. The expectation of meeting performance criteriawas taken into account when calculating the expense.
8. FINANCE COST AND FINANCE INCOME
2009 2008Finance cost €‘000 €‘000
Bank loans 12,641 15,796Hire purchase and finance loans 6 37Net defined benefit pension scheme 103 (367)
12,750 15,466
Finance incomeInterest income 1,848 1,556Fair value movement on derivative financial instrument (6,959) -Translation gain on private placement debt 11,881 -
6,770 1,556
Borrowing costs capitalised during the year amounted to €nil (2008: €nil).
9. PROFIT FOR THE YEAR BEFORE TAX
2009 2008€‘000 €‘000
The result for the year is stated after charging / (crediting):Distribution expenses 54,566 88,678Operating lease payments 2,022 2,674Non payroll product development costs 3,872 7,095Depreciation 36,088 40,588Amortisation of intangible assets 4,396 4,615Impairment of goodwill & intangibles - 43,576Foreign exchange (losses)/gains (2,887) 3,074Profit on sale of tangible assets (702) (171)Non-trading items - 75,077
Auditors’ Remuneration:Statutory Audit 999 1,104Services relating to Corporate Finance - 150Other services relating to tax 396 297All other audit related services 115 127
Notes to the Financial Statementsas at 31 December 2009

71
Financial Statements 2009
10. DIRECTORS’ REMUNERATION
Benefitin kind
Executive Basic and other Performance Pension 2009 2008Directors Salary allowances1 related bonus contributions2 Total Total
€‘000 €‘000 €‘000 €‘000 €‘000 €‘000
Gene M. Murtagh 635 26 - 95 756 756Dermot Mulvihill3 340 24 - 605 969 851Russell Shiels4 279 25 220 67 591 504Peter Wilson4 247 13 148 52 460 344Noel Crowe 280 16 - 42 338 338Louis Eperjesi4 & 5 144 16 - 60 220 350
1,925 120 368 920 3,334 3,143
Charge to ConsolidatedIncome Statementre share options 207 1,050
3,541 4,193
Non-executive Directors2009 2008
Non-executive Non-executivefees fees
€’000 €’000
Eugene Murtagh6 191 191Brendan Murtagh 70 70Tony McArdle 70 70David Byrne 70 70Brian Hill 70 70Helen Kirkpatrick 70 70Danny Kitchen7 58 -Brian Joyce8 6 70Eoin McCarthy9 29 70
634 681
1 Benefits relate to health insurance premiums and the use by Directors of company cars.2 All Executive Directors participate in defined contribution pension schemes operated by the Group.3 The Group made a contribution of €1,417,000 during 2009 to the Group’s occupational pension plan in respect of
Dermot Mulvihill, representing accelerated pension contributions up to the date of his retirement at age 62.The proportion charged to the Consolidated Income Statement in respect of this payment for 2009 is €605,000,and the prepayment for 2010 is €406,000, and for 2011 is €406,000. There are claw back arrangements in placeshould he retire early.
4 The 2009 salaries and remuneration have been converted to Euro at the following rates USD: 1.3946; STG: 0.8917.Russell Shiels’ basic salary was $388,000 (2008: $388,000).Peter Wilson’s basic salary was £220,000 (2008: £220,000).Louis Eperjesi’s basic salary was £128,333 (2008: £220,000).
5 Louis Eperjesi resigned as an Executive Director on 31 July 2009.On termination of his employment he also received €298,000 as compensation for loss of office.
6 Eugene Murtagh also received a contribution to his personal pension scheme of €143,250.7 Danny Kitchen was appointed as a Non-executive Director on 1 March 2009.8 Brian Joyce retired as a non-executive director on 30 January 2009.9 Eoin McCarthy retired as a non-executive director on 14 May 2009.
Notes to the Financial Statementsas at 31 December 2009

72
Financial Statements 2009
10. DIRECTORS’ REMUNERATION (cont’d)
Number of Directors at year-end 2009 2008Executive Directors 5 6Non-executive Directors 7 8Total 12 14
Average number of Directors during the year 2009 2008Executive Directors 6 6Non-executive Directors 7 8Total 13 14
11. INCOME TAX EXPENSE
2009 2008€‘000 €‘000Total Total
Current tax expense- Irish - 3,335- Overseas 14,878 13,772
Adjustment in respect of prior years* (6,308) 5488,570 17,655
Deferred taxation 142 6,4968,712 24,151
Reconciliation of average effective tax rate to applicable tax rate
Profit before tax 56,679 68,134Tax charge expressed as a percentage of profit before tax:
- current tax expense only 15.1% 25.9%- total income tax expense (current and deferred) 15.4% 35.4%
The following table reconciles the applicable Republic of Ireland statutory tax rate to the effective tax rate (current and deferred)of the Group:Irish corporation tax rate 12.5% 12.5%Expenses not deductible for taxation purposes 15.5% 19.8%Items not subject to tax (13.3%) (14.8%)Manufacturing relief - (0.6%)Net effect of differing tax rates 15.5% 8.5%Deferred Tax 0.3% 9.5%Other items (15.1%)* 0.5%Total effective tax rate 15.4% 35.4%
Factors that may affect future tax charges and other disclosure requirementsThe total tax charge in future periods will be affected by any changes to the corporation tax rates in force in the countriesin which the Group operates. The current tax charges will also be impacted by changes in the excess of tax depreciation(capital allowances) over accounting depreciation and the use of tax credits.
*The adjustment in respect of prior years primarily relates to the resolution of outstanding tax matters in overseas jurisdictions.
Notes to the Financial Statementsas at 31 December 2009

73
Financial Statements 2009
Notes to the Financial Statementsas at 31 December 2009
12. EARNINGS PER SHARE
The calculations of earnings per share are based on the following: 2009 2008€‘000 €‘000
Profit attributable to ordinary shareholders 47,658 44,990
Number of Number ofshares (‘000) shares (‘000)
2009 2008
Weighted average number of ordinary sharesfor the calculation of basic earnings per share 166,116 168,318
Dilutive effect of share options 2,326 1,238
Weighted average number of ordinary sharesfor the calculation of diluted earnings per share 168,442 169,556
2009 2008€cent €cent
Basic earnings per share 28.7 26.7Diluted earnings per share 28.3 26.5
The number of options which are anti-dilutive and have therefore not been included in the above calculations are 6,729,728.
13. GOODWILL
At 31 December 2009€‘000
At 1 January 279,777Additions relating to current year acquisitions 7,175Additions relating to prior year acquisitions 1,094Impairment loss recognised -Net exchange difference 11,975Carrying amount 31 December 2009 300,021
Cost 342,669Accumulated impairment losses (42,648)Net carrying amount 300,021
At 31 December 2008€‘000
At 1 January 303,966Additions 54,117 Impairment loss recognised (39,554)Net exchange difference (38,752) Carrying amount 31 December 2008 279,777
Cost 322,425Accumulated impairment losses (42,648)Net carrying amount 279,777

74
Financial Statements 2009
Notes to the Financial Statementsas at 31 December 2009
13. GOODWILL (cont’d)
Impairment testing of goodwillAn impairment review is performed annually for each cash-generating unit (CGU) to which a carrying amount of goodwill hasbeen allocated. The cash generating units represent the lowest level within the Group at which the associated goodwill ismonitored for internal management purposes. This is not larger than the primary and secondary segments determined inaccordance with IAS 14 Segment Reporting. A CGU is a reporting sub-segment, generally defined as a core business of thesegment and typically reflects the manner in which the Group organises its business and analyses its results for internalreporting purposes.
The recoverable amounts of the CGU’s are determined from value-in-use calculations based on the cash flows from the 5 yearfinancial forecasts approved by senior management, with year 1 extracted from budget and years 2-5 from the strategic plan.They include conservative assumptions regarding future organic growth and allow for negative growth in some CGU’s in certainyears. A terminal value reflecting inflation of 2% (but no other growth) is applied to the year 5 cash flows. Sensitivity analysis iscarried out on all budgets and strategic plans used in the calculations.
The discount factor is based on a weighted average cost of capital incorporating relevant government bonds for the risk-freerate, equity risk premium and cost of debt appropriate to the industry. The overall before-tax discount rate used for all CGU’s is8.8%. The discount rate has also been subjected to sensitivity analysis for all CGU’s.
The key assumptions for these forecasts include management’s conservative estimates of revenue growth, future profitabilityand level of working capital required to support trading. These assumptions are consistent with the prior year. Differentassumptions measuring the sensitivity of the method used are systematically tested using the following parameters:
- 10% change in annual average growth rate of sales and EBIT margin
+/- 1-2% change in discount rate applied to cashflows
The key sensitivity for the impairment calculation is the growth in sales and EBIT margin. Applying these techniques, noimpairment arose in 2009.
A total of 8 cash-generating units have been identified and these are analysed as follows between the four operating segmentsin the Group:
Insulated Panels 3 Insulated Panels Western Europe, CEMEI, Panels North AmericaInsulation Boards 1 InsulationEnvironmental & Renewables 2 Environmental/Europe, HWS/RenewablesAccess Floors 2 KAF, Access Floors-North AmericaTotal cash-generating units 8
No impairment losses were recognised by the Group in 2009 (2008: €42.6mn).
Results of the impairment tests are presented below for all CGU’s that represent 20% or more of total goodwill.
The impairment testing carried out on the remaining goodwill in the balance sheet at 31 December 2009 identified significantheadroom in the recoverable amount of the related CGU’s as compared to their carrying value.
Panels North AmericaThis division represents 24% of the Group’s total goodwill as at 31 December 2009 relating to the acquisition of insulatedpanels companies in the United States and Canada.

75
Financial Statements 2009
Notes to the Financial Statementsas at 31 December 2009
13. GOODWILL (cont’d)
2009 2008€‘000 €‘000
Carrying amount of goodwill allocated to the CGU 68,893 62,632% EBIDTA would need to drop by for an impairment to arise 51% 75%
Insulated Panels Western EuropeThis division represents 20% of the Group’s total goodwill. Goodwill for an equivalent of €60mn related to the acquisition ofcompanies within the Insulated Panels division has been allocated for this impairment test. Following an internal reorganisationduring the year, some of the goodwill from the old Offsite CGU has been reallocated to this CGU.
2009 2008€‘000 €‘000
Carrying amount of goodwill allocated to the CGU 60,551 47,669% EBIDTA would need to drop by for an impairment to arise 69% 61%
14. OTHER INTANGIBLE ASSETS
At 31 December 2009
Technical OtherCost Patents Brands Know-how Intangibles Total
€‘000 €‘000 €‘000 €‘000 €‘000
At 1 January 5,778 12,121 156 8,658 26,712Additions* - - - 1,260 1,260Net exchange difference - 295 1 (157) 139At 31 December 5,778 12,416 157 9,761 28,111
Accumulated amortisation
At 1 January (5,702) (5,372) (35) (2,436) (13,544)Charge for year (79) (1,869) (22) (2,426) (4,396)Net exchange difference 3 4 (1) 128 134At 31 December (5,778) (7,237) (58) (4,734) (17,806)
Net book value - 5,179 99 5,027 10,305
*Additions include an amount of €1.25mn relating to the acquisition of AIR-CELL Innovations (refer to Note 37).

76
Financial Statements 2009
Notes to the Financial Statementsas at 31 December 2009
14. OTHER INTANGIBLE ASSETS (cont’d)
At 31 December 2008
Technical OtherCost Patents Brands Know-how Intangibles Total
€‘000 €‘000 €‘000 €‘000 €‘000
At 1 January 5,818 16,883 1,211 3,682 27,593Additions - 3,265 138 5,066 8,469Impairment - (7,065) (1,188) - (8,253)Net exchange difference (40) (962) (5) (90) (1,097)At 31 December 5,778 12,121 156 8,658 26,712
Accumulated amortisation
At 1 January (5,319) (6,213) (326) (1,572) (13,429)Charge for year (423) (3,092) (159) (941) (4,615)Impairment - 3,785 446 - 4,231Net exchange difference 40 148 4 77 269At 31 December (5,702) (5,372) (35) (2,436) (13,544)
Net book value 76 6,748 121 6,222 13,168
15. JOINTLY CONTROLLED ENTITIES
The following are jointly controlled entities, in which the Group holds 50% of the voting shares, which have been incorporatedinto the consolidated financial statements using the proportionate consolidation.
Kingspan Tarec Industrial Insulation LimitedKingspan Tarec Industrial Insulation NV
The aggregate amounts relating to these entities that have been included in the Consolidated Financial Statements as follows:
2009 2008€‘000 €‘000
Non-current assets 6,319 6,547Current assets 5,532 5,373
11,851 11,920
Non-current liabilities (1,718) (76) Current liabilities (5,571) (8,780)
(7,289) (8,856)
Income 17,174 19,766Expenses (14,829) (17,506)Profit for the year before tax 2,345 2,260Income tax expense (22) (325)Net profit for the year 2,323 1,935

77
Financial Statements 2009
Notes to the Financial Statementsas at 31 December 2009
16. PROPERTY, PLANT AND EQUIPMENT
At 31 December 2009Land and Plant and Motorbuildings machinery vehicles Total
Cost or valuation €‘000 €‘000 €‘000 €‘000
At 1 January 238,593 434,354 11,064 684,011Acquisition of business entities 86 283 41 410Additions 10,169 31,829 1,238 43,236Disposals (1,860) (9,549) (2,178) (13,587)Impairment (143) (8,857) 156 (8,844)Renanalysed as ‘held for sale’ (Note 20) (25,014) - - (25,014)Translation adjustment 7,624 14,444 231 22,299At 31 December 229,455 462,504 10,552 702,511
Depreciation
At 1 January (35,298) (230,539) (7,105) (272,942)Acquisition of business entities (16) (6,376) (28) (6,420)Charge for year (5,550) (28,730) (1,808) (36,088)Disposals 1,138 8,678 1,758 11,574Impairment (89) 2,191 (41) 2,061Reanalysed as ‘held for sale’ (Note 20) 6,004 - - 6,004Translation adjustment (2,714) (4,501) 504 (6,711)At 31 December (36,525) (259,277) (6,720) (302,522)
Net book value at 31 December 2009 192,930 203,227 3,832 399,989
The net book value and depreciation of leased assets included above is split by category as follows:NBV 2,822,691Depreciation 521,742
Depreciation is included in the category ‘Operating Costs’ in the Consolidated Income Statement.

78
Financial Statements 2009
Notes to the Financial Statementsas at 31 December 2009
16. PROPERTY, PLANT AND EQUIPMENT (cont’d)
At 31 December 2008 Land and Plant and Motorbuildings machinery vehicles Total
Cost or valuation €‘000 €‘000 €‘000 €‘000
At 1 January 231,502 414,315 11,911 657,728Acquisition of business entities 19,684 28,438 - 48,122Additions 26,357 73,733 2,869 102,959Disposals (5,925) (25,246) (2,179) (33,350)Translation adjustment (33,025) (56,886) (1,537) (91,448)At 31 December 238,593 434,354 11,064 684,011
Depreciation
At 1 January (31,795) (220,758) (6,487) (259,040)Acquisition of business entities (3,930) (28,173) (297) (32,400)Charge for year (11,399) (27,079) (2,110) (40,588)Disposals 6,406 11,211 1,408 19,025Translation adjustment 5,420 34,260 381 40,061At 31 December (35,298) (230,539) (7,105) (272,942)
Net book value at 31 December 2008 203,294 203,815 3,958 411,068
The net book value and depreciation of leased assets included above is split by category as follows:NBV 2,493,115Depreciation charge 82,606
Included within the cost of plant and machinery are assets in the course of construction to the value of €21,278,160(2008: €46,205,508). These assets have not yet been depreciated.
Included within the cost of land and buildings are assets in the course of construction to the value of €1,591,257(2008: €34,281,150). These assets have not yet been depreciated.
Depreciation is included in the category ‘Operating Costs’ in the Consolidated Income Statement.
17. FINANCIAL ASSETS & INVESTMENTS IN SUBSIDIARIES
GROUP2009 2008€‘000 €‘000
Long term financial assets:Unlisted investments (at cost) 10 210
10 210
All of the above investments have been designated as assets available for sale.
COMPANYRestated
2009 2008€‘000 €‘000
Investment in Subsidiaries:Shares in subsidiaries at cost - unlisted:At 1 January (as previously reported) - 25,070Prior year adjustment - 2,373Adjusted balance 26,943 27,443Disposals (9,684) (500)Additions 1,060,200 -At 31 December 1,077,459 26,943

79
Financial Statements 2009
Notes to the Financial Statementsas at 31 December 2009
18. INVENTORIES
2009 2008€‘000 €‘000
Raw materials and consumables 94,750 130,649Work in progress 1,572 2,824Finished goods 36,921 44,695Inventory provision (22,422) (19,052)
110,821 159,116
A total of €598.5mn of inventories was included in the Consolidated Income Statement as an expense (2008: €963.5mn).This includes an amount of €3.4mn (2008: €14mn) resulting from the write down of inventories.
None of the above carrying amounts have been pledged as security for liabilities entered into by the Group.
19. TRADE AND OTHER RECEIVABLES
GROUP COMPANY2009 2008 2009 2008€‘000 €‘000 €‘000 €‘000
Amounts falling due within one yearTrade receivables 181,071 266,491 - -Other receivables 11,846 17,151 - -Prepayments 10,588 15,547 - 2Amounts due from subsidiaries - - 263,652 60,738
203,505 299,189 263,652 60,740
The Group’s trade and other receivables have been reviewed for indicators of impairment. Certain trade receivables were foundto be impaired and a provision of €23,096,000 (2008: €19,095,520) has been recorded accordingly. The movement on theprovision is analysed as follows:
2009 2008€‘000 €‘000
At 1 January 19,096 13,389Translation adjustment 1,000 (3,315)Arising on acquisition - 1,636Provided during the year 10,375 10,131Written off during the year (8,000) (2,862)Recovered during the year 625 117At 31 December 23,096 19,096
The concentration of credit risk is limited due to the customer base being large and unrelated. The Directors believe that thereis no further credit provision required in excess of the allowance for doubtful debts.

80
Financial Statements 2009
Notes to the Financial Statementsas at 31 December 2009
19. TRADE AND OTHER RECEIVABLES (cont’d)
The aged analysis of trade receivables split between amounts that were neither past due nor impaired and amounts past duebut not impaired at the year end was as follows:
Within terms and not impaired:GROUP
2009 2008€‘000 €‘000
Less than 90 days due 110,089 154,168Greater than 90 days due 4,950 4,190
115,039 158,358
Past due but not impaired
0 to 60 days 57,101 92,77660+ days 8,931 15,357
66,032 108,133
The carrying amount of receivables whose terms have been negotiated, that would otherwise be past due or impaired is €NIL(2008: €182,984).
The Group has in place a comprehensive credit insurance policy covering trade receivables.
The Directors consider that the carrying amount of trade and other receivables approximate to their fair value.
20. ASSETS HELD FOR SALE
GROUP2009 2008€‘000 €‘000
By operating segment:Insulated Panels 1,688 -Insulation Boards 7,840 -Environmental and Renewables 9,482 -
19,010 -
In 2009, the Group has classified certain properties as assets held for sale, arising from restructuring activity. The bulk of theproperties are located in Ireland and the UK, and the sales are expected to complete during 2010. These assets are held at netbook value since the date the decision was made to transfer them to this class of asset.
21. TRADE AND OTHER PAYABLESGROUP COMPANY
2009 2008 2009 2008€‘000 €‘000 €‘000 €‘000
Amounts falling due within one yearTrade payables 85,228 128,018 - -Accruals and deferred income 91,247 96,104 - -Irish income tax and social welfare 299 348 - -Other income tax and social welfare 6,581 7,192 - -Value added tax 7,716 4,367 - -
191,071 236,029 - -
Included in accruals is the derivative financial liability of €388,642 relating to forward contracts. In 2008 a derivative financialasset of €6,658,000 was included in prepayments. The Directors consider that the carrying amount of trade and otherpayables approximate to their fair value.

81
Financial Statements 2009
Notes to the Financial Statementsas at 31 December 2009
22. INTEREST BEARING LOANS AND BORROWINGS
GROUP2009 2008€‘000 €‘000
Current financial liabilitiesBank loans and overdrafts- secured - -- unsecured 30,482 14,914Finance lease and hire purchase obligations 1,381 1,943
31,863 16,857
Non-current financial liabilitiesBank loans- secured - -- unsecured 201,141 345,248
201,141 345,248
Repayment schedule of non-current financial liabilitiesBank loans repayable:- between one and two years - -- between two and three years - 3,431- between three and four years 59,812 -- between four and five years - 190,196 - after more than five years 141,329 151,621
201,141 345,248Instalment paymentsLoans fully repayable within 5 years- not by instalments 91,674 201,484- by instalments - -
91,674 201,484
Loans fully repayable in more than 5 years- not by instalments 141,329 151,621- by instalments - -
141,329 151,621Interest-bearing loans and borrowings(non-current and current) 233,004 362,105
The Group concluded a 5-year €330mn revolving credit facility in September 2008 with a syndicate of 6 domestic andinternational banks. The facility is subject to industry standard covenants, the principal ones being a minimum EBITDA interestcover of 4 times, a maximum net debt to EBITDA multiple of 3.5 times and minimum net assets of €400mn. These covenantsmirror the covenants in the private placement loan notes (except for the minimum net asset requirement) which represents theother part of the Group’s core funding facilities.

82
Financial Statements 2009
Notes to the Financial Statementsas at 31 December 2009
23. CONTINGENT DEFERRED CONSIDERATION
For each transaction for which contingent deferred consideration has been provided, an annual review takes place to evaluateif the appropriate conditions are likely to be met.
The movement in the provision is analysed as follows:
2009 2008€‘000 €‘000
At 1 January 12,770 11,101Translation adjustment 499 (1,166)Arising on current year acquisitions 1,821 6,871Released during year (587) (1,515)Amounts paid (11,196) (2,521)At 31 December 3,307 12,770
Of the amount due at the reporting date, €2,609,000 is due after one year (2008: €7,790,000).
The contingent deferred consideration liability is derived from a review of the acquisition proposal and subsequent budget androlling 5 year strategic plans, which by their nature are based on a series of assumptions.
The Directors consider that the carrying amount of contingent deferred consideration approximates to its fair value.
24. FINANCIAL RISK MANAGEMENT & FINANCIAL INSTRUMENTS
Financial Risk ManagementIn the normal course of business, the Group has exposure to a variety of financial risks, including foreign currency risk, interestrate risk, liquidity risk, and credit risk. The Group’s focus is to understand these risks and to put in place policies that minimisethe economic impact of an adverse event on the Group’s performance. Meetings are held on a regular basis to review theresult of the risk assessment, approve recommended risk management strategies and monitor the effectiveness of suchpolicies.
Some of the Group’s risk management strategies include the usage of derivatives (otherwise than for speculative transactions),mainly forward exchange contracts, interest rate swaps, and cross currency interest rate swaps.
Liquidity riskIn addition to the high level of free cash flow, the Group operates a prudent approach to liquidity management using a mixtureof long-term debt together with short-term debt, cash and cash equivalents, to meet its liabilities when due.
The Group’s core funding is provided by a private placement of $200mn, of which $158mn matures in March 2015 and afurther $42mn in March 2017.
In addition the Group has a committed revolving credit facility of €330mn maturing in September 2013, of which c. €57mnwas drawn down at year end.
Both the private placement and the revolving credit facility have an interest cover test (Net Interest: EBITDA must exceed4 times) and a net debt test (Net Debt: EBITDA must be less than 3.5 times). In addition, the revolving credit facility has arequirement that the Group’s net assets must exceed €400mn.
The Group also has in place a number of uncommitted bilateral working capital facilities to serve its working capitalrequirements. These facilities total c. €65mn are mostly supported by a Group guarantee.

83
Financial Statements 2009
Notes to the Financial Statementsas at 31 December 2009
24. FINANCIAL RISK MANAGEMENT & FINANCIAL INSTRUMENTS (cont’d)
The following are the carrying amounts and contractual liabilities of financial liabilities (including interest payments):
Non-derivative Carryingfinancial liabilities amount Contractual Within Between Between Greater than
2009 Cash Flow 1 Year 1 and 2 Years 2 and 5 Years 5 Years€‘000 €‘000 €‘000 €‘000 €‘000 €‘000
Bank loans 92,046 92,246 30,552 - 59,942 1,752Private placement loan notes 139,577 189,370 6,384 6,384 19,152 157,450Finance lease liabilities 1,381 1,381 1,381 - - -Trade and other payables 191,071 191,071 191,071 - - -Deferred consideration 3,307 3,307 698 2,609 - -
Derivative financial liabilities
Interest rate swapsused for hedging- outflow - 533 239 236 58 -
- inflow - 80 36 35 9 -
Included in the contractual cash flows for the USD$200mn private placement debt are cash flows under the cross currencyinterest rate swap as follows:- outflow - 189,369 6,384 6,384 19,152 157,449
- inflow - 182,456 7,234 7,234 21,703 146,284
Under the Group’s 5-year revolving credit facility, the drawdown periods are either 1, 3 or 6 months. The contractual cashflowabove for Bank Loans includes only the interest on the revolver drawings of c. €57mn that will be payable at the nextdrawdown rollover date (March 2010), as that is the extent of the Group’s contractual cashflow obligation at 31 December2009.
For provisions, the carrying amount represents the Group’s best estimate of the expected future outflows. As it does notrepresent a contractual liability at the balance sheet date, no amount has been included as a contractual cash flow.
Foreign exchange risksAs outlined in the Business Risk Analysis on page 22, there are three types of foreign currency risk to which the Group isexposed, namely Transaction Risk, Translation Risk and Balance Sheet Risk.
Transaction risk arises where operating units have input costs or sales in currencies other than its functional currency.Transactional FX exposures are internally hedged as far as possible and to the extent that they are not, such material residualexposures are hedged on a rolling 12-month basis. The Group’s main exposure on transactional FX relates to GBP and USD,with less significant exposures to certain central European currencies. Based on current cashflow projections for the existingbusinesses to 31 December 2010, it is estimated that the Group is long c. GBP£23mn against EUR. At 31 December 2009hedges were in place covering c. 45% of this exposure. The Group is short c. USD$12mn against GBP. At 31 December 2009,hedges were in place covering c. 75% of this exposure.
In addition, where operating entities carry monetary assets and liabilities at year end denominated other than in their functionalcurrency, its translation at the year end rate of exchange versus their reporting currency will give rise to FX gains and losses.
Translational risk exists due to the fact that the Group has operations whose functional currency is not the EUR, the Group’sfunctional currency. Changes in the exchange rate between the reporting currencies of these operations and the EUR, have animpact on the Group’s consolidated reported result. For 2009, the impact of changing FX rates versus EUR compared to theaverage 2008 rates was adverse c. €4mn. In common with many other international groups, the Group does not currentlyseek to externally hedge its translation exposure.

84
Financial Statements 2009
Notes to the Financial Statementsas at 31 December 2009
24. FINANCIAL RISK MANAGEMENT & FINANCIAL INSTRUMENTS (cont’d)
Balance sheet risk arises on the annual retranslation at closing FX rates versus EUR of the Group’s non EUR denominatedinvestments, primarily GBP and USD. As the bulk of the Group’s non EUR investments are GBP denominated, the translationof these investments into EUR at the closing EUR:GPB rate has given rise to a significant exchange adjustment. Across all ofthe Group’s non-EUR currencies this adjustment amounted to €22.3mn (positive) for 2009 and has been taken directly toreserves. To the extent that the Group’s external debt is denominated in the same currency as its principal non-EURinvestments, the translation of this debt would mitigate the translation adjustment on the net investments. The external debtthat is USD denominated acts as a hedge against the translation of the Group’s US investments.
Sensitivity analysis for primary currency riskA 10% volatility of the EUR against GBP or USD in respect of transaction risk in the reporting entities functional currency wouldnot have a material impact either on the reported after tax profit, or on equity.
US Dollar Loan NotesThe Group had a private placement of US$158mn fixed interest 10-year bullet repayment loan notes maturing on 29 March2015 and US$42mn fixed interest 12-year bullet repayment loan notes maturing on 29 March 2017. The Group, being Eurodenominated and with mostly Euro cash flows wished to economically hedge the risk and therefore entered into US dollarfixed/Euro fixed cross currency interest rate swaps for the full amount of the private placement with semi-annual interestpayments with a weighted average interest rate of 4.15%. The maturity date of these cross currency interest rate swaps isidentical to the maturity date of the private placement debt.
These cross currency interest rate swaps had not been designated under the IAS 39 hedge accounting rules. Consequentlythe change in fair value of the cross currency interest rate swaps is recognised in the Consolidated Income Statement(€6.9mn) and the translation gain on the private placement debt is also recognised in the Consolidated Income Statement inaccordance with IAS 21 (€11.8mn).
On 26 February 2010, these cross currency interest rate swaps were designated as cash flow hedges under IAS 39 hedgeaccounting rules thus removing any significant volatility from reported earnings.
Interest Rate RiskThe Group’s has an exposure to movements in interest rates on its debt portfolio, and on its cash and cash equivalentbalances and derivatives. The Group policy is to ensure that at least 40% of its debt is fixed rate.
At 31 December 2009, the Group’s private placement debt of €151mn (swapped from USD$200mn) was fixed out to maturity(2015 and 2017) at a weighted average interest rate of 4.15%. Of the Group’s remaining external debt, USD$20mn has beenfixed for a period to January 2012 at an average rate of 1.675% plus margin.
In respect of interest bearing loans and borrowings, the following table indicates the effective average interest rates at thefinancial position date and the periods which they mature. Interest on interest bearing loans and borrowings classified asfloating rate is repriced at intervals of less than one year. The table further analyses interest bearing loans and borrowings bycurrency and fixed/floating mix.
As at 31 December 2009
Weighted At fixed At floating Under 5 Over 5average effective Total interest rate interest rate years years
interest rate €’000 €’000 €’000 €’000 €’000
Bank overdrafts 3.16% 23,969 - 23,969 23,969 -Bank loans 1.43% 56,808 13,958 42,850 56,808 -Loan notes 4.15% 139,577 139,577 - - 139,577Other loans 9.00% 11,269 - 11,269 11,269 -
231,623 153,535 78,088 92,046 139,577

85
Financial Statements 2009
Notes to the Financial Statementsas at 31 December 2009
24. FINANCIAL RISK MANAGEMENT & FINANCIAL INSTRUMENTS (cont’d)
At fixed At floatingTotal interest rate interest rate€’000 €’000 €’000
Euro 173,336 139,577 33,759USD 56,808 13,958 42,850Others 1,479 - 1,479
231,623 153,535 78,088
Floating/Fixed comparison (on gross debt)Weighted average fixed period 5.34
An increase or decrease of 100 basis points in each of the applicable rates and interest rate curves would not have a materialimpact on the reported after tax profit or equity of the Group.
Credit RiskCredit risk encompasses the risk of financial loss to the Group of counterparty default in relation to any of its financial assets.The Group’s maximum exposure to credit risk is represented by the balance sheet amount of each financial asset:
2009 2008 2007€‘000 €‘000 €‘000
Cash & cash equivalents 83,886 75,254 66,626Trade and other receivables 203,505 299,189 386,744Derivative financial assets - 6,658 1,702
Cash & cash equivalentsOn the Group’s cash and cash equivalents, counterparty risk is managed by spreading business across a portfolio ofrelationship banks.
Forward foreign exchange contractsA loss of €389,000 (2008: €6,658,000 gain) recognised in the cash flow hedge reserve in equity at 31 December 2009 onforward foreign exchange contracts designated as cash flow hedges under IAS 39 Financial Instruments: Recognition andMeasurement will be released to the Consolidated Income Statement at various dates up to 12 months after the balance sheetdate. This amount is included within accruals - at 31 December 2008 the corresponding amount was included in prepayments.
Financial Instruments by categoryThe carrying amount of financial assets presented in the statement of financial position relate to the following measurementcategories as defined in IAS 39:
Derivatesdesignated as
Loans and hedging Otherreceivables instruments (non IAS 39) Total
€’000 €’000 €’000 €’000As at 31 December 2009Current:Trade receivables 181,071 - - 181,071Other receivables - - 11,846 11,846Prepayments - - 10,588 10,588Cash and cash equivalents 83,886 - - 83,886Total for category 264,957 - 22,434 287,391
As at 31 December 2008Current:Trade receivables 266,491 - - 266,491Other receivables - - 17,151 17,151Prepayments - 6,658 8,889 15,547Cash and cash equivalents 75,254 75,254Total for category 341,745 6,658 26,040 374,443

86
Financial Statements 2009
Notes to the Financial Statementsas at 31 December 2009
24. FINANCIAL RISK MANAGEMENT & FINANCIAL INSTRUMENTS (cont’d)
The carrying amounts of financial assets presented in the statement of financial position relate to the following measurementcategories as defined in IAS 39:
Designated at Financial liabilities Derivativesfair value measured at designated
through profit amortised as hedging Otheror loss cost instruments (non IAS 39) Total€’000 €’000 €’000 €’000 €’000
As at 31 December 2009Current:Borrowings - 31,863 - - 31,863Trade payables - - - 85,228 85,228Accruals and deferred income - - 389 90,858 91,247Derivative financial instrument 917 - - - 917Total for category 917 31,863 389 176,086 209,255
Non current:Borrowings - 201,141 - - 201,141Derivative financial instrument 6,042 - - - 6,042Total for category 6,042 204,141 - - 207,183
As at 31 December 2008Current:Borrowings - 16,857 - - 16,857Trade payables - - - 128,018 128,018Accruals and deferred income - - - 96,104 96,104Total for category - 16,857 - 224,122 240,979
Non current:Borrowings - 345,249 - - 345,249Total for category - 345,249 - - 345,249
Fair value hierarchyThe Group adopted the amendments to IFRS 7 Improving disclosure about financial statements effective from1 January 2009. These improvements require the Group to present certain information about financial instrumentsmeasured at fair value in the statement of financial position. In the first year of application, comparative information neednot be presented for the disclosures required by the amendment. Accordingly, the disclosures for the fair value hierarchyis only presented for the 31 December 2009 year end.
Both forward contracts and the derivative financial instrument relating to the private placement loan fall within level 2 ofthe fair value hierarchy.
25. PROVISIONS FOR LIABILITIES
At Provided Claims Provisions Translation At1 January Acquisitions during year paid released adjustment 31 December
€‘000 €‘000 €‘000 €‘000 €‘000 €‘000 €‘000
Guarantees andwarranties
2009 56,467 201 22,165 (18,662) (3,660) 2,548 59,0592008 54,670 1,886 30,060 (17,722) (3,409) (9,018) 56,467
Of the closing provisions at 31 December 2009, €39.2mn relates to specific provisions (2008: €37.9mn) and €19.8mn relatesto risk based provisions (2008: €18.5mn).
Some products carry formal guarantees of satisfactory performance of varying periods following their purchase by customers.Specific provisions have been made where there are known claims and the estimated cost of rectifying these claims has beenprovided. The risk based provision relates to unexpired warranties where no claim has yet been received but based on qualitycontrol evaluations and past history of claims, it is probable that a claim will be received. The provision is based on the run rateat the estimated cost of settling the claim.
Both the number of claims (in the case of the risk based provision) and the cost of settling the claim are sensitive to change butnot too such an extent as would cause a material change in the year end provision.

87
Financial Statements 2009
Notes to the Financial Statementsas at 31 December 2009
26. DEFERRED TAX ASSETS AND LIABILITIES
Recognised deferred tax assets and liabilitiesDeferred tax assets and liabilities arising from temporary differences and unused tax losses can be summarised as follows:
Assets Liabilities Net2009 2008 2009 2008 2009 2008€‘000 €‘000 €‘000 €‘000 €‘000 €‘000
Property, plant and equipment (698) (766) (16,559) (16,854) (17,257) (17,620)Other timing differences 2,938 1,994 706 1,185 3,644 3,179Pension obligations - - 33 1,109 33 1,109Unused tax losses 710 - 838 56 1,548 56
2,950 1,228 (14,982) (14,504) (12,032) (13,276)
Deferred tax arises from differences in the timing of the recognition of items, principally depreciation and capital allowances,in the financial statements and by the tax authorities. There was no unrecognised deferred tax asset or liability at31 December 2009 (2008: €Nil).
The movement in the net deferred tax position for 2009 is as follows:
At Recognised Recognised Translation Arising on Transfer to DB At1 Jan in Income in Equity adjustment acquisitions Pension Liability 31 Dec
Property, plantand equipment (17,620) (276) - (1,390) 2,028 - (17,257)
Other timingdifferences 3,179 (1,255) - 1,022 698 - 3,644
Pension obligations 1,109 (41) 1,106 (714) - (1,426) 33
Unused tax loses 56 1,430 - 62 - - 1,548(13,276) (142) 1,106 (1,020) 2,726 (1,426) (12,032)
The movement in the net deferred tax position for 2008 is as follows:
At Recognised Recognised Translation Arising on Transfer to DB At1 Jan in Income in Equity adjustment acquisitions Pension Liability 31 Dec
Property, plantand equipment (16,082) (7,007) - 5,469 - - (17,620)
Other timingdifferences 3,379 574 - 30 (804) - 3,179
Pension obligations 2,100 (47) 452 (1,395) - - 1,109
Unused tax loses 71 (16) - - - - 56(10,532) (6,496) 452 4,104 (804) - (13,276)
27. SHARE CAPITAL2009 2008€‘000 €‘000
Authorised220,000,000 Ordinary shares of €0.13 each (2008: 220,000,000 shares) 28,600 28,600
Issued and fully paidOrdinary shares of €0.13 eachOpening balance - 171,269,951 shares 22,265 22,146Share options exercised - 234,000 shares 31 119Closing balance - 171,503,951 shares 22,296 22,265
At 31 December 2009, the Group held 5,237,017 (2008: 5,237,017) Treasury Shares in the Company.
28. SHARE PREMIUM ACCOUNT2009 2008€‘000 €‘000
At 1 January 35,751 31,917Employee share based compensation releasedon exercise (Note 32) 81 1,260Premium on shares issued 654 2,574At 31 December 36,486 35,751

88
Financial Statements 2009
Notes to the Financial Statementsas at 31 December 2009
29. OTHER RESERVES
GROUP COMPANY2009 2008 2009 2008€‘000 €‘000 €‘000 €‘000
At 1 January (194,036) (67,568) - -Exchange adjustments 22,341 (131,424) - -Cash flow hedging in equity
- current year (389) 6,658 - -- reclassification to profit and loss (6,658) (1,702)
At 31 December (178,742) (194,036) - -
Other reserves is analysed as follows at the year end:
Translation adjustment (178,136) (200,477)Cash flow hedging adjustment (606) 6,441
(178,742) (194,036)
30. REVALUATION RESERVE
2009 2008€‘000 €‘000
At beginning and end of year 713 713
31. CAPITAL REDEMPTION RESERVE
2009 2008€‘000 €‘000
At beginning and end of year 723 723
The capital redemption reserve arose on the cancellation of own shares in 2003 and the redemption of treasury sharesin 2007.
32. RETAINED EARNINGS
GROUP COMPANYRestated
2009 2008 2009 2008€‘000 €‘000 €‘000 €‘000
At 1 January (as previously reported) 651,841 681,755 28,943 30,674Prior year adjustment - - - 13,110Adjusted balance 651,841 681,755 28,943 43,784Retained profit for the year 47,658 44,990 1,251,545* 58,875Defined benefit pension scheme (3,951) (1,640) - -Income tax relating to items charged or credited to equity 1,106 452 - -Employee share based compensation 2,800 2,372 1,199 2,372Employee share based compensation released on exercise (81) (1,260) (81) (1,260)Share buyback - (32,565) - (32,565)Dividends - (42,262) - (42,262)At 31 December 699,373 651,841 1,281,606 28,944
In accordance with Section 148(8) of the Companies Act, 1963 and Section 7 (1A) of the Companies (Amendment) Act, 1986,the Company is availing of the exemption from presenting its individual profit and loss account to the Annual General Meetingand from filing it with the Registrar of Companies.
* Included in retained profit for the year is a profit on disposal of €1,049,317,547 realised on an internal reorganisation under which the Company transferred its shareholding in certain subsidiary companies to another Irish Group company.

89
Financial Statements 2009
Notes to the Financial Statementsas at 31 December 2009
33. DIVIDENDS
Dividends on Ordinary Shares are recognised in the Group’s financial statements once approved by the Board.
There was no Final Dividend on Ordinary Shares for the year ended 31 December 2008. There was no Interim Dividend onOrdinary Shares for the year ended 31 December 2009.
There is no Final Dividend on Ordinary Shares being proposed for the year ended 31 December 2009.
DIVIDENDS
Ordinary dividends2009 2008€‘000 €‘000
Paid: 2008 Final dividend nil (2007: 17.0c per share) - 28,9842009 Interim dividend nil (2008: 8.0c per share) - 13,278
- 42,262
34. MINORITY INTEREST
2009 2008€‘000 €‘000
At 1 January 1,825 3,230Capital injection by minority shareholder 4,000 (39)Transfer to goodwill on acquisition of remaining balance of subsidiary (1,447) -Dividends paid to minorities (340) (71)Profit and loss account 309 (1,007)Translation adjustment 339 (288)At 31 December 4,686 1,825
35. CASH FLOW STATEMENT
The following non-cash adjustments have been made to the pre-tax result for the year to arrive at operating cash flow:
2009 2008€‘000 €‘000
Depreciation, amortisation and impairment charges of fixed and intangible assets 40,178 88,876Employee equity-settled share options 2,800 2,372Net finance cost 5,980 13,910Non cash items 2,711 2,705Profit on sale of tangible assets (702) (171)Total 50,967 107,692
36. RECONCILIATION OF NET CASH FLOW TO MOVEMENT IN NET DEBT2009 2008€‘000 €‘000
(Decrease)/increase in cash and bank overdrafts (16,093) 21,352Decrease/(increase) in debt, lease finance and contingent deferred consideration 151,252 (80,706)Change in net debt resulting from cash flows 135,159 (59,354)
Loans and lease finance acquired with subsidiaries (388) (2,684)Contingent deferred consideration arising on acquisitions in the period (1,235) (5,356)Translation movement - relating to US dollar loan 11,881 -Translation movement - other 1,780 (7,259)Derivative financial instrument (6,959) -Net movement 140,238 (74,653)
Net debt at start of the year (299,622) (224,969)Net debt at end of the year (159,384) (299,622)

90
Financial Statements 2009
Notes to the Financial Statementsas at 31 December 2009
37. ACQUISITIONS
(a) AIR-CELL InnovationsThe Group completed one acquisition in the year, when it purchased 100% of the shares of the AIR-CELL Innovations,an Australian based distributor of insulation foil products. The consideration for the acquisition was cash.
A summary of the effect of the AIR-CELL Innovations acquisition during the year is as follows:
Book value Fair value Fair valueat acquisition adjustments to the Group
€‘000 €‘000 €‘000
Property, plant and equipment 385 (222) 163Goodwill 2,063 (2,063) -Intangibles 1,099 (1,099) -Inventories 382 - 382Financial assets 704 (704) -Trade and other receivables 3,134 - 3,134Taxation (624) - (624)Cash and cash equivalents 205 - 205Trade and other liabilities (2,549) (210) (2,759)Other 63 - 63Interest bearing loans and borrowings (388) - (388)Other intangible assets - 1,250 1,250Total net assets acquired 4,474 (3,048) 1,426
Effects of revisions of fair values above
Goodwill 7,175Consideration 8,601
2009€‘000
Satisfied by:
Consideration paid (including acquisition costs) 6,780Contingent deferred consideration 1,821
8,601
The fair value of the assets acquired has been provisionally determined as at 31 December 2009 and may be subject tochange as the Group has yet to finally determine the fair value attributed to all of the assets and liabilities acquired.
Any amendments to these fair values made during the subsequent reporting window (within the twelve month timeframe fromthe acquisition date imposed by IFRS 3) will be subject to disclosure in the 2010 Annual Report.
The revenue and profit of the Group for the financial year determined in accordance with IFRS as though the acquisition datesfor AIR-CELL Innovations effected during the year had been the beginning of that year would be as follows:
Revenue Operating Profit€‘000 €‘000
15,217 1,612
The goodwill arising on this acquisition relates primarily to access to new markets, while the intangible assets recognisedmainly refer to customer relationships.
(b) Prior year acquisitionsAdjustments made to goodwill in 2009 in respect of the prior year acquisitions in 2008 are as follows:
€‘000
Fair value adjustments 1,660Costs incurred 21Release of contingent deferred consideration (1,011)Additional contingent deferred consideration recognised 424
1,094
The fair value adjustments relate to corrections in respect of preliminary assessments of acquisitions in the prior year.

91
Financial Statements 2009
Notes to the Financial Statementsas at 31 December 2009
38. GUARANTEES AND OTHER FINANCIAL COMMITMENTS
(i) Government grantsIn certain circumstances, as set out in the grant agreements (the most significant of which are ceasing to trade, or the disposalof grant aided assets), grants may be repayable up to a maximum amount of €4,027,315 (2008: €1,304,322).
(ii) Guarantees and contingenciesThe private placement notes ($200mn) and the revolving credit facility (€330mn of which c. €57mn was drawn at year-end) areboth secured by means of cross guarantees provided by Kingspan Group plc and some of its subsidiaries. In addition, thereare a number of local overdraft facilities in overseas locations which are secured by means of a guarantee from KingspanGroup plc, or some other subsidiary company.
Tate Access Floors Inc., self-insures certain risks as a shareholder in an insurance captive. Generally, the Company’s exposure islimited to the Company’s premium plus an additional assessment. Unused premiums are refundable back to the Company in theform of dividends. The Company has accrued its estimate of probable loss at 31 December 2009.
(iii) Leasing and hire purchase 2009 2008Minimum Present value Minimum Present valuepayments of payments payments of payments
€‘000 €‘000 €‘000 €‘000
Finance lease and hire purchase obligations- within one year - 584 - 1,943- after one year - 797 - -Total minimum lease payments 1,503 - 2,195 -Less: amounts allocated to future finance costs (122) - (252) -Present value of minimum lease payments 1,381 1,381 1,943 1,943
Operating lease obligations are due as follows:
2009 2008€‘000 €‘000
- within one year 3,918 4,281- between 1 - 5 years 9,243 15,507- after 5 years 5,832 -
18,993 19,788
(iv) Future capital expenditureCapital expenditure in subsidiary entities, approved by the Directors but not provided in the financial statements, none of which relates to the holding company, is as follows:
2009 2008€‘000 €‘000
Contracted for 4,084 27,339Not contracted for 3,726 14,380
7,810 41,719
Capital expenditure in joint venture entities, approved by the Directors but not provided in the financial statements, none of which relates to the holding company, is as follows:
2009 2008€‘000 €‘000
Contracted for 11 560 Not contracted for 51 95
62 655

92
Financial Statements 2009
Notes to the Financial Statementsas at 31 December 2009
39. PENSION OBLIGATIONS
The Group operates defined contribution schemes in each of its main operating locations, and also has two defined benefitschemes (two of the three schemes in existance at the beginning of the year merged during the year).
The assets of each scheme are administered by trustees in funds independent from those of the Group.
Defined contribution schemesThe total cost charged to income of €6,271,246 (2008: €7,633,000) represents employer contributions payable to theseschemes in accordance with the rules of each plan. An amount of €1,748,299 (2008: €1,634,039) was included at year end inother accruals in respect of defined contribution pension accruals.
Defined benefit schemesThe Group operates two defined benefit schemes, each of which is closed to new members.
Total pension contributions to these schemes for the year amounted to €2,928,000 (2008: €2,611,000), and the expectedcontributions for 2010 are €2,294,000.
During the year €1,993,000 (2008: €1,417,000) of benefits were paid to members of these schemes.
The amount recognised in the Consolidated Income Statement relating to the defined benefit schemes has been disclosed inNote 7.
The pension costs relating to these schemes are assessed in accordance with the advice of qualified actuaries using theattained age method. The most recent actuarial valuations were 6 April 2006, 31 March 2007 and 5 April 2007 and these haveall been updated to 31 December 2009 by qualified independent actuaries to take account of the requirements of IAS 19Employee Benefits.
In general, actuarial valuations are not available for public inspection however, the results of valuations are advised to membersof the various schemes.
The extent of the Group’s obligation under these schemes is sensitive to judgmental actuarial assumptions, of which theprincipal ones are set out below. It is not considered that any reasonable sensitivity analysis on these assumptions wouldmaterially alter the scheme obligations.
2009 2008
Rate of increase of pensions in payment 3.30% 2.30%Discount rate 5.70% 6.00%Inflation assumption 3.30% 2.30%
The assets in the scheme and the expected rate of return for each year end were:2009 2008
Expected rate Expected rateof return of return
Equities 7.7% 7.0%-8.0%Bonds 5.70% 6.70%Cash 0.50% 2.00%
The net pension liability analysed as follows:2009 2008€’000 €’000
Equities 39,710 29,291Bonds 4,213 9,952Cash 8,329 474Other 267 -Total market value of assets 52,519 39,717Actuarial value of liability (57,611) (43,455)
Recoverable deficit in the scheme (5,092) (3,738)Related deferrred tax asset (Note 26) 1,426 1,056
Net pension liability (3,666) (2,682)
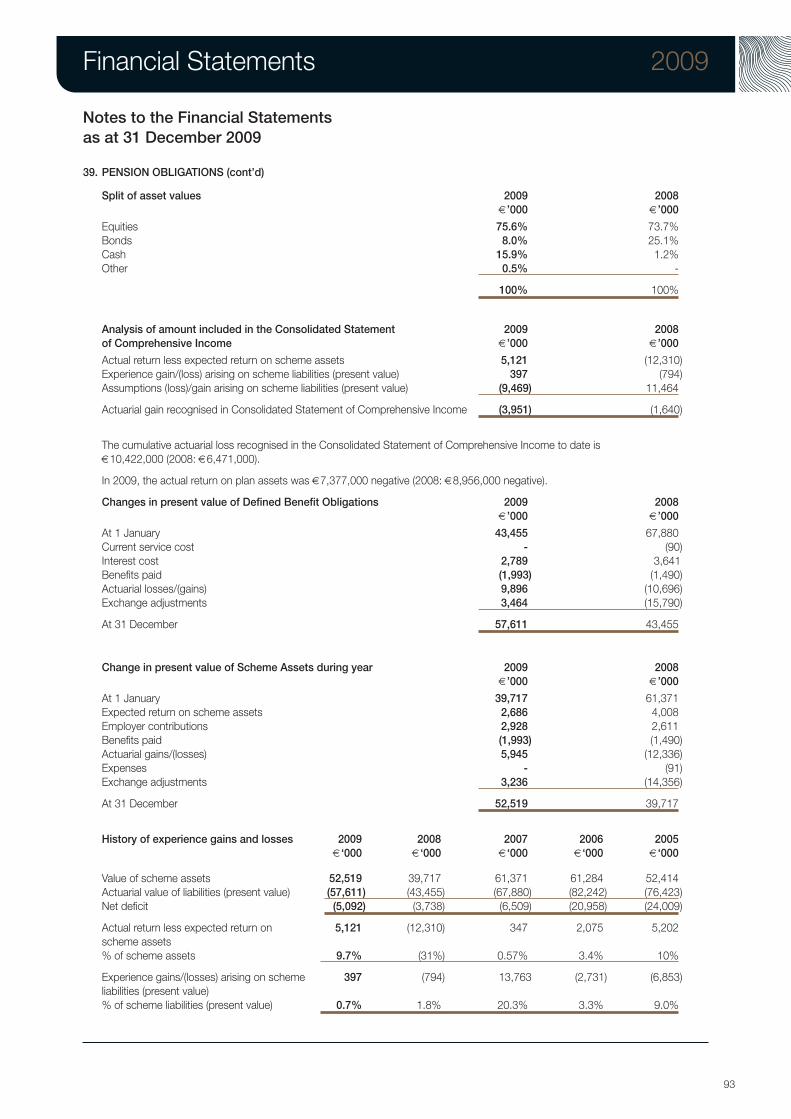
93
Financial Statements 2009
Notes to the Financial Statementsas at 31 December 2009
39. PENSION OBLIGATIONS (cont’d)
Split of asset values 2009 2008€’000 €’000
Equities 75.6% 73.7%Bonds 8.0% 25.1%Cash 15.9% 1.2%Other 0.5% -
100% 100%
Analysis of amount included in the Consolidated Statement 2009 2008of Comprehensive Income €’000 €’000
Actual return less expected return on scheme assets 5,121 (12,310)Experience gain/(loss) arising on scheme liabilities (present value) 397 (794)Assumptions (loss)/gain arising on scheme liabilities (present value) (9,469) 11,464
Actuarial gain recognised in Consolidated Statement of Comprehensive Income (3,951) (1,640)
The cumulative actuarial loss recognised in the Consolidated Statement of Comprehensive Income to date is€10,422,000 (2008: €6,471,000).
In 2009, the actual return on plan assets was €7,377,000 negative (2008: €8,956,000 negative).
Changes in present value of Defined Benefit Obligations 2009 2008€’000 €’000
At 1 January 43,455 67,880Current service cost - (90)Interest cost 2,789 3,641Benefits paid (1,993) (1,490)Actuarial losses/(gains) 9,896 (10,696)Exchange adjustments 3,464 (15,790)
At 31 December 57,611 43,455
Change in present value of Scheme Assets during year 2009 2008€’000 €’000
At 1 January 39,717 61,371Expected return on scheme assets 2,686 4,008Employer contributions 2,928 2,611Benefits paid (1,993) (1,490)Actuarial gains/(losses) 5,945 (12,336)Expenses - (91)Exchange adjustments 3,236 (14,356)
At 31 December 52,519 39,717
History of experience gains and losses 2009 2008 2007 2006 2005€‘000 €‘000 €‘000 €‘000 €‘000
Value of scheme assets 52,519 39,717 61,371 61,284 52,414Actuarial value of liabilities (present value) (57,611) (43,455) (67,880) (82,242) (76,423)Net deficit (5,092) (3,738) (6,509) (20,958) (24,009)
Actual return less expected return on 5,121 (12,310) 347 2,075 5,202scheme assets% of scheme assets 9.7% (31%) 0.57% 3.4% 10%
Experience gains/(losses) arising on scheme 397 (794) 13,763 (2,731) (6,853)liabilities (present value)% of scheme liabilities (present value) 0.7% 1.8% 20.3% 3.3% 9.0%

94
Financial Statements 2009
Notes to the Financial Statementsas at 31 December 2009
40. RELATED PARTY TRANSACTIONS
The principal related party relationships requiring disclosure in the Consolidated Financial Statements under IAS 24 RelatedParty Disclosures relate to (i) transactions between associated companies, (ii) compensation of key management personneland (iii) goods and services purchased from directors.
(i) Transactions between subsidiaries and associates are carried out on an arm’s length basis. The Company receiveddividends from subsidiaries of €202mn and there was a movement of inter company balances of €202.9mn.
(ii) For the purposes of the disclosure requirements of IAS 24 Related Party Disclosures, the term “key management personnel”(i.e. those persons having the authority and responsibility for planning, directing, and controlling the activities of the Company),refers to the Board of Directors which manages the business and affairs of the Company. As identified in the Report onDirectors Remuneration, the Directors, other than the non-executive directors, serve as executive officers of the Company.
Key management personnel compensation is set out in Note 10.
(iii) The Group purchased the following services at arms length from companies controlled by Mr. Eugene Murtagh:
2009 2008€‘000 €‘000
Travel services 33 482 Hotel 13 24Information Technology Services 30 45
76 551
The Group purchased the following services at arms length from companies controlled by Mr. Brendan Murtagh:
2009 2008€‘000 €‘000
Travel services - 19
There was €214 owed to related parties at 31 December 2009 (2008: €41,454).
41. CAPITAL MANAGEMENT POLICIES AND PROCEDURES
The Group employs a combination of debt and equity to fund its operations. At 31 December 2009 the total capital employedin the Group was €744.8mn (€159.3mn debt plus total equity).
The Board’s objective when managing capital is to maintain a strong capital base so as to maintain the confidence of investors,creditors and the market. The Board monitors the return on capital (defined as total shareholders’ equity plus net debt), andtargets a dividend level that is compatible with industry norms, but which also reflects any exceptional market conditions.The latter dicated that there was no dividend payment in respect of 2009.
The Board seeks to maintain a balance between the higher returns that might be possible with higher levels of borrowings andthe advantages and security afforded by a sound capital position. The Group actively manages foreign currency and interestrate exposure, as well as actively managing the net asset position, in order to create bottom line value. This necessitates thedevelopment of a methodology to optimize the allocation of financial resources on the one hand and the return on capital onthe other.
There were no changes to the Group’s approach to capital management during the year.

95
Financial Statements 2009
Notes to the Financial Statementsas at 31 December 2009
42. GROUP COMPANIES
The principal subsidiary companies and the percentage shareholding held by Kingspan Group plc, either directly or indirectly,at the balance sheet date are as follows:
Shareholding % Nature of BusinessIRELANDCoppercraft Limited 100 ManufacturingKingscourt Trustee Company Limited 100 Trustee CompanyKingspan Europe 100 Holding CompanyKingspan Fabrik Limited 100 ManufacturingKingspan Finance 100 Finance CompanyKingspan Funding Europe 100 Finance CompanyKingspan Funding Ireland 100 Finance CompanyKingspan Funding Overseas 100 Finance CompanyKingspan Holdings Limited 100 Holding CompanyKingspan Holdings (Irl) Limited 100 Management & ProcurementKingspan Holdings (North America) Limited 100 Holding CompanyKingspan Holdings (Overseas) Limited 100 Holding CompanyKingspan International Finance 100 Finance CompanyKingspan Investments (CEMEI) 100 Finance CompanyKingspan Investments Europe 100 Finance CompanyKingspan Investments (Ireland) Limited 100 Finance CompanyKingspan Nominees Limited 100 Holding CompanyKingspan Research & Development Limited 100 Product DevelopmentKingspan Securities Limited 100 Finance CompanyThermal Product Developments Limited 100 Product DevelopmentRegistered Office: Dublin Road, Kingscourt, Co. Cavan, Ireland
Kingspan Century Limited 100 ManufacturingRegistered Office: Clones Road, Monaghan, Co. Monaghan, Ireland
Kingspan Insulation Limited 100 ManufacturingRegistered Office: Bree Industrial Estate, Castleblayney, Co. Monaghan, Ireland
Kingspan Limited 100 ManufacturingRegistered Office: Carrick Road, Kingscourt, Co. Cavan, Ireland
Titan Environmental Limited 100 ManufacturingRegistered Office: Dundalk Road, Carrickmacross, Co. Monaghan, Ireland
UNITED KINGDOMKingspan Environmental and Renewables Limited 100 Holding CompanyKingspan Environmental Limited 100 ManufacturingKingspan Renewables Limited 100 ManufacturingRegistered Office: 180 Gilford Road, Portadown, BT63 5LE, Northern Ireland
Environmental Treatment Systems Limited 100 ManufacturingRegistered Office: College Road, Aston Clinton, Aylesbury, Buckinghamshire, UK
Banro Sections Limited 100 ManufacturingKingspan Group Limited 100 Holding CompanyKingspan Holdings (Insulation) Limited 100 Holding CompanyKingspan Holdings (Panels) Limited 100 Holding CompanyKingspan Holdings (Structural and Offsite) Limited 100 Holding CompanyKingspan Investments Limited 100 Holding CompanyKingspan Limited 100 ManufacturingKOS (No.1) Limited 100 ManufacturingWards Insulated Panels Limited 100 Sales & MarketingRegistered Office: Greenfield Business Park No. 2, Holywell, North Wales, UK
Kingspan Access Floors Limited 100 ManufacturingRegistered Office: Marfleet, Hull, Yorkshire, UK
Kingspan Hot Water Systems Limited 100 ManufacturingKingspan Solar Limited 100 MarketingRegistered Office: Tadman Street, Wakefield, West Yorkshire, WF1 5QU
Kingspan Insulation Limited 100 ManufacturingKingspan Tarec Industrial Insulation Limited 50 ManufacturingRegistered Office: Pembridge, Leominster, Herfordshire, UK
Kingspan Potton Limited 100 ManufacturingRegistered Office: Eltisley Road, Great Gransden, Sandy, Befordshire SG19 3AR

96
Financial Statements 2009
Notes to the Financial Statementsas at 31 December 2009
Shareholding % Nature of BusinessAUSTRALIAGriffin Rolled Steel Pty Limited 100 Holding CompanyKingspan Insulated Panels Pty 100 ManufacturingRegistered Office: 38-52 Dunheved Circuit, St Marys, Sydney, NSW 2760, AustraliaKingspan Insulation Holdings Ltd 100 Holding CompanyKingspan Insulation Pty Ltd 100 ManufacturingNovaduct Innovations Pty Ltd 100 Product DevelopmentNational Building Energy Rating Services Pty Ltd 100 Sales & MarketingRegistered Office: c/o Grant Thornton, Level 1, 10 Kings Park Road, West Perth 6005, AustraliaAUSTRIAKingspan GmbH 100 Sales & MarketingRegistered Office: Techgate Tower, Donau-City Straße 1, 1220 Vienna, Austria
BELGIUMKingspan Door Components S.A. 100 ManufacturingRegistered Office: 1A Zone Industrielle de l’Europe 2, 7900 Leuze-en-Hainaut, Belgium
Kingspan Holding Belgium N.V. 100 Holding CompanyKingspan Belgium N.V. 100 Sales & MarketingRegistered Office: Bouwelen 17, Industriepark Klein Gent, 2280 Grobbendonk, BelgiumKingspan Tarec Industrial Insulation NV 50 ManufacturingRegistered Office: Plejadenlaan 15, 1200 Brussel, Belgium
CANADAKingspan Insulated Panels Limited 100 ManufacturingRegistered Office: Fasken Martineau DuMoulin, 2100 - 1075 West Georgia Street, Vancouver, BC, V6E 3G2, CanadaTate ASP Access Floors Inc 100 ManufacturingRegistered Office: 66 Wellington Street West, Suite 3600, Toronto, Ontario, ON, M5K 1N6, Canada
CROATIAKingspan d.o.o. 100 Sales & MarketingRegistered Office: Jakova Gotovca 1, 10 000 Zagreb, Croatia
CZECH REPUBLICKingspan a.s. 100 ManufacturingRegistered Office: Vázní 465, 500 03 Hradec Králové, Czech Republic
DENMARKKingspan Danmark A/S 100 Sales & MarketingRegistered Office: Tækkemandsvej 7, 4300 Holbæk, DenmarkKingspan Miljocontainere A/S 100 ManufacturingRegistered Office: Amerikaveg 1, 7000 Fredericia, Denmark
ESTONIAKingspan OU 100 Sales & MarketingRegistered Office: Mustamäe tee 55, 10621 Tallinn, Estonia
FRANCEKingspan Sarl 100 Sales & MarketingRegistered Office: Bat 3 – Parc D’affaires de Crecy, 3 Rue Claude Chappe, 69370 Saint-Didier-au-Mont-d’Or, France
GERMANYKingspan Tek GmbH 100 ManufacturingRegistered Office: Beusterstraße 1a, 16348 Klosterfelde, GermanyKingspan Environmental GmbH 100 Sales & MarketingKingspan GmbH 100 Sales & MarketingRegistered Office: Am Schornacker 2, 46485 Wesel, Germany
HUNGARYKingspan Kft 100 ManufacturingRegistered Office: 2367 Újhartyán, Horka Dulo 1, Hungary
LATVIAKingspan SIA 100 Sales & MarketingRegistered Office: Volguntes iela 32-201, Ryga, Latvia
LITHUANIAUAB Kingspan 100 Sales & MarketingRegistered Office: 19 Draugystes gatve, Kaunas 51001, Lithuania
LUXEMBOURGKingspan Luxembourg Sarl 100 Finance CompanyRegistered Office: 398 Route d’Esch, L-1471, Luxembourg

97
Financial Statements 2009
Notes to the Financial Statementsas at 31 December 2009
Shareholding % Nature of BusinessNETHERLANDSKingspan B.V. 100 Sales & MarketingKingspan Holdings Netherlands B.V. 100 Holding CompanyKingspan Insulation B.V. 100 ManufacturingRegistered Office: Lingewei 8, 4004 LL, Tiel, Netherlands
NEW ZEALANDKingspan Limited 51 Sales & MarketingRegistered Office: 15 Ron Guthrey Road, Christchurch Airport, Christchurch, New Zealand
POLANDKingspan Insulation Sp.z o.o. 100 Sales & MarketingRegistered Office: ul. Kruczkowskiego 8, 00-380 Warsaw, PolandKingspan Sp.z o.o. 100 ManufacturingRegistered Office: ul. Przemyslowa 20, ap 27-300 Lipsko, PolandKingspan Environmental Sp.z o.o. 100 ManufacturingRegistered Office: ul. Topolowa 5, 62-090 Rokietnica k, Poznania, Poland
ROMANIAKingspan S.R.L. 100 Sales & MarketingRegistered Office: B-dul lancu de Hunedoary nr. P, bl.11, sc. 2et., ap. 50, sector 1, Bucharest, Romania
RUSSIAKingspan LLC 99 Sales & MarketingRegistered Office: 192012 Prospekt Obukhovskoj Oborony, 120, Liter B, St. Petersburg, Russian Federation
SERBIAKingspan d.o.o. 100 Sales & MarketingRegistered Office: Bulevar AVNOJ-a 45/z lokal 33, 11070 Novi Beograd, Serbia
SINGAPOREKingspan Pte Limited 100 Sales & MarketingRegistered Office: 80 Raffles Place, #25-01, UOB Plaza, Singapore (048624)
SLOVAKIAKingspan s.r.o. 100 Sales & MarketingRegistered Office: Ceska 3, 831 03 Bratislava, Slovakia
SPAINKingspan Holdings Spain SL 100 Holding CompanyRegistered Office: C/Alfonso XII, 22-20 DCHA, 28014 Madrid, Spain
Kingspan Suelo Technicos 50 Sales & MarketingRegistered Office: C/Guindos, 2 San Sebastian Delosreyes, 28700 Madrid, Spain
TURKEYIzopoli Yapi Elemanlari Taahhüt San. Ve Tic. A.S 51 ManufacturingRegistered Office: Istanbul - Besiktas, Ortakoy, Ciragan Cad. No:97, Turkey
UKRAINEKingspan Lviv 100 Sales & MarketingRegistered Office: Krymska Street 11, Office 404, 79035 Lviv, Ukraine
UNITED STATES OF AMERICAASM Modular Systems Inc. 100 ManufacturingRegistered Office: c/o CT Corporation System, 111 Eight Avenue, New York, NY 10011, USA
Kingspan Holdings Panels US Inc. 100 Holding CompanyKingspan Holdings US Inc. 100 Holding CompanyMorin Corporation 100 ManufacturingKingspan Medusa Inc. 100 Holding CompanyKingspan Solar Inc. 100 Sales & MarketingRegistered Office: The Corporation Trust Center, 1209 Orange Street, Wilmington Delaware, 19801, USAKingspan Insulated Panels Inc. 100 ManufacturingRegistered Office: CT Corporation Systems, 1200 South Pine Island Road, Plantation, FL 33324, USATate Access Floors, Inc. 100 ManufacturingRegistered Office: 7510 Montevideo Road, Jessup, Maryland, 20794, USA
43. Approval of Financial StatementsThe financial statements were approved by the Directors on 1 March 2010.
.

98
Group Five Year Summary 2009
RESULTS (amounts in €mn) IFRS IFRS IFRS IFRS IFRS2009 2008 2007 2006 2005
Revenue 1,125.5 1,672.7 1,863.2 1,461.2 1,243.4
Operating profit 62.7 82.0 236.7 194.0 145.1
Net profit before tax 56.7 68.1 224.2 185.2 135.0
Operating cash flow 212.8 228.3 230.5 201.5 179.6
EQUITY (amounts in €mn) IFRS IFRS IFRS IFRS IFRS2009 2008 2007 2006 2005
Gross assets 1,130.5 1,239.0 1,324.9 1,160.4 969.5
Working capital 123.3 222.3 285.4 229.7 172.1
Ordinary shareholders equity 580.8 517.3 669.7 543.5 416.3
Bank debt and lease obligations (net) 159.4 299.6 225.0 187.6 163.5
RATIOS IFRS IFRS IFRS IFRS IFRS2009 2008 2007 2006 2005
Net debt as % of shareholders’ equity 27.4% 57.9% 33.6% 34.5% 39.2%
Current assets / current liabilities 1.32 1.53 1.55 1.52 1.64
PER ORDINARY SHARE (amounts in €cent) IFRS IFRS IFRS IFRS IFRS2009 2008 2007 2006 2005
Earnings 28.7 26.7 110.5 89.8 66.4
Operating cash flows 128.1 135.7 135.9 119.8 107.2
Net assets 352.5 308.4 396.8 325.2 248.6
Ordinary dividends - 8.0 25 19.0 13.4
AVERAGE NUMBER OF EMPLOYEES 5,049 6,692 6,512 5,090 4,436
Group Five Year Summary

99
Group Five Year Summary 2009
REVENUE€mn
NET PROFITBEFORE TAX€mn
EARNINGSPER SHARE€Cent
DIVIDENDSPER SHARE€Cent
2009
2008
2007
2006
2005
2009
2008
2007
2006
2005
2009
2008
2007
2006
2005
2009
2008
2007
2006
2005
nil
1,672.7
1,863.2
1,461.2
1,243.4
1,125.5
68.1
224.2
185.2
135.0
56.7
26.7
110.5
89.8
66.4
28.7
8.0
25.0
19.0
13.4

Kingspan Group plc
Dublin Road, Kingscourt, Co. Cavan, IrelandTelephone: +353 42 969 8000
Fax: +353 42 966 7501
Email: [email protected] www.kingspan.com