rising morbidity and mortality in midlife among white non-hispanic americans in the 21st century
DESCRIPTION
Rising morbidity and mortality in midlife among whitenon-Hispanic Americans in the 21st centuryTRANSCRIPT
Rising morbidity and mortality in midlife among whitenon-Hispanic Americans in the 21st centuryAnne Case1 and Angus Deaton1
Woodrow Wilson School of Public and International Affairs and Department of Economics, Princeton University, Princeton, NJ 08544
Contributed by Angus Deaton, September 17, 2015 (sent for review August 22, 2015; reviewed by David Cutler, Jon Skinner, and David Weir)
This paper documents a marked increase in the all-cause mortality ofmiddle-aged white non-Hispanic men and women in the United Statesbetween 1999 and 2013. This change reversed decades of progress inmortality and was unique to the United States; no other rich countrysaw a similar turnaround. The midlife mortality reversal was confinedto white non-Hispanics; black non-Hispanics and Hispanics at midlife,and those aged 65 and above in every racial and ethnic group, contin-ued to see mortality rates fall. This increase for whites was largelyaccounted for by increasing death rates from drug and alcohol poison-ings, suicide, and chronic liver diseases and cirrhosis. Although alleducation groups saw increases in mortality from suicide and poison-ings, and an overall increase in external causemortality, thosewith lesseducation saw the most marked increases. Rising midlife mortalityrates of white non-Hispanics were paralleled by increases in midlifemorbidity. Self-reported declines in health, mental health, and abilityto conduct activities of daily living, and increases in chronic pain andinability to work, as well as clinically measured deteriorations in liverfunction, all point to growing distress in this population. We commenton potential economic causes and consequences of this deterioration.
midlife mortality | morbidity | US white non-Hispanics
There has been a remarkable long-term decline in mortality ratesin the United States, a decline in which middle-aged and older
adults have fully participated (1‒3). Between 1970 and 2013, acombination of behavioral change, prevention, and treatment (4, 5)brought down mortality rates for those aged 45–54 by 44%. Parallelimprovements were seen in other rich countries (2). Improvementsin health also brought declines in morbidity, even among the in-creasingly long-lived elderly (6‒9).These reductions in mortality and morbidity have made lives
longer and better, and there is a general and well-based presumptionthat these improvements will continue. This paper raises questionsabout that presumption for white Americans in midlife, even asmortality and morbidity continue to fall among the elderly.This paper documents a marked deterioration in the morbidity
and mortality of middle-aged white non-Hispanics in the UnitedStates after 1998. General deterioration in midlife morbidity amongwhites has received limited comment (10, 11), but the increase in all-cause midlife mortality that we describe has not been previouslyhighlighted. For example, it does not appear in the regular mortalityand health reports issued by the CDC (12), perhaps because itsdocumentation requires disaggregation by age and race. Beyond that,the extent to which the episode is unusual requires historical context,as well as comparison with other rich countries over the same period.Increasing mortality in middle-aged whites was matched by in-
creasing morbidity. When seen side by side with the mortalityincrease, declines in self-reported health and mental health, in-creased reports of pain, and greater difficulties with daily livingshow increasing distress among whites in midlife after the late1990s. We comment on potential economic causes and conse-quences of this deterioration.
Midlife MortalityFig. 1 shows age 45–54 mortality rates for US white non-Hispanics(USW, in red), US Hispanics (USH, in blue), and six rich in-dustrialized comparison countries: France (FRA), Germany (GER),
the United Kingdom (UK), Canada (CAN), Australia (AUS), andSweden (SWE). The comparison is similar for other Organisationfor Economic Co-operation and Development countries.Fig. 1 shows a cessation and reversal of the decline in midlife
mortality for US white non-Hispanics after 1998. From 1978 to 1998,the mortality rate for US whites aged 45–54 fell by 2% per year onaverage, which matched the average rate of decline in the six coun-tries shown, and the average over all other industrialized countries.After 1998, other rich countries’ mortality rates continued to declineby 2% a year. In contrast, US white non-Hispanic mortality rose byhalf a percent a year. No other rich country saw a similar turnaround.The mortality reversal was confined to white non-Hispanics; HispanicAmericans had mortality declines indistinguishable from the British(1.8% per year), and black non-Hispanic mortality for ages 45–54declined by 2.6% per year over the period.For deaths before 1989, information on Hispanic origin is not
available, but we can calculate lives lost among all whites. For thoseaged 45–54, if the white mortality rate had held at its 1998 value,96,000 deaths would have been avoided from 1999 to 2013, 7,000in 2013 alone. If it had continued to fall at its previous (1979‒1998)rate of decline of 1.8% per year, 488,500 deaths would have beenavoided in the period 1999‒2013, 54,000 in 2013. (Supporting In-formation provides details on calculations.)This turnaround, as of 2014, is specific to midlife. All-cause
mortality rates for white non-Hispanics aged 65–74 continued tofall at 2% per year from 1999 to 2013; there were similar declinesin all other racial and ethnic groups aged 65–74. However, themortality decline for white non-Hispanics aged 55–59 also slowed,declining only 0.5% per year over this period.
Significance
Midlife increases in suicides and drug poisonings have been pre-viously noted. However, that these upward trends were persis-tent and large enough to drive up all-cause midlife mortality has,to our knowledge, been overlooked. If the white mortality ratefor ages 45−54 had held at their 1998 value, 96,000 deaths wouldhave been avoided from 1999–2013, 7,000 in 2013 alone. If it hadcontinued to decline at its previous (1979‒1998) rate, half a milliondeaths would have been avoided in the period 1999‒2013, com-parable to lives lost in the US AIDS epidemic through mid-2015.Concurrent declines in self-reported health, mental health, andability to work, increased reports of pain, and deteriorating mea-sures of liver function all point to increasing midlife distress.
Author contributions: A.C. and A.D. designed research, performed research, analyzeddata, and wrote the paper.
Reviewers: D.C., Harvard University; J.S., Dartmouth College; and D.W., Institute forSocial Research.
The authors declare no conflict of interest.
Freely available online through the PNAS open access option.
See Commentary on page 15006.1To whom correspondence may be addressed. Email: [email protected] or [email protected].
This article contains supporting information online at www.pnas.org/lookup/suppl/doi:10.1073/pnas.1518393112/-/DCSupplemental.
15078–15083 | PNAS | December 8, 2015 | vol. 112 | no. 49 www.pnas.org/cgi/doi/10.1073/pnas.1518393112

There was a pause in midlife mortality decline in the 1960s,largely explicable by historical patterns of smoking (13). Otherwise,the post-1999 episode in midlife mortality in the United States is bothhistorically and geographically unique, at least since 1950. The turn-around is not a simple cohort effect; Americans born between 1945and 1965 did not have particularly high mortality rates before midlife.Fig. 2 presents the three causes of death that account for the
mortality reversal among white non-Hispanics, namely suicide, drugand alcohol poisoning (accidental and intent undetermined), andchronic liver diseases and cirrhosis. All three increased year-on-yearafter 1998. Midlife increases in suicides and drug poisonings havebeen previously noted (14–16). However, that these upward trendswere persistent and large enough to drive up all-cause midlife mor-tality has, to our knowledge, been overlooked. For context, Fig. 2 alsopresents mortality from lung cancer and diabetes. The obesity epi-demic has (rightly) made diabetes a major concern for midlifeAmericans; yet, in recent history, death from diabetes has not beenan increasing threat. Poisonings overtook lung cancer as a cause ofdeath in 2011 in this age group; suicide appears poised to do so.Table 1 shows changes in mortality rates from 1999 to 2013 for
white non-Hispanic men and women ages 45–54 and, for com-parison, changes for black non-Hispanics and for Hispanics. Thetable also presents changes in mortality rates for white non-His-panics by three broad education groups: those with a high schooldegree or less (37% of this subpopulation over this period), thosewith some college, but no bachelor’s (BA) degree (31%), and thosewith a BA or more (32%). The fraction of 45- to 54-y-olds in thethree education groups was stable over this period. Each cell showsthe change in the mortality rate from 1999 to 2013, as well as itslevel (deaths per 100,000) in 2013.Over the 15-y period, midlife all-cause mortality fell by more
than 200 per 100,000 for black non-Hispanics, and by more than60 per 100,000 for Hispanics. By contrast, white non-Hispanicmortality rose by 34 per 100,000. The ratio of black non-Hispanicto white non-Hispanic mortality rates for ages 45–54 fell from
2.09 in 1999 to 1.40 in 2013. CDC reports have highlighted thenarrowing of the black−white gap in life expectancy (12). How-ever, for ages 45–54, the narrowing of the mortality rate ratio inthis period was largely driven by increased white mortality; ifwhite non-Hispanic mortality had continued to decline at 1.8%per year, the ratio in 2013 would have been 1.97. The role playedby changing white mortality rates in the narrowing of the black−white life expectancy gap (2003−2008) has been previouslynoted (17). It is far from clear that progress in black longevityshould be benchmarked against US whites.The change in all-cause mortality for white non-Hispanics 45–54 is
largely accounted for by an increasing death rate from externalcauses, mostly increases in drug and alcohol poisonings and in sui-cide. (Patterns are similar for men and women when analyzed sep-arately.) In contrast to earlier years, drug overdoses were notconcentrated among minorities. In 1999, poisoning mortality for ages45–54 was 10.2 per 100,000 higher for black non-Hispanics thanwhite non-Hispanics; by 2013, poisoning mortality was 8.4 per100,000 higher for whites. Death from cirrhosis and chronic liverdiseases fell for blacks and rose for whites. After 2006, death ratesfrom alcohol- and drug-induced causes for white non-Hispanicsexceeded those for black non-Hispanics; in 2013, rates for white non-Hispanic exceeded those for black non-Hispanics by 19 per 100,000.The three numbered rows of Table 1 show that the turnaround
in mortality for white non-Hispanics was driven primarily by in-creasing death rates for those with a high school degree or less.All-cause mortality for this group increased by 134 per 100,000between 1999 and 2013. Those with college education less than aBA saw little change in all-cause mortality over this period; thosewith a BA or more education saw death rates fall by 57 per100,000. Although all three educational groups saw increases inmortality from suicide and poisonings, and an overall increase inexternal cause mortality, increases were largest for those with theleast education. The mortality rate from poisonings rose morethan fourfold for this group, from 13.7 to 58.0, and mortality fromchronic liver diseases and cirrhosis rose by 50%. The final tworows of the table show increasing educational gradients from 1999
USW
FRA
GER
USH
UK
CAN
AUS
SWE
200
250
300
350
400
450
deat
hs p
er 1
00,0
00
1990 2000 2010
year
Fig. 1. All-cause mortality, ages 45–54 for US White non-Hispanics (USW),US Hispanics (USH), and six comparison countries: France (FRA), Germany(GER), the United Kingdom (UK), Canada (CAN), Australia (AUS), and Swe-den (SWE).
poisonings
lung cancer
suicides
chronic liver diseases
diabetes
1015
2025
30de
aths
per
100
,000
2000 2005 2010 2015year
Fig. 2. Mortality by cause, white non-Hispanics ages 45–54.
Case and Deaton PNAS | December 8, 2015 | vol. 112 | no. 49 | 15079
SOCIALSC
IENCE
SSE
ECO
MMEN
TARY
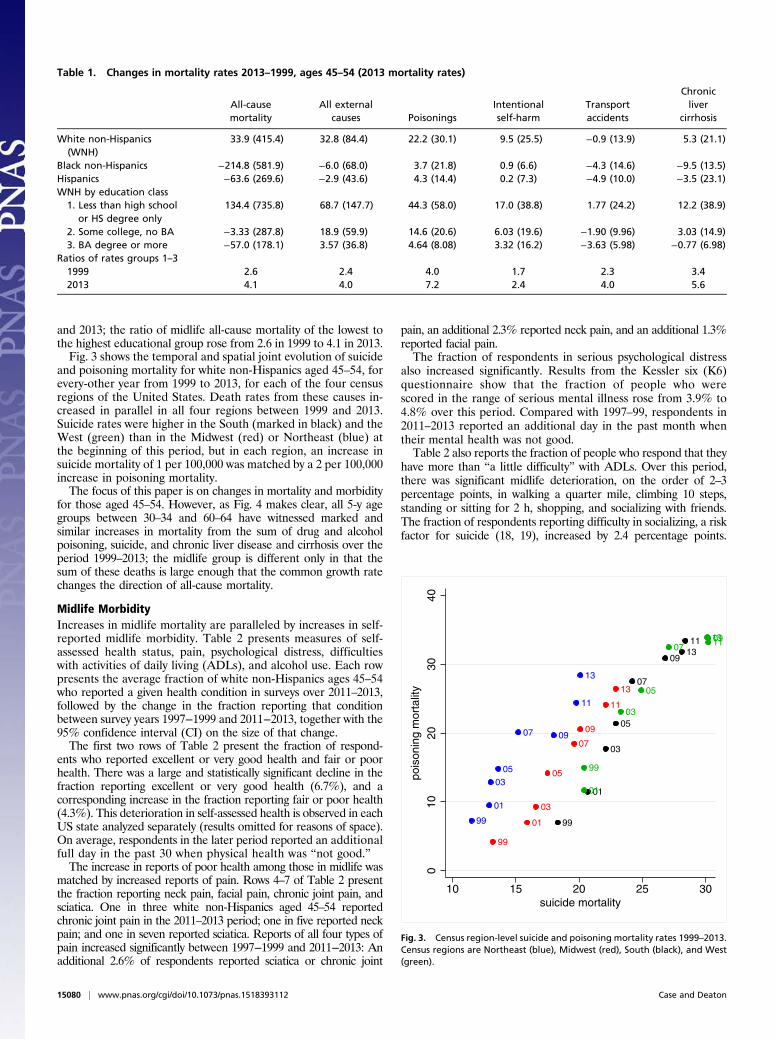
and 2013; the ratio of midlife all-cause mortality of the lowest tothe highest educational group rose from 2.6 in 1999 to 4.1 in 2013.Fig. 3 shows the temporal and spatial joint evolution of suicide
and poisoning mortality for white non-Hispanics aged 45–54, forevery-other year from 1999 to 2013, for each of the four censusregions of the United States. Death rates from these causes in-creased in parallel in all four regions between 1999 and 2013.Suicide rates were higher in the South (marked in black) and theWest (green) than in the Midwest (red) or Northeast (blue) atthe beginning of this period, but in each region, an increase insuicide mortality of 1 per 100,000 was matched by a 2 per 100,000increase in poisoning mortality.The focus of this paper is on changes in mortality and morbidity
for those aged 45–54. However, as Fig. 4 makes clear, all 5-y agegroups between 30–34 and 60–64 have witnessed marked andsimilar increases in mortality from the sum of drug and alcoholpoisoning, suicide, and chronic liver disease and cirrhosis over theperiod 1999–2013; the midlife group is different only in that thesum of these deaths is large enough that the common growth ratechanges the direction of all-cause mortality.
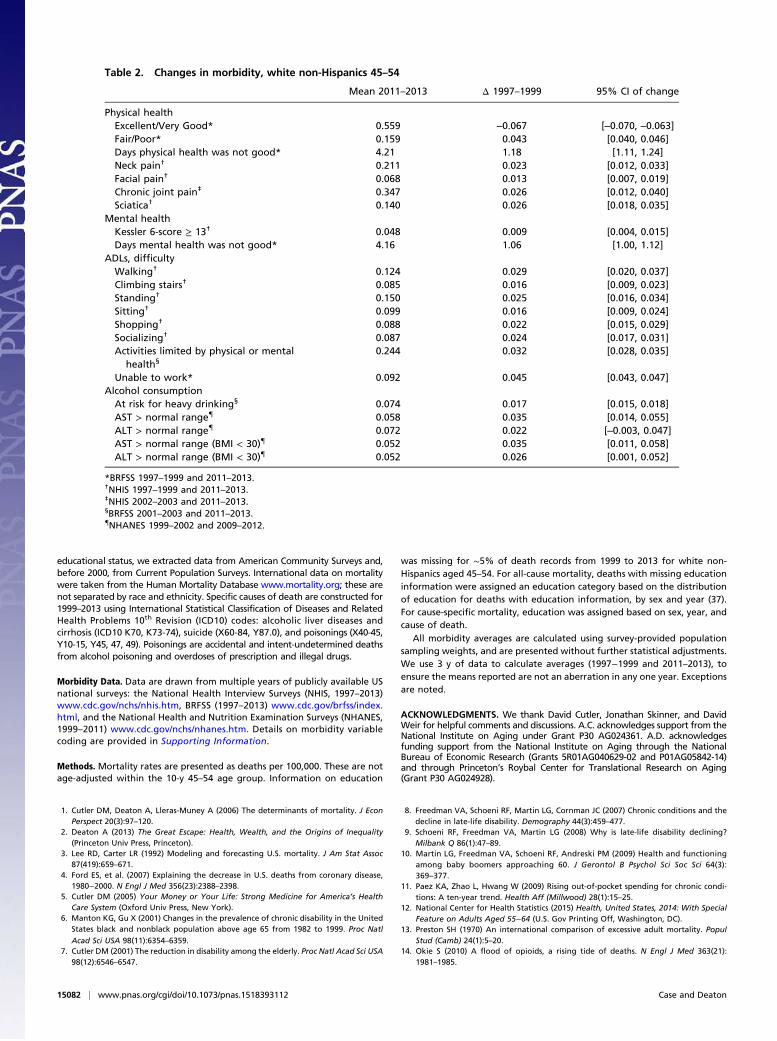
Midlife MorbidityIncreases in midlife mortality are paralleled by increases in self-reported midlife morbidity. Table 2 presents measures of self-assessed health status, pain, psychological distress, difficultieswith activities of daily living (ADLs), and alcohol use. Each rowpresents the average fraction of white non-Hispanics ages 45–54who reported a given health condition in surveys over 2011–2013,followed by the change in the fraction reporting that conditionbetween survey years 1997−1999 and 2011−2013, together with the95% confidence interval (CI) on the size of that change.The first two rows of Table 2 present the fraction of respond-
ents who reported excellent or very good health and fair or poorhealth. There was a large and statistically significant decline in thefraction reporting excellent or very good health (6.7%), and acorresponding increase in the fraction reporting fair or poor health(4.3%). This deterioration in self-assessed health is observed in eachUS state analyzed separately (results omitted for reasons of space).On average, respondents in the later period reported an additionalfull day in the past 30 when physical health was “not good.”The increase in reports of poor health among those in midlife was
matched by increased reports of pain. Rows 4–7 of Table 2 presentthe fraction reporting neck pain, facial pain, chronic joint pain, andsciatica. One in three white non-Hispanics aged 45–54 reportedchronic joint pain in the 2011–2013 period; one in five reported neckpain; and one in seven reported sciatica. Reports of all four types ofpain increased significantly between 1997−1999 and 2011−2013: Anadditional 2.6% of respondents reported sciatica or chronic joint
pain, an additional 2.3% reported neck pain, and an additional 1.3%reported facial pain.The fraction of respondents in serious psychological distress
also increased significantly. Results from the Kessler six (K6)questionnaire show that the fraction of people who werescored in the range of serious mental illness rose from 3.9% to4.8% over this period. Compared with 1997–99, respondents in2011–2013 reported an additional day in the past month whentheir mental health was not good.Table 2 also reports the fraction of people who respond that they
have more than “a little difficulty” with ADLs. Over this period,there was significant midlife deterioration, on the order of 2–3percentage points, in walking a quarter mile, climbing 10 steps,standing or sitting for 2 h, shopping, and socializing with friends.The fraction of respondents reporting difficulty in socializing, a riskfactor for suicide (18, 19), increased by 2.4 percentage points.
Table 1. Changes in mortality rates 2013–1999, ages 45–54 (2013 mortality rates)
All-causemortality
All externalcauses Poisonings
Intentionalself-harm
Transportaccidents
Chronicliver
cirrhosis
White non-Hispanics(WNH)
33.9 (415.4) 32.8 (84.4) 22.2 (30.1) 9.5 (25.5) −0.9 (13.9) 5.3 (21.1)
Black non-Hispanics −214.8 (581.9) −6.0 (68.0) 3.7 (21.8) 0.9 (6.6) −4.3 (14.6) −9.5 (13.5)Hispanics −63.6 (269.6) −2.9 (43.6) 4.3 (14.4) 0.2 (7.3) −4.9 (10.0) −3.5 (23.1)WNH by education class
1. Less than high schoolor HS degree only
134.4 (735.8) 68.7 (147.7) 44.3 (58.0) 17.0 (38.8) 1.77 (24.2) 12.2 (38.9)
2. Some college, no BA −3.33 (287.8) 18.9 (59.9) 14.6 (20.6) 6.03 (19.6) −1.90 (9.96) 3.03 (14.9)3. BA degree or more −57.0 (178.1) 3.57 (36.8) 4.64 (8.08) 3.32 (16.2) −3.63 (5.98) −0.77 (6.98)
Ratios of rates groups 1–31999 2.6 2.4 4.0 1.7 2.3 3.42013 4.1 4.0 7.2 2.4 4.0 5.6
99
01
0305
07 09
11
13
99
01
03
05
07
09
11
13
99
01
03
05
07
09
1113
99
01
03
05
07091113
010
2030
40po
ison
ing
mor
talit
y
10 15 20 25 30suicide mortality
Fig. 3. Census region-level suicide and poisoning mortality rates 1999–2013.Census regions are Northeast (blue), Midwest (red), South (black), and West(green).
15080 | www.pnas.org/cgi/doi/10.1073/pnas.1518393112 Case and Deaton

Respondents reporting that their activities are limited by physicalor mental health increased by 3.2 percentage points. The fractionreporting being unable to work doubled for white non-Hispanicsaged 45–54 in this 15-y period.Increasing obesity played only a part in this deterioration of
midlife self-assessed health, mental health, reported pain, and dif-ficulties with ADLs. Respondents with body mass indices above 30reported greater morbidity along all of these dimensions. However,deterioration in midlife morbidity occurred for both obese andnonobese respondents, and increased prevalence of obesity ac-counts for only a small fraction of the overall deterioration.Risk for heavy drinking—more than one (two) drinks daily for
women (men)—also increased significantly. Blood tests showincreases in the fraction of participants with elevated levels ofaspartate aminotransferase (AST) and alanine aminotransferase(ALT) enzymes, indicators for potential inflammation of, or dam-age to, the liver. Nonalcoholic fatty liver disease can also elevateAST and ALT enzymes; for this reason, we show the fractions withelevated enzymes among all respondents, and separately for non-obese respondents (those with body mass index < 30).As was true in comparisons of mortality rate changes, where
midlife groups fared worse than the elderly, most of thesemorbidity indicators either held constant or improved amongolder populations over this period. With the exception of neckpain and facial pain, and enzyme test results (for which censusregion markers are not available), the temporal evolution of eachmorbidity marker presented in Table 2 is significantly associatedwith the temporal evolution of suicide and poisonings withincensus region. (Supporting Information provides details.)
DiscussionThe increase in midlife morbidity and mortality among US whitenon-Hispanics is only partly understood. The increased availabilityof opioid prescriptions for pain that began in the late 1990s hasbeen widely noted, as has the associated mortality (14, 20‒22).The CDC estimates that for each prescription painkiller death in2008, there were 10 treatment admissions for abuse, 32 emergency
department visits for misuse or abuse, 130 people who wereabusers or dependent, and 825 nonmedical users (23). Tightercontrols on opioid prescription brought some substitution intoheroin and, in this period, the US saw falling prices and risingquality of heroin, as well as availability in areas where heroin hadbeen previously largely unknown (14, 24, 25).The epidemic of pain which the opioids were designed to treat
is real enough, although the data here cannot establish whetherthe increase in opioid use or the increase in pain came first. Bothincreased rapidly after the mid-1990s. Pain prevalence mighthave been even higher without the drugs, although long-termopioid use may exacerbate pain for some (26), and consensus onthe effectiveness and risks of long-term opioid use has beenhampered by lack of research evidence (27). Pain is also a riskfactor for suicide (28). Increased alcohol abuse and suicides arelikely symptoms of the same underlying epidemic (18, 19, 29),and have increased alongside it, both temporally and spatially.Although the epidemic of pain, suicide, and drug overdoses
preceded the financial crisis, ties to economic insecurity are possi-ble. After the productivity slowdown in the early 1970s, and withwidening income inequality, many of the baby-boom generation arethe first to find, in midlife, that they will not be better off than weretheir parents. Growth in real median earnings has been slow for thisgroup, especially those with only a high school education. However,the productivity slowdown is common to many rich countries, someof which have seen even slower growth in median earnings than theUnited States, yet none have had the same mortality experience(lanekenworthy.net/shared-prosperity and ref. 30). The United Stateshas moved primarily to defined-contribution pension plans withassociated stock market risk, whereas, in Europe, defined-benefitpensions are still the norm. Future financial insecurity may weighmore heavily on US workers, if they perceive stock market riskharder to manage than earnings risk, or if they have contributedinadequately to defined-contribution plans (31).Our findings may also help us understand recent large increases in
Americans on disability. The growth in Social Security DisabilityInsurance in this age group (32) is not quite the near-doublingshown in Table 2 for the Behavioral Risk Factor Surveillance System(BRFSS) measure of work limitation, but the scale is similar in levelsand trends. This has been interpreted as a response to the generosityof payments (33), but careful work based on Social Security recordsshows that most of the increase can be attributed to compositionaleffects, with the remainder falling in the category of (hard to as-certain) increases in musculoskeletal and mental health disabilities(34); our morbidity results suggest that disability from these causeshas indeed increased. Increased morbidity may also explain some ofthe recent otherwise puzzling decrease in labor force participation inthe United States, particularly among women (35).The mortality reversal observed in this period bears a resemblance
to the mortality decline slowdown in the United States during theheight of the AIDS epidemic, which took the lives of 650,000Americans (1981 to mid-2015). A combination of behavioral changeand drug therapy brought the US AIDS epidemic under control;age-adjusted deaths per 100,000 fell from 10.2 in 1990 to 2.1 in 2013(12). However, public awareness of the enormity of the AIDS crisiswas far greater than for the epidemic described here.A serious concern is that those currently in midlife will age
into Medicare in worse health than the currently elderly. This isnot automatic; if the epidemic is brought under control, its sur-vivors may have a healthy old age. However, addictions are hardto treat and pain is hard to control, so those currently in midlifemay be a “lost generation” (36) whose future is less bright thanthose who preceded them.
Materials and MethodsMortality Data. We assembled data on all-cause and cause-specific mortalityfrom the CDC Wonder Compressed and Detailed Mortality files as well as fromindividual death records from 1989 to 2013. For population by ethnicity and
30−34
35−39
40−44
60−64
45−49
55−59
50−5420
4060
80po
ison
ing,
sui
cide
, and
live
r m
orta
lity
2000 2005 2010 2015year
Fig. 4. Mortality by poisoning, suicide, chronic liver disease, and cirrhosis,white non-Hispanics by 5-y age group.
Case and Deaton PNAS | December 8, 2015 | vol. 112 | no. 49 | 15081
SOCIALSC
IENCE
SSE
ECO
MMEN
TARY
educational status, we extracted data from American Community Surveys and,before 2000, from Current Population Surveys. International data on mortalitywere taken from the Human Mortality Database www.mortality.org; these arenot separated by race and ethnicity. Specific causes of death are constructed for1999–2013 using International Statistical Classification of Diseases and RelatedHealth Problems 10th Revision (ICD10) codes: alcoholic liver diseases andcirrhosis (ICD10 K70, K73-74), suicide (X60-84, Y87.0), and poisonings (X40-45,Y10-15, Y45, 47, 49). Poisonings are accidental and intent-undetermined deathsfrom alcohol poisoning and overdoses of prescription and illegal drugs.
Morbidity Data. Data are drawn from multiple years of publicly available USnational surveys: the National Health Interview Surveys (NHIS, 1997–2013)www.cdc.gov/nchs/nhis.htm, BRFSS (1997–2013) www.cdc.gov/brfss/index.html, and the National Health and Nutrition Examination Surveys (NHANES,1999–2011) www.cdc.gov/nchs/nhanes.htm. Details on morbidity variablecoding are provided in Supporting Information.
Methods. Mortality rates are presented as deaths per 100,000. These are notage-adjusted within the 10-y 45–54 age group. Information on education
was missing for ∼5% of death records from 1999 to 2013 for white non-Hispanics aged 45–54. For all-cause mortality, deaths with missing educationinformation were assigned an education category based on the distributionof education for deaths with education information, by sex and year (37).For cause-specific mortality, education was assigned based on sex, year, andcause of death.
All morbidity averages are calculated using survey-provided populationsampling weights, and are presented without further statistical adjustments.We use 3 y of data to calculate averages (1997−1999 and 2011–2013), toensure the means reported are not an aberration in any one year. Exceptionsare noted.
ACKNOWLEDGMENTS. We thank David Cutler, Jonathan Skinner, and DavidWeir for helpful comments and discussions. A.C. acknowledges support from theNational Institute on Aging under Grant P30 AG024361. A.D. acknowledgesfunding support from the National Institute on Aging through the NationalBureau of Economic Research (Grants 5R01AG040629-02 and P01AG05842-14)and through Princeton’s Roybal Center for Translational Research on Aging(Grant P30 AG024928).
1. Cutler DM, Deaton A, Lleras-Muney A (2006) The determinants of mortality. J EconPerspect 20(3):97–120.
2. Deaton A (2013) The Great Escape: Health, Wealth, and the Origins of Inequality(Princeton Univ Press, Princeton).
3. Lee RD, Carter LR (1992) Modeling and forecasting U.S. mortality. J Am Stat Assoc87(419):659–671.
4. Ford ES, et al. (2007) Explaining the decrease in U.S. deaths from coronary disease,1980−2000. N Engl J Med 356(23):2388–2398.
5. Cutler DM (2005) Your Money or Your Life: Strong Medicine for America’s HealthCare System (Oxford Univ Press, New York).
6. Manton KG, Gu X (2001) Changes in the prevalence of chronic disability in the UnitedStates black and nonblack population above age 65 from 1982 to 1999. Proc Natl
Acad Sci USA 98(11):6354–6359.7. Cutler DM (2001) The reduction in disability among the elderly. Proc Natl Acad Sci USA
98(12):6546–6547.
8. Freedman VA, Schoeni RF, Martin LG, Cornman JC (2007) Chronic conditions and thedecline in late-life disability. Demography 44(3):459–477.
9. Schoeni RF, Freedman VA, Martin LG (2008) Why is late-life disability declining?Milbank Q 86(1):47–89.
10. Martin LG, Freedman VA, Schoeni RF, Andreski PM (2009) Health and functioningamong baby boomers approaching 60. J Gerontol B Psychol Sci Soc Sci 64(3):369–377.
11. Paez KA, Zhao L, Hwang W (2009) Rising out-of-pocket spending for chronic condi-tions: A ten-year trend. Health Aff (Millwood) 28(1):15–25.
12. National Center for Health Statistics (2015) Health, United States, 2014: With SpecialFeature on Adults Aged 55−64 (U.S. Gov Printing Off, Washington, DC).
13. Preston SH (1970) An international comparison of excessive adult mortality. PopulStud (Camb) 24(1):5–20.
14. Okie S (2010) A flood of opioids, a rising tide of deaths. N Engl J Med 363(21):1981–1985.
Table 2. Changes in morbidity, white non-Hispanics 45–54
Mean 2011–2013 Δ 1997–1999 95% CI of change
Physical healthExcellent/Very Good* 0.559 ‒0.067 [‒0.070, ‒0.063]Fair/Poor* 0.159 0.043 [0.040, 0.046]Days physical health was not good* 4.21 1.18 [1.11, 1.24]Neck pain† 0.211 0.023 [0.012, 0.033]Facial pain† 0.068 0.013 [0.007, 0.019]Chronic joint pain‡ 0.347 0.026 [0.012, 0.040]Sciatica† 0.140 0.026 [0.018, 0.035]
Mental healthKessler 6-score ≥ 13† 0.048 0.009 [0.004, 0.015]Days mental health was not good* 4.16 1.06 [1.00, 1.12]
ADLs, difficultyWalking† 0.124 0.029 [0.020, 0.037]Climbing stairs† 0.085 0.016 [0.009, 0.023]Standing† 0.150 0.025 [0.016, 0.034]Sitting† 0.099 0.016 [0.009, 0.024]Shopping† 0.088 0.022 [0.015, 0.029]Socializing† 0.087 0.024 [0.017, 0.031]Activities limited by physical or mental
health§0.244 0.032 [0.028, 0.035]
Unable to work* 0.092 0.045 [0.043, 0.047]Alcohol consumption
At risk for heavy drinking§ 0.074 0.017 [0.015, 0.018]AST > normal range{ 0.058 0.035 [0.014, 0.055]ALT > normal range{ 0.072 0.022 [‒0.003, 0.047]AST > normal range (BMI < 30){ 0.052 0.035 [0.011, 0.058]ALT > normal range (BMI < 30){ 0.052 0.026 [0.001, 0.052]
*BRFSS 1997–1999 and 2011–2013.†NHIS 1997–1999 and 2011–2013.‡NHIS 2002–2003 and 2011–2013.§BRFSS 2001–2003 and 2011–2013.{NHANES 1999–2002 and 2009–2012.
15082 | www.pnas.org/cgi/doi/10.1073/pnas.1518393112 Case and Deaton

15. Phillips JA (2014) A changing epidemiology of suicide? The influence of birth cohortson suicide rates in the United States. Soc Sci Med 114(Aug):151–160.
16. Phillips JA, Robin AV, Nugent CN, Idler EL (2010) Understanding recent changes insuicide rates among the middle-aged: Period or cohort effects? Public Health Rep125(5):680–688.
17. Harper S, Rushani D, Kaufman JS (2012) Trends in the black-white life expectancy gap,2003−2008. JAMA 307(21):2257–2259.
18. Institute of Medicine, Board on Neuroscience and Behavioral Health (2001) RiskFactors for Suicide: Summary of a Workshop, ed Goldsmith SK (Natl Acad Press,Washington, DC).
19. Institute of Medicine (2001) Reducing Suicide: A National Imperative, eds Goldsmith SK,Pellmar TC, Kleinman AM, Bunney WE (Natl Acad Press, Washington, DC).
20. Centers for Disease Control and Prevention (CDC) (2013) Vital signs: Overdoses ofprescription opioid pain relievers and other drugs among women—United States,1999−2010. MMWR Morb Mortal Wkly Rep 62(26):537–542.
21. Volkow ND, Frieden TR, Hyde PS, Cha SS (2014) Medication-assisted therapies—Tackling the opioid-overdose epidemic. N Engl J Med 370(22):2063–2066.
22. Beauchamp GA, Winstanley EL, Ryan SA, Lyons MS (2014) Moving beyond misuse anddiversion: The urgent need to consider the role of iatrogenic addiction in the currentopioid epidemic. Am J Public Health 104(11):2023–2029.
23. Centers for Disease Control (2011) Policy Impact, Prescription Painkiller Overdoses(Centers Dis Control, Atlanta).
24. Quinones S (2015) Dreamland: the True Tale of America’s Opiate Epidemic (Blooms-bury Press, New York).
25. Cicero TJ, Ellis MS, Surratt HL, Kurtz SP (2014) The changing face of heroin use in theUnited States: A retrospective analysis of the past 50 years. JAMA Psychiatry 71(7):821–826.
26. Ballantyne JC, Mao J (2003) Opioid therapy for chronic pain. N Engl J Med 349(20):1943–1953.
27. Chou R, et al. (2015) The effectiveness and risks of long-term opioid therapy forchronic pain: A systematic review for a National Institutes of Health Pathways toPrevention Workshop. Ann Intern Med 162(4):276–286.
28. Cheatle MD (2011) Depression, chronic pain, and suicide by overdose: On the edge.Pain Med 12(Suppl 2):S43–S48.
29. Phillips JA, Nugent CN (2013) Antidepressant use and method of suicide in the UnitedStates: Variation by age and sex, 1998−2007. Arch Suicide Res 17(4):360–372.
30. Organization for Economic Cooperation and Development (2008) Growing Unequal?Income Distribution and Poverty in OECD Countries (Org Econ Coop Dev, Paris).
31. Samwick AA, Skinner J (2004) How will 401(k) pension plans affect retirement in-come? Am Econ Rev 94(1):329–343.
32. Social Security Administration (2015) Research, statistics, and policy analysis. Availableat www.ssa.gov/policy/docs/statcomps/. Accessed September 13, 2015.
33. Autor DH, Duggan MG (2006) The growth in the Social Security Disability rolls: A fiscalcrisis unfolding. J Econ Perspect 20(3):71–96.
34. Liebman JB (2015) Understanding the increase in disability insurance benefit receiptin the United States. J Econ Perspect 29(2):123–150.
35. Braun S, Coglianese J, Furman J, Stevenson B, Stock J (2015) Understanding the de-cline in the labor force participation rate in the United States. Available at www.voxeu.org/article/decline-labour-force-participation-us. Accessed June 21, 2015.
36. Meier B (April 9, 2012) Tightening the lid on pain prescriptions. NY Times, Section A, p 1.37. Rostron BL, Boies JL, Arias E (2010) Education Reporting and Classification on Death
Certificates in the United States. Vital and Health Statistics (Natl Cent Health Stat.Atlanta) Ser 151, Vol 2.
38. Kessler RC, et al. (2003) Screening for serious mental illness in the general population.Arch Gen Psychiatry 60(2):184–189.
39. Mayo Medical Clinic (2015) Test ID: AST. Available at www.mayomedicallaboratories.com/test-catalog/Clinical+and+Interpretive/8360, www.mayomedicallaboratories.com/test-catalog/Clinical+and+Interpretive/8362. Accessed August 17, 2015.
Case and Deaton PNAS | December 8, 2015 | vol. 112 | no. 49 | 15083
SOCIALSC
IENCE
SSE
ECO
MMEN
TARY