risenga maluleke statistician-general statisticssouth africa
TRANSCRIPT

A Poverty Mapping Overview of the Poorest
Provinces, Metros, Districts and Localities
in South Africa
Statistics South Africa
Risenga MalulekeStatistician-General
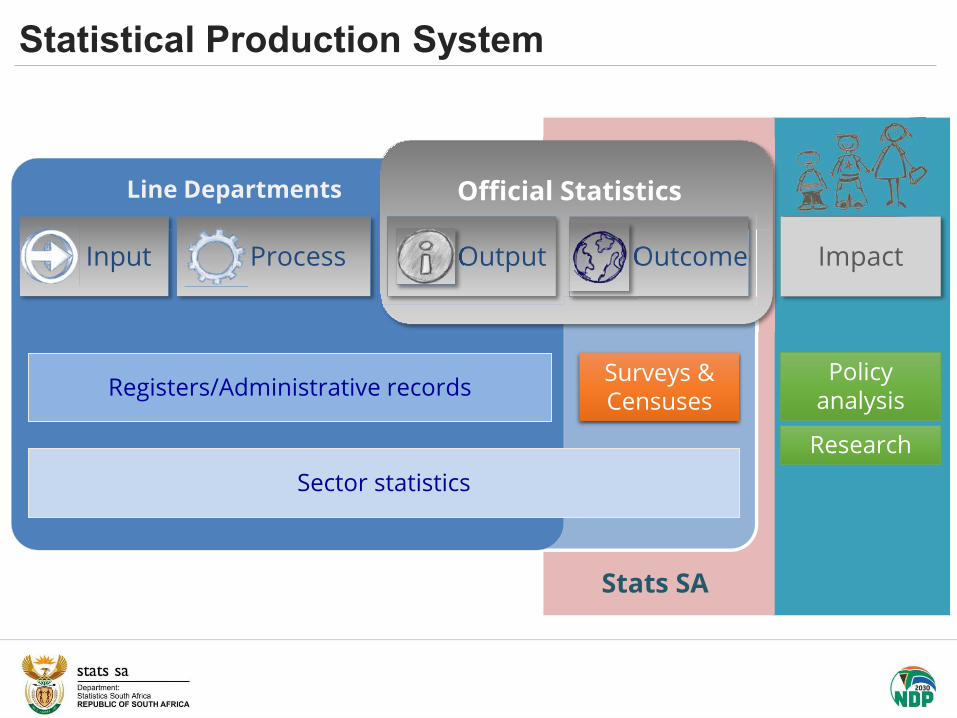
Surveys & Censuses
Sector statistics
Registers/Administrative records
Line Departments
Stats SA
Official Statistics
Policy analysis
Research
Input Process Output OutcomeOutput ImpactOutcome
Statistical Production System
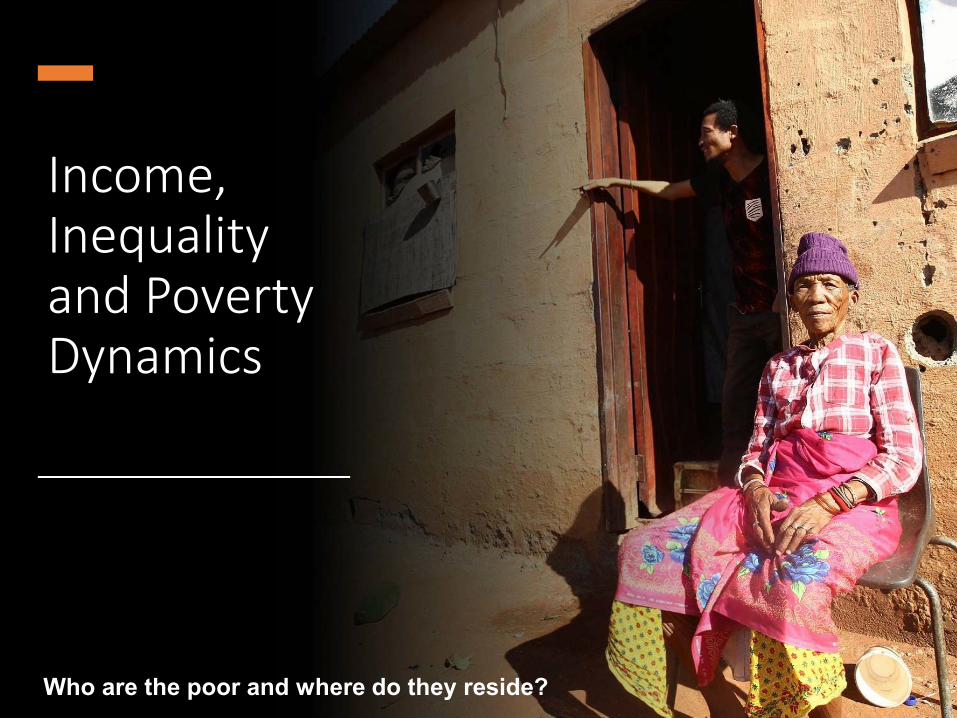
Income, Inequality and Poverty Dynamics
Who are the poor and where do they reside?

Stats SA applies and measures various definitions of poverty
Subjective poverty (self-perceived)
Money-metric (lack of income/expenditure)
Multidimensional poverty (lack of basic services, education, etc.)
Inequality (Gini coefficient, share of expenditure, etc.)

Threshold of absolute deprivation. The amount of money required to purchase the minimum required daily energy intake
Food Poverty Line
R585
Austere threshold below which one has to choose between food and important non-food items
Lower-Bound Poverty Line
R840
Upper-Bound Poverty Line
R1268Threshold of relative deprivation below which people cannot afford the minimum desired lifestyle by most South Africans
Source: National Poverty Lines
National Poverty Lines based on April 2020 prices

R219
Food Poverty Line ; R585
R370
Lower-bound Poverty Line (LBPL); R840
R575
Upper-bound Poverty Line (UBPL); R1 268
R0
R200
R400
R600
R800
R1 000
R1 200
R1 400
2006 2007 2008 2009 2010 2011 2012 2013 2014 2015 2016 2017 2018 2019 2020Source: National Poverty Lines
National Poverty Line Series from 2006 to 2020
Upper-Bound Poverty Line Lower-Bound Poverty Line
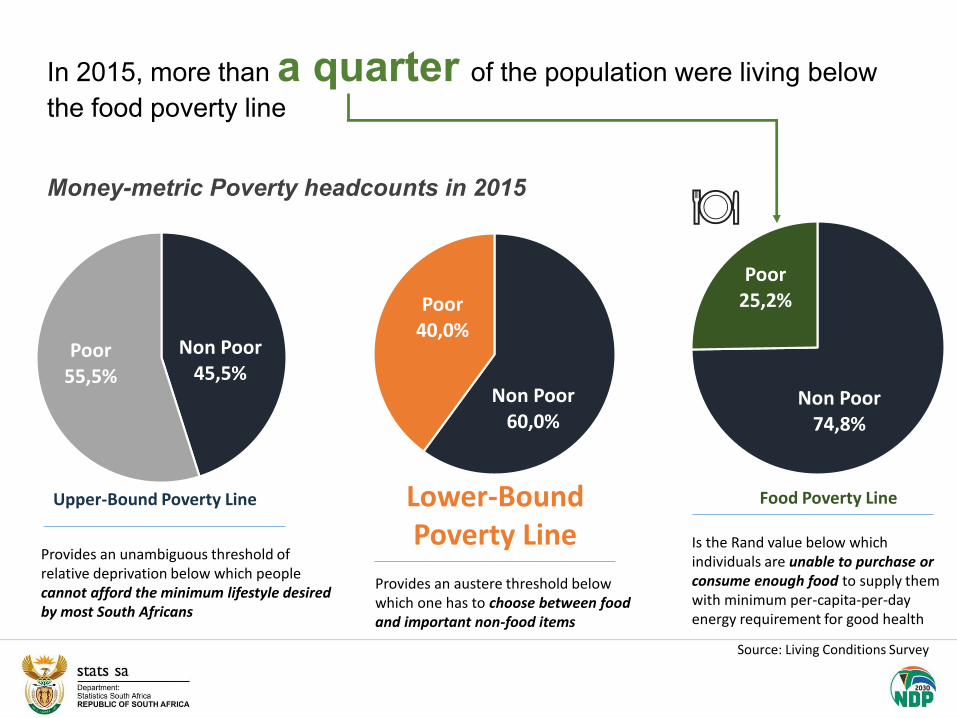
Non Poor45,5%
Poor55,5%
Non Poor60,0%
Poor40,0%
Non Poor74,8%
Poor25,2%
Food Poverty Line
In 2015, more than a quarter of the population were living below the food poverty line
Source: Living Conditions Survey
Is the Rand value below which individuals are unable to purchase or consume enough food to supply them with minimum per-capita-per-day energy requirement for good health
Provides an austere threshold below which one has to choose between food and important non-food items
Provides an unambiguous threshold of relative deprivation below which people cannot afford the minimum lifestyle desired by most South Africans
Money-metric Poverty headcounts in 2015

28,4%
33,5%
21,4%
25,2%
51,0%
47,6%
36,4%
40,0%
66,6%
62,1%
53,2%
55,5%
0,0
10,0
20,0
30,0
40,0
50,0
60,0
70,0
2006 2009 2011 2015
Perc
enta
ge
Approximately 13,8 million South Africans were living below the FPL in 2015, down from a peak of 16,7 million in 2009.
Poverty headcounts based on the FPL, LBPL and UBPL

8,0
18,0
28,0
38,0
48,0
58,0
2006
2009
2011
2015
2006
2009
2011
2015
2006
2009
2011
2015
2006
2009
2011
2015
2006
2009
2011
2015
2006
2009
2011
2015
2006
2009
2011
2015
2006
2009
2011
2015
2006
2009
2011
2015
LPEC
KZN
MPNC
NW
FS
WC
GP
The poorest three provinces in the country have consistently been Limpopo, Eastern Cape & KwaZulu-Natal.
Gauteng & Western Cape remain the two provinces with the lowest poverty headcounts at 13,6 % & 12,8% respectively.
For Periods 2006 / 2009 / 2011 / 2015Source: Poverty Trends Report
KZN
Poverty Measures of Households (LBPL)

48,3% 45,6%
34,7%38,2%
53,6%49,6%
38,1%
41,7%
0,0
10,0
20,0
30,0
40,0
50,0
60,0
70,0
80,0
2006 2009 2011 2015
Perc
enta
ge
Females remain more disadvantaged than males consistently recording a higher headcount, gap and severity measures at each point in time; however, the difference between the sexes is narrowing.
Source: Living Conditions Survey
Poverty headcounts by sex (LBPL)
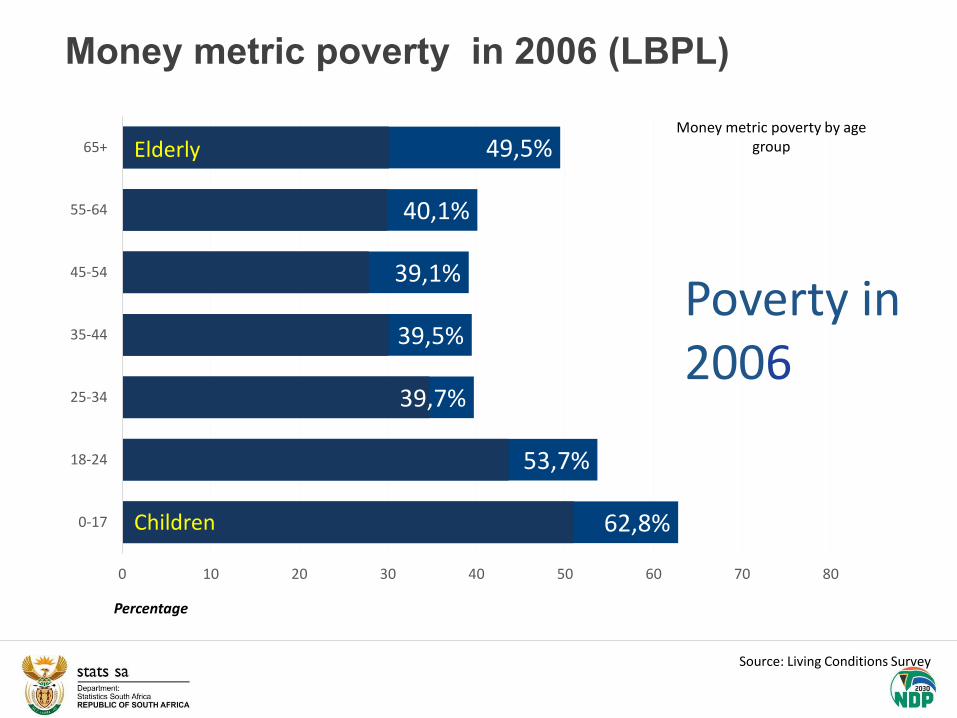
62,8%
53,7%
39,7%
39,5%
39,1%
40,1%
49,5%
0 10 20 30 40 50 60 70 80
0-17
18-24
25-34
35-44
45-54
55-64
65+
Poverty in 2006
Children
Elderly
Percentage
Money metric poverty in 2006 (LBPL)
Source: Living Conditions Survey
Money metric poverty by age group

51,0%
43,6%
34,7%
30,1%
27,8%
29,9%
30,1%
0 10 20 30 40 50 60 70 80
0-17
18-24
25-34
35-44
45-54
55-64
65+ - 19,3% Points
-11,8%Points
-10,0% Points
-11,3% Points
- 10,0 %Points
-9,4 %Points
- 5,0%Points
Poverty in 2015
Children
Elderly
Percentage
Change in money metric poverty between 2006 and 2015 (LBPL)
Elderly saw the greatest reduction in money metric poverty
Source: Living Conditions Survey

Household size: 2,4
Household income: R199 267
Ownership of dwelling: 60,1%
Piped water inside/on site: 86,7%
2,4
Electricity: 91,4%
Piped water inside/on site:
Household size: 4,6
Household income: R46 624
Ownership of dwelling: 78,2%
Piped water inside/on site: 59%
78,2%
Electricity: 80,5%Electricity: 80,5%
Poor Households Non-poor Households
Household Expenditure R31 669
Flush toilet: 39,3% Flush toilet: 80,8%
Household Expenditure R151 097
39,3%
Non-poor households had better access to services compared to poor households
Profile of Poor and Non-poor households (Money Metric)

The South African Multidimensional Poverty Index (SAMPI) provides a more holistic view of poverty

Health
Education
Child mortality
Years of schooling
School attendance
The four dimensions of the SAMPI
Living standards
Lighting
Heating
Cooking
Water
Sanitation
Economic activity
Unemployment
Dwelling
Assets
(death of child under 5)
(completed 5 years of schooling)
(school-aged child out of school)
(no electricity)
(no electricity)
(no electricity)
(no piped water)
(informal/traditional/caravan/tent)
(no flush toilet)
(no radio/TV/phone/car)
(adults unemployed)
Deprivation cut-offs

17,9%
8,0%7,0%
2001 2002 2003 2004 2005 2006 2007 2008 2009 2010 2011 2012 2013 2014 2015 2016
RSA
Multidimensional Poverty headcount by Geographic Various levels 2001-2016
SAMPI
SourceThe South African MPI2002 2003 2004 2005 2006 2007 2008 2009 2010 2012 2013 2014 2015
Headcount poverty decreased from 17,9% in 2001 to 7,0% in 2016
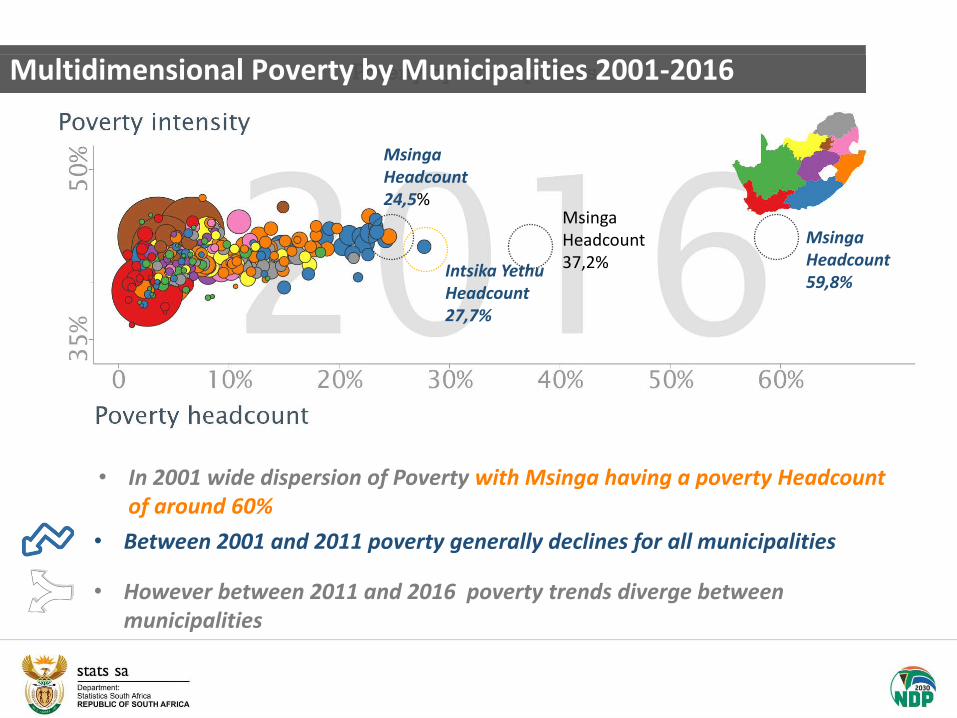
• In 2001 wide dispersion of Poverty with Msinga having a poverty Headcount of around 60%
• Between 2001 and 2011 poverty generally declines for all municipalities
• However between 2011 and 2016 poverty trends diverge between municipalities
Multidimensional Poverty by Municipalities 2001-2016
Msinga Headcount 59,8%
Msinga Headcount 24,5%
Intsika YethuHeadcount 27,7%
Msinga Headcount 37,2%

KZN
82
7
3 6
4
9 5
1
22%
23%
23%
23%
23%
23%
23%
24%
25%
28%
Ngquza Hill
Emalahleni
Umhlabuyalingana
Mbizana
Ntabankulu
Engcobo
Port St Johns
Umzimvubu
Msinga
Intsika Yethu12
34
Engcobo5Ntabankulu6
Mbizana7Umhlabuyalingana8
Ngquza Hill10Emalahleni9
10
ECHigh levels of
poverty in rural areas of SA
Location of the ten poorest municipalities (by headcount) in 2016.
SourceThe South African MPI

District and Municipal View of Poverty 2016
SourceThe South African MPI

Data from Census 2011 allows us to zoom into poverty hotspots

Mapping the poverty headcount by ward - 2011
SourceThe South African MPI

Mapping the poverty headcount by MunicipalityEastern Cape – 2011
SourceThe South African MPI

Mapping the poverty headcount by ward Port St Johns – 2011
SourceThe South African MPI

Census 2001, 2011 and CS 2016
40 5233
10 Years
5 Years
Multidimensional Poverty Drivers

14,0%
12,9%
19,5%
20,7%
23,3%
20,8%
24,1%
27,8%
32,9%
26,5%
21,7%
28,8%
39,2%
41,8%
41,9%
42,3%
44,0%
46,2%
48,9%
52,5%
WC
GP
RSA
KZN
FS
MP
NC
NW
EC
LP
Female Male
52,5% of Female headed households in LP do not have an employed household memberHouseholds without and employed household member by sex of household head, 2018
Source: Marginal Groups Indicator Report 2018
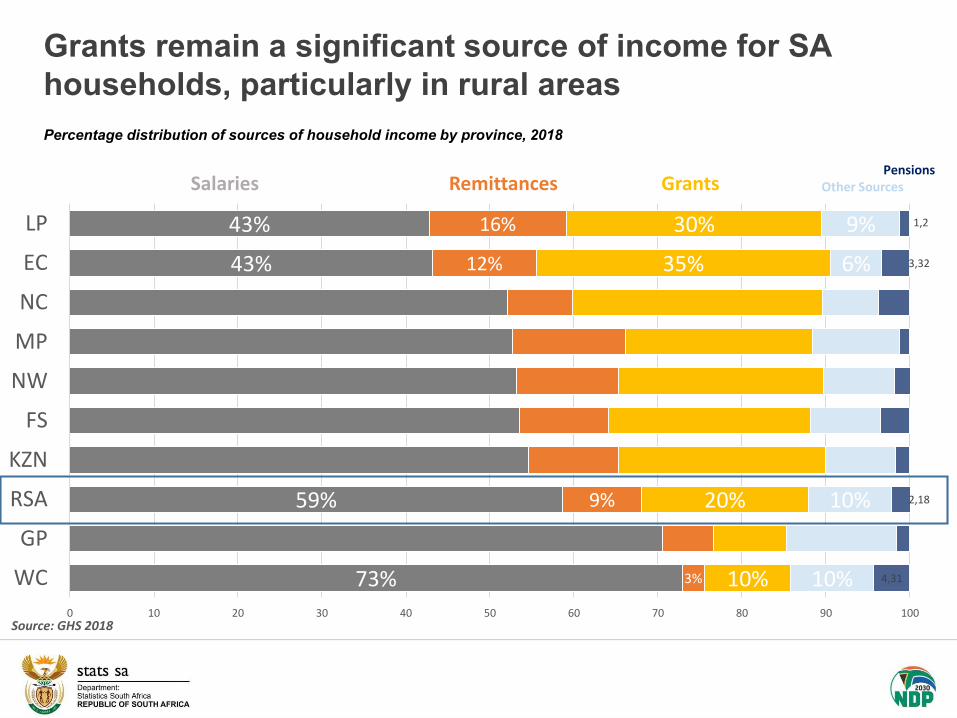
43%43%
59%
73%
16%
12%
9%
3%
30%35%
20%
10%
9%6%
10%
10%
1,2
3,32
2,18
4,31
0 10 20 30 40 50 60 70 80 90 100
LPECNCMPNW
FSKZNRSAGP
WC
Salaries Remittances Other SourcesGrantsPensions
Percentage distribution of sources of household income by province, 2018
Source: GHS 2018
Grants remain a significant source of income for SA households, particularly in rural areas

Vulnerability to hunger at an individual and household level has been declining whilst access to grants has been increasing.
22,8%
9,7%
27,7%
11,3%12,8%
31,0%30,8%
44,3%
2002 2004 2006 2008 2010 2012 2014 2016 2018
Grants and Vulnerability to hunger 2002 - 2018
Grant: persons
Grant: households
Vulnerability to hunger: persons
Vulnerability to hunger: HH
Source: GHS 2018

4,6% 5,
2% 6,2%
10,1
%
8,3%
11,6
%
14,3
%
14,6
%
10,8
%
9,5%
3,8%
8,1%
9,6% 11
,3%
11,6
%
14,4
%
14,8
%
15,3
%
15,6
% 17,4
%
0%
2%
4%
6%
8%
10%
12%
14%
16%
18%
20%
LP GP EC FS RSA MP NC NW KZN WC
Male Female
Limpopo as a whole (4,2%) had the lowest percentage of households male or female that reported suffering from hunger
Source: Marginal Groups Indicator Report 2018
Households that reported hunger

29
Indigent households identified by
municipalities
Beneficiaries
Water Electricity Sewerage and sanitation
Solid waste management
Western Cape 370 639 360 571 365 839 357 619 357 016
Eastern Cape 797 103 516 972 337 832 274 686 221 946
Northern Cape 73 831 67 015 69 548 63 200 63 841
Free State 178 740 147 304 164 215 144 414 146 737
KwaZulu-Natal 769 258 643 560 296 034 347 792 465 588
North West 162 170 99 492 146 996 74 643 79 573
Gauteng 863 221 744 844 407 788 384 352 814 705
Mpumalanga 109 318 103 125 104 447 90 741 93 664
Limpopo 307 163 127 550 131 448 44 603 42 493
South Africa 3 631 443 2 810 433 2 024 147 1 782 050 2 285 563
Poor households as determined by municipalities ; The basis on which a municipality determines if a household is indigent varies across municipalities, even within same province
3,6 Million Indigent households identified by municipalities
Indigent households registered with municipalities: 2018

A gender disaggregated perspective on poverty and inequality as experienced by Women, Youth and People Disabilities?
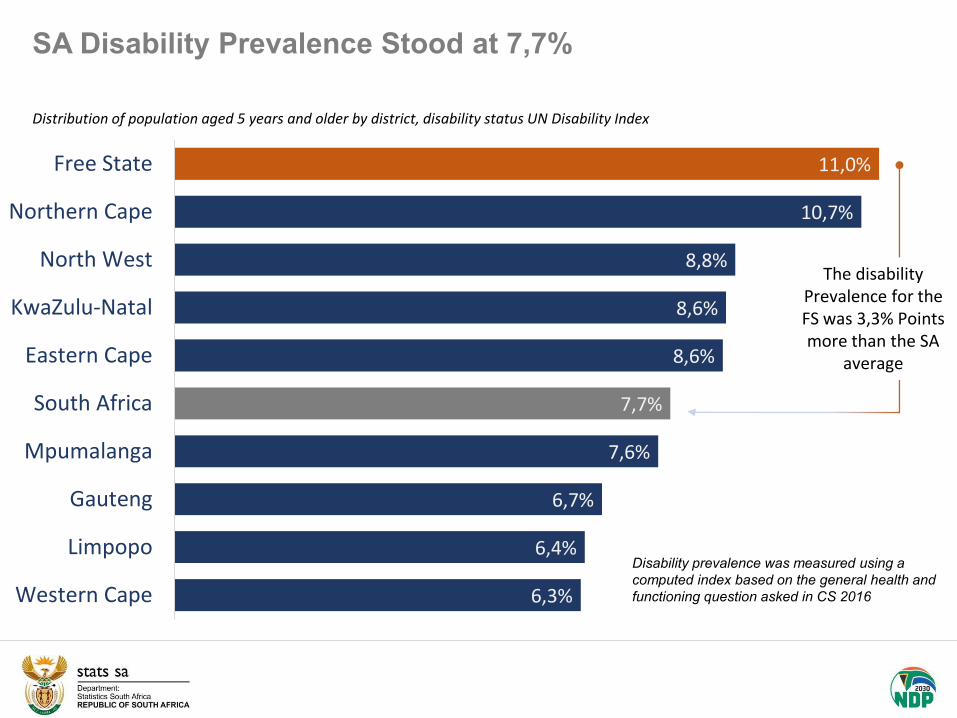
SA Disability Prevalence Stood at 7,7%
6,3%
6,4%
6,7%
7,6%
7,7%
8,6%
8,6%
8,8%
10,7%
11,0%
Western Cape
Limpopo
Gauteng
Mpumalanga
South Africa
Eastern Cape
KwaZulu-Natal
North West
Northern Cape
Free State
The disability Prevalence for the FS was 3,3% Points more than the SA
average
Distribution of population aged 5 years and older by district, disability status UN Disability Index
Disability prevalence was measured using a computed index based on the general health and functioning question asked in CS 2016

Male Female Both SexesPersons with Disability R35 153 R21 245 R27 143Persons without disability R60 421 R39 033 R49 977
R0
R10 000
R20 000
R30 000
R40 000
R50 000
R60 000
R70 000
Aver
age
annu
al p
erso
nal I
ncom
e
Source: Profile of persons with disabilities in South Africa Census 2011
Average annual personal income of persons with disabilities is lower compared to those with no disabilities.
Average annual personal income by sex and disability status

Persons without disabilities: only 7,4% had
no formal education and about 11% had
tertiary education
Disability and level of education
24,6%Persons with disabilities showed the highest proportion with
no formal education (24,6%) and had the lowest proportion
that had attained higher education (5,1%)
7,4%
Source: Profile of persons with disabilities in South Africa

In 2018 women’s median monthly earnings were 76% of men's median monthly earnings

Women with tertiary education experienced a narrower pay gap in 2018, earning 92,3% of men’s earnings2018, earning 92,3% of men’s earnings

Limpopo has the highest gender pay gap - Females earned 66,2% of men’s median monthly earnings in 2018men’s median monthly earnings in 2018

8,1%
13,0%
24,0%
33,8%
30,1%
6,1%
14,4%
19,0%
26,3%
23,3%
White
Indian/Asian
Coloured
BlackAfrican
Both sexes
Unemployment Rateby Population Group
Q2:2020 Q1:2020
8,0%
11,7%
24,7%
31,6%
28,3%
6,5%
11,3%
20,5%
24,8%
22,1%
Male Unemployment RateBy Population Group
Q2:2020 Q1:2020
Black women are the most vulnerable with unemployment rate of over 30%.
8,2%
15,3%
23,2%
36,5%
32,4%
5,6%
20,3%
17,4%
28,2%
24,8%
Female Unemployment Rate by Population Group
Q2:2020 Q1:2020
37
OFFICIAL unemployment rate by population group and sex
Black African women are the most vulnerable with an unemployment rate above 28,0%.

10,1%
18,7%
31,0%
44,1%
39,7%
14,3%
26,2%
33,1%
46,3%
42,0%
White
Indian/Asian
Coloured
BlackAfrican
Both sexes
Expanded unemployment rate by population group
Q2:2020 Q1:2020
9,8%
15,3%
31,8%
40,4%
36,5%
14,0%
19,7%
33,3%
42,9%
38,9%
Male expanded unemployment rate
Q2:2020 Q1:2020
10,5%
24,2%
30,0%
48,2%
43,4%
14,6%
36,6%
33,0%
50,2%
45,7%
Female expanded unemployment rate
Q2:2020 Q1:2020
Irrespective of gender, the black African and coloured population groups remain vulnerable in the labour market.
38
EXPANDED unemployment rate by population group and sex

EducationWorkNEET
Those young people
(15-34 years) who are
categorised as NEET
are considered to be
disengaged from both
work and education.
Youth NEET rate is calculated as the total number of youth who are NEET as a proportion of the total
youth-specific working-age population
?
Not in employment, education or training (NEET)
39

36,8%
41,7%43,9%
47,9%
20%
25%
30%
35%
40%
45%
50%
Q2: 2019 Q2: 2020
FEMALE NEET
MALE NEET
NEET (15-34 years) by gender
Over 9,2 million (44,7%) out of 20,5 million young people aged 15-34 years were not in employment, education or training (NEET). The overall NEET rate increased by 4,4 percentage points y/y.
20%
25%
30%
Female NEETUp by 4,0 percentage points
Male NEETUp by 4,9 percentage points
15-34 YEARS
40Source: QLFS Q2 2020
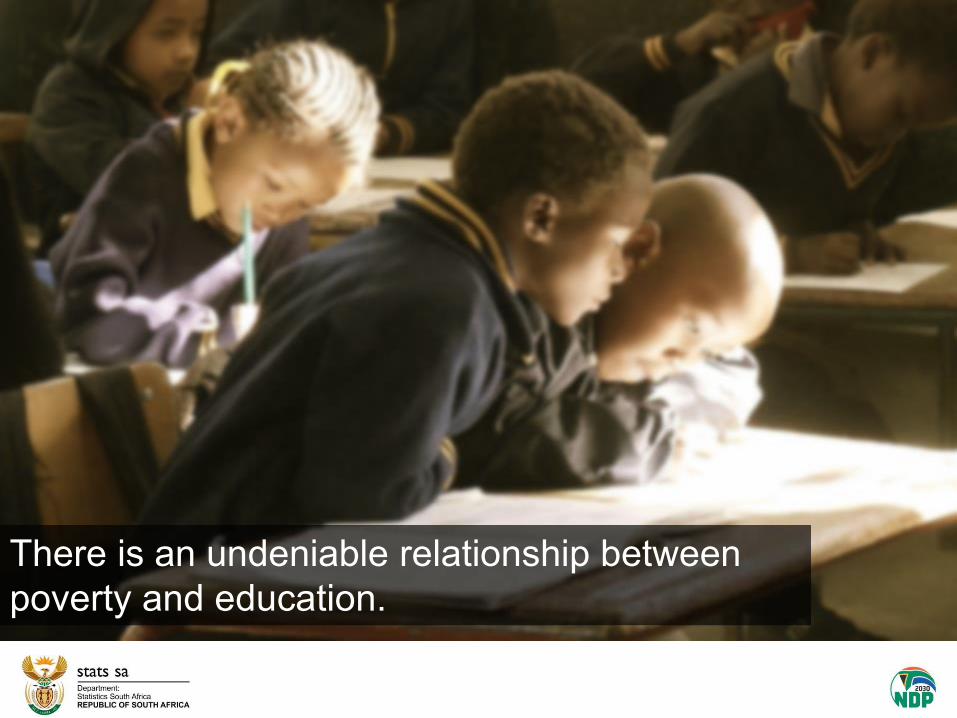
There is an undeniable relationship between poverty and education.

Percentage of those aged 5 – 24 years who attend educational institution, 2018
There is noticeable representation of learners who are older than the ideal graduation age in primary and secondary schools.
0%
20%
40%
60%
80%
100%
5 6 7 8 9 10 11 12 13 14 15 16 17 18 19 20 21 22 23 24
TVET
University
Primary School
Secondary School
Pre
Scho
ol
Not in Education or Training
Source: GHS 2018

Main reasons given by persons aged 7 to 18 years for not attending an educational institution, 2018
Over a fifth of learners cited a lack of money as the main reason for not attending an educational institution. Some reasons for not attending an educational institution are particularly affected by gender.
3,5%
7,5%
7,9%
9,8%
10,8%
13,3%
22,9%
24,2%
Working at home
Education is useless
Family commitments
Completed education
Illness and disability
Other
Poor academic performance
No money for fees
M F
Vast gender disparities in “family commitment” and “education is useless”
14.4%0,2%
11,8%3,9%
Source: GHS 2018

Ndzi hela kwala!