rise scada and electrical system - murdoch...
TRANSCRIPT

MURDOCH UNIVERSITY
Rise SCADA and Electrical System
A report pertaining to the condition and serviceability of the electrical and SCADA systems
of the former RISE facility
Chris Woodard
Supervisor: Assoc. Professor Graeme Cole
Associate Supervisor: Dr. Martina Calais

2
Abstract The former Research Institute for Sustainable Energy (RISE) testing laboratory was originally a facility for
measuring, monitoring and testing a variety of renewable energy systems. The RISE facility was
independent of the School of Engineering and Energy, but has recently been taken over by the School as
the Engineering and Energy Laboratory.
Many of the systems associated with the laboratory have not been operated for a number of years and
the condition of these systems, and the equipment that is associated with them, is not known.
Personnel involved with the former RISE facility have since left Murdoch taking with them their
knowledge of the facility.
This project was primarily concerned with re-commissioning these systems and developing an
operational knowledge of the SCADA based control system. Areas to be covered in particular were:
connections to the grid from PV arrays and wind turbines
PLC system and software
inverters, solar array simulator, environmental chamber and other peripheral equipment
power supplies such as the diesel generator, motor generator set and battery banks
3 phase permanently connected power monitors
AC and DC electrical systems
Initial inspections of the electrical systems showed that two key components of the facility were found
to be defective and would need to be rectified if the facility was to function properly. These components
were the diesel generator which provided electricity totally independent of the grid for testing purposes,
and a fault on the PLC which was affecting the operation of the electrical systems. Also several main
pieces of equipment had since been removed from the facility; most notably of these being the battery
banks, main test inverter and the DC supply from the wind turbines located in what is now known as the
Renewable Energy Outdoor Test Area (ROTA). Several pieces of equipment required for the operation of
the diesel generator would also require attention such as the fuel tank and starting battery.
Approval was granted for the alternator to be repaired and placed back into service. Approval was also
granted for the purchase of a replacement analogue input card to rectify the fault with the PLC.
In addition to this another requirement of the project was to develop a system so that the laboratory
could be used as a training facility for future students. A procedure was developed so that an electrical
system consisting of actual real components; a source, a transmission and distribution system and a load
could be simulated. Software was also developed using National Instruments LabVIEW software to
monitor and record various power parameters from the system. The system is referred to as the “Small
Electrical Distribution System”.
As an aside to this a program has been developed that monitors and records voltage, current and power
that is being produced by the Real PV Array located on the roof of the Energy and Engineering
Laboratory building.

3
For someone who is unfamiliar with the setup of the electrical systems that make up the Energy and
Engineering Laboratory a simplified block diagram of the Main AC switchboard has been produced.
Schedules have been included of all socket inlets and outlets, main AC and communications cables and
the Main AC Switchboard nomenclature.
The diesel generator is nearly ready to be re-commissioned after approximately 5 years of non use.
Procedures have been developed so that a user can configure the Main AC switchboard so that the
“Small Electrical Distribution System” can be operated safely and measurements obtained and analysed.
The main goal of the project was to get the diesel generator operating; therefore this report is focused
on the equipment associated with the diesel generator. The equipment focused on was the diesel
generator itself, the Main AC Switchboard, the Load Bank and the PLC system. Systems such as the Main
DC switchboard and Solar Array Simulator were not covered in as much detail as they are not required
for the “Small Electrical Distribution System”.
Figure 1 View of the Engineering and Energy Lab

4
Disclaimer I declare that the following to be my own work as defined by Murdoch Universities policy on plagiarism.
Acknowledgments I would like to give thanks to Associate Professor Graeme Cole and Doctor Martina Calais for there
support and encouragement for the duration of this project. Their wisdom, expertise and advice have
helped make this past four months an enjoyable and fulfilling experience.
Thanks are also extended to Mr John Boulton for his assistance in the removal of the defective
alternator, transporting myself and various pieces equipment around Perth and his assistance in getting
the Energy and Engineering Lab operating again.
Mr Will Stirling for his efforts in recommissioning the PC’s that monitor and control the equipment in
the Energy and Engineering Lab and for his assistance updating the software.
And thanks also to Mr Jeff Laava for his technical support and the Kat and June in the office for their
administrative assistance.

5
Contents Abstract ......................................................................................................................................................... 2
Disclaimer...................................................................................................................................................... 4
Acknowledgments ......................................................................................................................................... 4
List of figures ................................................................................................................................................. 8
Chapter 1 ....................................................................................................................................................... 9
Introduction .................................................................................................................................................. 9
Chapter 2 ..................................................................................................................................................... 11
Main components ....................................................................................................................................... 11
Large (Main) System ............................................................................................................................... 11
Main AC Switchboard .......................................................................................................................... 11
Main DC Switchboard ......................................................................................................................... 13
Cabling ................................................................................................................................................. 13
Small System ........................................................................................................................................... 14
Small AC Switchboard ......................................................................................................................... 14
Small DC Switchboard ......................................................................................................................... 14
Diesel Generator Set ............................................................................................................................... 15
Socket Inlets/Outlets .............................................................................................................................. 15
Load Bank ................................................................................................................................................ 15
Environmental Chamber ......................................................................................................................... 16
Solar Array Simulator .............................................................................................................................. 17
Motor Generator Set .............................................................................................................................. 17
Main Inverter .......................................................................................................................................... 18
Battery Banks .......................................................................................................................................... 18
Solar Array Connection ........................................................................................................................... 18
Control System ........................................................................................................................................ 18
Powermonitor ..................................................................................................................................... 19
Setting up the PLC to operate the Real PV Array ................................................................................ 20
Chapter 3 ..................................................................................................................................................... 25
Major works conducted .............................................................................................................................. 25
Diesel Generator ..................................................................................................................................... 25
Fuel tank .............................................................................................................................................. 26

6
Chapter 4 ..................................................................................................................................................... 28
Small Electrical Distribution System ........................................................................................................... 28
Program................................................................................................................................................... 29
Generator ............................................................................................................................................ 29
Switchboard ........................................................................................................................................ 29
Load bank ............................................................................................................................................ 29
Displays ............................................................................................................................................... 31
Setting up RS Logix to read from the Powermonitors ............................................................................ 33
Simplified version of the Small Electrical Distribution System ............................................................... 38
Chapter 5 ..................................................................................................................................................... 40
Real PV array ............................................................................................................................................... 40
Setting up the Real PV Array to export power ........................................................................................ 41
Fieldpoint device ..................................................................................................................................... 42
Chapter 6 ..................................................................................................................................................... 44
Issues ........................................................................................................................................................... 44
Analogue Input card ................................................................................................................................ 44
Power monitor ........................................................................................................................................ 45
Chapter 7 ..................................................................................................................................................... 46
Future Work ................................................................................................................................................ 46
LabVIEW Server ....................................................................................................................................... 46
LabVIEW .................................................................................................................................................. 46
Mechanism to prevent phase unbalance............................................................................................ 46
Mechanism to prevent generator overcurrent. .................................................................................. 46
Additional protection .......................................................................................................................... 46
Fuel Tank Level Monitor ......................................................................................................................... 46
Chapter 9 ................................................................................................................................................. 48
Power issues ........................................................................................................................................... 48
3 phase laboratory power supplies ..................................................................................................... 48
Electric car charging station ................................................................................................................ 49
Other Systems to be Re-commissioned .............................................................................................. 49
Chapter 10 ................................................................................................................................................... 50
Conclusions ................................................................................................................................................. 50

7
What did I achieve from this project ...................................................................................................... 50
References .................................................................................................................................................. 52
Bibliography ............................................................................................................................................ 52
Drawings ................................................................................................................................................. 52
Websites ................................................................................................................................................. 52
Appendices .................................................................................................................................................. 53
Appendix A. Main AC Switchboard Label Schedule ................................................................................ 53
Appendix B. Main AC Cable Schedule ..................................................................................................... 54
Appendix C. Schedule of Socket Inlets/Outlets ...................................................................................... 55
Appendix D. Communications Cable Schedule ....................................................................................... 56
Appendix E. Alternator insulation tests .................................................................................................. 57
Windings to earth ............................................................................................................................... 57
Between windings ............................................................................................................................... 57
Continuity ............................................................................................................................................ 58
Appendix F. Load Bank co-ordination for single phase resistive loads ................................................... 59
Appendix G. Block diagram of MACSB .................................................................................................... 60
Appendix H. Block diagram of Real PV array connections ...................................................................... 61
Appendix I. Block diagram of communications systems ......................................................................... 62
Appendix J. Graph of Power Exported .................................................................................................... 63

8
List of figures Figure 1 View of the Engineering and Energy Lab ........................................................................................ 3
Figure 2 Main AC Switchboard .................................................................................................................... 11
Figure 3 Block diagram of the MACSB ........................................................................................................ 12
Figure 4 Main DC Switchboard.................................................................................................................... 13
Figure 5 Load Bank ...................................................................................................................................... 16
Figure 6 Environmental Chamber control panel ......................................................................................... 17
Figure 7 Motor Generator Set ..................................................................................................................... 18
Figure 8 Allen-Bradley Powermonitor. The Real PV Array is providing 1 amp on L1 ................................. 19
Figure 9 Ensure PLC is online ...................................................................................................................... 21
Figure 10 Open the Force Files folder ......................................................................................................... 21
Figure 11 OUTPUT forces window .............................................................................................................. 22
Figure 12 Note how O:1/190 correlates to O:1.11/14 ................................................................................ 22
Figure 13 Select Force On - O:1/190 ........................................................................................................... 23
Figure 14 Selecting Yes will enable the force.............................................................................................. 23
Figure 15 If Forces Enabled is displayed then outputs are forced .............................................................. 24
Figure 16 Diesel Generator with rewound alternator installed .................................................................. 26
Figure 17 Power flow for the Small Electrical Distribution System ............................................................ 29
Figure 18 Front Panel of the Small Distribution System ............................................................................. 31
Figure 19 Voltage block diagram showing the integer and exponent ........................................................ 32
Figure 20 A full list of files is available under Address/Symbol .................................................................. 34
Figure 21 All Data Files are found in the Data File folder ........................................................................... 34
Figure 22 Data File N200. Highlighted are the integer and exponent for current L1. It is showing 10.18
amps ............................................................................................................................................................ 35
Figure 23 Data File N100 correlates with Data File N200 ........................................................................... 35
Figure 24 N100 is one of the 10 files to be read ......................................................................................... 36
Figure 25 Ladder rung 0006 Command & Status Blockmove Sequencer. Data File N101 is currently being
read ............................................................................................................................................................. 37
Figure 26 Main block transfer sequencer ................................................................................................... 37
Figure 27 Voltage/current bit transfer read. When source A equals 100 data from N100 is transferred to
M0 ............................................................................................................................................................... 38
Figure 28 Front Panel Simplified Small Distribution System ....................................................................... 39
Figure 29 Front Panel Real PV array. Note the affect of a cloudy day ........................................................ 41
Figure 30 Emergency Stop .......................................................................................................................... 44
Figure 31 Drawing 0023E5-3 showing spare cable cores and inputs/outputs ........................................... 47

9
Chapter 1
Introduction The Research Institute for Sustainable Energy (RISE) testing laboratory was originally set up to provide a
flexible test apparatus with associated facilities for a range of system configurations and component
tests. The laboratory was to have the following functions:
Component performance and environmental testing under controlled temperature and
humidity conditions
Hybrid system operation logging under programmed load and control conditions for validation
of simulation models
System performance logging under control conditions for inverter and control equipment tests
Power quality testing of real equipment such as inverters and control equipment
Standards testing of transients and voltage dips on inverters and control equipment
Standards testing of harmonics from inverters and control equipment
Teaching facility with multiple computers and internet access
Post graduate research
Project acceptance testing
Two of the main test facilities for which this thesis is covering are:
A large or main system comprising 120/240V DC and 3 phase AC up to 50kW.
A small system comprising 24/48V DC and single phase AC up to 5kW.
The laboratory consisted of the following main components:
AC and DC switchboards and cabling
Central PC based system for control and monitoring from the PLC
Programmable resistive and inductive load bank
Environmental chamber for testing of temperature and humidity effects on system components
25kW simulated solar array source
70kW DC power source
28kVA diesel generator and associated facilities e.g. Acoustically treated room and fuel system
20kVA inverter (since been removed)
2 flexible battery banks 24V to 48V DC and 120V to 240V DC (since been removed)
Connection for a real solar array (currently operating via Grid Connection circuit breaker and
Grid Connection Switchbox)
Connection for a real wind turbine source (via socket inlet P15 and socket outlet P14, currently
disconnected)
Connection for a temporary inverter (via socket outlets P1, P2 and P3)
Connection for a temporary diesel generator set (via socket inlets P11 and P12)

10
Connection for a temporary load bank (via socket outlets P13)
Connection for a variable load (via 55A isolator located in store)
11
Chapter 2
Main components
Large (Main) System The AC and DC switchboards and cabling are designed with capacity to accommodate a 50kVA inverter
at 240V DC and 3 phase 415V AC.
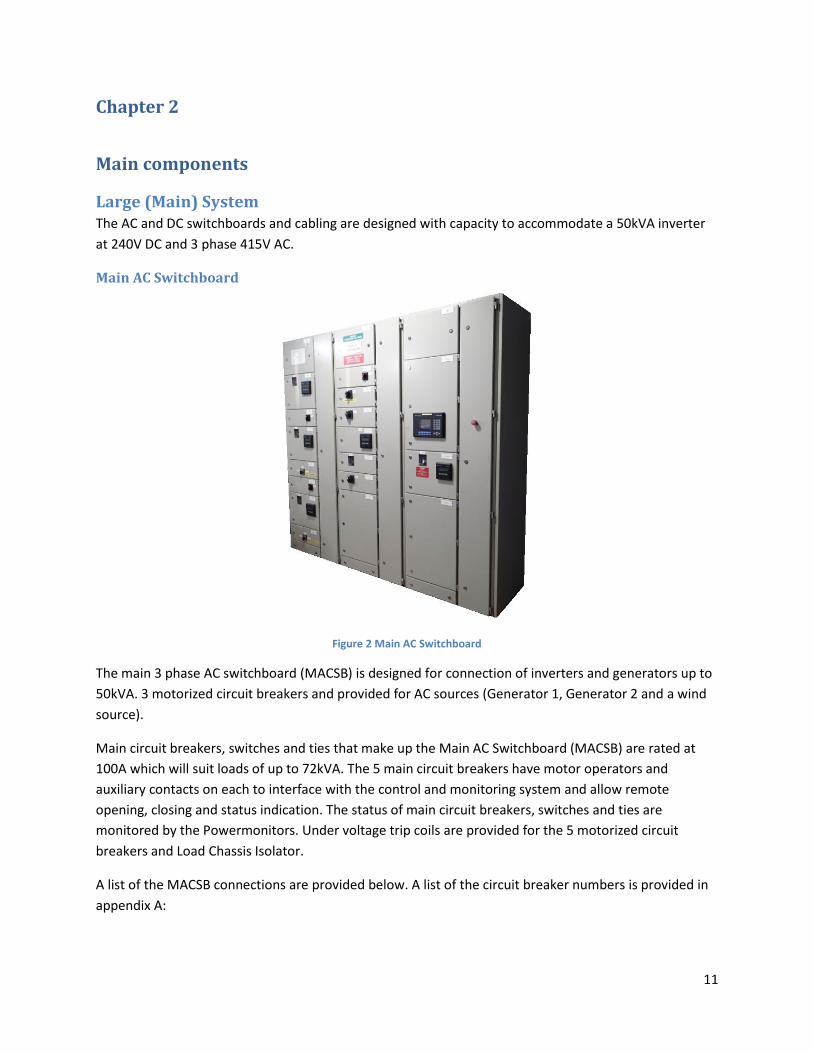
Main AC Switchboard
Figure 2 Main AC Switchboard
The main 3 phase AC switchboard (MACSB) is designed for connection of inverters and generators up to
50kVA. 3 motorized circuit breakers and provided for AC sources (Generator 1, Generator 2 and a wind
source).
Main circuit breakers, switches and ties that make up the Main AC Switchboard (MACSB) are rated at
100A which will suit loads of up to 72kVA. The 5 main circuit breakers have motor operators and
auxiliary contacts on each to interface with the control and monitoring system and allow remote
opening, closing and status indication. The status of main circuit breakers, switches and ties are
monitored by the Powermonitors. Under voltage trip coils are provided for the 5 motorized circuit
breakers and Load Chassis Isolator.
A list of the MACSB connections are provided below. A list of the circuit breaker numbers is provided in
appendix A:

12
Permanent inverter (2 generator inputs (L1 & L4) one load output L9)
Temporary test inverter (2 generator inputs (L1 & L4) one load output L10)
Wind turbine (motorized circuit breaker L7)
Load bank (shunt tripped circuit breaker L13)
Temporary load (motorized circuit breaker L12)
Permanent generator (motorized circuit breaker L5)
Temporary/future generator (motorized circuit breaker L2)
Grid connection for temporary inverter and solar array (motorized circuit breaker L14)
The grid connection (L14), three source connections (L2, L5 and L7) and the load (L11) each have a
power monitor (Allen Bradley 1403 Powermonitor II) permanently connected. These units measure the
full range of voltage, current, power and harmonics. They communicate via a remote I/O data
connection to the PLC and LabVIEW Server. In addition each Powermonitor has a digital display on the
front of the switchboard.
The AC switchboards are not connected to mains power to allow synchronising with mains, nor are
standard building loads able to be transferable from mains to the AC switchboards.
The Grid connection circuit breaker on the MACSB is not connected to the remainder of the main AC
system. It allows connection of a grid-connect inverter to the mains, independent of the laboratory AC
system supplied by the diesel generator.
Below is a block diagram of the MACSB. Further details regarding this diagram is provided in Appendix G.
Figure 3 Block diagram of the MACSB

13
Main DC Switchboard
Figure 4 Main DC Switchboard
Although contained within the one switchboard, the Main DC switchboard (MDCSB), the Large DC
system and Small DC system are totally separate from each other.
The Main DC Switchboard is designed to operate up to a current of 250A. At 120V DC the system has a
capacity of 30kVA or at 240V DC a capacity of 60kVA.
All circuit breakers on the MDCSB are manually operated with auxiliary contacts to indicate the status to
the control and monitoring system. Circuit breakers also have shunt trip coils for remote tripping.
The Large DC system MDCSB connections are provided for:
Temporary battery bank
Solar simulator
Real solar array
Permanent inverter
Temporary inverter
Charger
The Large DC system DC bus is fitted with a voltmeter and ammeter with LED displays on panel 1F-7. The
real solar array and solar simulator are also fitted with a voltmeter and ammeter on their respective
panels.
The selector switch for either 120V DC or 240V DC operation is located on the MDCSB, panel 1F-0.
Cabling
Cable schedules for the main AC cables and communications cables are included in appendix B.

14
Some cables have been left unterminated due to their associated equipment being removed, i.e. the
main test inverter.
Cabling for the main inverter includes MAC2, MAC4 and MAC6, LDC7+ and LDC7-, and comms cables
COM7 and IN-11. The 3 main AC (MAC) cables have been disconnected at both the inverter and
switchboard ends and information tags placed appropriately. The DC cables and comms cables have
information tags placed appropriately.
Small System
Small AC Switchboard
The Small AC Switchboard (SACSB) is designed for connection of a single phase inverter and a generator
up to 5kVA. It has 5 circuit breakers with open, closed and tripped status signals for remote monitoring
and shunt coils for remote tripping. There is 1 AC source connection (small generator connection P12),
an inverter input (socket inlet P8), inverter output (socket outlet P7) and a source load tie (circuit
breaker L4). The inverter input (L1) has a contactor to allow for remote on/off control of the generator
input to the inverter.
The load is supplied via a 24 pole circuit breaker chassis and PLC controlled contactors. Loads comprise
of resistive and reactive loads within the load bank and a bank of 10 GPO’s located on the front of the
SACSB.
Two Crompton Integra single phase power monitors measure the generator supply and the inverter
output and communicate using RS485 directly to the LabVIEW server.
Small DC Switchboard
The Small DC System switchboard (SDCSB) is located within the Main DC switchboard, but is totally
separate from the Large DC system.
The Small DC switchboard is set up similar to the Large DC Switchboard. All circuit breakers on the
SDCSB are manually operated with auxiliary contacts to indicate the status to the control system. Circuit
breakers also have shunt trip coils for remote tripping.
Circuit breakers are provided for:
Temporary battery bank
Solar simulator
Temporary inverter
Charger
The DC bus is fitted with a voltmeter and ammeter with displays on panel 2F-3. The Small System
Charger and solar simulator are also fitted with a voltmeter and ammeter on their respective panel.
The selector switch for either 12V DC or 24V DC originally located on the SDCSB (panel 2F-0) has been
removed from the switchboard.

15
Diesel Generator Set An acoustically treated sound proof room houses two power sources together with fuel supplies and
acoustically treated ventilation. One skid mount diesel generator (28kVA) and one skid mount motor
generator set (70kW).
2 socket inlets (P11 & P12) and cabling have also been installed both in the generator room and on the
wall externally to add another generator up to 50kVA, either permanently or as a temporary stand alone
package unit.
No synchronising equipment is provided as it is assumed that even if two generator sets were in place,
they would operate on a duty/standby basis. Synchronising of the duty generator and the inverter is
achieved by the inverter control system.
Socket Inlets/Outlets Schedules for all 3 phase socket inlets and outlets in the facility are included in appendix C.
All 3 phase socket inlets and outlets in the RISE facility have been clearly identified and labelled.
Load Bank A programmable load bank is connected to both the MACSB and SACSB. The load bank has single phase
resistive and reactive loads in binary coded steps beginning at 150 watts and 150VAr. With all steps on
the total load per phase is 9450W and 9450VAr.
The bank is configured to allow single or 3 phase loads. The 3 phase load is connected in a star
configuration.
The Load Bank is fed from the MACSB load bus via the Load Bank Isolator (L13), Load Chassis (located in
panel 2F-19) and the PLC controlled Load Contactors (located in panel 3F-18). The 3 phase loads
comprise binary coded resistive and reactive steps as follows:
Resistive Reactive
Per Phase Step 1 150W 150VAr
Per Phase Step 2 300W 300VAr
Per Phase Step 3 600W 600VAr
Per Phase Step 4 1200W 1200VAr
Per Phase Step 5 2400W 2400VAr
Per Phase Step 6 4800W 4800VAr
Total per phase 9450W 9450VAr
Total 3 phase 28350W 28350VAr
The 2400 and 4800 Watt and VAr steps are controlled by 3 phase contactors. Smaller steps have single
phase contactors. This allows for loads to be incremented in steps of 150W or 150 VAr up to a total of
9450W/VAr per phase.

16
The resistor bank is cooled by a 2.2kW fan supplied from the building mechanical services switchboard.
The load bank has a 0-100°C RTD probe to monitor the load bank temperature. The fan will start if any
resistive load is on and the temperature reaches 35°C (stored in B3:109). It will stop when all resistive
loads are off and the temperature falls below 35°C or if any resistive load is on and the temperature is
below 30°C (again stored in B3:109).
If the temperature reaches 68°C (stored in B3:109) then an alarm is displayed on Panelview and the 3
phase loads are tripped and the single phase inverter output (L5 on the SACSB) and bus tie (L4 on the
SACSB) are tripped.
Figure 5 Load Bank
All loads are contactor controlled using either LabVIEW or the touch panel where load steps can be
programmed.
Provision has also been made for a future 11kW 3 phase motor load with cabling and isolator installed in
the store.
Environmental Chamber An insulated chamber provides a facility for the testing the effects of temperature and humidity on
system components. The chamber is approximately 4.5m×3m×3m and can provide a temperature range
of -5°C to 65°C and humidity up to 99%. The Environmental Chamber control panel communicates
directly with the LabVIEW server via RS485.
The Environmental Chamber does not form part of the “Small Electrical Distribution System” and
therefore was not covered in detail in this project.

17
Figure 6 Environmental Chamber control panel
Solar Array Simulator A 25 kW PV array simulator was obtained by RISE to simulate solar panels of different types and power
ratings. The simulator is capable of producing an open circuit voltage of 750V DC and a short circuit
current of up to 40A. Power for the simulator is provided by a 70 kW motor generator set located in the
Generator Room. The simulator allowed for the testing of various grid connected inverters in a
controlled setting.
Once again the solar array simulator does not form part of the “Small Electrical Distribution System” and
therefore was not covered in detail in this project.
Motor Generator Set Located in the Generator Room is a 70 kW ABB motor generator set which supplies the solar array
simulator via the Simulator Output Panel located in the Main test Area. The set is capable of delivering
800V DC at 88A.
While not part of the “Small Electrical Distribution System”, the annual maintenance routine was carried
out and the unit was operated to confirm its serviceability.

18
Figure 7 Motor Generator Set
Main Inverter Integral to the system was a 20kVA, 120V DC, 240V AC Advanced Energy System Inverter for the purpose
of simulation research. The inverter was connected to the Large DC bus, both generator supplies (Diesel
Generator Set and the Temporary Generator Connection) and the Load Bank.
The inverter has since been removed and all associated cables have been disconnected.
Battery Banks Located in the battery room were 2 flexible battery banks. One 24V to 48V DC bank for the Small DC
system and one 120V to 240V DC bank for the Large DC system.
The Large System battery bank consisted of 2 strings of 60 2Volt 500Amp/hour lead acid batteries in
series, able to be configured to provide either 120V DC or 240V DC (series or parallel connection).
The Small System battery bank consisted of 2 strings of 12 2Volt 500Amp/hour lead acid batteries in
series, able to be configured to provide either 24V DC or 48V DC (series or parallel connection).
Both of these battery banks have since been removed from the facility.
Solar Array Connection
Located in the Main Test Area are the Solar Array Switch Panel and Grid Connection Switch Box. These
are provided so power from the Real PV Array can be sent to up to 4 different inverters, via the Solar
Array Switch Panel, and then sent to the Grid Connection Circuit Breaker via the Grid Connection Switch
Box. The Grid Connection Switch Box enables one single phase inverter to be connected to each phase,
even though the solar array connection can accommodate up to 4 inverters.
A block diagram of the Solar Array Connection is in Appendix I.
Control System A LabVIEW Supervisory Control and Data Acquisition (SCADA) system is provided in the laboratory to
monitor and control aspects of the facility. The National Instruments LabVIEW system in the form of
standard software packages on a PC communicates to the PLC, remote switchboards, power monitors,
environmental chamber, solar array simulator and previously the main test inverter.

19
The system also uses an Allen-Bradley SLC5 programmable logic controller (PLC’s) and remote I/O in the
switchboards for the collection of Powermonitor data, circuit breaker and contactor control, interlocks
and status reporting to the LabVIEW system.
The main PLC is located in the Main AC Switchboard (MACSB). A remote I/O (RIO) network connects the
PLC to the 5 Powermonitors in the MACSB and to the remote PLC racks in the Main DC Switchboard
(MDCSB) and Small AC Switchboard (SACSB).
The RIO network allows a collection of extensive Powermonitor data which is stored in the PLC for use
by LabVIEW. The 5 motorised circuit breakers are monitored and controlled via the 5 Powermonitors.
The remainder of the status and control points on the MACSB are connected to digital I/O cards in the
PLC rack. The Load Bank temperature is the only analogue point currently connected to the main PLC
rack.
The MDCSB PLC rack has a thermocouple input module for monitoring battery temperature and 2
analogue input modules for DC voltages and currents. It also has digital input and output modules for
status and control.
The SACSB has only digital I/O for status and control. The 2 Crompton Integra Power Monitors in the
SACSB are connected direct to the LabVIEW server via an RS485 link.
Powermonitor
The MACSB includes 5 Allen-Bradley Bulletin 1403 Powermonitor II devices each with their own display
module. The Powermonitor is a microprocessor based monitoring and control device that uses voltage,
current and status inputs and relay connections for monitoring and control. The display module is an
input/output device that communicates with the Powermonitor via a serial fibre optic link.
Figure 8 Allen-Bradley Powermonitor. The Real PV Array is providing 1 amp on L1
All power monitors communicate to the PLC via the RIO network.
Each Powermonitor records a vast amount of data. Below is a complete list of the real time metering
measurements:

20
Current in Amps (per phase and neutral)
Average current in Amps
Positive sequence current in Amps
Negative sequence current in Amps
Percent current unbalance
Voltage in Volts (per phase Line-Line, and Line-Neutral on 4 wire systems)
Average voltage in Volts (per phase Line-Line, and Line-Neutral on 4 wire systems)
VAUX (Auxiliary voltage input)
Positive sequence voltage in Volts
Negative sequence voltage in Volts
Percent voltage unbalance
Frequency in Hertz
Phase rotation (ABC, ACB)
Watts (total and per phase on 4 wire systems)
VAr (total and per phase on 4 wire systems)
VA (total and per phase on 4 wire systems)
True power factor (total and per phase on 4 wire systems)
Displacement power factor (total and per phase on 4 wire systems)
Distortion power factor (total and per phase on 4 wire systems)
Power consumption in kW Hours (forward, reverse and net)
Reactive power consumption (forward, reverse and net)
Demand (Amps, Watts, VAr and VA)
Instantaneous demand (Amps, Watts, VAr and VA)
First order projected demand (Amps, Watts, VAr and VA)
Second order projected demand (Amps, Watts, VAr and VA)
Below is a complete list of the real time harmonic analysis (currents and voltages 4 wire system)
Percent distortion up to the 41st harmonic
IEEE percent total harmonic distortion
IEC percent total harmonic distortion
IEEE-519 compliance (Recommended Practices and Requirements for Harmonic Control in
Electrical Power Systems)
Telephone interference factor
Crest factor
K-factor
Setting up the PLC to operate the Real PV Array
Located in the Test Area on the west wall is the Grid Connection Switch Box, which allows up to 4
inverters to connected (only 1 per phase) to the Grid Connection circuit breaker and therefore enable
the export of power through the Grid Connection circuit breaker.

21
The input from each inverter to the Grid Connection Switch Box is protected by a fuse connected in
series with a Miniature Circuit Breaker (MCB), with each MCB having an under voltage shunt coil
attached. The 240V AC for each under voltage shunt coil is supplied from a relay output module in the
remote PLC rack located in the SACSB; slot 3 output number 14 (O:1.11/14).
This output has not yet been entered into the version of the PLC program that we are using so cannot
be operated from the ladder diagram. To activate O:1.11/14 we must force this output on. This can be
achieved by following the steps below:
1. Once in the RS Logix program, ensure that the PLC is “online” and the green “RUN” or “REMOTE
RUN” is visible
Figure 9 Ensure PLC is online
2. In the tree on the left hand side of the window open the “Project” folder then open the “Force
Files” folder
Figure 10 Open the Force Files folder

22
3. Open “O0 – OUTPUT” by double clicking it. The output forces window should appear
Figure 11 OUTPUT forces window
4. Ensure the radix is set to binary. The output that is required to be forced on is O:1.11/14, which
will appear as O:1/190, but located under Offset 14
Figure 12 Note how O:1/190 correlates to O:1.11/14

23
5. Right click on O:1/190 and select “Force On”
Figure 13 Select Force On - O:1/190
6. Select the “Enable button” then select “Yes”
Figure 14 Selecting Yes will enable the force

24
7. Check that the green “Force Installed” and yellow “Force Enabled” are displayed in the top
ribbon
Figure 15 If Forces Enabled is displayed then outputs are forced
8. Output 14 of the relay output module is now forced on
This method is also applicable to any other force that may be required.

25
Chapter 3
Major works conducted
Diesel Generator Initial inspection of the Energy & Engineering Laboratory found the diesel generator located in the
Generator Room to be in an un-serviceable condition. The main cables from the generator terminal box
had been removed and the alternator separated from the diesel engine, with the alternator in a state of
partial disassembly. The generator fuel tank and associated fuel lines had also been removed and their
locations unknown.
An insulation test of the stator windings was carried out between each winging, and between each
winding and earth. This test showed that there was a dead short between several of the windings and
that the machine would need to be rewound. Visual inspection of the stator windings showed that some
had been affected by heat. Test results can be found in appendix E.
Contact with personal associated with the former RISE facility revealed that the alternator had been
unserviceable for at least 4 years and that the diesel generator was not used for a period of time before
that as it provided a supply that was unsuitable for their requirements. Power required for the testing of
equipment was provided from a California Instruments MX45 Power Supply instead.
Approval was given to have the alternator repaired and returned to working condition. The alternator
was delivered to Global Rewinds Pty/Ltd of Bibra Lake for inspection. This inspection confirmed that the
alternator stator required rewinding and the entire unit would be re-built. Included in the rebuild in
addition to the re-wind was:
rotor and exciter cleaned, baked and varnished
main bearing replaced
reassemble and re-paint
It was decided that Global Rewinds would reinstall the alternator as it would then be covered by their 12
month warranty.

26
Figure 16 Diesel Generator with rewound alternator installed
Fuel tank
The original design of the diesel generator included a wall mounted generator fuel tank that was located
in the store room adjacent to the generator room.
The initial inspection of the facility revealed that the fuel tank and associated fuel lines had been
removed. Contact with present and former Murdoch staff or personal associated with the former RISE
facility failed to either reveal the whereabouts of the tank or ascertain why it was removed.
Manufacturers of fuel tanks in the Perth area deal mainly in tanks with a capacity of tens of thousands of
litres or more. A tank of less than 1000 litres would have easily satisfied the requirements of the
Engineering and Energy Laboratory. A tank less than 100 litres would be ideal as the tank would then be
portable and small enough to be taken to a service station for refilling.
A suggestion that a plastic fuel tank designed for use with an outboard boat motor be used. Diesel
engines require a fuel supply line and a fuel return line which an outboard motor does not require;
therefore the plastic outboard tank would need to be modified to accommodate the fuel return line.
Approximately 80% of the fuel supplied to the diesel is returned to the tank. Also the manufacturers of
the majority of plastic outboard fuel tanks state that they are not suitable for diesel use.
Also available for marine use are stainless steel “drop-in” type tanks, ranging in sizes from 23 litres up
complete with handles and a fuel supply connection. As the fuel being returned to the tank is not under
significant pressure a tank of this style would be easily modified to suit our requirements.
A 60 litre stainless steel fuel tank was obtained from Whitworth Marine of Mosman Park. Alterations
had to be made to the tank for the inclusion of a fuel return line. A ¼inch brass fitting has been fitted to
the top of the tank to accommodate the fuel return line. The fuel tank is mounted in the Generator
Room on the east wall at a height of approximately 1000mm; this allows for a partial head pressure but
is not so high as to hinder the fuel returning to the tank.

27
A ¼inch hard drawn copper pipe has been used for the fuel supply line. A 300mm section of flexible
rubber hose has been included to allow for movement between the generator and skid. A 5/8inch hard
drawn copper pipe has been used for the fuel return line, also with a 300mm section of flexible rubber
hose.
The fuel consumption of the diesel generator when operating at 50% of prime power is 3.5litres/hour. A
sixty litre tank therefore offers at least 15 hours use if operating at 50%. 75% of prime power offers at
least 10 hours of use.

28
Chapter 4
Small Electrical Distribution System As per the main goal of the project, a LabVIEW program has been developed to monitor and record the
various parameters of the Small Electrical Distribution System. Attached in appendix G is the simplified
block diagram of the MACSB. From this we can see how the MACSB needs to be configured for correct
operation. The LabVIEW program that monitors and controls the Small Electrical Distribution System
includes indicators to show the correct configuration of the appropriate circuit breakers and switches.
This is a guide only, there are no pre-requisite required to operate the Small Electrical Distribution
System.
Below is a list of how the circuit breakers and switches should be set for power to be supplied to the
Load Bank from the diesel generator:
Check Generator 1 Wind Source tie (L6) is closed
Check Wind Source Load tie (L8) is closed
Check Load Chassis Isolator (L13) is closed
Inside panel 2F-19 Load Chassis check all miniature circuit breakers are on
Check Generator 1 circuit breaker (L5) is closed**
Check Generator 2 Inverter Select switch (L1) is set to 0 (off)*
Check Generator 2 circuit breaker (L2) is open*
Check Generator 1 – Generator 2 Tie (L3)is open*
Check Generator 1 Inverter Select switch (L4) is set to 0 (off)*
Check Wind Source circuit breaker (L7) is open*
Check Inverter 1 Output (L9) is open*
Check Inverter 2 Output (L10) is open*
Check Temporary Load circuit breaker (L12) is open*
*It is not important for items marked thus to be set as described. This is only a recommendation as it provides “double isolation” and reduces
the risk of electric shock.
**Before starting the diesel generator; Generator 1 circuit breaker should be open. This is to prevent the generator from being started under
load. The LabVIEW program requires that Generator 1 circuit breaker is open before the diesel generator can be started.
It should be noted that the generator is a 22kW unit. It is possible to place a 28kW load on the load
bank. Care must be taken not to overload the generator. The generator is protected by a 40A MCB in the
generator control box.

29
Figure 17 Power flow for the Small Electrical Distribution System
Program The LabVIEW program that has been developed to control and monitor the Small Electrical Distribution
System is designed to indicate the status of major components of the system, control of the load applied
to the generator and provide data displays and record for some of the more important and interesting
electrical parameters.
Generator
Starting and stopping the generator is achieved via the Start/Stop Generator push button in the
generator section of the front panel. This push button via the global variables controls digital output
O:5.0/12, which in turn activates the generator start relay and generator run relay in junction box JB-
GEN-M. Generator 1 circuit breaker L5 must be open prior to starting the generator. This is to prevent
the generator from being started under load.
Switchboard
Indication of the setup of the MACSB for correct operation is via the LEDs in the “Setup” section of the
front panel. The switchboard is set up correctly when all LED indicators are lit. It is not a pre-requisite to
have the switchboard correctly configured prior to operating the load bank, however power may not get
from load to source if it is not the case. Remember that Generator 1 circuit breaker must be open prior
to starting.
For correct switchboard configuration LED indicators are provided for the status of the:
Generator 1 circuit breaker L5
Generator 1 Wind Source Tie L6
Wind Source Load Tie L8
Load Chassis isolator L13
Remember it is not imperative that the remainder of the circuit breakers and switches be open; this is
only for the purposes of double isolation.
Load bank
Operation of the load bank is carried out from the “Load Bank” section of the front panel (see figure 16).
This section can be separated into 4 groups; small resistive loads, small reactive loads, 3 phase loads and
load indicators:

30
1. Small resistive loads.
Small resistive loads can be placed on to the generator in 150 watt increments from 150
watts up to 2250 watts per phase. They can be operated in 2 ways. By selecting the
Individual/All push button to ALL, loads can be set from the All Resistive control. This will
place the same load setting on each phase. By selecting IND. (Individual), different resistive
loads can be set on each phase from the L1 Resistive, L2 Resistive and L3 Resistive controls.
L1 resistive loads are controlled by data file N16:0 (L1 Resistive Loads). N16:0 writes to
data file N17:0 (L1 Resistive Load) which in turn controls the load contactors. An example
of how the loads for L1 are co-ordinated is given in the appendix.
L2 resistive loads are controlled by data files N16:2 and N17:2.
L3 resistive loads are controlled by data files N16:4 and N17:4.
When the “ALL” option has been selected, the input is written to N16:0, N16:2 and N16:4
simultaneously in the LabVIEW program.
2. Small reactive loads.
Small reactive loads are operated the same way as the resistive loads. They can be placed
on to the generator in 150 VAr increments from 150 VAr to 2250 VArs. They too can be
operated in 2 ways. By selecting the Individual/All push button to ALL, loads can be set
from the All Reactive control. This will place the same reactive load setting on each phase.
By selecting IND. (Individual), different reactive loads can be set on each phase from the L1
Reactive, L2 Reactive and L3 Reactive controls.
Operation of the reactive loads is identical to that of the resistive loads.
L1 reactive loads are controlled by data files N16:1 and N17:1.
L2 reactive loads are controlled by data files N16:3 and N17:3.
L3 reactive loads are controlled by data files N16:5 and N17:5.
3. 3 phase loads.
2 controls operate the 3 phase contactors which control the 2400 and 4800 watt resistive
loads and the 2400 and 4800 VAr reactive loads. The control labelled 3 Phase Resistive
operates the resistive loads and the control labelled 3 Phase Reactive controls the reactive
loads. They can both be set to either 0, 2400 or 4800 watts/VArs.
The 3 phase loads are controlled directly from data file N17 (not via N16 as described
above).
Data bits N17:0/4 and N17:0/5 control the 2400W and 4800W 3 phase loads respectively.
Therefore a decimal value of 16 has to be entered into N17:0 to operate the 2400W load
and a decimal value 32 has to be entered to operate the 4800W load.
Data bits N17:1/4 and N17:1/5 control the 2400VAr and 4800VAr 3 phase loads
respectively. Operation is exactly the same as for the resistive loads.
It is not possible to operate the single phase loads from data file N17.

31
4. Load Indicators.
Indicators show the load placed on each phase in Watts and in VAr. The total load in Watts
and VAr is also shown (remember that adding the power of each phase gives the total
power).
The Load Indicators receive their information from data file N:18. N:18 is used in the PLC
program to deliver the load information to the Panelview display.
It is recommended that those not familiar with operating electrical systems operate the load
bank in “All” mode (all 3 phases change together). When operating a 3 phase generator loads
should be distributed evenly over all 3 phases to limit voltage imbalance.
Displays
Various parameters are able to be monitored and recorded from the front panel of the LabVIEW
program. It has been designed so that when various loads, both resistive and reactive, that are placed
on the generator, the operator can observe the parameters in real time and compare these values to
theoretical calculations.
As a lot of information is available on the front panel, numerical displays were chosen over “gauge” type
indicators as they physically take up less space.
Figure 18 Front Panel of the Small Distribution System
Parameters that can be observed are:
Volts
Voltages are displayed for all phases line to line and line to neutral. As part of the
Powermonitors “basic” parameter data monitoring, each line voltage and phase voltage is
measured. A single voltage measurement consists of 2 parts, the integer and the exponent. For
example the voltage between L1 and L2 consists of N220:21 (Load PM L1 to L2 Voltage –

32
Integer) and N220:22 (Load PM L1 to L2 Voltage – Exponent). These two voltage values are then
used in LabVIEW and the actual voltage displayed on the front panel as follows:
Figure 19 Voltage block diagram showing the integer and exponent
The LabVIEW program allows the operator to view each voltage on the Front Panel as a
numerical display.
All current data is part of data file N220 “VOLTAGE/CURRENT DATA – READ
Current
Current measurements for all 3 phases (line current) and neutral current are displayed next to
the voltage displays. Just like the voltage measurements described above, the line current for
each phase and neutral are displayed on the front panel as a numerical value. Also as for the
voltage data, they consist of an integer and exponent part. The neutral current is included so
the operator can see what occurs when an unbalanced load is placed on the alternator.
All current data is part of data file N220 “VOLTAGE/CURRENT DATA – READ.
Power
Below the voltage and current section are the displays for real power, reactive power and
apparent power in the power section. Numerical displays show real, reactive and apparent
power for each phase. Total values for real, reactive and apparent power are also available on
the Front Panel. The application for each display is the same as for voltage.
The power data is part of data file N221 “REAL TIME POWER DATA – READ”
Power factor
Power factor is a ratio of Watts to VA. Power factor should be maintained at or as close to unity
as possible. The power factor information from the Powermonitor is available for each phase
and total power factor. The power factor displayed on the front panel is the “true power factor”
of the system, the where the apparent power includes all the harmonics of the system. The
Powermonitor also measures and records the “displacement power factor”, which is the
difference in phase between current and voltage but is not used in this program.
The power factor data is part of data file N221 “REAL TIME POWER DATA – READ”
Frequency
Frequency is related directly to the speed of the prime mover, in this case the diesel engine. The
formula for generator speed is:
Where is the speed of the diesel (nominally 1500)
is the frequency (in Hertz)
is the number of poles (in this case it is a 4 pole machine)
is a constant

33
The diesel generator is designed to operate at 50Hz, so by observing the frequency one can
ascertain the speed of the prime mover. By placing more load on the generator the prime
mover has to work harder to maintain a constant 1500 rpm, and therefore a constant 50Hz
frequency. If the frequency is noticed to drop off at high loads then the diesel may be struggling
to maintain speed.
There is no under frequency protection incorporated into the motorized circuit breakers on the
MACSB so care must be taken not to overload the prime mover. There is a suggestion in chapter
7 Future works regarding this.
The frequency data is part of data file N220 “VOLTAGE/CURRENT DATA – READ”
Setting up RS Logix to read from the Powermonitors As stated in the section on Powermonitors’, each Powermonitor has the ability to monitor a large
amount of information. Such an amount of information is too large for the LabVIEW sever and the PLC
program to deal with all at once. Therefore the operator must select which parameters are to be read
from the Powermonitor by the PLC. Once the required data files are read by the PLC they may be utilized
in LabVIEW.
As mentioned previously, the Powermonitors can monitor and record harmonic distortion and
magnitude up to the 41st harmonic. Using the Grid Connection Powermonitor as an example, below is a
list of the data files that provide “general information” data that is useful to us at this stage:
N200 VOLTAGE/CURRENT DATA – READ (Includes frequency).
N201 REAL TIME POWER DATA – READ (includes power factor).
N202 CUMULATIVE POWER DATA – READ.
The next 13 data files contain information regarding mostly harmonics, as well as a few write files. A full
list of files regarding the Grid Connection Power Monitor is available in Rockwell Logix under the
Address/Symbol file. The same data is available for the other 4 Powermonitors.
34
Figure 20 A full list of files is available under Address/Symbol
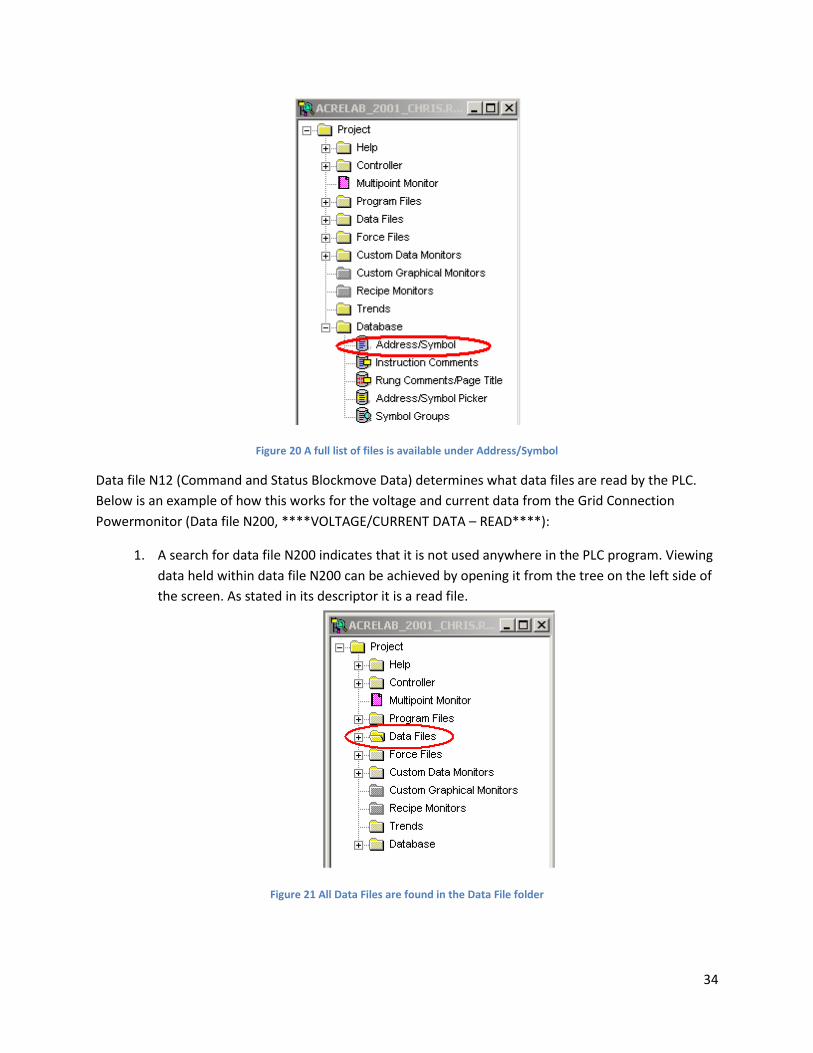
Data file N12 (Command and Status Blockmove Data) determines what data files are read by the PLC.
Below is an example of how this works for the voltage and current data from the Grid Connection
Powermonitor (Data file N200, ****VOLTAGE/CURRENT DATA – READ****):
1. A search for data file N200 indicates that it is not used anywhere in the PLC program. Viewing
data held within data file N200 can be achieved by opening it from the tree on the left side of
the screen. As stated in its descriptor it is a read file.
Figure 21 All Data Files are found in the Data File folder

35
Figure 22 Data File N200. Highlighted are the integer and exponent for current L1. It is showing 10.18 amps
2. The required information can be read from data file N100 (Grid PM Voltage/Current Block
transfer Control Bit). Note that N100 correlates with N200. N101 with N201 and so forth.
Figure 23 Data File N100 correlates with Data File N200

36
3. Information read by the PLC is determined by which Block Transfer Control Bit is entered into
data file N12 (Command and Status Blockmove Data). Note that only 10 data files can be
entered into N12 which limits the amount of data that we can read. Changing Block Transfer
Control Bits can be done “on the fly.”
Figure 24 N100 is one of the 10 files to be read

37
4. The data file to be read is then selected by the Command & Status Blockmove Sequencer. The
Command & Status Blockmove Sequencer selects a file, (1 of 10 from N12), and then adds it
to data file N10 (Initialize Sequencer Input File).
Figure 25 Ladder rung 0006 Command & Status Blockmove Sequencer. Data File N101 is currently being read
5. The Main Block Transfer Sequencer now updates data file N9 (Initialize Sequencer Address),
taken from N10. N9 is updated whenever the previous block transfer (in this case N100) is
complete, and then moves on to the next block transfer as directed by the Command & Status
Blockmove Sequencer.
Figure 26 Main block transfer sequencer

38
6. When N9 has selected N100 to read, it performs a bit transfer read (BTR). The data from N100
is then stored in Memory Block M0. This action occurs in subroutine U3. The data is now
available to be collected by programs such as LabVIEW.
Figure 27 Voltage/current bit transfer read. When source A equals 100 data from N100 is transferred to M0
Information can also be written to the Powermonitors in a similar way but has not been conducted in
this project.
Simplified version of the Small Electrical Distribution System The amount of data that is present on the Front Panel of the Small Electrical Distribution System vi. may
seem confusing to some people. Therefore a simpler version of the program was developed particularly
for people who are not familiar with the facility or the operation of generators.
The simplified version program has been adapted from the original program, with most of the functions
removed and easier to view “gauge” type indicators used. The main differences from the original
program are:
The load bank can only be operated in “ALL” mode, i.e. the load on each phase will be the
same. This is to allow for simpler operation of the system
The average current of all 3 phases is used instead of line current. The neutral current has
been removed.
Average line voltage for all three phases only. Phase voltage is not included
Total real, reactive and apparent power only
Total power factor only
The front panel of the simplified version of the program is shown below

39
Figure 28 Front Panel Simplified Small Distribution System

40
Chapter 5
Real PV array A LabVIEW program has been developed so that a number of variables can be displayed and recorded
from the Grid Connection Powermonitor. This “sub-project” was discussed in the progress report as an
aside to the main project in the event that there were delays in the diesel generator being completed on
time. The Real PV Array program was developed while waiting for the alternator to be returned and also
out of curiosity.
The Real PV Array program measures and records the voltage, current, real time real power and net real
power. The program is configured to monitor only the voltage and current for phase L1 since the grid
connect inverter is a single phase inverter and is currently configured to operate on L1. The real time
real power and net real power are the total values for all 3 phases (even though L2 and L3 have no
current flow). The Real PV Array is exporting power to the grid, and therefore is displayed on the
Powermonitor as a negative value. For the purpose of clarity power values on the LabVIEW program are
negated so they are shown as positive values.
The front panel of the LabVIEW program displays the real time voltage, current and real power on both
analogue and digital displays. The real time current is also shown on a Waveform Chart so one has a
visual representation of how the current varies over a period of time, for example a 12 hour period. The
net energy exported is shown as a digital display only.
Included in the Real PV Array LabVIEW program is an option to export data to a spreadsheet of your
choice. This allows for data to be collected over an extended period of time. The frequency of the data
collection is user chosen from a control on the front panel. A graph of real power being exported over
an entire day is available in appendix J.

41
Figure 29 Front Panel Real PV array. Note the affect of a cloudy day
Setting up the Real PV Array to export power Above is a simplified block diagram of how to configure the system to export power from the Real PV
Array to the grid via the Grid Connection circuit breaker. Presently only the Sunnyboy inverter (red
inverter located on the west wall of the Main Test Area) is connected to the Real PV Array for use. This
procedure is for configuring the system to export power on L1 phase only. Other configurations can be
used after knowledge of the system has been gained.
1. Ensure that no emergency stops are activated and that PLC comms are healthy
2. Check that output 14 of the Relay Output Card located in slot 3 of the SACSB RIO rack is on. This
provides 240V AC to the under-voltage release coils for circuit breakers CB1, CB2, CB3 and CB4
located in the Grid Connection Switch Box (procedure for this is in the section on “Setting up
the PLC to operate the Real PV Array”)
3. Inside the Grid Connection Switch Box (located on the west wall of the Main Test area) switch
CB2 to on, the Sunnyboy inverter feeds into this circuit breaker. All other circuit breakers can
remain off

42
4. On the front panel of the Grid Connection Switch Box set switch 2 (S2) to L1. All other switches
can remain off (this is the selector switch for the Sunnyboy inverter to the Grid Connection
circuit breaker)
5. On the Solar Array Outlet Panel (the panel to the left of the Grid Connection Switch Box) located
on the west wall of the Main Test Area, set circuit breaker CB-C2 (second from right labelled PV
Array 3 Main Switch) to on. All other circuit breakers can remain off
6. Located on the roof of the Energy and Engineering Lab is the Solar Array Patch Panel. Beneath
the Solar Array Patch Panel are 2 extensions. On the right hand side extension set circuit
breaker C2 (second from right) to on. All other circuit breakers can remain off
7. On the MACSB close the Grid Connection Circuit Breaker (L14). This can be done either from the
Panelview unit (Main AC Switchboard screen) or manually from the circuit breaker itself.
8. Power should now be exported to the grid. This can be confirmed by observing the current L1
on the Grid Connection Powermonitor.
Note: The configuration of the PV panels or the Solar Array Patch Panel has not been addressed in this
report. Before any changes are made a good understanding of PV arrays is required and the operating
manuals for the Solar Array Patch Panel should be consulted.
Fieldpoint device As well as the data from the Grid Connection Powermonitor, additional data regarding the current
weather conditions would complement the Real PV Array LabVIEW program perfectly.
Located in the Solar Array Patch Panel (on the roof of the building) is a National Instruments FP1001
device for the purpose of collecting data regarding the status of the Real PV Array and current weather
conditions. Connected to this device are 2 FP AI-110 analogue input modules and 1 FP TC-120
thermocouple input module.
This system allows for the monitoring of a range of Real PV Array data:
AI-110
Solar radiation
Relative humidity
Ambient temperature
Wind direction
Wind speed
Voltage for each block of panels
Current for each block of panels
TC-120
2 thermocouples per block of panels

43
These parameters combined with the LabVIEW program already created for the monitoring of data
from the Grid Connection Powermonitor would provide excellent data on the performance of the Real
PV Array for various weather conditions.

44
Chapter 6
Issues
Analogue Input card Early in the project it was noticed that a fault had occurred with a 1746-NI8 type 8 channel analogue
input card in the remote I/O rack located in the MDCSB. If a fault is detected in an I/O rack then the red
“fault” LED is illuminated and a fault code is displayed on the Status Display of the Remote I/O Adapter
Module. The fault code in this case was “E58 L02” indicating a generic “I/O Module Fault”(E58) in slot
number 2 (L02).
Under this condition the “DC comms healthy” (memory bit B3:99/8) is not energized resulting in the
“Common Emergency Stop” (output O:6.0/7) output being de-energized. This output provides 240V AC
to all circuit breakers with an under-voltage release coil. This includes motorized circuit breakers,
manual circuit breaker for the Load Chassis (L13) and the ACRE Lab Sub Board main circuit breaker. To
overcome this, a force can be applied to the Common Emergency Stop so these circuit breakers can be
operated. This is defiantly not good practice as it renders the emergency stop safety system for the
switchboards and all 3 phase socket outlets inoperable (note that the 3 phase socket outlets installed in
the Energy and Engineering Laboratory are NOT protected by an Earth Leakage Circuit Breaker).
Figure 30 Emergency Stop
Slot 3 of the I/O rack also contains a 1746-NI8 analogue input card identical to the faulty card located in
slot 2. After isolating control power to the MDCSB the cards in slots 2 and 3 were interchanged. With the
power de-isolated the fault had moved to slot number 3 confirming that the card was indeed faulty and
not the back plane or Remote I/O Adapter Module.
The power was again isolated and the faulty card removed from the remote I/O rack. When the power
was de-isolated, the Remote I/O Adapter Module displayed fault code C52 (I/O module missing from the
previously saved configuration) and the problem with the “DC comms healthy” remained. It was
considered that the slot that was left vacant be disabled and the inputs and outputs associated with the
card left un-monitored. Disabling the slot is not a straight forward process however and in-depth
software changes are required. A substantial amount of time would be required to study the manuals
before performing such a task. Telephone conversations with Rockwell Software support staff confirmed
this view.
Replacing the faulty card with another card that is similar (1746-NI4 4 channel analogue input card) was
tried with the Remote I/O Adapter Module recognizing the card in slot 3 not the card saved in the

45
configuration (fault code C54). As before, re-configuring the PLC to recognize the different module is not
a simple process and significant amounts of time would be required to perform such a function.
Telephone conversations with the technical support staff at Rockwell Software advised that the faulty
card be replaced with a like card, or that significant software changes would otherwise be required.
A 1746-NI8 card was sourced from a supplier in America; the system restarted and is now operating
correctly.
It should be noted that the problem of complex software changes when re-configuring for a different
card or disabling a slot only applies to the remote I/O racks and NOT the main CPU.
Power monitor Each Powermonitor is equipped with 2 LED’s labelled “Power” and “OK”. The power LED is illuminated
when the device sufficient power is applied to the device, 240V AC via the Power L/+ and N/- terminals.
When the device is initially powered up or the power to the device has been cycled the “OK” LED should
flash indicating that it is conducting a self test. If the “OK” LED remains illuminated then the device has
passed the self test and is operating correctly.
The “OK” LED for the Grid Connection Circuit Breaker Powermonitor did not remain illuminated when
the power was cycled, indicating that a fault had developed in the unit. When the Powermonitor
develops a fault no information is passed to or is displayed on the Display Module. The grid Connect
Circuit breaker was not able to be operated from a remote position (Panelview or the LabVIEW server),
nor was the status of the circuit breaker (open/closed, auto/manual) displayed on the Panelview.
This issue would have impacted on the section of the project concerning the Real PV Array, where the
PV array would export power back into the grid and data such as power consumption and current would
not be able to be collected and recorded.
The power to the device was cycled several times with the “OK” LED failing to remain illuminated.
Replacing the Powermonitor unit with a power monitor from another part of the switchboard that
would not be used in the foreseeable future was another option.
Each Powermonitor has a Smart Communications Card attached to it (Cat No. 1403-NSC) that allows
communications with the RIO system. Each communications card is configured to its specific location, so
the card would be removed from the Powermonitor and its location not changed when the
Powermonitors are changed.
If one of the other 4 Powermonitors is disconnected from the RIO system, then the Grid Connection
Powermonitor functions correctly. The Generator 2 Powermonitor is currently disconnected as it is
presently unused. It has not yet been discovered what is causing this fault.

46
Chapter 7
Future Work The Engineering and Energy Lab is a substantial facility and incorporates a number of systems, some of
which have not even been considered during this project. The systems that have been concentrated on
can still be improved and expanded.
LabVIEW Server The PC that is operating as the LabVIEW server requires a serial RS-485 communications card so that it
can communicate with some of the peripheral equipment within the lab. This card will be required if the
Fieldpoint device for the Real PV Array is to be utilised. The card will also be required for the PV array
simulator, the Crompton Integra power monitors in the SACSB and the environmental chamber.
At the time of writing a card had been ordered and is awaiting installation.
LabVIEW
Mechanism to prevent phase unbalance.
To prevent personnel from placing a load on the generator that is too out of balance, a mechanism
should be incorporated into the Load Bank controls. A maximum percentage level could be set (50%
phase unbalance for example) and if a load is configured that is greater than this then the operation
should not be carried out.
Mechanism to prevent generator overcurrent.
The motorized circuit breakers on the MACSB are set to 63 amps; the generator circuit breaker located
in the Generator Control Box is a 40 amp C curve MCB (miniature circuit breaker). This offers adequate
protection to the alternator which is rated to 83 amps at 0.8 power factor. A mechanism to prevent the
generator from delivering no greater than 40 amps incorporated into LabVIEW would provide further
protection as a C curve MCB has a mean tripping current of 7.5 amps.
Additional protection
The circuit breakers on the MACSB do not protect against conditions such as under frequency (which
can be caused by generator overload), over frequency (caused by generator over speed) or under
voltage and over voltage. If these conditions do occur then a facility for opening Generator 1 circuit
breaker and shutting down the generator in LabVIEW could prevent any damage to the diesel and
alternator from occurring.
Fuel Tank Level Monitor Currently there is no facility for remote level indication of the generator fuel tank. At the moment this
must be done by physically checking the level of the tank.
It is important that the diesel engine does not run out of fuel. Diesel is used to lubricate the internal
components of the fuel pump, governor and injectors and damage may occur if allowed to run dry.

47
A tank level indicator connected to one of the spare analogue inputs located in slot 2 of the MACSB
could be considered as a future project with a low level alarm when the fuel tank level reaches a
predetermined level. If the level reaches a second predetermined level, low low level, then Generator 1
circuit breaker would open and the generator shut down. There are no spare digital inputs available for
this so the same analogue input may have to be used.
There are spare cable cores available from the MACSB to JB-GEN-M. Cable IN-2 cores 1 and 2.
Figure 31 Drawing 0023E5-3 showing spare cable cores and inputs/outputs

48
Chapter 9
Power issues The current electrical layout of the Energy and Engineering Laboratory presents a number of shortfalls in
power supplies available, particularly 3 phase supplies.
3 phase laboratory power supplies
3 phase supplies presently available in the Main Laboratory and Test Area are fed from the ACRE Lab
Sub Board No.1 These socket outlets were originally for the use of testing equipment and are protected
by a shunt connected under-voltage relay operated by the emergency stop signal from the PLC (output
O:6.0/7 Common Emergency Stop).
The under voltage relay will activate when output O:6.0/7 is de-energized. This can happen when (but is
not limited to:)
Emergency stop button is activated on the MACSB, MDCSB or SACSB
Communications failure from the MDCSB or SACSB to the PLC
Loss of 240V AC control power to the MACSB, MDCSB or SACSB
When a new program is downloaded to PLC
Note: originally an Uninterruptible Power Supply supplied 240V control power to the 3 switchboards but
has since been removed. Control power is currently being fed from the Rise Building Main Switchboard
on a dedicated circuit.
Note: also see section Issues/Analogue Input Card regarding MDCSB communications failure.
If an activity is being carried out that requires a reliable 3 phase power supply, the current configuration
will not be acceptable. If the Lab is again used for testing and research purposes then removing the
under-voltage relay will not be an option as the socket outlets will not be protected by emergency stop.
Nor are any of the socket outlets protected by a residual current device (RCD).
It is desirable therefore in the future to have a number of 3 phase socket outlets that are separate from
the ACRE Lab Sub Board. Physically there is no available space on the chassis of the Rise Building Main
Switchboard but are a number of redundant circuits within the building.
Supplied from the Rise Building Main Switchboard RWB 13 is an 80A 3 phase supply which is terminated
in an 80A isolator located on the west wall of the Main Laboratory. This could in the future supply a
distribution board totally separate from the ACRE Lab Sub Board.
Prior to being occupied by RISE, the building was used as a workshop. Located on the second level
adjacent to the building main switchboard is a mechanical services switchboard. The original purpose of
this switchboard was the control of workshop equipment such as air compressors, extraction fans, filters
dryers etc. and therefore contains relays and other control equipment for their operation.

49
Currently this switchboard is being used as a “sub-board”, supplying power to equipment currently used
within the Energy & Engineering Lab. This equipment includes:
Load Bank cooling fan
Environmental Chamber control panel
Environmental Chamber air conditioning units
Hydrogen fuel cell test facility (de-commissioned)
As the building is no longer used as a workshop and most of the equipment supplied from it is now
redundant, redesigning this board could provide a further 160/200 amps 3 phase power via the
mechanical services CFS (combination fuse switch) located on the building main switchboard.
Electric car charging station
During the semester an electric vehicle charging station was installed on the south wall external to the
building. The charging station is fed from the ACRE Lab Sub Board and therefore will experience the
same issues as previously discussed, with the possibility of leaving a car uncharged.
Supplying the charging station from the future distribution board described in the section above would
alleviate this problem but ideally it should be fed from a supply that is separate from the Energy and
Engineering Laboratory.
Located on the Rise Building Main Switchboard is a redundant evaporative air conditioner circuit red 19.
This cable is terminated in the Main Laboratory area adjacent to the cassette unit.
The cable is unsuitable for the requirements of the electric vehicle charging station but the unused
circuit breaker in the Rise Building Main Switchboard can be used.
Other Systems to be Re-commissioned
There are some systems that were not looked at for this project that could be considered for future
work. The Environmental Chamber and Solar Array Patch Panel are 2 systems that are relatively intact
and it should be easy to ascertain if they are able to be returned to working condition.
The MDCSB has some major pieces of associated equipment removed such as the main test inverter and
battery banks and chargers. There is a supply from the real PV array that has been added but an inverter
is required before it can be connected to the MACSB and then the Load Bank.

50
Chapter 10
Conclusions The Energy and Engineering laboratory now has a number of systems in operating condition. The Real
PV Array is exporting power back into the grid and the diesel generator will hopefully soon be working
again. The MACSB and load bank can now be used for purposes that which they were designed. The
Main Laboratory Area received a bit of a tidy up as well. It is hoped that lab will be used in the future as
it provides an excellent opportunity to see real decent sized equipment being used for the purpose that
they were intended, and its operational data collected and analysed. There are aspects of the facility
that accommodate all the courses offered by the school from PV arrays to power generation and
distribution to computer and PLC control.
I consider the project to be successful in achieving the goals that were set, and I hope that the new
Engineering and Energy Lab will be used well into the future.
What did I achieve from this project Liaising with third parties.
This project allowed me the opportunity to make contact with a number of companies across a variety
of industries. This included obtaining quotes for the re-winding of the alternator and ultimately
organising the re-winding of the alternator, its delivery and its installation. The sourcing and purchase of
replacement Allen-Bradley components for the PLC system and the telephone conversations were held
with Rockwell Automation regarding the communications fault on the MDCSB. Investigating the
requirements of a new fuel tank for the diesel from tank manufacturers, sheet metal fabricators, original
equipment manufacturers and wholesalers; and the purchase of a fuel tank which required
modifications so that it could be used.
Project management.
This includes but is not limited to the co-ordination of the project with various vendors, and managing
the time so that the project can proceed in a logical sequence of stages.
Time co-ordination.
The project ran over the course of a standard semester of 4 months (29th July to 18th November). While
this appears to be a long time to complete the requirements of the project careful time management
was essential. This prevented the all too common rush at the end of semester to get everything
completed on time and ensured that components of the project were completed within time and in
order.
Familiarization with new equipment and developing skills with equipment previously used.

51
Prior to commencing this project I had no experience with Allen-Bradley hardware or its associated
Rockwell software. Consultation with the manuals available for Allen-Bradley equipment as well as a bit
of “trial and error” with the software soon allowed me to navigate quite freely through the ladder logic
diagram and manipulate the code where required. Using the functions within the software such as
accessing data files, force files, address/symbol databases and usage and property files. The installation
of the alternator allowed me to re-practice some electrical skills that I had not used for quite a few years
such as following electrical schematic diagrams and fault finding.

52
References
Bibliography Phase Engineers, Operation & Maintenance Manual Section 1.1 Overview.
Phase Engineers, Operation & Maintenance Manual Section 2.1 Panelview – PLC Interface.
Phase Engineers, Operation & Maintenance Manual Section 2.2 PLC Ladder Listing.
Phase Engineers, Operation & Maintenance Manual Section 2.4 PLC Address Database.
Nuova Saccardo Motori – Italy, NSM Three-Phase brushless synchronous generator.
Allen-Bradley Company, Inc, SLC 500 Analogue Input Module.
Allen-Bradley Company, Inc, SLC 5/04 Modular Processor.
Allen-Bradley Company, Inc, Remote I/O Scanner.
Allen-Bradley Company, Inc, Remote I/O Adapter Module.
Drawings Phase Engineers, Drawing No. 0100E2. Laboratory Services Layout. Revision 0 30/08/2004.
Phase Engineers, Drawing No. 0100E3. Laboratory General Purpose Power Layout. Revision 0 30/08/2004.
Phase Engineers, Drawing No. 0100E5. Rise Building Single Line Diagram. Revision 0 30/08/2004.
Phase Engineers, Drawing No. 0023E4. Master Control Schematic. Revision 3 30/06/2004.
Phase Engineers, Drawing No. 0023E5. Main AC Switchboard Schematic Diagram and Elevation. Revision 5
30/06/2004.
Phase Engineers, Drawing No. 0023E8-2. Field Termination Diagrams. Revision 0 30/06/2004.
Phase Engineers, Drawing No. 0078E21. PV Array System Instrumentation Wiring. Revision 0 30/06/2004.
Phase Engineers, Drawing No. 0078E22. PV Array System Instrumentation Wiring. Revision 0 30/06/2004.
Phase Engineers, Drawing No. 0078E26. PV Array System Solar Array Output Panel Wiring. Revision 0 30/06/2004.
Websites GE FANUC, Setting up DH+ Connection to a SLC 5/04 via Channel 1. Available: http://support.ge-ip.com
[Accessed 26 Sep. 2012].

53
Appendices
Appendix A. Main AC Switchboard Label Schedule Below is a list of the switches, circuit breakers and ties for the Main AC switchboard and their
nomenclature. Note that L11 is a Powermonitor only.
L1 Generator 2 Inverter Select Switch
L2 Generator 2 Motorized Circuit Breaker
L3 Generator 1 – Generator 2 Tie
L4 Generator 1 Inverter Select Switch
L5 Generator 1 Motorized Circuit Breaker
L6 Generator 1 – Wind Source Tie
L7 Wind Source Motorized Circuit Breaker
L8 Wind Source – Load Tie
L9 Inverter 1 Output Switch
L10 Inverter 2 Output Switch
L11 Load Metering Powermonitor
L12 Temporary Load Motorized Circuit Breaker
L13 Load bank Circuit Breaker
L14 Grid Connection Motorized Circuit Breaker

54
Appendix B. Main AC Cable Schedule Below is a list of the main power cables associated with the Main AC switchboard only (MAC stands for
Main AC). A full cable schedule for all power cables including DC cables, cross sectional area and number
of cores is available in the RISE lab operating manuals.
MAC 1 MACSB Generator 2 Load Selector Switch to Outlet P1
MAC 2 MACSB Generator 2 Load Selector Switch to Inverter 1
MAC 3 MACSB Generator 1 Load Selector Switch to Outlet P2
MAC 4 MACSB Generator 1 Load Selector Switch to Inverter 1
MAC 5 Inlet P3 to MACSB Inverter 2 Output Breaker
MAC 6 Inverter 1 to MACSB Inverter 1 Output Breaker
MAC 7 Inlet P4 to MACSB Grid Connection Circuit Breaker
MAC 8 Inlets P11A & P11B to MACSB Generator 2 Circuit Breaker
MAC 9 Generator 1 to MACSB Generator 1 Circuit Breaker
MAC 10 MACSB Temporary Load Breaker to Outlet P13
MAC 11 MACSB Load Chassis to Variable Load
MAC 12 NOT USED
MAC 13 MACSB Load Chassis to Load Bank 14.4kW Load
MAC 14 MACSB Load Chassis to Load Bank 14.4kVAr Load
MAC 15 MACSB Load Chassis to Load Bank 7.2kW Load
MAC 16 MACSB Load Chassis to Load Bank 7.2kVAr Load
MAC 17 MACSB Load Chassis to Load Bank 3×1.2kW Load
MAC 18 MACSB Load Chassis to Load Bank 3×1.2kW Load
MAC 19 MACSB Load Chassis to Load Bank 3×600W Load
MAC 20 MACSB Load Chassis to Load Bank 3×600VAr Load
MAC 21 MACSB Load Chassis to Load Bank 3×300W Load
MAC 22 MACSB Load Chassis to Load Bank 3×300VAr Load
MAC 23 MACSB Load Chassis to Load Bank 3×150W Load
MAC 24 MACSB Load Chassis to Load Bank 3×150VAr Load
MAC 25 RISE Building Main Switchboard to MACSB Grid Connection Circuit Breaker

55
Appendix C. Schedule of Socket Inlets/Outlets Below is a list of the socket inlets and outlets and their locations within the RISE building. This list is for
the Large and Small AC systems and DC system only and does not include generat purpose single and 3
phase socket outlets.
P1 Socket Outlet for Temporary Inverter. Located Test Area West Wall
P2 Socket Outlet for Temporary Inverter. Located Test Area West Wall
P3 Socket Inlet for Temporary Inverter. Located Test Area West Wall
P4 Socket Outlet for Temporary Inverter. Located Test Area West Wall
P5 Large Test Battery Connection. DC Isolator Located Test Area West Wall
P6 Large Test Inverter Connection. DC Isolator Located Test Area West Wall
P7 Socket Outlet Small Test Inverter Connection. Located on SACSB
P8 Socket Inlet Small Test Inverter Connection. Located on SACSB
P9 Small Test Battery Connection. DC Isolator Located Test Area West Wall
P10 Small Test Inverter Connection. DC Isolator Located Test Area West Wall
P11A Large Test Generator Connection. Located Generator Room North Wall
P11B Large Test Generator Connection. Located External of Generator Room
P12 Small Test Generator Connection. Located External of Generator Room
P13 Temporary Load Connection. Located South Wall Test Area. 2 Internal 1 External
The connection for the variable load is located in the store on the north wall. Presently it is a 55 amp
isolator. There is a socket outlet located on the east wall of the Main Laboratory Area labelled P17
capacitor load, for the purpose of connecting a capacitive load. This outlet is controlled by output
O:6.0/2.

56
Appendix D. Communications Cable Schedule Below is a list of the communications cables associated with the RISE facility. A full cable schedule
including type of cable, cross sectional area and number of cores is available in the RISE lab operating
manuals.
IN-1 Digital I/O JB-GEN-M to MACSB PLC
IN-2 Analogue I/O JB-GEN-M to MACSB PLC
IN-3 Analogue I/O JB-GEN-M to MACSB PLC
IN-4 Digital I/O JB-L to MACSB PLC
IN-5 Analogue I/O JB-L to MACSB PLC
IN-6 Digital I/O JB-GEN-S to SACSB PLC
IN-7 Analogue I/O JB-GEN-S to SACSB PLC
IN-8 Remote Start JB-GEN-M to Exhaust Fan
IN-9 Status MDCSB PLC to Large DC System battery breakers
IN-10 Status MDCSB PLC to Small DC System battery breakers
IN-11 Gen 1 control Main test inverter to MACSB PLC
IN-240-1 240V control JB-GEN-M to MACSB
IN-240-2 240V control JB-L to MACSB
IN-240-3 240V control JB-GEN-S to SACSB PLC
IN-240-4 Shunt trip MDCSB PLC to Large DC System battery breakers
IN-240-5 Shunt trip MDCSB PLC to Small DC System battery breakers
IN-GEN1 Gen Interlocks GEN1 Terminal box to JB-GEN-M
IN-FF Fuel flow Fuel flow meter to JB-GEN-M
IN-LV Load control Variable load to JB-L
IN-LT Load temp Load Bank to JB-L
IN-BAT1 Battery room temp Battery room to MDCSB PLC
IN-BAT2 Battery 1 temp Battery bank 1 to MDCSB PLC
IN-BAT3 Battery 2 temp Battery bank 2 to MDCSB PLC
IN-BAT4 Battery 3 temp Battery bank 3 to MDCSB PLC
IN-BAT5 Battery 4 temp Battery bank 4 to MDCSB PLC

57
Appendix E. Alternator insulation tests The initial test results for the alternator armature windings are as follows. Values which are un-
acceplable have been highlighted. Note that the armature consists of 6 separate windings
Windings to earth
Insulation resistance between the armature windings and earth is shown below. Insulation was tested at
500V.
U1-U2 >10MΩ
U5-U6 8MΩ
V1-V2 >10MΩ
V5-V6 10MΩ
W1-W2 10MΩ
W5-W6 >10MΩ
Between windings
Insulation resistance between each armature winding is shown below. Insulation was tested at 1000V.
Note the dead short between 3 sets of windings.
W1-W2 W5-W6 8MΩ
W1-W2 V1-V2 >8MΩ
W1-W2 U1-U2 10MΩ
W1-W2 V5-V6 5MΩ
W1-W2 U5-U6 >5MΩ
V1-V2 V5-V6 5MΩ
V1-V2 V1-V2 7MΩ
V1-V2 U5-U6 0
V1-V2 W5-W6 0
U1-U2 U5-U6 9MΩ
U1-U2 W5-W6 9MΩ
U1-U2 V5-V6 9MΩ
W5-W6 V5-V6 >2MΩ
W5-W6 U5-U6 0
V5-V6 U5-U6 >2MΩ

58
Continuity
Continuity of each winding is shown below. Each result is acceplable for this size of alternator.
U1-U2 1.75Ω
U5-U6 1.75 Ω
V1-V2 1.75 Ω
V5-V6 1.80 Ω
W1-W2 1.80 Ω
W5-W6 1.80 Ω

59
Appendix F. Load Bank co-ordination for single phase resistive loads The table below shows how the load for each phase is co-ordinated by writing the appropriate binary
value to the appropriate data file. Reactive loads operate in an identical fashion.
Binary Value Loads Total load
0000 0
0001 150W 150W
0010 300W 300W
0011 300W, 150W 450W
0100 600W 600W
0101 600W, 150W 750W
0110 600W, 300W 900W
0111 600W, 300W, 150W 1050W
1000 1200W 1200W
1001 1200W, 150W 1350W
1010 1200W, 300W 1500W
1011 1200W, 300W, 150W 1650W
1100 1200W, 600W 1800W
1101 1200W, 600W, 150W 1950W
1110 1200W, 600W, 300W 2100W
1111 1200W, 600W, 300W, 150W 2250W

60
Appendix G. Block diagram of MACSB
Figure 32 Block diagram of the MACSB
Above is a block diagram that has been produced to help explain the operation of the Main AC
switchboard. Note that the Grid Connection circuit breaker and its associated power monitor are totally
separate from the rest of the switchboard.
Power that enters the switchboard from the power sources such as the diesel generator have been
shown with green arrows.
Power that leaves the switchboard to inverters and loads are shown with red arrows.
Switchboard busbars are shown as yellow arrows.
Where power can be imported and exported, a combination of green and red is used.
Switches and ties are shown with diamonds and circuit breakers are shown as squares. The only
exception is L11 which is the load metering and is a Powermonitor only.

61
Appendix H. Block diagram of Real PV array connections The real PV Array located on the roof of the RISE facility is connected to the Grid Connection circuit
breaker as shown in figure 33 below. Note that at the time of writing that the Sunnyboy inverter is the
only inverter connected to the Real PV Array.
Figure 33 Block diagram of the Real PV array connections

62
Appendix I. Block diagram of communications systems The diagram in figure 34 below shows the layout and type of communications that are used to control
the systems of the RISE facility.
Figure 34 Block diagram of the comms systems

63
Appendix J. Graph of Power Exported Figure 35 below shows the real power produced by the Real PV Array during daylight hours on a clear
sunny day. Note the effect that a small amount of cloud cover at approximately midday has on the
output of the array.
Figure 35 Chart of the power in Watts exported on a clear day