riparian area management - bureau of land management tr 1737-10.pdf · areas of interest. baseline...
TRANSCRIPT

The Use of Aerial Photographyto Manage Riparian-Wetland Areas
U.S. Department of the Interior
Bureau of Land Management
RIPARIAN AREA MANAGEMENT
TR 1737-10 1994, Revised 2001
TNEMTRAPE
D.
S.U
OF THEI N
TE
RI O
R
3 1 8 4 9hcraM
,
U.S. DEPARTMENT OF THE INTERIORBUREAU OF LAND MANAGEMENT

Production services by:
Information and Communications StaffTerry D’Erchia, Chief (303-236-6547)
Janine Koselak: Layout and DesignLinda Hill: Editing
Lee Barkow, DirectorNational Science & Technology CenterP.O. Box 25047Denver, Colorado 80225-0047
The Bureau of Land Management’s National Scienceand Technology Center supports other BLM officesby providing a broad spectrum of services in areassuch as biological resources, engineering, lands andminerals, library assistance, mapping sciences, photoimaging, physical sciences, communications, andtechnology transfer.
Copies available from:National Business Center
Printed Materials Distribution Service, BC-650BP.O. Box 25047
Denver, Colorado 80225-0047Phone: (303-236-7637)
TR 1737-10BLM/ST/ST-01/002+1737
(formerly BLM/SC/ST-94/005+1737)
Distribution by:
Denver Center Support Services GroupRobert Pinkney, Group Admin. (303-236-9420)
Sherri Hendren: Printing CoordinationFrank Tisby: Distribution Management
Dennis Sykes, DirectorNational Business CenterP.O. Box 25047Denver, CO 80225-0047
The Bureau of Land Management’s National BusinessCenter (NBC) provides business and fiscalinformation and services. Information encompassesBureauwide budgeting, financial, property, procure-ment, and collections systems; customers aresupported by help desks, training, national supportprograms/services, and consulting services. Usersatisfaction and customer service are at the heart ofNBC’s organization.

i
RIPARIAN AREA MANAGEMENT
The Use of Aerial Photographyto Manage Riparian-Wetland Areas
by
Pam ClemmerCartographer/Remote SensingBureau of Land Management
National Science and Technology CenterDenver, Colorado
Technical Reference 1737-101994, Revised 2001
U.S. Department of the InteriorBureau of Land Management
National Science and Technology CenterP.O. Box 25047
Denver, CO 80225-0047

ii
Suggested citations:
Clemmer, Pam. 1994, Revised 2001. Riparian area management: The use of aerialphotography to manage riparian-wetland areas. Technical Reference 1737-10.Bureau of Land Management, Denver, CO. BLM/ST/ST-01/002+1737. 54 pp.
U.S. Department of the Interior. 1994, Revised 2001. Riparian area management: Theuse of aerial photography to manage riparian-wetland areas. Technical Reference1737-10. Bureau of Land Management, Denver, CO. BLM/ST/ST-01/002+1737. 54 pp.

iii
Acknowledgments
This is an enhanced version of Technical Reference 1737-2, The Use of AerialPhotography to Inventory and Monitor Riparian Areas (Batson et al. 1987). Althoughmuch of the original content remains, this revised reference approaches the topic froma broader perspective.
The author wishes to thank the following individuals from the BLM Service Center(now the National Science and Technology Center) for the time they offered in review,comment, and development of this document: Don Prichard, Alan Amen, LarryCunningham, and especially Ed Work.
A special thanks to Jason Swegle of the Remote Sensing Staff and to Linda Hill andJanine Koselak of the Technology Transfer Staff at the BLM Service Center (now theNational Science and Technology Center) for making this a quality document.

iv

v
Table of Contents
Page
I. Introduction ........................................................................................................ 1
II. Purpose ............................................................................................................... 3
III. Acquiring Aerial Photography ........................................................................... 5
A. Planning the Project .................................................................................... 5
1. Choosing Photo Parameters ................................................................ 5
2. Researching Existing Photos ............................................................... 7
B. Contracting for Aerial Photography ......................................................... 10
1. Planning for an Aerial Contract ......................................................... 11
2. Initiating an Aerial Contract .............................................................. 13
3. Placing Ground Targets ..................................................................... 14
4. Collecting Data On-Site .................................................................... 15
IV. Interpreting and Analyzing Aerial Photos ........................................................ 17
A. Involving Others in Analysis .................................................................... 17
1. Using Local BLM Staff ..................................................................... 17
2. Requesting Service Center Assistance .............................................. 17
3. Contracting for Analysis ................................................................... 17
B. Initiating Interpretation ............................................................................. 17
1. Preparing the Photos ......................................................................... 18
2. Selecting the Minimum Mapping Unit (MMU) ................................ 19
3. Developing the Vegetation Analysis Framework .............................. 20
4. Analyzing the Photos ........................................................................ 20
5. Using Photo Mensuration .................................................................. 21
C. Capturing Data for GIS Input ................................................................... 22
1. Determining the Map Base ................................................................ 22
2. Transferring Data to the Map Base ................................................... 22
3. Capturing Data in a GIS .................................................................... 23

vi
V. Using Remote Sensing for Field Applications ............................................... 25
A. Inventorying and Monitoring Riparian-Wetland Areas........................... 25
1. Acquiring Photos for Monitoring .................................................... 26
2. Analyzing Photos for Monitoring .................................................... 26
B. Determining Classification ..................................................................... 26
C. Assessing Functionality .......................................................................... 27
D. Supporting Other Management Techniques ............................................ 28
VI. Summary ......................................................................................................... 31
Literature Cited ........................................................................................................ 33
Appendix A: Minimum Mapping Unit Templates ................................................ 35
Appendix B: Sample Vegetation Analysis Framework ......................................... 39
Appendix C: Remote Sensing Application Guide for Riparian-WetlandArea Management............................................................................ 41
Appendix D: Aerial Photo Samples ...................................................................... 47
1
The Use of Aerial Photography to Manage Riparian-Wetland Areas
I. Introduction
Under the Federal Land Policy and Management Act (FLPMA) of 1976, the Bureauof Land Management (BLM) is required to inventory lands and resources on a con-tinuing basis. Aerial photography and other remote sensing techniques can be used toobtain inventory data and can be valuable tools for making management decisions.Aerial photos have proven especially useful in the management of riparian-wetlandareas.
There are many benefits to using aerial photography for managing riparian-wetlandareas. For example, using large-scale color infrared or natural color aerial photogra-phy can accelerate and enhance collection of ground data. Percent of canopy andground cover, bare soil, and acreage can also be calculated from aerial photos. Riparian-wetland plant communities can be delineated for mapping purposes, and generalizedvegetation/soil correlations can also be made. Aerial photos furnish a historicalrecord of the condition of an area at a given point in time; therefore, changes inriparian-wetland areas can be visually assessed by comparing aerial photos taken at alater date. Aerial photos also link data geographically, allowing detailed vegetationmaps to be transferred to a Geographic Information System (GIS) for spatial modelingpurposes.
Remote sensing techniques provide valuable information for both ecosystem-basedand site-specific riparian-wetland management decisions. As BLM moves towardecosystem-based management, resources will be managed across jurisdictionalboundaries on a global, regional, or watershed basis. Small-scale aerial photos (e.g.,1:40,000) and satellite imagery can provide a broad ecosystem perspective of awatershed. Specific problem areas or limiting factors in the management of a riparian-wetland area can be identified through preliminary analysis. Once problem areas areidentified, larger scale imagery (e.g., 1:12,000, 1:6,000, or 1:4,800), acquired using anaerial camera on board a low-flying aircraft, can be used to focus on site-specificareas of interest.
Baseline data is required to effectively manage riparian-wetland areas. Aerial photobaseline data, when carefully selected prior to a project, allows analysis of a largearea of interest, at a minimum cost, in less time per hectare than conventional on-the-ground methods (Keating 1993). Properly documented baseline data can support ordisprove management decisions.

2

3
II. Purpose
The purpose of this technical reference is to provide resource specialists with thebasic information, concepts, and procedures associated with using aerial photographyto establish baseline data for effective management of riparian-wetland areas. Thistechnical reference provides suggestions for the use of various scales of photography,guidance for acquiring aerial photography, and general procedures for conducting avegetation inventory.

4

5
III. Acquiring Aerial Photography
Successful projects using aerial photography are carefully planned prior to initiation.The ultimate objective of a project must be defined before aerial photos are acquired.Once the objective is defined, the project can proceed to the next phases, whichinclude: choosing the correct photo parameters (i.e., scale, type of film), acquiringthe data, preparing the data, interpreting the data, analyzing the data, transferring thedata to an appropriate map base, and capturing the data in a GIS. Although the initialeffort is time-consuming, once the data is entered into a GIS, the resource specialisthas developed a baseline that can be used for modeling analysis with other data sets.State Office or National Science and Technology Center personnel are available tolend technical assistance as needed.
A. Planning the Project
Planning for photo acquisition and analysis is a critical phase of the interpretiveeffort that is often overlooked or ignored. First, and most importantly, the in-tended use of the resulting photography must be clearly defined prior to selectionand acquisition of the photography. Careful planning ensures that the correctphoto parameters (i.e., scale of photos, film type) are selected to accomplish thetask.
1. Choosing Photo Parameters
Remotely sensed data is most effective when used from a multistage perspec-tive, which involves studying the overall area or ecosystem with satelliteimagery, or small-scale aerial photography, gradually focusing in on the site-specific areas of interest with larger scale photography. Standard 7 1/2-minute-scale topographic maps should be used in conjunction with satelliteimagery or small-scale (1:40,000 to 1:80,000) photos to delineate and deter-mine overall condition of the watershed or limiting factors that help definecapability and potential. Once a broad overall perspective is acquired, riparian-wetland areas in need of further study can be identified. Scale and film typeare selected based on the desired result. For example, after studying thewatershed using 1:40,000-scale photos, the resource specialist might want amore intensive inventory over the project area at scales of 1:12,000, 1:6,000,or larger.
a. Selecting Film
Resource specialists should determine the ultimate objective of their studyand select the scale and film type accordingly. If vegetation compositionis needed, color infrared photography should be chosen. Infrared filmallows the interpreter to detect subtle differences in vegetation due tohigh sensitivity of the film in the infrared portion of the electromagneticspectrum. The human eye is not capable of discerning the infrared portion

6
of the electromagnetic spectrum. Advances in film technology allow us to“see” a part of the spectrum that we do not see with our naked eye. Natu-ral color film is adequate if more general information is desired, such asacreage, percent of canopy cover, channel widths, stream lengths, generalimprovement, or increase of riparian-wetland vegetation. Photos 1a and2a in Appendix D provide a comparison of natural color and color infra-red, respectively.
b. Selecting Scale
Resource specialists should determine the smallest scale possible toaccomplish the task. The concept of large scale versus small scale is oftenconfusing. When comparing a large- and small-scale photo over the samesite, features on the small-scale photo appear smaller. The representativefraction (RF) scale is a small fractional number. For example, 1/24,000 isa smaller scale than 1/12,000. These fractional scales are commonlyexpressed as ratio scales of 1:24,000 and 1:12,000. If the film format isthe same for both photos (e.g., 9- x 9-inch), the small-scale photo (1:24,000)covers a greater ground area than the large-scale photo (1:12,000).
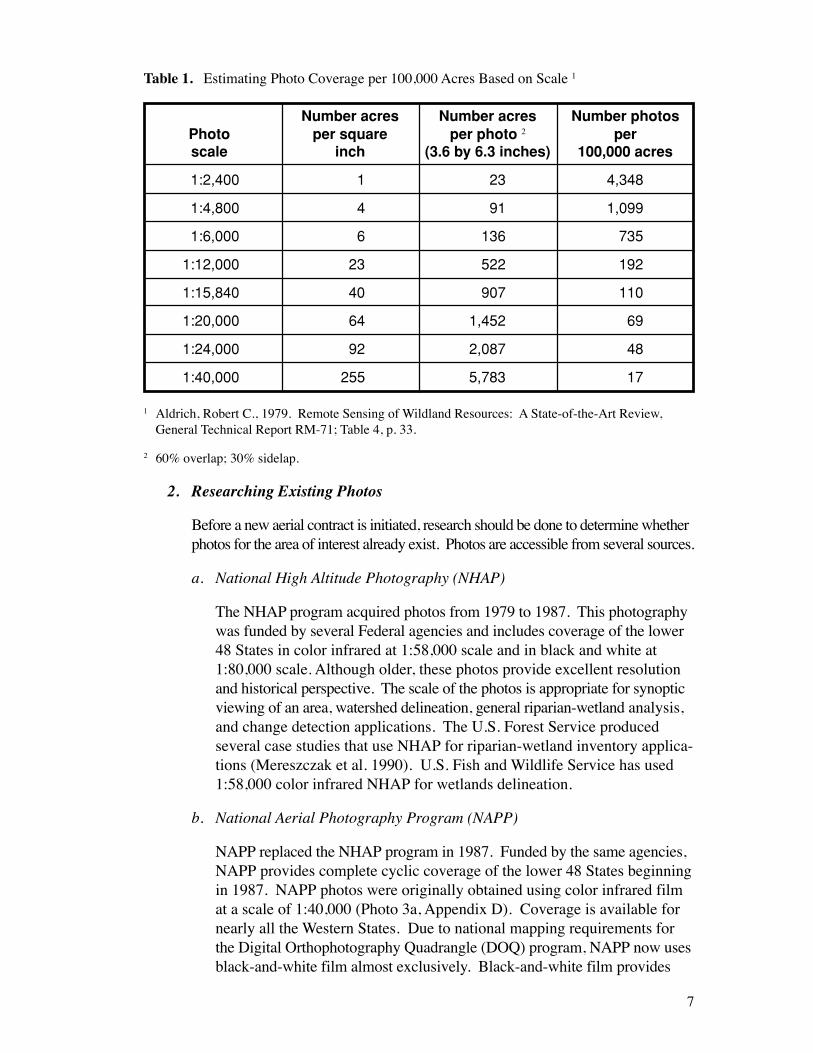
Relatively speaking, a smaller scale requires fewer photos and covers alarger area (Table 1). The interpretive process is accelerated because thereare fewer photos to interpret and transfer to a map base. With the properoptical equipment, interpretation can be accomplished at a much smallerscale (Aldrich 1979).
Care should be taken to select a scale that is small enough to make the jobeasier, but large enough to interpret the detail needed. (Photos 2a and 3ain Appendix D provide a comparison of different scales of the same area.)As a test, several different scales of film transparencies or prints can beordered for the area of interest, such as stereo pairs at scales of 1:40,000and 1:24,000, and larger scales of 1:12,000, 1:6,000, or 1:4,800. (Photos5, 6a, and 7 in Appendix D are examples of larger scales.) The photos canthen be carefully studied and compared to determine the level of detailderived from each. A smaller scale should be selected for synoptic coverageand a larger scale for site-specific analysis.
7
Table 1. Estimating Photo Coverage per 100,000 Acres Based on Scale 1
Number acres Number acres Number photosPhoto per square per photo 2 perscale inch (3.6 by 6.3 inches) 100,000 acres
1:2,400 1 23 4,348
1:4,800 4 91 1,099
1:6,000 6 136 735
1:12,000 23 522 192
1:15,840 40 907 110
1:20,000 64 1,452 69
1:24,000 92 2,087 48
1:40,000 255 5,783 17
1 Aldrich, Robert C., 1979. Remote Sensing of Wildland Resources: A State-of-the-Art Review,General Technical Report RM-71; Table 4, p. 33.
2 60% overlap; 30% sidelap.
2. Researching Existing Photos
Before a new aerial contract is initiated, research should be done to determine whetherphotos for the area of interest already exist. Photos are accessible from several sources.
a. National High Altitude Photography (NHAP)
The NHAP program acquired photos from 1979 to 1987. This photographywas funded by several Federal agencies and includes coverage of the lower48 States in color infrared at 1:58,000 scale and in black and white at1:80,000 scale. Although older, these photos provide excellent resolutionand historical perspective. The scale of the photos is appropriate for synopticviewing of an area, watershed delineation, general riparian-wetland analysis,and change detection applications. The U.S. Forest Service producedseveral case studies that use NHAP for riparian-wetland inventory applica-tions (Mereszczak et al. 1990). U.S. Fish and Wildlife Service has used1:58,000 color infrared NHAP for wetlands delineation.
b. National Aerial Photography Program (NAPP)
NAPP replaced the NHAP program in 1987. Funded by the same agencies,NAPP provides complete cyclic coverage of the lower 48 States beginningin 1987. NAPP photos were originally obtained using color infrared filmat a scale of 1:40,000 (Photo 3a, Appendix D). Coverage is available fornearly all the Western States. Due to national mapping requirements forthe Digital Orthophotography Quadrangle (DOQ) program, NAPP now usesblack-and-white film almost exclusively. Black-and-white film provides
8
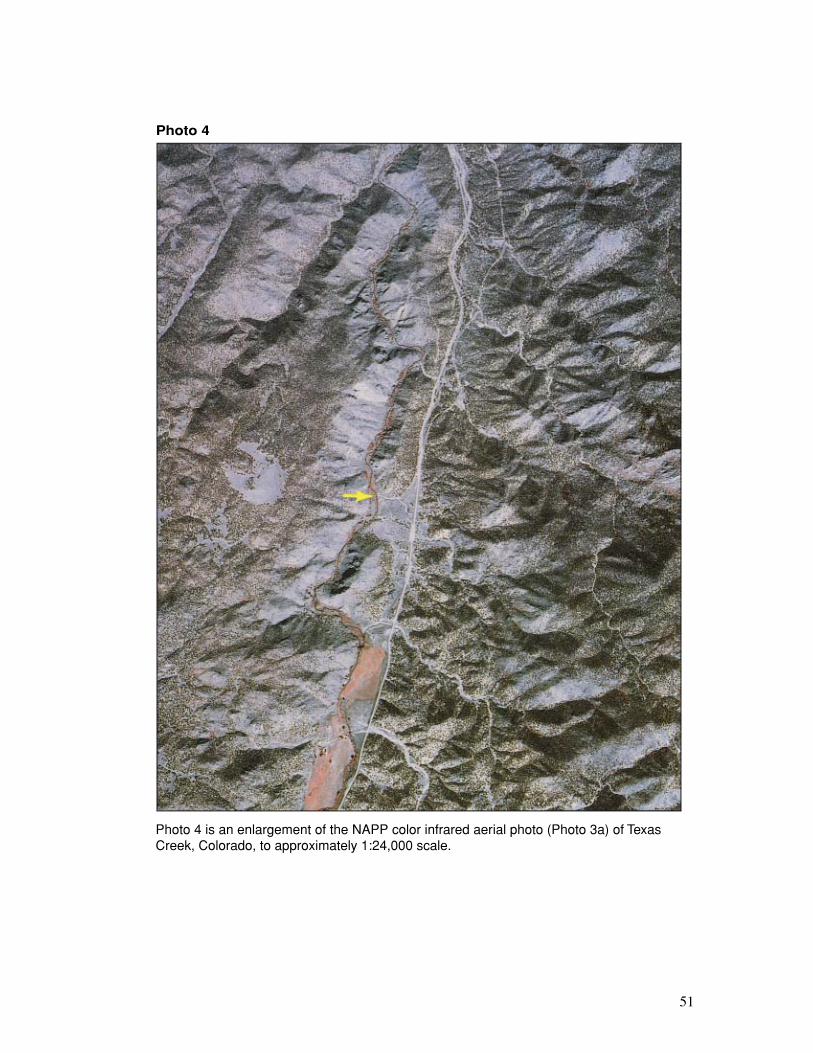
higher resolution needed for orthophoto production at lower cost thancolor infrared film. The scale of the NAPP photos (1:40,000) is appropriatefor the same applications as those listed for NHAP. Both NHAP andNAPP provide high-quality photographic products that can be satisfactorilyenlarged to 1:24,000 scale. Photos 3a and 4 in Appendix D provide acomparison of these scales. Anderson and Hardin (1992) have demonstratedthe use of NAPP color infrared photos for delineating wetlands in Utah.
NHAP and NAPP photography can be aquired from EROS Data Center (EDC)in Sioux Falls, South Dakota, or the U.S. Department of Agriculture's AerialPhotographic Field Office (APFO) in Salt Lake City, Utah. Online searchesand ordering can be conducted at http://edcsns17.cr.usgs.gov/EarthExplorer/.
c. BLM Photography
BLM has acquired a considerable amount of aerial photography over theyears. Most of this photography is archived at BLM's Aerial PhotographyArchive and Processing Lab, Denver Federal Center, CO 80225, with theremainder stored at EDC. BLM photos consist of resource block photographyat scales from 1:12,000 to 1:24,000. Block photography implies photographyacquired as adjacent photo flight lines. Block photography usually has 60percent endlap between successive photos with a sidelap between adjacentflight lines of 30 percent. Smaller scales (e.g., 1:24,000) are appropriate for abroad perspective of a stream reach and generalized riparian-wetland analysis.
Smaller areas of strip photography (riparian-wetland and special projects)are acquired in select areas at larger scales of 1:6,000, 1:4,800, or 1:3,000(Photo 5, Appendix D). Strip photography consists of a single flight lineof photos (e.g., stream reaches) where an endlap between successivephotos of 60 percent is commonly maintained for purposes of stereoscopicviewing. Site-specific riparian-wetland inventory is easily accomplishedat scales of 1:12,000, 1:6,000, or greater. If vegetation differentiation is arequirement, color infrared film is preferred over natural color.
d. Aerial Photography Summary Record System (APSRS)
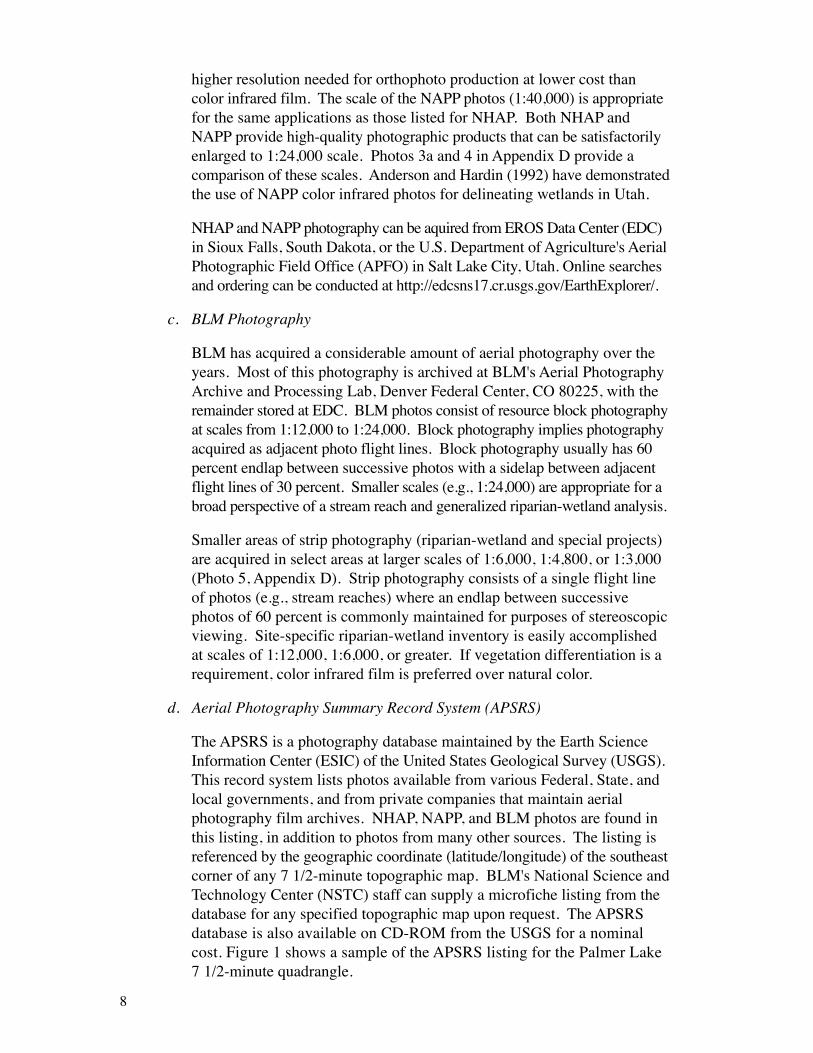
The APSRS is a photography database maintained by the Earth ScienceInformation Center (ESIC) of the United States Geological Survey (USGS).This record system lists photos available from various Federal, State, andlocal governments, and from private companies that maintain aerialphotography film archives. NHAP, NAPP, and BLM photos are found inthis listing, in addition to photos from many other sources. The listing isreferenced by the geographic coordinate (latitude/longitude) of the southeastcorner of any 7 1/2-minute topographic map. BLM's National Science andTechnology Center (NSTC) staff can supply a microfiche listing from thedatabase for any specified topographic map upon request. The APSRSdatabase is also available on CD-ROM from the USGS for a nominalcost. Figure 1 shows a sample of the APSRS listing for the Palmer Lake7 1/2-minute quadrangle.
9
Figure 1. Palmer Lake, Colorado (39° 00' N, 104° 52' W), APSRS listing.

10
If aerial photos for the area of interest already exist, adequate time should beallowed to order and receive the prints or film. In many instances, it can takeup to 8 weeks to receive photos. State Office remote sensing coordinators orBLM's Aerial Photography Archive and Processing Lab can provide assistancein obtaining photos from any of these sources.
Once the photos are received, resource specialists are ready for interpretationand analysis. It is highly recommended that film transparencies be usedinstead of prints. When viewed with adequate back-lighting, transparenciesprovide sharper images, making interpretation easier. Of course, the stereo-scopic equipment available to the interpreter determines whether film or printsare ordered.
B. Contracting for Aerial Photography
If larger scale, more current aerial photos are desired, or if no photos exist for thearea of interest, an aerial photo contract should be considered. The followingcontract guidelines are aimed primarily toward large-scale strip photographycontracts. Generally the same procedures apply for block photography acquisi-tion. Tables 2 and 3 show approximate costs for both strip and block projects.
Table 2. Scale, Coverage, and Costs for Resource Block Aerial Photography Contracts
Approximate CostPer Square Mile ($)1
DescriptiveScale Scale Color Infrared
1:12,000 1" = 1,000' 36.00 42.00
1:15,840 = 1,320' 29.00 32.00
1:24,000 = 2,000' 12.00 14.00
Table 3. Scale, Coverage, and Costs for Strip (i.e., riparian) Aerial Photography Contracts
Approximate CostPer Linear Mile ($)1
DescriptiveScale Scale Color Infrared
1:2,400 1" = 200' 200.00 225.00
1:4,800 = 400' 175.00 200.00
1:6,000 = 500' 150.00 175.00
1:12,000 = 1,000' 100.00 125.00
1 Approximate costs are based on 1994 average contract costs. Actual cost may vary significantlydepending upon the region and size of the job.
1 Approximate costs are based on 1994 average contract costs. Actual cost may vary significantlydepending upon the region and size of the job.

11
1. Planning for an Aerial Contract
It is strongly recommended that resource specialists consult the State Office remotesensing coordinators or NSTC remote sensing staff before initiating an aerial contract.
a. Selecting the Riparian-Wetland Area
Areas that are of primary concern should be selected carefully. Thebeginning and end points of stream reaches requiring coverage should beidentified on a 1:24,000-scale USGS 7 1/2-minute topographic map(Figure 2). It is best not to skimp on photo coverage. Once the aircraft isover the area, an additional two or three exposures do not add significantlyto the overall cost of the project.
b. Determining Season and Time of Day
Ideally, the photos should be obtained as near to “peak of green” as possible.This is generally near the point where vegetation is growing vigorouslyand is at a full leaf stage. Local resource specialists usually know whenpeak of green occurs. In addition, if deep canyons are in the area, fieldspecialists should specify a higher sun angle than normal (i.e., time of day)for the flight in order to minimize shadows within the canyon depression.
The objective of the project should be considered when selecting the dateof photography. Generally, riparian vegetation is more easily distinguishedfrom upland vegetation in photos taken later in the growing season.
c. Selecting Film
The intended use of the imagery directly relates to the type of film required.For example, if the extent of a riparian-wetland area is to be outlined andquantified (in acres), natural color film is adequate. If vegetation compo-sition (i.e., trees, shrubs, grasses) is to be analyzed, color infrared film ispreferred. Color infrared film captures a greater range of spectral reflectancevariation between vegetation types than does natural color film.
d. Selecting Scale
Intended use also has a direct bearing on scale requirements. For example,a scale of 1:24,000 or smaller is sufficient to locate most riparian-wetlandareas, make linear (mileage) measurements, and determine watersheds.However, to visually analyze, delineate, and measure areas to the commu-nity level for later comparison (monitoring), a scale of 1:2,400 to 1:6,000is recommended for narrow strips of riparian-wetland vegetation. Widermeandering riparian-wetland zones may require photo scales from 1:4,800to 1:12,000 in order to photographically cover the area with a single flightline. If the adjacent uplands are of interest, a smaller scale should beconsidered. Again, the larger the scale, the more costly the project, so thesmallest possible scale for accomplishing the task should be selected.

12
Figure 2. Coverage required for Muddy Creek is identified on a USGS 7 1/2-minute topographic map.

13
2. Initiating an Aerial Contract
The necessary paperwork for an aerial contract should be initiated at least 6months prior to the expected flight date to allow time for preparing specifica-tions, requesting photo lab work, securing bids, awarding the contract, andholding a prework conference. Contracts under $100,000 can be handled bythe State or Field Offices. Contracts of $100,000 or greater are handled by theprocurement staff at BLM's National Business Center.
a. Preparing Specifications for Aerial Photography
Technical aerial photography specification packets are available fromNSTC's aerial photo coordinator. These specifications incorporate thepreplanning considerations mentioned, in addition to other requirementsfor obtaining quality imagery. Form 9672-3, Specification Detail Sheet(July 1984), is an attachment to the specifications. The form providesspace for specific information relative to the acquisition of the photogra-phy and any additional requirements not covered in the specifications.NSTC can provide these packets or assist in completing this form.
b. Preparing the Flight Map
Flight maps should be prepared from USGS topographic maps. The1:24,000-scale, 7 1/2-minute topographic map is used for large-scale stripprojects (i.e., riparian) and the 1:100,000-scale map is used for smallerscale block projects (e.g., 1:12,000, 1:24,000). Generally these maps areprepared by the State Office remote sensing coordinators or the NSTCaerial photo coordinator in consultation with the State or Field Office.
c. Procuring the Photography
The procurement process is usually handled by State Offices or NSTC.Technical assistance on photo procurement procedures is available from theNSTC aerial photo coordinator. The method of contracting for photographyis usually determined by the estimated size and cost of a project.
Cooperative planning between BLM offices and other Federal, State, andlocal agencies can significantly reduce project costs. A major cost item isferry time for the flight crew from the contractor’s home base to theproject site. If the project is combined with another project in a nearbyarea, the ferry charge is minimized.
Assuming the project cost is within the authority of the local contractingofficer, the following options for contracting the job are available:
1) A formal Invitation for Bid can be issued. This is done through theNational Business Center when large contracts are involved.

14
2) Standard Form 18 can be used to obtain written quotations. Under thisprocedure, specifications, maps, and other items that clarify the requestfor price quotations can be sent. At least 3 weeks should be allowed toreceive bids.
3) The Oral Quotations Form 1510-42 for supplies and services can beused. This form is generally used for small aerial photo contracts withrequirements that can be described sufficiently over the phone toobtain price quotes.
Any questions regarding the procurement process should be directed toNSTC's aerial photo coordinator.
3. Placing Ground Targets
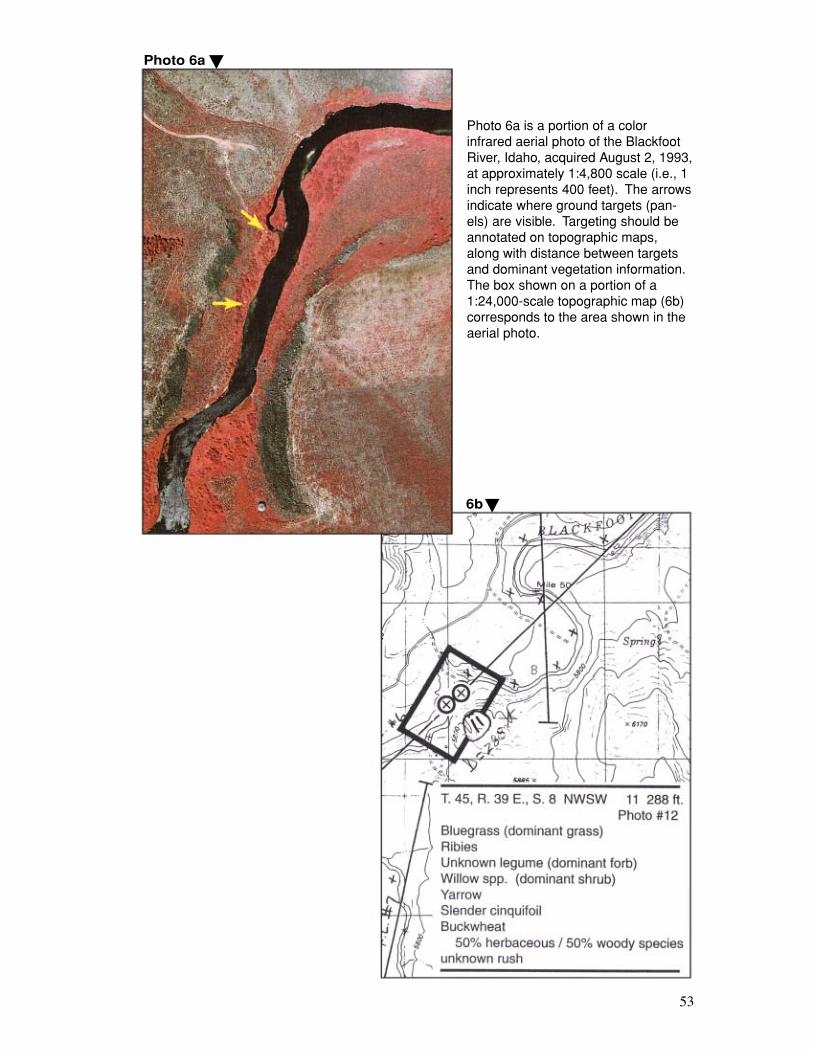
Ground targeting, also called paneling, is essential for larger scale photo con-tracts (i.e., 1:2,400 to 1:12,000). With larger scale photos, it is often difficult todetermine the photo scale using map identifiable features. Acquiring the knownground distance between two targets allows the interpreter to calculate theactual photo scale (Photo 6a, Appendix D). Once the photo scale is determined,photo mensuration (linear measurements and acreage determination) can beaccomplished directly on the photo using a simple formula (see section IV.B.5).
Targeting should be completed not more than 1 week prior to flying to avoidtarget loss from wind, animal disturbance, or vandalism. Target panels can beconstructed from butcher paper, which is readily available from butcher shopsand grocery stores, or from plastic material. Butcher paper is biodegradable,but the plastic material is not. Targets should be anchored with twine, rocks,or nails and large washers. The target material should be removed once theaerial photography has been accepted. Sometimes photos from portions ofcontracted flights are rejected due to clouds or excessive tip, tilt, or crab of theaircraft, and those areas are required to be reflown.
For riparian areas along stream corridors, two targets should be placed at eachend of a stream reach. For longer stream segments, another set (two targets)should be placed at approximately 2-mile intervals along the stream or at themidpoint of the segment. The following guidelines are acceptable for photoscales of 1:2,400 to 1:6,000:
• Targets should be placed 200 to 500 feet apart within the photo coveragearea, with one of the targets near the stream where ground data and photoswill be taken. An accurate ground distance between the targets should bemeasured and recorded for later use in determining photo scale. Targetsshould be placed in relatively flat terrain within clear view of the aircraft.
• Target panels should be in the form of crosses (+). Each target panelshould be 10 feet long and at least 18 inches wide for large-scale projects.
15
If photogrammetric work is anticipated, the requirements for target placementare more strict. Horizontal and vertical control points need to be collectedusing survey quality Global Positioning System (GPS) units. Photogrammetrytechniques are used to obtain extremely accurate measurements. NSTC'sphotogrammetry staff should be consulted on target placement and is availableto assist in mission planning upon request.
4. Collecting Data On-Site
On-site data collection efforts should be accomplished at the time of targetplacement. Data collected on-site provides the interpreter with valuableinformation about on-ground conditions at the time the photos are acquired.Photos 1b, 2b, and 3b of Appendix D show on-ground conditions for the areasin Photos 1a, 2a, and 3a, respectively. Although field verification is valuableanytime during the project, it is important for the interpreter to know the siteconditions at the time of photo acquisition.
Slides (35-mm) of the riparian-wetland area should be taken at the site wherethe targets are placed, and inventory data should be collected for the reach.The dominant and subdominant herbaceous vegetation, shrubs, and trees, andthe percent bare soil should be determined. Data acquired in the field can beused to develop interpretive guidance once the photos have been acquired.This data should include any additional field notes that may assist in photointerpretation. Sketched maps annotated to indicate the presence and type ofland cover (e.g., plant species, soil type) are useful for developing photointerpretation keys.
The approximate coordinate locations of the targets should be determinedfrom a topographic map (Photo 6a and 6b, Appendix D). Coordinate locationcan be useful for locating oneself during interpretation. If possible, differen-tially corrected GPS coordinates for the center of the target panels should becollected. Accurate coordinate locations aid in registering and entering datainto a GIS.

16

17
IV. Interpreting and Analyzing Aerial Photos
Once photos have been acquired, local BLM staff, State or NSTC personnel, orcontracted facilities can perform interpretation; however, interpretation is best per-formed by someone familiar with the local vegetation and ecosystem characteristics.
A. Involving Others in Analysis
1. Using Local BLM Staff
Photo interpretation and data analysis should be performed at the local FieldOffice level by resource specialists familiar with vegetation and managementactivities on the site. Interdisciplinary involvement in interpretive analysiswill provide a broader perspective. State and Field Office remote sensingexpertise should also be called upon, when available. Contacts should bemade with any Federal, State, and local agencies who may have an interest inthe area under consideration. These contacts may contribute expertise inanalysis, existing data, or financial assistance for a data-sharing project.
2. Requesting NSTC Assistance
Optical photo interpretation equipment is sensitive, fragile, and difficult tomove. Such interpretation equipment is available at the NSTC for use byBLM Field Office personnel. Facilities and staff from the NSTC remotesensing staff are also available to help field personnel with analysis. Generalizedinterpretation can be accomplished at NSTC, followed by verificationassistance from specialists in the field.
3. Contracting for Analysis
Educational institutions, consulting firms, and other Government agenciesmay offer interpretation and analysis capabilities. For instance, the Environ-mental Protection Agency (EPA) facility in Las Vegas, Nevada, has cooper-ated with BLM offices in past years. This type of cooperation varies fromperforming the analysis and documenting the results to simply making theirfacilities available for a BLM work session.
B. Initiating Interpretation
Input into a GIS requires transferring interpretations from aerial photos to a stablemap base. If GIS input is not the ultimate goal, and information is to be usedonly to calculate approximate acreage of riparian-wetland vegetation, photomensuration procedures should be used (see section IV.B.5).

18
1. Preparing the Photos
a. Delimiting the Effective Area
During the interpretation process it is important to analyze only the"effective area" of each photo. Generally, the effective area is the centralportion of the photo and includes overlap and sidelap from adjacent photos(Figure 3). The effective area serves two purposes. It defines the area ofleast geometric distortion in the photo and it allows the interpreter todelineate and classify the features in a project area once and only once,eliminating inefficient and multiple interpretations that could occur if alarger area on the overlapping photo were to be interpreted. The drawingof the effective area on every photo can be a tedious and protracted pro-cess, a discussion of which is beyond the scope of this technical reference.Crisco (1988) provides detailed information regarding effective areadelineation.
b. Preparing Overlays
Interpretations should be compiled on clear mylar overlays, thus allowingthe photos to be preserved for other applications. A clear mylar overlay(9-x 9-inch) should be attached to each frame to be interpreted, and a fine-point permanent marking pen should be used to carefully annotate eachside fiducial mark observed on the photo. The identification format (photolabeling) is then transferred from each photo so that it can be easilyreregistered if the overlay becomes detached. The identification format
Figure 3. Effective area.
Effective area ofphoto 1-3-8 and 1-3-9 60% overlap
Line of flight
1-3-9
1-3-8

19
includes the date of the photography, agency, scale, project code, andframe number (roll-flight-exposure number) as shown in Figure 4.
Figure 4. Sample identification format.
2. Selecting the Minimum Mapping Unit
A minimum mapping unit (MMU) should be selected prior to photo interpre-tation. The MMU serves as a guide for all future polygon delineation andmapping. For example, a 1-acre MMU would be equivalent to a 0.1-inchsquare at 1:24,000 scale. Although very small features and individual plantsare discernible on large-scale aerial photos, a reasonable mapping unit must beselected. The interpreter must keep in mind that the delineations will bereduced in size significantly when the data is transferred to the map base. Toassist in interpretation, a template depicting the MMU at the intended scaleshould be constructed to use as a guide during interpretation. Sample MMUtemplates are provided in Appendix A.
Larger riparian-wetland areas can be portrayed as polygons on a 1:24,000-scalemap base. However, the majority of BLM streams have riparian-wetlandcommunities that are quite small and cannot be portrayed with polygons at ascale of 1:24,000. This complicates the use of detailed riparian-wetland datawithin a GIS. Features that are too small to portray with an MMU as a polygonat the final map scale can be compiled as line or point data. Line segments mustbe described and defined. Appropriate attributes must be assigned to featureswhen they are input into a GIS. For example, a red line segment represents awidth of less than 100 feet. This information, along with line length and mapscale, determines line segment acreage. Spot symbols need to be defined interms of area. For example, spot symbols represent areas less than .5 acre. GISfeature design and descriptions are discussed at length in Technical Reference1737-7, Procedures for Ecological Site Inventory—With Special Reference toRiparian-Wetland Sites (Leonard et al. 1992). These procedures are easilyadapted to any GIS input procedure, but should be defined prior to map transfer.
6-15-90Identificationformat
Fiducial mark
1-3-8BLM 5 ID-90-CI
20
3. Developing a Vegetation Analysis Framework
If vegetation analysis is part of the defined project, a vegetation analysisframework should be developed prior to interpretation. This frameworkdescribes the characteristics of the dominant and mixed riparian-wetlandcommunities to be encountered and delineated. As interpretation proceeds,the framework is modified as needed. Appendix B provides an example of avegetation analysis framework that was used in 1986 during a work session inNevada and found to be adequate for that environment. Resource specialists areurged to review this framework and create their own based on local requirements.The framework should include defined criteria for the classes that are selected.The previously selected MMU should be used for interpretations. Delineationsshould be confined to the riparian-wetland area and interpretation kept withinthe effective area.
4. Analyzing the Photos
Each information layer should be compiled on a separate overlay. For example,stream channels on recent photos often show much change from the older7 1/2-minute topographic maps. Stream channels, therefore, are compiled onone overlay to monitor stream channel movement, while vegetation interpreta-tions are compiled on a separate overlay. Separating the data layers allowsease in map transfer and subsequent digitization.
Photo interpreters should use the best available optical equipment during theinitial stages of the project. A zoom transfer scope allows interpretations to bedirectly compiled from photo to map base. If this equipment is not available,a two-step process is required. Stereoscopic viewing of prints is helpful,particularly in determining relative heights of tree and shrub species. Aerialphotographs can be obtained as paper prints or positive film transparencies.Although paper prints are commonly used in the field, it is strongly recommendedthat film transparencies be used with adequate back lighting for interpretationbecause they provide a finer resolution image. Visual analysis usingtransparencies under stereo magnification has proven to be of great value.
While interpreting the photo, it is best to proceed from the dominant or purertypes of communities to the more difficult mixed communities. Using theMMU template as a guide for polygon delineation, each vegetation typeshould be systematically identified. To develop interpretive consistency, all ofone type should be delineated at the same time. Jumping around createsconfusion in interpretation. Photo 7 in Appendix D shows interpretations on aportion of Tabor Creek, NV.
Use of supporting ground photography is encouraged, as are field visits. Ifaerial photography was contracted, the ground data that was collected whentargeting was accomplished (see section III.B.4) should be used. Photointerpretation is a confidence-building exercise and it is important to use all

21
available supporting data. Although the first several photos take longer,experience has shown that photo interpreters increase their speed and efficiencyonce confidence is gained.
When analysis is complete, interpretations can be transferred to a standardmap base. Once transfer is completed, the compilation can be entered into aGIS. Once input into a GIS, future monitoring, change detection, and analysiscan be achieved quickly (see section IV.C).
If input into GIS is not required, and the dominant use of the data is to gathertabular information concerning approximate acreage, photo mensuration ispossible.
5. Using Photo Mensuration
After the photo preparation and interpretation processes are complete, it ispossible to tabulate acreage directly from the photos. This process is calledphoto mensuration. The resulting acreage figures are approximations; thismethod is far less accurate due to the lack of a controlled map base. Photomensuration is more accurately calculated on interpretations that have beencarefully transferred to a map base.
a. Determining Photo Scale
The contracted photo scale, which is normally annotated in the identifica-tion format on each photo, is not the actual photo scale. When severeelevation changes occur within any flight line, the actual photo scalevaries considerably and affects the mensuration results. The actual scaleon any given photo is calculated using a known ground distance. Onlarge-scale photos, this distance is obtained between the target sets that areplaced before the flight (see section III.B.3). On smaller scale photos,calculation is commonly made by measuring a distance between twophoto- and map-identifiable features (Crisco, 1988). An average scale forthe flight line can then be determined for mensuration purposes.
Photo scale (PS) is the ratio of photo distance (PD) to ground distance(GD). All values must be converted to the same unit of measure.
Example: The ground distance between targets A and B is 400 feet. Thephoto distance between the same targets A and B is 2 inches. What is thephoto scale?
Photo Scale = 1:2,400
PDGD
= PS
2" (PD)400' x 12" (GD) = =
–••
–••2" (PD)4,800" (GD)
1"2,400"
2"2"

22
Photo scale is expressed as a ratio: 1 inch on the photo represents 2,400inches on the ground. Once the photo scale is determined, the descriptivescale is easily calculated. The descriptive scale shows how many feet onthe ground are equivalent to 1 inch on the photo. In this example, thedescriptive scale is figured as follows:
Descriptive Scale: 1"=200'
b. Calculating Acreage
There are several methods for determining acreage. These methods maybe used directly on the photo, but are more accurate if used on a controlledmap base once the interpretations have been transferred.
Many Field Offices have access to digital planimeters that allow directcalculation of acreage when the photo scale is entered. Additionally,portable digital planimeters can be rented on a daily basis at a reasonablecost.
If the project area is small, the dot grid and manual methods are cost-efficient alternatives (Crisco 1988). Acreage calculation can be deter-mined with most GIS software packages, once the interpretations aredigitized.
As the data is assembled, it should be recorded on a vegetation analysisframework form (Appendix B). The data can be recorded by photo num-ber, and subsequent tabulation by other subdivisions (e.g., allotment,ownership, stream segment) is possible if desired.
C. Capturing Data for GIS Input
1. Determining the Map Base
If data is primarily to be used to create a map of riparian-wetland cover typesand may ultimately be used in a GIS, map base considerations are critical.The standard base for BLM resource management applications is the USGS7 1/2-minute, 1:24,000-scale topographic map or orthophoto quadrangle.Stable base mylar provides the most accurate digitizing base and shouldalways be used in place of paper print products.
2. Transferring Data to the Map Base
Aerial photos contain displacement and distortion and do not provide mapaccuracy for measuring purposes. Photo analysis should be followed bytransfer of the detail onto a map base to provide input for a GIS. This process
–••1"
2,400" 12" =1"
200'
23
prevents duplication of effort in future monitoring and supports baseline dataacquisition for ecosystem-based management activities.
To begin map transfer, the vegetation analysis framework, the map base MMUtemplate (i.e., 1:24,000), and the GIS compilation guidelines discussed insection IV.B.2 should be used. The interpretations from the photos should becarefully compiled onto a stable base orthophoto. Detail is easier to transferfrom an aerial photo to an orthophoto because both have photo-identifiablefeatures in common. If orthophotos are not available, 7 1/2-minute topo-graphic maps can be used as a base. Discrete boundaries of the lines andpolygons, along with appropriate labels, should be transferred to the base map.If the finished compilation overlay is to be mechanically scanned, the compi-lation method for producing the most efficiently scanned overlay should firstbe determined. For example, black lines with blue attribute labels are easierto scan and edit than numerous color classes.
Once interpretations are transferred to the map base, the manual photo mensu-ration technique can be used to acquire acreage figures, which is more accuratethan direct mensuration off the photos. If the area is large and the desiredresult is analysis in a GIS, alternate data capture methods are more efficient.
3. Capturing Data in a GIS
Once the data has been compiled on a stable map base, it is ready to enter intoa GIS. A local GIS specialist should be consulted to determine the mostefficient method of input. Manual digitizing on a tablet is commonly used.Heads-up digitizing from a digital orthophoto is also a common method ofinput. Scanner technology is popular, although it is somewhat costly. A drumscanner is available for use at NSTC.

24

25
V. Using Remote Sensing for Field Applications
Methods and standards for managing riparian-wetland areas have been establishedwithin BLM’s technical reference series (TR 1737) on riparian area management.Remote sensing techniques can be applied in virtually all types of riparian-wetlandmanagement. Inventory and monitoring are more traditional uses of remotely senseddata. However, aerial photography can also assist in assessing functionality, deter-mining classification, and improving management planning processes. The table inAppendix C provides suggestions on how to use remotely sensed data for riparian-wetland management applications. Suggested scales and film types are also given.Actual scale and film selection should be determined by the intended use and size ofthe area. Resource specialists may find that other scales or film types are adequatefor their applications.
A. Inventorying and Monitoring Riparian-Wetland Areas
Remote sensing techniques have long been used to inventory and monitor riparian-wetland areas. Using the appropriate date, scale, and film, riparian-wetlandvegetation can be interpreted and measured using methods described in sectionIV. Small-scale photos give a general overall perspective of the area, includingthe geomorphology, landform, drainage pattern, and watershed area and condition.Aerial photos can be used to determine channel sinuosity, channel confinement,and valley width, and provide a more accurate basis for analysis than topographicmaps. Stereoscopic photo interpretation, along with physiographic analysis of a7 1/2-minute topographic map, allow preliminary ecological typing. Initialassessment of vegetative bank protection and water sedimentation can be performedusing medium- or large-scale aerial photos. Vegetation association and phase canbe identified using aerial photos, as discussed in-depth in Technical Reference1737-3, Inventory and Monitoring Riparian Areas, (Myers 1989). Certainly treecanopy, herbaceous cover, and to some extent, age distribution of woody dominantspecies can also be identified using aerial photos at an adequate scale.
Technical Reference 1737-8, Greenline Riparian-Wetland Monitoring (Cagney 1993),discusses methods that can utilize large-scale (1:2,400) color infrared photography.The Forest Service General Technical Report 47, Monitoring the Vegetation Resourcesin Riparian Areas (Winward 2000), offers additional, updated information on thistopic. Recommended transect length is a minimum of 726 feet along the greenline.At 1:2,400 scale, 1 inch on the aerial photo represents approximately 200 feet onthe ground. With color infrared film, vegetation composition can be differentiatedalong the transect. In fact, resolution at that scale is better than 1 foot. After fieldchecks have been conducted, interpretations can be used to support the baseline data.
The most easily detected change in a riparian-wetland area is a reduction in foliarcover and an increase in bare soil. This change may be obvious upon inspectionof the baseline (initial) photo compared with monitoring photos taken 5 to 10years later. The cause of the change may be answered only by on-the-groundinspection. The photos offer an opportunity to monitor the extent of change, butnot necessarily the cause.

26
Once baseline data is established, a monitoring plan should be initiated for thoseareas in need of more intense scrutiny. Videography is especially well suited forquick damage assessment, but resolution is much lower than conventional aerialphotography.
1. Acquiring Photos for Monitoring
The same considerations outlined for the original aerial photography contractshould be used to plan subsequent flights for monitoring purposes. Areaselection, season and time of day, film type, scale, specifications, procurement,and ground targeting requirements should follow the same criteria as theoriginal project. Flight maps used in the previous project should be referred toin designing the subsequent flights. The idea is to create conditions as closeto those of the previous flight as possible. Although not mandatory, using thesame conditions greatly simplifies interpretation.
2. Analyzing Photos for Monitoring
The old and new aerial photos over the riparian-wetland area, along withsmaller scale photos of the watershed, should be compared visually. From thiscomparison, critical areas can be evaluated and apparent changes occurring onnonstudy areas can also be detected and documented. One of the importantadvantages of a photo-based monitoring system over entirely ground-basedstudy is the ability to expand the area that can be evaluated.
It is anticipated that several key areas will already be selected prior to havingthe area reflown. These sites should be closely evaluated. Interpretation andanalysis should again be performed on these key areas and results compared.It is important to remember that critical steps performed during the initialbaseline interpretation are essential for monitoring the areas. In addition, ifthe visual comparison yielded further areas of change, a reinterpretation maybe appropriate. Once photo interpretation and analysis are complete, theprobable causes of change should be investigated.
B. Determining Classification
As with inventory and monitoring, remote sensing brings an added dimension tothe classification process, which is discussed in Technical Reference 1737-5,Riparian and Wetland Classification Review (Gebhardt et al. 1990). Possibly thegreatest benefit is the overall perspective that is provided with smaller scaleimagery. Using a broad approach allows limiting factors in the landscape tomanifest themselves. Emphasis should be placed on using the remotely senseddata as a prerequisite to the classification itself.
Technical Reference 1737-7, Procedures for Ecological Site Inventory—With SpecialReference to Riparian-Wetland Sites (Leonard et al. 1992), describes a processthat looks at the interaction between soils, climate, hydrology, and vegetation forriparian-wetland resources and uplands. This highly interdisciplinary activity

27
lends itself well to using remote sensing techniques. Using appropriate imageryof the area under study, each interdisciplinary team member can relate theirperspective of the study area. After initial team observations are made, individualstudy can be undertaken to determine such things as vegetation composition andacreage, canopy cover, bare soil, locations for gathering hydrologic information,present vegetation as compared with previous historical photos, open watersurface area, soil and surface geology characteristics, and general watershedquality.
C. Assessing Functionality
Considerable effort has been expended to inventory, classify, restore, enhance,and protect riparian-wetland areas. The following technical references define astructured interdisciplinary activity that assists resource specialists in determiningthe condition of riparian-wetland areas on public lands:
TR 1737-9, Process for Assessing Proper Functioning Condition (Prichard etal. 1993)
TR 1737-11, Process for Assessing Proper Functioning Condition for LenticRiparian-Wetland Areas (Prichard et al. 1994)
TR 1737-15, A User Guide to Assessing Proper Functioning Condition andthe Supporting Science for Lotic Areas (Prichard et al. 1998)
TR 1737-16, A User Guide to Assessing Proper Functioning Condition andthe Supporting Science for Lentic Areas (Prichard et al. 1999)
Although riparian-wetland areas are small in comparison to the vast acreage ofpublic lands, assessing the condition of all these areas is an extensive effort.Aerial photos can assist in the initial planning for functionality assessment.Remotely sensed data can be beneficial in determining existing condition, potentialcondition, resource values, planned actions, and monitoring requirements.
Aerial photos can be used to assist in completing the reporting tables shown inthese technical references to define riparian-wetland management objectives.Riverine miles, acreage, and preliminary determination of functioning conditioncan be assessed using remotely sensed data. Initial trend can be assessed usinghistorical photos. Given the appropriate scale and film type, aerial photos cansignificantly reduce field time and overall evaluation efforts.
Technical Reference 1737-12, Using Aerial Photographs to Assess Proper Func-tioning Condition of Riparian-Wetland Areas (Prichard et al. 1996), provides detailedexplanations and procedures for using aerial photography to assess condition.

28
D. Supporting Other Management Techniques
Grazing management, as discussed in Technical References 1737-4, GrazingManagement in Riparian Areas (Kinch 1989), and 1737-14, Grazing Managementfor Riparian-Wetland Areas (Leonard et al. 1997) can be enhanced by usingremotely sensed data to develop alternative strategies. Using historical photos,range conservationists are able to ascertain how management strategies used overthe years have impacted the land. Heavily grazed riparian-wetland areas anduplands are generally quite obvious on aerial photos and are stark evidence tomismanagement of the public lands. Color infrared photos exhibit the seasonaland topographic aspects of range suitability and carrying capacity. Used inallotment planning, aerial photos assist in planning livestock access points, pasturedesign, and riparian-wetland protection.
Technical Reference 1737-6, Management Techniques in Riparian Areas (Smithand Prichard 1992), discusses methods to achieve specific goals and objectives inriparian-wetland management. The basic management unit for these techniques isthe watershed. Small-scale aerial photos and satellite imagery are excellent toolsfor becoming familiar with a watershed. They allow a broader perspective thanon-site observation and present a more comprehensive picture than a topographicmap. Some of the management techniques that are enhanced by using aerialphotos include:
Fencing: Exclosures are areas that are easily distinguished on an aerial photo.Aerial photos may be used to measure and determine the amount of fencingrequired and to determine acreage associated with fenced areas.
Prescribed burns: Aerial photos can assist in prescribed burn planning. Topogra-phy and fuel characteristics are features easily identified from photos. Fire breaksand control lines can be determined. Digital image processing techniques havebeen used in the past to create fire fuels map products for states in the WesternU.S. These products, produced at a small scale, determine fuel type and burncharacteristics using remotely sensed satellite data.
Forestry practices: Forest management traditionally uses remote sensing tech-niques for planning, inventory, and monitoring.
Mineral activities: Mineral activities offer extensive opportunities to developareas of new riparian-wetland vegetation. Aerial photos and satellite imageryprovide the capability to detect surface disturbance as well as healthy plant vigor.Change detection and monitoring activities in mining areas are excellentapplications for remote sensing techniques in either a digital or manual environment.

29
Structures: Physical structures are placed in watersheds to control erosion ordegradation of a site. Aerial photos assist in planning the placement of thosestructures in addition to monitoring the effects of those structures in the future.Most failures result from trying to apply a technique that worked well for one sitewithout realizing that the new site is different. This mistake can be avoided byusing small-scale imagery, which allows the surrounding landform, soils, andwatershed to be studied to determine the possible effectiveness of the plan.
Beaver management: Beaver can be used to naturally transform pioneer woodyvegetation into physical features that result in the expansion of floodplain, riparian-wetland community structure, diversity, and productivity (Dickinson 1971).Beaver activity is uniquely evident on aerial photos. Types of adjacent woodyvegetation can also be identified by aerial photos (Parsons and Brown 1978).
Bank stabilization: Streambank stabilization efforts are aided by the use ofhistorical photos for change detection purposes. Natural erosive components ofthe surrounding landscape can help determine the potential of the area.
Recreation planning: In recreation planning, determining riparian-wetlandvalues is extremely important. The entire ecosystem should be taken into consid-eration. Photos can be used to develop future trail systems, plan site design tominimize vehicular impacts to riparian-wetland areas, evaluate adjacent uplandsfor potential hazards to human concentrations, and determine floodplain extent.
Road construction: Road construction planning should always incorporate theuse of aerial photos to help determine impacts to adjacent riparian-wetland areas.Landform, vegetation inventory, flood potential, and watershed analysis are just afew components that can be studied from an aerial perspective.

30

31
VI. Summary
Remote sensing techniques provide valuable information for riparian-wetland areamanagement. Aerial photos and satellite imagery can be used to establish baselinedata on which future management is based.
The first step in acquiring aerial photo baseline data is to define the objective of theproject, and to select the appropriate scale and film type to meet that objective. Thenresearch is conducted to determine whether photos with the desired specificationsexist.
Contracting for aerial photography is an option if appropriate photos for the area ofinterest are not available. Planning for a contract involves selecting the area; deter-mining the season, time of day to fly, and film type; and selecting the scale. Prior tothe flight, ground targets are placed to provide ground reference for determiningphoto scale, and vegetation data is collected on-site for use during analysis.
Once the photos have been acquired, interpretation can be accomplished by localBLM staff, State or NSTC personnel, or contracted photo interpreters. Interpretationprocedures consist of preparing photos, determining a minimum mapping unit(MMU), developing a vegetation analysis framework, and analyzing photos. Photomensuration derived directly from the photos is possible on smaller projects or whenapproximate measurements are acceptable.
If data is to be used for analysis purposes in a GIS environment, interpretations aretransferred to a stable map base from the photos. After transferring data to anorthophoto, digitization into a GIS is possible.
Remote sensing techniques allow resource specialists to monitor an area when fieldconditions do not allow on-site visits. Changes in management strategies for riparian-wetland areas, which are characteristically highly responsive to modifications, areeasily monitored at specified intervals. Remotely sensed data can also be used indetermining classification, assessing functionality, and supporting other managementtechniques addressed in the Riparian Area Management technical reference series.
To ensure that specific objectives are met, projects involving remote sensing must becarefully designed and executed. The NSTC remote sensing staff is available toprovide support and assistance at each stage of the project.

32

33
Literature Cited
Aldrich, R.C. 1979. Remote sensing of wildland resources: A state-of-the-art review.General Technical Report RM-71. USDA Forest Service, Rocky MountainResearch Station, Fort Collins, CO. 56 pp.
Anderson, V.J. and P.J. Hardin. 1992. Infrared photo interpretation of non-riparianwetlands. Rangelands: 14(6) 334-337.
Batson, F.T., P.E. Cuplin, and W.A. Crisco. 1987. Riparian area management: The useof aerial photography to inventory and monitor riparian areas. TR 1737-2. Bureauof Land Management, BLM/YA/PT-87/021+1737, Denver, CO. 16 pp.
Cagney, J. 1993. Riparian area management: Greenline riparian-wetland monitoring.TR 1737-8. Bureau of Land Management, BLM/SC/ST-93/001+1737, Denver, CO. 45 pp.
Crisco, W.A. 1988. Interpretation of aerial photographs. USDI, BLM/YA/PT-88/001+1268, Denver, CO. 41 pp.
Dickinson, N.R. 1971. Aerial photographs as an aid in beaver management. N.Y. Fishand Game J. 18(1):57-61.
Gebhardt, K., S. Leonard, G. Staidl, and D. Prichard. 1990. Riparian area manage-ment: Riparian and wetland classification review. TR 1737-5. Bureau of LandManagement, BLM/YA/PT-91/002+1737, Denver, CO. 56 pp.
Keating, Jr., J.B. 1993. The geo-positioning selection guide for resource management.Technical Note 389. Bureau of Land Management, BLM/SC/PT-93/002+9160,Denver, CO. 64 pp.
Kinch, G. 1989. Riparian area management: Grazing management in riparian areas.TR 1737-4. Bureau of Land Management, BLM/YA/PT-89/021+1737, Denver,CO. 48 pp.
Leonard, S., G. Staidl, J. Fogg, K. Gebhardt, W. Hagenbuck, and D. Prichard. 1992.Riparian area management: Procedures for ecological site inventory—with specialreference to riparian-wetland sites. TR 1737-7. Bureau of Land Management,BLM/SC/PT-92/004+1737, Denver, CO. 135 pp.
Mereszczak, I., J. Colmer, J. Oden, J. Almy, M. Hoppus, P. Ishikawa, Jr., H.Lachowski, J. Ward, and A. Oslin, Ph.D. 1990. Riparian area management: Whatcan remote sensing contribute? Engineering Management Series EM 7140-19.USDA, Forest Service, Washington, DC.
Myers, L.H. 1989. Riparian area management: Inventory and monitoring riparian areas.TR 1737-3. Bureau of Land Management, BLM/YA/PT-87/002+1737, Denver,CO. 79 pp.

34
Parsons, G.R. and M.K. Brown. 1978. An assessment of aerial photography interpre-tation for recognizing potential beaver colony sites. In: Trans. N.E. Sect. TWS,35th N.E. Fish & Wildlife Conference, White Sulphur Springs., WV. Pages 181-184.
Prichard, D., H. Barrett, J. Cagney, R. Clark, J. Fogg, K. Gebhardt, P. Hansen,B. Mitchell, and D. Tippy. 1993. Riparian area management: Process for assessingproper functioning condition. TR 1737-9. Bureau of Land Management, BLM/SC/ST-93/003+1737, Denver, CO. 60 pp.
Prichard, D., C. Bridges, S. Leonard, R. Krapf, and W. Hagenbuck. 1994. Riparian
area management: Process for assessing proper functioning condition for lentic
riparian-wetland areas. TR 1737-11. Bureau of Land Management, BLM/SC/
ST-94/008+1737, Denver, CO. 46 pp.
Prichard, D., P. Clemmer, M. Gorges, G. Meyer, and K. Shumac. 1996. Riparian area
management: Using aerial photographs to assess proper functioning condition of
riparian wetland areas. TR 1737-12. Bureau of Land Management, BLM/RS/
ST-96/007+1737, Denver, CO. 52 pp.
Prichard, D., J. Anderson, C. Correll, J. Fogg, K. Gebhardt, R. Krapf, S. Leonard,
B. Mitchell, and J. Staats. 1998. Riparian area management: A user guide to
assessing proper functioning condition and the supporting science for lotic areas.
TR 1737-15, Bureau of Land Management, BLM/RS/ST-98/001+1737, Denver,
CO. 136 pp.
Prichard, D., F. Berg, W. Hagenbuck, R. Krapf, R. Leinard, S. Leonard, M. Manning,
C. Noble, and J. Staats, 1999. Riparian area management: A user guide to assessing
proper functioning condition and the supporting science for lentic areas.
TR 1737-16. Bureau of Land Management, BLM/RS/ST-99/001+1737, Denver,
CO. 109 pp.
Smith, B. and D. Prichard. 1992. Riparian area management: Management techniquesin riparian areas. TR 1737-6. Bureau of Land Management, BLM/SC/PT-92/003+1737, Denver, CO. 44 pp.
Winward, A. 2000. Monitoring the vegetation resources in riparian areas. General
Technical Report RMRS-GTR-47. U.S. Department of Agriculture, Forest Service,
Rocky Mountain Research Station, Ogden, UT. 49 pp.

35
Appendix AMinimum Mapping Unit Templates

36
255 acres1"= 3,333'
1:40,000
Scale1"
1 acre10 acres
91.8 acres
871'
436'100'
50'
1"= 2,000'
1:24,000
1"
1 acre
10 acres
23 acres
1742'
871'50'
25'
1"= 1,000'
1:12,000
1"
1 acre
10 acres
436'100'

37
12.9 acres
1742'
871'50'
25'
1"= 750'
1:9,000
Scale 1"
1 acre
10 acres
436'100'
5.7 acres
1742'
871'50'
25'
1"= 500'
1:6,000
1"
10 acres
436'100'
1 acre
3.7 acres
1742'
871'50'
25'
1"= 400'
1:4,800
1"
5 acres
436'100'
1 acre

38

39
Appendix BSample Vegetation Analysis Framework

40
Riparian-Wetland Plant Community Photo Analysis Form(can be attached on photo or overlay when complete)
Site NamePhoto NumberDateInterpreter
Dominant Species Groups
1. Herbaceous Vegetation - Minimum Mapping Unit (MMU) is 1 acre. Herba-ceous vegetation is dominant and comprises 75% or more of the ground cover.Shrubs and trees may be present but amount to less than MMU.
1____________acres
2. Shrubs - MMU is 1 acre. Shrubs are dominant and comprise 75% or more ofcanopy. Trees and herbaceous vegetation may be present but amount to lessthan MMU.
2____________acres
3. Trees - MMU is 1 acre. Trees 10 feet high are dominant and comprise 75% ormore of canopy. Shrubs and herbaceous vegetation may be present butamount to less than MMU.
3____________acres
4. Riparian-Wetland Vegetation - Scarce or absent. A linear measurement of thelength of stream where there is an absence of riparian-wetland vegetation inMMU amounts. If less than 200 feet in length, disregard and include in othertypes (dominant or mixed).
4____________acres
Mixed Communities
MMUs of mixed types are 1 acre. Tree, shrub, or herbaceous vegetation less than75% cover with a lesser amount of one or two other groups included in a mixedcommunity.
5. Shrub/herbaceous vegetation 5____________acres
6. Tree/herbaceous vegetation 6____________acres
7. Tree/shrub 7____________acres
8. Tree/shrub/herbaceous vegetation 8____________acres
Total riparian-wetland ____________acres

41
Appendix CRemote Sensing Application Guide for Riparian-Wetland Management

42
General Comments
1) The Scale column indicates suggested scales only. Appropriate scale selection isdependent on the size of the area under consideration. Larger or smaller scalesmay be used for the applications listed, but may create more interpretive work forthe analyst. Scale selection should be carefully determined based on the area ofconsideration and the intended use.
2) Scale column abbreviations represent the following:
L = Large scale (1:2,400 to 1:12,000)M= Medium scale (1:15,840 to 1:30,000)S = Small scale (< 1:30,000)
3) The Film Type column indicates suggested film types only. In many instances,other film types are also appropriate for the applications listed.
4) Film Type column abbreviations represent the following:
B = Black and whiteC = Natural colorI = False color infraredS = Satellite imagery
5) The following table provides examples of various remote sensing applications thatcan be used in riparian-wetland management. This list of applications is by nomeans inclusive.

43
Remote Sensing Application Guide forRiparian-Wetland Management*
Film Task/Application Scale Type Comments
Project Planning
Synoptic view S B/I/S Provides an overall perspective of the area;
general condition, limiting factors, water-
shed delineation; ecoregion
delineation.
Linear miles S B/C/I Derived from descriptive scale.
Area identification S B/C/I /S Locating areas in need of further
examination; defining reaches; identifying
field inventory sites.
Geomorphology/landform S C Slope, aspect, relief.
Drainage pattern S B
Inventory Technical References 1737-2**; 1737-3
Riparian-wetland M I Springs, seeps, wet meadow as habitat
type related to the associated vegetation.
Vegetation
Acreage determination L C/I Interpretations should be transferred to an
orthophoto for map accuracy calculation.
The photo scale needed is dependent on
the size of the riparian-wetland areas to be
measured.
Density L I Cottonwoods, willows.
Reproduction L I Young trees, but not seedlings.
Structure L C Height of vegetation.
Streambank shade L C
Streambank stability L I Associated with vegetation composition.
Species composition L I Cottonwoods, willows.
Percent cover L I Trees, shrubs, herbaceous, bare soil.
Hydrology
Stream width M C
Floodplain M C
Streambed silt M I
Stream channel stability M C
& movement
Channel sinuosity S C/I Photos often identify current channel
patterns better than older 7 1/2-minute
topographic maps.

44
FilmTask/Application Scale Type Comments
Soils
Soil determination M B/C Assists in identifying and recording soil
information.
Soil characteristics M B/C
Setting & associated M C Slope, aspect, relief, wetness.
land features
Classification Technical References 1737-5; 1737-7
Potential M B/C/I Compare historical photography to
determine past management practices.
Limiting factors S C Look at a larger area to determine
possible factors effecting riparian-wetlands
in the area of interest.
Field site planning S C/I Use to identify locations for gathering
vegetation, hydrology, and soils data.
General watershed quality S C/I Provides broad perspective of watershed.
Surface geology S C
Open water surface area M C/I Scale depends on size of water body.
Acreage determination L C/I See Inventory section.
Assessing Functionality Technical References 1737-9; 1737-11;
1737-12; 1737-15; 1737-16
Planning
Existing condition L I Scale is dependent on the size of the
riparian-wetland area.
Potential condition L I Use historical photography to assess.
Resource values M C/I Beaver dams, waterfowl habitat; evaluate
surrounding ecovalues.
Management technique M C/I See Management Planning section.
planning
Monitoring — — See Monitoring section.
Preliminary assessment M I Use smaller scale imagery to assess a
of functionality large area, then focus on areas that
appear to need further investigation.

45
FilmTask/Application Scale Type Comments
Reporting tables
Riverine/miles S I General assessment.
Riverine/nonriverine acres S I General assessment.
Functional condition M I General indicators.
Trend M C/I General indicators using historical
photography.
Management Planning Technical References 1737-4**; 1737-6;
1737-14
Grazing M C/I Allotment planning applications.
Ecosystem-based S C/I Provides a synoptic view of an area.
evaluation
Project planning Aerial photos are important ancillary data
that should be examined prior to any
management decision.
Exclosures M C
Prescribed burns M C/I
Physical structures M C
Streambank stabilization M C
Road construction M C
Mineral activities M C
Recreation planning M C
Monitoring Technical References 1737-2**; 1737-3;
1737-8** and General Technical Report 47.
All applications that are listed in the
Inventory section apply to monitoring.
Trend — — Monitoring should attempt to replicate
previous scale and film type as closely as
possible.
* This table is not intended as an all-inclusive list of applications for riparian-wetland management.** This publication is out of print. Copies may be available in libraries.

46

47
Appendix DAerial Photo Samples

48
Photo 1a
Photo 1b
Photo 1a is a portion of a naturalcolor aerial photo of Texas Creek,Colorado, acquired October 14,1976, at approximately 1:15,840scale (i.e., 1 inch represents 1,320feet). The arrow in the aerial shotindicates the gravel bar and bareground seen in Photo 1b, which isa ground shot of the same area.
Photo 1b depicts on-the-groundconditions for Texas Creek inSeptember 1976. The gravel barand bare ground are obviousindicators of a nonfunctionalstream.

49
Photo 2a
Photo 2b
Photo 2a is a portion of a colorinfrared aerial photo of TexasCreek, Colorado, acquired July 9,1983, at approximately 1:24,000scale (i.e., 1 inch represents2,000 feet). The photo showsevidence of revegetation alongthe streambank, and the gravelbars are no longer evident.
Photo 2b shows Texas Creek inJune 1978 in a functional — atrisk condition. Managementactions were changed in 1977 toreverse the trend of Texas Creekand allow the area to progresstowards its capability andpotential.
50
Photo 3a
Photo 3b
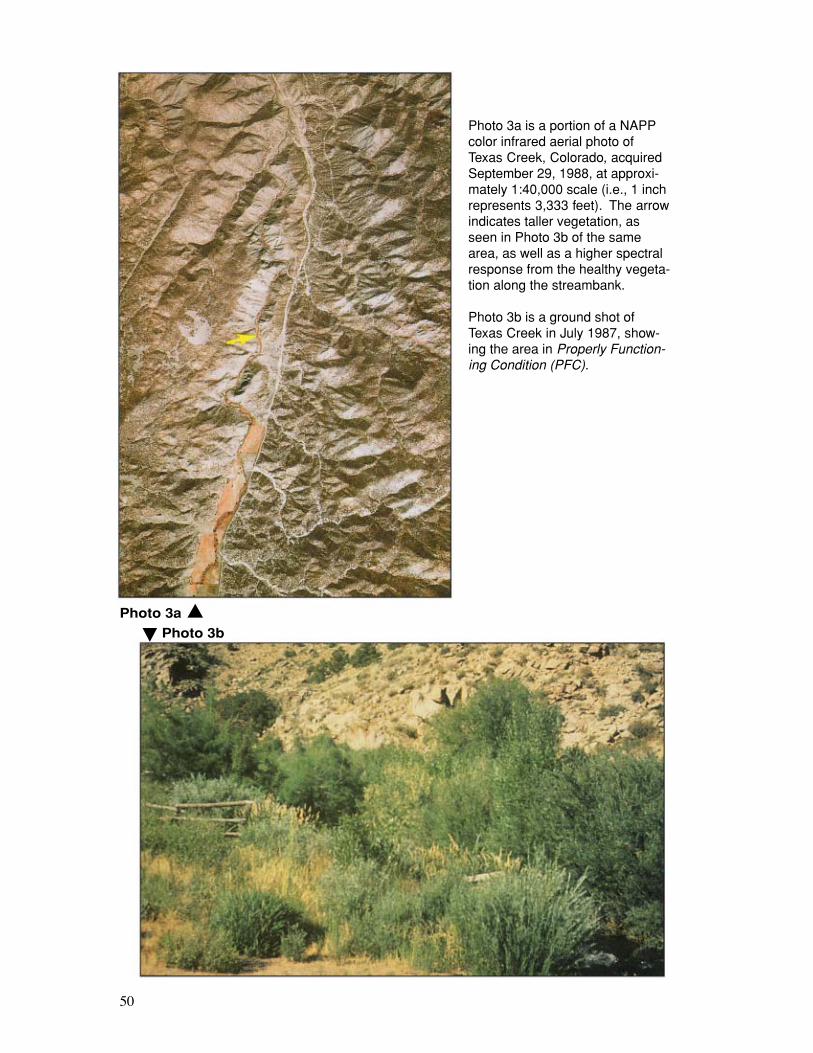
Photo 3a is a portion of a NAPPcolor infrared aerial photo ofTexas Creek, Colorado, acquiredSeptember 29, 1988, at approxi-mately 1:40,000 scale (i.e., 1 inchrepresents 3,333 feet). The arrowindicates taller vegetation, asseen in Photo 3b of the samearea, as well as a higher spectralresponse from the healthy vegeta-tion along the streambank.
Photo 3b is a ground shot ofTexas Creek in July 1987, show-ing the area in Properly Function-ing Condition (PFC).
51
Photo 4 is an enlargement of the NAPP color infrared aerial photo (Photo 3a) of TexasCreek, Colorado, to approximately 1:24,000 scale.
Photo 4

52
Photo 5 is a portion of a color infrared aerial photo of Muddy Creek, Wyoming, acquiredAugust 17, 1993, at approximately 1:3,000 scale (i.e., 1 inch represents 250 feet).
Photo 5
53
Photo 6a is a portion of a colorinfrared aerial photo of the BlackfootRiver, Idaho, acquired August 2, 1993,at approximately 1:4,800 scale (i.e., 1inch represents 400 feet). The arrowsindicate where ground targets (pan-els) are visible. Targeting should beannotated on topographic maps,along with distance between targetsand dominant vegetation information.The box shown on a portion of a1:24,000-scale topographic map (6b)corresponds to the area shown in theaerial photo.
Photo 6a
6b

54
Photo 7 is a portion of a color infrared aerial photo of Tabor Creek, Nevada, acquiredJuly 16, 1984, at approximately 1:2,400 scale (i.e., 1 inch represents 200 feet).Interpretations were compiled on clear mylar overlays registered to the fiducial marks onthe photo.
Photo 7

55
Form ApprovedOMB No. 0704-0188
Public reporting burden for this collection of information is estimated to average 1 hour per response, including the time for reviewing instructions, searching existing data sources, gathering andmaintaining the data needed, and completing and reviewing the collection of information. Send comments regarding this burden estimate or any other aspect of this collection of information,including suggestions for reducing this burden, to Washington Headquarters Services, Directorate for Information Operations and Reports, 1215 Jefferson Davis Highway, Suite 1204, Arlington,VA 22202-4302, and to the Office of Management and Budget, Paperwork Reduction Project (0704-0188), Washington, DC 20503.
5. FUNDING NUMBERS
12b. DISTRIBUTION CODE
18. SECURITY CLASSIFICATIONOF THIS PAGE
20. LIMITATION OF ABSTRACT
Standard Form 298 (Rev. 2-89)Prescribed by ANSI Std. Z39-18
298-102
NSN 7540-01-280-5500
REPORT DOCUMENTATION PAGE
4. TITLE AND SUBTITLE
1. AGENCY USE ONLY (Leave blank) 2. REPORT DATE 3. REPORT TYPE AND DATES COVERED
6. AUTHOR(S)
7. PERFORMING ORGANIZATION NAME(S) AND ADDRESS(ES) 8. PERFORMING ORGANIZATIONREPORT NUMBER
9. SPONSORING/MONITORING AGENCY NAME(S) AND ADDRESS(ES) 10. SPONSORING/MONITORINGAGENCY REPORT NUMBER
11. SUPPLEMENTARY NOTES
12a. DISTRIBUTION/AVAILABILITY STATEMENT
13. ABSTRACT (Maximum 200 words)
14. SUBJECT TERMS 15. NUMBER OF PAGES
16. PRICE CODE
17. SECURITY CLASSIFICATIONOF REPORT
19. SECURITY CLASSIFICATIONOF ABSTRACT
Unclassified Unclassified Unclassified UL
Revision to September 1994 version
Pam Clemmer
BLM/ST/ST-01/002+1737(formerly BLM/SC/ST-94/005+1737)
January 2001
RIPARIAN AREA MANAGEMENT TR 1737-10The Use of Aerial Photography to Manage Riparian-Wetland Areas
U.S. Department of the InteriorBureau of Land ManagementNational Science and Technology CenterP.O. Box 25047Denver, CO 80225-0047
This technical reference was originally produced as an enhanced version of RIPARIAN AREA MANAGEMENT TR 1737-2,The Use of Aerial Photography to Inventory and Monitor Riparian Areas. This document is a revision to its original versionpublished in September 1994.
This technical reference provides basic information, concepts, and procedures associated with usingaerial photography to establish baseline data for effective management of riparian-wetland areas.Suggestions for the use of various scales of photography, guidance for acquiring aerial photography,and general procedures for conducting a vegetation inventory are included.
• Aerial photography • Wetlands• Remote sensing • Monitoring• Riparian area management
64 + covers

56

57

58

59
The mention of trade names or commercial products does not constitute endorsement or recommendation for useby the Federal Government.

60