riparian area management - bureau of land management · riparian area management a user guide to...
TRANSCRIPT

U.S. Department of the Interior
Bureau of Land Management
RIPARIAN AREA MANAGEMENT
TR 1737-16 1999, Revised 2003
A User Guide to Assessing ProperFunctioning Condition and
the Supporting Science for Lentic Areas
U.S. Department of Agriculture
Forest Service
U.S. Department of Agriculture
Natural Resources Conservation Service

Copies available from:
Bureau of Land ManagementNational Business Center
BC-650BP.O. Box 25047
Denver, Colorado 80225-0047
BLM/RS/ST-99/001+1737+REV03
RIPARIAN AREA MANAGEMENT
A User Guide to Assessing ProperFunctioning Condition and
the Supporting Science for Lentic Areas
by
Don Prichard - Work Group LeaderFishery Biologist/Riparian-Wetland Coordinator
Bureau of Land ManagementNational Applied Resource Sciences Center, Colorado
Work Group
Technical Reference 1737-161999, revised 2003
U.S. Department of the InteriorBureau of Land Management
National Applied Resource Sciences CenterP.O. Box 25047
Denver, CO 80225-0047
Forrest BergStream Mechanics Engineer
Natural Resources Conservation ServiceRiparian/Wetland Technical Team
Bozeman, Montana
Warren HagenbuckRegional Wetland Coordinator (retired)
U.S. Fish and Wildlife ServiceAlbuquerque, New Mexico
Russ KrapfSoil Scientist
Bureau of Land ManagementNational Training Center
Phoenix, Arizona
Robert LeinardPlant Ecologist
Natural Resources Conservation ServiceRiparian/Wetland Technical Team
Bozeman, Montana
Steve LeonardRiparian Ecologist/Grazing Management Specialist
Bureau of Land ManagementNational Riparian Service Team
Prineville, Oregon
Mary ManningEcologist
Forest ServiceNorthern Region
Missoula, Montana
Chris NobleSoil Scientist
Natural Resources Conservation Service Riparian/Wetland Technical Team
Bozeman, Montana
Janice StaatsHydrologist
Forest ServiceNational Riparian Service Team
Prineville, Oregon

iii
Acknowledgments
The authors would like to thank the following individuals for the time they offeredin review, comment, and development of this document: Al Amen, MarkBiddlecomb, Clay Bridges, Pam Clemmer, Mary D’Aversa, Jim Fogg, KarlGebhardt, Paula Ledford, Ramone McCoy, and Paul Summers from the Bureau ofLand Management; Lorena Corzatt and Susan Holtzman from the Forest Service;and Terry Costner, Marcus Miller, and Sandy Wyman from the Natural ResourcesConservation Service.
The authors also extend a special thank you to Linda Hill and Jennifer Kapus of theNational Applied Resource Sciences Center, and to the National Business Center, fordoing a fine job in editing, layout, design, and production of the final document.

v
Contents
Page
Acknowledgments . . . . . . . . . . . . . . . . . . . . . . . . . . . . . . . . . . . . . . . . . . . . . . . . .iii
I. Introduction . . . . . . . . . . . . . . . . . . . . . . . . . . . . . . . . . . . . . . . . . . . . . . . . . .1
II. Method Development . . . . . . . . . . . . . . . . . . . . . . . . . . . . . . . . . . . . . . . . . .3
III. Definitions . . . . . . . . . . . . . . . . . . . . . . . . . . . . . . . . . . . . . . . . . . . . . . . . . . .5
IV. PFC Assessment Procedure . . . . . . . . . . . . . . . . . . . . . . . . . . . . . . . . . . . . . .7A. Review Existing Documents . . . . . . . . . . . . . . . . . . . . . . . . . . . . . . . . . .7B. Analyze the Definition of PFC . . . . . . . . . . . . . . . . . . . . . . . . . . . . . . . . .7C. Assess Functionality . . . . . . . . . . . . . . . . . . . . . . . . . . . . . . . . . . . . . . . . .8
1. Attributes and Processes . . . . . . . . . . . . . . . . . . . . . . . . . . . . . . . . . . .82. Capability and Potential . . . . . . . . . . . . . . . . . . . . . . . . . . . . . . . . . .103. Functioning Condition . . . . . . . . . . . . . . . . . . . . . . . . . . . . . . . . . . . .114. Functional Rating . . . . . . . . . . . . . . . . . . . . . . . . . . . . . . . . . . . . . . .13
D. Institute the Process . . . . . . . . . . . . . . . . . . . . . . . . . . . . . . . . . . . . . . . .141. Planning . . . . . . . . . . . . . . . . . . . . . . . . . . . . . . . . . . . . . . . . . . . . . .142. Management . . . . . . . . . . . . . . . . . . . . . . . . . . . . . . . . . . . . . . . . . . .153. Monitoring . . . . . . . . . . . . . . . . . . . . . . . . . . . . . . . . . . . . . . . . . . . .16
V. Quantification of Checklist Items . . . . . . . . . . . . . . . . . . . . . . . . . . . . . . . . .17A. Hydrology . . . . . . . . . . . . . . . . . . . . . . . . . . . . . . . . . . . . . . . . . . . . . . .18
Item 1: Riparian-wetland area is saturated at ornear the surface or inundated in “relatively frequent” events . . . . . . .19
Item 2: Fluctuation of water levels is not excessive . . . . . . . . . . . . . . .23Item 3: Riparian-wetland area is enlarging or has achieve
potential extent . . . . . . . . . . . . . . . . . . . . . . . . . . . . . . . . . . . . . . . . .24Item 4: Upland watershed is not contributing to
riparian-wetland degradation . . . . . . . . . . . . . . . . . . . . . . . . . . . . . . .26Item 5: Water quality is sufficient to support
riparian-wetland plants . . . . . . . . . . . . . . . . . . . . . . . . . . . . . . . . . . .30Item 6: Natural surface or subsurface flow patterns are not altered
by disturbance (i.e., hoof action, dams, dikes, trails, roads,rills, gullies, drilling activities) . . . . . . . . . . . . . . . . . . . . . . . . . . . . .31
Item 7: Structure accommodates safe passage of flows(e.g., no headcut affecting dam or spillway) . . . . . . . . . . . . . . . . . . .32
B. Vegetation . . . . . . . . . . . . . . . . . . . . . . . . . . . . . . . . . . . . . . . . . . . . . . .33Item 8: There is diverse age-class distribution of riparian-wetland
vegetation (recruitment for maintenance/recovery) . . . . . . . . . . . . . .34Item 9: There is diverse composition of riparian-wetland vegetation
(for maintenance/recovery) . . . . . . . . . . . . . . . . . . . . . . . . . . . . . . . .36
vi
Item 10: Species present indicate maintenance ofriparian-wetland soil moisture characteristics . . . . . . . . . . . . . . . . . .37
Item 11: Vegetation is comprised of those plants orplant communities that have root masses capable ofwithstanding wind events, wave flow events, or overland flows(e.g., storm events, snowmelt) . . . . . . . . . . . . . . . . . . . . . . . . . . . . . .39
Item 12: Riparian-wetland plants exhibit high vigor . . . . . . . . . . . . . . .40Item 13: Adequate riparian-wetland vegetative cover is
present to protect shoreline/soil surface and dissipate energyduring high wind and wave events or overland flows . . . . . . . . . . . .42
Item 14: Frost or abnormal hydrologic heaving is not present . . . . . . . .43Item 15: Favorable microsite condition (i.e., woody material,
water temperature, etc.) is maintained by adjacent sitecharacteristics . . . . . . . . . . . . . . . . . . . . . . . . . . . . . . . . . . . . . . . . . .45
C. Erosion/Deposition . . . . . . . . . . . . . . . . . . . . . . . . . . . . . . . . . . . . . . . . .47Item 16: Accumulation of chemicals affecting plant
productivity/composition is not apparent . . . . . . . . . . . . . . . . . . . . . .47Item 17: Saturation of soils (i.e., ponding, flooding frequency,
and duration) is sufficient to compose and maintain hydric soils . . . .48Item 18: Underlying geologic structure/soil material/permafrost
is capable of restricting water percolation . . . . . . . . . . . . . . . . . . . . .51Item 19: Riparian-wetland is in balance with the water and
sediment being supplied by the watershed (i.e., no excessiveerosion or deposition) . . . . . . . . . . . . . . . . . . . . . . . . . . . . . . . . . . . .52
Item 20: Islands and shoreline characteristics (i.e., rocks, coarseand/or large woody material) are adequate to dissipate windand wave event energies . . . . . . . . . . . . . . . . . . . . . . . . . . . . . . . . . .53
VI. Summary . . . . . . . . . . . . . . . . . . . . . . . . . . . . . . . . . . . . . . . . . . . . . . . . . . .55
Appendix A: Riparian-Wetland Lentic Checklist . . . . . . . . . . . . . . . . . . . . . . . . .57
Appendix B: Potential and Capability Examples . . . . . . . . . . . . . . . . . . . . . . . . .63
Appendix C: Lentic Riparian-Wetland Examples . . . . . . . . . . . . . . . . . . . . . . . .77
Appendix D: PFC—What It Is and What It Isn’t . . . . . . . . . . . . . . . . . . . . . . . .89
Appendix E: Common Wetlands . . . . . . . . . . . . . . . . . . . . . . . . . . . . . . . . . . . . .93
Appendix F: Problem Wetlands . . . . . . . . . . . . . . . . . . . . . . . . . . . . . . . . . . . . .97
Literature Cited . . . . . . . . . . . . . . . . . . . . . . . . . . . . . . . . . . . . . . . . . . . . . . . . .103
Glossary of Terms . . . . . . . . . . . . . . . . . . . . . . . . . . . . . . . . . . . . . . . . . . . . . . .109

1
A User Guide to Assessing ProperFunctioning Condition and
the Supporting Science for Lentic Areas
I. Introduction
Riparian-wetland areas are some of our most productive resources. They are highlyprized for their recreation, fish and wildlife, water supply, cultural, and historicvalues, as well as for their economic values, which stem from their use for livestockproduction, timber harvest, and mineral extraction.
This document provides guidance for assessing the condition of any riparian-wetlandarea other than a lotic (riverine) area. These areas, which are called lentic areas, notonly include jurisdictional wetlands as defined by the U.S. Army Corps of Engineers(1987), but also nonjurisdictional areas (e.g., deep water, freshwater, saline, marine,and estuarine) that provide enough available water to the root zone to establish andmaintain riparian-wetland vegetation.
Proper functioning condition (PFC) is a qualitative method for assessing the condi-tion of riparian wetland areas. The term PFC is used to describe both the assessmentprocess and a defined, on the-ground condition of a riparian-wetland area.
The PFC assessment refers to a consistent approach for considering hydrology,vegetation, and erosion/deposition (soils) attributes and processes to assess thecondition of riparian wetland areas. A checklist is used for the PFC assessment(Appendix A), which synthesizes information that is basic for determining ariparian-wetland area’s health.
The on-the-ground condition termed PFC refers to how well the physical processesare functioning. PFC is a state of resiliency that will allow a lentic riparian-wet-land area to hold together during wind and wave action events or overland flowevents with a high degree of reliability. This resiliency allows an area to then pro-duce desired values, such as waterfowl habitat, neotropical bird habitat, or forageover time. Riparian-wetland areas that are not functioning properly cannot sustainthese values.
PFC is a qualitative assessment based on quantitative science. The PFC assessmentis intended to be performed by a trained and experienced interdisciplinary (ID) team.Quantitative techniques support the PFC checklist and should be used in conjunctionwith the PFC assessment for individual calibration, where answers are uncertain, orwhere experience is limited. PFC is also an appropriate starting point for deter-mining and prioritizing the type and location of quantitative inventory or monitoringnecessary.

2
The PFC assessment has proven to be an excellent communication tool for bringingdiverse groups to consensus. This process provides a common vocabulary for iden-tifying the building blocks for the development of desired condition (DC) andresulting values.
Again, the method developed for assessing PFC is qualitative and is based on usinga checklist to make a relatively quick determination of condition. The purpose ofthis technical reference is to explain how this methodology was developed for lenticareas and to assist an ID team in answering checklist items by providing examplesof and references to methods of quantification where necessary.
3
II. Method Development
The Bureau of Land Management (BLM), the Fish and Wildlife Service (FWS), andthe Natural Resources Conservation Service (NRCS), formerly the Soil ConservationService, worked together to develop the PFC method. The methodology forassessing the condition of running water (lotic) systems is presented in BLMTechnical Reference (TR) 1737-9, Process for Assessing Proper FunctioningCondition (Prichard et al. 1993), and the methodology for standing water (lentic)systems is presented in TR 1737-11, Process for Assessing Proper FunctioningCondition for Lentic Riparian-Wetland Areas (Prichard et al. 1994).
Technical Reference 1737-15, A User Guide to Assessing Proper FunctioningCondition and the Supporting Science for Lotic Areas (Prichard et al. 1998) providesthe background for how the PFC tool was developed. The PFC method has beenimplemented by BLM and adopted by several other agencies. In 1996, the BLMand the USDA Forest Service (FS) announced a cooperative riparian-wetland man-agement strategy, which would include the NRCS as a principal partner. A NationalRiparian Service Team was formed to act as a catalyst for implementing thisstrategy.
This cooperative strategy recognized that if riparian-wetland areas are to be produc-tive, they have to be managed on a watershed basis, which requires working togetheracross ownership boundaries. To be successful, the agencies would need to usecommon terms and definitions and determine a minimum method for evaluating thecondition of riparian-wetland areas. The BLM and the FS identified the PFCmethod as the starting point—as the minimum level of assessment for riparian-wetland areas.

5
III. Definitions
To assess the condition of a riparian-wetland area, there must be a gauge to measureagainst. The definition of PFC in TR 1737-9 and TR 1737-15 establishes the gaugefor assessing lotic systems. This definition has to be adjusted for lentic systemsbecause they are affected by wind and wave energies or overland flow energiesversus high flow events, and they typically have a restrictive layer (e.g., geologicstructure/soil material/permafrost/manmade restrictive layer) that limits water perco-lation and maintains the site:
Proper Functioning Condition - Lentic riparian-wetland areas are func-tioning properly when adequate vegetation, landform, or debris is present to:dissipate energies associated with wind action, wave action, and overlandflow from adjacent sites, thereby reducing erosion and improving waterquality; filter sediment and aid floodplain development; improve flood-waterretention and ground-water recharge; develop root masses that stabilizeislands and shoreline features against cutting action; restrict water percola-tion; develop diverse ponding characteristics to provide the habitat and thewater depth, duration, and temperature necessary for fish production, water-bird breeding, and other uses; and support greater biodiversity.
The components of this definition are in order relative to how processes work on theground.
When adequate vegetation, landform, or debris is present to dissipate energy associ-ated with wind and wave action or overland flow, then a number of physical changesbegin to occur, such as reduced erosion, floodplain development, and improvedflood-water retention. As physical aspects of an area begin to function, they start theprocess of developing wetland characteristics. These physical aspects have to befunctioning properly to sustain characteristics that provide habitat for resourcevalues.
For areas that are not functioning properly, changes have to be made to allow themto recover (e.g., acquire adequate vegetation). A change such as increasing vegeta-tion cover results in changes that improve function. Recovery starts with having theright elements present to dissipate energy, which puts the physical process intoworking order and provides the foundation to sustain the desired condition.
Each riparian-wetland area has to be judged against its capability and potential. Thecapability and potential of natural riparian-wetland areas are characterized by theinteraction of three components: 1) hydrology, 2) vegetation, and 3) erosion/deposition (soils).
Potential is defined as the highest ecological status a riparian-wetland areacan attain given no political, social, or economical constraints; it is oftenreferred to as the “potential natural community” (PNC).

6
Capability is defined as the highest ecological status a riparian-wetland areacan attain given political, social, or economical constraints. These con-straints are often referred to as limiting factors.
Examples of how both potential and capability apply to the checklist and rating canbe found in Appendix B. A more detailed discussion on potential and capability isfound in Appendix B of TR 1737-15.
If a riparian-wetland area is not in PFC, it is placed into one of three other cate-gories:
Functional—At Risk - Riparian-wetland areas that are in functional condi-tion, but that have an existing soil, water, or vegetation attribute that makesthem susceptible to degradation.
Nonfunctional - Riparian-wetland areas that clearly are not providing ade-quate vegetation, landform, or woody debris to dissipate energies associatedwith flow events, and thus are not reducing erosion, improving water quality,etc.
Unknown - Riparian-wetland areas for which there is a lack of sufficientinformation to make any form of determination.

7
IV. PFC Assessment Procedure
The process for assessing lentic areas involves reviewing existing documents, ana-lyzing the PFC definition, and assessing functionality using an ID team. Each stepis important because it provides a foundation and a certain level of understandingnecessary to complete the next step.
A. Review Existing Documents
An ID team should review TR 1737-9, TR 1737-11, and TR 1737-15 beforeassessing functioning condition of lentic riparian-wetland areas. The ID team shouldalso review the other technical references identified in TR 1737-9 and TR 1737-15,which provide a basis for assessing PFC, as well as thought processes that will beuseful in assessing the functional status of any riparian wetland area. Reviewingthese documents helps an ID team develop an understanding of the concepts of theriparian-wetland area they are assessing.
Other documents to review may include Classification of Wetland and DeepwaterHabitats of the United States (Cowardin et al. 1979), local riparian-wetland vegetationclassifications, soil survey reports, and riparian-wetland ecological site descriptions.
The level of information necessary to assess PFC for lentic riparian-wetland areaswill vary. Some will require the magnitude of effort provided by an ecological siteinventory (ESI) to assess functionality, while others can be assessed by using thelentic checklist in Appendix A. Information pertaining to ESI applications can befound in BLM’s TR 1737-7, Procedures for Ecological Site Inventory—with SpecialReference to Riparian-Wetland Sites (Leonard et al. 1992a).
When using the PFC method to assess functioning condition, existing files should bereviewed for pertinent information. For some riparian-wetland areas, enough infor-mation may exist to assess functionality without having to go to the field. However,field verification is desirable, if not necessary, in most cases. For other areas, theexisting information will be useful in establishing capability and potential or trend.
B. Analyze the Definition of PFC
When assessing PFC for lentic riparian-wetland areas, the definition of PFC must beanalyzed. One way to do this is by breaking the definition down as follows:
Lentic riparian-wetland areas are functioning properly when adequate vegetation,landform, or debris is present to:
• dissipate energies associated with wind action, wave action, and overlandflow from adjacent sites, thereby reducing erosion and improvingwater quality;
• filter sediment and aid floodplain development;

8
• improve flood-water retention and ground-water recharge; • develop root masses that stabilize islands and shoreline features against
cutting action;• restrict water percolation;• develop diverse ponding characteristics to provide the habitat and the
water depth, duration, and temperature necessary for fish production,waterbird breeding, and other uses;
• and support greater biodiversity.
Lentic riparian-wetland areas are functioning properly when there is adequate sta-bility present to provide the listed benefits applicable to a particular area. Theanalysis must be based on the riparian-wetland area's capability and potential. If, forexample, the system does not have the potential to support woody vegetation, thatcriteria would not be used in the assessment.
C. Assess Functionality
Assessing the condition of a lentic riparian-wetland area requires an ID team to lookat the entire area. Attributes and processes do not always occur in equal balancethroughout a lentic riparian wetland area. For example, overland flow might enter agiven riparian-wetland area at one end and exit at the opposite end. In order toanswer specific items on the lentic checklist, an ID team is going to have to go tothe location where water and sediment are being supplied from the watershed toassess balance, to the location of the outlet to assess safe passage of flows, and lookat the entire area to determine if flow patterns are altered by disturbance.
Stratified sampling may be appropriate for lentic areas when you assess and extrapo-late from one riparian-wetland area to another area of the same type as long as envi-ronmental, management, and other factors relating to the assessment are constant.Even when these factors are constant, current aerial photos need to be checked toensure conditions are the same. The procedure to do this is explained in BLM’s TR1737-12, Using Aerial Photographs to Assess Proper Functioning Condition ofRiparian-Wetland Areas (Prichard et al. 1996).
1. Attributes and Processes
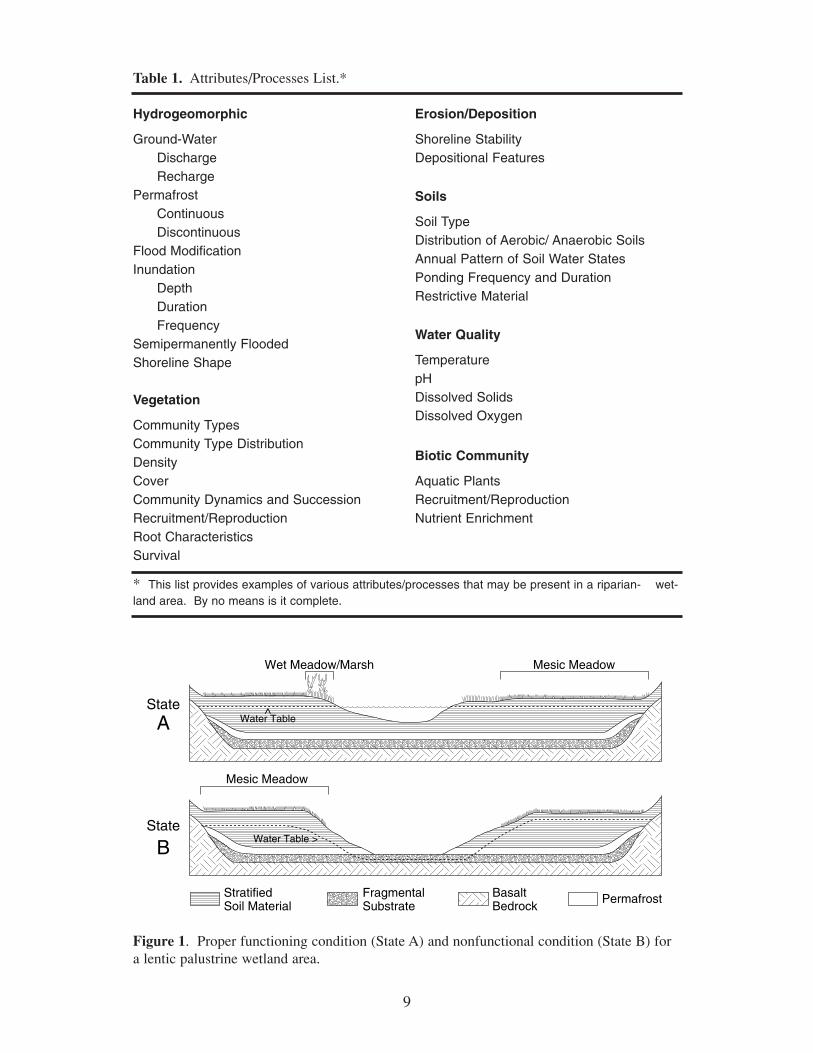
Assessing PFC involves understanding the attributes and processes occurring in alentic riparian wetland area. An ID team must determine the attributes and processesimportant to the riparian wetland area that is being assessed. If they do not spendthe time to develop an understanding of the processes affecting an area, their judge-ment about PFC will be incomplete and may be incorrect. The attributes andprocesses for the area being evaluated need to be identified. Table 1 provides a list ofattributes and processes that may occur in any given lentic riparian-wetland area.
To understand these processes, an example of an Alaskan palustrine wetland area inboth a functional and nonfunctional condition is provided in Figure 1. Applying the
9
Hydrogeomorphic
Ground-WaterDischargeRecharge
PermafrostContinuousDiscontinuous
Flood ModificationInundation
DepthDurationFrequency
Semipermanently FloodedShoreline Shape
Vegetation
Community TypesCommunity Type DistributionDensityCoverCommunity Dynamics and SuccessionRecruitment/Reproduction Root CharacteristicsSurvival
Erosion/Deposition
Shoreline StabilityDepositional Features
Soils
Soil TypeDistribution of Aerobic/ Anaerobic SoilsAnnual Pattern of Soil Water StatesPonding Frequency and DurationRestrictive Material
Water Quality
TemperaturepHDissolved SolidsDissolved Oxygen
Biotic Community
Aquatic PlantsRecruitment/ReproductionNutrient Enrichment
Table 1. Attributes/Processes List.*
* This list provides examples of various attributes/processes that may be present in a riparian- wet-land area. By no means is it complete.
Mesic MeadowWet Meadow/Marsh
^Water Table
Water Table >
Mesic Meadow
StratifiedSoil Material
FragmentalSubstrate
BasaltBedrock
Permafrost
State
B
StateA
Figure 1. Proper functioning condition (State A) and nonfunctional condition (State B) fora lentic palustrine wetland area.

10
PFC definition, State A would be classified as PFC. Important attributes andprocesses present for State A are:
Hydrogeomorphic - Continuous permafrost; shoreline shape; and depth, duration, and frequency of inundation.
Vegetation - Community types and distribution, recruitment and reproduction, root density, community dynamics, and survival.
Erosion/Deposition - Shoreline stability.
Soils - Distribution of anaerobic soil and ponding frequency and duration.
Water Quality - No change.
Biotic Community - Aquatic plant recruitment and reproduction.
Land activities and natural processes that disrupt the permafrost layer would resultin State A progressing to State B. State B would be classified as nonfunctional.The following changes in attributes and processes are likely in State B:
Hydrogeomorphic - Continuous permafrost (lost); shoreline shape (changed);and depth, duration, and frequency of inundation (decreased).
Erosion/Deposition - Shoreline stability (decreased).
Soils - Distribution of anaerobic soil and ponding frequency and duration (decreased).
Water Quality - Temperature (increased), pH (changed).
Biotic Community - Aquatic plant recruitment and reproduction (decreased).
The previous example is found in Alaska and represents only one of many types oflentic riparian wetlands. However, it is important to remember that there are othertypes and that:
Riparian-wetland areas do have fundamental commonalities in how theyfunction, but they also have their own unique attributes. Riparian-wetlandareas can and do function quite differently. As a result, most areas need tobe evaluated against their own capability and potential. Even for similarareas, human influence may have introduced component(s) that havechanged the area's capability and potential. Assessments, to be correct, mustconsider these factors and the uniqueness of each area.
2. Capability and Potential
Determining functionality of lentic riparian-wetland areas involves determining anarea's capability and potential. The approach is:
• Look for reference areas (relic areas, exclosures, preserves, etc.).• Seek out historic photos, survey notes, and/or documents that indicate
historic condition.
11
• Search out species lists (animals and plants - historic and present).• Determine species habitat needs (animals and plants) related to species that
are/were present.• Examine the soils and determine if they were saturated at one time and
are now well-drained.• Examine the hydrology; establish the frequency and duration of
flooding/ponding.• Identify vegetation that currently exists and determine if the same species
occurred historically. • Determine the entire watershed's general condition and identify its major
landform(s).• Look for limiting factors, both human-caused and natural, and determine if
they can be corrected.
This approach forms the basis for initiating an inventory effort like ESI. For someareas, conducting an ESI effort will be the only way to assess an area's capabilityand potential.
3. Functioning Condition
The steps in Figure 3 of TR 1737-15 provide examples of the relationship betweenPFC and vegetation community succession for a lotic riparian-wetland area. Thisrelationship can be applied to lentic riparian-wetland areas as well. If vegetationsuccession continues uninterrupted (Step 1 to Step 2), the riparian-wetland site willprogress through some predictable changes from early seral to potential natural com-munity (although not necessarily as linearly as depicted). As the vegetation commu-nity progresses, the riparian-wetland area will advance through phases of notfunctioning, functioning at-risk, and functioning properly.
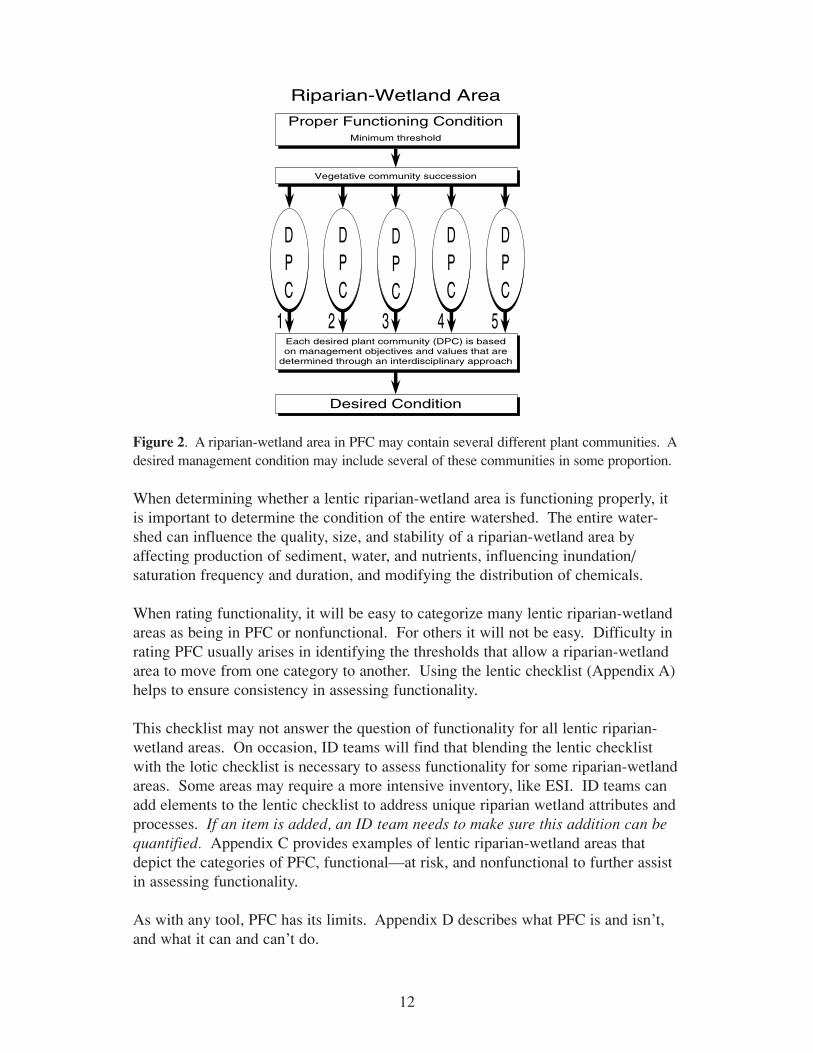
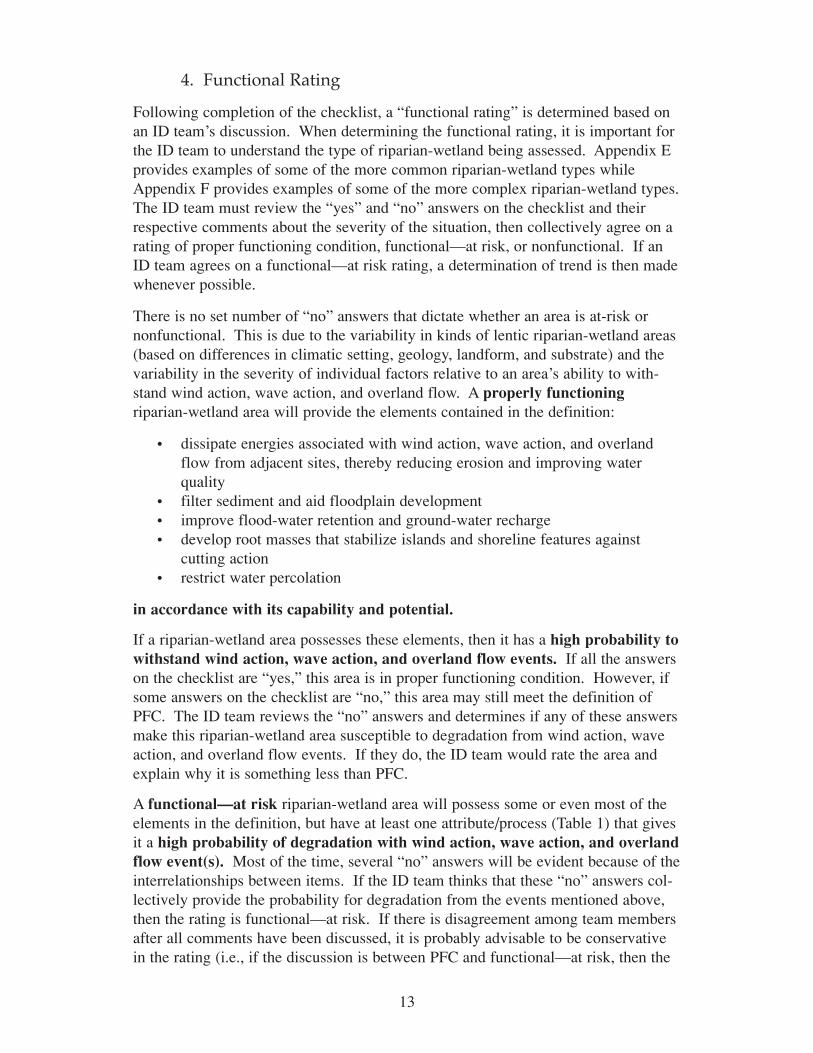
At various stages within this successional process, the riparian-wetland area willprovide a variety of values for different uses (Step 4). Optimal conditions forgrazing occur when forage is abundant and the area is stable and sustainable.Wildlife goals depend upon the species for which the area is being managed. If theriparian-wetland area is to provide nesting habitat for songbirds, the optimum condi-tions might be late seral. If the area is to provide feeding habitat for shorebirds, theoptimum condition might be mid-seral. Lentic riparian-wetland areas can functionproperly before they achieve their potential. The PFC definition does not meanpotential or optimal conditions for a particular species have to be achieved for anarea to be rated as functioning properly. The threshold for any goal is at least PFCbecause any rating below this would not be sustainable. For riparian-wetlandareas, PFC may occur from early seral to late seral. Desired plant community(DPC) is then determined based on management objectives through an interdiscipli-nary approach (Step 5 in Figure 3, TR 1737-15), eventually achieving the desiredcondition (Figure 2). Plant communities and future condition need to be balancedwithin a watershed(s) and within an ecoregion(s).
12
Figure 2. A riparian-wetland area in PFC may contain several different plant communities. Adesired management condition may include several of these communities in some proportion.
When determining whether a lentic riparian-wetland area is functioning properly, itis important to determine the condition of the entire watershed. The entire water-shed can influence the quality, size, and stability of a riparian-wetland area byaffecting production of sediment, water, and nutrients, influencing inundation/saturation frequency and duration, and modifying the distribution of chemicals.
When rating functionality, it will be easy to categorize many lentic riparian-wetlandareas as being in PFC or nonfunctional. For others it will not be easy. Difficulty inrating PFC usually arises in identifying the thresholds that allow a riparian-wetlandarea to move from one category to another. Using the lentic checklist (Appendix A)helps to ensure consistency in assessing functionality.
This checklist may not answer the question of functionality for all lentic riparian-wetland areas. On occasion, ID teams will find that blending the lentic checklistwith the lotic checklist is necessary to assess functionality for some riparian-wetlandareas. Some areas may require a more intensive inventory, like ESI. ID teams canadd elements to the lentic checklist to address unique riparian wetland attributes andprocesses. If an item is added, an ID team needs to make sure this addition can bequantified. Appendix C provides examples of lentic riparian-wetland areas thatdepict the categories of PFC, functional—at risk, and nonfunctional to further assistin assessing functionality.
As with any tool, PFC has its limits. Appendix D describes what PFC is and isn’t,and what it can and can’t do.
Riparian-Wetland Area
Desired Condition
Proper Functioning ConditionMinimum threshold
Vegetative community succession
Each desired plant community (DPC) is basedon management objectives and values that are
determined through an interdisciplinary approach
DPC
DPC
1 2 3 4 5
DPC
DPC
DPC
13
4. Functional Rating
Following completion of the checklist, a “functional rating” is determined based onan ID team’s discussion. When determining the functional rating, it is important forthe ID team to understand the type of riparian-wetland being assessed. Appendix Eprovides examples of some of the more common riparian-wetland types whileAppendix F provides examples of some of the more complex riparian-wetland types.The ID team must review the “yes” and “no” answers on the checklist and theirrespective comments about the severity of the situation, then collectively agree on arating of proper functioning condition, functional—at risk, or nonfunctional. If anID team agrees on a functional—at risk rating, a determination of trend is then madewhenever possible.
There is no set number of “no” answers that dictate whether an area is at-risk ornonfunctional. This is due to the variability in kinds of lentic riparian-wetland areas(based on differences in climatic setting, geology, landform, and substrate) and thevariability in the severity of individual factors relative to an area’s ability to with-stand wind action, wave action, and overland flow. A properly functioningriparian-wetland area will provide the elements contained in the definition:
• dissipate energies associated with wind action, wave action, and overlandflow from adjacent sites, thereby reducing erosion and improving waterquality
• filter sediment and aid floodplain development• improve flood-water retention and ground-water recharge• develop root masses that stabilize islands and shoreline features against
cutting action• restrict water percolation
in accordance with its capability and potential.
If a riparian-wetland area possesses these elements, then it has a high probability towithstand wind action, wave action, and overland flow events. If all the answerson the checklist are “yes,” this area is in proper functioning condition. However, ifsome answers on the checklist are “no,” this area may still meet the definition ofPFC. The ID team reviews the “no” answers and determines if any of these answersmake this riparian-wetland area susceptible to degradation from wind action, waveaction, and overland flow events. If they do, the ID team would rate the area andexplain why it is something less than PFC.
A functional—at risk riparian-wetland area will possess some or even most of theelements in the definition, but have at least one attribute/process (Table 1) that givesit a high probability of degradation with wind action, wave action, and overlandflow event(s). Most of the time, several “no” answers will be evident because of theinterrelationships between items. If the ID team thinks that these “no” answers col-lectively provide the probability for degradation from the events mentioned above,then the rating is functional—at risk. If there is disagreement among team membersafter all comments have been discussed, it is probably advisable to be conservativein the rating (i.e., if the discussion is between PFC and functional—at risk, then the
14
rating should be functional—at risk). One situation where only one “no” answerindicates a lentic riparian wetland area is at risk is when a structure is not accommo-dating safe passage of flows because a headcut is starting to affect the dam orspillway. The riparian-wetland above the structure is then rated as functional—atrisk regardless of other factors. The prairie pothole wetland example in Appendix Cprovides an example of this.
Trend must be determined, if possible, when a rating of functional—at risk is given.Preferably, trend is determined by comparing the present situation with previousphotos, trend studies, inventories, and any other documentation or personal knowl-edge attained in a review of existing documents or interviews prior to the PFCassessment. In the absence of information prior to the assessment, indicators of“apparent trend” may be deduced during the assessment process. Recruitment andestablishment of riparian-wetland species (or the absence thereof) that indicate anincrease (or decline) in soil moisture characteristics can be especially useful.However, care must be taken to relate these indicators to recent climatic conditionsas well as to management. If there is insufficient evidence to make a determinationthat there is a trend toward PFC (upward) or away from PFC (downward), then thetrend is not apparent.
Nonfunctional riparian-wetland areas clearly lack the elements listed in the PFCdefinition. Usually nonfunctional riparian-wetland areas translate to a preponder-ance of “no” answers on the checklist, but not necessarily all “no” answers. Ariparian-wetland area may still be saturated at or near the surface or inundated in“relatively frequent” events, but be clearly nonfunctional because it lacks vegetationto protect the area from erosion and deposition. The lack of vegetation and inabilityto buffer the sediment being supplied greatly reduce the extent of this wetland andprevent it from recovering.
It is imperative for management interpretation of the checklist to document factors con-tributing to unacceptable conditions outside management’s control for functional—at risk and nonfunctional ratings where achievement of PFC may beimpaired. It is desirable to document any of the factors listed if they occur, even if theydon’t appear to be affecting the achievement of PFC. Their presence may still affectachievement of desired condition for other values when compared to a natural system.
D. Institute the Process
1. Planning
The process established in TR 1737-15 for incorporating information into a manage-ment plan would apply to lentic riparian-wetland areas also:
Step 1 Existing Condition - Determine the existing riparian-wetland and watershed condition using the standard checklist.
Step 2 Potential - Each area is assessed relative to its potential. Determine potential by using reference areas, historic photos, etc. (ESI process).
15
Step 3 PFC - Determine the minimum conditions required for the area to function properly.
Step 4 Resource Values - Determine existing and potential resource values and the plant communities necessary to support these values.
Step 5 Management Goals - Identify specific objectives to reach management goals for the watershed, PFC, DPC, or DC.
Step 6 Planned Actions - Design management actions to achieve PFC and then DC.
Step 7 Monitoring - Design appropriate monitoring strategies to assess progress towards meeting management goals.
Step 8 Flexibility - Maintain management flexibility to accommodate change based upon monitoring results.
2. Management
Successful management of lentic riparian-wetland areas requires implementation ofa well-conceived plan. Appropriate strategies and practices that consider the entirewatershed should be used. Upland and lentic riparian-wetland areas are interrelatedand cannot be managed separately.
Inferences about habitat condition can be made from the PFC assessment.Generally, a lentic riparian-wetland area in nonfunctional condition will not providequality habitat conditions. One that is in PFC can be expected to provide at leastsome quality habitat. Additionally, an area in PFC can be managed for improvedhabitat, if that is an objective.
The PFC assessment can be used as a tool for prioritizing either additional inventoryneeds or restoration activities. PFC provides a sorting that allows the establishmentof priorities. Functional—at risk areas with a downward trend should receive pri-ority for treatment. These areas may be near the threshold of rapidly degrading intoa nonfunctional condition. Planned actions to begin recovery can usually be imple-mented at a much lower cost in these areas. Once an area is nonfunctional, theeffort, cost, and time required for recovery may dramatically increase.
Restoration of nonfunctional systems should be reserved for those situations when:
• recovery is possible,• efforts are not at the expense of at-risk systems,• or unique opportunities exist.
At the same time, areas that are functioning properly are usually not the highest pri-orities for restoration because they are more resilient than the at-risk areas. It is crit-

16
ical to manage PFC areas to retain their resilience and further recovery towarddesired condition. Identifying systems in PFC also allows local managers to assesswhy these systems have fared well in the past and to possibly use them as modelsfor recovery of similar systems.
The PFC assessment can also help determine the appropriate timing and design ofriparian-wetland restoration projects (including structural and management changes). Itcan identify situations where structures are either entirely inappropriate or premature.
The results of the PFC assessment can be used in watershed analysis. While themethodology and resultant data are site-specific, the ratings can be aggregated andanalyzed at the watershed scale. The PFC method is most useful when condition isdetermined based on local information, experience, and knowledge of functions andprocesses at the watershed scale. Information from the PFC assessment, along withother watershed and habitat condition information, helps provide a good picture ofwatershed health and the possible causal factors affecting watershed health. Usingthe PFC method will help to identify watershed-scale problems and suggest manage-ment remedies and priorities. These management decisions are derived by concen-trating on the “no” answers on the checklist. Additional uses for this informationcan be found in TR 1737-15, Appendix E.
There are other documents that can be helpful in assisting with this process: BLM’sTR 1737-14, Grazing Management for Riparian-Wetland Areas (Leonard et al.1997), provides grazing management principles, concepts, and practices that havebeen effective in improving and maintaining desired conditions on riparian-wetlandareas, and Prescribed Grazing (USDA NRCS Field Office Technical Guide, SectionIV, Practice No. 528) provides guidance for establishing grazing management plans.For other forms of management, such as recreation development, mining opportuni-ties, timber practices, and watershed treatments, BLM’s TR 1737-6, ManagementTechniques in Riparian Areas (Smith and Prichard 1992), provides suggested prac-tices. With a change in management, most riparian-wetland areas can achieve PFCin a few years, but some will take many years to achieve the identified DPC oradvanced ecological status.
3. Monitoring
Management effectiveness and progress can be assessed and documented with moni-toring. A good monitoring plan, including a schedule for field visits and the protocolto be used, must be developed as a part of the management plan. For monitoring tobe effective, field sites must be revisited on a scheduled basis. Monitoring reflectstrends and will show whether the planned objectives are being achieved.
A number of references are available to help when developing monitoring plans.Inventory and Monitoring of Riparian Areas, BLM TR 1737-3 (Myers 1989), providesguidance. The Integrated Riparian Evaluation Guide (USDA FS 1992) provides somespecific protocols that can be used for monitoring riparian-wetland areas. The NationalRange and Pasture Handbook (USDA NRCS 1998c) provides general guidance forrangeland monitoring, which can also be used for riparian-wetland area monitoring.

17
V. Quantification of Checklist Items
As long as the procedure is followed and the definitions are understood, the PFCassessment will work for most sites because it was developed from rigorous science(ESI) and is performed by a trained and experienced ID team. However, there willbe times when items from the checklist need to be quantified.
There is a considerable body of literature addressing relationships between soils,vegetation, hydrology, and other riparian-wetland functions, as well as a growingnumber of “success stories” from which empirical comparisons can (and have) beenmade. The references presented here are selected as examples of supporting docu-mentation for the PFC assessment. By no means are these references all-encompassing, as there are many other ways to quantify these items.
The checklist items are designed to address the common attributes and processesthat have to be in working order for a lentic riparian-wetland area to function prop-erly. Each item on the checklist is answered with a “yes,” meaning that the attributeor process is working, a “no,” meaning that it is not working, or an “N/A,” meaningthe item is not applicable to that particular area. For any item marked “no,” theseverity of the condition must be explained in the “Remarks” section and must bediscussed by the ID team in determining riparian-wetland functionality. Using the“Remarks” section to also explain items marked “yes” is encouraged but notrequired.
The intent of each checklist item, examples of how each item might be answered,and ways to quantify each item are outlined below. These examples should not bemisconstrued as a cookbook, as there are many riparian-wetland types. Beforeassessing condition of any riparian wetland area, its attributes and processes have tobe defined to answer the checklist items correctly.
It is important to note that many of the checklist items are closely related. This pro-vides a system of checks and balances for how any one item is answered. Forexample, if item 6 (natural surface or subsurface flow patterns are not altered by dis-turbance) is answered “yes” for a recovering system, item 1 should be answered“yes” because the riparian-wetland area is being saturated or inundated in relativelyfrequent events. It is also important to note the items are numbered for the purposeof cataloging comments and that the numbers do not declare importance. Theimportance of any one item will vary relative to a riparian-wetland area’s attributesand processes. However, there is an order to when some of the items are answered“yes.” Any time item 13 is answered “yes,” more than likely items 8, 9, 10, and 11will be answered “yes.” For a riparian-wetland area to recover or be maintained, theright plants have to establish themselves and then produce the adequate amount ofcover. The supporting science for some of the items is the same or overlapping.Explanations are with the most appropriate items, but some cross-referencing maybe required.
18
A. Hydrology
Hydrologic attributes and processes are addressed in this section relative to presenceand function. The term “wetland hydrology” encompasses all hydrologic character-istics of lentic areas that are periodically inundated or have soils saturated to the sur-face at some time during the growing season. Areas with evident characteristics ofwetland hydrology are those where the presence of water has an overriding influenceon characteristics of vegetation and soils due to anaerobic and reducing conditions,respectively. Such characteristics are usually present in areas that are inundated orsaturated to the surface for sufficient duration to develop hydric soils and supportvegetation typically adapted for life in periodically anaerobic soil conditions.Hydrology is often the least exact of the parameters, and indicators of wetlandhydrology are sometimes difficult to identify in the field. However, it is essential toestablish that a wetland area is periodically inundated or has saturated soils duringthe growing season (Prichard et al. 1994).
The Federal Government’s standard for classifying wetlands is described in Cowardinet al. (1979), which is available on the Internet at http://www.nwi.fws.gov. Thissystem provides ecological and hydrological information for the identification, classi-fication, and mapping of wetlands and deepwater habitats in the United States and itsterritories. The standard was selected by the Federal Geographic Data Committee in1996. Systems are the highest level of the classification hierarchy; five are defined—marine, estuarine, riverine, lacustrine, and palustrine. Systems are further divided bysubsystems and classes. Water regime, water chemistry, and soil modifiers are usedat the class level to further describe wetlands. For riverine systems, the process forassessing PFC for lotic systems should be used (TR 1737-15). Palustrine wetlandsthat are periodically inundated from overbank flows may occur adjacent to riverinesystems, but are not included as part of the riverine system. In those cases, and inothers where a mixture of lotic and lentic systems occur, both the lotic and lentic PFCdefinitions and checklist questions should be examined in order to understand theimportant attributes and processes of those systems.
BLM’s TR 1737-7 (Leonard et al. 1992a) details field procedures for describing anddocumenting site information (ESI) as it applies to the interaction of soils,hydrology, and vegetation for riparian-wetland resources and uplands. This methodis a rigorous science base for classifying riparian-wetland sites and the quantitativemeasures used in ESI can be used for items 1-7 in the hydrology section of thechecklist.
References associated with the hydrogeomorphic model (HGM) (Brinson 1993;Smith et al. 1995; Brinson et al. 1995; and Walton et al. 1995) describe anotherapproach for assessing wetland functions that could also be used for items 1-7 in thehydrology section. The HGM approach includes a development and applicationphase. In the development phase, wetlands are classified into regional subclassesbased on hydrogeomorphic factors. A functional profile is developed to describe thecharacteristics of the regional subclass, identify the functions that are most likely tobe performed, and discuss the characteristics that influence how those functions are
19
performed. Reference wetlands are selected to represent the range of variabilityexhibited by the regional subclass in a reference domain, and assessment models areconstructed and calibrated by an ID team based on reference standards and datafrom reference wetlands. Reference standards are the conditions exhibited by theundisturbed, or least disturbed, wetlands and landscapes in the reference domain.The functional indices resulting from the assessment models provide a measure ofthe capacity of a wetland to perform functions relative to other wetlands in theregional subclass. The application phase of the approach or assessment procedureincludes characterizing the wetland, assessing its functions, analyzing the results ofthe assessment, and applying them to a specific project (Smith et al. 1995).
Item 1: Riparian-wetland area is saturated at or near the surface or inundated in “relatively frequent” events
Purpose
Water creates and maintains all wetlands. Cowardin et al. (1979) state, “In generalterms, wetlands are lands where saturation with water is the dominant factor deter-mining the nature of soil development and the types of plant and animal communi-ties living in the soil and on its surface.” The purpose of item 1 is to document thatinundation or saturation is long enough in duration and occurs frequently enough tomaintain wetland characteristics.
Examples
Item 1 would be answered “yes” if evidence of inundation or saturation, such ashydric soils, standing water, or recent deposits of sediment and/or debris on thefloodplain from overbank flows, is apparent. Another indicator for a “yes” answerwould be if obligate wetland (OBL) species and/or facultative wetland (FACW)species dominate a site. Additional information on how vegetation is used as a wet-land indicator is provided in the vegetation section.
Item 1 would be answered “no” if the evidence of saturation or inundation is lessthan in the past. One indicator of this may be where obligate upland (UPL) and fac-ultative upland (FACU) species are encroaching on OBL and FACW species, indi-cating a loss of hydrology. Another indicator is a soil with hydric properties, whichpresently lacks periods of inundation or saturation.
There is a strong relationship between item 1 and items 3, 6, 10, and 17. If item 1 isanswered “no,” then these items will usually be answered “no” also.
Supporting Science/Quantitative Methodologies
Even though the factors influencing the wetness of an area are numerous (e.g., pre-cipitation, topography, soil characteristics, plant cover, ground water), all lentic siteshave a source of water consistent enough to cause anaerobic (no oxygen) andreducing (i.e., loss of electrons from metal or metallic element) conditions. The

20
source of water for riparian-wetland areas may be precipitation, runoff, flooding,tidal influence, ground water, or some combination of sources.
Inundation or saturation must occur often enough (frequency) and long enough(duration) to develop and maintain the anaerobic and reducing conditions. Both“measurements” and “field observations” are helpful to document that saturation orinundation is occurring in the “relatively frequent” events within the potential orcapability of the site. Local knowledge and historical records should be used asmuch as possible, especially where problem wetlands are concerned. If a jurisdic-tional wetland determination is made, the U.S. Army Corps of Engineers (COE)1987 Wetlands Delineation Manual should be consulted for information on the cri-teria, primary indicators, and secondary indicators necessary to meet the wetlandhydrology, soils, and vegetation requirements. However, within the context of PFC,riparian-wetland areas are broadly defined to include nonjurisdictional types that donot meet the hydric soils or wetland hydrology definition in U.S. Army COE (1987)or the Clean Water Act.
Where available, hydrology data from local soil surveys should be used in conjunc-tion with recorded data. Gage data, such as lake, tidal, ground water, and streamstage, along with precipitation data, are available from different sources, dependingon the location. These sources include the U.S. Geological Survey (USGS); COEDistrict Offices; Bureau of Reclamation (BOR); NRCS; Tennessee Valley Authority(TVA); National Oceanic and Atmospheric Administration (NOAA); HighwayDepartments; and other State, County, and local agencies.
USDA NRCS (1997) describes a nine-step process for using stream and lake gagesto document the timing, duration, and frequency of inundation adjacent to streamsand lakes. At least 10 years of gage data during the growing season are needed.The highest stage of each year that is exceeded for a predetermined duration is deter-mined. If the inundation criterion is 7 days, the lowest stage occurring during those7 days of high flow is recorded. The median recorded stage readings are tabulatedin descending order, and the median value computed. Any land in the immediatevicinity of the gage below this median elevation would be inundated for the inunda-tion criterion by out-of bank flooding during the growing season in 50 percent of theyears, thus meeting the wetland criterion.
Few riparian-wetland areas have sufficient existing information on ground-water con-ditions or wells for mapping the water table, so it may be necessary to install wellpoints. Well points are small-diameter (1-1/4- to 3-inch) metal or PVC well casingswith short screened intervals to allow water to flow into the casings. The COE hasinstallation procedures for placing monitoring wells in wetlands (Sprecher 1993).The NRCS state geologist or hydraulic engineer can also provide information onspecifications for installing, casing, and sealing wells; taking and recording measure-ments; and local regulations concerning well development (USDA NRCS 1997).
Existing wells were likely drilled into the regional aquifer for water supply, and thewater level might not be representative of the shallow ground-water conditions that

21
support the riparian wetland area of interest. Using information from both nearbyexisting wells and installed well points helps an ID team to determine whether theriparian-wetland area is the result of a perched aquifer or is hydraulically connectedto a regional system. This information is crucial for determination of regionalversus local effects. Details on well depth, screened interval, and date of drilling formany wells are available from the USGS Water Resources Division. Well informa-tion for many wells drilled on public land and assistance in designing/planningground-water monitoring projects can be obtained from BLM’s National AppliedResource Sciences Center.
Aerial photographs are useful for documenting evidence and extent of wetlandinundation or soil saturation (Clemmer 1994; Prichard et al. 1996). Comparing sev-eral years of photos will help in interpreting the effect of very dry or very wetperiods. Acquiring photos taken during similar seasons or months will provide amore accurate comparison. Photography can also assist in preliminary identificationof lentic sites for further field investigation based on the spectral response of local-ized vegetation around the site.
USDA NRCS (1997) describes a method using annual rainfall data and aerial pho-tographs to document wetland hydrology. The annual rainfall total for each year iscompared to the annual boundaries for wet and dry from the WETS table (seewww.wcc.nrcs.usda.gov and click on climate for WETS table and associated docu-mentation). The WETS table identifies the boundary where 3 in 10 of the precipita-tion amounts are wetter than normal value and the boundary where 3 in 10 valuesare drier than normal. Normal is considered to be values that fall between these twoboundaries. Aerial photographs from years of average precipitation are comparedwith aerial photographs from wet years and dry years. If a wet signature appears fora site only in wet years, a good probability exists that wetland hydrology is not pre-sent under normal circumstances. If a wet signature is seen in both dry and wetyears, the site may well meet wetland hydrology criteria. Where the wet signaturesappear in wet and normal years, further study is needed to determine whether wet-land hydrology exists on the site.
While recorded data can provide valuable information, field observations are alsoimportant. There are a number of hydrologic indicators that can be observed in thefield:
• Inundation. Seasonal conditions and recent weather conditions should be considered. Surveyed cross sections can be used to document the elevation of high water. Harrelson et al. (1994) is a good reference for surveying basics and surveying cross sections.
• Soil saturation. Digging a soil pit to a depth of 16 inches and observing the water level in the hole after sufficient time has been allowed for water to drain into the hole will indicate soil saturation. The time required varies depending on the soil texture. In some cases, the depth to the water table (or upper level at which water is flowing into the pit) can be observed by

22
examining the wall of the hole. Because of the capillary fringe, saturated soils will be nearer the surface (U.S. Army COE 1987).
Using an auger hole to confirm saturation may be inaccurate or misleading inclayey soils when only macropores are filled with water. Macropores mayhave filled during a recent rain while the soil matrix remained unsaturated.Tightly sealed piezometers or tensiometers are recommended to confirm sat-uration. These instruments should be sealed with clay (e.g., bentonite) toprevent surface water from running down the sides of the instruments(Vepraskas 1994).
There are hydric soils indicators that will show that wetland hydrology ispresent or has been present at some time. Histosols, Histic Epipedon, BlackHistic, Hydrogen Sulfide Odor are usually saturated or inundated for much ofmost years for soil of all textures. Sandy Gleyed Matrix, Polyvalue BelowSurface, Thin Dark Surface are the wetter hydric soil indicators for soil withsand or loamy sand soil textures. Loamy Gleyed Matrix, Thick Dark Surfaceare the hydric soil indicators for wetter soils of soil textures of sandy loam,sandy clay loam, clay loam, loam, silt loam, silty clay loam, sandy clay, andclay. While soils with all other hydric indicators will require a shorter dura-tion of saturation or inundation, they will still have or have had wetlandhydrology. See item 17 for more information on hydric soils.
Steel rods (rebar) can also be used to measure the depth to the water table ina wetland (Brigdham et al. 1991). Rebar is pounded into the wetland soil.The oxidation/reduction process that occurs during saturation will change thecolor of the steel rod and can be measured to indicate the depth to watertable.
• Watermarks. Watermarks can be observed on fixed objects, such as woody vegetation, bridge pillars, fences, bedrock, or boulders.
• Drift lines. Evidence consists of linear deposition of debris or debris entangled in fixed objects such as vegetation. Debris is usually deposited parallel to the direction of water flow and provides an indication of the minimum portion of the area inundated during a flooding event.
• Sediment deposits (mineral or organic). Sediment deposition on vegetation and other objects provides an indication of the minimum inundation level.
• Drainage patterns (surface evidence of drainage flow into or through an area). Evidence consists of drainage patterns eroded into the soil, debris oriented perpendicular to the direction of water flow, or the absence of leaf litter. Scouring is often evident around roots of persistent vegetation. Because drainage patterns also occur on upland areas (i.e., ephemeral channels), topographic position must also be considered.
23
• Oxidized rhizospheres (zone of soil where living plant root and microorganisms occur). These are associated with living plant roots in the upper 12 inches of the soil.
• Water-stained leaves (works better in the eastern United States than in the western United States). Water stains on leaf litter indicate areas that have been inundated with water.
• Vegetation. Vegetation can be a useful indicator that an area is being saturated near the surface or inundated often enough. Existing vegetation needs to be compared against the potential for the site using an ecological site description, vegetation classification, or similar reference. When riparian-wetland species are not clearly dominant on a site, the FAC-neutral test (U.S. Army COE 1987) can be used and compared to the potential.
• Soil Survey Data. This data provides climatic information, soil classifications, and wetness characteristics of soils, such as frequency, duration, and timing of inundation.
Indicators above are mostly from the U.S. Army COE 1987 Wetland DelineationManual. For nonjurisdictional riparian-wetland areas, the water table and wetlandsoil criteria may occur at a greater depth.
Item 2: Fluctuation of water levels is not excessive
Purpose
Riparian-wetland vegetation plays an important role in the stability of most lenticriparian-wetland areas. Periodic flooding or saturation of these areas is necessary topromote and sustain this vegetation, but to do so, these water level changes must bewithin the range of plant tolerance. The purpose of item 2 is to determine if these waterlevel changes are within the limits that will sustain the riparian-wetland vegetation.
Examples
Most lentic riparian-wetland areas require vegetation to function properly. The veg-etation on these sites for the most part should be OBL and/or FACW species. If ariparian-wetland area is dominated by OBL and/or FACW species, the answer toitem 2 would be “yes.” However, some lentic riparian-wetland areas only have thepotential to produce facultative (FAC) species (see Appendix F). The answer to item2 would be “yes” if these sites are dominated by FAC species. There are some sitesthat only produce OBL, FACW, FAC species during wet years and are dominated byUPL species during dry years (see Appendix F). The answer to item 2 would be“yes” if these sites are producing OBL, FACW, or FAC species during wet yearseven though they are dominated by UPL species during dry years, as this is the norm(see playa wetland example from New Mexico in Appendix B). Understanding thepotential of the site is critical in order to answer the question correctly.
24
Item 2 would be answered “no” if bare soil or annual UPL species are present inplace of OBL and FACW species as a result of changes in the water level. Anexample of this is a reservoir with constantly fluctuating water levels resulting in azone of no vegetation. Other wetlands can also experience this if water is removedor added on an irregular basis. Natural systems will occasionally experience this asa result of irregular water fluctuation. Again, understanding site potential is crucialin these situations.
“N/A” would apply for those wetland types that do not require riparian-wetland vegetation to function properly.
There is a strong relationship between item 3 and items 1, 10, 12, and 17. If item 3is answered “no,” then these items will often be answered “no” as well.
Supporting Science/Quantitative Methodologies
Riparian-wetland plants living along the edges of standing water bodies haveadapted so that during drying periods, as long as water levels do not drop drastically,the plants will expand and occupy the newly exposed sites. During wetter periods,as the water body fills up again, some plants may be drowned out around the edges.If the elevation of the water level changes faster than the plants can respond, a“bathtub ring” effect occurs where riparian-wetland plants cannot survive, leavingbare ground. Excessive ground-water fluctuations or the combination of excessiveground-water and surface-water changes can cause similar vegetation effects. The“bathtub ring” effect is very obvious on aerial photos.
The recorded data discussed in item 1 can be used to document water level changesfor this item (i.e., lake gage data). Comparing the rate of fill and the rate of with-drawal with similar systems in the region will help determine whether the waterfluctuation is appropriate because of site potential or is a problem accelerated bysome human-caused disturbance.
Item 3: Riparian-wetland area is enlarging or has achievedpotential extent
Purpose
Depending on a lentic area’s site characteristics, degradation can lead either to accel-erated sedimentation (filling in faster) or to loss or lowering of the water table.Either process has a detrimental effect on the riparian-wetland vegetation. Someriparian-wetland areas initially appear to be enlarging as they fill in. Depositionaround shorelines provides more shallow water area for emergent vegetation.However, over the long-term, there is a decrease in extent as the circumferenceshrinks with declining catchment capacity. A loss or lowering of the water table canresult in water stress (loss of vigor), lowered production, and eventually a completeloss of riparian-wetland vegetation. Recovery is expressed by an increase inriparian-wetland vegetation. The purpose of item 3 is to determine if a riparian-wetland area is recovering or has recovered.
25
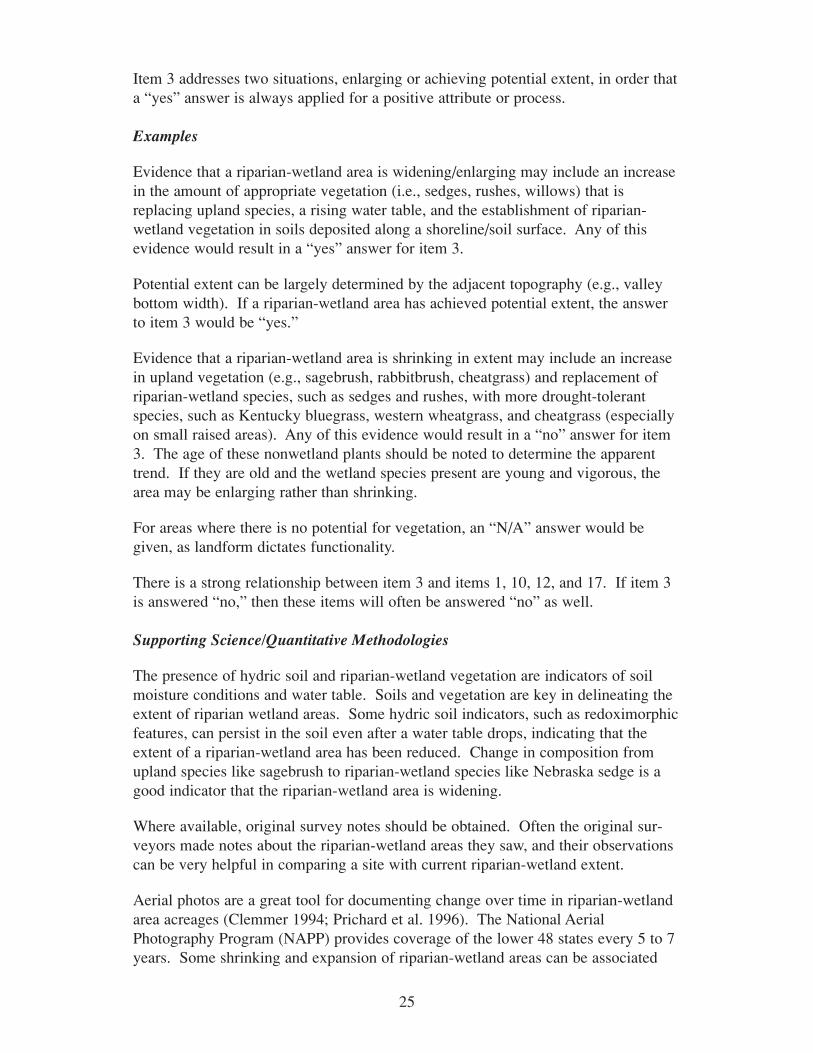
Item 3 addresses two situations, enlarging or achieving potential extent, in order thata “yes” answer is always applied for a positive attribute or process.
Examples
Evidence that a riparian-wetland area is widening/enlarging may include an increasein the amount of appropriate vegetation (i.e., sedges, rushes, willows) that isreplacing upland species, a rising water table, and the establishment of riparian-wetland vegetation in soils deposited along a shoreline/soil surface. Any of thisevidence would result in a “yes” answer for item 3.
Potential extent can be largely determined by the adjacent topography (e.g., valleybottom width). If a riparian-wetland area has achieved potential extent, the answerto item 3 would be “yes.”
Evidence that a riparian-wetland area is shrinking in extent may include an increasein upland vegetation (e.g., sagebrush, rabbitbrush, cheatgrass) and replacement ofriparian-wetland species, such as sedges and rushes, with more drought-tolerantspecies, such as Kentucky bluegrass, western wheatgrass, and cheatgrass (especiallyon small raised areas). Any of this evidence would result in a “no” answer for item3. The age of these nonwetland plants should be noted to determine the apparenttrend. If they are old and the wetland species present are young and vigorous, thearea may be enlarging rather than shrinking.
For areas where there is no potential for vegetation, an “N/A” answer would begiven, as landform dictates functionality.
There is a strong relationship between item 3 and items 1, 10, 12, and 17. If item 3is answered “no,” then these items will often be answered “no” as well.
Supporting Science/Quantitative Methodologies
The presence of hydric soil and riparian-wetland vegetation are indicators of soilmoisture conditions and water table. Soils and vegetation are key in delineating theextent of riparian wetland areas. Some hydric soil indicators, such as redoximorphicfeatures, can persist in the soil even after a water table drops, indicating that theextent of a riparian-wetland area has been reduced. Change in composition fromupland species like sagebrush to riparian-wetland species like Nebraska sedge is agood indicator that the riparian-wetland area is widening.
Where available, original survey notes should be obtained. Often the original sur-veyors made notes about the riparian-wetland areas they saw, and their observationscan be very helpful in comparing a site with current riparian-wetland extent.
Aerial photos are a great tool for documenting change over time in riparian-wetlandarea acreages (Clemmer 1994; Prichard et al. 1996). The National AerialPhotography Program (NAPP) provides coverage of the lower 48 states every 5 to 7years. Some shrinking and expansion of riparian-wetland areas can be associated
26
with climate fluctuation. However, there may be a time lag for areas that are depen-dent on ground-water recharge.
To measure riparian-wetland extent in the field, several transects for soils and vege-tation information should be established perpendicular to the down valley axis of theriparian complex. For soils, standard identification and delineation procedures(USDA NRCS 1998b and other NRCS soils manuals and handbooks; U.S. ArmyCOE 1987) should be used. Vegetation community complex composition can beassessed using a line intercept transect (USDA FS 1992). Additional detail isincluded in the supporting science for the vegetation section (the questions are inter-related).
Monitoring wells discussed in item 1 can also be used to measure the expansion orcontraction of a riparian-wetland.
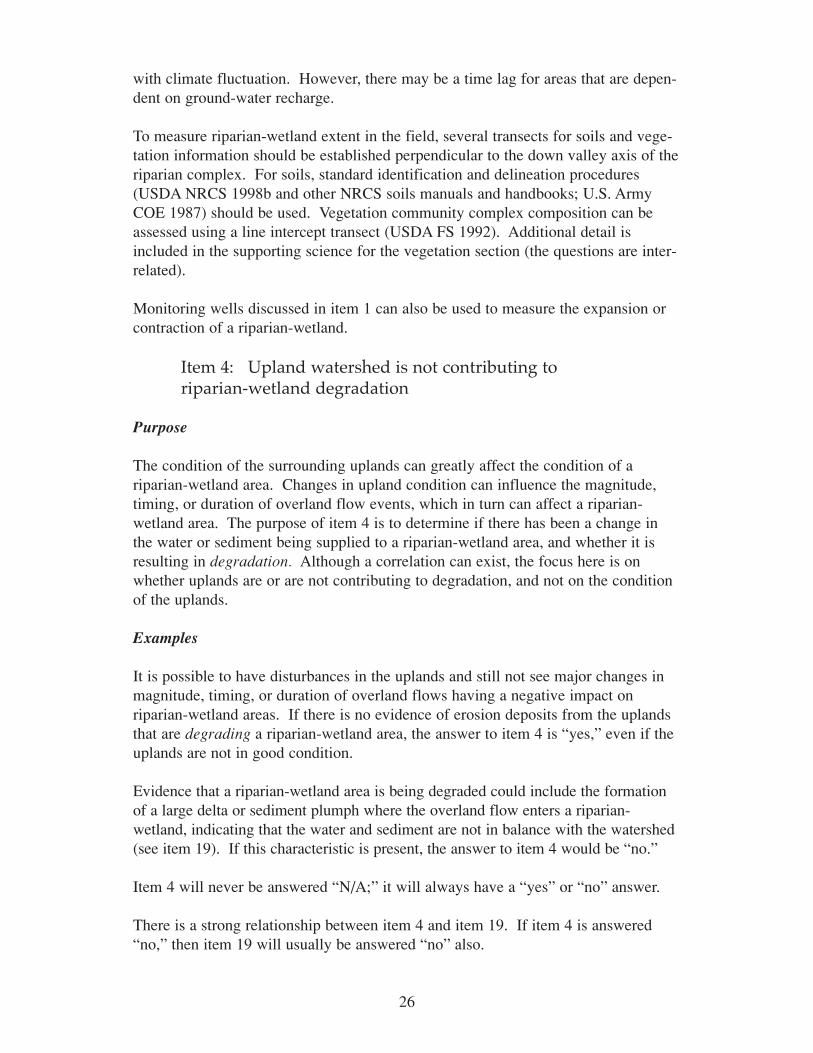
Item 4: Upland watershed is not contributing to riparian-wetland degradation
Purpose
The condition of the surrounding uplands can greatly affect the condition of ariparian-wetland area. Changes in upland condition can influence the magnitude,timing, or duration of overland flow events, which in turn can affect a riparian-wetland area. The purpose of item 4 is to determine if there has been a change inthe water or sediment being supplied to a riparian-wetland area, and whether it isresulting in degradation. Although a correlation can exist, the focus here is onwhether uplands are or are not contributing to degradation, and not on the conditionof the uplands.
Examples
It is possible to have disturbances in the uplands and still not see major changes inmagnitude, timing, or duration of overland flows having a negative impact onriparian-wetland areas. If there is no evidence of erosion deposits from the uplandsthat are degrading a riparian-wetland area, the answer to item 4 is “yes,” even if theuplands are not in good condition.
Evidence that a riparian-wetland area is being degraded could include the formationof a large delta or sediment plumph where the overland flow enters a riparian-wetland, indicating that the water and sediment are not in balance with the watershed(see item 19). If this characteristic is present, the answer to item 4 would be “no.”
Item 4 will never be answered “N/A;” it will always have a “yes” or “no” answer.
There is a strong relationship between item 4 and item 19. If item 4 is answered“no,” then item 19 will usually be answered “no” also.
27
Supporting Science/Quantitative Methodologies
The watershed surrounding a riparian-wetland area can influence the hydrologicregime, water quality, sediment supply, and plant community composition. Waterquality is discussed in item 5, and plant community composition is discussed in thevegetation section.
The hydrologic functions of riparian-wetland areas are governed by a water budget anda sediment budget. Depending on the type of riparian-wetland area, water enters awetland as precipitation, incoming channel flow, overbank flow, overland flow fromadjacent slopes, ground-water discharge, or some combination of these. Water isstored in a wetland as surface and subsurface storage, and is lost as runoff, evapora-tion/transpiration, and/or ground-water recharge. Sediments are deposited in a wetlandfrom bedload, filtered from surface runoff, or precipitated from dissolved minerals inrunoff and ground-water flows, and are lost through erosion (Zeedyk 1996). When anatural system is in dynamic equilibrium, it maintains a level of stability that permitsinternal adjustments of variables without producing rapid changes to the system.
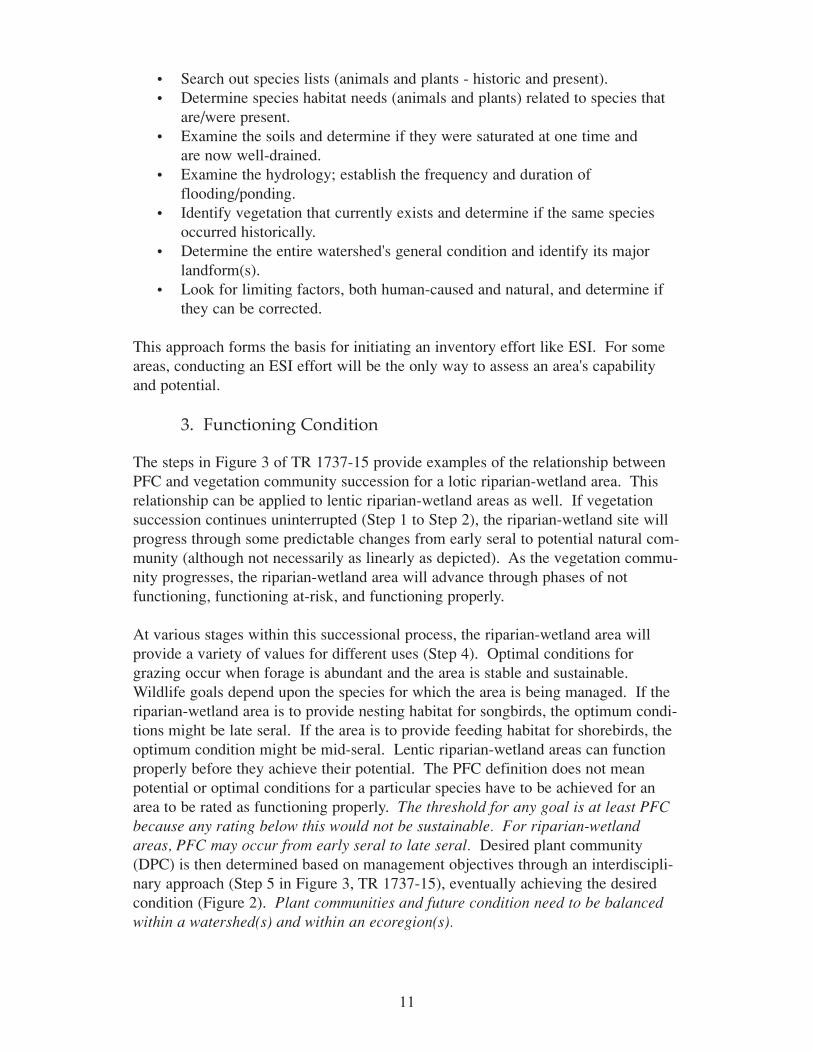
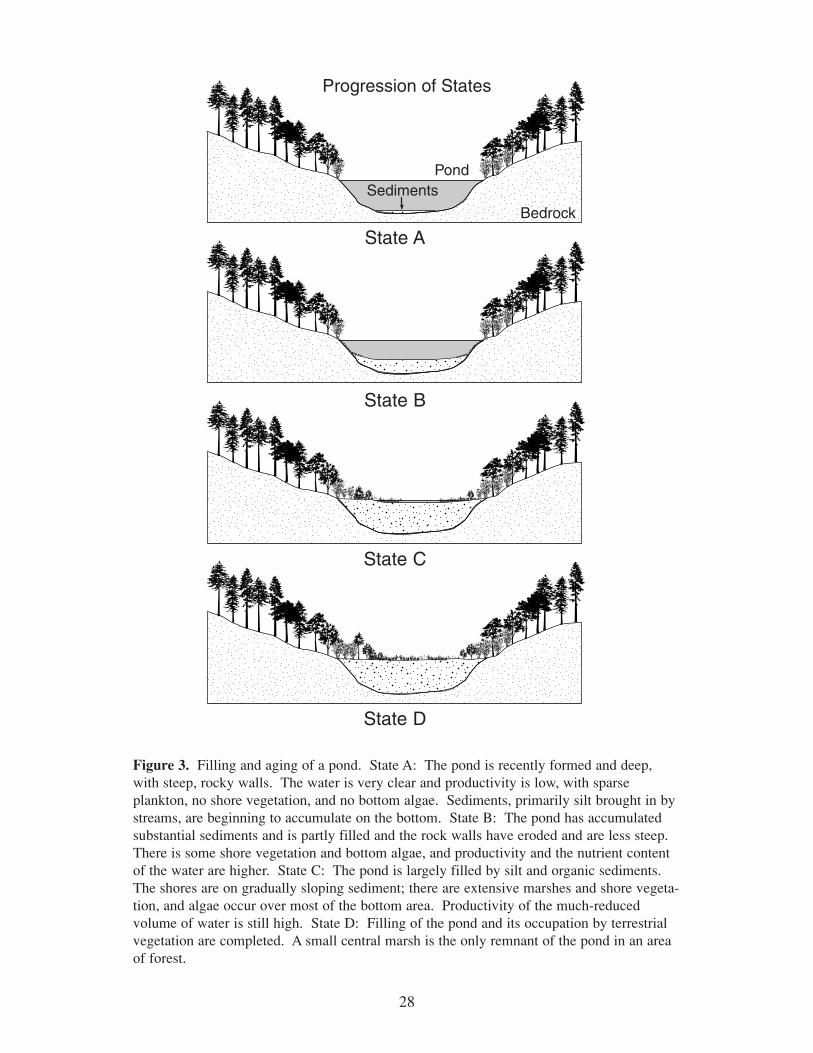
Detrimental changes in water supply come from constraining or diverting surfaceand/or subsurface flows. An example would be upslope road ditches and crossdrainage structures installed in a manner that concentrates overland flows away fromthe riparian-wetland area, causing desiccation of meadow soils (Zeedyk 1996). Ifhuman disturbance in a watershed increases the sediment delivery to a riparian-wetland area, the progression of states can be accelerated (Figure 3).
Aerial photos that cover several years or decades can be used to identify riparian-wetland adjustments through time for a particular riparian-wetland complex.Information on the use of aerial photos is provided in Clemmer (1994) and Prichardet al. (1996). Most of the photo interpretive techniques and procedures described inPrichard et al. (1996) for lotic sites can be applied to lentic sites.
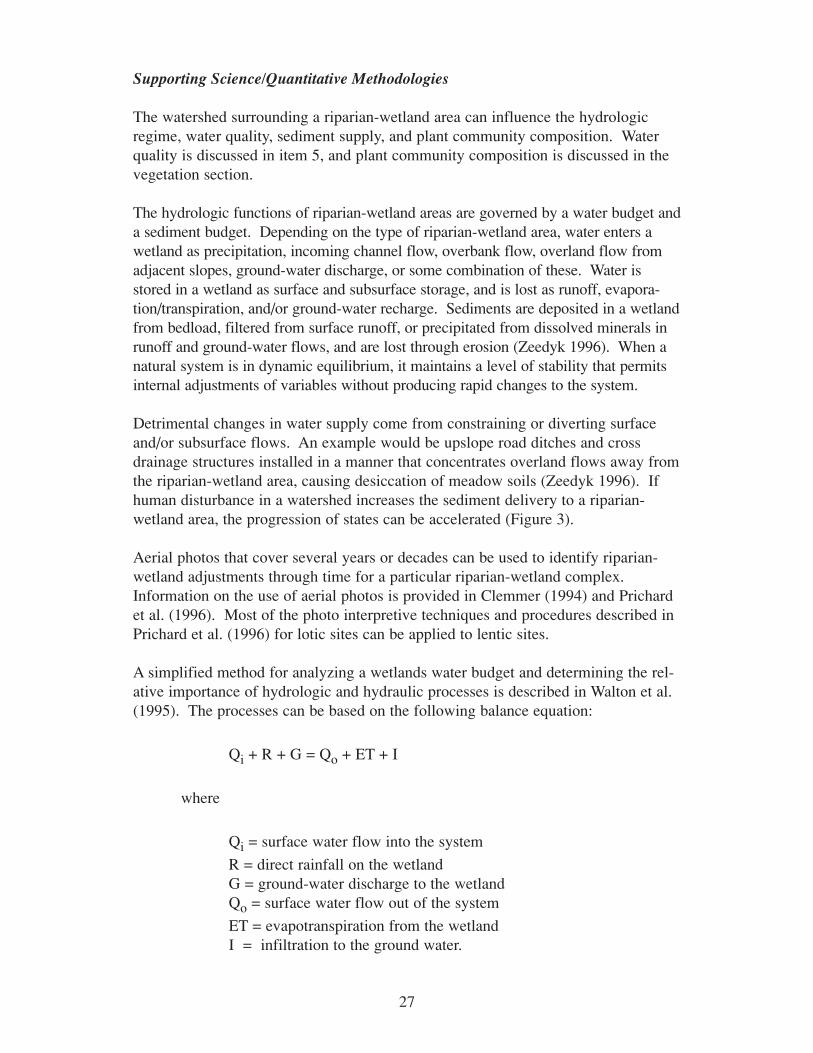
A simplified method for analyzing a wetlands water budget and determining the rel-ative importance of hydrologic and hydraulic processes is described in Walton et al.(1995). The processes can be based on the following balance equation:
Qi + R + G = Qo + ET + I
where
Qi = surface water flow into the system
R = direct rainfall on the wetlandG = ground-water discharge to the wetlandQo = surface water flow out of the system
ET = evapotranspiration from the wetlandI = infiltration to the ground water.
28
Figure 3. Filling and aging of a pond. State A: The pond is recently formed and deep,with steep, rocky walls. The water is very clear and productivity is low, with sparseplankton, no shore vegetation, and no bottom algae. Sediments, primarily silt brought in bystreams, are beginning to accumulate on the bottom. State B: The pond has accumulatedsubstantial sediments and is partly filled and the rock walls have eroded and are less steep.There is some shore vegetation and bottom algae, and productivity and the nutrient contentof the water are higher. State C: The pond is largely filled by silt and organic sediments.The shores are on gradually sloping sediment; there are extensive marshes and shore vegeta-tion, and algae occur over most of the bottom area. Productivity of the much-reducedvolume of water is still high. State D: Filling of the pond and its occupation by terrestrialvegetation are completed. A small central marsh is the only remnant of the pond in an areaof forest.
Bedrock
Pond
Progression of States
Sediments
State A
State B
State C
State D
29
For many wetlands, these variables can be estimated using empirical methods orknown data or both. For more information on water budgets, see USDA NRCS(1997) and Chapter 8 of Dunne and Leopold (1978).
Wetlands Research Program Technical Note SD-CP-4.1 describes four methods tomeasure sedimentation rates in wetland systems. The advantages and disadvantagesof each are discussed, and their application to wetland evaluation considered (WRP1993). The four methods are:
• Modified sediment trap method. A sediment trap in limnological and oceanographic research consists of a cylindrical column, which is approximately five times as tall as it is wide, that is submerged into the water body. These 5:1 aspect ratio columns are designed to prevent anyresuspension of the trapped material. In situations where the cylinders
would not stay submerged for the sampling period and resuspension of materials is a significant aspect of the sedimentation patterns of the wetland type, a method of using “sediment plates” has been developed. These plates are 15-cm-diameter Plexiglas circles. Each disk is anchored a known distance and direction from a known point to aid in relocating the disks later. Sampling frequency is determined by the hydrology of the system. The accumulated material is measured.
• Feldspar clay marker horizon method. Feldspar clay is spread out on the wetland surface, at a rate of 2 liters (L) per 0.25 square meter (m2), at a known distance and direction from a known point. Sampling consists of locating the clay pad and taking a small core of the sediments deposited above the clay and the clay itself. The amount of material deposited above the bright white marker horizon can be easily measured. Sampling frequency depends on the hydrology of the wetland system. This method can be used in shallow standing water, as the feldspar clay will sink to the bottom and create a good marker horizon.
• 137 Cesium atmospheric fallout method. 137 Cesium is a product of nuclear fission reaction and does not occur naturally in the environment. Widespread global dispersal of 137 cesium began with thermonuclear weapons testing in late 1952 and measurable amounts began to appear in the soil in 1954. Peak quantities occurred in 1963-64. 137 Cesium is rapidly absorbed by suspended particles and the clay components of sediments and soil. Once deposited, it establishes a fairly stable marker. To measure 137 cesium, sediment cores are taken in wetland and are sliced in increments appropriate to the anticipated rate of sedimentation. The sections are dried and 137 cesium activity is counted with a lithium drifted germanium detector and multichannel analyzer. The procedure is expensive.
• Dendrogeomorphic method. Cores or cross sections of specific trees are taken to obtain the age relative to geomorphic processes.
Models such as the Pacific Southwest Interagency Committee Sediment YieldProcedure (PSIAC) can be used to estimate sedimentation rates. PSIAC is a sedi-
30
ment prediction model that includes overland production from uplands and channelerodibility.
Discussions on watershed health and riparian-wetland condition and quantitativemethodologies for riverine wetlands can be found in Brinson et al. (1995), DeBanoand Schmidt (1989), and Prichard et al. (1998) .
Item 5: Water quality is sufficient to supportriparian-wetland plants
Purpose
The maintenance of water quality is important for these sites to function properly.The purpose of item 5 is to determine if water quality is being maintained,thus allowing these sites to produce the kind of vegetation necessary for properfunctioning.
Examples
Item 5 would be answered “yes” if multiple riparian-wetland species, such as blackgrass, salt grass, and salt meadow cord grass, are present in an estuarine intertidalwetland type. Presence of water smartweed, bladderwort, and pondweed in a palus-trine emergent wetland would yield a “yes” answer to item 5 (examples of thesewetlands can be found in Cowardin et al. 1979).
Item 5 would be answered “no” when a site is dominated by species that indicatepoor water quality. An example of this would be when an algae bloom early in thegrowing season dominates a site. Another example for a “no” answer would bewhen only one species is present where there should be multiple species. A foulsmell or discolored water should be further investigated to determine whether awater quality problem exists, or whether the foul smell is from anaerobic conditionsand the discoloration is from a natural accumulation of organics.
If water quality is limiting (a “no” answer) and there are still plants present, theywill almost always exhibit low vigor as described in item 12. However, the reverseis not always true; low vigor does not necessarily indicate a water quality problem.
“N/A” would apply for those wetland types that do not require riparian-wetland veg-etation to function properly.
There is a strong relationship between items 5 and items 8 through 13. If waterquality is so poor that it will not support riparian-wetland vegetation, then items 8through 13 will usually be answered “no.”
Supporting Science/Quantitative Methodologies
Lentic areas are “sinks” where water, nutrients, sediments, and other componentsaccumulate as part of the natural processes. But, the presence of pollutants in any
31
water body, including ground water, can cause problems with the health and vigor ofplant life. A few examples are:
• Freshwater aquatic plants are negatively affected by cadmium (a heavy metal) at concentrations ranging from 2 to 7400 micrograms per liter (µg/l) and cyanide from 30 to 26000 µg/l.
• Abnormal accumulations of salts can stress some plants or change the composition to plants that can tolerate elevated amounts of salts.
• Inorganic suspended materials reduce light penetration into the water body, and can lead to the formation of films on plant leaves, which blocks sunlight and impedes photosynthesis (EPA 1986).
The geology of some watersheds naturally yield salts, calcium carbonates (fromlimestone), or other components that can inhibit plant growth. Understanding thegeology, soils, and water source is important to assess whether the cause is appro-priate because of site potential or is a problem accelerated by some human-causeddisturbance in the watershed.
Water samples need to be collected and analyzed following each state’s protocols(check with the State Department of Water Quality or equivalent), and the resultscompared against known quality criteria.
Item 6: Natural surface or subsurface flow patterns are not altered by disturbance (i.e., hoof action, dams, dikes, trails, roads, rills, gullies, drilling activities)
Purpose
Alteration of surface or subsurface flow patterns may affect the functionality of asite. For areas where riparian-wetland vegetation is important, a change in flow patterns may mean a change in vegetation type (wetland species to upland species),creating a site unable to dissipate energies and function properly. For others, it maymean a change in extent of wetland or complete loss. The purpose of item 6 is todetermine if surface or subsurface flow patterns are being maintained.
Examples
A “yes” answer would be given for item 6 for the PFC prairie pothole example fromMontana in Appendix C. No disturbances, such as trailing, roads, or dams, are pre-sent that would affect surface flow patterns to the wetland. Disturbance within awatershed does not necessarily mean flow patterns are automatically altered. Roads,trails, dikes, and dams can be built and not affect the amount, time, or frequency ofsurface or subsurface flows. A key concept for a “yes” answer is whether a riparian-wetland area is receiving a normal range of surface and subsurface flows, even ifthere is disturbance within its watershed.
Item 6 would be answered “no” for the New Mexico lacustrine wetland exampleprovided in Appendix C. The development of trails has intercepted, diverted, and
32
concentrated overland flows away from the wetland site. This diversion and concen-tration of flows have initiated a headcut that is draining the site, thus reducing thewetland’s ability to dissipate energies and function properly. Another example of a“no” answer would be where a highly variable seasonal wetland was excavated inthe center, resulting in a reduction of the extent or the loss of wetland.
Item 6 can never be answered “N/A;” it is always answered “yes” or “no.”
There is a strong relationship between item 6 and items 1, 3, 10, 14, and 17. If item6 is answered “no,” then one or more of these items may be answered “no.”
Supporting Science/Quantitative Methodologies
If the natural surface or subsurface flow patterns of lentic areas are altered, thetiming, frequency, magnitude, and duration of inundation or saturation can beaffected, with corresponding changes to the soils and vegetation. Some examplesare when a riparian-wetland is not inundated because a dike keeps flood waters out;a lentic area is drained by diverting surface or subsurface flow away from the site; oran area has compacted soils, which reduces the infiltration rate and increases runoff.
Surface flow pattern changes can be tracked using aerial photography (Clemmer1994; Prichard et al. 1996). Also refer to the discussions under item 3 regardingchanges in the extent of riparian wetland areas and under item 4 regarding changesin water flow.
Item 7: Structure accommodates safe passage of flows (e.g., no headcut affecting dam or spillway)
Purpose
Some lentic riparian-wetland areas have been altered through the addition of structures designed to capture more runoff, thus creating a more permanent or largerwetland. The prairie pothole region in eastern Montana and North Dakota providesmany examples. However, when structures are placed to alter a riparian-wetlandarea, it is very important that the structure is designed and maintained to accommo-date safe passage of flows. The purpose of item 7 is to determine if these structuresare accommodating safe passage of flows.
Examples
If the ID team determines the structure is stable and accommodating flows, theanswer to item 7 would be “yes.” If there is erosion, leakage, or a headcut affectingthe integrity of the dam or spillway, the answer to item 7 would be “no.” Anexample is provided in Appendix C. For the functional—at risk prairie potholeexample in Montana (Appendix C), item 7 would be answered “no” because aheadcut has developed in the spillway and is threatening the integrity of the dam.
If no structures are present, item 7 is answered “N/A.”
33
Supporting Science/Quantitative Methodologies
Gully erosion occurs when headcuts form and an area downcuts. As the gullybottom downcuts, it deepens and then widens, thereby endangering the structure.Headcuts extend upstream or upslope into ungullied headwater areas, increasing thenumber of drainage channels (i.e., by developing additional tributaries) (Heede1976). If there is a headcut or nickpoint present downstream of a dam or otherstructure, there is the possibility that the headcut will advance upstream, removingpart of the structure and causing the wetland area to be eroded and drained. If leftunchecked, a headcut will proceed upstream until some hard point, such as abedrock outcrop, is encountered or a smooth transition between upstream and down-stream gradient is attained (Heede 1980).
When assessing item 7, the presence or absence of any headcuts below a structureshould be noted.
B. Vegetation
Items 8-15 address vegetation attributes and processes that should be in workingorder for a lentic riparian-wetland system to function properly. Landform can play amajor role in defining the riparian-wetland setting. Wide, flat valley bottoms resultin mosaics of vegetation, or complexes. The riparian-wetland complex as describedin the Intermountain Region Integrated Riparian Evaluation Guide (USDA FS 1992)is influenced by the valley bottom setting. The complex is comprised of patches ofcommunity types, in various amounts and locations. In assessing functionality, thewhole complex should be considered in order to understand such items as age classdistribution and species diversity.
The site potential should be evaluated when determining vegetation types that can befound in lentic riparian-wetland areas. Many lentic riparian-wetland areas do nothave the soil and hydrology conditions needed to support tree or shrub species.Many of these wetland types do not need tree or shrub species for physical stability.These species may be a component for desired condition, but are not required to des-ignate a lentic riparian-wetland area as functioning properly.
Factors such as the kind, proportion, and amount (cover or density) of vegetation inthe riparian wetland community contribute to the assessment of shoreline-forming/soil surface vegetation and the encroachment of upland vegetation. Thelinear distribution of vegetation is the primary factor affecting the extent of erodedshorelines/soil surfaces, assuming that the right kinds and proportions of species arein the community (or simply the inverse relationship—the amount of shorelines orsoil surfaces lacking the right kind and amount of vegetation). Lateral distributionof vegetation determines the riparian-wetland area’s ability to accommodate periodsof wind action, wave action, and overland flows and drought. In order to persist orimprove, the plant species or communities of interest must be both healthy (vig-orous) and replacing or increasing their numbers or extent through recruitment intothe community.
34
The level III riparian area evaluation from the USDA FS (1992) provides measure-ment techniques for cross-section composition of the riparian-wetland complex, veg-etation composition within a complex and along the greenline, and woody speciesregeneration. Each item, except for items 12, 14, and 15, can be quantified or inter-preted from quantified information using these techniques.
Riparian-wetland plants are classified into five types based on the likelihood of theiroccurrence in wetlands or nonwetlands (Reed 1988). These classes are: obligatewetland (OBL), facultative wetland (FACW), facultative (FAC), facultative upland(FACU), and obligate upland (UPL). OBL species are likely to occur in wetlands>99 percent of the time, whereas FACW species occur in wetlands between >67-99percent of the time. The FAC species are likely to occur in wetlands 33-67 percentof the time; FACU species are likely to occur 1-<33 percent of the time. UPLspecies almost never (<1 percent) occur in wetlands. The FACW, FAC and FACUcategories are subdivided by “+” and “-” modifiers. An FACW- would be closer toan FAC, or would reflect slightly drier conditions based on probability of occurrence(U.S. Army COE 1987).
Plant lists have been compiled by the FWS for each region in the United States.Some species may be listed as a different wetland indicator type, depending on thestate and region in which it occurs. Some states have developed localized plant listsas a subset of the national list.
Item 8: There is diverse age-class distribution of riparian-wetland vegetation (recruitment for maintenance/recovery)
Purpose
In most cases, a riparian-wetland area should have more than one age class of wet-land plants present for maintenance and/or recovery. This item is not askingwhether all possible age classes are present. It is only asking whether a sufficientnumber of age classes are present to provide recruitment to maintain an area or toallow an area to recover. Most riparian-wetland areas can do this with two ageclasses, as long as one is young (for recruitment). Mature woody species (e.g.,willow, birch, alder) usually survive due to deep roots. Herbaceous plants canrespond to changing site conditions more quickly because they are shallow-rooted.Most herbaceous riparian wetland plants spread vegetatively. A lack of spreading bythese plants may indicate a lack of age class diversity, possibly due to a change insite conditions. Many lentic riparian-wetland sites need only the right kind of herba-ceous vegetation for stability and proper function.
Examples
For riparian-wetland areas that require woody vegetation to achieve functionality,this item would be answered “yes” if there are seedlings and saplings present. Itwould be answered “no” if these age classes aren’t present. However, it is importantto determine the mode and timing of regeneration. In some systems, the site condi-
35
tions may not be favorable (either too wet or too dry) for germination, even thoughthere are many seeds on-site (a long-lived seed bank). Only one young age classmay be present when germination occurs infrequently. Willow and cottonwoodshave many seeds that are viable for about 2 weeks. If the mineral soil is too dry, theseeds will desiccate. A dense layer of sedges also limits establishment, since theseeds cannot come in contact with wet mineral soils. The seed source is always pre-sent, but the site conditions are not always favorable for seedling establishment.
Herbaceous riparian-wetland communities are typically dominated by grasslike(graminoid) plants that regenerate vegetatively by tillering, rhizomes, or stolons. Itcan be more difficult to distinguish between age classes. However, if you know thehabit of these species, i.e., if they are dense mat-forming sedges such as Nebraskasedge, you expect to see continuous, robust cover composed of many stems andblades. In this case, the answer to this item would be “yes.” However, if the coveris clumped or there are only scattered individuals, the answer would be “no.”
Many riparian-wetland areas have potential for both woody and herbaceous vegeta-tion. For example, wide valley bottoms can be occupied by a complex of geyer andbooth willow with continuous cover of beaked sedge in the undergrowth. Theanswer would be “yes” if young willows and robust cover of the sod-forming sedgeare present.
This item is evaluating riparian-wetland vegetation, not upland vegetation. If thearea has basin big sagebrush, with all age classes represented, but only has old,decadent willows, then the answer to this item would be “no.” The same is true foritems 9-13. One exception is “problem wetlands” (see Appendix F), such as highlyvariable seasonal wetlands, that may be dominated by upland plants during the drierpart of the growing season or sometime after drought.
An “N/A” answer would apply for those riparian-wetland areas that occur inbedrock, such as some high mountain lakes.
This item is very closely linked to items 3 and 12.
Supporting Science/Quantitative Methodologies
Age-class distribution may vary by the type of life form (tree versus grass) andspecies, but in general, healthy, expanding populations have many young-age-classindividuals, decreasing to fewer individuals of progressively older age classes, dueto natural thinning processes. If there are more older age classes, and little or noyoung age classes represented, then the population is decreasing. Long-livedspecies, such as woody plants, usually reproduce by seed. The site conditions haveto be appropriate during the time that the seeds are viable. If this happens infre-quently, the age class distribution will reflect this. Episodic events, such as floodingor drying may create favorable conditions for establishment, resulting in patchy dis-tributions of individuals of the same age.
Age of multistemmed woody species (particularly shrubs such as willows) is diffi-cult to determine, since coring the stems is practically impossible. Single stemmed
36
willows, such as peachleaf and Gooding’s willow, could be cored. Most shrubs,however, are “aged” based on the number of stems and proportion of live to deadstems (USDA FS 1992). Myers (1989) recommends using “stem age” for age-classanalysis of woody plants. A high correlation between basal stem diameter and agefor several riparian-wetlands species is also presented.
Herbaceous species that reproduce vegetatively through tillering, rhizomes, orstolons usually have a less patchy appearance, since the “young” individuals areattached to the “parent” plant. Site conditions likely matter less in this mode ofregeneration, since the plant has already established and is simply expanding.Bunch grasses, such as tufted hairgrass, may not be as common in riparian-wetlandsystems. However, if present, they will regenerate by seed, or by tillering, whichenlarges the tuft. Again, age-class distribution is often associated with vigor.
Item 9: There is diverse composition of riparian-wetland vegetation (for maintenance/recovery)
Purpose
In addition to diverse age-class distribution, diverse species composition is generallyalso important for maintenance and recovery. This item is not asking if all plants arepresent that an area can potentially support. Rather, the intent is to document thatthe existing species composition is sufficient for maintenance or recovery. This gen-erally means that two or more riparian-wetland species are present, but varies by thepotential of the site to support a given number of species. Some sites are dominatedby one species of sedge, such as beaked sedge. This may be due to both site charac-teristics and the competitive advantage of the species over other species. However,these monospecific sites may be more vulnerable to disease or extreme climatechanges, depending on the ecological amplitude of the dominant species. If it canonly survive within a narrow range of conditions, any change may lead to loss ofthat species and degradation of the area. Capability of the site must also be consid-ered. If the hydrology has been altered by some activity in the upper watershed,altered flows into the wetland may limit the types of species that can survive.Typically, sites are occupied by more than one species, unless there is a unique soilproperty or water regime, or the species is aggressive and outcompetes other species.
Examples
If an ID team determines an area can function with either woody or herbaceous veg-etation and the area has planeleaf willow and Wolf’s willow, the answer to item 9would be “yes” even though other species may be potentially present on the site. Ifthis same area contained only Wolf’s willow, the answer would be “no.” If the samearea contained Nebraska sedge and Baltic rush and no woody vegetation, the answerwould also be “yes.”
If however, the ID team determines that an area requires both woody and herbaceousvegetation, and only Nebraska sedge and Baltic rush are present, the answer to item
37
9 would be “no.” Even though two herbaceous species are present to maintain orrecover the area, the team determined that both woody and herbaceous componentswere necessary. At least one woody species and one herbaceous species are requiredin the species mix for that area.
Some riparian areas have the potential for only one species. If that species is pre-sent, then the answer is “yes.” Understanding the site potential will help in thisdetermination.
Many riparian-wetland areas function without woody vegetation. Marshes and wetmeadows may be completely dominated by sedges, rushes, other graminoids, andmosses. These may form a mosaic where the patches are dominated by a singlespecies. In some cases, woody vegetation may be desired, but the site has limitedpotential to produce woody species. This system still functions properly. If an uplandspecies or a drier site species, such as silver sagebrush or shrubby cinquefoil, were pre-sent, this would likely indicate that the site is drying. The presence of these types ofspecies should not be considered as part of the number of wetland species presentwhen addressing this question. They instead reflect a shift in composition away fromriparian wetland species. However, it is important to know the potential of the areabefore determining whether the species present should or should not be there.
“N/A” would apply to those types of areas that do not require vegetation to functionproperly.
Supporting Science/Quantitative Methodologies
In order to know the potential (i.e., the types of species and associated communitytypes) for a given lentic area, it is critical to consult the local classification or eco-logical site descriptions (USDA NRCS 1998c) if they exist. Regional riparian-wetland classifications, even those from adjacent states or regions, are a goodresource. They provide descriptions of types that may also occur across the WesternStates, due to the presence of water, regardless of their location. That makes iteasier to refer to classifications from adjacent states if you don’t have one in yourlocal area. For example, many classifications have a Geyer willow/becked sedgetype that are very similar for major species and site characteristics from Montana(Hansen et al. 1995) to Nevada (Manning and Padgett 1995). These classificationshave been helpful in evaluating sites in adjoining states where no current classifica-tion existed. The type descriptions, along with the constancy/average cover tableshelp describe the range of characteristics in terms of site, location, hydrology, andspecies composition and structure. Without these classifications it is difficult toassess potential and determine the number of species that should be present.
Item 10: Species present indicate maintenance of riparian-wetland soil moisture characteristics
Purpose
The intent of this item is to look for those species that indicate the presence of ashallow water table, which maintains riparian-wetland species over time. A persis-
38
tent water table typically is essential to the maintenance or recovery of a riparian-wetland area. This item is not asking the amount or stabilizing ability of the species,but rather if the presence of these species indicate maintenance of riparian-wetlandmoisture conditions. Even annuals, such as ovate spikerush (OBL) and rabbit-footgrass (FACW), may indicate maintenance of the water table in the absence of deep-rooted perennials. This depends on how degraded the area appears and the types ofspecies present.
Examples
When OBL or FACW plants (e.g., bog birch, baltic rush) are present, this itemwould be answered “yes” since these plants usually occur under natural conditionsin riparian-wetland areas. If FACU or UPL plants (e.g., rabbitbrush, Sandbergsbluegrass) dominated the area, this item would be answered “no” since these speciestypically occur in upland settings.
Some intermittent/seasonal systems, depending on timing/frequency of precipitationor inundation, could be somewhat different; their potential may be FAC plants, suchas chokecherry. In these situations, this item would be answered “yes.” However, ifthese systems are dominated by FACU and/or UPL plants, then this item would beanswered “no.”
It is important to look at the age of the wetland indicator plants. If there are matureGeyer and Drummond willows (OBL species), but no young willows and no OBLherbaceous undergrowth, then the site may be drying out. The mature woodyspecies can access the deep water table, but the herbaceous species are more sensi-tive to changes in soil moisture. They reflect the depth and duration of the watertable and will respond more rapidly. It also helps to know what species one wouldexpect to find in these communities; local classifications help in determining if theundergrowth is appropriate for that riparian-wetland community.
An “N/A” answer would apply for those riparian-wetland areas that are confined inbedrock, such as some high mountain lakes.
There is a strong relationship between item 10 and items 1, 3, 6, and 17. If item 10is answered “no,” then items 1, 3, 6, and 17 will often be answered “no” as well.
Supporting Science/Quantitative Methodologies
Most riparian-wetland classifications address those types that reflect drier states(Leonard et al. 1992b). For example, willow types with Kentucky bluegrass under-growth (Manning and Padgett 1995) usually indicate a shift in undergrowth awayfrom wet site species, such as sedges, due to either disturbance and/or site drying.Myers (1989) also cites an increase in upland plants as indicators of a decliningwater table. These could initially be undergrowth species, such as Douglas sedge, orwoody species, such as rabbitbrush.
In order to address this item, it is recommended that species composition and age-class distribution be assessed. This assessment may show an apparent trend from

39
which an inference can be made about whether the system is maintaining soil mois-ture characteristics. For example, if young willow and sedges are present and onlyold sagebrush remain, then the wetland species would appear to be reoccupying asite that at one time was drier. In particular, expansion of residual clones of rhi-zomatous sedges will indicate that the water table is probably nearer the surface, andat a longer duration than when the sagebrush dominated the site.The FAC-neutral test (U.S. Army COE 1987) can be used to calculate whetherspecies indicate maintenance of riparian-wetland soil moisture characteristics.
Item 11: Vegetation is comprised of those plants or plant communities that have root masses capable of withstanding wind events, wave flow events, or overland flows (e.g., storm events, snowmelt)
Purpose
Lentic riparian-wetland areas such as marshes can have open water or they can bewet meadows that may have standing water some part of the year. In both situa-tions, the root masses anchor the soil and protect either the shoreline or the soil sur-face from wind and wave action or overland flow. The intent of this item is todocument that the shorelines/soil surfaces have the right plants or community typesto protect the riparian-wetland area from erosion. It is asking if those species haveroot systems capable of withstanding such events. It is only asking if those speciesare present, it is not asking for an amount. However, there must be enough (i.e.,more than a few scattered individuals) to stabilize exposed soil and shorelines withproper management.
Most perennial plants that are OBL and FACW have root masses capable of with-standing these events, while most FACU and UPL plants do not. Typically, herba-ceous species with rhizomes or stolons, which form a continuous mat of roots (ratherthan isolated individual bunch grasses), are most effective.
Examples
Woody riparian-wetland species, such as willow, alder, dogwood, and birch, have adense root wad that is very effective in armoring shorelines against wave action, icedamage, undercutting, and bank collapse. Coyote willow has a colonizing habit—itexpands vegetatively by underground shoots that stabilize bare soil surfaces such asthose along pond and marsh margins. Herbaceous wetland species, particularly rhi-zomatous graminoids, such as cattails, bulrush, sedges, rushes, and some wetlandgrasses, have dense fibrous root systems that create a stable soil, bound together byan extensive network of fine roots. These roots and rhizomes have such a strong sta-bilizing effect on the soils that they can armor the soil surfaces and shoreline againstextreme events. They are particularly effective in protecting against ice damage,which removes unvegetated soil away from the shoreline and exposes more shorelineto further damage. The ice crystals cannot break apart the root network. If theseplants are dominant, then the answer would be “yes.” If, however, a weakly rhizoma-tous grass such as Kentucky bluegrass, or a tap-rooted shrub such as basin big sage-
40
brush, were dominant, then the answer would be “no.” These species do not have asufficient root system to stabilize the soil surface/shoreline against these events.
Intermittent/seasonal areas would be an exception. For many of these areas, domi-nance of FAC plants may be all that is required for a “yes” answer. For example,dry meadows that are dominated by Douglas sedge and mat mulhy, with minoramounts of baltic rush, have the potential for only these species to dominate, sincethey dry out early in the growing season.
There are situations, such as with high mountain lakes surrounded by boulder fields,where vegetation has no influence on shoreline stability. For these, the answerwould be “N/A.”
Supporting Science/Quantitative Methodologies
A good indicator is the presence of OBL and FACW species, because they typicallyhave high erosion control potential, which is determined from the species’ rootinghabits (Lewis 1958; Manning et al. 1989), or preferably from ratings or discussionsof both species and community types, such as in Weixelman et al. (1996), Hansen etal. (1995), Manning and Padgett (1995), USDA FS (1992), and Kovalchik (1987).In general, graminoids with rhizomes or stolons are the best soil binders since theyform a continuous, interwoven mat of rhizomes and large, medium, and fine roots.It is the high proportion (both in mass and density) of fine roots (over 90 percent inNebraska sedge) within this mat, however, that aids in aggregate formation, rootturnover, and inputs of organic matter into the soil. These properties aid in soildevelopment, which in turn creates a more favorable environment for wetland plantestablishment.
Even though the above publications are for local areas, the species and similar com-munity types occur broadly throughout the Western States. Certain species, such asNebraska sedge, beaked sedge, and baltic rush, are common throughout the 11Western States.
Again, there are exceptions (e.g., bedrock-controlled lake) where vegetation con-tributes little, if any, to shoreline stability. It may provide habitat to many wildlifeand invertebrate species, but it doesn’t provide stability.
Item 12: Riparian-wetland plants exhibit high vigor
Purpose
The intent of this item is to determine if riparian-wetland plants are healthy androbust or weakened and stressed and being lost from the plant community. Theaboveground expression is a reflection of the condition of the root system and theability of riparian-wetland species to hold an area together. As riparian-wetlandplants weaken, they can become decadent and eventually die, making the area sub-ject to degradation.
41
Examples
This item is very important, but is sometimes difficult to answer. For most riparian-wetland areas, plant size, shape, and leaf color during the growing season can beused to determine vigor. However, variability between site characteristics and cli-mate between years can produce differences as great as those differences betweenstressed and unstressed plants on similar sites. Knowledge of reference areas is nec-essary to distinguish effects of site differences from induced stress.
It is useful to separate woody plants and herbaceous plants when assessing vigor.For example, shape and percent of dead stems may be the important indicators forwillows, whereas plant height and leaf width may be the important indicators forNebraska sedge. If willows for a given area are well rounded and robust, and asso-ciated (ungrazed) Nebraska sedge plants averaged 80 cm high with leaves 10 mmwide at the base, the answer to item 12 would be “yes.” If these same willows werehighlined/mushroom-shaped, contained a lot of dead stems, and the (ungrazed)Nebraska sedge plants only averaged 20 cm high with leaf widths of only 5 mm on asimilar site, the answer is “no.” It is common to have a mixed answer indicated onthe form as a “liner” with comments that the willows, for instance, had low vigorbut the herbaceous components appeared healthy. Exclosures on similar sites canhelp in assessing vigor.
Another example of when this item would be answered “no” would be if plantleaves are turning yellow (chlorosis) during the growing season. This may happenas a result of water being removed or added to a system, which stresses the plants.For plants adapted to prolonged saturation, the stress is usually greatest when wateris removed, but plants requiring periodic aeration may suffer stress either way.Change in leaf color can also indicate a disease problem, water chemistry (toxicity)problem, or climatic factors such as temperature stress.
Abundance of herbaceous plants can also be used to assess vigor, but must be usedwith caution. If Nebraska sedge forms a dense, continuous sod, the answer to item12 would be “yes.” If Nebraska sedge occurs as isolated plants or broken clumpsthat are not forming communities, the answer is probably “no.” However, a recentchange in management can result in healthy, vigorous clumps that simply haven’thad time to develop into dense swards. Leaf width, plant height, and degree of newtillers can help make that determination.
“N/A” would be used for riparian-wetland areas that have no potential to producevegetation.
Supporting Science/Quantitative Methodologies
Vigor is difficult to quantify, possibly because the relative health of plants within acommunity can be expressed in many morphological and physiological forms. Thereproductive indicators for herbaceous species discussed in item 8 (unhealthy plantsdon’t reproduce as well), along with plant size or volume; leaf area, number, size,and color; and root growth are all associated with relative plant health or vigor. A
42
review of plant physiological responses to various stresses (Sosebee 1977) indicatesthat reduced productivity is associated with most, if not all, responses. There isabundant information on the use of production as a measure and its associatedadvantages and disadvantages (Elzinga 1998). Production can be especially prob-lematic to measure on trees and shrubs. Growth form (morphology), leader length,and the proportion of dead or dying stems in comparison with young leaders (Cole1958) are longstanding indicators of vigor on shrubs.
Chlorosis (yellowing), necrosis (tissue degeneration), and wilting are also good indi-cators of loss of vigor from moisture, chemical, temperature, or disease stress.Although there are direct measurements associated with these indicators, the mostcommon field measurements would still be relative productivity, size, or reproduc-tion of plants.
Weixelman et al. (1996) have established procedures for documenting mean rootingdepth and expected ranges of rooting depth associated with various ecological condi-tions of specific riparian community types. Shallower rooting depths associatedwith the declining status of an ecological type can, in part, be a quantitative measureof the vigor of the community.
Item 13: Adequate riparian-wetland vegetative cover is present to protect shoreline/soil surface and dissipate energy during high wind and wave events or overland flows
Purpose
Vegetation filters sediment, aids floodplain development, protects shorelines, etc., allof which dissipate energies associated with wind action, wave action, and overlandflow events. The purpose of this item is to determine if there is an adequate amountof vegetation present to dissipate energies from these events.
This item is crucial for areas where vegetation is required for proper functioning.For a riparian wetland area to recover, composition of the right plants, recruitment,etc., are necessary. However, until the right amount is present, the riparian-wetlandarea will not cross the threshold that would allow it to function properly.
Examples
For a wetland that receives periodic wind and wave action, the shoreline oppositethe direction of the prevailing winds may require 90 percent cover. If an area hasadequate cover of riparian wetland plants, the answer to item 13 would be “yes.”For other wetland types with different site potential, the shoreline may only need 70percent cover for the answer to be “yes.”
If a shoreline being assessed is dominated by upland plants, the answer to item 13would be “no.” If this same shoreline is 50 percent riparian-wetland plants and 50percent upland plants, the answer to item 13 would still be “no.”
43
Item 13 would be answered “N/A” for riparian-wetland areas that do not need vege-tation to achieve PFC.
It is important to understand that item 13 deals with amount, while items 8-12 dealwith composition, age class, etc., not amount. Generally item 13 will be answered“no” if one or more of the other vegetation items are answered “no.”
Supporting Science/Quantitative Methodologies
The best protection against excessive erosion is the preservation of adequate vegeta-tive cover to dissipate the erosive forces acting upon a shoreline/soil surface duringperiods of wind action, wave action, and overland flows. Forces resisting erosioninclude physical properties of the shoreline/soil surface and vegetative protectionfrom erosive shear. Physical properties of the shoreline/soil surface are primarilyrelated to cohesive strength of shoreline/soil surface materials and other factorsincreasing tensile strength. Cohesive strength of shorelines/soil surfaces materials islargely a function of soil texture (especially particle size), soil chemistry, and soilstructure. However, vegetation root mass and length also increase the tensilestrength of the shoreline/soil surface.
Vegetation has the potential to influence the balance of energy during wind action,wave action, and overland flows in at least two ways. First, living or dead vegeta-tion (or any other cover) that extends into the wind action, wave action, and over-land flow has the potential to reduce energies, thus reducing erosive shear forcesacting upon the shoreline/soil surface.
Vegetation also influences the balance of energy during flow events by increasingresisting forces in the shoreline/soil surface. Particularly in noncohesive soils andsediments, vegetation greatly increases the resistive forces in shoreline/soil surfacematerials. Tensile strength provided by root masses of riparian-wetland vegetationmay be the primary source of resistance in the soil of many western riparian-wetlandareas. Tensile strength will be dependent upon both the kind of vegetation presentand the extent and density of root masses in the soil. Determination of root massadequacy will be site-specific, as less cohesive sediments will require greater rootmass to achieve the same level of stability as more cohesive soils elsewhere.
A preferred method of quantification is to calculate a greenline stability rating(USDA FS 1992 and similar documents). A stability rating of 7-10 would generallybe considered adequate. However, there may be instances in low-energy systemswhere a rating of 5-6 might suffice, but these are expected to be rare situations.
Item 14: Frost or abnormal hydrologic heaving is not present
Purpose
Frost or hydrologic heaving occurs when soil pores contain free water conducive tothe development of segregated ice lenses or crystals and when temperatures dropbelow freezing. Expansion when water changes from a liquid to a solid state and
44
continued growth of ice crystals or lenses over time can expand the soil surfaceupward. This is a natural process that can be aggravated by impacts that either sealparts of the surface, which restricts water infiltration between plants, or reduces porespace by compaction between plants. Excessive removal of vegetation acting asthermal cover can also exaggerate the effects of freezing. Over time, vegetatedhummocks of increasing elevation develop between the sealed or compacted inter-spaces. Riparian wetland vegetation on the hummocks may be diminished orreplaced by upland vegetation as the surface becomes elevated above the watertable. Root shearing becomes a problem and interspace areas are exposed toincreased erosional forces. Slope wetlands may experience a higher ground waterdischarge from the site as hummocks increase. The intent of this item is to deter-mine whether frost or hydrologic heaving is occurring, and if so, whether it is occur-ring at a normal or aggravated rate.
Examples
Before answering item 14, the ID team has to determine that frost or hydrologicheaving can occur on the site. Many riparian areas will not experience thisattribute/process. For frost or hydrologic heaving to occur, the right amount ofmoisture, soil conditions, and freezing temperatures must be present to allow waterdroplets in the soil to form ice crystals. For areas that do not meet these require-ments, including most of the riparian-wetlands that occur in the desert Southwest,the answer to item 14 would be “N/A.”
When this process does occur, the ID team judges if the rate of frost heaving is normalor aggravated. If the configuration of frost heaves is normal relative to height anddensity of mounds, the answer to item 14 is “yes.” If the mounds are significantlyhigher than normal or more frequent, then the answer is “no.” Appendix C providesan example of a lacustrine wetland in Colorado that shows both. The frost heaving onthe left is more column like, with more frequent and often narrower hummocks. Mosthummocks on the left are also slightly higher. Also note the higher proportion of non-vegetated interspace. The answer to item 14 would be “no” for the area on the left and“yes” for the area on the right, which is considered to be “natural.”
The example provides an easy comparison because of the fenceline contrast acrossthe same valley bottom with presumably the same soil and hydrology. Comparisonsof different locations should be assessed on sites with similar soil, moisture, andambient temperature.
Appendix C provides another example of excessive hydrologic heaving on a wetmeadow wetland in Idaho.
Supporting Science/Quantitative Methodologies
Frost heaving doesn’t typically occur in clean sands and gravels, but does occur asthe silt and nonplastic clay content in the soil increases. The proper moisture con-tent and freezing temperatures are also necessary for frost heaving to occur (Hough1957).

45
The National Soils Handbook (USDA 1983) describes the basic processes and engi-neering significance of frost heaving. Empirical evidence indicates that severity ofthe frost action can be aggravated through management practices such as improperlivestock grazing. However, there is little additional literature on the precise mecha-nisms leading to that result or quantification of ecological consequences in differentsettings. The hummock topography in wet meadows is different than other frostheave situations. Raised portions of natural frost boils are higher on the barren por-tion of the heave than vegetated surroundings (Fahey 1974), whereas the raised por-tion of meadow hummocks are vegetated. The compacted area in vehicle tracksseems to have greater frost heave and subsequent subsidence (Gatto 1997), whereasthe probable compacted area between the hummocks appears to have less severeheaving. Differential frost heave (Fowler and Noon 1997) may have some bearingon the differences observed, but the relationship has not been described for the situa-tion here (to our knowledge). The National Range and Pasture Handbook (USDANRCS 1998c) also describes frost heaving of forage plants, but it does not describethe hummock topography. It is possible that downward and outward expansion inthe interspace is squeezing the soil and plant tussocks up like squeezing toothpasteout of a tube, but that is speculation by the authors. Our suggestion is that thisprocess is sufficiently common to warrant additional research on managementimpacts in natural settings subject to frost heave.
Measurement of the hummock topography for comparison purposes can be accom-plished using a one-dimensional soil roughness analysis described by Grossman andPringle (1987). One dimensional soil roughness is the variation in ground surfaceheight along a line. In the procedure used, the distance is measured at regular inter-vals to the ground surface from a leveled rod. Heights are then corrected for theground surface slope and the standard deviation of the corrected height is calculated.The procedure can be adjusted to obtain roughness at different scales.
Item 15: Favorable microsite condition (i.e., woody material, water temperature, etc.) is maintained by adjacent site characteristics
Purpose
Some riparian-wetland areas require very specific conditions to sustain temporalwater budgets. If seasonal inflows, outflows, and/or evapotranspiration characteris-tics are significantly altered, the type and extent of the riparian-wetland area can alsobe altered. Adjacent site characteristics can directly influence both inflow and out-flow by buffering surface runoff. Changes in the type of vegetation can also changeevaporation versus transpiration rates. Increases or decreases in one may not be pro-portional to changes in the other, thus affecting annual patterns of soil water states.In some riparian-wetland areas, adjacent site characteristics can affect vegetationrecruitment potential on-site by shading, temperature modification, available seedgermination sites, etc. If functionality is dependent on these particular species, thenthe adjacent site characteristics must also be maintained. The intent of this item is to

46
determine whether microsite conditions are necessary for proper functioning, and ifso, whether adjacent site characteristics are maintaining those conditions.
Examples
Forested depressional wetland areas in the Pacific Northwest require the presence ofnursery logs that provide sites for some plants such as western red cedar to establish.The decaying logs must also maintain adequate moisture and temperature for germi-nation. Trees on adjacent sites can buffer inflows to these sites to prevent excessiveinundation. Probably more importantly, a certain density of tall trees provides shadethat prevents surface drying during germination. The mature trees surrounding thesite are also a greater source of nursery logs than the trees on-site.In this situation, the absence of large trees for shade and nursery logs within fallingdistance of the riparian-wetland area would result in a “no” answer for item 15. Ifthere is a mixed age class of trees on adjacent sites with sufficient canopy to providesolar insulation to the site, item 15 would be answered “yes.” If they are not presentor being maintained, then the answer to item 15 would be “no.”
Maintaining favorable microsite conditions may also be necessary for retention ofpermafrost for some areas such as black spruce wetlands in Alaska (Post 1996).
In many cases, the effects associated with adjacent site characteristics will havealready been considered in item 4 (upland watershed) or item 6 (surface or subsur-face flow patterns). Before answering item 15, it is important to determine ifmicrosite conditions have to be present to function properly and then identify whatthese conditions are. Most riparian-wetland areas do not require these special condi-tions. In sites that do not require these conditions to be present to function properly,the answer to item 15 would be “N/A.”
Supporting Science/Quantitative Methodologies
Brinson (1993) and Walton et al. (1995) describe wetland hydraulic and hydrologicalprocesses including those that may be influenced by adjacent sites. Daily waterstage can be measured as a direct indicator. However, effects of overall watershedconditions versus adjacent site and evapotranspiration characteristics is difficult todetermine. Surface-level solar radiation and daily maximum and minimum tempera-tures can also be measured as direct indicators for sites such as the forested wetlanddescribed above. There may be other microsite conditions that affect different typesof wetlands and their function.
The publication An Approach for Assessing Wetland Functions UsingHydrogeomorphic Classification, Reference Wetlands, and Functional Indices(Smith et al. 1995) describes a procedure for characterization, assessment, andanalysis that should help identify and model relationships of adjacent sites tomicrosite conditions where they exist.

47
C. Erosion/Deposition
Items 16-20 deal with erosion/deposition attributes and processes that have to be inworking order for an area to function properly. Some of the documents referenced inthe introductions to the sections on hydrology and vegetation are also appropriate here.
Item 16: Accumulation of chemicals affecting plant productivity/composition is not apparent
Purpose
Maintaining a chemical balance in a lentic riparian-wetland area is necessary forfunctionality. The accumulation of harmful chemicals can potentially affect plantcomposition and/or productivity. The intent of this item is to determine if the vege-tation is being affected by chemicals in the system.
Examples
If a riparian-wetland area shows no accumulation of harmful chemicals and requiresvegetation to function properly, the answer to item 16 would be “yes.” If there isaccumulation of chemicals, the ID team must then determine if the accumulation isaffecting productivity/composition of riparian-wetland plants. If this accumulationof chemicals is not affecting plant productivity or composition, the answer to item16 would still be “yes.” But if this accumulation is affecting plant productivityand/or composition, item 16 would be answered “no.”
An ID team has the option of taking samples for further evaluation should they beunable to adequately answer this question. Many chemicals that would typically befound in a lentic riparian wetland area, such as phosphates and nitrates, may actuallyenhance vegetative production. But they may also cause algae blooms, reduction ofoxygen in open water systems, and rapid eutrophication that is not necessarily good.
There are situations where the accumulation of chemicals is obviously harmful tovegetation, even to the point of being toxic (in some situations, potentially a healthhazard to people). An excellent example would be the established Superfund sitenear Butte, Montana. The heavy metal content in the water of this area has essen-tially created such harsh conditions in the riparian-wetland area that no vegetationexcept a few scattered plants can survive. Flocculated metal salts contained in thewater may be deposited on the soil surface. The answer in this situation would be“no.”
“N/A” would apply for those riparian-wetland areas that do not require vegetation tofunction properly.
Item 16 is closely associated to items 8, 9, and 18. When item 16 is answered “no,”either item 8 or 9 must also be answered “no.” When item 16 is answered “no,”item 18 should be viewed as a possible cause.

48
Supporting Science/Quantitative Methodologies
The amount of accumulation of chemicals that affects plant growth depends on soiltexture, distribution and type of salts in the soil, and plant species (USDA NRCS1998a). Singer and Magnus (1987) found that drainage and high evaporation alsopromote the accumulation of salts. Salts of sodium, calcium, and magnesium withchloride, sulfate, and bicarbonate are the most common.
Chemicals (salts and heavy metals) are delivered to the soil surface by capillaryaction, ponded water, ground water, and overland flow. Salts are transported to thesoil surface by capillary action and are precipitated out during evaporation of thesoil water. The amount of salt that accumulates depends on the soil texture, depth ofthe water table, and depth of restricting layers. The height of capillary rise in theunsaturated soil above the water table depends on the soil grain size. The predictedheight of capillary rise in sediments varies from 750 cm for fine silts to 1.5 cm forfine gravel (Fetter 1994). Evaporation from the pond surface causes salts to precipi-tate along the shoreline as the surface area of the pond decreases. In these evapora-tion zones, salts accumulate and salts and other solutes in the soil water lower theosmotic component of the soil moisture. For plants to grow in an environment ofincreased salts, the plant must change the concentration of the solute in the cells.This process of osmotic regulation costs the plant energy and decreases its growth(Singer and Magnus 1987). Plant growth also decreases in response to toxicity ofone or more ions of salt.
Because different plant species have different tolerance levels to salts, the plant com-munity composition changes with the changing concentrations of salt. In addition tochanging the osmotic component, high levels of salt alter the pH of soils, thuschanging the availability of such micronutrients as Fe, Mn, Cu, and Zn.
Chemical- (salt-) affected areas may be detected by observing: 1) salt crystals orcrusts on the surface, 2) zones of accumulation in the soil profile, and 3) reducedplant vigor. The degree of chemical accumulation may be determined from satu-rated soil paste extracts (USDA U.S. Salinity Laboratory 1954; USDA NRCS 1996).Salinity can be determined in the field by a portable salinity tester.
Item 17: Saturation of soils (i.e., ponding, flooding frequency, and duration) is sufficient to compose and maintain hydric soils
Purpose
Hydric soils are developed and maintained through frequent flooding, ponding, orsaturation for a long enough time for anaerobic conditions to develop. The intent ofitem 17 is to determine whether hydric soils are being created or maintained in thoseareas that should have hydric soils.
Examples
Soils that are regularly flooded usually produce indicators that they are beingflooded and are hydric. These indicators are accumulations of iron and manganese

49
oxides (redox concentrations) and/or organic matter, iron and clay depletions (redoxdepletions), and matrices that have low chroma color in situ (reduced matrices).When soils display these characteristics, the answer to item 17 would be “yes.”When soils display these characteristic and lack saturation or inundation, the answerto item 17 would be “no.”
“N/A” would apply to those riparian-wetland areas where hydric soil conditions donot form, for example, a rocky shore or gravel beach.
Because hydric soils are developed and maintained by inundation or saturation,items 17 and 1 are closely associated. When answering item 17, the ID team shouldrefer to how they answered item 1. A “no” answer to item 1 may result in a “no”answer to item 17.
There is a strong relationship between item 17 and items 3, 6, and 10. If item 17 isanswered “no,” then one or more of these related items will also be answered “no.”
Supporting Science/Quantitative Methodologies
A soil is considered hydric if it forms under conditions of saturation, flooding, orponding long enough during the growing season to form anaerobic conditions in itsupper part. Hydric soils are formed by biogeochemical processes that promote theaccumulation of organic matter and the reduction, translocation, and accumulation ofiron, manganese, sulfur, and carbon compounds. In the wettest soils, a rotten eggodor (hydrogen sulfide) is a strong indicator of hydric soils. Other indicators areeither the depletion or concentration of Fe/Mn. Hydric soils with parent materialslow in Fe/Mn may have low chroma colors that are not related to the moisture con-tent. In these situations, as well as in the absence of hydrogen sulfide, the accumu-lation of carbon should be used as an indicator. These indicators include presence ofHistosols or Histic Epipedon (Vepraskas 1994).
The presence of a hydric soil indicator is the easiest way to demonstrate that soil sat-uration is sufficient to develop and maintain hydric soils. In cases where hydric soilindicators are not present, other more complicated measures can be taken to deter-mine soil saturation. Certainly if long-term hydrologic data is available, saturationcan be determined. Also, weather data, measurement of redox potential, and dyes,such as alpha alpha dipyridyl, can be used (Vepraskas 1994).
Hydric soils may be difficult to identify in the field if: 1) they are derived fromgrayish or reddish parent materials, 2) they have a high pH or low organic mattercontent, 3) they are Mollisols or Vertisols, 4) they have relict redoximorphic fea-tures, or 5) they have been disturbed, as in cultivated and filled areas. Artificiallydrained or protected soils are considered hydric if they have at least one of the indi-cators.
The hydric soils criteria (1995) can be found in USDA NRCS (1998b):
1. All Histosols except Folists, or2. Soil in Aquic suborders, great groups, or subgroups, Albolls suborder,
Aquisalids, Pachic subgroups, or Cumulic subgroups that are:
50
a. somewhat poorly drained with a water table equal to 0.0 foot (ft)from the surface during the growing season, or
b. poorly drained or very poorly drained and have either:(1) water table equal to 0.0 ft during the growing season if textures
are coarse sand, sand, or fine sand in all layers within 20 inches(in), or for other soils,
(2) water table of less than or equal to 0.5 ft from the surface duringthe growing season if permeability is equal to or greater than 6.0 in/hour (h) in all layers within 20 in, or
(3) water table at less than or equal to 1.0 ft from the surface duringthe growing season if permeability is less than 6.0 in/h in anylayer within 20 in, or
3. Soils that are frequently ponded for long or very long duration during thegrowing season, or
4. Soils that are frequently flooded for long or very long duration during thegrowing season.
The main purpose for the criteria is to create hydric soil lists. According to theNational Technical Committee for Hydric Soils, criteria 1, 3, and 4 can be used todocument the presence of a hydric soil; however, proof that anaerobic conditionsexist also must be obtained. Either data or best professional judgement may be usedto document anaerobic conditions. Criteria 2 cannot be used to document the pres-ence of a hydric soil; hydric soil indicators are used to document the presence of ahydric soil for these saturated soils (Hurt and Carlisle 1997).
Field indicators for hydric soils vary from one land resource region to another(USDA NRCS 1998b). These indicators include color, presence of redoximorphicfeatures, thickness, and depth.
The following steps should be included in any method for identifying hydric soils(USDA NRCS 1998b):
a) All organic materials (leaves, needles, bark, etc.) should be removed toexpose the surface.
b) Several holes should be dug to a depth or 50 cm (20 in.) or as deep as neededto make an accurate description. Multiple holes will ensure that the soil pro-file description is representative of the site and will remove variations causedby small changes in elevation.
c) From the description, field indicators that have been met should be specified.d) Measurements should be made from muck or mineral soil surface unless
instructed otherwise.e) All colors refer to moist Munsell colors. Soil chroma should not be rounded
to meet an indicator. A soil matrix with a chroma between 2 and 3 should belisted as having a chroma of 2+. (If the indicator has a chroma of 2 or less, achroma of 2+ would not meet the requirements.) Values should be roundedto the nearest color chip. Methods of characterizing redoximorphic features,such as quantity, class, size, contrast, color, and moisture state, are based onestablished field techniques (USDA NRCS 1998b).
51
Item 18: Underlying geologic structure/soil material/permafrost is capable of restricting water percolation
Purpose
Lentic or standing water riparian-wetland areas often have an underlying materialthat causes a site to persist. This underlying material restricts water percolation, producing permanent or seasonal ponding, saturation, or inundation. This materialmay be a geologic structure such as bedrock, a soil type like clay, or permafrost.This underlying material has to be maintained for an area to function properly.
The best way to describe the importance of maintaining this underlying material is tocompare a riparian-wetland area to a bathtub with a plug. As long as the plug staysin place, the tub can retain water, but as soon as the plug is pulled, it can no longerretain water. When this happens, an area can no longer maintain existing hydrologyand associated vegetation because it is being drained and will eventually be lost.
The intent of item 18 is to identify whether this underlying material is being main-tained.
Examples
If a riparian-wetland area shows no signs that its underlying material has been dis-turbed and is restricting water percolation, the answer to item 18 would be “yes.” Ifan ID team observes activities such as dredging or the formation of a headcut that isdraining an area, the answer to item 18 would be “no.” The functional—at risklacustrine wetland in New Mexico (Appendix C) provides an example of when item18 would be answered “no.” Surface disturbance has initiated a headcut that hasdisrupted the underlying material and is draining the wetland area.
“N/A” would be used for a riparian-wetland area that does not have a restrictinglayer, such as one that is sustained by the upward movement of ground water.
Supporting Science/Quantitative Methodologies
An underlying restrictive layer is a prerequisite for most standing water systems.Natural restrictive layers may be caused by geologic materials or activities, com-pacted soil material such as clay or hardpans, and in some areas, permafrost. In arti-ficial standing water systems, synthetic fabrics, clay layers, or chemical applicationsmay form restrictive layers.
If saturation or inundation hydrology is observed, then the obvious answer to item18 is “yes.” However, if hydrology is not observable at the time of the assessment,then recent aerial photography can be used to observe if an underlying material isbeing maintained. If direct observation of hydrology or aerial photography at thewet time of year are not available, then local geology or soils information should beused to indicate if a layer restrictive to water movement occurs in the area. Layers

52
that are restrictive to water movement are often too deep for direct observation withhand tools.
Where disturbance is suspected to have altered a restrictive layer, tests should bemade by comparing disturbed area attributes to the undisturbed area attributes.Many restrictive layers are not perfectly sealed and disturbance can accelerate therate of loss, thereby reducing the riparian wetland area extent.
Item 19: Riparian-wetland is in balance with the water and sediment being supplied by the watershed (i.e., no excessive erosion or deposition)
Purpose
Over geologic time, lentic riparian-wetland areas typically fill with sediment andmay even convert to an upland area type, which is natural. However, this conver-sion rate can be accelerated by activities within a watershed, such as road building,logging, water diversions, farming, or grazing, if not done properly. Too many roadsor roads in the wrong location may accelerate erosion within a watershed. This ero-sion may result in excessive amounts of sediment being supplied to a riparian-wetland area, filling it faster. When this happens, an area will no longer functionproperly. The intent of item 19 is to identify that water and sediment are being sup-plied at a natural rate and can function properly.
Also, if flows increase into a riparian-wetland area, increased energy may formheadcuts, endangering the area. Increased flows may also change the type ofriparian-wetland (i.e., marsh to lake).
Examples
If a lentic riparian-wetland area shows no evidence of excessive deposition and isnot filling any faster than its normal rate as a result of excess sediment from thewatershed, the answer to item 19 would be “yes.” If flow has been added from adiversion, and excessive erosion or deposition is taking place as a result of thisincreased flow, the answer to item 19 would be “no.” Indicators of excessive ero-sion or deposition can include unstable shorelines, deltas extending into a wetland,and loss of open water. The Nevada seep wetland in Appendix C provides anexample of a wetland for which the answer to item 19 would be “no.”
Item 19 will never be answered “N/A;” it will always have a “yes” or “no” answer.
Since water and sediment are supplied from the watershed, this item is closely tiedto item 4.
Supporting Science/Quantitative Methodologies
Riparian-wetland areas are constantly adjusting to the water and sediment being sup-plied by the watershed. Changes in riparian-wetland areas correspond to changes in
53
overland flow and sediment being supplied. Understanding riparian-wetland areasrequires an understanding of changes in overland flows and sediment productionupslope from the areas. The riparian-wetland balance can be quantified by some ofthe methods described under item 4.
Adjustment should be evaluated for both time and spatial considerations.
Item 20: Islands and shoreline characteristics (i.e., rocks, coarse and/or large woody material) are adequate to dissipate wind and wave event energies
Purpose
Riparian-wetland areas with islands and shorelines have to be able to dissipate energyduring wind action and wave action events to function properly. These islands andshorelines need characteristics that create forces resistant to wind action and waveaction. While most lentic riparian-wetland areas require riparian-wetland vegetationalong islands and shorelines to do this, some do not. The presence of rocks and/orwoody material can dissipate energies associated with wind action and wave action,thereby providing the elements necessary for a system to function properly. Theintent of item 20 is to address those systems that do not require vegetation.
Examples
If a palustrine wetland has adequate rock or coarse and/or large woody materialalong its shoreline to dissipate energies from wind action and wave action, theanswer to item 20 would be “yes.” If a riparian-wetland area does not have ade-quate rock material, etc., the answer to item 20 would be “no.”
If a palustrine wetland requires riparian-wetland vegetation versus rock material,etc., along its shoreline to dissipate energy from wind and wave action, then item 20is answered “N/A.” The Nevada palustrine wetland (Appendix C) provides anexample of when item 20 would be answered “N/A.”
Riparian-wetland areas that require vegetation on islands and shorelines to dissipateenergy are addressed in item 13. However, there will be systems that have both,such as a high mountain lake where one side is a talus slope and the other side is anextensive wet meadow. If this is the case, both items 13 and 20 have to beaddressed. It is important to remember that each riparian wetland area is ratedaccording to its capability and potential.
Supporting Science/Quantitative Methodologies
Rocks on or near the surface of shorelines reduce the impact of waves. The amountof rock along islands and shorelines needed to dissipate wind and wave event ener-gies depends on: 1) amount, kind, and size of rock on-site; 2) size and depth ofwater sources; 3) frequency, timing, direction, and duration of event energies;

54
4) slope of the shoreline; 5) use of the area; 6) adjacent topography; and 7) length offetch. On shorelines lacking wave action, unprotected soil could be stable (Wingate1999).
Loss of shorelines affect lentic areas by: 1) lowering water quality, 2) reducing thecapacity to hold water, and 3) altering the plant community.The impact of wind and wave event energies can be determined by: 1) comparingchanges in the riparian-wetland areas over several years using aerial photos(Prichard et al. 1996), 2) establishing photo points, 3) surveying distances from areference point to the edge of water, 4) measuring the sedimentation rates of thelentic system, and 5) setting markers at the edge of water and comparing changesover time.
55
VI. Summary
The BLM and the FS, working with the NRCS, have initiated an effort to restore andmanage riparian-wetland areas in 11 Western States. To be effective, these agencieshave established common terms and definitions, as well as a method for evaluatingthe condition of these areas, which has been extensively reviewed and tested. Thismethod is the proper functioning condition assessment (see TR 1737-9, TR 1737-11,and TR 1737-15).
The method for assessing PFC is a qualitative, yet science-based process that con-siders both abiotic and biotic factors as they relate to physical function. It facilitatescommunication about the condition of a riparian-wetland area and focuses attentionon the physical process before considering values. A standard checklist ensures con-sistency in evaluating the condition of lentic riparian-wetland areas.
The PFC method is straightforward: review existing documents, analyze the PFCdefinition, and assess functionality using the checklist. The assessment requires theuse of an ID team. To assess the condition of a riparian-wetland area, an ID teamhas to understand its capability and potential and identify its attributes andprocesses. If an ID team does not spend the time to develop this understanding,their judgement about PFC will be incomplete and may be incorrect.
Riparian-wetland areas are rated in four categories: proper functioning condition,functional—at risk, nonfunctional, and unknown. The condition of some riparian-wetland areas will be relatively easy to discern, while the condition of others will beless evident. Occasionally, items on the checklist will have to be quantified to deter-mine how they should be answered. There are numerous ways these items can bequantified, including those summarized in this document.
For areas that are functional—at risk, trend should be identified, as it is a key con-sideration in interpreting data. At-risk areas with a downward trend are often thehighest management priority because a decline in resource values is apparent. Yetthese areas often retain much of the resiliency associated with a functioning area.There is usually an opportunity to reverse this trend through changes in manage-ment. At-risk areas with an upward trend are often a priority for monitoring efforts.These areas should be monitored to ensure that they continue to improve.
Conversely, trend is not determined for areas that are nonfunctional. While theseareas could theoretically still be in decline, most of the riparian values have alreadybeen lost. The presence of sufficient riparian-wetland attributes and processes towarrant a determination of trend usually results in a rating of functional—at risk.
Once proper functioning condition is reached, trend relates to specific objectives. Itis common for an area in PFC to continue to have an upward trend toward otherdesired conditions. Many sites that are properly functioning must continue toimprove to meet site-specific objectives. However, a downward trend may put thearea at-risk.
56
The lack of specific information will place some riparian-wetland areas into the cat-egory of unknown. It is imperative that areas for which no data exists be evaluatedand added to the database. As information is acquired and resource values are iden-tified, best management practices need to be implemented. Successful managementstrategies have to address the entire watershed, as upland and riparian-wetland areasare interrelated and cannot be considered separately.
To manage riparian-wetland areas successfully requires a state of resiliency thatallows an area to hold together during frequent wind action, wave action, and over-land flow events. When a riparian-wetland area’s physical aspects are in workingorder, then characteristics are maintained that sustain the area’s ability to produceresource values. Function comes first, then values (desired condition).
Managing riparian-wetland areas does not cease once PFC is achieved—it has juststarted. Existing and potential resource values and the plant communities necessaryto support these values have to be identified. Once these values have been identi-fied, specific objectives can be derived to ascertain desired condition. Managementactions to achieve desired condition can then be designed and implemented.
57
Appendix A:Riparian-Wetland Lentic Checklist


59
General Instructions
1) This checklist constitutes the Minimum National Standards required todetermine proper functioning condition of lentic riparian-wetland areas.
2) As a minimum, an ID team will use this checklist to determine the degree offunction of a riparian-wetland area.
3) An ID team must review existing documents, particularly those referencedin this document, so that the team has an understanding of the concepts ofthe riparian-wetland area they are assessing.
4) An ID team must determine the attributes and processes important to theriparian wetland area that is being assessed.
5) Mark one box for each element. Elements are numbered for the purpose ofcataloging comments. The numbers do not declare importance.
6) For any item marked “No,” the severity of the condition must be explained inthe “Remarks” section and must be a subject for discussion with the IDteam in determining riparian-wetland functionality. Using the “Remarks”section to also explain items marked “Yes” is encouraged but not required.
7) Based on the ID team's discussion, “functional rating” will be resolved andthe checklist's summary section will be completed.
8) Establish photo points where possible to document the area being assessed.

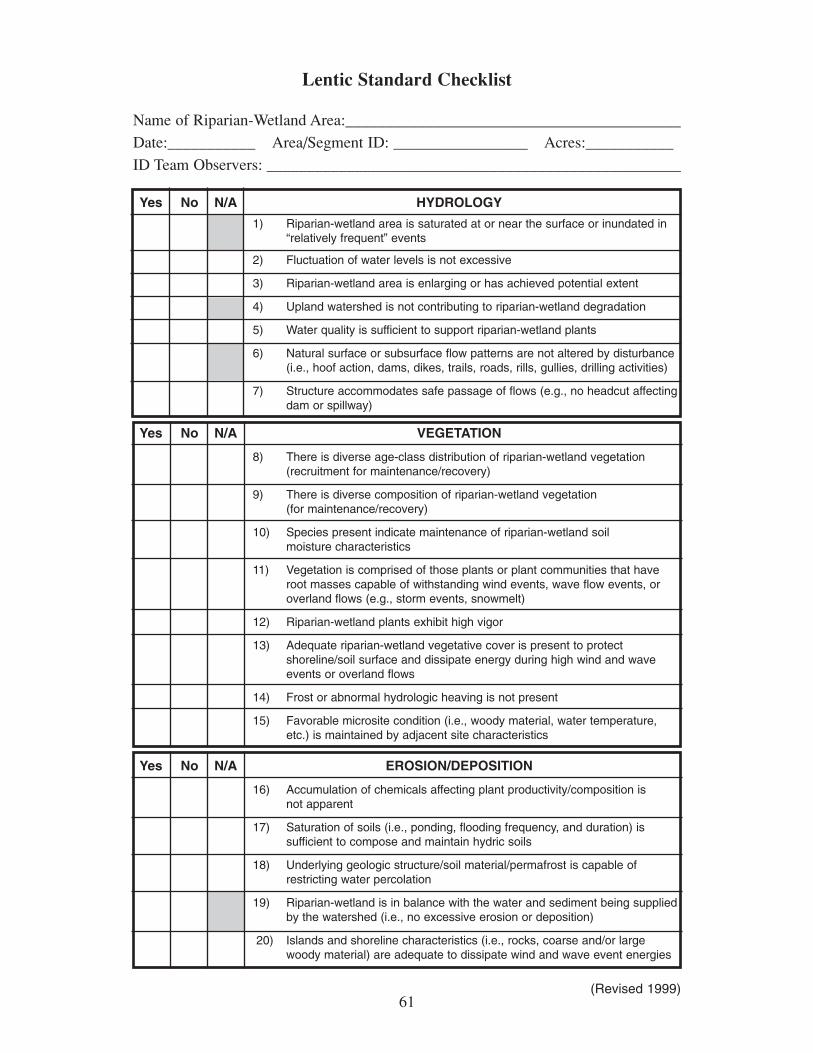
Lentic Standard Checklist
Name of Riparian-Wetland Area:__________________________________________
Date:___________ Area/Segment ID: _________________ Acres:___________
ID Team Observers: ____________________________________________________
Yes No N/A HYDROLOGY
1) Riparian-wetland area is saturated at or near the surface or inundated in “relatively frequent” events
2) Fluctuation of water levels is not excessive
3) Riparian-wetland area is enlarging or has achieved potential extent
4) Upland watershed is not contributing to riparian-wetland degradation
5) Water quality is sufficient to support riparian-wetland plants
6) Natural surface or subsurface flow patterns are not altered by disturbance (i.e., hoof action, dams, dikes, trails, roads, rills, gullies, drilling activities)
7) Structure accommodates safe passage of flows (e.g., no headcut affecting dam or spillway)
Yes No N/A VEGETATION
8) There is diverse age-class distribution of riparian-wetland vegetation (recruitment for maintenance/recovery)
9) There is diverse composition of riparian-wetland vegetation(for maintenance/recovery)
10) Species present indicate maintenance of riparian-wetland soil moisture characteristics
11) Vegetation is comprised of those plants or plant communities that have root masses capable of withstanding wind events, wave flow events, or overland flows (e.g., storm events, snowmelt)
12) Riparian-wetland plants exhibit high vigor
13) Adequate riparian-wetland vegetative cover is present to protect shoreline/soil surface and dissipate energy during high wind and wave events or overland flows
14) Frost or abnormal hydrologic heaving is not present
15) Favorable microsite condition (i.e., woody material, water temperature, etc.) is maintained by adjacent site characteristics
Yes No N/A EROSION/DEPOSITION
16) Accumulation of chemicals affecting plant productivity/composition is not apparent
17) Saturation of soils (i.e., ponding, flooding frequency, and duration) is sufficient to compose and maintain hydric soils
18) Underlying geologic structure/soil material/permafrost is capable ofrestricting water percolation
19) Riparian-wetland is in balance with the water and sediment being suppliedby the watershed (i.e., no excessive erosion or deposition)
20) Islands and shoreline characteristics (i.e., rocks, coarse and/or largewoody material) are adequate to dissipate wind and wave event energies
(Revised 1999)61

62
Remarks
________________________________________________________________________________________________________________________________________________________________________________________________________________________________________________________________________________________________________________________________________________________________________________________________________________________________________________________________________________________________________________________________________________________________________________________________________________________________________________________________________________________________________________________________________________________________________________________________________________________________________________________________________________________________________________________________________________________________________________________________________________________________________________________________________________________________________________________________________________________________________________________________________________________________________________________________________________________________________________________________________________________________________________________________________________________________________________________________________________________________________________________________________
Summary Determination
Functional Rating:
Proper Functioning Condition ________Functional—At Risk ________
Nonfunctional ________Unknown ________
Trend for Functional—At Risk:
Upward _____Downward _____
Not Apparent _____
Are factors contributing to unacceptable conditions outside the controlof the manager?
Yes ___No ___
If yes, what are those factors?___ Dewatering ___ Mining activities ___ Watershed condition___ Dredging activities ___ Road encroachment ___ Land ownership___ Other (specify)____________________________________

63
Appendix B:Potential and Capability Examples


65
The following examples show how to fill out the checklist and determine func-tioning condition for a variety of scenarios, and explain how to consider and applypotential and capability:
Example 1: Assessing functionality of a problem wetland.
Example 2: Assessing functionality of a natural lake that is limited by the presence of a pumping station.
Example 3: Assessing functionality of a system that is not at potential.


67
Example 1. Assessing functionality of a problem wetland: This area is a playa wetland, adepressional area that has wetland indicators (i.e., hydrology, soil, vegetation) during wetterportions of its growing season, but normally lacks these indicators during the drier portionof the growing season. In addition, some playa wetlands lack field indicators of hydric soil.OBL and FACW plants are present during the wet season while FACU and UPL plants arepresent during the dry season. The soils underlying this playa are intact and are capable ofrestricting water percolation. The watershed for this playa wetland is intact.
Figure B1. Cocklebur Lakes, New Mexico.
Cla
y Br
idge
s
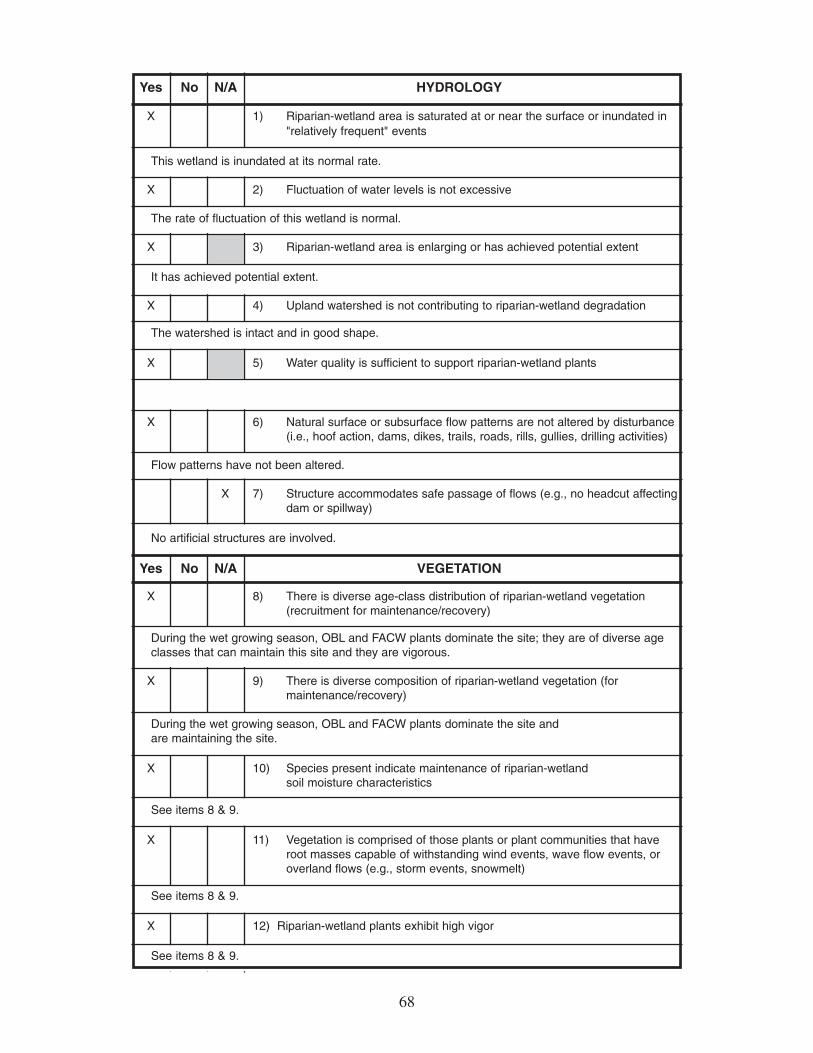
68
Yes No N/A HYDROLOGY
X 1) Riparian-wetland area is saturated at or near the surface or inundated in "relatively frequent" events
This wetland is inundated at its normal rate.
X 2) Fluctuation of water levels is not excessive
The rate of fluctuation of this wetland is normal.
X 3) Riparian-wetland area is enlarging or has achieved potential extent
It has achieved potential extent.
X 4) Upland watershed is not contributing to riparian-wetland degradation
The watershed is intact and in good shape.
X 5) Water quality is sufficient to support riparian-wetland plants
X 6) Natural surface or subsurface flow patterns are not altered by disturbance (i.e., hoof action, dams, dikes, trails, roads, rills, gullies, drilling activities)
Flow patterns have not been altered.
X 7) Structure accommodates safe passage of flows (e.g., no headcut affecting dam or spillway)
No artificial structures are involved.
Yes No N/A VEGETATION
X 8) There is diverse age-class distribution of riparian-wetland vegetation (recruitment for maintenance/recovery)
During the wet growing season, OBL and FACW plants dominate the site; they are of diverse age classes that can maintain this site and they are vigorous.
X 9) There is diverse composition of riparian-wetland vegetation (for maintenance/recovery)
During the wet growing season, OBL and FACW plants dominate the site andare maintaining the site.
X 10) Species present indicate maintenance of riparian-wetland soil moisture characteristics
See items 8 & 9.
X 11) Vegetation is comprised of those plants or plant communities that haveroot masses capable of withstanding wind events, wave flow events, or overland flows (e.g., storm events, snowmelt)
See items 8 & 9.
X 12) Riparian-wetland plants exhibit high vigor
See items 8 & 9.
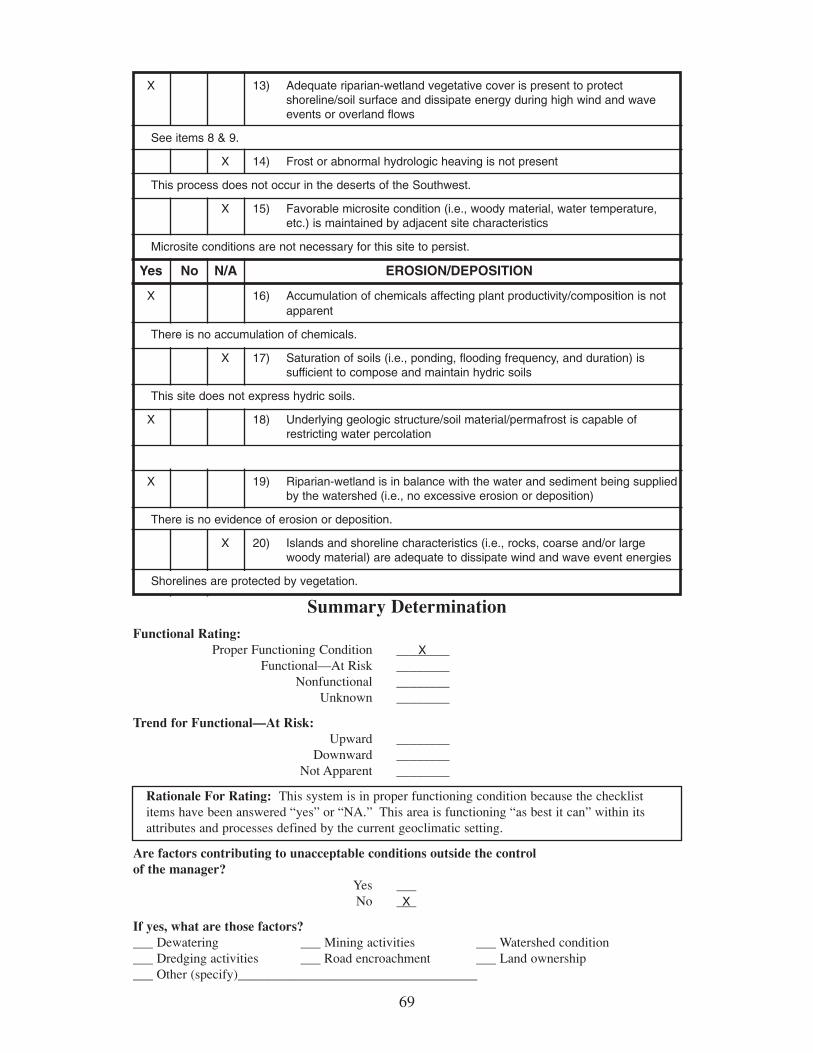
69
X 13) Adequate riparian-wetland vegetative cover is present to protect shoreline/soil surface and dissipate energy during high wind and wave events or overland flows
See items 8 & 9.
X 14) Frost or abnormal hydrologic heaving is not present
This process does not occur in the deserts of the Southwest.
X 15) Favorable microsite condition (i.e., woody material, water temperature, etc.) is maintained by adjacent site characteristics
Microsite conditions are not necessary for this site to persist.
Yes No N/A EROSION/DEPOSITION
X 16) Accumulation of chemicals affecting plant productivity/composition is not apparent
There is no accumulation of chemicals.
X 17) Saturation of soils (i.e., ponding, flooding frequency, and duration) issufficient to compose and maintain hydric soils
This site does not express hydric soils.
X 18) Underlying geologic structure/soil material/permafrost is capable of restricting water percolation
X 19) Riparian-wetland is in balance with the water and sediment being supplied by the watershed (i.e., no excessive erosion or deposition)
There is no evidence of erosion or deposition.
X 20) Islands and shoreline characteristics (i.e., rocks, coarse and/or largewoody material) are adequate to dissipate wind and wave event energies
Shorelines are protected by vegetation.
Summary DeterminationFunctional Rating:
Proper Functioning Condition ________Functional—At Risk ________
Nonfunctional ________Unknown ________
Trend for Functional—At Risk:Upward ________
Downward ________Not Apparent ________
Rationale For Rating: This system is in proper functioning condition because the checklistitems have been answered “yes” or “NA.” This area is functioning “as best it can” within itsattributes and processes defined by the current geoclimatic setting.
Are factors contributing to unacceptable conditions outside the controlof the manager?
Yes ___No ___
If yes, what are those factors?___ Dewatering ___ Mining activities ___ Watershed condition___ Dredging activities ___ Road encroachment ___ Land ownership___ Other (specify)____________________________________
X
X
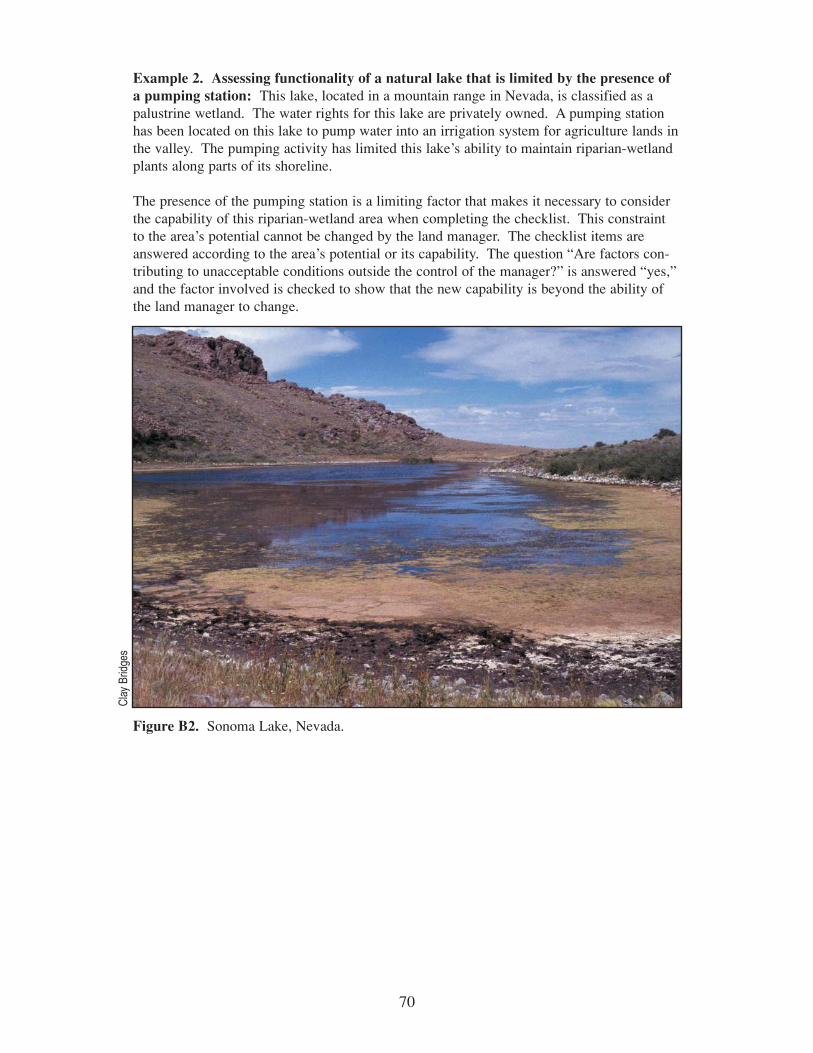
70
Example 2. Assessing functionality of a natural lake that is limited by the presence ofa pumping station: This lake, located in a mountain range in Nevada, is classified as apalustrine wetland. The water rights for this lake are privately owned. A pumping stationhas been located on this lake to pump water into an irrigation system for agriculture lands inthe valley. The pumping activity has limited this lake’s ability to maintain riparian-wetlandplants along parts of its shoreline.
The presence of the pumping station is a limiting factor that makes it necessary to considerthe capability of this riparian-wetland area when completing the checklist. This constraintto the area’s potential cannot be changed by the land manager. The checklist items areanswered according to the area’s potential or its capability. The question “Are factors con-tributing to unacceptable conditions outside the control of the manager?” is answered “yes,”and the factor involved is checked to show that the new capability is beyond the ability ofthe land manager to change.
Figure B2. Sonoma Lake, Nevada.
Cla
y Br
idge
s
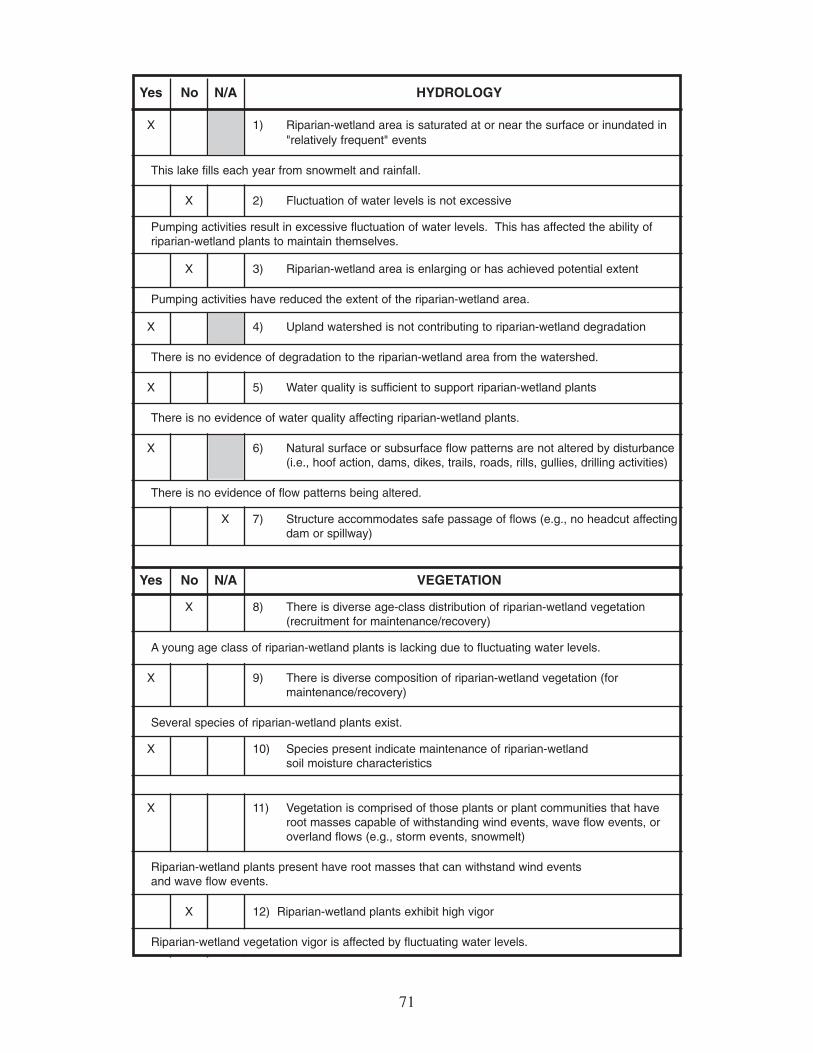
71
Yes No N/A HYDROLOGY
X 1) Riparian-wetland area is saturated at or near the surface or inundated in"relatively frequent" events
This lake fills each year from snowmelt and rainfall.
X 2) Fluctuation of water levels is not excessive
Pumping activities result in excessive fluctuation of water levels. This has affected the ability of riparian-wetland plants to maintain themselves.
X 3) Riparian-wetland area is enlarging or has achieved potential extent
Pumping activities have reduced the extent of the riparian-wetland area.
X 4) Upland watershed is not contributing to riparian-wetland degradation
There is no evidence of degradation to the riparian-wetland area from the watershed.
X 5) Water quality is sufficient to support riparian-wetland plants
There is no evidence of water quality affecting riparian-wetland plants.
X 6) Natural surface or subsurface flow patterns are not altered by disturbance (i.e., hoof action, dams, dikes, trails, roads, rills, gullies, drilling activities)
There is no evidence of flow patterns being altered.
X 7) Structure accommodates safe passage of flows (e.g., no headcut affecting dam or spillway)
Yes No N/A VEGETATION
X 8) There is diverse age-class distribution of riparian-wetland vegetation (recruitment for maintenance/recovery)
A young age class of riparian-wetland plants is lacking due to fluctuating water levels.
X 9) There is diverse composition of riparian-wetland vegetation (for maintenance/recovery)
Several species of riparian-wetland plants exist.
X 10) Species present indicate maintenance of riparian-wetland soil moisture characteristics
X 11) Vegetation is comprised of those plants or plant communities that haveroot masses capable of withstanding wind events, wave flow events, or overland flows (e.g., storm events, snowmelt)
Riparian-wetland plants present have root masses that can withstand wind eventsand wave flow events.
X 12) Riparian-wetland plants exhibit high vigor
Riparian-wetland vegetation vigor is affected by fluctuating water levels.
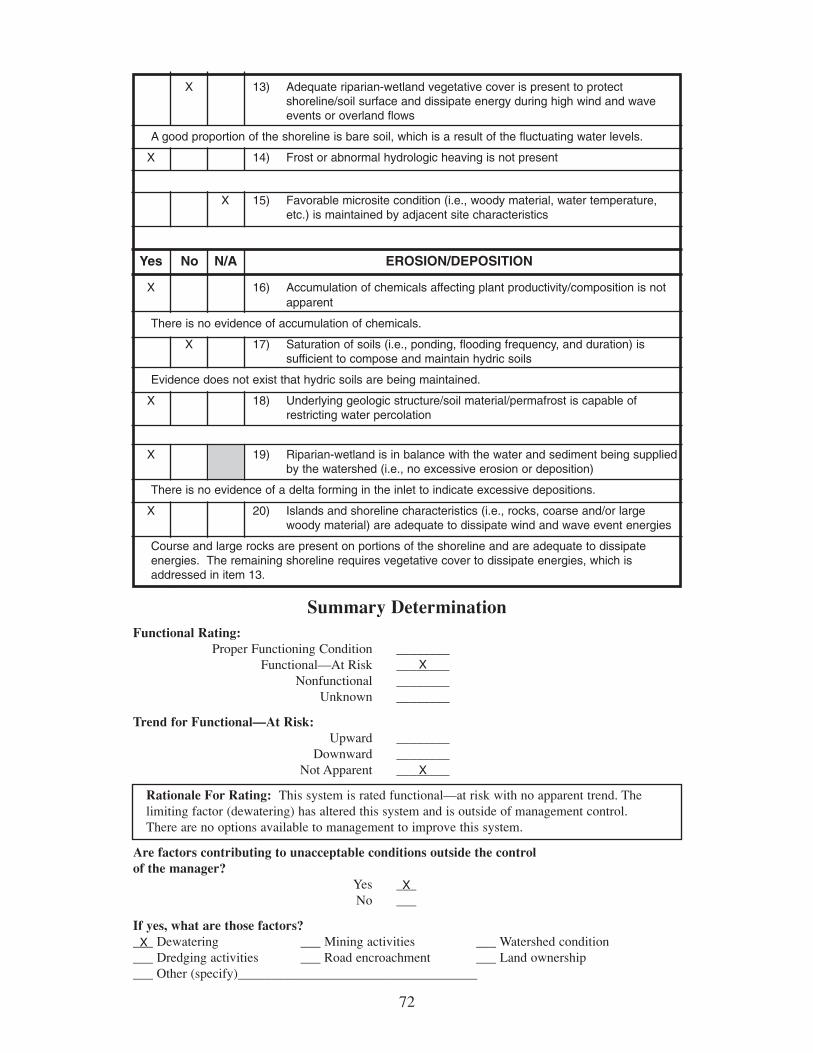
72
X 13) Adequate riparian-wetland vegetative cover is present to protect shoreline/soil surface and dissipate energy during high wind and wave events or overland flows
A good proportion of the shoreline is bare soil, which is a result of the fluctuating water levels.
X 14) Frost or abnormal hydrologic heaving is not present
X 15) Favorable microsite condition (i.e., woody material, water temperature, etc.) is maintained by adjacent site characteristics
Yes No N/A EROSION/DEPOSITION
X 16) Accumulation of chemicals affecting plant productivity/composition is not apparent
There is no evidence of accumulation of chemicals.
X 17) Saturation of soils (i.e., ponding, flooding frequency, and duration) issufficient to compose and maintain hydric soils
Evidence does not exist that hydric soils are being maintained.
X 18) Underlying geologic structure/soil material/permafrost is capable of restricting water percolation
X 19) Riparian-wetland is in balance with the water and sediment being supplied by the watershed (i.e., no excessive erosion or deposition)
There is no evidence of a delta forming in the inlet to indicate excessive depositions.
X 20) Islands and shoreline characteristics (i.e., rocks, coarse and/or largewoody material) are adequate to dissipate wind and wave event energies
Course and large rocks are present on portions of the shoreline and are adequate to dissipate energies. The remaining shoreline requires vegetative cover to dissipate energies, which is addressed in item 13.
Summary DeterminationFunctional Rating:
Proper Functioning Condition ________Functional—At Risk ________
Nonfunctional ________Unknown ________
Trend for Functional—At Risk:Upward ________
Downward ________Not Apparent ________
Rationale For Rating: This system is rated functional—at risk with no apparent trend. The limiting factor (dewatering) has altered this system and is outside of management control. There are no options available to management to improve this system.
Are factors contributing to unacceptable conditions outside the controlof the manager?
Yes ___No ___
If yes, what are those factors?___ Dewatering ___ Mining activities ___ Watershed condition___ Dredging activities ___ Road encroachment ___ Land ownership___ Other (specify)____________________________________
X
X
X
X

73
Example 3. Assessing functionality of a system that is not at potential: The hydrologyof this riparian-wetland area is intact but there is no riparian-wetland development. Currentmanagement is preventing riparian-wetland vegetation from developing. There is no protec-tion to the area from erosion and deposition. As a result, the riparian-wetland area’s extenthas been greatly reduced.
Figure B3. Coyote Hole, Nevada.
Cla
y Br
idge
s
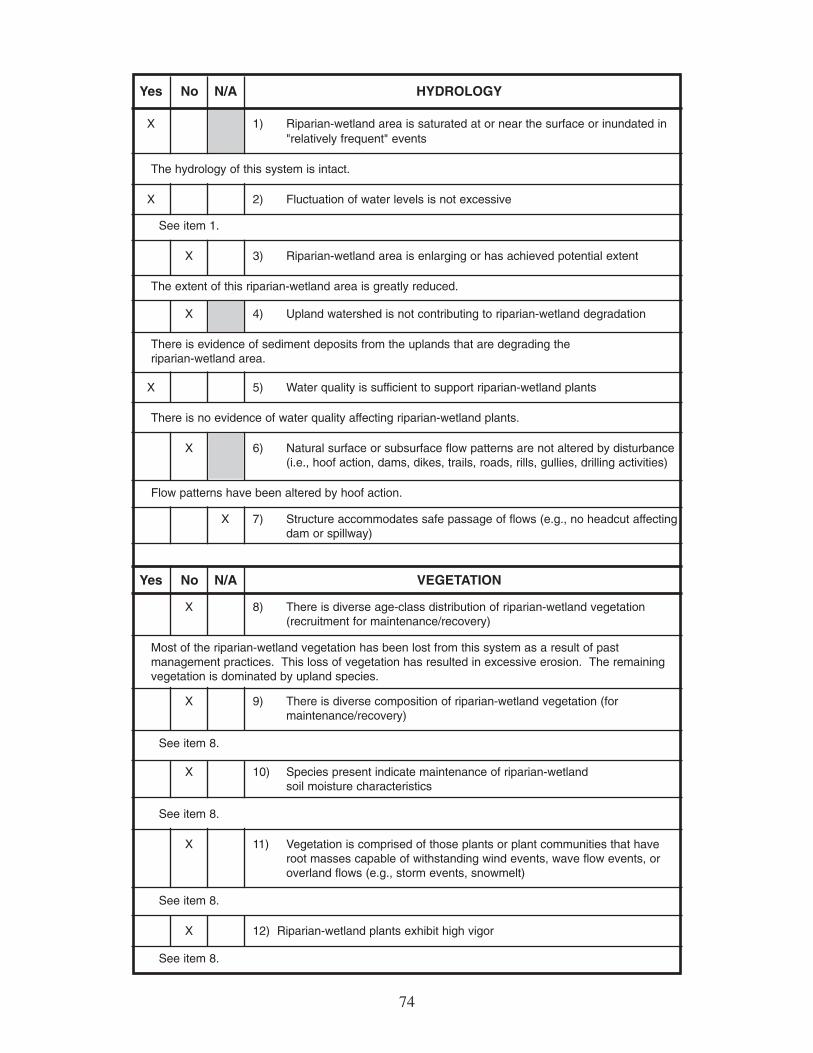
74
Yes No N/A HYDROLOGY
X 1) Riparian-wetland area is saturated at or near the surface or inundated in"relatively frequent" events
The hydrology of this system is intact.
X 2) Fluctuation of water levels is not excessive
See item 1.
X 3) Riparian-wetland area is enlarging or has achieved potential extent
The extent of this riparian-wetland area is greatly reduced.
X 4) Upland watershed is not contributing to riparian-wetland degradation
There is evidence of sediment deposits from the uplands that are degrading the riparian-wetland area.
X 5) Water quality is sufficient to support riparian-wetland plants
There is no evidence of water quality affecting riparian-wetland plants.
X 6) Natural surface or subsurface flow patterns are not altered by disturbance (i.e., hoof action, dams, dikes, trails, roads, rills, gullies, drilling activities)
Flow patterns have been altered by hoof action.
X 7) Structure accommodates safe passage of flows (e.g., no headcut affecting dam or spillway)
Yes No N/A VEGETATION
X 8) There is diverse age-class distribution of riparian-wetland vegetation (recruitment for maintenance/recovery)
Most of the riparian-wetland vegetation has been lost from this system as a result of past management practices. This loss of vegetation has resulted in excessive erosion. The remaining vegetation is dominated by upland species.
X 9) There is diverse composition of riparian-wetland vegetation (for maintenance/recovery)
See item 8.
X 10) Species present indicate maintenance of riparian-wetland soil moisture characteristics
See item 8.
X 11) Vegetation is comprised of those plants or plant communities that haveroot masses capable of withstanding wind events, wave flow events, or overland flows (e.g., storm events, snowmelt)
See item 8.
X 12) Riparian-wetland plants exhibit high vigor
See item 8.

75
X 13) Adequate riparian-wetland vegetative cover is present to protect shoreline/soil surface and dissipate energy during high wind and wave events or overland flows
See item 8.
X 14) Frost or abnormal hydrologic heaving is not present
X 15) Favorable microsite condition (i.e., woody material, water temperature, etc.) is maintained by adjacent site characteristics
Yes No N/A EROSION/DEPOSITION
X 16) Accumulation of chemicals affecting plant productivity/composition is not apparent
There is no evidence of accumulation of chemicals that might affect plant productivity.
X 17) Saturation of soils (i.e., ponding, flooding frequency, and duration) issufficient to compose and maintain hydric soils
X 18) Underlying geologic structure/soil material/permafrost is capable of restricting water percolation
X 19) Riparian-wetland is in balance with the water and sediment being supplied by the watershed (i.e., no excessive erosion or deposition)
There is evidence of excessive erosion.
X 20) Islands and shoreline characteristics (i.e., rocks, coarse and/or largewoody material) are adequate to dissipate wind and wave event energies
Summary DeterminationFunctional Rating:
Proper Functioning Condition ________Functional—At Risk ________
Nonfunctional ________Unknown ________
Trend for Functional—At Risk:Upward ________
Downward ________Not Apparent ________
Rationale For Rating: This riparian-wetland area is rated nonfunctional because it clearly is not providing adequate vegetation to dissipate energies associated with flows and thus is notallowing any wetland development.
Are factors contributing to unacceptable conditions outside the controlof the manager?
Yes ___No ___
If yes, what are those factors?___ Dewatering ___ Mining activities ___ Watershed condition___ Dredging activities ___ Road encroachment ___ Land ownership___ Other (specify)____________________________________
X
X

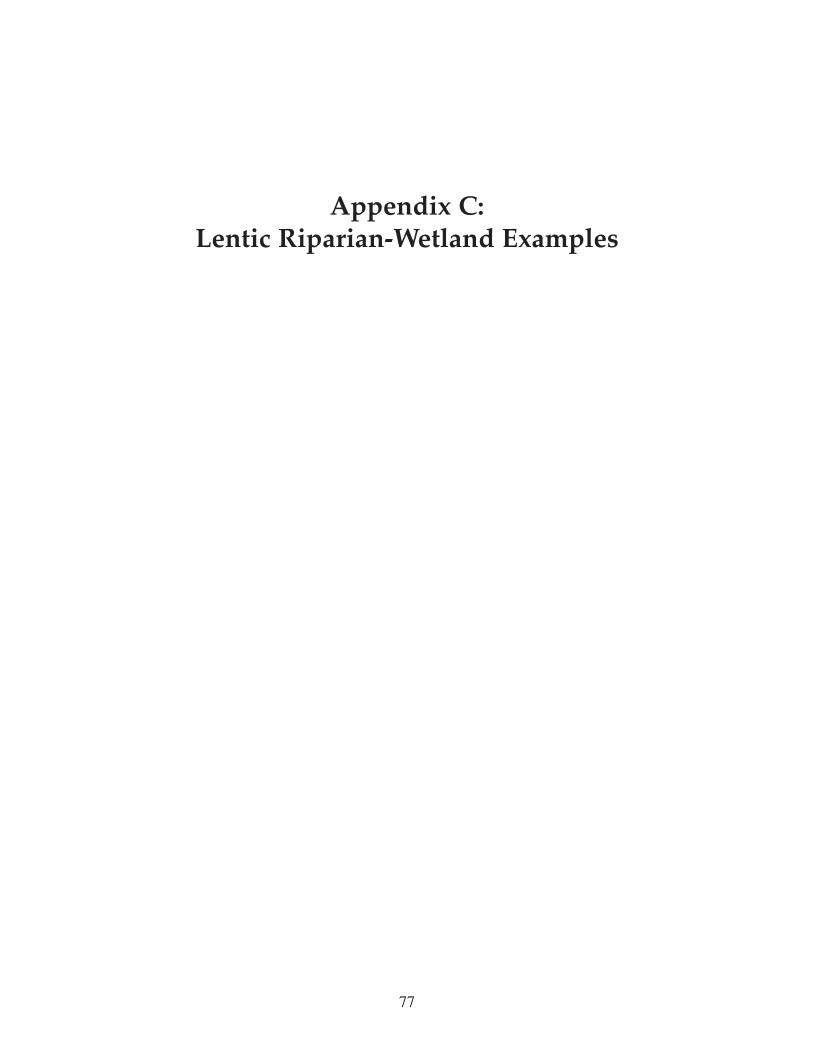
77
Appendix C:Lentic Riparian-Wetland Examples

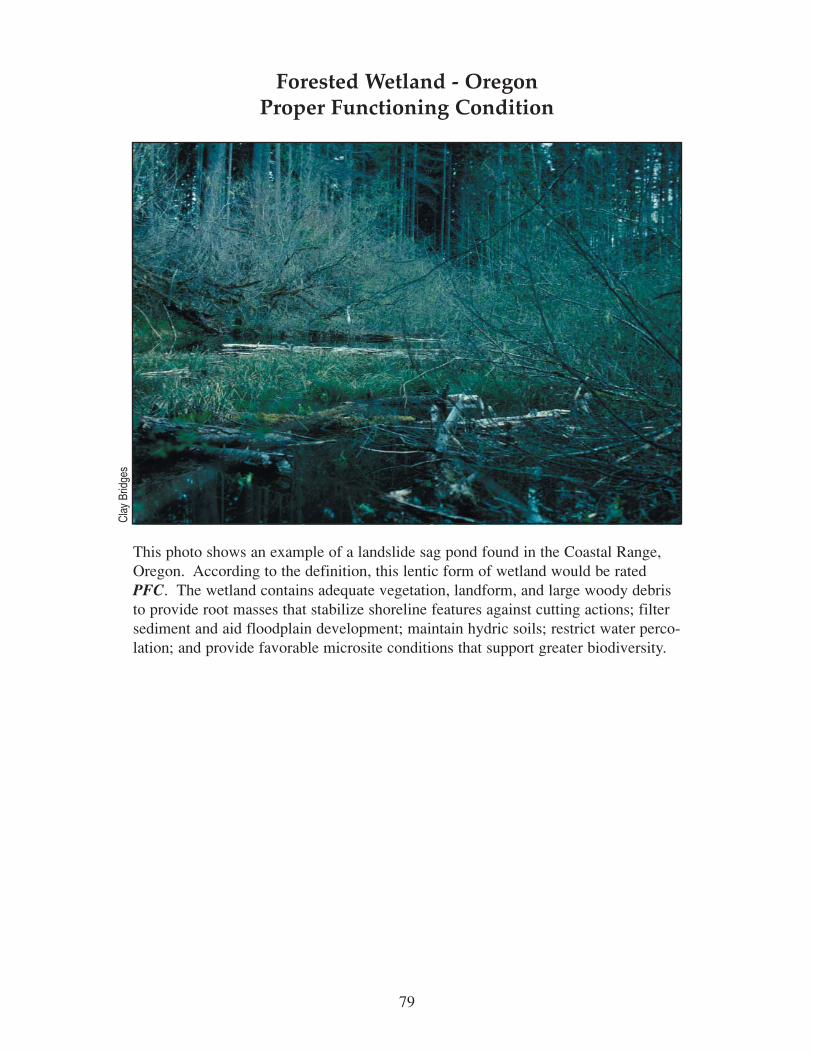
79
Forested Wetland - OregonProper Functioning Condition
This photo shows an example of a landslide sag pond found in the Coastal Range,Oregon. According to the definition, this lentic form of wetland would be ratedPFC. The wetland contains adequate vegetation, landform, and large woody debristo provide root masses that stabilize shoreline features against cutting actions; filtersediment and aid floodplain development; maintain hydric soils; restrict water perco-lation; and provide favorable microsite conditions that support greater biodiversity.
Cla
y Br
idge
s
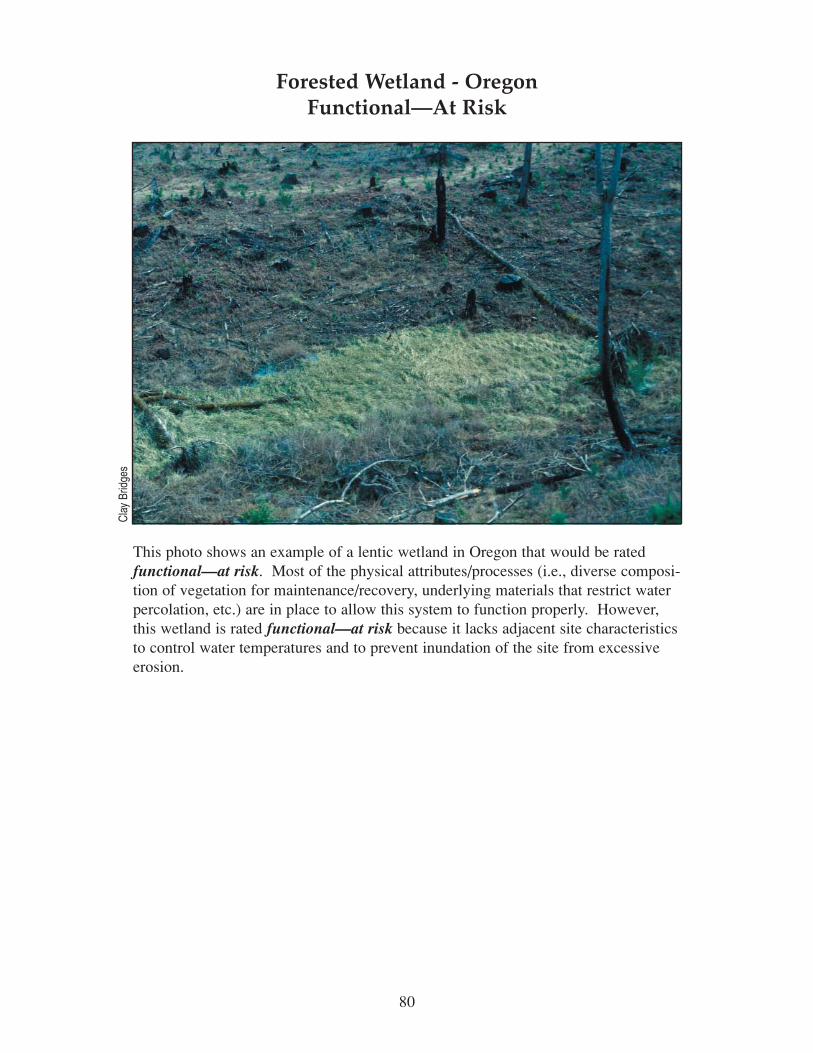
80
Forested Wetland - OregonFunctional—At Risk
This photo shows an example of a lentic wetland in Oregon that would be ratedfunctional—at risk. Most of the physical attributes/processes (i.e., diverse composi-tion of vegetation for maintenance/recovery, underlying materials that restrict waterpercolation, etc.) are in place to allow this system to function properly. However,this wetland is rated functional—at risk because it lacks adjacent site characteristicsto control water temperatures and to prevent inundation of the site from excessiveerosion.
Cla
y Br
idge
s
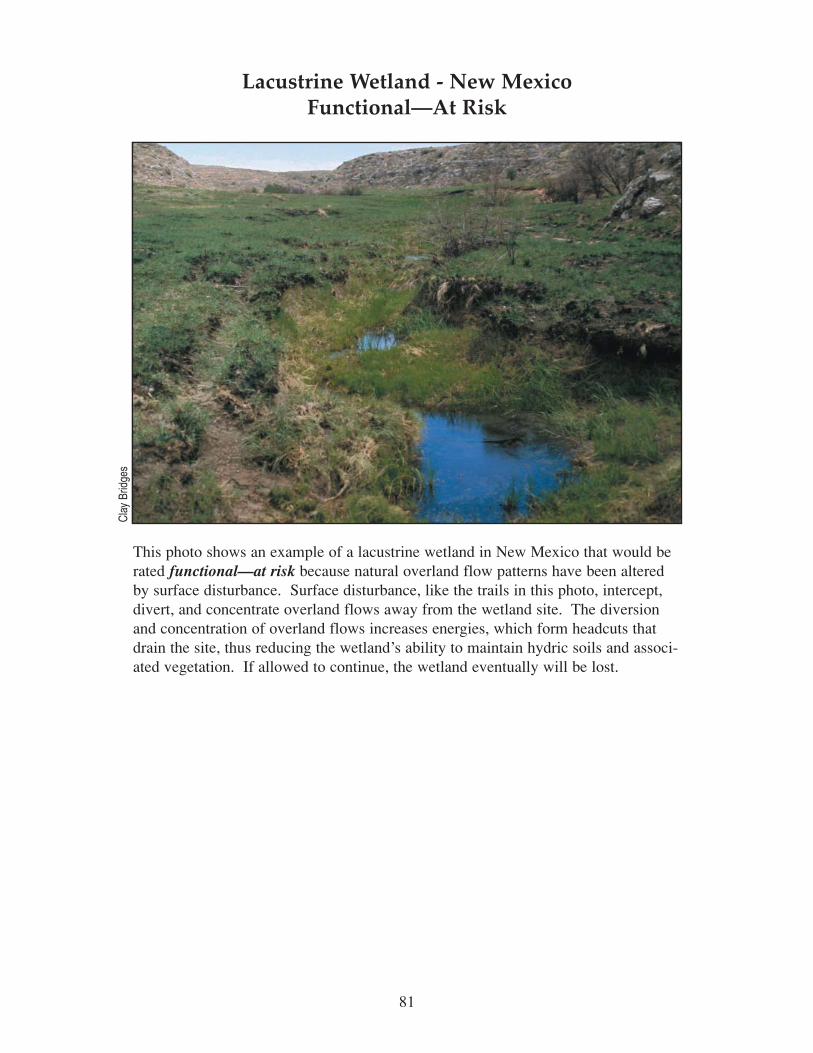
81
Lacustrine Wetland - New MexicoFunctional—At Risk
This photo shows an example of a lacustrine wetland in New Mexico that would berated functional—at risk because natural overland flow patterns have been alteredby surface disturbance. Surface disturbance, like the trails in this photo, intercept,divert, and concentrate overland flows away from the wetland site. The diversionand concentration of overland flows increases energies, which form headcuts thatdrain the site, thus reducing the wetland’s ability to maintain hydric soils and associ-ated vegetation. If allowed to continue, the wetland eventually will be lost.
Cla
y Br
idge
s
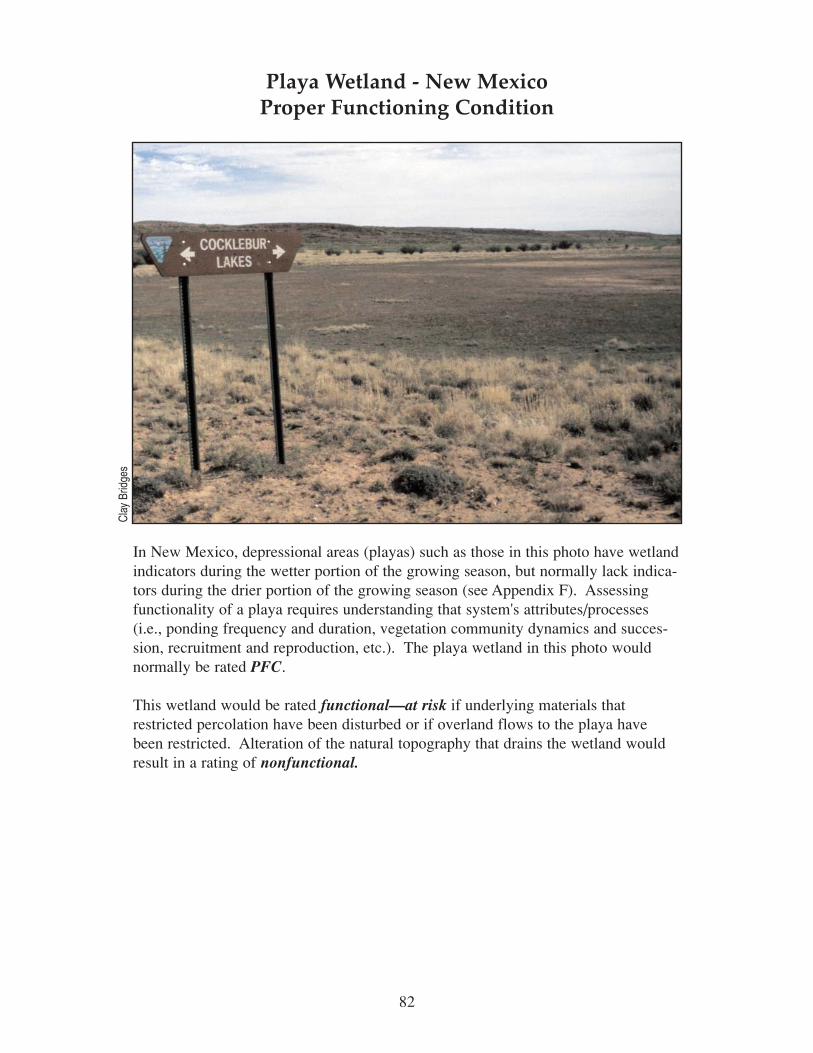
82
Playa Wetland - New MexicoProper Functioning Condition
In New Mexico, depressional areas (playas) such as those in this photo have wetlandindicators during the wetter portion of the growing season, but normally lack indica-tors during the drier portion of the growing season (see Appendix F). Assessingfunctionality of a playa requires understanding that system's attributes/processes(i.e., ponding frequency and duration, vegetation community dynamics and succes-sion, recruitment and reproduction, etc.). The playa wetland in this photo wouldnormally be rated PFC.
This wetland would be rated functional—at risk if underlying materials thatrestricted percolation have been disturbed or if overland flows to the playa havebeen restricted. Alteration of the natural topography that drains the wetland wouldresult in a rating of nonfunctional.
Cla
y Br
idge
s
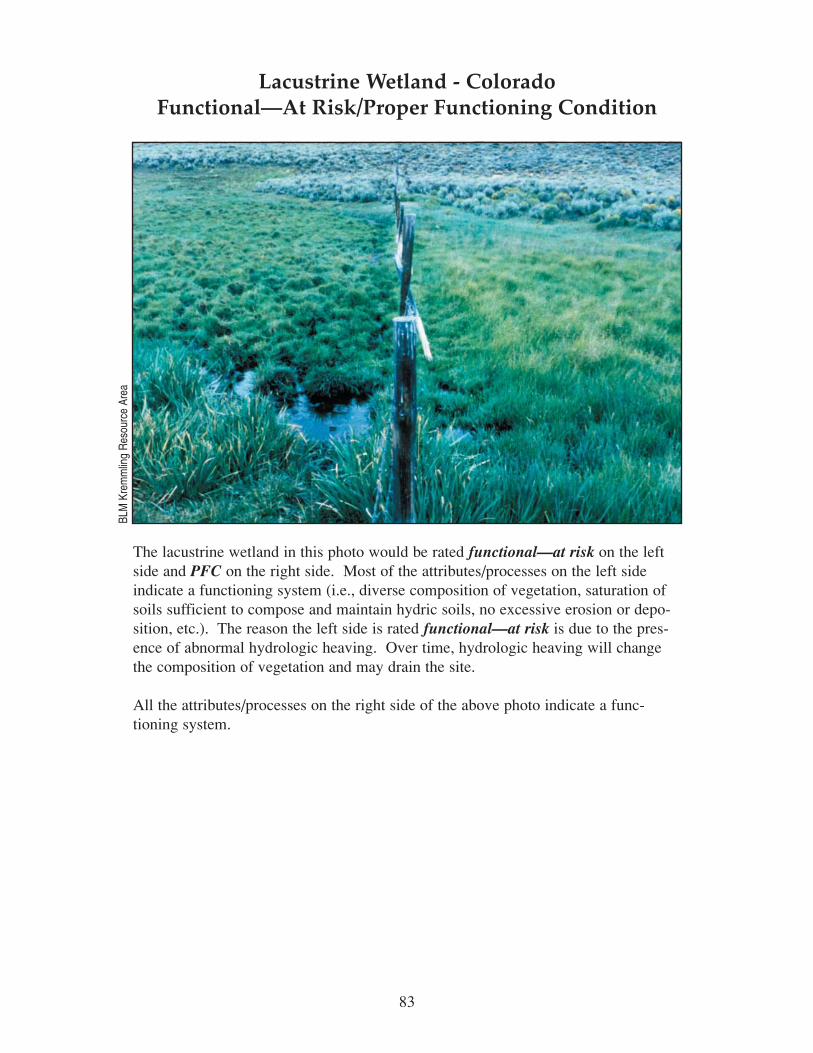
83
Lacustrine Wetland - ColoradoFunctional—At Risk/Proper Functioning Condition
The lacustrine wetland in this photo would be rated functional—at risk on the leftside and PFC on the right side. Most of the attributes/processes on the left sideindicate a functioning system (i.e., diverse composition of vegetation, saturation ofsoils sufficient to compose and maintain hydric soils, no excessive erosion or depo-sition, etc.). The reason the left side is rated functional—at risk is due to the pres-ence of abnormal hydrologic heaving. Over time, hydrologic heaving will changethe composition of vegetation and may drain the site.
All the attributes/processes on the right side of the above photo indicate a func-tioning system.
BLM
Kre
mm
ling
Res
ourc
e Ar
ea

84
Seep Wetland - NevadaNonfunctional
This photo shows an example of a seep located in Nevada that would be rated asnonfunctional relative to the definition of proper functioning condition. This wet-land clearly does not provide adequate vegetation to filter sediment and aid wetlanddevelopment, lacks adequate cover to protect the area from erosion or deposition asa result of overland flows, lacks diverse age-class distribution and composition ofvegetation to allow recovery, and does not provide wetland characteristics necessaryto support aquatic or other species. This lack of vegetation and the area’s lack ofbalance with the sediment being supplied has permitted three things to occur: 1) theextent of the wetland has been greatly reduced, 2) the wetland’s water quality hasbeen altered, and 3) the wetland’s diversity of aquatic vegetation has been greatlyreduced. The area provides little biodiversity.
Mar
k Bi
ddle
com
b
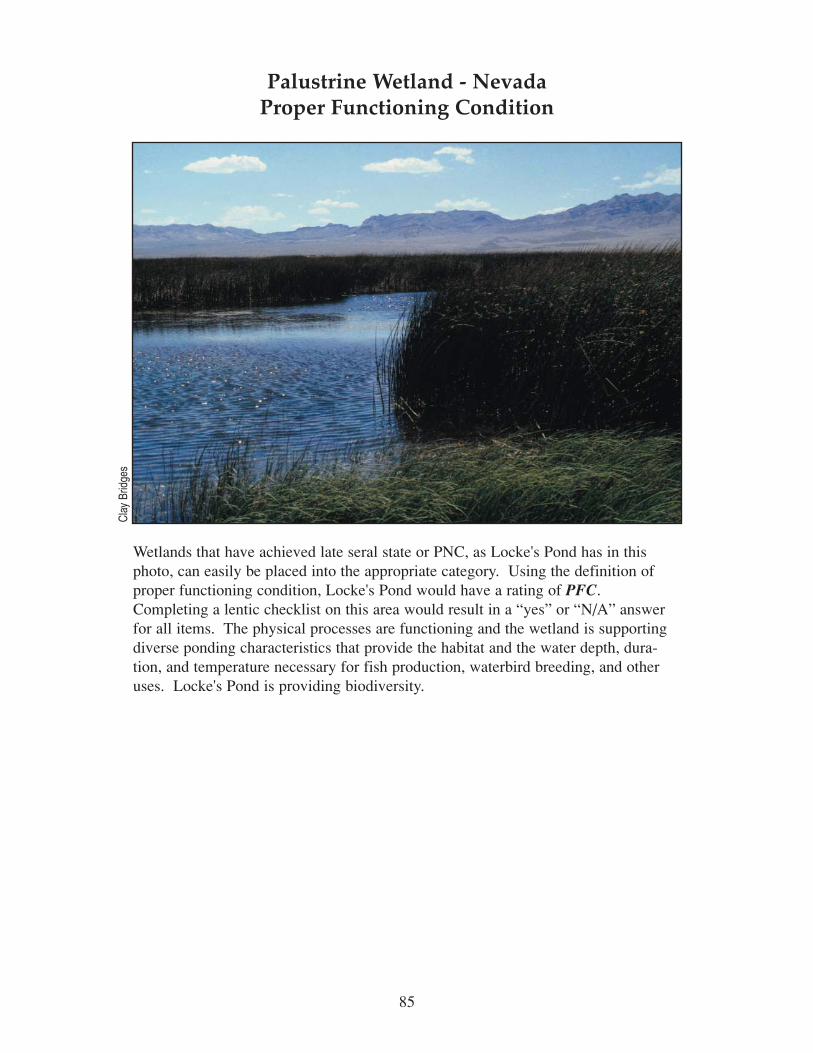
85
Palustrine Wetland - NevadaProper Functioning Condition
Wetlands that have achieved late seral state or PNC, as Locke's Pond has in thisphoto, can easily be placed into the appropriate category. Using the definition ofproper functioning condition, Locke's Pond would have a rating of PFC.Completing a lentic checklist on this area would result in a “yes” or “N/A” answerfor all items. The physical processes are functioning and the wetland is supportingdiverse ponding characteristics that provide the habitat and the water depth, dura-tion, and temperature necessary for fish production, waterbird breeding, and otheruses. Locke's Pond is providing biodiversity.
Cla
y Br
idge
s
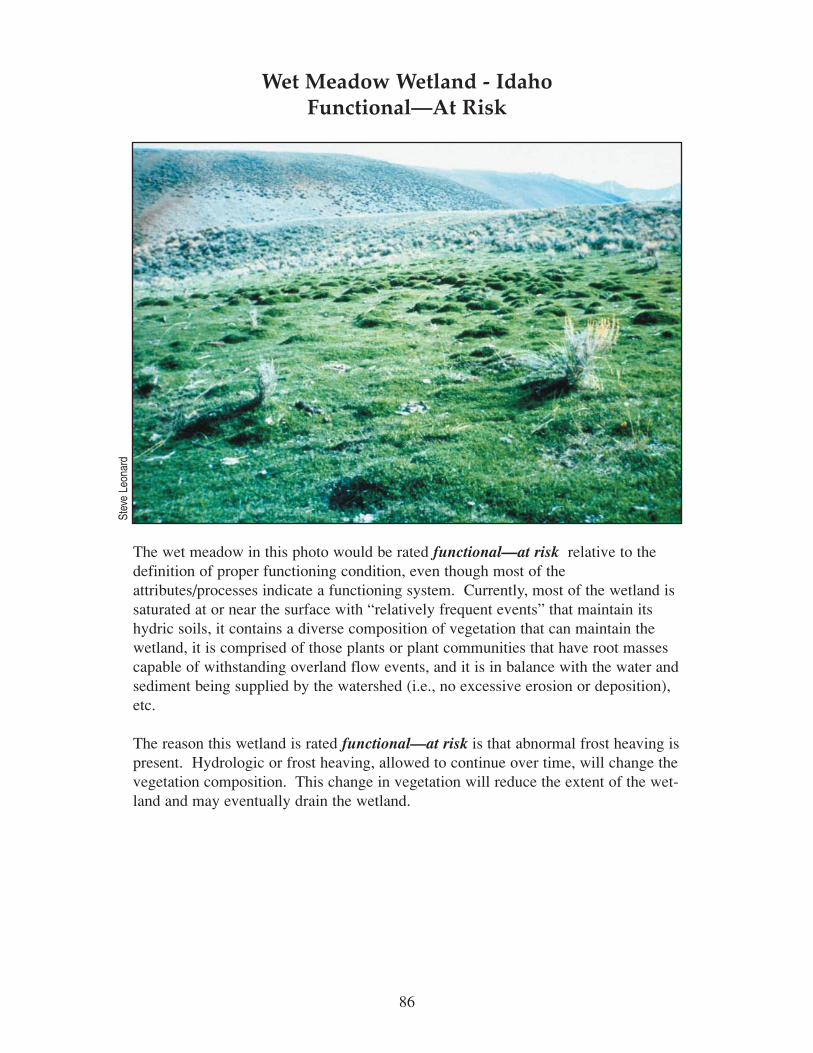
86
Wet Meadow Wetland - IdahoFunctional—At Risk
The wet meadow in this photo would be rated functional—at risk relative to thedefinition of proper functioning condition, even though most of theattributes/processes indicate a functioning system. Currently, most of the wetland issaturated at or near the surface with “relatively frequent events” that maintain itshydric soils, it contains a diverse composition of vegetation that can maintain thewetland, it is comprised of those plants or plant communities that have root massescapable of withstanding overland flow events, and it is in balance with the water andsediment being supplied by the watershed (i.e., no excessive erosion or deposition),etc.
The reason this wetland is rated functional—at risk is that abnormal frost heaving ispresent. Hydrologic or frost heaving, allowed to continue over time, will change thevegetation composition. This change in vegetation will reduce the extent of the wet-land and may eventually drain the wetland.
Stev
e Le
onar
d
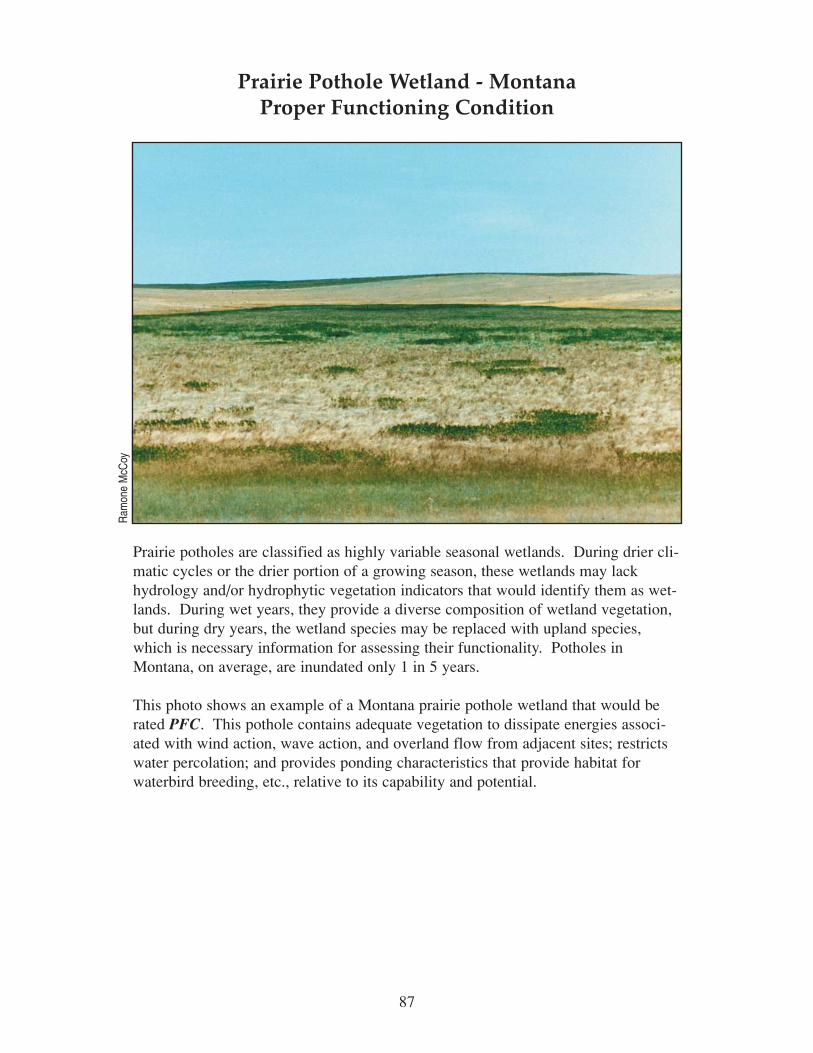
87
Prairie Pothole Wetland - MontanaProper Functioning Condition
Prairie potholes are classified as highly variable seasonal wetlands. During drier cli-matic cycles or the drier portion of a growing season, these wetlands may lackhydrology and/or hydrophytic vegetation indicators that would identify them as wet-lands. During wet years, they provide a diverse composition of wetland vegetation,but during dry years, the wetland species may be replaced with upland species,which is necessary information for assessing their functionality. Potholes inMontana, on average, are inundated only 1 in 5 years.
This photo shows an example of a Montana prairie pothole wetland that would berated PFC. This pothole contains adequate vegetation to dissipate energies associ-ated with wind action, wave action, and overland flow from adjacent sites; restrictswater percolation; and provides ponding characteristics that provide habitat forwaterbird breeding, etc., relative to its capability and potential.
Ram
one
McC
oy
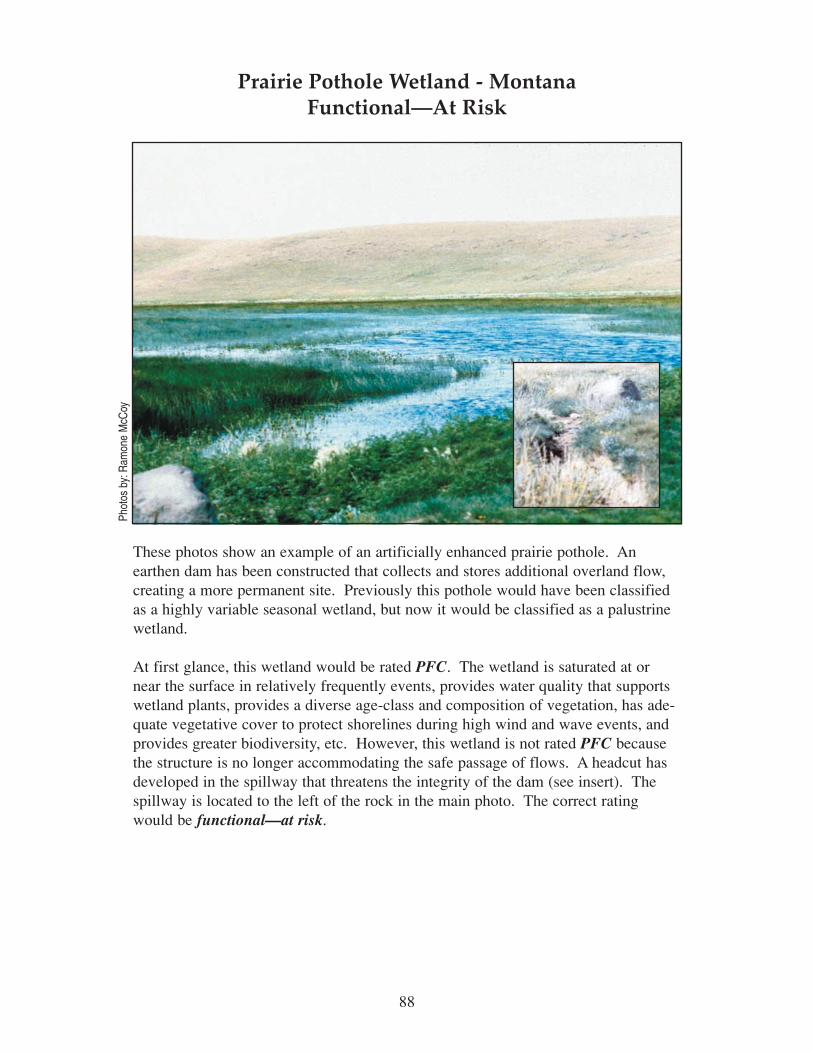
Prairie Pothole Wetland - MontanaFunctional—At Risk
These photos show an example of an artificially enhanced prairie pothole. Anearthen dam has been constructed that collects and stores additional overland flow,creating a more permanent site. Previously this pothole would have been classifiedas a highly variable seasonal wetland, but now it would be classified as a palustrinewetland.
At first glance, this wetland would be rated PFC. The wetland is saturated at ornear the surface in relatively frequently events, provides water quality that supportswetland plants, provides a diverse age-class and composition of vegetation, has ade-quate vegetative cover to protect shorelines during high wind and wave events, andprovides greater biodiversity, etc. However, this wetland is not rated PFC becausethe structure is no longer accommodating the safe passage of flows. A headcut hasdeveloped in the spillway that threatens the integrity of the dam (see insert). Thespillway is located to the left of the rock in the main photo. The correct ratingwould be functional—at risk.
88
Phot
os b
y:R
amon
e M
cCoy

89
Appendix D:PFC—What It Is and What It Isn’t

91
PFC is: A methodology for assessing the physical functioning of riparian-wetland areas. The term PFC is used to describe both the assessment process, and a defined, on-the-ground condition of a riparian-wetland area. In either case, PFC defines a minimum level or starting point for assessing riparian-wetland areas.
The PFC assessment provides a consistent approach for assessing the physical functioning of riparian-wetland areas through consideration of hydrology, vegetation, and soil/landform attributes. The PFC assessment synthesizes information that is foundational to determining the overall health of a riparian-wetland area.
The on-the-ground condition termed PFC refers to how well the physical processes are functioning. PFC is a state of resiliency that will allow a riparian-wetland area to hold together during a wind action, wave action, or overland flow event, sustaining that system’s ability to produce values related to both physical and biological attributes.
PFC isn’t: The sole methodology for assessing the health of the aquatic or terrestrial components of a riparian-wetland area.
PFC isn’t: A replacement for inventory or monitoring protocols designed to yield information on the “biology” of the plants and animals dependent on the riparian-wetland area.
PFC can: Provide information on whether a riparian-wetland area is physically functioning in a manner that will allow the maintenance or recovery of desired values (e.g., fish habitat, neotropical birds, or forage) over time.
PFC isn’t: Desired condition. It is a prerequisite to achieving desired condition.
PFC can’t: Provide more than strong clues as to the actual condition of habitat for plants and animals. Generally a riparian-wetland area in a physically nonfunctioning condition will not provide quality habitat conditions. A riparian-wetland area that has recovered to proper functioning condition would either be providing quality habitat conditions, or would be moving in that direction if recovery is allowed to continue. A riparian-wetland area that is functioning at-risk would likely lose any habitat that exists during a wind action, wave action, or overland flow event.
Therefore: To obtain a complete picture of riparian-wetland area health, including the biological side, one must have information on both physical status, provided through the PFC assessment, and biological habitat quality. Neither will provide a complete picture when analyzed in isolation. In most cases, proper functioning condition will be a prerequisite to achieving and maintaining habitat quality.
PFC is: A useful tool for prioritizing restoration activities. By concentrating on the “at-risk” systems, restoration activities can save many riparian-wetland areas from degrading to a nonfunctioning condition. Once a system is nonfunctional, the effort, cost, and time required for recovery is dramatically increased. Restoration of nonfunctional systems should be reserved for those situations where the riparian-wetland has reached a point where recovery is possible, when efforts are not at the expense of “at-risk” systems, or when unique opportunities exist. At the same time, systems that are properly functioning are not the highest priorities for restoration. Management of these systems should be
92
continued to maintain PFC and further recovery towards desired condition.
PFC is: A useful tool for determining appropriate timing and design of riparian-wetland restoration projects (including structural and management changes). It can identify situations where structures are either entirely inappropriate or premature.
PFC is: A useful tool that can be used in watershed analysis. While the methodology and resultant data is “area based,” the ratings can be aggregated and analyzed at the watershed scale. PFC, along with other watershed and habitat condition information helps provide a good picture of watershed health and the possible causal factors affecting watershed health. Use of PFC will help to identify watershed-scale problems and suggest management remedies and priorities.
PFC isn’t: Watershed analysis in and of itself, or a replacement for watershed analysis.
PFC is: A useful tool for designing monitoring plans. By concentrating implementation monitoring efforts on the “no” answers, greater efficiency of resources (people, dollars, time) can be achieved. The limited resources of the local manager in monitoring riparian-wetland parameters can be prioritized to those factors that are currently “out of range” or at risk of going out of range. The role of research may extend to validation monitoring of many of the parameters.
PFC isn’t: Designed to be a long-term monitoring tool, but it may be an appropriate part of a well-designed monitoring program.
PFC isn’t: Designed to provide monitoring answers about attaining desired conditions. However, it can be used to provide a thought process on whether a management strategy is likely to allow attainment of desired conditions.
PFC can: Reduce the frequency and sometimes the extent of more data- and labor-intensive inventories. PFC can reduce time and cost by concentrating efforts on the most significant problem areas first, thereby increasing efficiency.
PFC can’t: Eliminate the need for more intensive inventory and monitoring protocols. These will often be needed to validate that riparian-wetland area recovery is indeed moving toward or has achieved desired conditions (e.g., good quality habitat) or simply to establish what the existing habitat quality is.
PFC is: A qualitative assessment based on quantitative science. The PFC assessment is intended for individuals with local, on-the-ground experience in the kind of quantitative sampling techniques that support the checklist. These quantitative techniques are encouraged in conjunction with the PFC assessment for individual calibration where answers are uncertain or where experience is limited. PFC is also an appropriate starting point for determining and prioritizing the type and location of the quantitative inventory or monitoring that is necessary.
PFC isn’t: A replacement for quantitative inventory or monitoring protocols. PFC is meant to complement more detailed methods by providing a way to synthesize data and communicate results.
Appendix E:
93
Common Wetlands
Riparian-wetland systems can be either nonjurisdictional or jurisdictional. Thelatter refers to those types that meet the legal requirements of a wetland as defined


95
by the Wetland Delineation Manual (U.S. Army COE 1987). Activities, such asdredge and fill, in those regulated wetlands are subject to section 404 of the CleanWater Act. These activities are regulated by the COE and NRCS on agriculturallands. The three parameters, vegetation, soils, and hydrology, are used to make thedetermination. The wetland indicator plant list (Reed 1988) is used to determinewetland species status.
However, not all lentic types of riparian-wetlands are jurisdictional, and the PFCassessment is not intended to be used to make this determination. Several classifica-tions describe various wetland types. The system described by Cowardin et al.(1979) defines wetland types using hydrologic and geomorphic factors, along withchemical and biological factors. The hydrogeomorphic (HGM) system uses geomor-phic setting, water sources, and hydrodynamics to classify wetlands. In addition,numerous vegetative classifications have been developed. Windell et al. (1986)describe systems such as marshes, fens, bogs, wet meadows, playas, potholes,willow carrs, and forested wetlands. A comparison of HGM and Cowardin types, aswell as some examples, follow:
HGM Class Examples Cowardin System
Slope Fen PalustrineSeep Springs
Riverine Riparian RiverineOxbow Palustrine
Depressions Potholes LacustrinePlayas PalustrineVernal Pools
Tidal Fringe Estuaries EstuarineTidal Ponds
Lacustrine Fringe Lake Edges LacustrineMarshes Palustrine
Mineral Soil Flats Broad Interfluves PalustrineLarge Relict Lakes
Organic Soil Flats Extensive Peatlands Palustrine
Windell et al. (1986) define the following broad vegetative riparian-wetland types,which are common in the Western States:
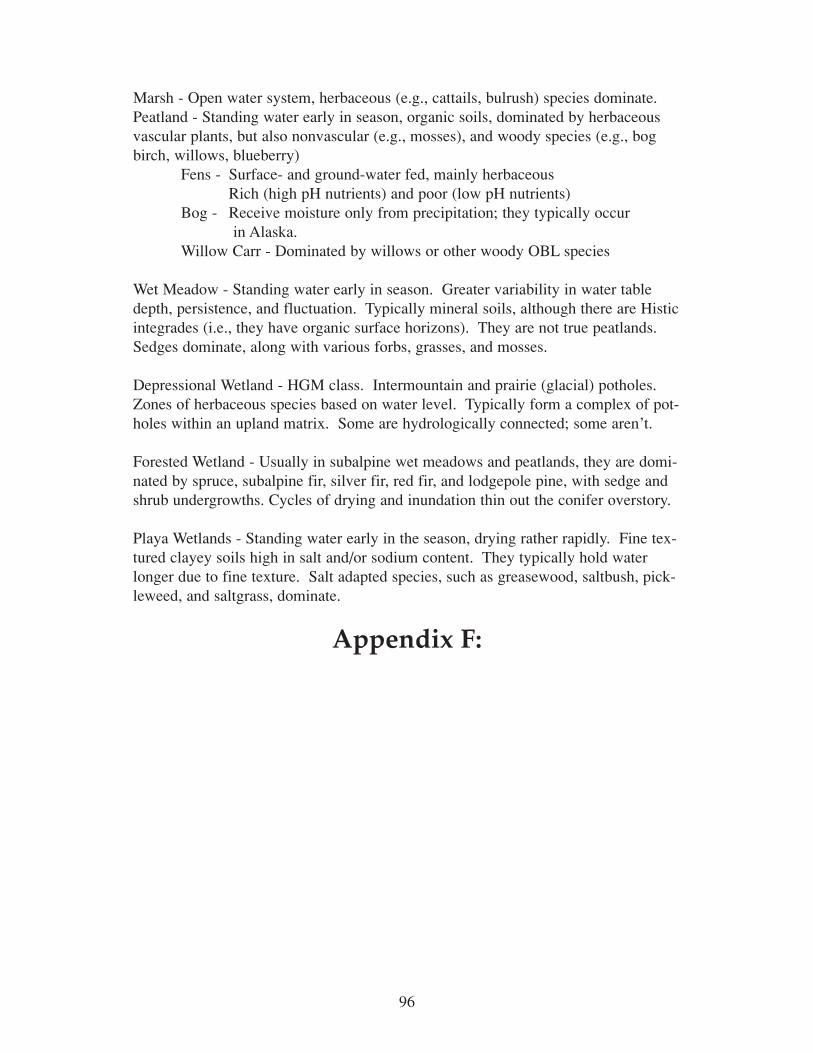
96
Marsh - Open water system, herbaceous (e.g., cattails, bulrush) species dominate.Peatland - Standing water early in season, organic soils, dominated by herbaceousvascular plants, but also nonvascular (e.g., mosses), and woody species (e.g., bogbirch, willows, blueberry)
Fens - Surface- and ground-water fed, mainly herbaceousRich (high pH nutrients) and poor (low pH nutrients)
Bog - Receive moisture only from precipitation; they typically occurin Alaska.
Willow Carr - Dominated by willows or other woody OBL species
Wet Meadow - Standing water early in season. Greater variability in water tabledepth, persistence, and fluctuation. Typically mineral soils, although there are Histicintegrades (i.e., they have organic surface horizons). They are not true peatlands.Sedges dominate, along with various forbs, grasses, and mosses.
Depressional Wetland - HGM class. Intermountain and prairie (glacial) potholes.Zones of herbaceous species based on water level. Typically form a complex of pot-holes within an upland matrix. Some are hydrologically connected; some aren’t.
Forested Wetland - Usually in subalpine wet meadows and peatlands, they are domi-nated by spruce, subalpine fir, silver fir, red fir, and lodgepole pine, with sedge andshrub undergrowths. Cycles of drying and inundation thin out the conifer overstory.
Playa Wetlands - Standing water early in the season, drying rather rapidly. Fine tex-tured clayey soils high in salt and/or sodium content. They typically hold waterlonger due to fine texture. Salt adapted species, such as greasewood, saltbush, pick-leweed, and saltgrass, dominate.
Appendix F:
97
Problem Wetlands
Certain wetlands may be difficult to identify because field indicators of the threewetland identification criteria may be absent, at least at certain times of the year.


99
These wetlands are considered problem wetlands because the difficulty in identifica-tion is generally due to normal environmental conditions and is not the result ofhuman activities or catastrophic natural events, with the exception of newly createdwetlands. Because of the difficulty in identifying these areas as wetlands, there willbe a degree of difficulty in assessing their functionality. ID teams may need to addelements to the lentic checklist to assess these problem wetlands.
Examples of these problem wetlands are discussed below. Learning how to recog-nize these wetlands and to understand their attributes/processes is important forassessing functionality.
1. Wetlands Dominated by Facultative Upland (FACU) Plant Species
Since wetlands often exist along a natural wetness gradient between permanentlyflooded substrates and better-drained soils, the wetland plant communities some-times may be dominated by FACU species. Although FACU-dominated plant com-munities are usually uplands, they sometimes become established in wetlands. Inorder to determine whether a FACU-dominated plant community constituteshydrophytic vegetation, the soil and hydrology must be examined. If the area meetsthe hydric soil and wetland hydrology criteria, then the vegetation is hydrophytic.
2. Evergreen Forested Wetlands
Wetlands dominated by evergreen trees occur in many parts of the country. In somecases, the trees are obligate wetland (OBL) species, facultative wetland (FACW)species, and facultative (FAC) species, e.g., Atlantic white cedar (Chamaecyparisthyoides), black spruce (Picea mariana), balsam fir (Abies balsamae), slash pine(Pinus elliottii), and loblolly pine (P. taeda). In other cases, however, the dominantevergreen trees are FACU species, including red spruce (Picea rubens), Engelmannspruce (P. engelmannii), white spruce (P. glauce), Sitka spruce (P. sitchensis),eastern white pine (Pinus strobus), pitch pine (P. rigida), lodgepole pine (P.contorta), longleaf pine (P. palustris), ponderosa pine (P. banksiana), eastern hem-lock (Tsuga canadensis), western hemlock (T. heterophylla), Pacific silver fir (Abiesamabilis), white fir (A. concolor), and subalpine fir (A. lasiocarpa). In dense stands,these evergreen trees may preclude the establishment of understory vegetation or, insome cases, the understory vegetation may also be FACU species. Since these plantcommunities are usually found on nonwetlands, the ones established in wetlandareas may be difficult to recognize at first glance. The landscape position of theevergreen forested areas, such as a depression, drainageway, bottomland, flat insloping terrain, and seepage slope, should be considered because it often providesclues to the likelihood of wetlands. Soils also should be examined in these situa-tions. The wetlands can be identified by following the procedures for FACU-domi-nated wetlands described above.
3. Glacial Till Wetlands
100
Sloping wetlands occur in glaciated areas where thin soil covers relatively imperme-able glacial till or where layers of glacial till have different hydraulic conditions thatpermit ground-water seepage. Such areas are seldom, if ever, flooded, but downs-lope ground-water movement keeps the soils saturated for a sufficient portion of thegrowing season to produce anaerobic and reducing soil conditions. This promotesdevelopment of hydric soils and hydrophytic vegetation. Indicators of wetlandhydrology may be lacking during the drier portion of the growing season. Hydricsoil indicators also may be lacking because certain areas are so rocky that it is diffi-cult to examine soil characteristics within 18 inches.
4. Highly Variable Seasonal Wetlands
In many regions (especially in arid and semiarid regions), depressional areas occurthat may have indicators of all three wetland criteria during the wetter portion of thegrowing season, but normally lack indicators of wetland hydrology and/orhydrophytic vegetation during the drier portion of the growing season. In addition,some of these areas lack field indicators of hydric soil. OBL and FACW plantspecies normally are dominant during the wetter portion of the growing season,while FACU and obligate upland (UPL) species (usually annuals) may be dominantduring the drier portion of the growing season and during and for some time afterdroughts. Examples of highly variable seasonal wetlands are pothole wetlands in theupper Midwest, playa wetlands in the Southwest, and vernal pools along the coast ofCalifornia. It is important to become familiar with the ecology of these and similartypes of wetlands, and to be particularly aware of drought conditions that permitinvasion of UPL species (even perennials).
5. Interdunal Swale Wetlands
Along the U.S. coastline, seasonally wet swales supporting hydrophytic vegetationare located within sand dune complexes on barrier islands and beaches. Some ofthese swales are inundated or saturated to the surface for considerable periods duringthe growing season, while others are wet for only the early part of the season. Insome cases, swales may be flooded irregularly by the tides. These wetlands havesandy soils that generally lack field indicators of hydric soil. In addition, indicatorsof wetland hydrology may be absent during the drier part of the growing season.Consequently, these wetlands may be difficult to identify.
6. Vegetated River Bars and Adjacent Flats Wetlands
Along western streams in arid and semiarid parts of the country, some river bars andflats may be vegetated by FACU species while others may be colonized by wetterspecies. If these areas are frequently inundated for 1 or more weeks during thegrowing season, they are wetlands. The soils often do not reflect the characteristicfield indicators of hydric soils, however, and thereby pose delineation problems.
7. Vegetated Flats Wetlands
101
Vegetated flats are characterized by a marked seasonal periodicity in plant growth.They are dominated by annual OBL species, such as wild rice (Zizania aquatica),and/or perennial OBL species, such as spatterdock (Nuphar luteum), that have non-persistent vegetative parts (i.e., leaves and stems break down rapidly during thewinter, providing no evidence of the plant on the wetland surface at the beginning ofthe next growing season). During winter and early spring, these areas lack vegeta-tive cover and resemble mud flats; therefore, they do not appear to qualify as wet-lands. But during the growing season, the vegetation becomes increasingly evident,qualifying the area as a wetland. In evaluating these areas, which occur both incoastal and interior parts of the country, the time of year of the field observation andthe seasonality of the vegetation must be considered. Again, it is important tobecome familiar with the ecology of these wetland types.
8. Newly Created Wetlands
These wetlands include manmade (artificial) wetlands, beaver-created wetlands, andother natural wetlands. Artificial wetlands may be purposely or accidentally createdby human activities (e.g., road impoundments, undersized culverts, irrigation, andseepage from earth-dammed impoundments). Many of these areas will have indica-tors of wetland hydrology and hydrophytic vegetation. But the area may lack typicalfield characteristics of hydric soils since the soils have just recently been inundatedand/or saturated. Since all of these wetlands are newly established, field indicatorsof one or more of the wetland identification criteria may not be present.
9. Entisols (Floodplain and Sandy Soils) Wetlands
Entisols are usually young or recently formed soils that have little or no evidence ofpedogenically developed horizons. These soils are typical of floodplains throughoutthe U.S., but are also found in glacial outwash plains, along tidal waters, and inother areas. They include sandy soils of riverine islands, bars, and banks and finertextured soils of floodplain terraces. Some entisols are easily recognized as hydricsoils such as the sulfaquents of tidal salt marshes, whereas others pose problemsbecause they do not possess typical hydric soil field indicators. Wet sandy entisols(with loamy fine sand and coarser textures in horizons within 20 inches of the sur-face) may lack sufficient organic matter and clay to develop hydric soil colors.When these soils have a hue between 10YR and 10Y and distinct or prominent mot-tles present, a chroma of 3 or less is permitted to identify the soil as hydric.
10. Mollisols (Prairie and Steppe Soils) Wetlands
Mollisols are dark-colored, base-rich soils. They are common in the central part ofthe conterminous U.S. from eastern Illinois to Montana and south to Texas. Naturalvegetation is mainly tall grass prairies and short grass steppes. These soils typicallyhave deep, dark topsoil layers (mollic epipedons) and low chroma matrix colors toconsiderable depths. They are rich in organic matter due largely to the vegetation(deep roots) and reworking of the soil and organic matter by earthworms, ants,

102
moles, and rodents. The low chroma colors of mollisols are not necessarily due toprolonged saturation, so be particularly careful in making wetland determinations inthese soils must be made carefully. It is important to become familiar with the char-acteristics of mollisols with aquic moisture regimes.
Literature Cited

103
Brigdham, S.D., S.P. Faulkner, and C.J. Richardson. 1991. Steel rod oxidation ashydraulic indicator in wetland soils. American Journal of the Soil ScienceSociety, Vol. 55. pp. 856-862.
Brinson, M.M. 1993. A hydrogeomorphic classification for wetlands. U.S. ArmyCorps of Engineers Waterways Experiment Station, Wetlands ResearchProgram Technical Report WRP-DE-4. 79 pp.
Brinson, M.M., F.R. Hauer, L.C. Lee, W.L. Nutter, R.D.Rheinhardt, R.D. Smith,and D. Whigham. 1995. A guidebook for application of hydrogeomorphicassessments to riverine wetlands. U.S. Army Corps of Engineers WaterwaysExperiment Station, Wetlands Research Program Technical Report WRP-DE-11. Operational draft. 113 pp.
Clemmer, P. 1994. Riparian area management: the use of aerial photography tomanage riparian-wetland areas. TR 1737-10. Bureau of Land Management,BLM/SC/ST 94/005+1737, Service Center, CO. 64 pp.
Cole, G.F. 1958. Range survey guide. Montana Fish and Game Dept. 18 pp.Cowardin, L.M., V. Carter, F. Golet, and E. LaRoe. 1979. Classification of wetlands
and deepwater habitats of the United States. USDI, FWS/OBS-79/31,Washington, DC. 103 pp.
DeBano L.F. and L.J. Schmidt. 1989. Improving southwestern riparian areas throughwatershed management. General Technical Report RM-182. USDA ForestService Rocky Mountain Forest and Range Experiment Station, Fort Collins,CO. 33 pp.
Dunne, T. and L.B. Leopold. 1978. Water in environmental planning. W.H. Freemanand Company, New York. 818 pp.
Elzinga, C.L., D.W. Salzer, and J.W. Willoughby. 1998. Measuring and monitoringplant populations. TR 1730-1. Bureau of Land Management, BLM/RS/ST-98/005+1730, Denver, CO. 492 pp.
Environmental Protection Agency. 1986. Quality criteria for water 1986. Office ofWater Regulations and Standards. EPA/440/5-86/001. 398 pp.
Fahey, B.D. 1974. Seasonal frost heave and frost penetration measurements in theIndian peaks region of the Colorado front range. Arctic and Alpine Research,Vol. 6, No. 1, 1974. pp. 63 70.
Fetter, C.W. 1994. Applied Hydrogeology. Third Edition. MacMillan CollegePublishing Company, New York. 488 pp.
Fowler, A.C. and C.G. Noon. 1997. Differential frost heave in seasonally frozensoils. In: Iskandar, I.K., E.A. Wright, J.K. Radke, B.S. Sharratt, P.H.Groeneveld, and L.D. Hinzman (Eds.). Special Report 97-10: InternationalSymposium on Physics, Chemistry, and Ecology of Seasonally Frozen Soils,Fairbanks, Alaska, June 10-12, 1997. pp. 247-252.
Gatto, L.W. 1997. Freeze-thaw effects on the hydrologic characteristics of rutted andcompacted soils. In: Iskandar, I.K., E.A. Wright, J.K. Radke, B.S. Sharratt,P.H. Groeneveld, and L.D. Hinzman (Eds.). Special Report 97-10:International Symposium on Physics, Chemistry, and Ecology of SeasonallyFrozen Soils, Fairbanks, Alaska, June 10-12, 1997. pp. 189-198.
Grossman, R.B. and F.B. Pringle. 1987. Describing surface soil properties - theirseasonal changes and implications for management. In: Reybold, W.U. andG.W. Petersen (Eds.). Soil Survey Techniques, SSSA Special Publication No.
104
20. pp. 57-75.Hansen, P.L., R.D. Pfister, K. Boggs, B.J. Cook, J. Joy, and D.K. Hinkley. 1995.
Classification and management of Montana’s riparian and wetland sites.Miscellaneous Publication No. 54, Montana Forest and ConservationExperiment Station, School of Forestry, University of Montana. Missoula,MT. 646 pp.
Harrelson, C.C., C.L. Rawlins, and J.P. Potyondy. 1994. Stream channel referencesites: an illustrated guide to field technique. USDA Forest Service RockyMountain Forest and Range Experiment Station General Technical ReportRM-245. 61 pp.
Heede, B.H. 1976. Gully development and control: the status of our knowledge.USDA Forest Service Research Paper RM-169. Rocky Mountain Forest andRange Experiment Station. Ft. Collins, CO. 42 pp.
____________. 1980. Stream dynamics: an overview for land managers. USDAForest ServiceGeneral Technical Report RM-72. Ft. Collins, CO. 26 pp.
Hough, B. K. 1957. Basic Soils Engineering. The Ronald Press Company, NewYork. pp. 77- 78, 381-382, and 484-485.
Hurt, G.W. and V.W. Carlisle. 1997. Proper use of hydric soil terminology. SoilSurvey Horizons, Vol. 38, No. 4. Madison, WI. page 101.
Kovalchik, B.L. 1987. Riparian zone associations, Deschutes, Ochoco, Fremont, andWinema National Forests. R6 ECOL TP-279-87. USDA Forest Service,Pacific Northwest Region. 171 pp.
Leonard, S., G. Staidl, J. Fogg, K. Gebhardt, W. Hagenbuck, and D. Prichard. 1992a.Riparian area management: procedures for ecological site inventory - withspecial reference to riparian wetland sites. TR 1737-7. Bureau of LandManagement, BLM/SC/PT-92/004+1737, Service Center, CO. 135 pp.
Leonard, S.G., G.J. Staidl, K.A. Gebhardt, and D.E. Prichard. 1992b. Viewpoint:Range site/ecological site information requirements for classification ofriverine riparian ecosystems. J. Range Manage. 45:431-435.
Leonard, S., G. Kinch, V. Elsbernd, M. Borman, and S. Swanson. 1997. Riparianarea management: grazing management for riparian-wetland areas. Bureau ofLand Management, BLM/RS/ST-97/002+1737, National Applied ResourceSciences Center, CO. 80 pp.
Lewis, M.E. 1958. Carex - it’s distribution and importance in Utah. Brigham YoungUniv. Bull., Biological Series - Vol. I, No. 2. 43 pp.
Manning, M.E., S.R. Swanson, T. Svejcar, and J. Trent. 1989. Rooting characteristicsof four intermountain meadow community types. J. Range Manage42(4):309-312.
Manning, M.E. and W.G. Padgett. 1995. Riparian community type classification forHumboldt and Toiyabe National Forests, Nevada and eastern California. R4-Ecol-95-01. USDA Forest Service, Intermountain Region. 306 pp.
Myers, L.H. 1989. Riparian area management: inventory and monitoring ofriparian areas. TR 1737-3. Bureau of Land Management, BLM/YA/PT-89/022+1737, Service Center, CO. 89 pp.
105
Post, R.A. 1996. Functional profiles of black spruce wetlands in Alaska.EPA 910/R-96-006. Seattle, WA. 170 pp.
Prichard, D., H. Barrett, J. Cagney, R. Clark, J. Fogg, K. Gebhardt, P. Hansen, B.Mitchell, and D. Tippy. 1993. Riparian area management: process forassessing proper functioning condition. TR 1737-9. Bureau of LandManagement, BLM/SC/ST-93/003+1737, Service Center, CO. 60 pp.
Prichard, D., C. Bridges, S. Leonard, R. Krapf, and W. Hagenbuck. 1994. Riparianarea management: process for assessing proper functioning condition forlentic riparian-wetland areas. TR 1737-11. Bureau of Land Management,BLM/SC/ST-94/008+1737, Service Center, CO. 46 pp.
Prichard, D., P. Clemmer, M. Gorges, G. Meyer, and K. Shumac. 1996. Riparianarea management: using aerial photographs to assess proper functioning con-dition of riparian wetland areas. TR 1737-12. Bureau of Land Management,BLM/RS/ST-96/007+1737, National Applied Resource Sciences Center, CO.52 pp.
Prichard, D., J. Anderson, C. Correll, J. Fogg, K. Gebhardt, R. Krapf, S. Leonard, B.Mitchell, and J. Staats. 1998. Riparian area management: a user guide toassessing proper functioning condition and the supporting science for loticareas. TR 1737-15. Bureau of Land Management, BLM/RS/ST-98/001+1737. 136 pp.
Reed, P.B., Jr. 1988. National list of plant species that occur in wetlands. U.S. Fishand Wildlife Service Biological Report 88. USDI Fish and Wildlife Service,Research and Development. Washington, DC.
Singer, M.J. and D.N. Magnus. 1987. Soils an introduction. MacMillan PublishingCompany, New York.
Smith R.D., A. Amman, C. Bartoldus, and M.M. Brinson. 1995. An approach forassessing wetland functions using hydrogeomorphic classification, referencewetlands, and functional indices. U.S. Army Corps of Engineers WaterwaysExperiment Station, Wetlands Research Program Technical Report WRP-DE-9. 72 pp.
Smith, B. and D. Prichard. 1992. Riparian area management: management tech-niques in riparian areas. TR 1737-6. Bureau of Land Management,BLM/SC/PT-92/003+1737, Service Center, CO. 44 pp.
Sosebee, R.E. (Editor). 1977. Rangeland plant physiology. Range Science Series No.4. Society for Range Management, Denver, CO. 290 pp.
Sprecher, S.W. 1993. Installing monitoring wells/piezometers in wetlands. WetlandResearch Program, Technical Note HY-IA-3.1, U.S. Army Corp of Engineers.Waterways Experiment Station, Vicksburg, MS. 14 pp.
U.S. Army Corp of Engineers. 1987. Wetlands delineation manual. Final report.Wetlands Research Program Technical Report Y-87-1.
United States Department of Agriculture. 1983. National soils handbook, asamended. Soil Conservation Service, Washington DC. 619 p.
USDA Forest Service. 1992. Integrated riparian evaluation guide—IntermountainRegion. USDA Forest Service, Intermountain Region, Ogden, UT. 199 pp.
USDA, Natural Resources Conservation Service. 1996. Soil survey laboratorymethod manual—the soil survey analytical continuum. Soil SurveyInvestigations Report No. 42, Version 3.0. Washington, DC.

106
____________. 1997. Hydrology tools for wetland determination, chapter 19,Engineering FieldHandbook. Donald E. Woodward (ed.). USDA, NRCS, Fort Worth, TX. 55pp.
____________. 1998a. Field book for describing and sampling soils, version 1.1(March 1998).
____________. 1998b. Field indicators of hydric soils in the United States - a guidefor identifying and delineating hydric soils, version 4.0 (March 1998).Wetland Science Institute and Soils Division. Lincoln, NE. 30 pp.
____________. 1998c. National range and pasture handbook. 190-VI. USDA U.S. Salinity Laboratory. 1954. Diagnosis and improvement of saline and
alkali soils. Agr. Hdb. No. 60, Washington DC. 158 pp.Vepraskas, M.J. 1994. Redoximorphic features for identifying aquic conditions.
Technical Bulletin 301. North Carolina Ag. Research Service. North CarolinaState Univ., Raleigh, NC. 33 pp.
Walton, R., T.H. Martin, R.S. Chapman, and J.E. Davis. 1995. Investigations of wet-lands hydraulic and hydrological processes, model development, and applica-tion. Technical Report WRP-CP-6. U.S. Army Corps of Engineers.Vicksburg, MS. 118 pp.
Weixelman, D.A., D.C. Zamudio, and K.A. Zamudio. 1996. Central Nevada riparianfield guide.R4-ECOL-96-01. USDA Forest Service, Intermountain Region.145 pp.
Windell, J.T., B.E. Willard, D.J. Cooper, S.Q. Foster, C.F. Knud-Hansen, L.P. Rink,and G.N. Kiladis. 1986. An ecological characterization of Rocky Mountainmontane and subalpine wetlands. U.S. Fish and Wildlife Service. Serv. Biol.Rep. 86(11). 298 pp.
Wingate, G. 1999. Hydrologist, BLM Alturas Field Office, Alturas, CA. Personalcommunication.
Wetlands Research Program. 1993. Methods for measuring sedimentation rates inbottomland hardwood (BLH) wetlands. WRP Technical Note SD-CP-4.1. 7pp.
Zeedyk W.D. 1996. Managing roads for wet meadow ecosystem recovery. ReportNo. FHWA-FLP-96-016. USDA Forest Service Southwestern Region. 73 pp.
Glossary of Terms
Advanced Ecological Status - A community with a high coefficient of similarity to
107
a defined or perceived PNC for an ecological site, usually late seral or PNC ecolog-ical status.
Aerobic - A condition in which molecular oxygen is a part of the environment.
Anaerobic - A condition in which molecular oxygen is absent (or effectively so)from the environment.
Duration - A general descriptive term for the average amount of time that inunda-tion lasts per flood occurrence for a geographic area. Categories include: very brief(less than 2 days); brief (2 to 7 days); long (7 days to 1 month); very long (morethan 1 month); and flash flooding (less than 2 hours).
Facultative (FAC) Species - Plant species that are equally likely to occur in wet-lands or nonwetlands (estimated probability 34-66 percent).
Facultative Upland (FACU) Species - Plant species that usually occur in nonwet-lands (estimated probability 67-99 percent), but that are occasionally found in wet-lands (estimated probability 1-33 percent).
Facultative Wetland (FACW) Species - Plant species that usually occur in wet-lands (estimated probability 67-99 percent), but that are occasionally found in non-wetlands.
Flooding - When the soil surface is temporarily covered with flowing water fromany source, such as overflowing streams or rivers, runoff from adjacent slopes, andinflow from high tides.
Frequency - A general descriptive term for the relative chance of reoccurrence of aflooding event for a geographic area. Categories include: none (0 percent chance);rare (0 to 5 percent chance); occasional (5 to 50 percent chance); and frequent(greater than 50 percent chance).
Frost (or Abnormal Hydrologic) Heaving - The lifting of a surface by the internalaction of frost or hydrostatic pressure. It generally occurs after a thaw, when the soilis filled with water droplets and when a sudden drop in temperature below freezingchanges the droplets into ice crystals, which involves expansion and consequentlycauses an upward movement of the soil. The process is exacerbated when there iscompaction between plant tussocks (e.g., from hoof action) and/or excessiveremoval of thermal vegetation cover. The result is the hummocked appearance ofplants being elevated above the normal ground surface, root shearing betweenplants, and exposure of interspaces to increased erosional forces.
Gleyed Matrix - (USDA NRCS 1998b) Soils with a gleyed matrix have the fol-lowing combination of hue, value, and chroma, and the soils are not glauconitic:10Y, 5GY, 10GY, 10G, 5BG, 10BG, 5B, 10B, or 5PB with value 4 or more andchroma is 1; or 5G with value 4 or more and chroma is 1 or 2; or N with value 4 or
108
more; or (for testing only) 5Y, value 4 , and chroma 1. In some places the gleyedmatrix may change color upon exposure to air (reduced matrix). This phenomenonis included in the concept of gleyed matrix.
Histic Epipedon - A thick (20- to 60-cm) organic soil horizon that is saturated withwater at some period of the year unless artificially drained and that is at or near thesurface of a mineral soil.
Histosols - Organic soils that have organic materials in more than half of the upper80 cm (32 in), or that are of any thickness if they overlay rock or fragmental mate-rials that have interstices filled with organic soil materials.
Hydric Soil (1994) - A soil that formed under conditions of saturation, flooding, orponding long enough during the growing season to develop anaerobic conditions inthe upper part.
Hydrogen Sulfide Odor - An odor similar to rotten eggs associated with H2S.
Hydrogeomorphic - Features pertaining to the hydrology and/or geomorphology ofa riparian wetland area.
Inundation - A condition in which water from any source temporarily or perma-nently covers a land surface.
Obligate Upland (UPL) Species - Plant species that occur in wetlands in anotherregion, but almost always occur (estimated probability >99 percent) under naturalconditions in nonwetlands in the region specified.
Obligate Wetland (OBL) Species - Plant species that occur almost always (esti-mated probability >99%) under natural conditions in wetlands.
Ponding - A condition in which water stands in a closed depression. The water isremoved only by percolation, evaporation, or transpiration.
Potential Natural Community - Represents the seral stage the botanical commu-nity would achieve if all successional sequences were completed without humaninterference under the present environmental conditions.
Redox Concentration - Bodies of apparent accumulation of Fe-Mn oxides(Vepraskas 1994).
Redox Depletions - Bodies of low chroma (<2) having values of 4 or more whereFe-Mn oxides alone have been stripped out or where both Fe-Mn oxides and clayhave been stripped out (Vepraskas 1994).Redoximorphic Features - Features formed by the reduction, translocation, andoxidation of Fe and Mn oxides. Both iron and manganese are used because the twoare virtually inseparable in soils.
109
Reduced Matrices - Soil matrices that have a low chroma color in situ because ofthe presence of Fe(II), but whose color changes in hue or chroma when exposed toair as the Fe(II) is oxidized to Fe(III) (Vepraskas 1994).
Reduction - The gaining of electrons by an atom or ion, thereby reducing its vari-ance. For the purpose of hydric soil indicators, it is when the redox potential (Eh) isbelow the ferric/ferrous iron threshold as adjusted for pH. In hydric soils, this is thepoint when transformation of ferric iron (Fe+++) to ferrous iron (Fe++) occurs.
Riparian-Wetland Area - An area that is saturated or inundated at a frequency andduration sufficient to produce vegetation typically adapted for life in saturated soilconditions. It is also the transitional area between permanently saturated wetlandsand upland areas often referred to as a riparian area. This transition area has vegeta-tion or physical characteristics reflective of permanent surface or subsurface waterinfluence. Wetlands and wetland transitions are usually managed as a unit. Thesesystems can be either nonjurisdictional or jurisdictional.
Riparian-Wetland Ecological Site - An area of land with a specific potential plantcommunity and specific physical site characteristics, differing from other areas ofland in its ability to produce vegetation and to respond to management. Ecologicalsite is synonymous with range site.
Saturation - When the soil water pressure is zero or positive. Most all the soilpores are filled with water.
Vegetation Community Dynamics - Response of plant communities to changes intheir environment, to their use, and to stresses to which they are subjected. Climaticcycles, fire, insects, grazing, and physical disturbances are some of the many causesof changes in plant communities. Some changes are temporary while others arelong-lasting.
Vegetation Community Succession - A sequence of plant community changes fromthe initial colonization of a bare soil toward a PNC (primary succession). It mayinvolve sequences of plant community changes from PNC due to perturbations, or asequence toward PNC again following a perturbation (secondary succession).Vegetation community succession may be accompanied by subtle but significantchanges in temporal soil characteristics, such as bulk density, nutrient cycling, andmicroclimatic changes, but it is differentiated from major physical state changes,such as landform modification or long-term elevation or lowering of a water table,that would change the PNC of an ecological site.
Woody Debris - Woody vegetation that enters a riparian-wetland area and is largeenough to stay for a period of time and operate as a hydrologic modifier. Oftenreferred to as woody material.

110

