rio hondo/san gabriel river water quality group
TRANSCRIPT
Rio Hondo/San Gabriel River Water Quality Group
Coordinated Integrated Monitoring Program
1561 E. Orangethorpe Avenue, Suite 240 Fullerton, California 92831 TEL (714) 526-7500 | FAX (714) 526-7004 www.cwecorp.com

Rio Hondo/San Gabriel River Water Quality Group Coordinated Integrated Monitoring Program
Table of Contents
TABLE OF CONTENTS .................................................................................................................. i
LIST OF FIGURES ...................................................................................................................... iii
LIST OF TABLES ......................................................................................................................... iii
LIST OF ATTACHMENTS ............................................................................................................. iv
ACRONYMS ................................................................................................................................. v
ES. EXECUTIVE SUMMARY ................................................................................................ vii
ES.1 WATER QUALITY PRIORITIES...................................................................................................... vii ES.2 MONITORING SUMMARY ............................................................................................................. ix
ES.2.1 Receiving Water Monitoring ............................................................................................. x ES.2.2 Stormwater Outfall Monitoring ....................................................................................... xii ES.2.3 Non-Stormwater Outfall Screening and Monitoring ......................................................... xiv
ES.3 NEW DEVELOPMENT AND RE-DEVELOPMENT EFFECTIVENESS TRACKING ................................................xvii ES.4 REGIONAL STUDIES ............................................................................................................... xviii ES.5 WATERSHED COORDINATION .................................................................................................... xviii ES.6 CIMP IMPLEMENTATION SCHEDULE ........................................................................................... xviii ES.7 ADAPTIVE MANAGEMENT .......................................................................................................... xix
1. INTRODUCTION ........................................................................................................... 1
1.1 RIO HONDO/SAN GABRIEL RIVER WATER QUALITY GROUP ENHANCED WATERSHED MANAGEMENT PROGRAM AREA ..................................................................................................................................... 1
1.2 WATER QUALITY PRIORITIES........................................................................................................ 2 1.3 CIMP OVERVIEW ...................................................................................................................... 6
1.3.1 Receiving Water Monitoring ............................................................................................. 7 1.3.2 Stormwater Outfall Monitoring ......................................................................................... 7 1.3.3 Non-Stormwater Outfall Program ..................................................................................... 7 1.3.4 New Development and Re-Development Effectiveness Tracking ......................................... 7 1.3.5 Regional Studies ............................................................................................................. 7
1.4 MONITORING PROCEDURES .......................................................................................................... 8 1.5 2012 MS4 PERMIT REVIEW PROCESS AND CIMP IMPLEMENTATION ....................................................... 8
2. RECEIVING WATER MONITORING PROGRAM ........................................................... 10
2.1 RECEIVING WATER MONITORING OBJECTIVES ................................................................................ 10 2.2 DESCRIPTION OF RECEIVING WATER MONITORING .......................................................................... 10 2.3 RECEIVING WATER MONITORING SITES ........................................................................................ 10
2.3.1 Long Term Assessment Site ........................................................................................... 13 2.3.2 TMDL Sites ................................................................................................................... 16
2.4 MONITORED CONSTITUENTS AND FREQUENCY ................................................................................. 17 2.5 MONITORING COORDINATION ..................................................................................................... 20
3. MS4 DATABASE .......................................................................................................... 21
3.1 AVAILABLE INFORMATION .......................................................................................................... 21 3.2 INFORMATION NOT CURRENTLY AVAILABLE .................................................................................... 22
4. STORMWATER OUTFALL MONITORING ..................................................................... 23
4.1 PROGRAM OBJECTIVES .............................................................................................................. 23 4.2 STORMWATER OUTFALL MONITORING SITES .................................................................................. 23
4.2.1 Santa Anita Wash HUC-12 ............................................................................................. 26
- i -
Rio Hondo/San Gabriel River Water Quality Group Coordinated Integrated Monitoring Program
4.2.2 Big Dalton Wash HUC-12 ............................................................................................... 28 4.2.3 Santa Fe Flood Control Basin HUC-12 ............................................................................. 30 4.2.4 City of Monrovia ............................................................................................................ 32 4.2.5 Cities of Bradbury and Duarte ........................................................................................ 34
4.3 MONITORED CONSTITUENTS AND FREQUENCY ................................................................................. 36 4.4 STORMWATER OUTFALL MONITORING SUMMARY ............................................................................. 37
5. NON-STORMWATER OUTFALL PROGRAM .................................................................. 38
5.1 IMPLEMENTATION OF NON-STORMWATER OUTFALL SCREENING AND MONITORING PROGRAM IN RIO HONDO PORTION OF THE RH/SGRWQG AREA ......................................................................................... 40
5.2 IMPLEMENTATION OF NON-STORMWATER OUTFALL SCREENING AND MONITORING PROGRAM IN SAN GABRIEL RIVER PORTION OF THE RH/SGRWQG AREA ................................................................................ 42
5.3 INVENTORY OF MS4 OUTFALLS WITH NON-STORMWATER DISCHARGES ................................................. 43 5.4 PRIORITIZED SOURCE IDENTIFICATION ......................................................................................... 44 5.5 SIGNIFICANT NON-STORMWATER DISCHARGE SOURCE IDENTIFICATION ................................................ 45 5.6 NON-STORMWATER DISCHARGE MONITORING ................................................................................ 46
5.6.1 Non-Stormwater Outfall-Based Monitoring Sites .............................................................. 46 5.6.2 Monitored Constituents and Frequency ........................................................................... 46 5.6.3 Adaptive Monitoring ...................................................................................................... 47
6. NEW DEVELOPMENT/RE-DEVELOPMENT EFFECTIVENESS TRACKING ...................... 49
6.1 PROGRAM OBJECTIVES .............................................................................................................. 49 6.2 EXISTING NEW DEVELOPMENT/RE-DEVELOPMENT TRACKING PROCEDURES ............................................ 49 6.3 SPECIAL CONSIDERATIONS FOR DATA MANAGEMENT AND REPORTING ................................................... 49
6.3.1 Data Management ......................................................................................................... 50 6.3.2 Additional Data ............................................................................................................. 50 6.3.3 Reporting ..................................................................................................................... 50 6.3.4 Information Sharing ...................................................................................................... 50
6.4 SUMMARY OF NEW DEVELOPMENT/RE-DEVELOPMENT EFFECTIVENESS TRACKING ..................................... 51
7. REGIONAL STUDIES ................................................................................................... 52
8. SPECIAL STUDIES ...................................................................................................... 53
9. NON-DIRECT MEASUREMENTS .................................................................................. 54
10. ADAPTIVE MANAGEMENT ........................................................................................... 55
10.1 INTEGRATED MONITORING AND ASSESSMENT PROGRAM .................................................................... 55 10.2 CIMP REVISION PROCESS ......................................................................................................... 55
11. REPORTING ................................................................................................................ 57
11.1 DOCUMENTS AND RECORDS ....................................................................................................... 57 11.1.1 Event Summary Reports ................................................................................................ 57 11.1.2 Semi-Annual Analytical Data Reports .............................................................................. 57
11.2 MONITORING REPORTS ............................................................................................................. 57 11.2.1 Report Objectives ......................................................................................................... 57 11.2.2 Annual Reports ............................................................................................................. 58
12. CIMP IMPLEMENTATION SCHEDULE ......................................................................... 63
13. CONCLUSION.............................................................................................................. 65
14. REFERENCES .............................................................................................................. 67
- ii -

Rio Hondo/San Gabriel River Water Quality Group Coordinated Integrated Monitoring Program
List of Figures Figure ES-1 RH/SGRWQG EWMP Receiving Water Sites ....................................................................... xi Figure ES-2 Stormwater Outfall Monitoring Sites ............................................................................... xiii Figure 1-1 Location of the EWMP Group within the Los Angeles Basin ................................................... 2 Figure 1-2 Water Bodies and Geographic Boundary of the RH/SGRWQG ................................................ 3 Figure 2-1 Overview of Receiving Water Monitoring Sites ................................................................... 12 Figure 2-2 LTA Monitoring Sites Catchment Areas .............................................................................. 15 Figure 4-1 Stormwater Outfall Monitoring Sites .................................................................................. 25 Figure 4-2 Stormwater Outfall Monitoring Site – Santa Anita Wash HUC-12 ......................................... 27 Figure 4-3 Stormwater Outfall Monitoring Site – Big Dalton Wash HUC-12 ........................................... 29 Figure 4-4 Stormwater Outfall Monitoring Site – Santa Fe FCB HUC-12 ................................................ 31 Figure 4-5 Stormwater Outfall Monitoring Site – City of Monrovia ........................................................ 33 Figure 4-6 Stormwater Outfall Monitoring Site – Cities of Bradbury and Duarte .................................... 35 Figure 5-1 Non-Stormwater Outfall Program Flow Diagram ................................................................. 39
List of Tables Table ES-1 Water Body-Pollutant Combination Categories ................................................................. viii Table ES-2 Summary of Initial Constituent Categories and Priorities Derived from Conditions Within (X)
the Rio Hondo ................................................................................................................. ix Table ES-3 Summary of Initial Constituent Categories and Priorities Derived from Conditions Within (X)
the Peck Road Park Lake .................................................................................................. ix Table ES-4 Summary of Initial Constituent Categories and Priorities Derived from Conditions Within (X)
the San Gabriel River ....................................................................................................... ix Table ES-5 Non-Stormwater Outfall Screening Process for Los Angeles River WMA Utilizing E. coli to
Determine Significant Non-Stormwater Discharges ............................................................ xv Table ES-6 Non-Stormwater Outfall Screening and Monitoring Program Summary for the San Gabriel
River WMA .................................................................................................................... xvi Table ES-7 Approach for Establishing a Non-Stormwater Outfall Screening Process .............................xvii Table 1-1 RH/SGRWQG EWMP Area Land Use Summary....................................................................... 1 Table 1-2 TMDLs Applicable to the RH/SGRWQG EWMP Area and Downstream Areas ............................ 2 Table 1-3 Category 1 Water Body-Pollutant Combinations with WQBELs ................................................ 3 Table 1-4 RH/SGRWQG TMDLs and Applicability .................................................................................. 4 Table 1-5 Category 1 Pollutants with WQBELs for Discharges to Peck Road Park Lake ............................ 4 Table 1-6 Category 2 Water Body-Pollutant Combinations .................................................................... 5 Table 1-7 Summary of Initial Constituent Categories and Priorities Derived from Conditions Within the
EMWP Area in the LAR WMA .............................................................................................. 6 Table 1-8 Summary of Initial Constituent Categories and Priorities Derived from Conditions Within Peck
Road Park Lake ................................................................................................................. 6 Table 1-9 Summary of Initial Constituent Categories and Priorities Derived from Conditions Within the
EWMP Area in the SGR WMA ............................................................................................. 6 Table 2-1 Summary of RH/SGRWQG Receiving Water Monitoring Sites ................................................ 11 Table 2-2 Rio Hondo LTA Monitoring Site Land Use Comparison ......................................................... 14 Table 2-3 Little Dalton Wash LTA Monitoring Site Land Use Comparison .............................................. 16 Table 2-4 Annual Frequency of Receiving Water Monitoring during Wet- and Dry-Weather Conditions .. 18 Table 2-5 Frequency of Receiving Water Monitoring for Peck Road Park Lake ...................................... 20 Table 3-1 Available Information for MS4 Database ............................................................................. 21 Table 3-2 Information to be Collected for MS4 Database .................................................................... 22 Table 4-1 Santa Anita Wash HUC-12 Stormwater Outfall Monitoring Site Land Use Comparison ............ 26 Table 4-2 Stormwater Outfall Monitoring Site – Santa Anita Wash HUC-12 .......................................... 26 Table 4-3 Big Dalton Wash HUC-12 Stormwater Outfall Monitoring Site Land Use Comparison .............. 28
- iii -

Rio Hondo/San Gabriel River Water Quality Group Coordinated Integrated Monitoring Program
Table 4-4 Stormwater Outfall Monitoring Site – Big Dalton Wash HUC-12 ............................................ 28 Table 4-5 Santa Fe FCB HUC-12 Stormwater Outfall Monitoring Site Land Use Comparison ................... 30 Table 4-6 Stormwater Outfall Monitoring Site – Santa Fe FCB HUC-12 ................................................. 30 Table 4-7 City of Monrovia Stormwater Outfall Monitoring Site Land Use Comparison ........................... 32 Table 4-8 Stormwater Outfall Monitoring Site – City of Monrovia ......................................................... 32 Table 4-9 Cities of Bradbury and Duarte Stormwater Outfall Monitoring Site Land Use Comparison ....... 34 Table 4-10 Stormwater Outfall Monitoring Site – Cities of Bradbury and Duarte ................................... 34 Table 4-11 List of Constituents and Frequency for Stormwater Outfall Monitoring of Drains Discharging to
Respective Water Bodies ................................................................................................. 36 Table 4-12 Summary of Proposed Stormwater Outfall Monitoring Sites in the RH/SGRWQG EWMP Area 37 Table 4-13 RH/SGRWQG Member Represented by Each Stormwater Outfall Monitoring Site ................. 37 Table 5-1 Non-Stormwater Outfall Screening Process for Los Angeles River WMA Utilizing E. coli to
Determine Significant Non-Stormwater Discharges ............................................................ 40 Table 5-2 Non-Stormwater Outfall Screening and Monitoring Program Summary for the San Gabriel River
WMA .............................................................................................................................. 42 Table 5-3 Approach for Establishing a Non-Stormwater Outfall Screening Process ................................ 43 Table 5-4 Summary of Endpoints for Source Identification .................................................................. 45 Table 5-5 List of Constituents for Non-Stormwater Outfall Monitoring .................................................. 48 Table 6-1 Required Data to Track for New Development and Re-Development Projects per Attachment
E.X.A .............................................................................................................................. 49 Table 6-2 Required Data to Track for New Development and Re-Development Projects per Part
VI.D.7.d.iv.(1)(a) ............................................................................................................ 50 Table 6-3 Standard Data Formats ..................................................................................................... 51 Table 8-1 Special Studies from LAR Metals TMDL Being Considered for Implementation ....................... 53 Table 8-2 Special Studies from SGR Metals TMDL Being Considered for Implementation ...................... 53 Table 13-1 Summary of Receiving Water Monitoring Program Objectives ............................................. 65 Table 13-2 Summary of Stormwater Outfall Monitoring Program Objectives ......................................... 65 Table 13-3 Summary of Non-Stormwater Outfall Monitoring Program Objectives .................................. 66
List of Attachments Attachment A: Watershed Management Plan Area Background Attachment B: Monitoring Location Fact Sheets Attachment C: Table E-2 of the Monitoring and Reporting Program Attachment D: Stormwater Outfall Selection Attachment E: Analytical and Monitoring Procedures Appendix 1: Example Field and Chain-of-Custody Forms Attachment F: Chapter 13 QA/QC Data Evaluation from Caltrans Guidance Manual: Stormwater
Monitoring Protocols, 2nd Edition Attachment G: LACFCD Background
- iv -

Rio Hondo/San Gabriel River Water Quality Group Coordinated Integrated Monitoring Program
Acronyms BMP Best Management Practice BPA Basin Plan Amendment CEDEN California Environmental Data Exchange Network CERCLA Comprehensive Environmental Response, Compensation, and Liability Act CIMP Coordinated Integrated Monitoring Program CRAM California Rapid Assessment Method CWA Clean Water Act DDT Dichloro-diphenyl-trichloroethane DO Dissolved Oxygen EIA Effective Impervious Area EO Executive Officer EWMP Enhanced Watershed Management Program FCB Flood Control Basin GIS Geographic Information System HUC Hydrologic Unit Code IC/ID Illicit Connection/Illicit Discharge IMP Integrated Monitoring Program LA Los Angeles LACDPW Los Angeles County Department of Public Works LAR Los Angeles River LARWQCB Los Angeles Regional Water Quality Control Board LRS Load Reduction Strategy LTA Long Term Assessment MRP Monitoring and Reporting Program MS4 Municipal Separate Storm Sewer System NAL Non-Stormwater Action Level NPDES National Pollutant Discharge Elimination System NSW Non-Stormwater OC Organochlorine PAH Polycyclic Aromatic Hydrocarbon PCB Polychlorinated Biphenyl POTW Publicly Owned Treatment Works RAA Reasonable Assurance Analysis RH/SGRWQG Rio Hondo/San Gabriel River Water Quality Group ROWD Report of Waste Discharge RW Receiving Water RWL Receiving Water Limitation SCAG Southern California Association of Governments SCCWRP Southern California Coastal Water Research Project SGR San Gabriel River SGRRMP San Gabriel River Regional Monitoring Program SMC Stormwater Monitoring Coalition
- v -
Rio Hondo/San Gabriel River Water Quality Group Coordinated Integrated Monitoring Program
SQO Sediment Quality Objectives SSC Suspended Sediment Concentration SW Stormwater SWRCB State Water Resources Control Board TDS Total Dissolved Solids TIE Toxicity Identification Evaluation TKN Total Kjeldahl Nitrogen TMDL Total Maximum Daily Load TOC Total Organic Carbon TSS Total Suspended Solids USACE United States Army Corps of Engineers USEPA United States Environmental Protection Agency WBPC Water Body-Pollutant Combination WLA Waste Load Allocation WMA Watershed Management Area WMP Watershed Management Program WQBEL Water Quality-Based Effluent Limitation
- vi -
Rio Hondo/San Gabriel River Water Quality Group Coordinated Integrated Monitoring Program
ES. Executive Summary The National Pollutant Discharge Elimination System (NPDES) Municipal Separate Storm Sewer System (MS4) Permit Order No R4-2012-01751, (Permit) was adopted on November 8, 2012, by the Los Angeles Regional Water Quality Control Board (Regional Board or LARWQCB) and became effective December 28, 2012. The Regional Board adopted the Permit to ensure the MS4s in Los Angeles County do not cause or contribute to exceedances of water quality objectives set to protect the beneficial uses in the receiving waters. The County of Los Angeles (County), Los Angeles County Flood Control District (LACFCD), and the Cities of Arcadia, Azusa, Bradbury, Duarte, Monrovia, and Sierra Madre comprise the Rio Hondo/San Gabriel River Water Quality Group (RH/SGRWQG) formed to address water quality issues in their respective jurisdictions. The RH/SGRWQG has chosen the option of developing an Enhanced Watershed Management Program (EWMP) Plan and Coordinated Integrated Monitoring Program (CIMP) Plan as a path to compliance with the MS4 Permit, functioning as an EWMP Group. The purpose of the CIMP is to specify the approach for meeting the Monitoring and Reporting Program (MRP) Primary Objectives component of the MS4 Permit. The Primary Objectives of the MRP include:
1. Assess the chemical, physical, and biological impacts of discharges from the MS4 on receiving waters.
2. Assess compliance with receiving water limitations (RWLs) and water quality-based effluent limitations (WQBELs) established to implement Total Maximum Daily Load (TMDL) wet-weather and dry-weather waste load allocations (WLAs).
3. Characterize pollutant loads in MS4 discharges. 4. Identify sources of pollutants in MS4 discharges. 5. Measure and improve the effectiveness of pollutant controls implemented under the MS4 Permit.
The CIMP provides a framework for the RH/SGRWQG to implement an effective comprehensive monitoring program. The CIMP is designed to provide the RH/SGRWQG with the information necessary to guide water quality program management decisions, and assess the effectiveness of watershed actions. Additionally, the monitoring will provide a means to measure compliance with the MS4 Permit. The CIMP is composed of five elements, including:
1. Receiving Water Monitoring 2. Stormwater Outfall Monitoring 3. Non-Stormwater Outfall Assessment and Monitoring 4. New Development/Re-Development Effectiveness Tracking 5. Regional Studies
This document provides a discussion of the monitoring locations, constituents, monitoring frequency, and general monitoring approach. The attachments and appendices to this CIMP describe additional background information and detail specific analytical and monitoring procedures that will be used to implement this CIMP. ES.1 Water Quality Priorities The water quality priorities are the combination of a water quality issue, location of concern, and category of the concern. The water quality issue and where it is of concern is the water body-pollutant combination (WBPC). Categories of WBPCs defined in the MS4 Permit with their respective priorities are listed in Table ES-1. Priorities assigned to the WBPC will assist in the scheduling of watershed actions to
1 The Permit was adopted on November 8, 2012, by the Los Angeles Regional Water Quality Control Board (Regional Board) and became effective December 28, 2012.
- vii -

Rio Hondo/San Gabriel River Water Quality Group Coordinated Integrated Monitoring Program
address water quality. Each WBPC will be addressed as part of the EWMP. The CIMP specifies monitoring for each WBPC.
Table ES-1 Water Body-Pollutant Combination Categories Category Priority Water Body-Pollutant Combinations Included
1 Highest Priority WBPCs for which TMDL WLA or RWLs are established.
2 High Priority WBPCs for which data indicate water quality impairment in the receiving water according to the 303(d) list.1
3 Medium Priority WBPCs for which there are insufficient data to indicate impairment in the receiving water, but which exceed applicable RWLs.1
1 Only for pollutants where MS4 discharges may be causing or contributing to receiving water exceedances. Historic monitoring data from within the RH/SGRWQG EWMP area are essentially non-existent. The receiving waters downstream of the EWMP area are monitored; however, the operation of dams, natural channels, and infiltration facilities hydrologically disconnects the EWMP area from the downstream monitoring locations in all conditions other than large storms. The water quality in the downstream reaches generally does not represent the condition of receiving waters in the EWMP area. For the initial prioritization, the downstream monitoring data are not considered. New monitoring locations in the receiving waters at the downstream boundaries of the EWMP area will be monitored for the full list of MRP Table E-2 constituents. Those constituents found to exceed the applicable water quality objectives will be added to the water quality priorities and monitoring program as part of the adaptive management process. Based on the MS4 Permit prioritization categories, WBPCs for the Rio Hondo are presented in Table ES-2. WBPCs for Peck Road Park Lake are listed in Table ES-3. The San Gabriel River WBPCs are compiled in Table ES-4. The MS4 Permit also identifies a second level of prioritization based on whether final WLAs, expressed as WQBELs or RWLs, become effective before the end of the MS4 Permit term on December 28, 2017. Due to the natural rate of infiltration, operation of upstream dams and downstream spreading grounds, the Rio Hondo and San Gabriel River are generally dry with the exception of flows from relatively large storms. CIMP monitoring will be assessed over time to determine whether a connection exists between the upper and lower watershed and under which conditions. As the CIMP is implemented, the monitoring data will be used in an adaptive management process to refine the constituents in the EWMP area that need to remain on or be added to the prioritization. The priorities for the EWMP area were developed considering the area as hydrologically disconnected from areas in the lower watershed. The initial establishment of monitoring locations at the downstream boundaries of the EWMP area and analysis for the constituents in MRP Table E-2 will be a fundamental component of early adaptive management refinements to the water quality priorities and monitoring constituent lists. Water quality conditions identified within the EWMP area are marked with an “X” in the three tables.
- viii -

Rio Hondo/San Gabriel River Water Quality Group Coordinated Integrated Monitoring Program
Table ES-2 Summary of Initial Constituent Categories and Priorities Derived from
Conditions Within (X) the Rio Hondo
Constituent Category 1
TMDLs Highest Priority
Category 2 303(d) Listings
High Priority
Category 3 RWL Exceedances Medium Priority
Copper X Lead X X1 Zinc X Cadmium X Trash X Coliform/Indicator Bacteria2 X X3 Ammonia X Nitrate as N X Nitrite as N X Bis(2-ethylhexyl)phthalate X3 1 Listing on Monrovia Wash upstream of Peck Road Park Lake. 2 Total and Fecal Coliform objectives for fresh water are no longer listed in the Basin Plan. E. coli are the current
indicator for freshwater in the Basin Plan. 3 Listings on Sawpit Wash upstream of Peck Road Park Lake.
Table ES-3 Summary of Initial Constituent Categories and Priorities Derived from
Conditions Within (X) the Peck Road Park Lake
Constituent Category 1
TMDLs Highest Priority
Category 2 303(d) Listings
High Priority
Category 3 RWL Exceedances Medium Priority
Total Nitrogen X Total Phosphorus X Chlordane X DDT X Dieldrin X PCBs X
Table ES-4 Summary of Initial Constituent Categories and Priorities Derived from
Conditions Within (X) the San Gabriel River
Constituent Category 1
TMDLs Highest Priority
Category 2 303(d) Listings
High Priority
Category 3 RWL Exceedances Medium Priority
Lead X Coliform/Indicator Bacteria1 X 1 Total and Fecal Coliform objectives are no longer listed in the Basin Plan. E. coli are the current indicator for
freshwater in the Basin Plan. ES.2 Monitoring Summary Receiving water monitoring is designed to assess whether the water quality objectives are being met in water bodies and if beneficial uses are being supported. Stormwater and non-stormwater outfall monitoring is used to determine if the MS4 is causing or contributing to water quality issues in the receiving water. Additionally, the stormwater and non-stormwater outfall monitoring is used to
- ix -

Rio Hondo/San Gabriel River Water Quality Group Coordinated Integrated Monitoring Program
determine if the discharges are below municipal action levels and action levels specified in Attachment G of the MS4 Permit, respectively. Regional Studies are designed to measure the overall health of a watershed. ES.2.1 Receiving Water Monitoring The objectives of receiving water monitoring are to assess whether RWLs are being achieved, evaluate trends in pollutant concentrations, and determine whether designated beneficial uses are fully supported. WBPCs prioritizations were utilized to support the development of the monitoring approach. To address the MS4 Permit monitoring objectives and priorities, two types of monitoring are proposed, including:
Long Term Assessment – Long Term Assessment (LTA) monitoring is intended to determine if RWLs are achieved, assess trends in pollutant concentrations over time, and determine whether designated uses are supported.
TMDL – TMDL monitoring is conducted to evaluate attainment of or progress in attaining the WLAs.
While not explicitly established in the MRP, the monitoring types distinguish between the different end goals of monitoring for specific constituents within specific water bodies in the RH/SGRWQG area. LTA monitoring provides a long-term record for a robust suite of constituents to understand conditions within the watersheds. TMDL monitoring addresses TMDL related constituents and provides monitoring locations to assess other identified exceedances of RWLs determined through data analysis. Requirements in the MRP include receiving water monitoring sites at previously designated mass emission stations, TMDL receiving water compliance points, and additional receiving water locations representative of the impacts from MS4 discharges. A previously designated mass emission station is not located within the RH/SGRWQG area. The RH/SGRWQG area comprises a small portion of the total area draining to the mass emission station located in Reach 2 of the San Gabriel River (S14). The water quality at S14 is not necessarily reflective of potential contributions from MS4 discharges in the EWMP area. Data from S14 will not be used to directly assess the EWMP area. For the Rio Hondo portion of the watershed, the designated mass emission station in Reach 1 of the Los Angeles River (S10) is located a great distance from the RH/SGRWQG area and has a total upstream drainage area of 825 square miles. Monitoring at the S10 mass emission station will not be beneficial for the RH/SGRWQG because the group’s contribution to conditions at the S10 mass emission station is negligible. A tributary monitoring station is located in Rio Hondo (TS06); however, this station was only operated for two years, will not be operated in the future, and is not a previously designated mass emission station. Monitoring at the TS06 tributary station will not be beneficial for the RH/SGRWQG. To meet the requirements in the MRP, monitoring at TMDL receiving water compliance points and additional receiving water locations representative of the impacts from MS4 discharges is proposed. Proposed LTA and TMDL monitoring locations for the RH/SGRWQG are shown on Figure ES-1.
- x -

Rio Hondo/San Gabriel River Water Quality Group Coordinated Integrated Monitoring Program
Figure ES-1 RH/SGRWQG EWMP Receiving Water Sites
- xi -

Rio Hondo/San Gabriel River Water Quality Group Coordinated Integrated Monitoring Program
ES.2.2 Stormwater Outfall Monitoring Five stormwater outfall monitoring sites are identified for the group members participating in the RH/SGRWQG EWMP. The drainage areas for the outfalls may cover multiple jurisdictional boundaries. The stormwater outfall monitoring sites and the land uses within the EWMP area are presented in Figure ES-2. The selected sites are generally representative of the land uses within their respective 12-digit Hydrologic Unit Code (HUC-12) equivalent area. Two sites were specifically selected as representative of the major HUC-12s in the EWMP area. One site was selected with nearly all residential land use in the catchment area. In lieu of a receiving water site, two outfall sites discharging to the San Gabriel River Reach 5 were selected to assess the potential MS4 contribution to the reach as that section of the river is soft bottom allowing small to moderate storms and dry-weather flows to completely infiltrate, and upstream flow is predominately captured by upstream dams and diversions. The data collected at the monitored outfalls will be considered representative of MS4 discharge within the respective HUC-12. Compliance with WQBELs and RWLs may be based on comingled discharges or data not collected within a given jurisdiction. However, outfalls located in one Watershed Management Area (WMA) will not be used as the basis for compliance in the other WMA.
- xii -

Rio Hondo/San Gabriel River Water Quality Group Coordinated Integrated Monitoring Program
Figure ES-2 Stormwater Outfall Monitoring Sites
- xiii -

Rio Hondo/San Gabriel River Water Quality Group Coordinated Integrated Monitoring Program
ES.2.3 Non-Stormwater Outfall Screening and Monitoring The Non-Stormwater Outfall Screening and Monitoring Program focuses on dry-weather discharges to receiving waters from major outfalls. The program fills two roles, the first is to provide assessment of whether the non-stormwater discharges are potentially impacting the receiving water, and the second is to determine whether significant non-stormwater discharges are allowable. The non-stormwater outfall program is complimentary to the Illicit Connection/Illicit Discharge minimum control measure. Non-stormwater outfall monitoring sites will be determined after the screening events are completed and an inventory of outfalls is created. Constituents monitored at each non-stormwater outfall site will depend upon the receiving water that the outfall drains to. For the Rio Hondo portion of the RH/SGRWQG area, of the constituents addressed by TMDLs for which WQBELs and RWLs were incorporated into the MS4 Permit, E. coli consistently exceeds RWLs. All other TMDL-related WQBELs and RWLs are primarily associated with wet-weather discharges. Additionally, the Los Angeles River (LAR) Bacteria TMDL Basin Plan Amendment requires Permittees to conduct outfall monitoring. The proposed non-stormwater monitoring for the Los Angeles River WMA is integrated with the LAR Bacteria TMDL monitoring requirements. The non-stormwater monitoring sites are to be determined through the non-stormwater outfall screening and source identification process required by the MS4 Permit. E. coli loading is proposed as the primary characteristic for determining significant non-stormwater discharges for drains in the Rio Hondo Watershed. Additionally, by monitoring E. coli and flow in the non-stormwater discharge, respective jurisdictions will have the information necessary to develop a load reduction strategy (LRS) as prescribed in the LAR Bacteria TMDL. The characteristics for defining significant non-stormwater discharges are intended to align with LRS requirements. The top 10th percentile of loading is being used as a threshold for significant non-stormwater discharge and thereby inclusion in the LRS. Table ES-5 contains a summary of the approach.
- xiv -

Rio Hondo/San Gabriel River Water Quality Group Coordinated Integrated Monitoring Program
Table ES-5 Non-Stormwater Outfall Screening Process for Los Angeles River WMA
Utilizing E. coli to Determine Significant Non-Stormwater Discharges Component Description
Characteristics for Defining Significant Non-Stormwater Discharges
To be consistent with the top dectile of discharges as discussed in the Load Reduction Strategy outlined in the LA River Bacteria TMDL, the top 10% of the ranked outfalls will be determined as significant non-stormwater discharges. The ranking score is the sum of the following three ranking criteria: Does the non-stormwater discharge reach the receiving water
during dry-weather? If yes, continue through the ranking criteria.
E. coli loading rate: for each outfall monitored during the Non-Stormwater Outfall Screening Process, the average E. coli loading rate from the six outfall surveys will be calculated. The average E. coli loading rates from all outfalls will be ranked from highest to lowest. A ranking score will be applied to each outfall based on the decitile (10th percentile, 20th percentile, etc.,) of its average E. coli loading rate.
Number of dry-weather exceedance days at the nearest downstream receiving water site: a ranking score will also be applied to outfalls based on the number of dry-weather exceedance days exhibited at the nearest downstream receiving water site. The total number of dry-weather (summer dry- and winter-dry) exceedance days during the Non-Stormwater Outfall Screening Process will be used. Each receiving water site will be ranked from highest to lowest based on the total number of exceedance days.
Data Collection Data that will need to be collected include accurate flow measurements AND E. coli. Additionally, information needed to complete the inventory will be collected.
Frequency
The data will be collected for a total of six events. Three times as part of the initial screening process. The remaining three monitoring events to meet the requirements of the LAR Bacteria TMDL will be completed as part of the non-stormwater outfall monitoring.
Timeline It is proposed that commencement of the screening process occur in 2014.
- xv -

Rio Hondo/San Gabriel River Water Quality Group Coordinated Integrated Monitoring Program
A summary of the approach to address the MS4 Permit specified elements of the Non-Stormwater Outfall Program for the San Gabriel River WMA is presented in Table ES-6. Table ES-6 Non-Stormwater Outfall Screening and Monitoring Program Summary
for the San Gabriel River WMA Element Description Implementation Dates
Outfall Screening
A screening process will be implemented to collect data for determining which outfalls exhibit significant non-stormwater discharges.
The screening process will begin in 2014.
Identification of outfalls with significant non-stormwater discharge
Based on data collected during the Outfall Screening process, identify significant non-stormwater discharges.
Inventory of outfalls with non-stormwater discharge
Develop an inventory of major MS4 outfalls with known significant non-stormwater discharges and those requiring no further assessment.
Prioritized source investigation
Use the data collected during the screening process to prioritize outfalls for source investigations.
Identify sources of significant non-stormwater discharges
Perform source investigations per the prioritization schedule. If not exempt or unknown, determine abatement process.
Source investigations will be conducted for at least 25% of the significant non-stormwater discharges by the end of December 28, 2015, and 100% by December 28, 2017.
Monitoring non-stormwater discharges exceeding criteria
Monitor outfalls that are determined to convey significant non-stormwater discharges comprised of either unknown or non-essential conditionally exempt non-stormwater discharges, or continuing discharges attributed to illicit discharges.
First regularly scheduled dry-weather monitoring event after completing the source investigation or after the CIMP is approved by the Executive Officer, whichever is later.
To collect data to determine the significant non-stormwater outfalls, the RH/SGRWQG will perform three dry-weather screenings. The initial screening provides the dual purpose of data collection for completing the outfall database and initial evaluation of outfalls. Each outfall in the RH/SGRWQG area will be visited during the first screening. A standard form will be used to collect characteristic data, consisting of:
Channel bottom, visual estimate of flow rate; Whether discharge ponds in the channel or reaches a flowing receiving water; Clarity; and Presence of odors and foam.
Additionally, outstanding information for the MS4 inventory database will be collected, including, at a minimum, geographically referenced photographs. Flow rates will be identified as: no flow, trickle, more than a trickle. On the second and third screenings, drains larger than 12 inches in diameter and equivalent rectangular shaped will be investigated. Where discharge is present at least two of the three visits, the flow rates will be ranked and used as one metric in the significance determination. An analysis of land use and permitted discharges will be considered in addition to the data collected from the three screenings to evaluate the non-stormwater flows and determine which are significant. The screening process is outlined in Table ES-7.
- xvi -

Rio Hondo/San Gabriel River Water Quality Group Coordinated Integrated Monitoring Program
Table ES-7 Approach for Establishing a Non-Stormwater Outfall Screening
Process Component Description
Data Collection
Data include flow measurements, channel bottom, ponding of discharge, clarity, color, odor, foam, and standard field parameters. Land use and permitted dischargers will be considered in the evaluation with field data to determine significant non-stormwater discharge.
Frequency
Three assessments will be conducted as part of the initial screening process. The first screening will collect visual information on all drains. The second and third screenings will collect visual data from flowing drains greater than 12 inches in diameter.
Defining Significant Discharges
Perform GIS analysis and screen out drains between 12 and 36 inches in diameter that are not associated with industrial land use. Assess the flow rate for each outfall. Visual for the first, and measured on each additional visit. For outfalls where the flow was observed on two visits, rank the flow from highest to lowest. Including consideration of characteristic data and land use information if appropriate to determine list of significant non-stormwater discharges.
Timeline The non-stormwater outfall screening process will begin implementation in 2014.
ES.3 New Development and Re-Development Effectiveness Tracking Group members are required to maintain databases to track specific information related to new and re-development projects subject to the minimum control measures. The data will be used to assess the effectiveness of the Low Impact Development (LID) requirements for land development and to fulfill reporting requirements. Although internal procedures will vary, the development review process is generally consistent across group members. The process begins with review of the project application and issuance of entitlements by planning staff, technical review of the project design by engineering experts, oversight of construction by inspections staff, and follow up to ensure continued operation and maintenance by stormwater staff. Relevant project data is collected during each phase of the process. Although the data reporting requirements apply to all EWMP group members, the procedures for reviewing projects, tracking data, and reporting are different for each member and may even be different across departments within a given jurisdiction. With internal processes, procedures, and types of projects varying between individual group members, internal protocols to ensure that the required data will be tracked are provided in the CIMP. To facilitate internal discussions and the development of specific protocols, the CIMP provides a data template that will help standardize data collection so all group members will have the requisite data available for annual report production. Each group member is likely to develop a system for tracking and recording the new development and re-development effectiveness data, and will submit separate annual reports.
- xvii -

Rio Hondo/San Gabriel River Water Quality Group Coordinated Integrated Monitoring Program
ES.4 Regional Studies The LACFCD will continue to participate in the Regional Watershed Monitoring Program (Bioassessment Program) being managed by the Southern California Stormwater Monitoring Coalition (SMC). The SMC is the only regional study identified in the MRP. The LACFCD will contribute necessary resources to implement the bioassessment monitoring requirement of the MS4 Permit on behalf of all Permittees in Los Angeles County during the current permit cycle. Initiated in 2008, the SMC’s Regional Bioassessment Program is designed to run over a five-year cycle. Monitoring under the first cycle concluded in 2013, with reporting of findings and additional special studies planned to occur in 2014. SMC, including the LACFCD, is currently working on designing the bioassessment monitoring program for the next five-year cycle, which is scheduled to run from 2015 to 2019. ES.5 Watershed Coordination Opportunities exist to coordinate with other watershed management groups for receiving water monitoring. The CIMP is written to outline the monitoring requirements to assess the RH/SGRWQG MS4. Coordination with other watershed management groups will occur where data from other programs may be used to fulfill RH/SGRWQG requirements. The EWMP Group is coordinating with downstream monitoring groups in both the Los Angeles River WMA and San Gabriel River WMA to cost share Harbors Toxics TMDL monitoring. Additionally, as opportunities present themselves to coordinate with other Groups or Cities, the EMWP Group will do so where deemed agreeable with the parties involved. ES.6 CIMP Implementation Schedule Beginning July 1, 2015, or within 90 days of CIMP approval, whichever is later, sample collection for all constituents at all dry-weather receiving water sites will commence. The remaining monitoring will be affected by the feasibility of collecting a sample within 90 days of CIMP approval. The two primary factors affecting the feasibility of sample collection upon approval of this CIMP relate to (1) autosampler installation and (2) monitoring that is dependent upon prerequisite information (e.g., monitoring of significant non-stormwater discharges). The process for installing autosamplers includes numerous tasks that require multiple agency coordination for contracting, permitting, procurement, and installation. Additionally, while each proposed site was visited to ensure feasibility, none of the sites were observed under storm condition. Unforeseen issues with the selected sites, such as backwatering of the receiving water into an outfall leading to an unrepresentative sample, or flooding resulting in unsafe conditions, may lead to relocation of the site. Phasing in the receiving water and stormwater outfall sites outlined in the CIMP will allow evaluation of the sites to determine if any need to be changed due to significant contributions from non-MS4 sources or other reasons that sampling is not feasible at a site requiring an alternate or new site. Below is the proposed phasing schedule, to be adjusted as required due to permitting, procurement, and site suitability. Phase I of the CIMP implementation, Fiscal Year 2014-2015:
Non-stormwater screening Determination of significant non-stormwater outfalls Installation of LTA sites on Rio Hondo and Little Dalton Wash Installation of stormwater outfall sites on Bradbury Drain and BI 0025 Peck Road Drain
- xviii -

Rio Hondo/San Gabriel River Water Quality Group Coordinated Integrated Monitoring Program
Phase II of the CIMP implementation, Fiscal Year 2015-2016 (assuming CIMP approved by July 1, 2015):
Installation of stormwater outfall sites on BI 0602 – Line B and BI 1219 – Line C Dry-weather monitoring at all receiving water locations Dry-weather monitoring where source identification of significant non-stormwater outfalls is
completed and monitoring is required Stormwater monitoring at existing and new sites Initiate Peck Road Park Lake monitoring (water column, sediment, and fish tissue)
Phase III of the CIMP implementation, Fiscal Year 2016-2017 (assuming CIMP approved by July 1, 2015):
Installation of TMDL receiving water site on Sawpit Wash Installation of stormwater outfall site on Beatty Canyon Dry-weather monitoring at all receiving water locations Dry-weather monitoring where source identification of significant non-stormwater outfalls is
completed and monitoring is required Stormwater monitoring at existing and new sites Peck Road Park Lake monitoring (water column and sediment)
Phase IV of the CIMP implementation, Fiscal Year 2017-2018 (assuming CIMP approved by July 1, 2015):
Installation of TMDL receiving water site on Santa Anita Wash Dry-weather monitoring at all receiving water locations Dry-weather monitoring where source identification of significant non-stormwater outfalls is
completed and monitoring is required Stormwater monitoring at existing and new sites Peck Road Park Lake monitoring (water column and sediment)
In years following Fiscal Year 2017-2018, assuming timely CIMP approval and no unforeseen major complications, all currently planned stations will be installed and monitoring will proceed as specified in the CIMP. The non-stormwater outfall monitoring will progress as source identifications progress for the significant discharges, where appropriate. After the discharge quality for Santa Anita and Sawpit Washes are established, the water quality may be determined to be statistically similar, in which case the EWMP Group may choose to alternate between sites on an annual basis in subsequent Fiscal Years. ES.7 Adaptive Management The monitoring specified in the CIMP is, in part, dynamic. The specified list of constituents is based on water quality issues identified in downstream water bodies. If the analysis of collected data results in currently identified constituents proven to not be an issue in the EWMP area water bodies, the group members will request that the Regional Board allow those constituents to be removed from the monitoring. Likewise, if new constituents are identified, they will be added to the ongoing monitoring. The monitoring results will be evaluated annually against appropriate triggers and constituents added or removed as appropriate. The results from monitoring are meant to tie into the EWMP as feedback for the water quality changes resulting from control measures implemented by the group members.
- xix -

Rio Hondo/San Gabriel River Water Quality Group Coordinated Integrated Monitoring Program
1. Introduction The National Pollutant Discharge Elimination System (NPDES) Municipal Separate Storm Sewer System (MS4) Permit No. R4-2012-0175 (Permit) was adopted November 8, 2012, by the Los Angeles Regional Water Quality Control Board (Regional Board) and became effective December 28, 2012. The purpose of the MS4 Permit is to ensure the MS4s in Los Angeles County are not causing or contributing to exceedances of water quality objectives set to protect the beneficial uses in the receiving waters. Included as Attachment E to the MS4 Permit are requirements for a Monitoring and Reporting Program (MRP). The stated Primary Objectives for the MRP, listed in Part II.A.1 of the MRP, are as follows:
1. Assess the chemical, physical, and biological impacts of discharges from the MS4 on receiving waters.
2. Assess compliance with receiving water limitations (RWLs) and water quality-based effluent limitations (WQBELs) established to implement Total Maximum Daily Load (TMDL) wet-weather and dry-weather waste load allocations (WLAs).
3. Characterize pollutant loads in MS4 discharges. 4. Identify sources of pollutants in MS4 discharges. 5. Measure and improve the effectiveness of pollutant controls implemented under the MS4 Permit.
Extensive default monitoring requirements are specified in the MRP. However, the Permittees have the option to develop a Coordinated Integrated Monitoring Program (CIMP) that may be used to specify alternative approaches for meeting the Primary Objectives. Additionally, the CIMP is the vehicle to customize TMDL monitoring requirements and other historical monitoring program requirements, to unify efforts on a watershed scale, and provide consistent and comparable water quality observations throughout the watershed. Modifications to the MRP or TMDL monitoring requirements must satisfy the Primary Objectives and require sufficient justification to allow the changes. The Regional Board Executive Officer (EO) will provide final approval of the CIMP. Modifications to the MRP require sufficient justification for EO approval. 1.1 Rio Hondo/San Gabriel River Water Quality Group Enhanced
Watershed Management Program Area The Rio Hondo/San Gabriel River Water Quality Group (RH/SGRWQG) Enhanced Watershed Management Program (EWMP) Group is comprised of the County of Los Angeles (County), Los Angeles County Flood Control District (LACFCD), and the Cities of Arcadia, Azusa, Bradbury, Duarte, Monrovia, and Sierra Madre. The EWMP area is located in both the Los Angeles River (LAR) and San Gabriel River (SGR) Watershed Management Areas (WMAs), within Los Angeles County, as shown on the location map in Figure 1-1. The RH/SGRWQG is addressing receiving water and MS4 water quality through an EWMP Plan and CIMP process. The group’s jurisdictional boundaries and receiving water bodies are shown on Figure 1-2. Size and land uses for the group members are listed in Table 1-1.
- 1 -

Rio Hondo/San Gabriel River Water Quality Group Coordinated Integrated Monitoring Program
Figure 1-1 Location of the EWMP Group within the Los Angeles Basin
- 2 -

Rio Hondo/San Gabriel River Water Quality Group Coordinated Integrated Monitoring Program
Figure 1-2 Water Bodies and Geographic Boundary of the RH/SGRWQG
- 3 -

Rio Hondo/San Gabriel River Water Quality Group Coordinated Integrated Monitoring Program
Table 1-1 RH/SGRWQG EWMP Area Land Use Summary Land Use Category Area1 (square miles) Percentage
Agriculture 1.1 3 Commercial 3.5 8 Education 1.1 3 Industrial 2.8 7 Multi-Family (MF) Residential 2.8 7 Single Family (SF) Residential 19.3 47 Transportation 0.7 1 Vacant 9.9 24 Total 41.2 100
1 Does not include areas of Angeles National Forest within Group Member jurisdictional boundaries. The area included in the RH/SGRWQG EWMP encompass approximately 41 square miles of predominately residential and open space land use and excludes areas in the Angeles National Forest. Of the total LAR and SGR Watershed areas, the RH/SGRWQG members have jurisdiction over four and three percent of the total watersheds, respectively. The RH/SGRWQG is located in the eastern portion of the LAR WMA and the upper portion of the urban SGR WMA. The LAR receives drainage from an 834-square mile area of central and eastern Los Angeles County and extends 55 miles across urbanized areas of the San Fernando and west San Gabriel Valleys. Its headwaters originate in the Santa Susana Mountains. The LAR flows through residential, commercial, and industrial areas before emptying into the LAR estuary, San Pedro Bay, and ultimately the Pacific Ocean. The Rio Hondo is a major tributary of the Los Angeles River. The Rio Hondo Watershed is approximately 142 square miles in area. The Rio Hondo and its subwatersheds have headwaters in the undeveloped mountains of the Angeles National Forest. The RH/SGRWQG Permittees receive drainage via several smaller tributary washes and Rio Hondo Reach 3 discharges are flow-controlled at Peck Road Park Lake. The Cities of Arcadia and Sierra Madre, and Unincorporated County areas; and portions of the Cities of Bradbury and Duarte discharge to the Rio Hondo Watershed. Several San Gabriel Mountain canyons join Santa Anita and Sawpit Washes which drain to Peck Road Water Conservation Park (Peck Road Park Lake) and subsequently the Rio Hondo. Peck Road Park Lake is owned by the LACFCD and maintained by the Los Angeles County Department of Parks and Recreation. The SGR receives drainage from a 682-square mile area of eastern Los Angeles County and has a main channel length of approximately 58 miles. Its headwaters originate in the San Gabriel Mountains with the East, West, and North Forks. The SGR flows through residential, commercial, and industrial areas before emptying into the SGR estuary, between the Cities of Seal Beach and Long Beach, San Pedro Bay, and ultimately the Pacific Ocean. The San Gabriel River above Santa Fe Dam, Reach 5, receives drainage from the RH/SGRWQG Permittees. Also, Reach 4 of the San Gabriel River, between Ramona Road and Santa Fe Dam, forms a section of the boundary for the EWMP area, but it does not appear as if the RH/SGRWQG Permittees’ MS4 discharges directly discharge to this water body. The City of Azusa and Unincorporated County areas; and portions of the Cities of Bradbury and Duarte discharge to the San Gabriel River Watershed. Approximately four miles below the mouth of the San Gabriel Canyon is the Santa Fe Dam and Reservoir, which is operated and maintained by the United States Army Corps of Engineers (USACE). Both the Rio Hondo and San Gabriel River flow through portions of the Whittier Narrows Reservoir and may merge behind the reservoir during large storm events. Minor SGR flows may be diverted by a ditch within the reservoir to the Rio Hondo.
- 1 -
Rio Hondo/San Gabriel River Water Quality Group Coordinated Integrated Monitoring Program
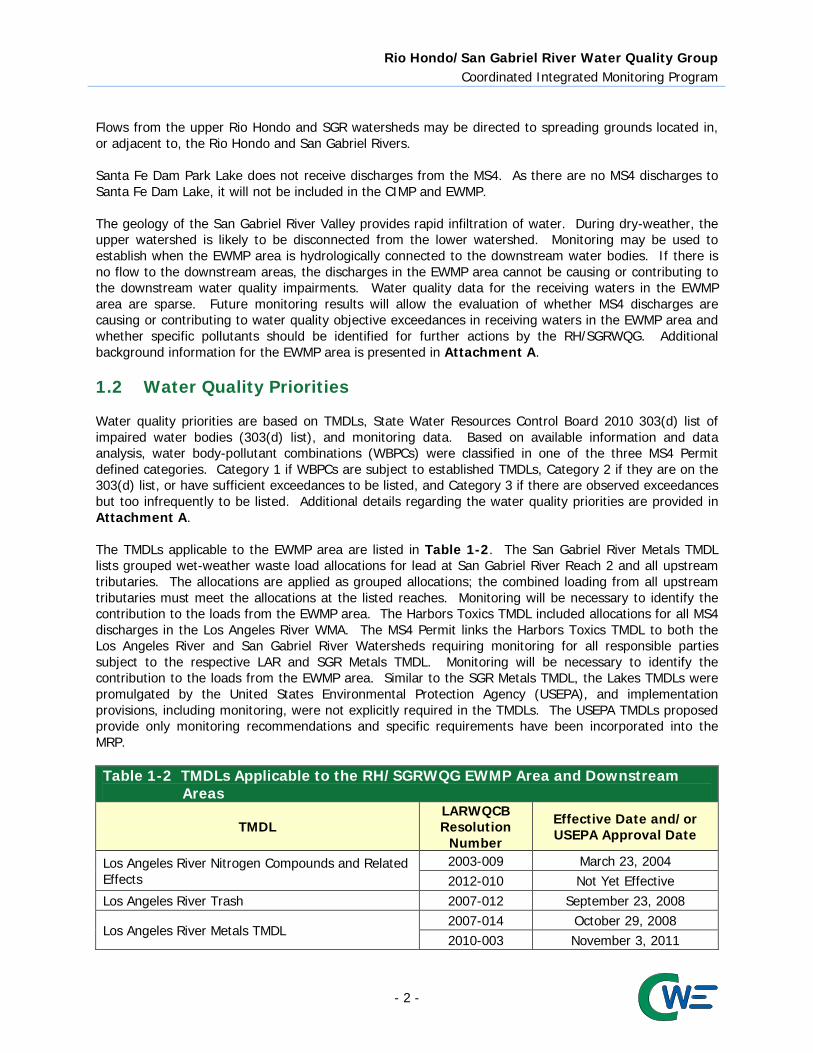
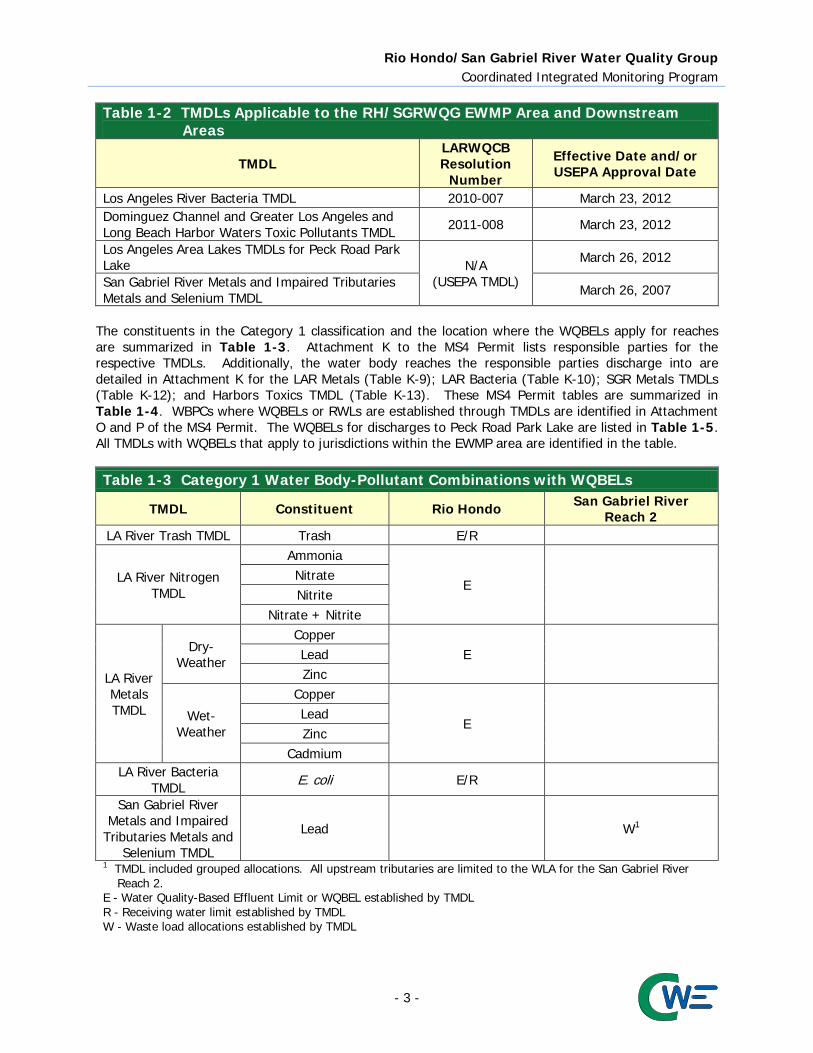
Flows from the upper Rio Hondo and SGR watersheds may be directed to spreading grounds located in, or adjacent to, the Rio Hondo and San Gabriel Rivers. Santa Fe Dam Park Lake does not receive discharges from the MS4. As there are no MS4 discharges to Santa Fe Dam Lake, it will not be included in the CIMP and EWMP. The geology of the San Gabriel River Valley provides rapid infiltration of water. During dry-weather, the upper watershed is likely to be disconnected from the lower watershed. Monitoring may be used to establish when the EWMP area is hydrologically connected to the downstream water bodies. If there is no flow to the downstream areas, the discharges in the EWMP area cannot be causing or contributing to the downstream water quality impairments. Water quality data for the receiving waters in the EWMP area are sparse. Future monitoring results will allow the evaluation of whether MS4 discharges are causing or contributing to water quality objective exceedances in receiving waters in the EWMP area and whether specific pollutants should be identified for further actions by the RH/SGRWQG. Additional background information for the EWMP area is presented in Attachment A. 1.2 Water Quality Priorities Water quality priorities are based on TMDLs, State Water Resources Control Board 2010 303(d) list of impaired water bodies (303(d) list), and monitoring data. Based on available information and data analysis, water body-pollutant combinations (WBPCs) were classified in one of the three MS4 Permit defined categories. Category 1 if WBPCs are subject to established TMDLs, Category 2 if they are on the 303(d) list, or have sufficient exceedances to be listed, and Category 3 if there are observed exceedances but too infrequently to be listed. Additional details regarding the water quality priorities are provided in Attachment A. The TMDLs applicable to the EWMP area are listed in Table 1-2. The San Gabriel River Metals TMDL lists grouped wet-weather waste load allocations for lead at San Gabriel River Reach 2 and all upstream tributaries. The allocations are applied as grouped allocations; the combined loading from all upstream tributaries must meet the allocations at the listed reaches. Monitoring will be necessary to identify the contribution to the loads from the EWMP area. The Harbors Toxics TMDL included allocations for all MS4 discharges in the Los Angeles River WMA. The MS4 Permit links the Harbors Toxics TMDL to both the Los Angeles River and San Gabriel River Watersheds requiring monitoring for all responsible parties subject to the respective LAR and SGR Metals TMDL. Monitoring will be necessary to identify the contribution to the loads from the EWMP area. Similar to the SGR Metals TMDL, the Lakes TMDLs were promulgated by the United States Environmental Protection Agency (USEPA), and implementation provisions, including monitoring, were not explicitly required in the TMDLs. The USEPA TMDLs proposed provide only monitoring recommendations and specific requirements have been incorporated into the MRP. Table 1-2 TMDLs Applicable to the RH/SGRWQG EWMP Area and Downstream
Areas
TMDL LARWQCB Resolution
Number
Effective Date and/or USEPA Approval Date
Los Angeles River Nitrogen Compounds and Related Effects
2003-009 March 23, 2004 2012-010 Not Yet Effective
Los Angeles River Trash 2007-012 September 23, 2008
Los Angeles River Metals TMDL 2007-014 October 29, 2008 2010-003 November 3, 2011
- 2 -
Rio Hondo/San Gabriel River Water Quality Group Coordinated Integrated Monitoring Program
Table 1-2 TMDLs Applicable to the RH/SGRWQG EWMP Area and Downstream
Areas
TMDL LARWQCB Resolution
Number
Effective Date and/or USEPA Approval Date
Los Angeles River Bacteria TMDL 2010-007 March 23, 2012 Dominguez Channel and Greater Los Angeles and Long Beach Harbor Waters Toxic Pollutants TMDL 2011-008 March 23, 2012
Los Angeles Area Lakes TMDLs for Peck Road Park Lake N/A
(USEPA TMDL)
March 26, 2012
San Gabriel River Metals and Impaired Tributaries Metals and Selenium TMDL March 26, 2007
The constituents in the Category 1 classification and the location where the WQBELs apply for reaches are summarized in Table 1-3. Attachment K to the MS4 Permit lists responsible parties for the respective TMDLs. Additionally, the water body reaches the responsible parties discharge into are detailed in Attachment K for the LAR Metals (Table K-9); LAR Bacteria (Table K-10); SGR Metals TMDLs (Table K-12); and Harbors Toxics TMDL (Table K-13). These MS4 Permit tables are summarized in Table 1-4. WBPCs where WQBELs or RWLs are established through TMDLs are identified in Attachment O and P of the MS4 Permit. The WQBELs for discharges to Peck Road Park Lake are listed in Table 1-5. All TMDLs with WQBELs that apply to jurisdictions within the EWMP area are identified in the table. Table 1-3 Category 1 Water Body-Pollutant Combinations with WQBELs
TMDL Constituent Rio Hondo San Gabriel River Reach 2
LA River Trash TMDL Trash E/R
LA River Nitrogen TMDL
Ammonia
E Nitrate Nitrite
Nitrate + Nitrite
LA River Metals TMDL
Dry-Weather
Copper E Lead
Zinc
Wet-Weather
Copper
E Lead Zinc
Cadmium LA River Bacteria
TMDL E. coli E/R
San Gabriel River Metals and Impaired
Tributaries Metals and Selenium TMDL
Lead W1
1 TMDL included grouped allocations. All upstream tributaries are limited to the WLA for the San Gabriel River Reach 2.
E - Water Quality-Based Effluent Limit or WQBEL established by TMDL R - Receiving water limit established by TMDL W - Waste load allocations established by TMDL
- 3 -

Rio Hondo/San Gabriel River Water Quality Group Coordinated Integrated Monitoring Program
Table 1-4 RH/SGRWQG TMDLs and Applicability
RH/SGRWQG Member
LAR
Wat
ersh
ed T
rash
TM
DL
LAR
Nit
roge
n C
ompo
unds
an
d R
elat
ed E
ffec
ts T
MD
L
LAR
and
Tri
buta
ries
M
etal
s TM
DL
LAR
Wat
ersh
ed
Bac
teri
a TM
DL
Los
Ang
eles
Are
a La
kes
TMD
Ls f
or P
eck
Roa
d P
ark
Lake
Dom
ingu
ez C
han
nel
and
Gre
ater
Lo
s A
ngel
es a
nd
Long
Bea
ch H
arbo
r W
ater
s To
xics
TM
DL1
SGR
and
Im
pair
ed
Trib
utar
ies
Met
als
and
Sele
nium
TM
DL
Arcadia X X X X X X Azusa X Bradbury X X X X X X Duarte X X X X X X Monrovia X X X X X X Sierra Madre X X X X X County of Los Angeles X X X X X X X LACFCD X X X X X X 1 The Cities of Arcadia, Azusa, Bradbury, Duarte, Monrovia, and Sierra Madre have a TMDL obligation to monitor
at the mouth of the Los Angeles River and San Gabriel River Estuaries for the Dominguez Channel and Greater Los Angeles and Long Beach Harbor Waters Toxics TMDL.
Table 1-5 Category 1 Pollutants with WQBELs for Discharges to Peck Road Park
Lake
Constituent Water Column Suspended Sediment Fish Tissue
Total Nitrogen W Total Phosphorus W Trash W Total PCB W W Alt Total Chlordane W W Alt Dieldrin W W Alt Total DDT1 W Alt 1 Total DDT measured in suspended sediment, 4-4’ DDT measured in water column. W = Waste Load Allocation established by TMDL. Alt = Alternative compliance options if fish tissue targets are met.
- 4 -

Rio Hondo/San Gabriel River Water Quality Group Coordinated Integrated Monitoring Program
WBPCs on the State Water Resources Control Board’s (SWRCB) 2010 Clean Water Act Section 303(d) list that are not already addressed by a TMDL or other action are included as Category 2. All listings within the EWMP area were identified and included to acknowledge that discharges from upstream reaches could impact the listed area, particularly during wet-weather. However, a constituent included in the table does not infer MS4 discharges from the EWMP area contribute to the downstream impairment. The 303(d) listing and location of the listing are summarized in Table 1-6.
Table 1-6 Category 2 Water Body-Pollutant Combinations
Constituent Sawpit Wash Monrovia Wash
Lead L Indicator Bacteria L Bis(2-ethylhexyl)phthalate L L = Listed on 2010 303(d) list.
Historic monitoring data from within the RH/SGRWQG EWMP area are essentially non-existent. The receiving waters downstream of the EWMP area are monitored; however, the operation of dams, natural channels, and infiltration facilities hydrologically disconnects the EWMP area from the downstream monitoring locations in all conditions other than large storms. The water quality in the downstream reaches may not be representative of the receiving waters condition in the EWMP area. For the initial prioritization, the downstream monitoring data are not considered. New monitoring locations in the receiving waters at the downstream boundaries of the EWMP area will be monitored for the full list of MRP Table E-2 constituents. Those constituents found to exceed the applicable water quality objectives will be added to the water quality priorities and monitoring program as part of the adaptive management process. Based on the MS4 Permit prioritization categories, WBPCs for the Rio Hondo are presented in Table 1-7. WBPCs for Peck Road Park Lake are listed in Table 1-8. The San Gabriel River WBPCs are compiled in Table 1-9. The MS4 Permit also identifies a second level of prioritization based on whether final WLAs, expressed as WQBELs or RWLs, become effective before the end of the MS4 Permit term on December 28, 2017. Due to the natural rate of infiltration, the Rio Hondo and San Gabriel River are generally dry with the exception of storm flows. CIMP monitoring will be assessed over time to determine whether a connection exists between the upper and lower watershed during dry and minor storm events. As the CIMP is implemented, the monitoring data will be used in an adaptive management process to refine the constituents in the EWMP area that need to remain on or be added to the prioritization. The initial establishment of monitoring locations at the downstream boundaries of the EWMP area and analysis for the constituents in MRP Table E-2 will be a fundamental component of early adaptive management refinements to the water quality priorities and monitoring constituent lists. Water quality conditions identified within the EWMP area are marked with an “X” in the three tables.
- 5 -

Rio Hondo/San Gabriel River Water Quality Group Coordinated Integrated Monitoring Program
Table 1-7 Summary of Initial Constituent Categories and Priorities Derived from
Conditions Within the EMWP Area in the LAR WMA
Constituent Category 1
TMDLs Highest Priority
Category 2 303(d) Listings
High Priority
Category 3 RWL Exceedances Medium Priority
Copper X Lead X X1 Zinc X Cadmium X Trash X Coliform/Indicator Bacteria2 X X3 Ammonia X Nitrate X Nitrite X Bis(2-ethylhexyl)phthalate X3 1 Listing on Monrovia Canyon Creek a tributary of Sawpit Wash. 2 Total and Fecal Coliform objectives for fresh water are no longer listed in the Basin Plan. E. coli are the current
indicator for freshwater in the Basin Plan. 3 Listings on Sawpit Wash upstream of Peck Road Park Lake.
Table 1-8 Summary of Initial Constituent Categories and Priorities Derived from
Conditions Within Peck Road Park Lake
Constituent Category 1
TMDLs Highest Priority
Category 2 303(d) Listings
High Priority
Category 3 RWL Exceedances Medium Priority
Total Nitrogen X Total Phosphorus X Chlordane X DDT X Dieldrin X PCBs X
Table 1-9 Summary of Initial Constituent Categories and Priorities Derived from
Conditions Within the EWMP Area in the SGR WMA
Constituent Category 1
TMDLs Highest Priority
Category 2 303(d) Listings
High Priority
Category 3 RWL Exceedances Medium Priority
Lead X Coliform/Indicator Bacteria1 X 1 Total and Fecal Coliform objectives are no longer listed in the Basin Plan. E. coli are the current indicator for
freshwater in the Basin Plan. 1.3 CIMP Overview The primary purpose of the CIMP document is to outline the process for collecting data to meet the goals and requirements of the MS4 Permit. The CIMP provides information on sample collection and analysis methodologies relevant to monitoring receiving waters and MS4 outfalls. Two types of receiving water sites are utilized to fulfill the Long Term Assessment (LTA) and evaluation and TMDL requirements. The
- 6 -
Rio Hondo/San Gabriel River Water Quality Group Coordinated Integrated Monitoring Program
CIMP provides the RH/SGRWQG with the information necessary to guide water quality program management decisions. Additionally, the monitoring program will provide a means to measure compliance with the MS4 Permit. The CIMP is composed of five elements, including:
1. Receiving Water Monitoring 2. Stormwater Outfall Monitoring 3. Non-Stormwater Outfall Monitoring 4. New Development/Re-Development Effectiveness Tracking 5. Regional Studies
1.3.1 Receiving Water Monitoring The receiving water monitoring is designed to provide data to determine whether the RWLs and water quality objectives are being achieved. Over time, the monitoring will allow the assessment of trends in pollutant concentrations. WBPCs prioritizations were utilized to support the development of the monitoring approach. While not explicitly established in the MRP, two monitoring types, LTA and TMDL, are proposed to distinguish between the different goals of monitoring for specific WBPCs in the EWMP area. The RH/SGRWQG is proposing these two types of sites to monitor the receiving waters and fulfill the MS4 Permit primary objectives. 1.3.2 Stormwater Outfall Monitoring The selected sites are representative of the land uses within each respective 12-digit Hydrologic Unit Code (HUC-12). The data collected at the monitored outfalls will be considered representative of MS4 discharges within the respective HUC-12. 1.3.3 Non-Stormwater Outfall Program The Non-Stormwater Outfall Screening and Monitoring Program focuses on dry-weather discharges to receiving waters from major outfalls. The program fulfills two roles, the first is to determine whether the non-stormwater constituent load is adversely impacting the receiving water and the second is to assess whether the non-stormwater discharge is allowable. The Non-Stormwater Outfall Program is designed to be complimentary to the Illicit Connection/Illicit Discharge (IC/ID) minimum control measure (MCM). Non-stormwater outfall monitoring sites will be determined after the screening events have been completed and an inventory of outfalls has been created. Constituents that will be monitored at each non-stormwater outfall monitoring site will depend upon the receiving water to which the non-stormwater outfall monitoring site discharges. 1.3.4 New Development and Re-Development Effectiveness Tracking EWMP Group members are required to maintain databases to track specific information related to new and re-development projects subject to the minimum control measures. 1.3.5 Regional Studies Only one regional study is identified in the MRP: the Southern California Stormwater Monitoring Coalition (SMC) Bioassessment Program. The Southern California Coastal Water Research Project (SCCWRP) oversees the SMC. The SMC Bioassessment Program is a collaborative effort between all of the Phase I MS4 NPDES Permittees and NPDES regulatory agencies in Southern California. The LACFCD will contribute necessary resources to implement the bioassessment monitoring requirement of the MS4 Permit on behalf of all Permittees in Los Angeles County during the current permit cycle. Monitoring under the first cycle concluded in 2013, with reporting of findings and additional special studies planned
- 7 -

Rio Hondo/San Gabriel River Water Quality Group Coordinated Integrated Monitoring Program
to occur in 2014. The SMC, including the LACFCD, is currently working on designing the bioassessment monitoring program for the next five-year cycle, which is scheduled to run from 2015 to 2019. 1.4 Monitoring Procedures Monitoring will occur during dry and wet conditions. Wet-weather conditions for triggering storm events will be defined as a 70 percent probable forecast of greater than 0.25 inches of precipitation where the preceding 72 hours of dry-weather has less than 0.1 inches of rain. Dry-weather is defined in the MRP as when the flow of the receiving water body is less than 20 percent greater than the base flow. In the case of an estuary, dry-weather is defined as days with less than 0.1 inches of rain and more than three days after a rain event of 0.1 inches or greater within the watershed, as measured from at least 50 percent of LACDPW controlled rain gauges within the watershed. Composite samples will be used for wet-weather sampling events to sufficiently characterize the receiving water during wet-weather. Grab samples may be utilized to collect wet-weather sampling in certain situations, which may include, but are not limited to, when the constituent of interest requires the use of grab samples (e.g., E. coli; oil and grease), conditions are considered unsafe to collect composite samples, or to perform investigative monitoring where composite sampling or installation of an automatic sample compositor (autosampler) may not be warranted. Additionally, if autosamplers fail during a rain event, or if the rain event is such that composite samples cannot be collected (e.g., very short in duration or volume), grab samples will be collected and submitted for analysis for all analytes. For dry-weather toxicity monitoring, the sampling event must take place during the historically driest month. As a result, the dry-weather monitoring event that includes toxicity monitoring will be conducted in July. The second dry-weather monitoring event will take place during January unless sampling during another month is deemed to be necessary or preferable. Generally, grab samples will be collected during dry-weather and composite samples will be collected during wet-weather. Grab samples will be used for dry-weather sampling events as the composition of the receiving water will change less over time; and thus, the grab samples sufficiently characterize the receiving water. Additionally, grab samples for dry-weather are consistent with similar programs throughout the region. Note that if rainfall begins after dry-weather monitoring has been initiated then dry-weather monitoring will be suspended and continued on a subsequent day when weather conditions meet the dry-weather conditions. All reasonable efforts will be made to monitor the first significant rain event of the storm year (first flush). The targeted storm events for wet-weather sampling will be selected based on a reasonable probability that the events will result in substantially increased flows in the Rio Hondo and San Gabriel River over at least 12 hours. Sufficient precipitation is needed to produce runoff and increase flow. The decision to sample a storm event will be made in consultation with weather forecasting information services after a quantitative precipitation forecast has been determined. All efforts will be made to collect wet-weather samples from all sites during a single targeted storm event. However, safety or other factors may make it infeasible to collect some or all samples from a given storm event. For example, storm events that will require field crews to collect wet-weather samples during holidays and/or weekends may not be sampled due to sample collection or laboratory staffing constraints. Additional information to support evaluating weather conditions, collecting grab and composite samples, and targeting wet-weather sampling events is provided in Attachment E. 1.5 2012 MS4 Permit Review Process and CIMP Implementation Following Regional Board adoption of the 2012 MS4 Permit as Order R4-2012-0175 on November 8, 2012, thirty-seven cities and three non-governmental organizations filed petitions for review
- 8 -

Rio Hondo/San Gabriel River Water Quality Group Coordinated Integrated Monitoring Program
with the State Water Resources Control Board (SWRCB), which were acknowledged in a January 30, 2013 letter, and deemed complete on July 8, 2013. Five of the filing Cities also simultaneously filed Request for Stays, which were denied on June 14, 2013. On April 1, 2014, the SWRCB adopted an Own Motion Review and thirty-five of the petitioners agreed to have their petitions for review placed in abeyance. The following reservation is included as a contingency in the CIMP, while the review processes proceed.
On December 10, 2012 the Cities of Arcadia, Bradbury, Duarte, Monrovia, and Sierra Madre (hereinafter “the Cities”) submitted Administrative Petitions (Petitions) to the California State Water Resources Control Board (SWRCB) pursuant to section 13320(a) of the California Water Code requesting that the SWRCB review various terms and requirements set forth in the 2012 MS4 Permit, Order No. R4-2012-0175 (2012 Permit) adopted by the California Regional Water Quality Control Board, Los Angeles Region (Regional Board). The Petitions were subsequently referred to as SWRCB/OCC File Nos. A 2236. For example Monrovia’s petition for review is designated as A2236(v). The Cities petitions requested that the State Board review certain terms/requirements contained in the 2012 Permit, including a review of all numeric limits, both interim and final, and whether derived from a TMDL or provided from the application of an adopted water quality standard, or through a discharge prohibition set forth in the Permit. The challenges to the various numeric limits set forth in the Permit, includes a challenge to all such numeric limits that may be complied with through the implementation of an approved Enhanced Watershed Management Plan (EWMP) and Coordinated Integrated Monitoring Plan (CIMP). On July 8, 2013 the SWRCB advised the Cities that the respective Petitions were complete and all such Petitions remain pending at this time. In spite of the pending Petitions, the Cities are acting in good faith and moving forward to attempt to comply with all of the applicable terms of the Permit, and look forward to working with the Regional Board to assess and implement the strategies and requirements necessary for compliance, including the development of an acceptable EWMP and CIMP. Nevertheless, because, through their Petitions, the Cities believe that many of the terms of the 2012 Permit are invalid, including the terms involving compliance with numeric limits. The Cities hereby expressly reserve and are not waiving, with this submission or otherwise, any of their rights to challenge the need for any EWMP and CIMP, including their rights to seek to void or otherwise compel modifications to the Permit terms involving the EWMP and CIMP, or to void or compel revisions to any other part or portion of the Permit. In addition, the Cities are not waving, and hereby expressly reserve, any and all rights they have or may have to seek to recover the costs from the State to develop and implement any EWMP and CIMP, on the grounds that such requirements are unfunded State mandates, and if funds are not provided by the State, to reimburse the Cities for such programs, to invalidate all such requirements.
- 9 -
Rio Hondo/San Gabriel River Water Quality Group Coordinated Integrated Monitoring Program
2. Receiving Water Monitoring Program The following subsections describe how the MRP requirements for receiving water monitoring will be met within the EWMP area. 2.1 Receiving Water Monitoring Objectives The objectives of the receiving water monitoring include the following:
Determine whether the RWLs are being achieved; Assess trends in pollutant concentrations over time, or during specified conditions; and Determine whether the designated beneficial uses are fully supported as determined by water
chemistry, as well as aquatic toxicity and bioassessment monitoring. 2.2 Description of Receiving Water Monitoring WBPCs prioritizations were utilized to support the development of the monitoring approach. To address the different monitoring objectives and priorities two types of monitoring are proposed:
Long Term Assessment – LTA monitoring is intended to determine if RWLs are achieved, assess trends in pollutant concentrations over time, and determine whether designated uses are supported.
TMDL – TMDL monitoring is conducted to evaluate attainment of or progress in attaining the TMDL.
While not explicitly established in the MRP, the monitoring types distinguish between the different end goals of monitoring for specific constituents within specific water bodies in the RH/SGRWQG area. LTA monitoring provides a long-term record for a robust suite of constituents to understand conditions within the watersheds. TMDL monitoring addresses TMDL related constituents and provides monitoring locations to assess other identified exceedances of RWLs determined through data analysis. 2.3 Receiving Water Monitoring Sites Requirements in the MRP include receiving water monitoring sites at previously designated mass emission stations, TMDL receiving water compliance points, and additional receiving water locations representative of the impacts from MS4 discharges. A previously designated mass emission station is not located within the RH/SGRWQG area. The designated mass emission station located in Reach 2 of the San Gabriel River (S14) is not necessarily representative of the MS4 contributions from the EMWP area, as the EWMP area is a small portion of the area draining to the station. Therefore, S14 will not be proposed as an LTA monitoring site for the RH/SGRWQG; however, the LACFCD is likely to continue monitoring S14, and the resulting data may be evaluated to identify long term trends or the consideration of additional constituents. For the Rio Hondo portion of the watershed, the designated mass emission station in Reach 1 of the Los Angeles River (S10) is located a great distance from the RH/SGRWQG area and has a total upstream drainage area of 825 square miles. Monitoring at the S10 mass emission station will not be beneficial for the RH/SGRWQG because the group’s contribution to conditions at the S10 mass emission station is negligible. A tributary monitoring station is located within the Rio Hondo (TS06); however, this station was only operated for two years, and will not be operated in the future. TS06 was not a previously designated mass emission station while it was operational. Future monitoring at the TS06 tributary station will not be beneficial for the RH/SGRWQG, as the historic location parallels the S14 site and would include a substantial amount of influence from communities outside of the EWMP area. To
- 10 -

Rio Hondo/San Gabriel River Water Quality Group Coordinated Integrated Monitoring Program
meet MRP requirements, monitoring at TMDL receiving water compliance points and additional receiving water locations representative of the impacts from MS4 discharges is proposed. Five receiving water sites are utilized in the CIMP. Two LTA sites have been selected in the RH/SGRWQG area to address the receiving water monitoring program objectives. Two TMDL sites are located within receiving waters discharging to Peck Road Park Lake, and will be used to assess the MS4 discharge to the lake. The final site is a TMDL site in Peck Road Park Lake where water column, benthic sediment, and fish tissue samples will be collected. The receiving water sites are summarized in Table 2-1, and located on Figure 2-1.
Table 2-1 Summary of RH/SGRWQG Receiving Water Monitoring Sites
Site ID Water Body Represented Coordinates Monitoring Type
Latitude Longitude LTA TMDL RHSGR_RH3_ARC Rio Hondo Reach 3 34.089836 -118.033828 X X RHSGR_LDW_BDW Little Dalton Wash 34.099445 -117.926766 X X RHSGR_SAN_DD Santa Anita Wash 34.106200 -118.016150 X RHSGR_SAW_PR Sawpit Wash 34.106140 -118.006921 X RHSGR_PRP_LAKE Peck Road Park Lake Varies Varies X
After the discharge quality for Santa Anita and Sawpit Washes are established, the water quality may be determined to be statistically similar, in which case the EWMP Group may choose to alternate between sites on an annual basis.
- 11 -
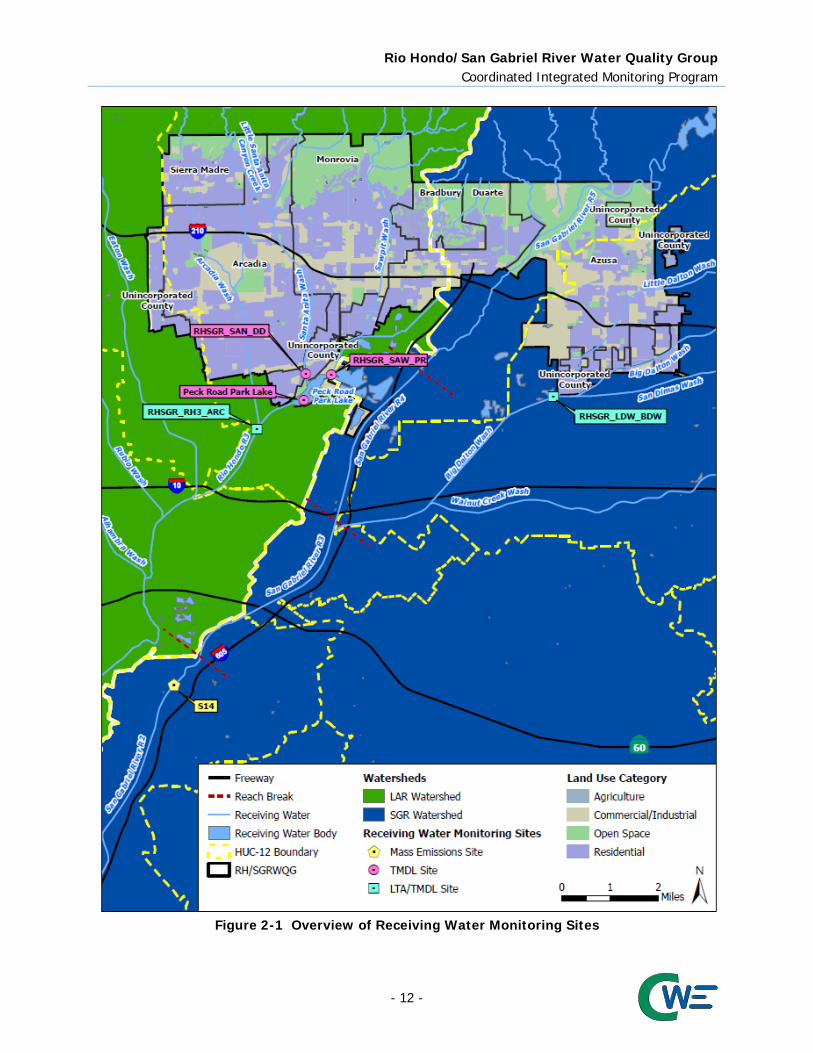
Rio Hondo/San Gabriel River Water Quality Group Coordinated Integrated Monitoring Program
Figure 2-1 Overview of Receiving Water Monitoring Sites
- 12 -

Rio Hondo/San Gabriel River Water Quality Group Coordinated Integrated Monitoring Program
2.3.1 Long Term Assessment Site One of the primary objectives of receiving water monitoring is to assess trends in pollutant concentrations over time, or during specified conditions. As a result, the primary characteristic of an ideal monitoring site is a robust dataset of previously collected monitoring results so that trends in pollutant concentrations over time, or during specified conditions, can be assessed. Such a site does not exist within the RH/SGRWQG area. Therefore, new LTA sites are proposed to support an understanding of potential impacts associated with MS4 discharges from the RH/SGRWQG. In addition, the historic mass emission station on the San Gabriel River, located outside of the RH/SGRWQG area, is identified as an additional resource possessing a robust dataset of previously collected monitoring results. The data collected from the mass emission station may be evaluated for long term trends; however this data may not necessarily reflect the EWMP area MS4 contribution to water quality. The proposed LTA sites meet the receiving water site monitoring objectives and support an understanding of potential impacts associated with MS4 discharges on receiving water conditions. An exceedance of an RWL at a receiving water site does not on its own represent an exceedance of an RWL that was caused by or contributed to by MS4 discharges. These sites also receive runoff from non-MS4 sources, including open space and other permitted discharges; hence the exceedance of an RWL may have been caused or contributed to by a non-MS4 source. A determination regarding whether MS4 discharges caused or contributed to an RWL exceedance should be made using data collected through outfall-based monitoring. The number of required receiving water monitoring sites is not specified in the MRP; however, it is beneficial for the RH/SGRWQG to have two LTA monitoring sites in:
Rio Hondo Reach 3, just downstream of the Arcadia Wash confluence. Little Dalton Wash, just upstream of the Big Dalton Wash confluence.
An LTA monitoring site is not proposed for San Gabriel River Reach 5 since this section of the river is soft bottom, allowing small to moderate storm and dry-weather flows to completely infiltrate, and upstream flow is predominately captured by upstream dams and diversions. In lieu of a receiving water site, two outfall sites to the San Gabriel River Reach 5 were selected to assess the potential MS4 contribution. The selected outfalls include:
Beatty Canyon Bradbury Drain
The first LTA site is located in Rio Hondo Reach 3, just downstream of the Arcadia Wash confluence. This location was selected because it is the most upstream location in Rio Hondo Reach 3 which captures the vast majority of drainage from the Rio Hondo portion of the RH/SGRWQG area. The approximate catchment areas for the two LTA sites are illustrated on Figure 2-2. The area around the San Gabriel River Reach 5 is assessed via the outfall monitoring on Beatty Canyon and Bradbury Drain. The outfall monitoring sites are detailed in Section 4. An overview of the land use within the catchment area is provided in Table 2-2.
- 13 -
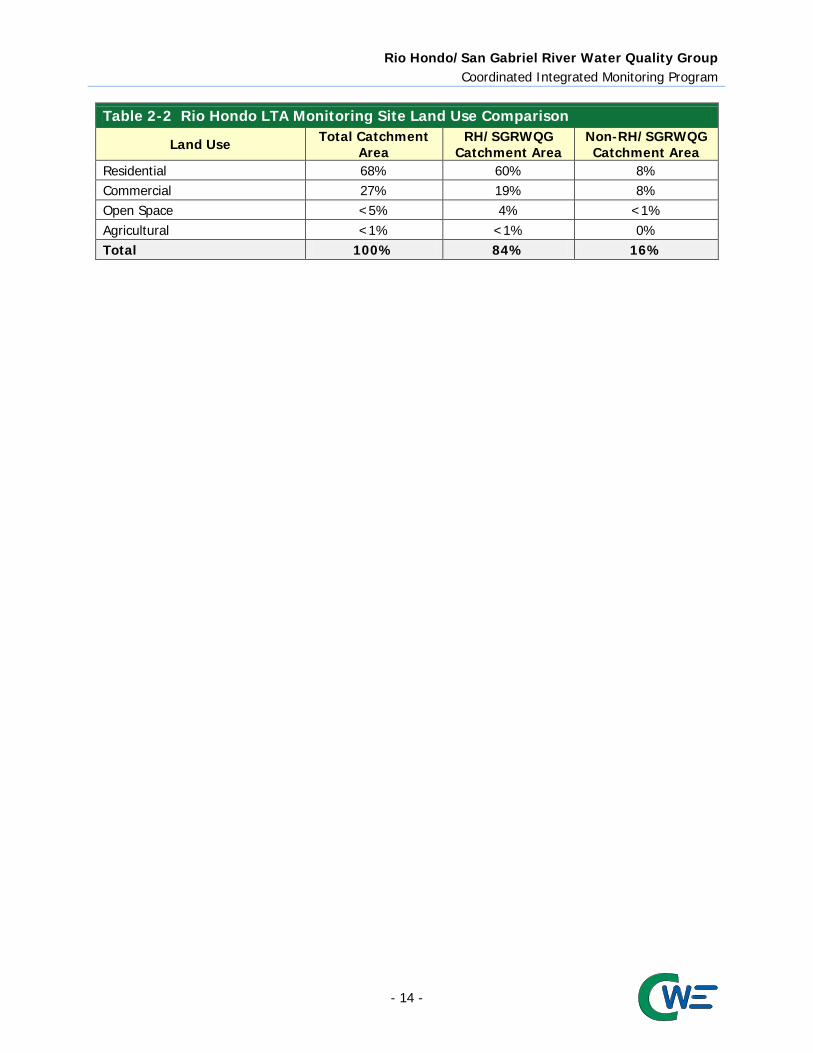
Rio Hondo/San Gabriel River Water Quality Group Coordinated Integrated Monitoring Program
Table 2-2 Rio Hondo LTA Monitoring Site Land Use Comparison
Land Use Total Catchment Area
RH/SGRWQG Catchment Area
Non-RH/SGRWQG Catchment Area
Residential 68% 60% 8% Commercial 27% 19% 8% Open Space <5% 4% <1% Agricultural <1% <1% 0% Total 100% 84% 16%
- 14 -
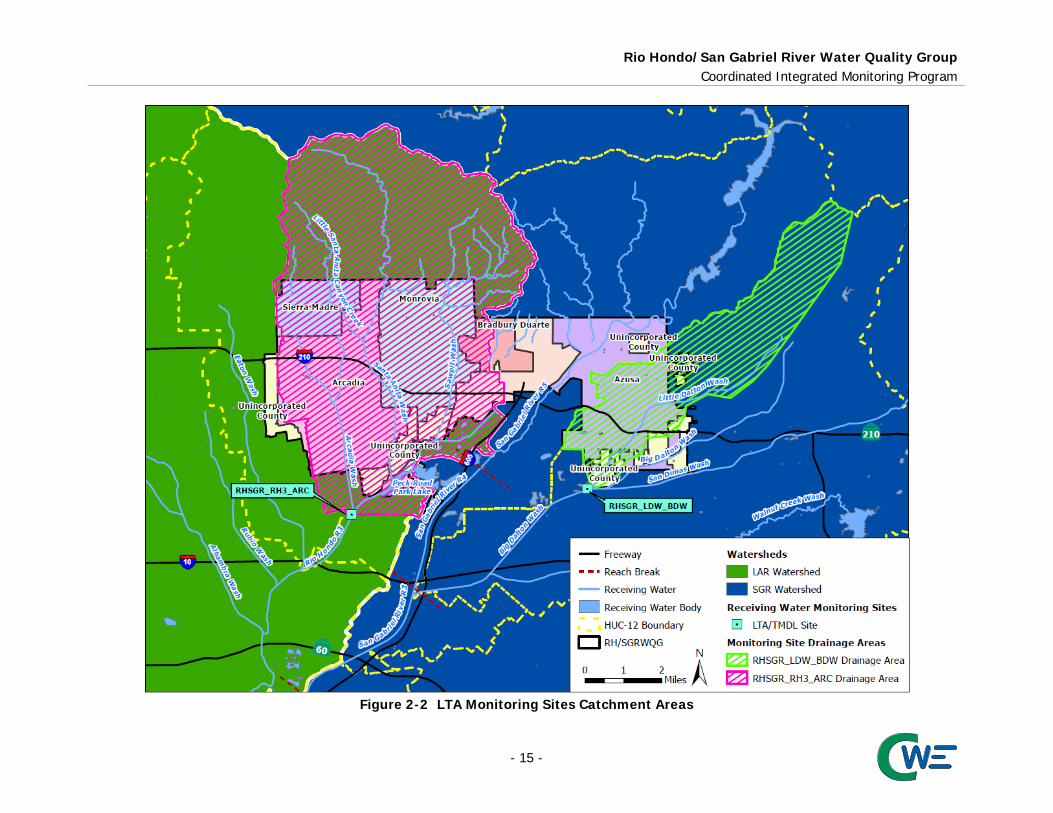
Rio Hondo/San Gabriel River Water Quality Group Coordinated Integrated Monitoring Program
Figure 2-2 LTA Monitoring Sites Catchment Areas
- 15 -
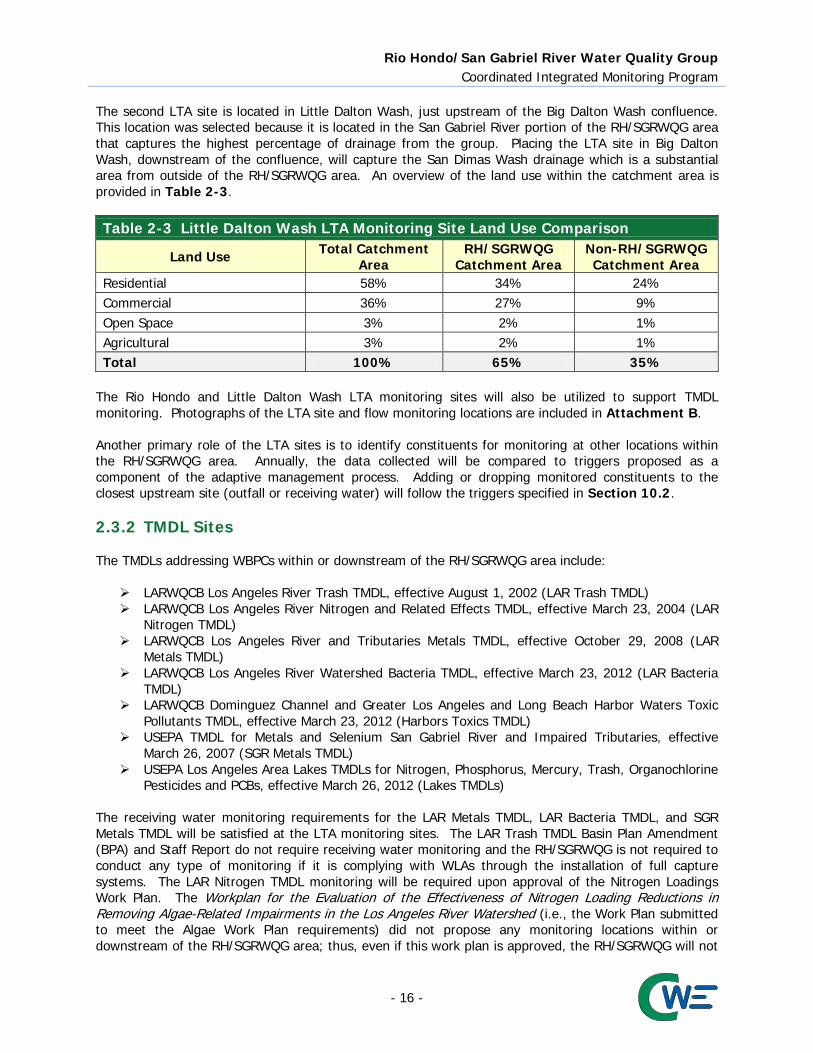
Rio Hondo/San Gabriel River Water Quality Group Coordinated Integrated Monitoring Program
The second LTA site is located in Little Dalton Wash, just upstream of the Big Dalton Wash confluence. This location was selected because it is located in the San Gabriel River portion of the RH/SGRWQG area that captures the highest percentage of drainage from the group. Placing the LTA site in Big Dalton Wash, downstream of the confluence, will capture the San Dimas Wash drainage which is a substantial area from outside of the RH/SGRWQG area. An overview of the land use within the catchment area is provided in Table 2-3.
Table 2-3 Little Dalton Wash LTA Monitoring Site Land Use Comparison
Land Use Total Catchment Area
RH/SGRWQG Catchment Area
Non-RH/SGRWQG Catchment Area
Residential 58% 34% 24% Commercial 36% 27% 9% Open Space 3% 2% 1% Agricultural 3% 2% 1% Total 100% 65% 35%
The Rio Hondo and Little Dalton Wash LTA monitoring sites will also be utilized to support TMDL monitoring. Photographs of the LTA site and flow monitoring locations are included in Attachment B. Another primary role of the LTA sites is to identify constituents for monitoring at other locations within the RH/SGRWQG area. Annually, the data collected will be compared to triggers proposed as a component of the adaptive management process. Adding or dropping monitored constituents to the closest upstream site (outfall or receiving water) will follow the triggers specified in Section 10.2. 2.3.2 TMDL Sites The TMDLs addressing WBPCs within or downstream of the RH/SGRWQG area include:
LARWQCB Los Angeles River Trash TMDL, effective August 1, 2002 (LAR Trash TMDL) LARWQCB Los Angeles River Nitrogen and Related Effects TMDL, effective March 23, 2004 (LAR
Nitrogen TMDL) LARWQCB Los Angeles River and Tributaries Metals TMDL, effective October 29, 2008 (LAR
Metals TMDL) LARWQCB Los Angeles River Watershed Bacteria TMDL, effective March 23, 2012 (LAR Bacteria
TMDL) LARWQCB Dominguez Channel and Greater Los Angeles and Long Beach Harbor Waters Toxic
Pollutants TMDL, effective March 23, 2012 (Harbors Toxics TMDL) USEPA TMDL for Metals and Selenium San Gabriel River and Impaired Tributaries, effective
March 26, 2007 (SGR Metals TMDL) USEPA Los Angeles Area Lakes TMDLs for Nitrogen, Phosphorus, Mercury, Trash, Organochlorine
Pesticides and PCBs, effective March 26, 2012 (Lakes TMDLs) The receiving water monitoring requirements for the LAR Metals TMDL, LAR Bacteria TMDL, and SGR Metals TMDL will be satisfied at the LTA monitoring sites. The LAR Trash TMDL Basin Plan Amendment (BPA) and Staff Report do not require receiving water monitoring and the RH/SGRWQG is not required to conduct any type of monitoring if it is complying with WLAs through the installation of full capture systems. The LAR Nitrogen TMDL monitoring will be required upon approval of the Nitrogen Loadings Work Plan. The Workplan for the Evaluation of the Effectiveness of Nitrogen Loading Reductions in Removing Algae-Related Impairments in the Los Angeles River Watershed (i.e., the Work Plan submitted to meet the Algae Work Plan requirements) did not propose any monitoring locations within or downstream of the RH/SGRWQG area; thus, even if this work plan is approved, the RH/SGRWQG will not
- 16 -
Rio Hondo/San Gabriel River Water Quality Group Coordinated Integrated Monitoring Program
be subject to any monitoring requirements. The Harbors Toxics TMDL monitoring requirements will be satisfied through coordination with downstream groups. Groups located at the LAR and SGR estuaries are each preforming the monitoring required to satisfy the MS4 Permit requirements. The RH/SGRWQG will cost share with the downstream groups to satisfy the joint monitoring requirements. This monitoring will serve as the Report of Implementation for the Harbors Toxics TMDL. Within the RH/SGRWQG area, three TMDL monitoring sites are proposed to address the Lakes TMDLs, including:
A new TMDL site located in Santa Anita Wash, just upstream of Peck Road Park Lake to fulfill stormwater monitoring TMDL requirements.
A new TMDL site located in Sawpit Wash, just upstream of Peck Road Park Lake to fulfill stormwater monitoring TMDL requirements.
A new TMDL site located within Peck Road Park Lake to fulfill in-lake compliance monitoring, fish tissue monitoring, and trash monitoring TMDL requirements.
The exact location of the Peck Road Park Lake TMDL monitoring site may vary due to hydrologic conditions affecting lake levels and the type of monitoring being conducted (i.e., water column, sediment, or fish tissue). The proposed sites are located on Figure 2-1. Photographs of the TMDL sites are included in Attachment B. All responsible parties to the TMDLs are equally responsible for performing monitoring throughout the watershed. Table 1-4 demonstrates which RH/SGRWQG members are affected by each of the TMDLs per Attachment K, Tables K-5, K-6, K-9, K-10, and K-13, of the MS4 Permit. As recognized by the footnote in Attachment K-4 of the MS4 Permit, the members of the RH/SGRWQG have entered into an Amended Consent Decree with the United States and State of California, including the Regional Board, pursuant to which the Regional Board has released the RH/SGRWQG members from responsibility for toxic pollutants in the Dominguez Channel and Greater Los Angeles and Long Beach Harbors. Accordingly, no inference should be drawn from the submission of this CIMP or from any action or implementation taken pursuant to it that the RH/SGRWQG members are obligated to implement the Dominguez Channel and Greater Los Angeles Harbor Waters Toxic Pollutants TMDL, including this CIMP or any of the Toxics TMDL’s other obligations or plans, or that the RH/SGRWQG members have waived any rights under the Amended Consent Decree. 2.4 Monitored Constituents and Frequency The MRP clearly defines the minimum required constituents, frequency, and duration of receiving water monitoring. A general summary of the frequency of monitoring and constituents identified in the MRP for receiving water monitoring for flowing streams are presented in Table 2-4. The frequency of monitoring in Peck Road Park Lake is summarized in Table 2-5.
- 17 -

Rio Hondo/San Gabriel River Water Quality Group Coordinated Integrated Monitoring Program
Table 2-4 Annual Frequency of Receiving Water Monitoring during Wet- and Dry-Weather Conditions
Constituent Annual Frequency1 (number wet events/number dry event)
Rio Hondo Santa Anita Wash Sawpit Wash Little Dalton Wash Monitoring Type LTA TMDL TMDL LTA Flow and field parameters2 3/9 3/9 3/9 3/2 Pollutants identified in Table E-2 of the MRP3 and not otherwise addressed below 14/14 14/14
Aquatic Toxicity 2/1 2/1 TSS and Hardness 3/2 3/2 3/2 3/2 Total Nitrogen 2/0 2/0 Organic Nitrogen 2/0 2/0 TKN 2/0 2/0 Total Phosphorus 2/0 2/0 Orthophosphate 2/0 2/0 Ammonia 0/2 2/0 2/0 Nitrate 0/2 2/0 2/0 Nitrite 0/2 2/0 2/0 Total and Dissolved Copper 3/2 3/2 Total and Dissolved Lead 3/2 3/2 3/2 3/25 Total and Dissolved Zinc 3/2 3/2 Total and Dissolved Cadmium 3/0 E. coli 3/9 3/9 3/9 3/2 Bis(2-ethylhexyl)phthalate 3/2 Total Dissolved Solids 2/0 2/0 0/2 TOC 1/0 1/0 DDT7, PCBs8, Dieldrin, and Chlordane9 16/06 16/06 1 Annual frequency listed as number of wet-weather events per year/number of dry-weather events per year (e.g., 3/2 signifies three wet-weather events per
year and two dry-weather events per year. 2 Field parameters are defined as DO, pH, temperature, and specific conductivity. 3 All pollutants identified in Table E-2 of the MRP that are not already addressed by TMDL monitoring at this site. After the first season of monitoring where
the Table E-2 constituents are monitored, an analysis will be conducted to determine which MS4 Permit required pollutants exceeded a water quality objective at this site. Those exceeding the respective water quality objectives will be added to the LTA monitoring list.
4 Monitoring frequency only applies during the first year of monitoring. For pollutants identified in Table E-2 of the MRP that are not detected at the Method
- 18 -

Rio Hondo/San Gabriel River Water Quality Group Coordinated Integrated Monitoring Program
Detection Limit (MDL) for its respective test method or the result is below the lowest applicable water quality objective, additional monitoring will not be conducted (i.e., the monitoring frequency will become 0/0). For pollutants identified in Table E-2 of the MRP that are detected above the lowest applicable water quality objective, additional monitoring will be conducted at the frequency specified in the MRP (i.e., the monitoring frequency will become 3/2) beginning the season following the Table E-2 sampling.
5 Effectiveness monitoring frequency of monthly for dry-weather will commence after the first Metals TMDL interim milestone (September 30, 2017) if ambient monitoring indicates that the interim requirements have not been met.
6 Per the USEPA Lakes TMDL, water samples and suspended solids samples will be collected during one wet-weather event each year and will be analyzed for metals, DDT, PCBs, and PAHs.
7 DDT is defined as the sum of 2,4’-DDD, 2,4’-DDE, 2,4’-DDT, 4,4’-DDD, 4,4’-DDE, and 4,4’-DDT. 8 To allow appropriate comparisons between potential sources and effects, the full suite of PCB congeners are to be analyzed for each matrix. PCBs are
defined as the sum of 54 PCB congeners when analyzed in the water column, sediment or suspended solids, including: 8, 18, 28, 31, 33, 37, 44, 49, 52, 56, 60, 66, 70, 74, 77, 81, 87, 95, 97, 99, 101, 105, 110, 114, 118, 119, 123, 126, 128, 132, 138, 141, 149, 151, 153, 156, 157, 158, 167, 168, 169, 170, 174, 177, 180, 183, 187, 189, 194, 195, 201, 203, 206, and 209.
9 Chlordane includes analyses for the following species: alpha-chlordane, gamma-chlordane, oxychlordane, cis-Nonachlor, and trans-Nonachlor.
- 19 -
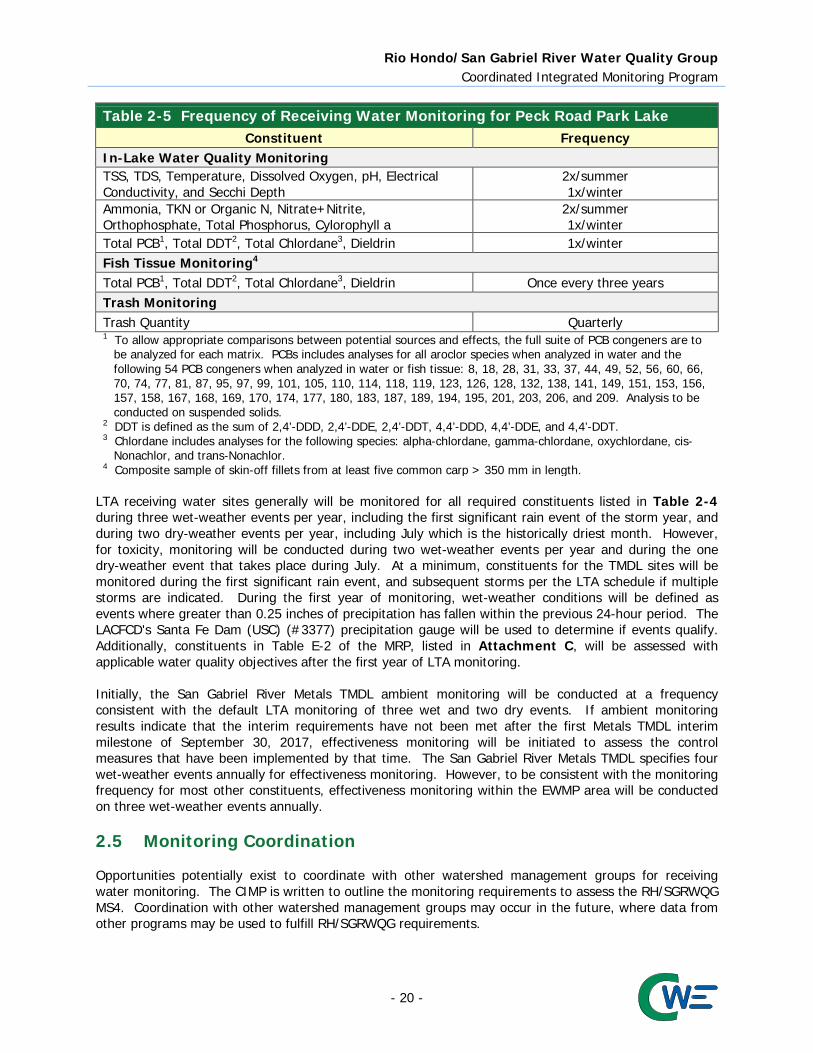
Rio Hondo/San Gabriel River Water Quality Group Coordinated Integrated Monitoring Program
Table 2-5 Frequency of Receiving Water Monitoring for Peck Road Park Lake Constituent Frequency
In-Lake Water Quality Monitoring TSS, TDS, Temperature, Dissolved Oxygen, pH, Electrical Conductivity, and Secchi Depth
2x/summer 1x/winter
Ammonia, TKN or Organic N, Nitrate+Nitrite, Orthophosphate, Total Phosphorus, Cylorophyll a
2x/summer 1x/winter
Total PCB1, Total DDT2, Total Chlordane3, Dieldrin 1x/winter Fish Tissue Monitoring4 Total PCB1, Total DDT2, Total Chlordane3, Dieldrin Once every three years Trash Monitoring Trash Quantity Quarterly 1 To allow appropriate comparisons between potential sources and effects, the full suite of PCB congeners are to
be analyzed for each matrix. PCBs includes analyses for all aroclor species when analyzed in water and the following 54 PCB congeners when analyzed in water or fish tissue: 8, 18, 28, 31, 33, 37, 44, 49, 52, 56, 60, 66, 70, 74, 77, 81, 87, 95, 97, 99, 101, 105, 110, 114, 118, 119, 123, 126, 128, 132, 138, 141, 149, 151, 153, 156, 157, 158, 167, 168, 169, 170, 174, 177, 180, 183, 187, 189, 194, 195, 201, 203, 206, and 209. Analysis to be conducted on suspended solids.
2 DDT is defined as the sum of 2,4’-DDD, 2,4’-DDE, 2,4’-DDT, 4,4’-DDD, 4,4’-DDE, and 4,4’-DDT. 3 Chlordane includes analyses for the following species: alpha-chlordane, gamma-chlordane, oxychlordane, cis-
Nonachlor, and trans-Nonachlor. 4 Composite sample of skin-off fillets from at least five common carp > 350 mm in length.
LTA receiving water sites generally will be monitored for all required constituents listed in Table 2-4 during three wet-weather events per year, including the first significant rain event of the storm year, and during two dry-weather events per year, including July which is the historically driest month. However, for toxicity, monitoring will be conducted during two wet-weather events per year and during the one dry-weather event that takes place during July. At a minimum, constituents for the TMDL sites will be monitored during the first significant rain event, and subsequent storms per the LTA schedule if multiple storms are indicated. During the first year of monitoring, wet-weather conditions will be defined as events where greater than 0.25 inches of precipitation has fallen within the previous 24-hour period. The LACFCD's Santa Fe Dam (USC) (#3377) precipitation gauge will be used to determine if events qualify. Additionally, constituents in Table E-2 of the MRP, listed in Attachment C, will be assessed with applicable water quality objectives after the first year of LTA monitoring. Initially, the San Gabriel River Metals TMDL ambient monitoring will be conducted at a frequency consistent with the default LTA monitoring of three wet and two dry events. If ambient monitoring results indicate that the interim requirements have not been met after the first Metals TMDL interim milestone of September 30, 2017, effectiveness monitoring will be initiated to assess the control measures that have been implemented by that time. The San Gabriel River Metals TMDL specifies four wet-weather events annually for effectiveness monitoring. However, to be consistent with the monitoring frequency for most other constituents, effectiveness monitoring within the EWMP area will be conducted on three wet-weather events annually. 2.5 Monitoring Coordination Opportunities potentially exist to coordinate with other watershed management groups for receiving water monitoring. The CIMP is written to outline the monitoring requirements to assess the RH/SGRWQG MS4. Coordination with other watershed management groups may occur in the future, where data from other programs may be used to fulfill RH/SGRWQG requirements.
- 20 -
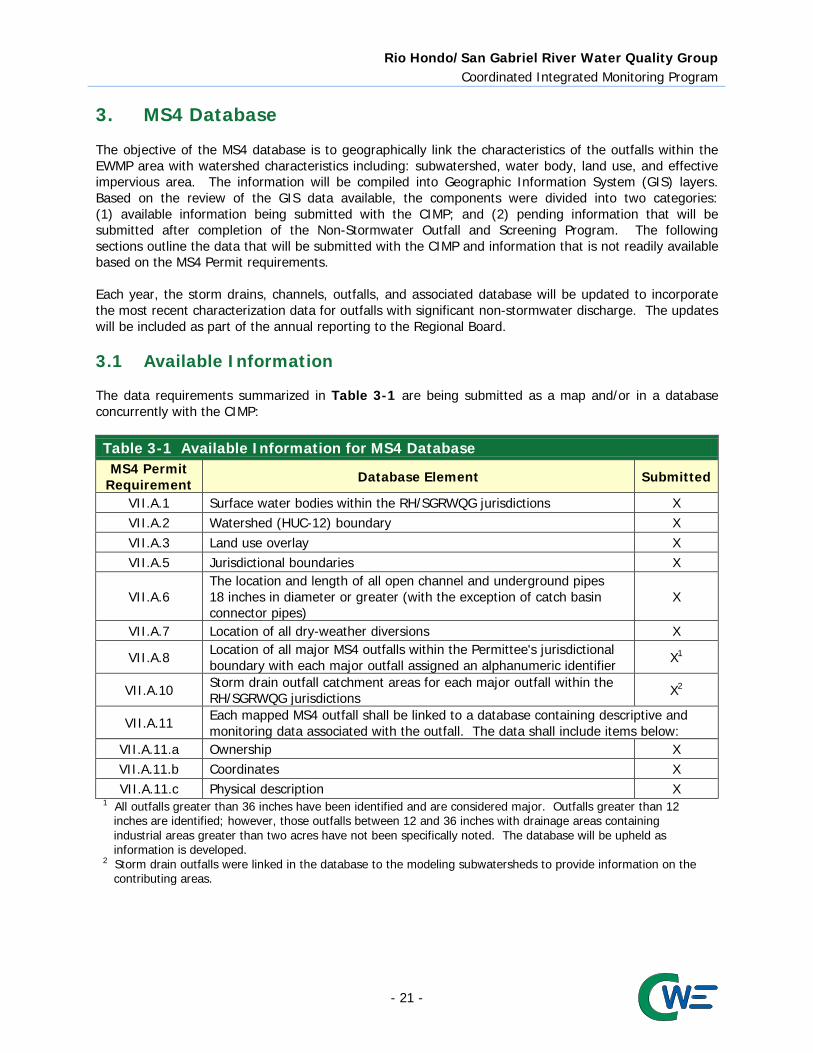
Rio Hondo/San Gabriel River Water Quality Group Coordinated Integrated Monitoring Program
3. MS4 Database The objective of the MS4 database is to geographically link the characteristics of the outfalls within the EWMP area with watershed characteristics including: subwatershed, water body, land use, and effective impervious area. The information will be compiled into Geographic Information System (GIS) layers. Based on the review of the GIS data available, the components were divided into two categories: (1) available information being submitted with the CIMP; and (2) pending information that will be submitted after completion of the Non-Stormwater Outfall and Screening Program. The following sections outline the data that will be submitted with the CIMP and information that is not readily available based on the MS4 Permit requirements. Each year, the storm drains, channels, outfalls, and associated database will be updated to incorporate the most recent characterization data for outfalls with significant non-stormwater discharge. The updates will be included as part of the annual reporting to the Regional Board. 3.1 Available Information The data requirements summarized in Table 3-1 are being submitted as a map and/or in a database concurrently with the CIMP:
Table 3-1 Available Information for MS4 Database MS4 Permit
Requirement Database Element Submitted
VII.A.1 Surface water bodies within the RH/SGRWQG jurisdictions X VII.A.2 Watershed (HUC-12) boundary X VII.A.3 Land use overlay X VII.A.5 Jurisdictional boundaries X
VII.A.6 The location and length of all open channel and underground pipes 18 inches in diameter or greater (with the exception of catch basin connector pipes)
X
VII.A.7 Location of all dry-weather diversions X
VII.A.8 Location of all major MS4 outfalls within the Permittee's jurisdictional boundary with each major outfall assigned an alphanumeric identifier X1
VII.A.10 Storm drain outfall catchment areas for each major outfall within the RH/SGRWQG jurisdictions X2
VII.A.11 Each mapped MS4 outfall shall be linked to a database containing descriptive and monitoring data associated with the outfall. The data shall include items below:
VII.A.11.a Ownership X VII.A.11.b Coordinates X VII.A.11.c Physical description X
1 All outfalls greater than 36 inches have been identified and are considered major. Outfalls greater than 12 inches are identified; however, those outfalls between 12 and 36 inches with drainage areas containing industrial areas greater than two acres have not been specifically noted. The database will be upheld as information is developed.
2 Storm drain outfalls were linked in the database to the modeling subwatersheds to provide information on the contributing areas.
- 21 -

Rio Hondo/San Gabriel River Water Quality Group Coordinated Integrated Monitoring Program
3.2 Information Not Currently Available As the data becomes available, it will be entered into the database. Upon completion of the non-stormwater screening, outstanding data will be collected. The data summarized in Table 3-2 will be populated into a database as the data is collected. The annual reports will include the updated database.
Table 3-2 Information to be Collected for MS4 Database MS4 Permit
Requirement Database Element To be Developed
Date of Submission
VII.A.4 Effective Impervious Area (EIA) overlay (if available) As available
VII.A.9 Notation of outfalls with significant NSW discharges (to be updated annually) X1 December 2015
VII.A.10
Detailed analysis of storm drain outfall catchment areas for any new outfall monitoring locations, outfalls identified as having significant NSW discharges, and outfalls addressed by structural BMPs
X2 Ongoing
VII.A.11 Each mapped MS4 outfall shall be linked to a database containing descriptive and monitoring data associated with the outfall. The data shall include items below:
VII.A.11.d Photographs of the outfall, where possible, to provide baseline information to track operation and maintenance needs over time
X3 December 2015
VII.A.11.e Determination of whether the outfall conveys significant NSW discharges X1 December 2015
VII.A.11.f Stormwater and non-stormwater monitoring data X4 Ongoing NSW = Non-stormwater 1 The determination of significant will be made after the initial screening process outlined in this CIMP. 2 Storm drain outfalls were linked in the database to the modeling subwatersheds to provide information on
contributing areas. Detailed analysis of storm drain outfall catchment areas for the stormwater outfall monitoring sites have been developed and additional detailed analysis for any new outfall monitoring locations, outfalls identified as having significant non-stormwater discharges, and outfalls addressed by structural BMPs will be conducted as needed.
3 These data will be gathered as part of the screening and monitoring program and will be added to the database as they are gathered.
4 These data will be gathered as part of the screening and monitoring program and will be added to a separate water quality database as they are gathered.
- 22 -
Rio Hondo/San Gabriel River Water Quality Group Coordinated Integrated Monitoring Program
4. Stormwater Outfall Monitoring 4.1 Program Objectives Stormwater outfall monitoring of discharges from the MS4, will allow the following three objectives to be achieved:
Determine the quality of stormwater discharge relative to municipal action levels. Determine whether stormwater discharge is in compliance with applicable stormwater WQBELs
derived from TMDL WLAs. Determine whether the discharge causes or contributes to an exceedance of RWLs.
4.2 Stormwater Outfall Monitoring Sites The primary criteria for the stormwater outfall monitoring program is selecting monitoring sites that are representative of the range of land uses in the RH/SGRWQG area and provide accurate data for measuring flows and characterizing pollutant loads. The MS4 Permit specifies a “default” requirement of one outfall site per jurisdiction per HUC-12. Based upon the characteristics of each HUC-12 and similarities between neighboring jurisdictions and HUC-12s, the default procedure was modified. The MS4 Permit allows an alternative approach through an approved CIMP to increase the cost efficiency and effectiveness of the monitoring program. For the following, the HUC-12 equivalent watersheds prepared by the LACFCD were considered in-lieu of the United States Geological Survey (USGS) HUC-12 watersheds. The following subsections outline the approach to meet the MS4 Permit requirements related to stormwater outfall monitoring. Fourteen potential stormwater outfall monitoring sites were identified for further evaluation during an initial desktop GIS analysis. The desktop GIS analysis of available outfalls was performed using land use and jurisdictional boundary information, and consisted of the following analyses listed in sequential order: (1) identifying the locations of major outfalls (defined as greater than 36 inches); (2) calculating the percentage of each land use associated with the entire HUC-12 and identifying the major outfalls with estimated catchment areas that most closely match the land use breakdown of the HUC-12 in which the outfall is located; (3) identifying outfalls that appeared to be viable options given what could be seen using Google Maps and Google Street View; and (4) identifying outfalls that receive drainage from multiple jurisdictions. All fourteen potential stormwater outfall monitoring sites identified were visited. Two additional candidate outfalls were considered as representative of MS4 discharge to San Gabriel River Reach 5. After all the potential sites were visited, proposed stormwater outfall monitoring sites were identified. The proposed sites were selected based on an evaluation of the land uses draining to the outfall location, the jurisdictions draining to the outfall location (with an emphasis placed on receiving drainage from as many jurisdictions as possible), the safety and accessibility of the site, and the ability to use autosampler equipment at the location (including signs of power availability). The following observations were checked at each site:
Coordinates Dimensions Presence/absence of flow Odor Color Clarity Floatables
- 23 -

Rio Hondo/San Gabriel River Water Quality Group Coordinated Integrated Monitoring Program
Deposits Vegetation Atmospheric conditions Accessibility Safety
The primary criterion for selecting the proposed monitoring sites was the representativeness of the land uses within the estimated outfall catchment area as compared to the HUC-12 as a whole. To best compare the land uses within the MS4 areas, the HUC-12 and outfall drainage area land uses were estimated only using open space characterized as golf courses, local parks, and regional parks for site selection. The land use analysis used 2005 Southern California Association of Governments (SCAG) land use layer. Open space associated with the Angeles National Forest, outside of the MS4 area, were not included in the analysis. Stormwater outfall monitoring sites selected for the RH/SGRWQG have been identified using the procedures outlined in this section. The group has four HUC-12 equivalents within its jurisdictional area. The Eaton Wash HUC-12 covers a minor portion of the RH/SGRWQG area and is similar in land use to the neighboring Santa Anita Wash HUC-12. As a result, no stormwater outfall monitoring site is located in the Eaton Wash HUC-12. One monitoring site within the Santa Anita Wash HUC-12 is identified to represent the group members located in both the Eaton Wash and Santa Anita Wash HUC-12s, namely: City of Arcadia, County of Los Angeles, and City of Sierra Madre. The City of Monrovia is also located in the Santa Anita Wash HUC-12, but is represented by a separate site. The City of Bradbury is also located in the Santa Anita Wash HUC-12, but given the similarities between the Cities of Bradbury and Duarte, one monitoring site is proposed to represent both of these group members. Two additional monitoring sites (one in the Santa Fe Flood Control Basin (FCB) HUC-12 and another in the Big Dalton Wash HUC-12) will also be monitored to represent the City of Azusa and County of Los Angeles unincorporated areas in the SGR WMA. The five stormwater outfall monitoring sites are presented in Figure 4-1. The selected sites are representative of the land uses within each respective drainage area which they represent. The data collected at the monitored outfalls will be considered representative of all MS4 discharges within the respective drainage area which the outfall represents. The resulting data will be applied to all group members represented by the site, regardless of whether a site is located within a particular group member’s jurisdiction or received flow from that land area. Compliance for group members with WQBELs and RWLs may be based on commingled discharges or data not collected within a given jurisdiction.
- 24 -

Rio Hondo/San Gabriel River Water Quality Group Coordinated Integrated Monitoring Program
Figure 4-1 Stormwater Outfall Monitoring Sites
- 25 -

Rio Hondo/San Gabriel River Water Quality Group Coordinated Integrated Monitoring Program
The stormwater outfall monitoring sites for the seven jurisdictions of the RH/SGRWQG are presented in the following subsections. Photographs of each of the stormwater outfall monitoring sites are included in Attachment B. 4.2.1 Santa Anita Wash HUC-12 The Santa Anita Wash HUC-12 is located in the Rio Hondo portion of the Los Angeles River WMA. The HUC-12 covers portions of the Cities of Arcadia, Bradbury, Monrovia, and Sierra Madre, as well as the County. However, the Cities of Bradbury and Monrovia will be represented by separate stormwater outfall monitoring sites. The BI 0602 – Line B site is selected, in part, as the catchment is composed nearly of all residential land use. The City of Monrovia site discussed below is also in the Santa Anita Wash HUC-12 and is reflective of the overall land use in the drainage area. Primary land use types for the group members represented by the Santa Anita Wash HUC-12 stormwater outfall monitoring site and primary land use types within the HUC-12 are presented in Table 4-1. Table 4-1 Santa Anita Wash HUC-12 Stormwater Outfall Monitoring Site Land Use
Comparison Land Use Santa Anita Wash HUC-12 Estimated Outfall Catchment Residential 52% 95% Commercial 38% 4% Open Space 10% 1% Agricultural 0% 0%
Table 4-2 Stormwater Outfall Monitoring Site – Santa Anita Wash HUC-12
HUC-12 City Drain Name Size Shape Material Latitude Longitude
Santa Anita Wash Arcadia BI 0602 –
Line B 90
inches Round RCP 34.107602 -118.036477
The BI 0602 – Line B site was identified as a site which is well-suited for sample collection. The primary factor contributing to the selection of the BI 0602 – Line B site is its relative representativeness within its apparent drainage area with respect to the primary land uses of the Santa Anita Wash HUC-12 for the group members that will be represented by the site. The outfall and respective land uses are shown on Figure 4-2. Other factors that contributed to the selection of the BI 0602 – Line B site include available space for the placement of a permanent sampling station, if desired, and safe and easy access for setup and tear-down of autosampling equipment.
- 26 -

Rio Hondo/San Gabriel River Water Quality Group Coordinated Integrated Monitoring Program
Figure 4-2 Stormwater Outfall Monitoring Site – Santa Anita Wash HUC-12
- 27 -
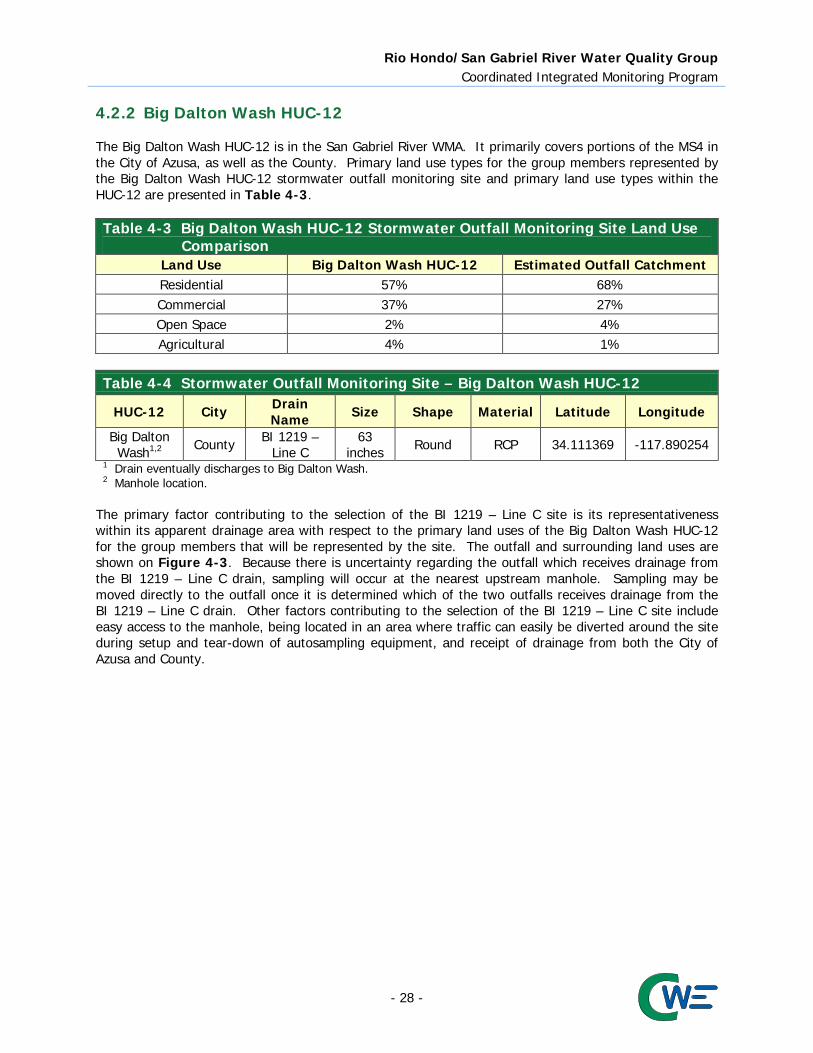
Rio Hondo/San Gabriel River Water Quality Group Coordinated Integrated Monitoring Program
4.2.2 Big Dalton Wash HUC-12 The Big Dalton Wash HUC-12 is in the San Gabriel River WMA. It primarily covers portions of the MS4 in the City of Azusa, as well as the County. Primary land use types for the group members represented by the Big Dalton Wash HUC-12 stormwater outfall monitoring site and primary land use types within the HUC-12 are presented in Table 4-3. Table 4-3 Big Dalton Wash HUC-12 Stormwater Outfall Monitoring Site Land Use
Comparison Land Use Big Dalton Wash HUC-12 Estimated Outfall Catchment Residential 57% 68% Commercial 37% 27% Open Space 2% 4% Agricultural 4% 1%
Table 4-4 Stormwater Outfall Monitoring Site – Big Dalton Wash HUC-12
HUC-12 City Drain Name Size Shape Material Latitude Longitude
Big Dalton Wash1,2 County BI 1219 –
Line C 63
inches Round RCP 34.111369 -117.890254 1 Drain eventually discharges to Big Dalton Wash. 2 Manhole location.
The primary factor contributing to the selection of the BI 1219 – Line C site is its representativeness within its apparent drainage area with respect to the primary land uses of the Big Dalton Wash HUC-12 for the group members that will be represented by the site. The outfall and surrounding land uses are shown on Figure 4-3. Because there is uncertainty regarding the outfall which receives drainage from the BI 1219 – Line C drain, sampling will occur at the nearest upstream manhole. Sampling may be moved directly to the outfall once it is determined which of the two outfalls receives drainage from the BI 1219 – Line C drain. Other factors contributing to the selection of the BI 1219 – Line C site include easy access to the manhole, being located in an area where traffic can easily be diverted around the site during setup and tear-down of autosampling equipment, and receipt of drainage from both the City of Azusa and County.
- 28 -

Rio Hondo/San Gabriel River Water Quality Group Coordinated Integrated Monitoring Program
Figure 4-3 Stormwater Outfall Monitoring Site – Big Dalton Wash HUC-12
- 29 -

Rio Hondo/San Gabriel River Water Quality Group Coordinated Integrated Monitoring Program
4.2.3 Santa Fe Flood Control Basin HUC-12 The Santa Fe FCB HUC-12 is in the San Gabriel River WMA and primarily covers portions of the Cities of Arcadia, Azusa, Bradbury, Duarte, and Monrovia, as well as the County. However, the Cities of Arcadia, Bradbury, Duarte, and Monrovia are represented by separate stormwater outfall monitoring sites. The primary land use types for the outfall catchment area and Santa Fe FCB HUC-12 are presented in Table 4-5. Table 4-5 Santa Fe FCB HUC-12 Stormwater Outfall Monitoring Site Land Use
Comparison Land Use Santa Fe FCB HUC-12 Estimated Outfall Catchment Residential 52% 61% Commercial 37% 16% Open Space 7% 20% Agricultural 4% 3%
Table 4-6 Stormwater Outfall Monitoring Site – Santa Fe FCB HUC-12
HUC-12 City Drain Name Size Shape Material Latitude Longitude
Santa Fe FCB1,2 Azusa Beatty
Canyon 144
inches Square or Rectangle RCB 34.143496 -117.925637
1 Drain eventually discharges to San Gabriel River Reach 5. 2 Manhole location.
The Beatty Canyon drain was identified as a drain which is well-suited for sample collection. The primary factor contributing to the selection of the Beatty Canyon drain is the size of its drainage area relative to the size of the other drainage area options evaluated. Also, when compared with the other options of comparable size, the Beatty Canyon site is more representative within its apparent drainage area with respect to the primary land uses of the Santa Fe FCB HUC-12 for the group members that are represented by the site. The outfall location and land uses are displayed on Figure 4-4. Sampling will occur at the nearest upstream manhole. Other factors that contributed to the selection of the Beatty Canyon drain include easy access to the manhole, being located in an area where traffic can easily be diverted around the site during setup and tear-down of autosampling equipment, and receipt of drainage from both the City of Azusa and County.
- 30 -

Rio Hondo/San Gabriel River Water Quality Group Coordinated Integrated Monitoring Program
Figure 4-4 Stormwater Outfall Monitoring Site – Santa Fe FCB HUC-12
- 31 -

Rio Hondo/San Gabriel River Water Quality Group Coordinated Integrated Monitoring Program
4.2.4 City of Monrovia The City of Monrovia is in the Santa Anita Wash and Santa Fe FCB HUC-12s. One stormwater outfall monitoring site is used to represent all MS4 drainage areas within the City of Monrovia. Primary land use types of the City of Monrovia and the proposed stormwater outfall catchment area are presented in Table 4-7. Table 4-7 City of Monrovia Stormwater Outfall Monitoring Site Land Use
Comparison Land Use City of Monrovia Estimated Outfall Catchment Residential 63% 58% Commercial 30% 21% Open Space 7% 21% Agricultural 0% 0%
Table 4-8 Stormwater Outfall Monitoring Site – City of Monrovia
HUC-12 City Drain Name Size Shape Material Latitude Longitude
Santa Anita Wash1,2 Monrovia
BI 0025 Peck Road
Drain
117 inches
Square or Rectangle RCB 34.118660 -118.003890
1 Drain eventually discharges to Sawpit Wash. 2 Manhole location.
The primary factor contributing to the selection of the BI 0025 Peck Road Drain is its representativeness within its apparent drainage area with respect to the primary land uses of the City of Monrovia, with the exception of open space. The outfall and respective land uses are shown on Figure 4-5. Because the outfall is located outside of the RH/SGRWQG area, sampling will occur at the nearest upstream manhole within the RH/SGRWQG area. Other factors that contributed to the selection of the BI 0025 Peck Road Drain include easy access to the manhole, a drainage area which is larger than other evaluated sites, and receipt of drainage from primarily the City of Monrovia.
- 32 -
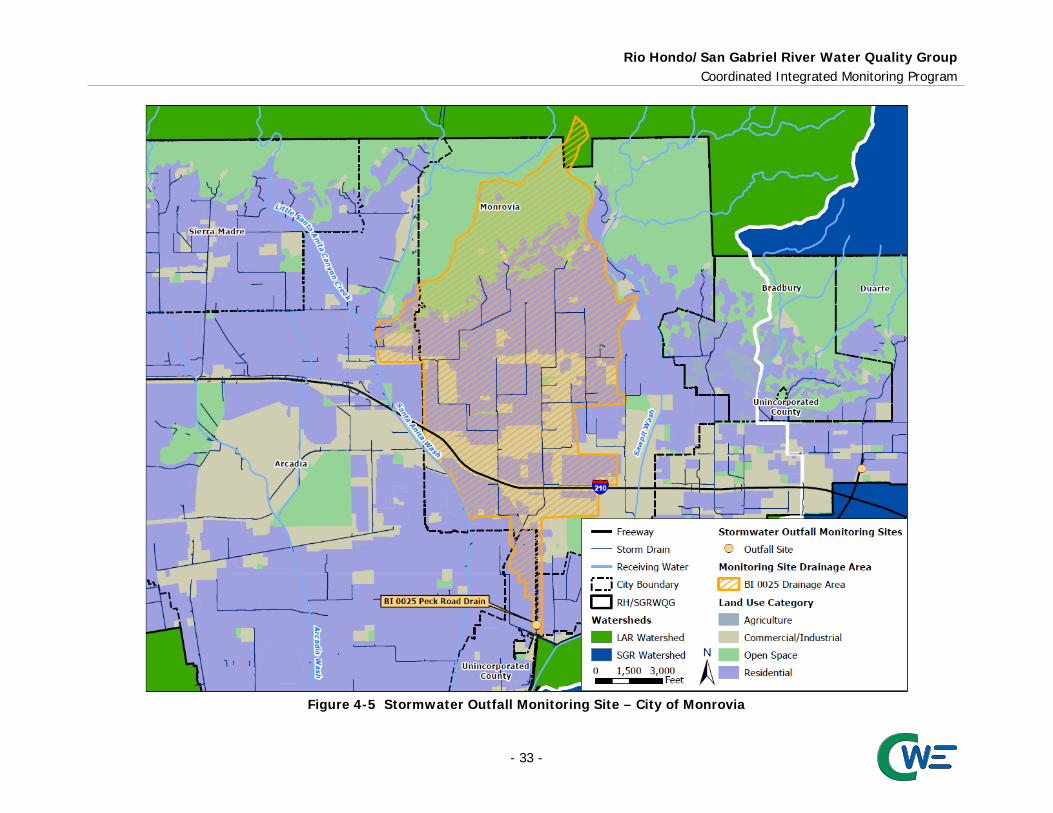
Rio Hondo/San Gabriel River Water Quality Group Coordinated Integrated Monitoring Program
Figure 4-5 Stormwater Outfall Monitoring Site – City of Monrovia
- 33 -

Rio Hondo/San Gabriel River Water Quality Group Coordinated Integrated Monitoring Program
4.2.5 Cities of Bradbury and Duarte The Cities of Bradbury and Duarte are in the Santa Anita Wash and Santa Fe FCB HUC-12s. One stormwater outfall monitoring site is used to represent all MS4 drainage areas within the Cities of Bradbury and Duarte. Primary land use types of the Cities of Bradbury and Duarte stormwater outfall estimated catchment area are presented in Table 4-9. Table 4-10 provides relevant information for the Cities of Bradbury and Duarte monitoring site. Table 4-9 Cities of Bradbury and Duarte Stormwater Outfall Monitoring Site Land
Use Comparison Land Use Cities of Bradbury and Duarte Estimated Outfall Catchment Residential 64% 61% Commercial 22% 16% Open Space 9% 20% Agricultural 5% 3%
Table 4-10 Stormwater Outfall Monitoring Site – Cities of Bradbury and Duarte
HUC-12 City Drain Name Size Shape Material Latitude Longitude
Santa Fe FCB Duarte Bradbury
Drain 156
inches Square or Rectangle RCB 34.137830 -117.955760
The primary factor contributing to the selection of the Bradbury Drain is its representativeness within its apparent drainage area with respect to the primary combined land uses of the Cities of Bradbury and Duarte. The outfall location and land uses are displayed on Figure 4-6. Other factors that contributed to the selection of the Bradbury Drain include available space for the placement of a permanent sampling station, if desired, safe and easy access for setup and tear-down of autosampling equipment, a drainage area which is larger than the other sites which were evaluated, and receipt of drainage from both the Cities of Bradbury and Duarte.
- 34 -

Rio Hondo/San Gabriel River Water Quality Group Coordinated Integrated Monitoring Program
Figure 4-6 Stormwater Outfall Monitoring Site – Cities of Bradbury and Duarte
- 35 -

Rio Hondo/San Gabriel River Water Quality Group Coordinated Integrated Monitoring Program
4.3 Monitored Constituents and Frequency Outfalls discharging to flowing water bodies will be monitored for all required constituents during three storm events per year concurrently with receiving water monitoring, with the exception of toxicity. Toxicity monitoring is only required when triggered by recent receiving water toxicity monitoring where a toxicity identification evaluation (TIE) on the observed receiving water toxicity test was inconclusive. The requirements for monitored constituents at each outfall are outlined in the MRP (Part VIII.B.1.c). Additionally, constituents in Table E-2 of the MRP, Attachment C, will not be able to be identified as exceeding applicable water quality objectives until after the first year of LTA monitoring. An overview of the MRP required constituents is listed in Table 4-11. Table 4-11 List of Constituents and Frequency for Stormwater Outfall Monitoring
of Drains Discharging to Respective Water Bodies
Constituents
Receiving Water to which Outfall is Discharging (number of wet-weather events per year)
Arcadia Wash
Sawpit Wash
San Gabriel River Reach 5
Big Dalton Wash
Drain BI 0602 – Line B
Peck Road Drain
Beatty Canyon & Bradbury Drain
BI 1219 – Line C
Flow, hardness, pH, dissolved oxygen, temperature, specific conductivity, and TSS
3 3 3 3
Table E-2 pollutants detected above relevant objectives1 3 3 3 3
Total and Dissolved Copper 3 3 3 3 Total and Dissolved Lead 3 3 3 3 Total and Dissolved Zinc 3 3 3 3 Total and Dissolved Cadmium 3 3 E. coli 3 3 3 3 TOC 12 1 DDT3, PCBs4, Dieldrin, and Chlordane5 1 1 Bis(2-ethylhexy)phthalate 3 1 Defined after the first monitoring season and an evaluation of the Table E-2 constituents is performed at the
nearest receiving water/LTA site. 2 Monitored over the same storm as receiving water monitoring. 3 DDT is defined as the sum of 2,4’-DDD, 2,4’-DDE, 2,4’-DDT, 4,4’-DDD, 4,4’-DDE, and 4,4’-DDT. 4 To allow appropriate comparisons between potential sources and effects, the full suite of PCB congeners are to
be analyzed for each matrix. PCBs are defined as the sum of 54 PCB congeners when analyzed in the water column, sediment or suspended solids, including: 8, 18, 28, 31, 33, 37, 44, 49, 52, 56, 60, 66, 70, 74, 77, 81, 87, 95, 97, 99, 101, 105, 110, 114, 118, 119, 123, 126, 128, 132, 138, 141, 149, 151, 153, 156, 157, 158, 167, 168, 169, 170, 174, 177, 180, 183, 187, 189, 194, 195, 201, 203, 206, and 209.
5 Chlordane includes analyses for the following species: alpha-chlordane, gamma-chlordane, oxychlordane, cis-Nonachlor, and trans-Nonachlor.
- 36 -
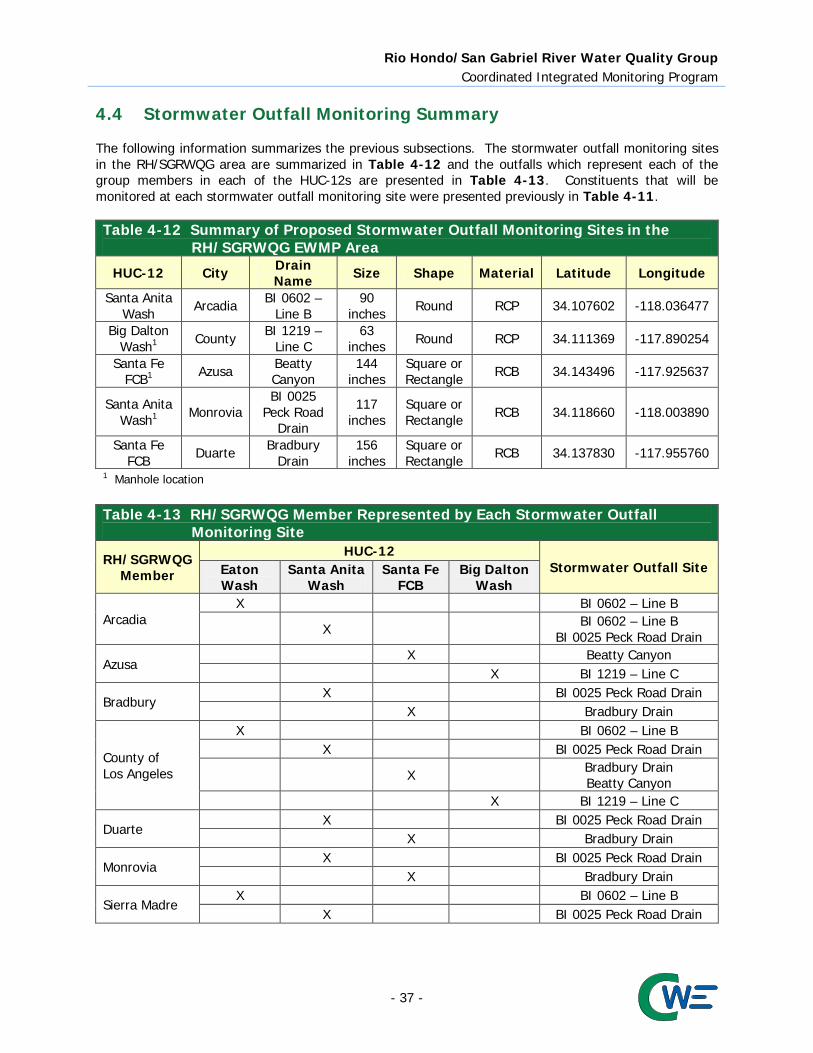
Rio Hondo/San Gabriel River Water Quality Group Coordinated Integrated Monitoring Program
4.4 Stormwater Outfall Monitoring Summary The following information summarizes the previous subsections. The stormwater outfall monitoring sites in the RH/SGRWQG area are summarized in Table 4-12 and the outfalls which represent each of the group members in each of the HUC-12s are presented in Table 4-13. Constituents that will be monitored at each stormwater outfall monitoring site were presented previously in Table 4-11. Table 4-12 Summary of Proposed Stormwater Outfall Monitoring Sites in the
RH/SGRWQG EWMP Area
HUC-12 City Drain Name Size Shape Material Latitude Longitude
Santa Anita Wash Arcadia BI 0602 –
Line B 90
inches Round RCP 34.107602 -118.036477
Big Dalton Wash1 County BI 1219 –
Line C 63
inches Round RCP 34.111369 -117.890254
Santa Fe FCB1 Azusa Beatty
Canyon 144
inches Square or Rectangle RCB 34.143496 -117.925637
Santa Anita Wash1 Monrovia
BI 0025 Peck Road
Drain
117 inches
Square or Rectangle RCB 34.118660 -118.003890
Santa Fe FCB Duarte Bradbury
Drain 156
inches Square or Rectangle RCB 34.137830 -117.955760
1 Manhole location Table 4-13 RH/SGRWQG Member Represented by Each Stormwater Outfall
Monitoring Site
RH/SGRWQG Member
HUC-12 Stormwater Outfall Site Eaton
Wash Santa Anita
Wash Santa Fe
FCB Big Dalton
Wash
Arcadia X BI 0602 – Line B
X BI 0602 – Line B BI 0025 Peck Road Drain
Azusa X Beatty Canyon X BI 1219 – Line C
Bradbury X BI 0025 Peck Road Drain X Bradbury Drain
County of Los Angeles
X BI 0602 – Line B X BI 0025 Peck Road Drain
X Bradbury Drain Beatty Canyon
X BI 1219 – Line C
Duarte X BI 0025 Peck Road Drain X Bradbury Drain
Monrovia X BI 0025 Peck Road Drain X Bradbury Drain
Sierra Madre X BI 0602 – Line B X BI 0025 Peck Road Drain
- 37 -

Rio Hondo/San Gabriel River Water Quality Group Coordinated Integrated Monitoring Program
5. Non-Stormwater Outfall Program Objectives of the non-stormwater outfall monitoring include the following:
Determine whether a discharge is in compliance with applicable non-stormwater WQBELs derived from TMDL WLAs.
Determine whether a discharge exceeds non-stormwater action levels. Determine whether a discharge contributes to or causes an exceedance of RWLs. Assist in identifying illicit discharges.
Additionally, the outfall screening and monitoring process is intended to prioritize outfalls for assessment and, where appropriate, scheduling of BMPs to address the non-stormwater flows. The Non-Stormwater Outfall Screening and Monitoring Program is focused on dry-weather discharges to receiving waters from major outfalls. The program fills two roles, the first is to provide assessment of whether the non-stormwater discharges are potentially impacting the receiving water, and the second is to determine whether significant non-stormwater discharges are allowable. The non-stormwater outfall program is complimentary to the Illicit Connection/Illicit Discharge minimum control measure. Non-stormwater outfall monitoring sites will be determined after the screening events are completed and an inventory of outfalls is created. Constituents monitored at each non-stormwater outfall site will depend upon the receiving water on which it is located. Additionally, the outfall screening and monitoring process is intended to meet the following objectives (Part IX.A of the MRP):
1. Develop criteria or other means to ensure that all outfalls with significant non-stormwater discharges are identified and assessed during the term of the MS4 Permit.
2. For outfalls determined to have significant non-stormwater flow, determine whether flows are the result of IC/IDs, authorized or conditionally exempt non-stormwater flows, natural flows, or from unknown sources.
3. Refer information related to identified IC/IDs to the IC/ID Elimination Program (Part VI.D.10 of the MS4 Permit) for appropriate action.
4. Based on existing screening or monitoring data or other institutional knowledge, assess the impact of non-stormwater discharges (other than identified IC/IDs) on the receiving water.
5. Prioritize monitoring of outfalls considering the potential threat to the receiving water and applicable TMDL compliance schedules.
6. Conduct monitoring or assess existing monitoring data to determine the impact of non-stormwater discharges on the receiving water.
7. Conduct monitoring or other investigations to identify the source of pollutants in non-stormwater discharges.
8. Use results of the screening process to evaluate the conditionally exempt non-stormwater discharges identified in Parts III.A.2 and III.A.3 of the MS4 Permit and take appropriate actions pursuant to Part III.A.4.d of the MS4 Permit for those discharges that have been found to be a source of pollutants. Any future reclassification shall occur per the conditions in Parts III.A.2 or III.A.6 of the MS4 Permit.
9. Maximize the use of resources by integrating the screening and monitoring process into existing or planned IMP and/or CIMP efforts.
In summary, the intent of the Non-Stormwater Outfall Program is to demonstrate that the group members are effectively prohibiting non-exempt or conditionally non-exempt discharges to receiving waters and to assess whether non-stormwater discharges are causing or contributing to exceedances of RWLs. By detecting, identifying, and eliminating illicit discharges, the program will demonstrate efforts
- 38 -

Rio Hondo/San Gabriel River Water Quality Group Coordinated Integrated Monitoring Program
by the RH/SGRWQG to effectively prohibit non-stormwater discharges to and from the MS4. Where the discharges are deemed “significant,” the program will discern whether they are illicit, exempt, or conditionally exempt. Furthermore, following the program procedures will allow determination of whether the discharges may be causing or contributing to exceedances of RWLs. The MS4 Permit specifies a process for screening, investigating, and ultimately monitoring of outfalls with non-stormwater discharges. The outfall screening and investigations must be completed prior to initiating monitoring at an individual outfall. A flowchart of the program is presented as Figure 5-1. Detailed discussion of each element is provided in the following subsections.
Figure 5-1 Non-Stormwater Outfall Program Flow Diagram
- 39 -

Rio Hondo/San Gabriel River Water Quality Group Coordinated Integrated Monitoring Program
5.1 Implementation of Non-Stormwater Outfall Screening and
Monitoring Program in Rio Hondo Portion of the RH/SGRWQG Area
For the Rio Hondo portion of the RH/SGRWQG area, of the constituents addressed by TMDLs for which WQBELs and RWLs were incorporated into the MS4 Permit, E. coli consistently exceeds RWLs for dry-weather discharges, and is assumed a reasonable evaluation characteristic. All other TMDL-related WQBELs and RWLs are primarily associated with wet-weather discharges. Additionally, the LAR Bacteria TMDL Basin Plan Amendment requires Permittees to conduct outfall monitoring. The RH/SGRWQG intends to prepare a Load Reduction Strategy (LRS) to comply with the LAR Bacteria TMDL. The LRS for the Rio Hondo is due March 2016. Non-stormwater screening and monitoring is proposed to be integrated with the LAR Bacteria TMDL monitoring requirements for the LRS compliance path. The non-stormwater monitoring sites are to be determined through the non-stormwater outfall screening and the source identification process required by the MS4 Permit. E. coli loading is proposed as the primary characteristic for determining significant non-stormwater discharges. Table 5-1 presents the components of the outfall screening process for the Rio Hondo portion of the RH/SGRWQG area. Table 5-1 Non-Stormwater Outfall Screening Process for Los Angeles River WMA
Utilizing E. coli to Determine Significant Non-Stormwater Discharges Component Description
Characteristics for Defining Significant Non-Stormwater Discharges
To be consistent with the top dectile of discharges as discussed in the Load Reduction Strategy outlined in the LA River Bacteria TMDL, the top 10% of the ranked outfalls will be determined to be significant non-stormwater discharges. The ranking score is the sum of the following three ranking criteria: Does the non-stormwater discharge reach the receiving water
during dry-weather? If yes, continue through the ranking criteria. E. coli loading rate: for each outfall monitored during the Non-
Stormwater Outfall Screening Process, the average E. coli loading rate from the six outfall surveys will be calculated. The average E. coli loading rates from all outfalls will be ranked from highest to lowest. A ranking score will be applied to each outfall based on the decitile (10th percentile, 20th percentile, etc.,) of its average E. coli loading rate.
Number of dry-weather exceedance days at the nearest downstream receiving water site: a ranking score will also be applied to outfalls based on the number of dry-weather exceedance days exhibited at the nearest downstream receiving water site. The total number of dry-weather (summer dry- and winter-dry) exceedance days during the Non-Stormwater Outfall Screening Process will be used. Each receiving water site will be ranked from highest to lowest based on the total number of exceedance days.
Data Collection Data that will need to be collected include accurate flow measurements AND E. coli. Additionally, information needed to complete the inventory will be collected.
Frequency
A total of six sampling events will be performed. Three times as part of the initial screening process. The remaining three monitoring events to meet the requirements of the LAR Bacteria TMDL will be completed as part of the non-stormwater outfall monitoring.
Timeline It is proposed that commencement of the screening process occur in 2014.
- 40 -

Rio Hondo/San Gabriel River Water Quality Group Coordinated Integrated Monitoring Program
An alternative frequency is proposed to integrate the approach to screening and identification of significant non-stormwater discharges with the LAR Bacteria TMDL outfall monitoring requirements. The frequency of the LAR Bacteria outfall monitoring is six times prior to submission of a Load Reduction Strategy. Although monitoring is normally not required during screening, Bacteria TMDL outfall monitoring will be conducted concurrently for increased efficiency. The frequency of sample collection for the screening and monitoring events are as follows:
Screening: Sample collection will be conducted six times at all flowing storm drains to establish the outfalls with significant non-stormwater discharges and meet the LAR Bacteria TMDL outfall monitoring requirements.
Monitoring at outfalls with significant non-stormwater discharges will be re-evaluated consistent with the MS4 Permit requirements on page E-28 of the MRP. Given that the Load Reduction Strategy is due on March 23, 2016, it is proposed that the screening process begin in Summer 2014 and monitoring begin in July 2015. As the proposed approach for identifying significant non-stormwater discharges already focuses on ranking outfalls based upon each outfall’s individual ranking score, it is recommended that the following alternative prioritization criteria be utilized:
1. Outfalls which have the highest ranking score. 2. Outfalls for which monitoring data exist and indicate recurring exceedances of one or more of the
Action Levels identified in Attachment G of the MS4 Permit. In terms of scheduling source investigations, it is recommended the scheduling focus on the outfalls with the highest ranking scores first. Outfalls will be monitored for all required constituents except toxicity. Toxicity monitoring is only required when triggered by recent receiving water toxicity monitoring where a TIE on the observed receiving water toxicity test was inconclusive.
- 41 -
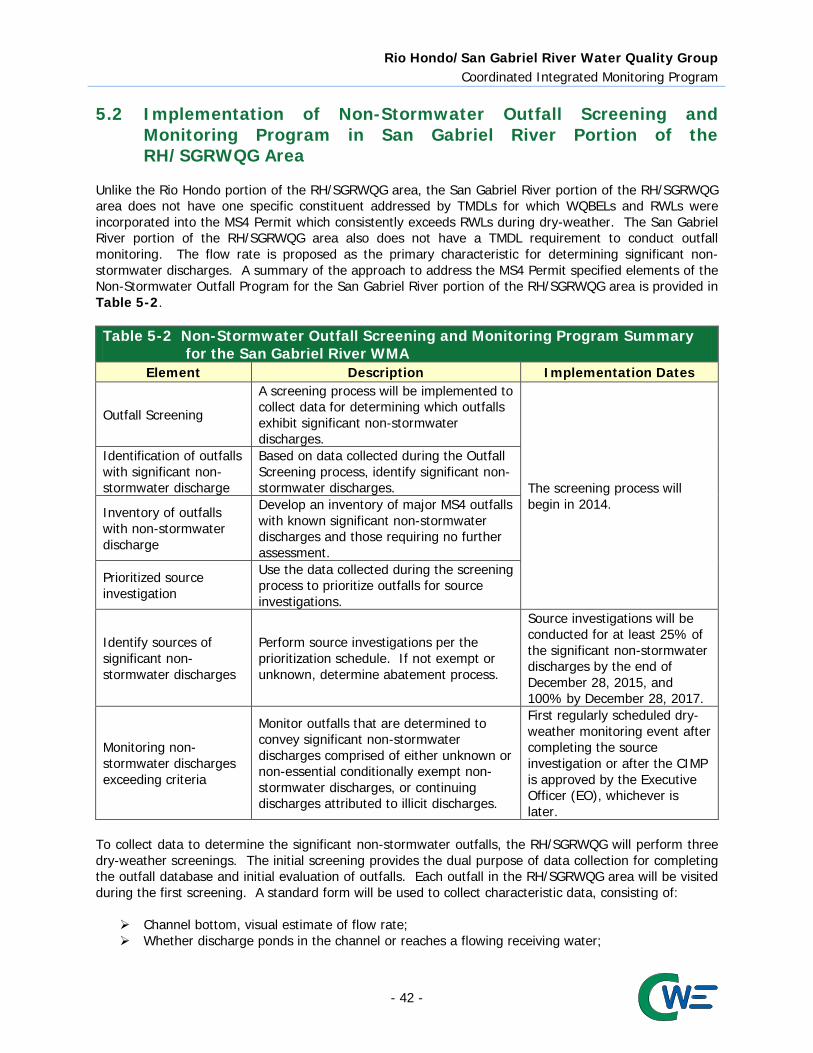
Rio Hondo/San Gabriel River Water Quality Group Coordinated Integrated Monitoring Program
5.2 Implementation of Non-Stormwater Outfall Screening and
Monitoring Program in San Gabriel River Portion of the RH/SGRWQG Area
Unlike the Rio Hondo portion of the RH/SGRWQG area, the San Gabriel River portion of the RH/SGRWQG area does not have one specific constituent addressed by TMDLs for which WQBELs and RWLs were incorporated into the MS4 Permit which consistently exceeds RWLs during dry-weather. The San Gabriel River portion of the RH/SGRWQG area also does not have a TMDL requirement to conduct outfall monitoring. The flow rate is proposed as the primary characteristic for determining significant non-stormwater discharges. A summary of the approach to address the MS4 Permit specified elements of the Non-Stormwater Outfall Program for the San Gabriel River portion of the RH/SGRWQG area is provided in Table 5-2. Table 5-2 Non-Stormwater Outfall Screening and Monitoring Program Summary
for the San Gabriel River WMA Element Description Implementation Dates
Outfall Screening
A screening process will be implemented to collect data for determining which outfalls exhibit significant non-stormwater discharges.
The screening process will begin in 2014.
Identification of outfalls with significant non-stormwater discharge
Based on data collected during the Outfall Screening process, identify significant non-stormwater discharges.
Inventory of outfalls with non-stormwater discharge
Develop an inventory of major MS4 outfalls with known significant non-stormwater discharges and those requiring no further assessment.
Prioritized source investigation
Use the data collected during the screening process to prioritize outfalls for source investigations.
Identify sources of significant non-stormwater discharges
Perform source investigations per the prioritization schedule. If not exempt or unknown, determine abatement process.
Source investigations will be conducted for at least 25% of the significant non-stormwater discharges by the end of December 28, 2015, and 100% by December 28, 2017.
Monitoring non-stormwater discharges exceeding criteria
Monitor outfalls that are determined to convey significant non-stormwater discharges comprised of either unknown or non-essential conditionally exempt non-stormwater discharges, or continuing discharges attributed to illicit discharges.
First regularly scheduled dry-weather monitoring event after completing the source investigation or after the CIMP is approved by the Executive Officer (EO), whichever is later.
To collect data to determine the significant non-stormwater outfalls, the RH/SGRWQG will perform three dry-weather screenings. The initial screening provides the dual purpose of data collection for completing the outfall database and initial evaluation of outfalls. Each outfall in the RH/SGRWQG area will be visited during the first screening. A standard form will be used to collect characteristic data, consisting of:
Channel bottom, visual estimate of flow rate; Whether discharge ponds in the channel or reaches a flowing receiving water;
- 42 -

Rio Hondo/San Gabriel River Water Quality Group Coordinated Integrated Monitoring Program
Clarity; and Presence of odors and foam.
Additionally, outstanding information for the MS4 inventory database will be collected, including, at a minimum, geographically referenced photographs. Flow rates will be identified as: no flow, trickle, more than a trickle. On the second and third screenings, drains larger than 12 inches in diameter and equivalent rectangular shaped will be investigated. Where discharge is present at least two of the three visits, the flow rates will be ranked and used as one metric in the significance determination. An analysis of land use and permitted discharges will be considered in addition to the data collected from the three screenings to evaluate the non-stormwater flows and determine which are significant. The screening process is outlined in Table 5-3. Outfalls would be monitored for all required constituents except toxicity. Toxicity monitoring is only required when triggered by recent receiving water toxicity monitoring where a TIE on the observed receiving water toxicity test was inconclusive.
Table 5-3 Approach for Establishing a Non-Stormwater Outfall Screening Process Component Description
Data Collection
Data include flow measurements, channel bottom, ponding of discharge, clarity, color, odor, foam, and standard field parameters. Land use and permitted dischargers will be considered in the evaluation with field data to determine significant non-stormwater discharge.
Frequency
Three assessments will be conducted as part of the initial screening process. The first screening will collect visual information on all drains. The second and third screenings will collect visual data from flowing drains greater than 12 inches in diameter.
Defining Significant Discharges
Perform GIS analysis and screen out drains between 12 and 36 inches in diameter that are not associated with industrial land use. Assess the flow rate for each outfall. Visual for the first, and measured on each additional visit. For outfalls where the flow was observed on two visits, rank the flow from highest to lowest. Including consideration of characteristic data and land use information if appropriate to determine list of significant non-stormwater discharges.
Timeline The non-stormwater outfall screening process will begin implementation in 2014.
1 The non-stormwater screening process will be repeated each MS4 Permit cycle (nominally, a five year period), or where requirements are eliminated in a subsequent MS4 Permit.
5.3 Inventory of MS4 Outfalls with Non-Stormwater Discharges An inventory of MS4 outfalls must be developed identifying those outfalls with known significant non-stormwater discharges and those requiring no further assessment (Part IX.D of the MRP). If the MS4 outfall requires no further assessment, the inventory must include the rationale for the determination of no further action required. Rationale for a determination of no future action will be expected to include: (1) the outfall does not have flow; (2) the outfall does not have a known significant non-stormwater discharge; or (3) discharges observed were determined to be exempt. The inventory will be included in a database as required by the MRP. Each year, the inventory must be updated to incorporate the most recent characterization data for outfalls with significant non-stormwater discharges.
- 43 -

Rio Hondo/San Gabriel River Water Quality Group Coordinated Integrated Monitoring Program
The following physical attributes of outfalls with significant non-stormwater discharges must be included in the inventory and is being collected as part of the screening process described in Section 5.1 and Section 5.2:
a. Date and time of last visual observation or inspection b. Outfall alpha-numeric identifier c. Description of outfall structure including size (e.g., diameter and shape) d. Description of receiving water at the point of discharge (e.g., natural, soft-bottom with armored
sides, trapezoidal, concrete channel) e. Latitude/longitude coordinates f. Nearest street address g. Parking, access, and safety considerations h. Photographs of outfall condition i. Photographs of significant non-stormwater discharge or indicators of discharge unless safety
considerations preclude obtaining photographs j. Estimation of discharge rate k. All diversions either upstream or downstream of the outfall l. Observations regarding discharge characteristics such as turbidity, odor, color, presence of
debris, floatables, or characteristics that could aid in pollutant source identification. 5.4 Prioritized Source Identification Once the major outfalls exhibiting significant non-stormwater discharges have been identified through the screening process and incorporated in the inventory, Part IX.E of the MRP requires that the RH/SGRWQG prioritize the outfalls for further source investigations. The MRP identifies the following prioritization criteria for outfalls with significant non-stormwater discharges:
Outfalls discharging directly to receiving waters with WQBELs or RWLs in the TMDL provisions for which final compliance deadlines have passed.
All major outfalls and other outfalls that discharge to a receiving water subject to a TMDL shall be prioritized according to TMDL compliance schedules.
Outfalls for which monitoring data exist and indicate recurring exceedances of one or more of the Action Levels identified in Attachment G of the MS4 Permit.
All other major outfalls identified to have significant non-stormwater discharges. Once the prioritization is complete, a source identification schedule will be developed. The scheduling will focus on the outfalls with the highest pollutant of concern loading rates first. Unless the results of the field screening justify a modification to the schedule in the MRP, the schedule will ensure that source investigations are completed on no less than 25% of the outfalls with significant non-stormwater discharges by December 28, 2015, and 100% by December 28, 2017. As the proposed approach for identifying significant non-stormwater discharges already focuses on ranking outfalls based upon each outfall’s pollutant of concern loading rate, it is recommended that alternative prioritization criteria be utilized as follows:
1. Outfalls which have the highest pollutant of concern loading rate (Rio Hondo subwatershed only). 2. Outfalls for which monitoring data exist and indicate recurring exceedances of one or more of the
Action Levels identified in Attachment G of the MS4 Permit.
- 44 -
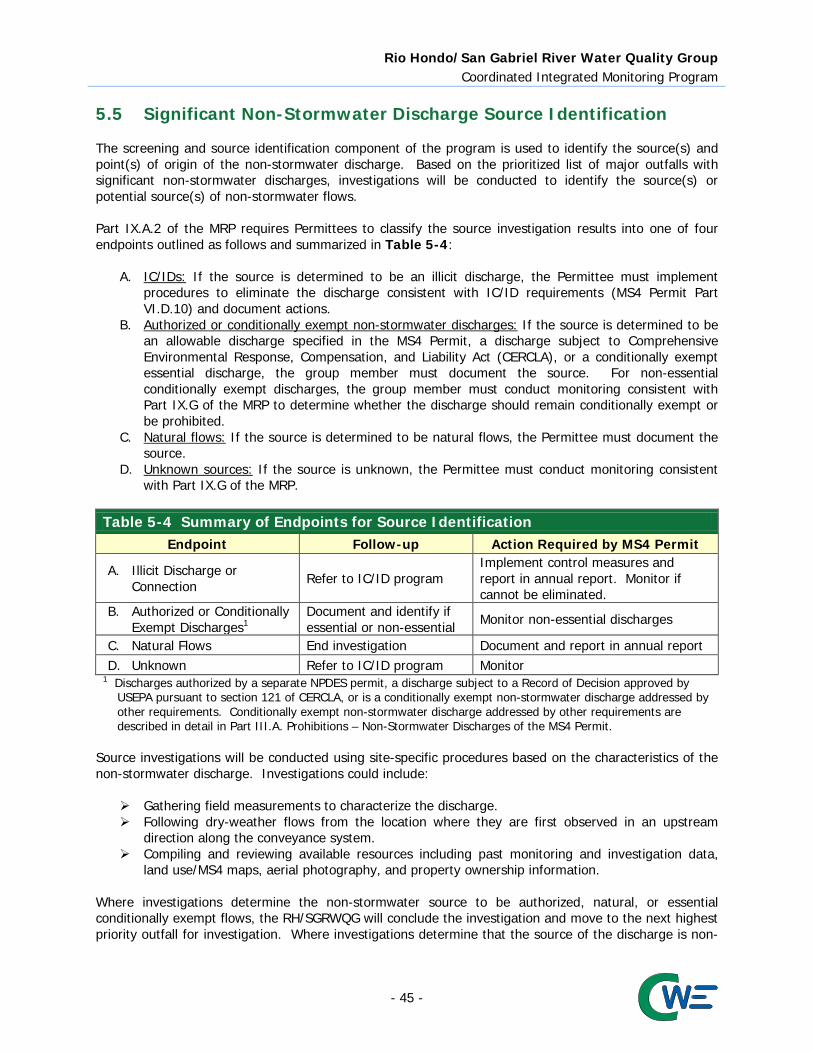
Rio Hondo/San Gabriel River Water Quality Group Coordinated Integrated Monitoring Program
5.5 Significant Non-Stormwater Discharge Source Identification The screening and source identification component of the program is used to identify the source(s) and point(s) of origin of the non-stormwater discharge. Based on the prioritized list of major outfalls with significant non-stormwater discharges, investigations will be conducted to identify the source(s) or potential source(s) of non-stormwater flows. Part IX.A.2 of the MRP requires Permittees to classify the source investigation results into one of four endpoints outlined as follows and summarized in Table 5-4:
A. IC/IDs: If the source is determined to be an illicit discharge, the Permittee must implement procedures to eliminate the discharge consistent with IC/ID requirements (MS4 Permit Part VI.D.10) and document actions.
B. Authorized or conditionally exempt non-stormwater discharges: If the source is determined to be an allowable discharge specified in the MS4 Permit, a discharge subject to Comprehensive Environmental Response, Compensation, and Liability Act (CERCLA), or a conditionally exempt essential discharge, the group member must document the source. For non-essential conditionally exempt discharges, the group member must conduct monitoring consistent with Part IX.G of the MRP to determine whether the discharge should remain conditionally exempt or be prohibited.
C. Natural flows: If the source is determined to be natural flows, the Permittee must document the source.
D. Unknown sources: If the source is unknown, the Permittee must conduct monitoring consistent with Part IX.G of the MRP.
Table 5-4 Summary of Endpoints for Source Identification Endpoint Follow-up Action Required by MS4 Permit
A. Illicit Discharge or Connection Refer to IC/ID program
Implement control measures and report in annual report. Monitor if cannot be eliminated.
B. Authorized or Conditionally Exempt Discharges1
Document and identify if essential or non-essential Monitor non-essential discharges
C. Natural Flows End investigation Document and report in annual report D. Unknown Refer to IC/ID program Monitor
1 Discharges authorized by a separate NPDES permit, a discharge subject to a Record of Decision approved by USEPA pursuant to section 121 of CERCLA, or is a conditionally exempt non-stormwater discharge addressed by other requirements. Conditionally exempt non-stormwater discharge addressed by other requirements are described in detail in Part III.A. Prohibitions – Non-Stormwater Discharges of the MS4 Permit.
Source investigations will be conducted using site-specific procedures based on the characteristics of the non-stormwater discharge. Investigations could include:
Gathering field measurements to characterize the discharge. Following dry-weather flows from the location where they are first observed in an upstream
direction along the conveyance system. Compiling and reviewing available resources including past monitoring and investigation data,
land use/MS4 maps, aerial photography, and property ownership information. Where investigations determine the non-stormwater source to be authorized, natural, or essential conditionally exempt flows, the RH/SGRWQG will conclude the investigation and move to the next highest priority outfall for investigation. Where investigations determine that the source of the discharge is non-
- 45 -

Rio Hondo/San Gabriel River Water Quality Group Coordinated Integrated Monitoring Program
essential conditionally exempt, an illicit discharge, or is unknown – further investigation may be conducted to eliminate the discharge or demonstrate that it is not causing or contributing to receiving water problems. Where the discharge is demonstrated to cause or contribute to receiving water exceedances, the regional board will be notified within 30 days of making the determination. In some cases, source investigations may ultimately lead to prioritized programmatic or structural BMPs. Where group members determine that they will address the non-stormwater discharge through modifications to programs or by structural BMP implementation, the RH/SGRWQG will incorporate the approach into the implementation schedule developed for the EWMP and the outfall can be lowered in priority for investigation, such that the next highest priority outfall can be addressed. 5.6 Non-Stormwater Discharge Monitoring As outlined in the MRP, outfalls with significant non-stormwater discharges that remain unaddressed after source investigation shall be monitored to meet the following objectives:
1. Determine whether a Permittee’s discharge is in compliance with applicable non-stormwater WQBELs derived from TMDL WLAs;
2. Determine if the quality of a Permittee’s discharge exceeds non-stormwater action levels, as described in Attachment G of the MS4 Permit; and
3. Determine whether a Permittee’s discharge causes or contributes to an exceedance of receiving water limitations.
As identified in Table 5-4, outfalls that have been determined to convey significant non-stormwater discharges where the source investigations concluded that the source is attributable to a continued illicit discharge (Endpoint A), non-essential conditionally exempt (Endpoint B), or unknown (Endpoint D) must be monitored. The requirements for constituents to be monitored are outlined in MS4 Permit Part VIII.G.1.a-e of the MRP. If the conclusion of a source investigation is that monitoring is required, the outfall will be added to the dry-weather monitoring sites and sampled beginning on the next regularly scheduled event. Monitoring results and an assessment of whether the discharge may be causing or contributing to exceedances of RWLs will be included in the annual report. 5.6.1 Non-Stormwater Outfall-Based Monitoring Sites The outfall screening and prioritization approach will result in an inventory of outfalls. Where required, the non-stormwater discharge will be monitored per the MS4 Permit requirements. The monitoring is described in the following section. 5.6.2 Monitored Constituents and Frequency Outfalls will be monitored for all required constituents except toxicity (toxicity monitoring is only required when triggered by recent receiving water toxicity monitoring where a TIE on the observed receiving water toxicity test was inconclusive). Additionally, constituents in Table E-2 of the MRP, will not be able to be identified as exceeding applicable water quality objectives until after the first year of LTA monitoring. While a monitoring frequency of four times per year is specified in the MS4 Permit, it is inconsistent with the dry-weather receiving water monitoring requirements. The receiving water monitoring requires two dry-weather monitoring events per year. Additionally, during the term of the current MS4 Permit, outfalls are required to be screened at least once and those with significant non-stormwater discharges will be subject to a source investigation. As a result, non-stormwater outfall monitoring events will be conducted twice per year. The non-stormwater outfall monitoring events will be coordinated with the dry-weather receiving water monitoring events to allow for an evaluation of whether the non-stormwater discharges
- 46 -
Rio Hondo/San Gabriel River Water Quality Group Coordinated Integrated Monitoring Program
are causing or contributing to an observed exceedance of water quality objectives in the receiving water. To be consistent with receiving water monitoring, non-stormwater monitoring will consist of collecting grab samples. Non-stormwater outfall monitoring sites will be determined after the screening events have been completed and an inventory of outfalls has been created. Constituents that will be monitored at each non-stormwater outfall site will depend upon the receiving water to which the non-stormwater outfall monitoring site discharges. A list of constituents applicable to non-stormwater outfall monitoring, based on discharge to which receiving water, is presented in Table 5-5. 5.6.3 Adaptive Monitoring Monitoring for non-stormwater discharges will be more dynamic than either the receiving water or stormwater outfall monitoring. Where source identifications are completed and monitoring is required, the outfall will be added to the site list for subsequent dry-weather monitoring events. Monitoring at outfalls with significant non-stormwater discharges will be re-evaluated annually consistent with the triggers outlined in Section 10.2. Modifications to the monitored constituents for each outfall will be detailed in the following annual report. As non-stormwater discharges are addressed, monitoring at the outfall will cease. Thus, the number and location of outfalls monitored has the potential to change on an annual basis. The process for adapting monitoring locations and frequency is presented in Section 10.
- 47 -

Rio Hondo/San Gabriel River Water Quality Group Coordinated Integrated Monitoring Program
Table 5-5 List of Constituents for Non-Stormwater Outfall Monitoring
Constituents Arcadia Wash
Santa Anita Wash
Little Santa Anita
Canyon Creek
Sawpit Wash
Rio Hondo
Reach 3
San Gabriel River
Reach 5
Little Dalton Wash
Big Dalton Wash
San Dimas Wash
Flow, hardness, pH, dissolved oxygen, temperature, specific conductivity, and TSS
X X X X X X X X X
Table E-2 pollutants detected above relevant objectives1
X X X X X X X X X
Ammonia X X X X X Nitrate-N X X X X X Nitrite-N X X X X X Total and Dissolved Copper X X X X X X X X X Total and Dissolved Lead X X X X X X X X X Total and Dissolved Zinc X X X X X X X X X E. coli2 X X X X X Trash3 X X X X X X X X X 1 Monitoring for Table E-2 constituents only after first season of monitoring at the LTA sites. 2 In addition, to comply with the LAR Bacteria TMDL, at least six snapshots of the Rio Hondo must be conducted. The snapshot events shall include E. coli by
USEPA- approved methods and flow rate at all MS4 outfalls that are discharging to a segment or tributary or across jurisdictional boundaries during a given monitoring event.
3 Trash is only monitored in discharge if complying with WLAs through the installation of partial capture treatment systems and institutional controls.
- 48 -

Rio Hondo/San Gabriel River Water Quality Group Coordinated Integrated Monitoring Program
6. New Development/Re-Development Effectiveness Tracking 6.1 Program Objectives EWMP Group members are required to maintain databases to track specific information related to new and re-development projects subject to the Minimum Control Measures (MCM) in Part VI.D.7. The tracking requirements are applicable to projects that were approved on or after the effective date of the MS4 Permit (December 28, 2012). (Attachment E.X.A) The specific data to be tracked is listed in Attachment E.X.A of the MS4 Permit (see Table 6-1 below). The data will be used to assess the effectiveness of the LID requirements for land development and to fulfill reporting requirements. Table 6-1 Required Data to Track for New Development and Re-Development
Projects per Attachment E.X.A Name of the Project Project design storm volume (gallons or MGD)
Name of the Developer Percent of design storm volume to be retained onsite
Project location and map1 Design volume for water quality mitigation treatment BMPs (if any)
Documentation of issuance of requirements to the developer
One year, one hour storm intensity2 (if flow through treatment BMPs are approved)
85th percentile storm event for the project design (inches per 24 hours)
Percent of design storm volume to be infiltrated at an offsite mitigation or groundwater replenishment site
95th percentile storm event for projects draining to natural water bodies (inches per 24 hours)
Percent of design storm volume to be retained or treated with biofiltration at an offsite retrofit project
Other design criteria required to meet hydromodification requirements for drainages to natural water bodies
Location and maps of offsite mitigation, groundwater replenishment, or retrofit sites1
Project design storm (inches per 24 hours) Date of Certificate of Occupancy 1 Preferably linked to the GIS Storm Drain Map 2 As depicted on the most recently issued isohyetal map published by the Los Angeles County hydrologist
6.2 Existing New Development/Re-Development Tracking Procedures The Standard Urban Stormwater Mitigation Program (SUSMP) requirements implemented under the previous MS4 Permit (Order R4-01-182) laid the foundation for the MCMs contained in Part VI.D.7 of the current MS4 Permit. With implementation of the SUSMP, Permittees required post-construction BMPs on applicable projects, developed standard requirements for project submittals, and began to track related data. The Permittees will build on the existing procedures for land development to ensure that all required project data is captured. 6.3 Special Considerations for Data Management and Reporting Although the data requirements are clear, the procedures for reviewing projects, tracking data, and reporting are different for each jurisdiction and may even be different across departments within the same jurisdiction. Due to the complexity of land development processes across jurisdictions, there are certain challenges that will arise when revising or implementing new data tracking procedures. The following considerations will assist agencies in developing internal protocols to ensure data is tracked as required and managed to facilitate assessment and reporting.
- 49 -

Rio Hondo/San Gabriel River Water Quality Group Coordinated Integrated Monitoring Program
6.3.1 Data Management Data is collected across multiple departments and therefore there may be variations in the formatting of the information. Departments will often use proprietary software and data may be housed in various databases. 6.3.2 Additional Data When developing data management protocols and internal procedures, group members will also consider the land development data tracking requirements contained in Part VI.D.7.d.iv.(1)(a). These requirements are distinct from those listed in the MRP but will likely be addressed similarly. Data requirements under Part VI.D are contained in Table 6-2. Table 6-2 Required Data to Track for New Development and Re-Development
Projects per Part VI.D.7.d.iv.(1)(a) New Development and Re-Development Data, Per Part VI.D.7.d.iv.(1)(a)
Municipal Project ID Maintenance Records State Waste Discharge Identification Number Inspection Date(s) Project Acreage Inspection Summary(ies) BMP Type and Description Corrective Action(s) BMP Location (coordinates) Date Certificate of Occupancy Issued Date of Acceptance Replacement or Repair Date Date of Maintenance Agreement
6.3.3 Reporting Reporting requirements pertaining to new development and re-development are prescribed in Part VI.D.7 and in the MRP. The Permittees may identify and collect additional data as necessary through the land development process to facilitate annual reporting. 6.3.4 Information Sharing A data template has been developed with defined data entry fields to facilitate consistent data collection, consistent with the data fields and formats provided in Table 6-3. Where possible, data fields that are added to software programs in use within departments will adhere to these protocols. At minimum, when data is compiled for a jurisdiction prior to generating an annual report, the data will be collected according to these specified formats. Standardized data format will facilitate analysis and reporting between jurisdictions (i.e., at the watershed scale).
- 50 -

Rio Hondo/San Gabriel River Water Quality Group Coordinated Integrated Monitoring Program
Table 6-3 Standard Data Formats Data (Units) Standard Format
Name of the Project (None) Text Field (1-100 characters) Name of the Developer (None) Text Field (1-100 characters)
Project location and map (None) APN (XXX-XXX-XX-XX) Street Address (Text Field 1-100 Characters) Jurisdiction
Date of Certificate of Occupancy (None) MM/DD/YYYY 85th percentile storm event for the project design (inches per 24 hours) Numeric (0.01 – 5)
95th percentile storm event for projects draining to natural water bodies (inches per 24 hours) Numeric (0.01 – 5)
Other design criteria required to meet hydromodification requirements for drainages to natural water bodies (none)
Text Field (1-100 characters)
Project design storm (inches per 24 hours) Numeric (0.01 – 5) Project design storm volume (gallons(1) or MGD) Numeric (0.1 – 1,000,000,000) Percent of design storm volume to be retained onsite (percent) Numeric (0 – 100)
Design volume for water quality mitigation treatment BMPs (gallons1 or MGD) Numeric (0.1 – 1,000,000,000)
One year, one hour storm intensity for flow-through treatment BMPs (inches per hour) Numeric (0.01 – 20)
Percent of design storm volume to be infiltrated at an offsite mitigation or groundwater replenishment site (percent)
Numeric (0 – 100)
Percent of design storm volume to be retained or treated with biofiltration at an offsite retrofit project (percent)
Numeric (0 – 100)
Location and maps of offsite mitigation, groundwater replenishment, or retrofit sites (none)
APN (XXX-XXX-XX-XX) Street Address (Text Field 1-100 Characters) Jurisdiction
Documentation of issuance of requirements to the developer (none) MM/DD/YYYY 1 MS4 Permit specifies gallons or million gallons per day (MGD)
6.4 Summary of New Development/Re-Development Effectiveness
Tracking The RH/SGRWQG members have developed mechanisms for tracking new development and re-development projects that have been conditioned for post-construction BMPs pursuant to MS4 Permit Part VI.D. Mechanisms for tracking the effectiveness of these BMPs have been developed pursuant to MS4 Permit Attachment E.X. A sample tracking mechanism has been developed by the group members.
- 51 -

Rio Hondo/San Gabriel River Water Quality Group Coordinated Integrated Monitoring Program
7. Regional Studies Only one regional study is identified in the MRP: Southern California SMC Bioassessment Program. The SMC Bioassessment Program is a collaborative effort between all of the Phase I MS4 NPDES Permittees and NPDES regulatory agencies in Southern California. The goal of the SMC is to develop technical information necessary to better understand stormwater mechanisms and impacts, and develop tools to effectively and efficiently improve stormwater decision-making. The LACFCD will coordinate and assist in implementing the bioassessment monitoring requirement of the MS4 Permit on behalf of all Permittees in Los Angeles County during the current permit cycle. Monitoring under the first cycle concluded in 2013, with reporting of findings and additional special studies planned to occur in 2014. The SMC Joint Executive Workgroup is currently working on designing the bioassessment monitoring program for the next five-year cycle, which is scheduled to run from 2015 to 2019.
- 52 -

Rio Hondo/San Gabriel River Water Quality Group Coordinated Integrated Monitoring Program
8. Special Studies Special studies will be conducted at the discretion of the RH/SGRWQG. Where data become available to better assess the potential sources of impairments in the watersheds, the RH/SGRWQG will be better able to judge whether to perform the special studies. As monitoring progresses and information on the EWMP area receiving waters and outfalls becomes available, the special studies can be further defined and considered. Table 8-1 and Table 8-2 list the planned topics to be considered for special studies. Regional Board approval of this CIMP would allow timely implementation of special studies in the event the RH/SGRWQG chooses to pursue them. At the discretion of the RH/SGRWQG, the planned topics of special studies may be initiated to better understand the behavior of metals in their specific portion of the watershed. Table 8-1 Special Studies from LAR Metals TMDL Being Considered for
Implementation TMDL Planned Topics for Special Study
LAR Metals TMDL
Refined flow estimates where there presently are no flow gauges and for improved gauging of low-flow conditions Water quality measurements, including a better assessment of hardness, water chemistry data (e.g., TSS and organic carbon) that may refine the use of metals partitioning coefficients. Effects of studies designed to evaluate site-specific toxic effects of metals on the Los Angeles River and its tributaries Source studies designed to characterize loadings from background or natural sources Review of water quality modeling assumptions including the relationship between metals and TSS as expressed in the potency factors and buildup and wash-off and transport coefficients Evaluation of aerial deposition and sources of aerial deposition
Table 8-2 Special Studies from SGR Metals TMDL Being Considered for
Implementation Purpose Planned Topics for Special Study
Evaluate numeric targets Site-Specific Translator
Characterize sources Refine estimates of metals loading from open space and natural sources Evaluate contribution from and sources of atmospheric deposition
Refine modeling assumptions
Refine dry-weather source representation Refine stormwater translator Refine relationship between metals loading and suspended sediments Refine potency factors Refine sediment wash-off and transport Refine representation of hydromodifications in the watershed
Refine copper WLAs Assess effect of upstream freshwater discharges on beneficial uses of Estuary Evaluate BMPs Evaluate effectiveness of structural and non-structural BMPs
- 53 -
Rio Hondo/San Gabriel River Water Quality Group Coordinated Integrated Monitoring Program
9. Non-Direct Measurements Water quality data collected through other monitoring programs (e.g., NPDES publicly owned treatment works (POTW)) in the watershed will be incorporated to the extent practicable. It is not the intent or purpose of the CIMP to compile and analyze all available data. Data reported by these entities will be evaluated for suitability for inclusion in the CIMP database. If the data are deemed to be suitable they will be included in the database described in the following element. Data from other programs will be used to supplement land use data to evaluate loading to the receiving water as well as to evaluate receiving water quality.
- 54 -
Rio Hondo/San Gabriel River Water Quality Group Coordinated Integrated Monitoring Program
10. Adaptive Management 10.1 Integrated Monitoring and Assessment Program The monitoring specified in the CIMP is, in part, dynamic. Historically, monitoring has not been performed in the RH/SGRWQG EWMP area receiving waters. Past monitoring efforts have been based on water quality issues identified in downstream water bodies. As new monitoring data is collected, if constituents currently identified prove to not be an issue in the RH/SGRWQG EWMP area water bodies, they will be removed from the monitoring program. Likewise, if new constituents are identified, they will be added to the ongoing monitoring. The results from the monitoring are meant to tie into the EWMP as feedback for the water quality changes resulting from control measures implemented by the RH/SGRWQG. 10.2 CIMP Revision Process This CIMP identifies a range of sampling that will likely result in data that will require changes to ensure monitoring meets the requirements and intent of the MRP and supports EWMP implementation. However, since many of those potential changes are identified in this CIMP, it should not be necessary to obtain Regional Board approval of modifications already considered in this CIMP to ensure timely implementation of appropriate modifications to monitoring. Changes identified in this section will be discussed in the annual report and implemented starting no later than the first CIMP monitoring event of the next monitoring year, including:
1. Adding constituents at receiving water and/or outfall monitoring sites, increasing monitoring frequency, or adding sites as a result of requirements in the MRP (e.g., TIE results), procedures outlined in this CIMP, or to further support meeting the monitoring objectives.
2. Discontinuing monitoring for Table E-2 constituents that are not identified as a water quality priority and are not detected at levels above relevant water quality objectives in the first year of monitoring.
3. Discontinuing monitoring of any non-TMDL, non-303(d) constituent at a specified site if there are two consecutive monitoring events for the same condition (i.e., wet- or dry-weather) with no exceedances observed.
4. Discontinuing monitoring of any 303(d) constituent where sufficient data are available to support delisting.
5. Modifying methods for consistency with USEPA method requirements or to achieve lower detection limits at the discretion of the RH/SGRWQG.
6. Changing analytical laboratories. 7. Relocating an outfall monitoring location determined to be not representative of MS4 discharges
in the RH/SGRWQG EWMP area, for reasons other than the observed water quality, or because monitoring at the site is not feasible.
8. Implementing the changes associated with conducting at least one re-assessment of the Non-Stormwater Outfall Program during the MS4 Permit term.
9. Choosing to initiate one or more of the Special Studies outlined in Section 8. 10. Modifications to sampling protocols resulting from coordination with other watershed monitoring
programs. In particular, suspended sediment monitoring associated with meeting the requirements of the Harbors Toxics TMDL will be conducted downstream of the RH/SGRWQG EWMP area. If consistent exceedances of interim WQBELs are observed and the RH/SGRWQG determines that control measures will need to be implemented to meet the final WQBELs by March 23, 2032, the RH/SGRWQG will commence monitoring at the LTA sites to assess the degree to which discharges from the RH/SGRWQG EWMP area are causing or contributing to those exceedances. After March 23, 2032, if there are two consecutive monitoring events with
- 55 -

Rio Hondo/San Gabriel River Water Quality Group Coordinated Integrated Monitoring Program
exceedances observed, the RH/SGRWQG will commence monitoring at the stormwater outfall monitoring sites to assess the degree to which discharges from each RH/SGRWQG member may be causing or contributing to those exceedances.
Should additional modifications be identified that are not specified in this section that would be major changes to the approach (e.g., moving or removing a stormwater outfall or receiving water location), the modifications will be proposed in the annual report and in a separate letter to the Regional Board requesting Executive Officer approval of the change.
- 56 -

Rio Hondo/San Gabriel River Water Quality Group Coordinated Integrated Monitoring Program
11. Reporting The following sections detail monitoring and reporting requirements outlined in the MRP. The annual reports will be due on December 15th each year and will cover the period of July 1st to June 30th of the previous fiscal year. 11.1 Documents and Records RH/SGRWQG members will retain records of all monitoring information, including all calibration and maintenance records and all original strip chart recordings for continuous monitoring instrumentation, copies of all reports required by the MS4 Permit, and records of all data used to complete the Report of Waste Discharge (ROWD) and application of the MS4 Permit, for a permit required period of at least three years from the date of the sample, measurement, report, or application. 11.1.1 Event Summary Reports Reports of monitoring activities shall include at a minimum the following information:
The date, time of sampling or measurements, exact place, weather conditions, and rain fall amount.
The individual(s) who performed the sampling or measurements. The date(s) analyses were performed. The individual(s) who performed the analyses. The analytical techniques or methods used. The results of such analyses. The data sheets showing toxicity test results.
11.1.2 Semi-Annual Analytical Data Reports Results from each of the receiving water or outfall based monitoring station conducted in accordance with the Standard Operating Procedure shall be sent electronically to the Regional Board’s Stormwater site at [email protected]. The monitoring results will be submitted on a semi-annual basis and highlight exceedances applicable to WQBELs, RWLs, action levels, or aquatic toxicity thresholds. Corresponding sample dates and monitoring locations will be included. Data will be transmitted in the most recent Southern California SMC’s Standardized Data Transfer Formats. 11.2 Monitoring Reports 11.2.1 Report Objectives The annual reporting process is intended to provide the Regional Board with summary information to allow for the assessment of the Permittees:
Participation in one or more Watershed Management Programs. Impact of each Permittee(s) stormwater and non-stormwater discharges on the receiving water. Each Permittee’s compliance with RWLs, numeric WQBELs, and non-stormwater action levels. The effectiveness of each Permittee(s) control measures in reducing discharges of pollutants
from the MS4 to receiving waters. Whether the quality of MS4 discharges and the health of receiving waters is improving, staying
the same, or declining as a result of watershed management program efforts, and/or TMDL implementation measures, or other Minimum Control Measures.
- 57 -

Rio Hondo/San Gabriel River Water Quality Group Coordinated Integrated Monitoring Program
Whether changes in water quality can be attributed to pollutant controls imposed on new
development, re-development, or retrofit projects. The annual report process also seeks to provide a forum for Permittee(s) to discuss the effectiveness of its past and ongoing control measure efforts and to convey its plans for future control measures. Detailed data and information will also be provided in a clear and transparent fashion to allow the Regional Board and general public to review and verify conclusions presented by the Permittee. 11.2.2 Annual Reports Annual reports shall be organized to include the following information. Annual reports will include all aspects of CIMP implementation occurring July 1 through June 30. 11.2.2.1 Watershed Summary Information Part XVII.B of the MRP allows for Permittees participation in an EWMP to provide the following Watershed Summary Information through the development of an EWMP. 11.2.2.1.1 Watershed Management Area When a Permittee has collaboratively developed an EWMP, reference to the EWMP and any revisions to the EWMP may suffice for baseline information regarding the WMA. If not, the annual report must contain information detailing the following:
1. The effective TMDLs, applicable WQBELs and RWLs, and implementation and reporting requirements, and compliance dates.
2. CWA section 303(d) listings of impaired waters not addressed by TMDLs. 3. Results of regional bioassessment monitoring. 4. A description of known hydromodificaitons to receiving waters and a description, including
locations, of natural drainage systems. 5. Description of groundwater recharge areas including number and acres. 6. Maps and/or aerial photographs identifying the location of ecologically sensitive areas (ESAs),
areas of special biological significance (ASBS), natural drainage systems, and groundwater recharge areas.
11.2.2.1.2 Subwatershed (HUC-12) Descriptions Information shall be included for each subwatershed (HUC-12) within the Permittee(s) jurisdiction. Where relevant information is already present in an EWMP, baseline information regarding the subwatershed descriptions may be satisfied by reference to the EWMP. The following descriptions of subwatersheds must be present:
1. Description including HUC-12 number, name and a list of all tributaries named in the Basin Plan. 2. Land use map of the HUC-12 watershed. 3. 85th percentile, 24-hour rainfall isohyetal map for the subwatershed. 4. One-year, one-hour storm intensity isohyetal map for the subwatershed. 5. MS4 map for the subwatershed, including major MS4 outfalls and all low flow diversions.
11.2.2.1.3 Description of Permittee(s) Drainage Area within the Subwatershed Information shall be included for each drainage area within the Permittee(s) jurisdiction. Where relevant information is already present in an EWMP, baseline information regarding the subwatershed descriptions
- 58 -

Rio Hondo/San Gabriel River Water Quality Group Coordinated Integrated Monitoring Program
may be satisfied by reference to the EWMP. The following descriptions of drainage area must be present:
1. A subwatershed map depicting the Permittee(s) jurisdictional area and the MS4, including major outfalls (with identification numbers), and low flow diversions located within the Permittee(s) jurisdictional area.
2. Provide the estimated baseline percent of EIA within the Permittee(s) jurisdictional area. 11.2.2.2 Annual Assessment and Reporting The following sections shall be included in each Permittee or group of Watershed Permittees’ Annual Report. The information will be provided for each watershed within the Permittee’s jurisdiction. Annual Reports submitted on behalf of a group of watershed Permittees shall clearly identify all data collected and strategies, control measures, and assessments implemented by each Permittee within its jurisdiction as well as those implemented by multiple Permittees on a watershed scale. 11.2.2.2.1 Stormwater Control Measures The following information shall be complied for inclusion in the Annual Report by each Permittee.
1. Estimated cumulative change in percent EIA since the effective date of the Permit, and if possible, the estimated change in the stormwater runoff volume during the 85th percentile storm event.
2. Summary of new development/re-development projects constructed within the Permittee(s) jurisdictional area during the reporting year.
3. Summary of retrofit projects that reduced or disconnected impervious area from MS4 during the reporting year.
4. Summary of other projects designed to intercept stormwater runoff prior to discharge to the MS4 during the reporting year.
5. Estimate the total runoff volume retained on site by the implementation of such projects during the reporting year.
6. Summary of actions taken in compliance with TMDL implementation plans or approved EWMP to implement TMDL provisions.
7. Summary of riparian buffer/wetland restoration projects completed during the reporting year. For riparian buffers include width, length and vegetation type; for wetland include acres restored, enhanced or created.
8. Summary of other Minimum Control Measures implemented during the reporting year, as the Permittee deems relevant.
9. Status of all multi-year efforts that were not completed in the current year and will therefore continue into the subsequent year(s). Additionally, if any of the requested information cannot be obtained, the Permittee(s) shall provide a discussion of the factor(s) limiting its acquisition and steps that will be taken to improve future data collection efforts.
11.2.2.2.2 Effectiveness Assessment of Stormwater Control Measures The following information will be included to detail Stormwater Control Measures during the reporting year:
1. Rainfall summary for the reporting year. Summarize the number of storm events, highest volume event (inches/24 hours), highest number of consecutive days with measurable rainfall, total rainfall during the reporting year compared to average annual rainfall for the subwatershed.
- 59 -

Rio Hondo/San Gabriel River Water Quality Group Coordinated Integrated Monitoring Program
2. Provide a summary table describing rainfall during stormwater outfall and wet-weather receiving
water monitoring events. The summary description shall include the date, time that the storm commenced and the storm duration in hours, the highest 15-minute recorded storm intensity (converted to inches/hour), the total storm volume (inches), and the time between the storm event sampled and the end of the previous storm event.
3. Where control measures were designed to reduce impervious cover or stormwater peak flow and flow duration, provide hydrographs or flow data of pre- and post-control activity for the 85th percentile, 24-hour rain event, if available.
4. For natural drainage systems, develop a reference watershed flow duration curve and compare it to a flow duration curve for the subwatershed under current conditions.
5. Provide an assessment as to whether the quality of stormwater discharges as measured at designed outfalls is improving, staying the same or declining. The Permittee may compare water quality data from the reporting year to previous years with similar rainfall patterns, conduct trends analysis, or use other means to develop and support its conclusions.
6. Provide an assessment as to whether wet-weather receiving water quality within the jurisdiction of the Permittee is improving, staying the same or declining, when normalized for variations in rainfall patterns. The Permittee may compare water quality data from the reporting year to previous years with similar rainfall patterns, conduct trends analysis, draw from regional bioassessment studies, or use other means to develop and support its conclusions.
7. Status of all multi-year efforts, including TMDL implementation, that were not completed in the current year and will continue into the subsequent year(s). Additionally, if any of the requested information cannot be obtained, the Permittee shall provide a discussion of the factors(s) limiting its acquisition and steps that will be taken to improve future data collection efforts.
11.2.2.2.3 Non-Stormwater Water Control Measures The following information will be included to detail non-stormwater control measures present in the Permittee’s jurisdiction:
1. Estimate the number of major outfalls within the Permittee’s jurisdiction in the subwatershed. 2. Provide the number of outfalls what were screened for significant non-stormwater discharges
during the reporting year. 3. Provide the cumulative number of outfalls that have been screened for significant non-
stormwater discharges since the date the Permit was adopted through the reporting year. 4. Provide the number of outfalls with confirmed significant non-stormwater discharge. 5. Provide the number of outfalls where significant non-stormwater discharge was attributed to
other NPDES permitted discharges; other authorized non-stormwater discharges; or conditionally exempt discharges.
6. Provide the number of outfalls where significant non-stormwater discharges were abated as a result of the Permittee’s actions.
7. Provide the number of outfalls where non-stormwater discharges was monitored. 8. Provide the status of all multi-year efforts, including TMDL implementation, that were not
completed in the current year and will continue into the subsequent year(s). Additionally, if any of the requested information cannot be obtained, the Permittee shall provide a discussion of the factor(s) limiting its acquisition and steps that will be taken to improve future data collection efforts.
11.2.2.2.4 Effectiveness Assessment of Non-Stormwater Control Measures The following information will be included to assess non-stormwater control measures effectiveness:
1. Provide an assessment as to whether receiving water quality within the jurisdiction of the Permittee is impaired, improving, staying the same or declining during the dry-weather
- 60 -

Rio Hondo/San Gabriel River Water Quality Group Coordinated Integrated Monitoring Program
conditions. Each Permittee may compare water quality data from the reporting year to previous years with similar dry-weather flows, conduct trends analysis, draw from regional bioassessment studies, or use other means to develop and support its conclusions.
2. Provide an assessment of the effectiveness of the Permittee(s) control measures in effectively prohibiting non-stormwater discharges through the MS4 to the receiving water.
3. Provide the status of all multi-year efforts that were not completed in the current year and will continue into the subsequent year(s).
11.2.2.2.5 Integrated Monitoring Compliance Report The following information will be included to assess the Permittee(s) compliance with applicable TMDLs, WQBELs, RWLs, and action levels:
1. Provide an Integrated Monitoring Report that summarizes all identified exceedances of the following against applicable RWLs, WQBELs, non-stormwater action levels, and aquatic toxicity thresholds:
a. Outfall-based stormwater monitoring data b. Wet-weather receiving water monitoring data c. Dry-weather receiving water data d. Non-stormwater outfall monitoring data
All sample results that exceeded one or more applicable thresholds shall be readily identified. 2. If aquatic toxicity was confirmed and a TIE was conducted, identify the toxic chemicals as
determined by the TIE. Include all relevant data to allow the Regional Board to review the adequacy and findings of the TIE. This shall include, but not be limited to:
a. The sample(s) date b. Sample(s) start and end time c. Sample type(s) d. Sample location(s) as depicted on a map e. The constituents, analytical results, and applicable limitation.
3. Provide a description of efforts that were taken to mitigate and/or eliminate all non-stormwater discharges that exceeded one or more applicable WQBELs, or caused or contributed to aquatic toxicity.
4. Provide a description of efforts that were taken to address stormwater discharges that exceeded one or more applicable WQBELs, or caused or contributed to aquatic toxicity.
5. Where RWLs were exceeded, provide a description of efforts that were taken to determine whether discharges from the MS4 caused or contributed to the exceedances and all efforts that were taken to control the discharge of pollutants from the MS4 to those receiving waters in response to the exceedances.
11.2.2.2.6 Adaptive Management Strategies The following information will be included to outline Adaptive Management Strategies:
1. Identify the most effective control measures and describe why the measures were effective and how other measures will be optimized based on past experiences.
2. Identify the least effective control measures and describe why the measures were deemed ineffective and how the control measures will be modified or terminated.
3. Identify significant changes to control measures during the prior year and the rationale for the changes.
4. Describe all significant changes to control measures anticipated for the next year and rationale for the changes. Those changes requiring approval of the Regional Board or its EO shall be clearly identified at the beginning of the Annual Report.
- 61 -

Rio Hondo/San Gabriel River Water Quality Group Coordinated Integrated Monitoring Program
5. Include a detailed description of control measures to be applied to new development or re-
development projects disturbing more than 50 acres. 6. Provide the status of all multi-year efforts that were not completed in the current year and will
continue into the subsequent year(s). 11.2.2.2.7 Supporting Data and Information Beginning with the first annual report generated after beginning CIMP implementation, all reported monitoring data and associated meta data shall be summarized in an Excel spreadsheet and sorted by watershed, subwatershed and monitoring station/outfall identifier linked to the subwatershed map. The data summary must include the date, sample type (flow-weighted composite, grab, and field measurement), sample start and stop times, constituent, analytical method, value, and units. The date field must be linked to a database summarizing the weather data for the sampling date including 24-hour rainfall, rainfall intensity, and days since the previous rain event.
- 62 -
Rio Hondo/San Gabriel River Water Quality Group Coordinated Integrated Monitoring Program
12. CIMP Implementation Schedule The CIMP will become effective July 1, 2015 or 90 days after approval by the Executive Officer of the Regional Board, whichever is later. New development and re-development effectiveness tracking will begin no later than the date of Draft EWMP submittal (June 28, 2015). Implementation of the CIMP will begin this fall with the non-stormwater screening. Within 90 days of CIMP approval, sample collection for all constituents at all dry-weather receiving water sites will commence. The remaining monitoring will be affected by the feasibility of collecting a sample within 90 days of CIMP approval. The two primary factors affecting the feasibility of sample collection upon approval of this CIMP relate to (1) autosampler installation and (2) monitoring that is dependent upon prerequisite information (e.g., monitoring of significant non-stormwater discharges). The process for installing autosamplers includes numerous tasks that require multiple agency coordination and permitting. Numerous autosampler stations have been installed throughout the County and provide significant experience in understanding the challenges and timelines for designing, permitting, and installing autosampler stations. The following is an overview of the tasks and timelines associated with autosampler installation, and what would be considered a relatively straightforward installation timeframe:
Detailed autosampler site configuration/design, which includes data collection and review, identification of MS4 Permit requirements, concept design, development of summary technical memorandums, and review by participating agencies and associated divisions: 12 months
Obtaining permits from one or more of the following entities: USACE, LACFCD, United States Fish and Wildlife Service, California Department of Fish and Wildlife, California Coastal Commission, and the Regional Board: 3 to 10 months
Purchasing of equipment through a contractor or agency procurement process (can occur somewhat concurrently with permitting): 2 to 6 months
Connecting to power via an upgrade to existing service or establishing new service: 1 to 6 months
Construction of monitoring station assuming no bid/award process: 1 month Total time: 18 to 30 months
The installation may not be straightforward at each site. While each proposed site was visited to ensure feasibility, none of the sites were observed under storm condition. Unforeseen issues with the selected sites, such as backwatering of the receiving water into an outfall leading to an unrepresentative sample, or flooding resulting in unsafe conditions, may lead to relocation of the site. Phasing in the receiving water and stormwater outfall sites outlined in the CIMP will allow evaluation of the sites to determine if any need to be changed due to significant contributions from non-MS4 sources or other reasons that sampling is not feasible at a site requiring an alternate or a new site. Below is the proposed phasing schedule, to be adjusted as required due to permitting, procurement, and site suitability.
Phase I of the CIMP implementation, Fiscal Year 2014-2015: Non-stormwater screening Determination of significant non-stormwater outfalls Installation of LTA sites on Rio Hondo and Little Dalton Wash Installation of stormwater outfall sites on Bradbury Drain and BI 0025 Peck Road Drain
Phase II of the CIMP implementation, Fiscal Year 2015-2016 (assuming CIMP
approved by July 1, 2015): Installation of stormwater outfall sites on BI 0602 – Line B and BI 1219 – Line C
- 63 -

Rio Hondo/San Gabriel River Water Quality Group Coordinated Integrated Monitoring Program
Dry-weather monitoring at all receiving water locations Dry-weather monitoring where source identification of significant non-stormwater outfalls is
completed and monitoring is required Stormwater monitoring at existing and new sites Initiate Peck Road Park Lake monitoring (water column, sediment, and fish tissue)
Phase III of the CIMP implementation, Fiscal Year 2016-2017 (assuming CIMP
approved by July 1, 2015): Installation of TMDL receiving water site on Sawpit Wash Installation of stormwater outfall site on Beatty Canyon Dry-weather monitoring at all receiving water locations Dry-weather monitoring where source identification of significant non-stormwater outfalls is
completed and monitoring is required Stormwater monitoring at existing and new sites Peck Road Park Lake monitoring (water column and sediment)
Phase IV of the CIMP implementation, Fiscal Year 2017-2018 (assuming CIMP
approved by July 1, 2015): Installation of TMDL receiving water site on Santa Anita Wash Dry-weather monitoring at all receiving water locations Dry-weather monitoring where source identification of significant non-stormwater outfalls is
completed and monitoring is required Stormwater monitoring at existing and new sites Peck Road Park Lake monitoring (water column and sediment)
In years following Fiscal Year 2017-2018, assuming timely CIMP approval and no unforeseen major complications, all currently planned stations will be installed and monitoring will proceed as specified in the CIMP. If adjustments to the phasing schedule become necessary, the rational will be discussed and a new timeline will be proposed in the annual report as a component of the adaptive management. After the discharge quality for Santa Anita and Sawpit Washes are established, the water quality may be determined to be statistically similar, in which case the EWMP Group may choose to alternate between sites on an annual basis in subsequent Fiscal Years.
- 64 -

Rio Hondo/San Gabriel River Water Quality Group Coordinated Integrated Monitoring Program
13. Conclusion The CIMP incorporates the primary objectives listed in the MS4 Permit. Additionally, the EWMP Group is collaborating with downstream groups to coordinate required TMDL monitoring. A summary of how the receiving water monitoring program meets the intended objectives of the receiving water monitoring program outlined in Part II.E.1 of the MRP is presented in Table 13-1.
Table 13-1 Summary of Receiving Water Monitoring Program Objectives MRP Objective CIMP Component Meeting Objective
Determine whether the RWLs are being achieved
Five total receiving water monitoring sites TMDL receiving water monitoring sites located as required by TMDLs Constituents added for monitoring based on the water quality
priorities (i.e., the constituents at the highest risk of exceeding RWLs) Assess trends in pollutant concentrations over time, or during specified conditions
LTA stations set at base of the EWMP area Monitoring during dry-weather and wet-weather Constituents added for monitoring based on the water quality
priorities and outcome of the Table E-2 analysis. Determine whether the designated beneficial uses are fully supported as determined by water chemistry, as well as aquatic toxicity and bioassessment monitoring
One monitoring site located in the major water bodies exiting the EWMP area
Aquatic toxicity monitoring to be conducted during dry- and wet-weather
Constituents added for monitoring based on the water quality priorities
A summary of how the stormwater outfall monitoring program meets the intended objectives of the stormwater outfall monitoring program outlined in Part VIII.A of the MRP is presented in Table 13-2.
Table 13-2 Summary of Stormwater Outfall Monitoring Program Objectives MRP Objective CIMP Component Meeting Objective
Determine the quality of a Permittee’s discharge relative to municipal action levels, as described in Attachment G of the MS4 Permit
Stormwater outfall monitoring sites chosen using a representative land use within HUC-12 approach
Extensive list of constituents being collectively monitored at stormwater outfall monitoring sites
Determine whether a Permittee’s discharge is in compliance with applicable WQBELs derived from TMDL WLAs
Stormwater outfall monitoring sites located in water bodies with applicable WQBELs
Stormwater outfall monitoring sites chosen using a representative land use within HUC-12s
List of constituents based on the water quality priorities which includes constituents with WQBELs derived from TMDL WLAs and considers current and historical exceedances in receiving waters
- 65 -
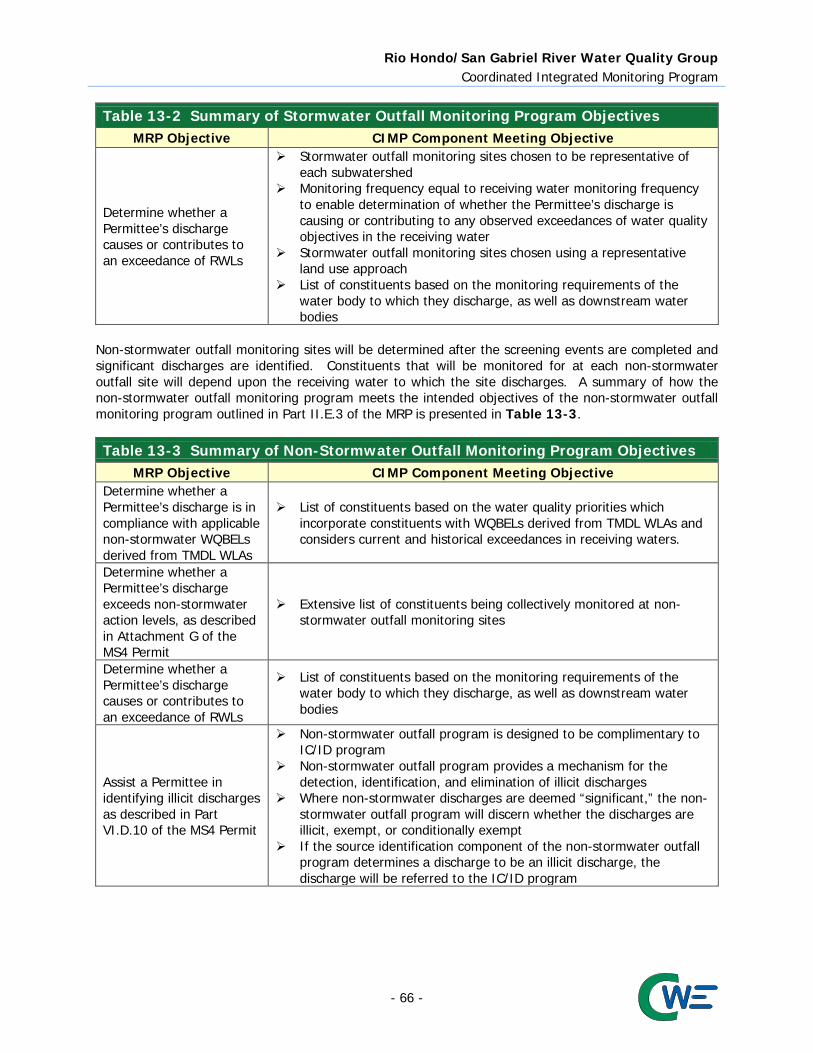
Rio Hondo/San Gabriel River Water Quality Group Coordinated Integrated Monitoring Program
Table 13-2 Summary of Stormwater Outfall Monitoring Program Objectives MRP Objective CIMP Component Meeting Objective
Determine whether a Permittee’s discharge causes or contributes to an exceedance of RWLs
Stormwater outfall monitoring sites chosen to be representative of each subwatershed
Monitoring frequency equal to receiving water monitoring frequency to enable determination of whether the Permittee’s discharge is causing or contributing to any observed exceedances of water quality objectives in the receiving water
Stormwater outfall monitoring sites chosen using a representative land use approach
List of constituents based on the monitoring requirements of the water body to which they discharge, as well as downstream water bodies
Non-stormwater outfall monitoring sites will be determined after the screening events are completed and significant discharges are identified. Constituents that will be monitored for at each non-stormwater outfall site will depend upon the receiving water to which the site discharges. A summary of how the non-stormwater outfall monitoring program meets the intended objectives of the non-stormwater outfall monitoring program outlined in Part II.E.3 of the MRP is presented in Table 13-3.
Table 13-3 Summary of Non-Stormwater Outfall Monitoring Program Objectives MRP Objective CIMP Component Meeting Objective
Determine whether a Permittee’s discharge is in compliance with applicable non-stormwater WQBELs derived from TMDL WLAs
List of constituents based on the water quality priorities which incorporate constituents with WQBELs derived from TMDL WLAs and considers current and historical exceedances in receiving waters.
Determine whether a Permittee’s discharge exceeds non-stormwater action levels, as described in Attachment G of the MS4 Permit
Extensive list of constituents being collectively monitored at non-stormwater outfall monitoring sites
Determine whether a Permittee’s discharge causes or contributes to an exceedance of RWLs
List of constituents based on the monitoring requirements of the water body to which they discharge, as well as downstream water bodies
Assist a Permittee in identifying illicit discharges as described in Part VI.D.10 of the MS4 Permit
Non-stormwater outfall program is designed to be complimentary to IC/ID program
Non-stormwater outfall program provides a mechanism for the detection, identification, and elimination of illicit discharges
Where non-stormwater discharges are deemed “significant,” the non-stormwater outfall program will discern whether the discharges are illicit, exempt, or conditionally exempt
If the source identification component of the non-stormwater outfall program determines a discharge to be an illicit discharge, the discharge will be referred to the IC/ID program
- 66 -

Rio Hondo/San Gabriel River Water Quality Group Coordinated Integrated Monitoring Program
14. References Cowgill, U.M. and D.P. Milazzo. 1990. The sensitivity of two cladocerans to water quality variables,
salinity and hardness. Arch. Hydrobiol. 120:185–196. Kayhanian, M., C. Stransky, S. Bay, S. Lau, M.K. Stenstrom. 2008. Toxicity of urban highway runoff with
respect to storm duration. Science of the Total Environment 389:109-128. LARWQCB. 2002. Amendments to the Water Quality Control Plan – Los Angeles Region for the Los
Angeles River Trash TMDL. Attachment A to Resolution No. 2001-013. Adopted September 19, 2001. Effective August 1, 2002. Revised September 23, 2008.
LARWQCB. 2003. Amendment to the Water Quality Control Plan – Los Angeles Region to Incorporate
the Los Angeles River Nitrogen Compounds and Related Effects TMDL. Attachment A to Resolution No. 03-009. Adopted July 10, 2003. Effective March 23, 2004. Revised June 4, 2013.
LARWQCB. 2007. Amendment to the Water Quality Control Plan – Los Angeles Region to Incorporate
the Los Angeles River and Tributaries Metals TMDL. Attachment A to Resolution No. 2007-014. Adopted September 6, 2007. Effective October 29, 2008. Revised November 3, 2011.
LARWQCB. 2010. Amendment to the Water Quality Control Plan – Los Angeles Region to Incorporate
the Los Angeles River Watershed Bacteria TMDL. Attachment A to Resolution No. R10-007. Adopted July 9, 2010. Effective March 23, 2012.
LARWQCB. 2011. Amendment to the Water Quality Control Plan – Los Angeles Region to Incorporate
the Total Maximum Daily Load for Toxic Pollutants in Dominguez Channel and Greater Los Angeles and Long Beach Harbor Waters. Attachment A to Resolution No. R11-008. Adopted May 5, 2011. Effective March 23, 2012.
Lee, G. F. and A. Jones-Lee. “Review of the City of Stockton Urban Stormwater Runoff Aquatic Life
Toxicity Studies Conducted by the CVRWQCB, DeltaKeeper and the University of California, Davis, Aquatic Toxicology Laboratory between 1994 and 2000,” Report to the Central Valley Regional Water Quality Control Board, G. Fred Lee & Associates, El Macero, CA, October (2001).
Los Angeles RWQCB, Final Staff Report for the Implementation Plans and Schedules for the Los Cerritos
Channel and San Gabriel River Metals TMDLs, 2013. Palumbo, A., Fojut, T., TenBrook, P. and Tjerdeema, R. 2010a. Water Quality Criteria Report for
Diazinon. Prepared for the Central Valley Regional Water Quality Control Board by the Department of Environmental Toxicology, University of California, Davis. March.
Palumbo, A., Fojut, T., Brander, S., and Tjerdeema, R. 2010b. Water Quality Criteria Report for
Bifenthrin. Prepared for the Central Valley Regional Water Quality Control Board by the Department of Environmental Toxicology, University of California, Davis. March.
Schiff, K., Bax, B., Markle, P., Fleming, T. and Newman, J. 2007. Wet and Dry Weather Toxicity in the
San Gabriel River. Bulletin of the Southern California Academy of Sciences: Vol. 106: 3. Available at: http://scholar.oxy.edu/scas/vol106/iss3/2.
Southern California Coastal Water Research Project (SCCWRP). 2009. Sediment Quality Assessment
Draft Technical Support Manual. Technical Report 582.
- 67 -

Rio Hondo/San Gabriel River Water Quality Group Coordinated Integrated Monitoring Program
United States Environmental Protection Agency (USEPA). 1991. Methods for Aquatic Toxicity
Identification Evaluations: Phase I. Toxicity Characterization Procedures. 2nd Edition. EPA-600-6-91-003. National Effluent Toxicity Assessment Center, Duluth, MN.
United States Environmental Protection Agency (USEPA). 1992. Toxicity Identification Evaluation:
Characterization of Chronically Toxic Effluents, Phase I. EPA/600/6-91/005F. May 1992. National Effluent Toxicity Assessment Center, Duluth, MN.
United States Environmental Protection Agency (USEPA). 1993a. Methods for Aquatic Toxicity
Identification Evaluations- Phase II Toxicity Identification Procedures for Samples Exhibiting Acute and Chronic Toxicity. EPA-600-R-92-080. National Effluent Toxicity Assessment Center, Duluth, MN.
United States Environmental Protection Agency (USEPA). 1993b. Methods for Aquatic Toxicity
Identification Evaluations- Phase III Toxicity Confirmation Procedures for Samples Exhibiting Acute and Chronic Toxicity. EPA-600-R-92-081. National Effluent Toxicity Assessment Center, Duluth, MN.
United States Environmental Protection Agency (USEPA). 1995. Short-term Methods for Estimating the
Chronic Toxicity of Effluents and Receiving Waters to West Coast Marine and Estuarine Organisms. EPA-600-R-95-136. August.
United States Environmental Protection Agency (USEPA). 1996. Marine toxicity identification evaluation
(TIE): Phase I guidance document. EPA/600/R-96/054. National Health and Environmental Effects Research Laboratory. Narragansett, RI.
United States Environmental Protection Agency (USEPA). 2002a. Short-term Methods for Estimating the
Chronic Toxicity of Effluents and Receiving Waters to Freshwater Organisms. Fourth Edition. October. EPA-821-R-02-013.
United States Environmental Protection Agency (USEPA). 2002b. Methods for Measuring the Acute
Toxicity of Effluent and Receiving Waters to Freshwater and Marine Organisms. Fifth Edition. October. EPA-821-R-02-012.
United States Environmental Protection Agency (USEPA). 2007. Sediment toxicity identification
evaluation (TIE) phases I, II, and III guidance document. EPA/600/R-07/080. U.S. Environmental Protection Agency, Office of Research and Development, Atlantic Ecology Division. Narragansett, RI.
United States Environmental Protection Agency (USEPA). 2007. Total Maximum Daily Loads for Metals
and Selenium – San Gabriel River and Impaired Tributaries. USEPA Region 9. March 26, 2007. United States Environmental Protection Agency (USEPA). 2010. National Pollutant Discharge Elimination
System Test of Significant Toxicity Technical Document. EPA/833-R-10-004, U.S. Environmental Protection Agency, Office of Environmental Management, Washington, DC.
United States Environmental Protection Agency (USEPA). 2012. Los Angeles Area Lakes Total Maximum
Daily Loads for Nitrogen, Phosphorus, Mercury, Trash, Organochlorine Pesticides and PCBs. USEPA Region 9. March 26, 2012.
Weston, D.P. and E.L. Amweg. 2007. Whole sediment toxicity identification evaluation tools for
pyrethroid insecticides: II. Esterase addition. Environmental Toxicology and Chemistry 26:2397-2404.
- 68 -

Rio Hondo/San Gabriel River Water Quality Group Coordinated Integrated Monitoring Program
Wheelock, C., Miller, J., Miller, M., Gee, S., Shan, G. and Hammock, B. 2004. Development of Toxicity
Identification Evaluation (TIE) procedures for pyrethroid detection using esterase activity. Environmental Toxicology and Chemistry 23:2699-2708.
- 69 -

Rio Hondo/San Gabriel River Water Quality Group Coordinated Integrated Monitoring Program
Attachment A
Watershed Management Plan Area Background
- 70 -
Rio Hondo/San Gabriel River Water Quality Group Coordinated Integrated Monitoring Program
A.1 Watershed Background The following subsections summarize the hydrology, geographic boundaries, and existing monitoring programs in the watershed management area covered by the CIMP. A.1.1 Enhanced Watershed Management Program Area Overview Flows from the upper Rio Hondo and SGR watersheds maybe directed to spreading grounds located in, or adjacent to, the Rio Hondo and San Gabriel Rivers. Receiving waters within the EWMP area include:
Rio Hondo Water Bodies Arcadia Wash Little Santa Anita Canyon Creek Santa Anita Wash Monrovia Canyon Wash Sawpit Wash Rio Hondo Reach 3
San Gabriel River Water Bodies
San Gabriel River Reach 5 Little Dalton Wash Big Dalton Wash San Dimas Wash
Lakes and reservoirs in the EWMP area include:
Rio Hondo Watershed Lake Peck Road Park Lake
San Gabriel River Watershed Lake Santa Fe Dam Park Lake
A.2 Existing Monitoring Programs Existing watershed monitoring programs provide historical data and information that can be used to support site selection and identification of constituents for monitoring. The following subsections briefly describe the current state of existing monitoring programs relevant to the EWMP Group. A.2.1 Council for Watershed Health Monitoring Programs The Los Angeles River Watershed Monitoring Program (LARWMP) and San Gabriel River Regional Monitoring Program (SGRRMP) are primarily funded by the Los Angeles County Sanitation Districts (LACSD) and conducted by the Council for Watershed Health (formerly Los Angeles and San Gabriel Rivers Watershed Council). Nearly all existing sites are located outside the EWMP area. Only one site monitored on one occasion is reflective of receiving waters in the EWMP area. No exceedances of water quality objectives were found at this site. The LARWMP and SGRRMP include monitoring to address five core management questions related to priority beneficial uses:
What is the condition of streams in the watershed? Are conditions at areas of unique interest getting better or worse?
- 71 -

Rio Hondo/San Gabriel River Water Quality Group Coordinated Integrated Monitoring Program
Are receiving waters near discharges meeting water quality objectives? Is it safe to swim? Are locally caught fish safe to eat?
The monitoring conducted under the SGRRMP and LARWMP are summarized in Table A-1 and Table A-2, respectively. During the 2009-2013 five-year cycle, bioassessment monitoring was conducted under the LARWMP and SGRRMP which are programs under the Stormwater Monitoring Coalition (SMC). The Council for Watershed Health oversees the two programs. The Council for Watershed Health will continue to conduct the LARWMP and SGRRMP, which will include SMC Bioassessment Program monitoring for the next five-year cycle in the Los Angeles River and San Gabriel River WMAs.
Table A-1 San Gabriel River Regional Monitoring Program Monitoring Summary Question Approach Sites Indicators Frequency 1 Randomized
design for streams in watershed
10 new per year Triad: bioassessment, water chemistry, toxicity, CRAM
Annually, in spring
2 Fixed sites in freshwater and estuary
4 high value wetlands
Wetland habitat (CRAM) Annually, in summer
5 tributary confluence with mainstem 3 background sites
bioassessment, water chemistry, toxicity, CRAM
Annually, in spring
4 estuary sites Water Quality, sed. chemistry, toxicity, infauna
Annually, in summer
3 Assess NPDES RW results against WQS
NPDES RW sampling locations
Water quality, chemistry, toxicity, bioassessment, bacteria
Varies
4 Focus on high-use areas
8 upper watershed river sites
E. coli 5/month (May-Sep)
5 lower watershed sentinel sites
E. coli 5/month (May-Sep)
1 estuary site Total coliforms, E. coli, Enterococcus
2/week (All Year)
5 Focus on Popular fishing sites Commonly caught species High-risk chemicals
Rotating popular fishing locations: 2 sites/year
Commonly caught fish at each location: Mercury, DDTs, PCBs, arsenic, selenium
Annually in late summer
- 72 -
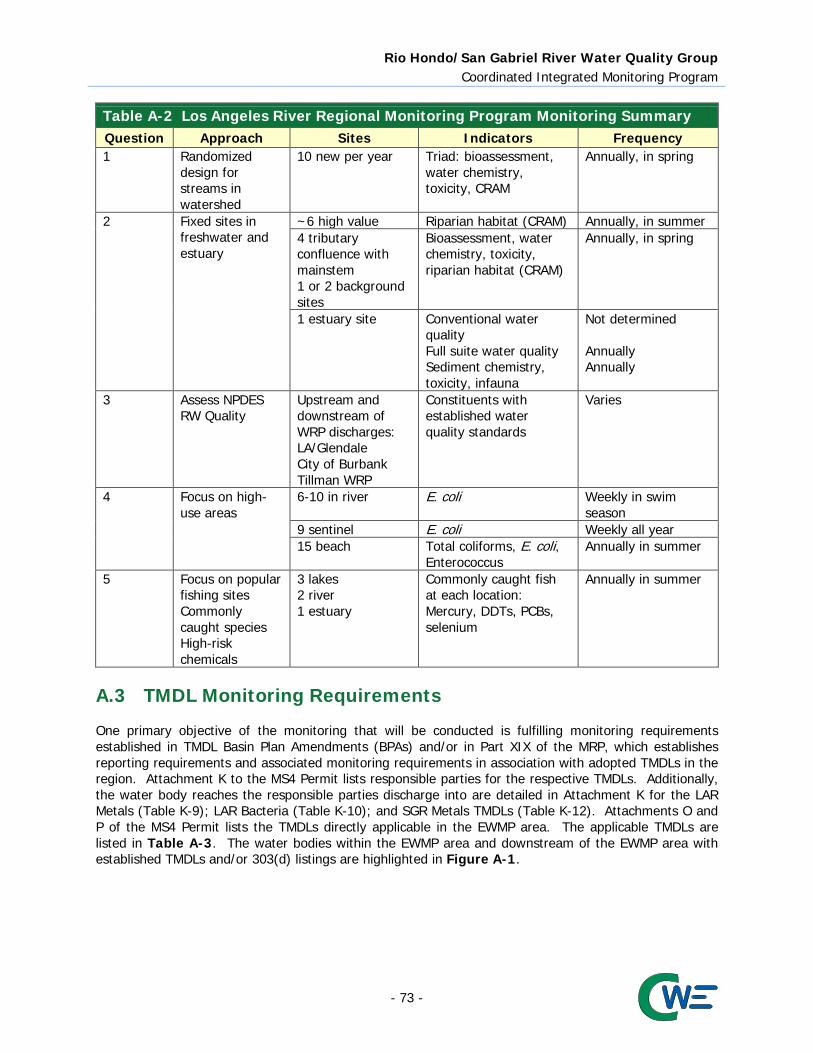
Rio Hondo/San Gabriel River Water Quality Group Coordinated Integrated Monitoring Program
Table A-2 Los Angeles River Regional Monitoring Program Monitoring Summary Question Approach Sites Indicators Frequency 1 Randomized
design for streams in watershed
10 new per year Triad: bioassessment, water chemistry, toxicity, CRAM
Annually, in spring
2 Fixed sites in freshwater and estuary
~6 high value Riparian habitat (CRAM) Annually, in summer 4 tributary confluence with mainstem 1 or 2 background sites
Bioassessment, water chemistry, toxicity, riparian habitat (CRAM)
Annually, in spring
1 estuary site Conventional water quality Full suite water quality Sediment chemistry, toxicity, infauna
Not determined Annually Annually
3 Assess NPDES RW Quality
Upstream and downstream of WRP discharges: LA/Glendale City of Burbank Tillman WRP
Constituents with established water quality standards
Varies
4 Focus on high-use areas
6-10 in river E. coli Weekly in swim season
9 sentinel E. coli Weekly all year 15 beach Total coliforms, E. coli,
Enterococcus Annually in summer
5 Focus on popular fishing sites Commonly caught species High-risk chemicals
3 lakes 2 river 1 estuary
Commonly caught fish at each location: Mercury, DDTs, PCBs, selenium
Annually in summer
A.3 TMDL Monitoring Requirements One primary objective of the monitoring that will be conducted is fulfilling monitoring requirements established in TMDL Basin Plan Amendments (BPAs) and/or in Part XIX of the MRP, which establishes reporting requirements and associated monitoring requirements in association with adopted TMDLs in the region. Attachment K to the MS4 Permit lists responsible parties for the respective TMDLs. Additionally, the water body reaches the responsible parties discharge into are detailed in Attachment K for the LAR Metals (Table K-9); LAR Bacteria (Table K-10); and SGR Metals TMDLs (Table K-12). Attachments O and P of the MS4 Permit lists the TMDLs directly applicable in the EWMP area. The applicable TMDLs are listed in Table A-3. The water bodies within the EWMP area and downstream of the EWMP area with established TMDLs and/or 303(d) listings are highlighted in Figure A-1.
- 73 -

Rio Hondo/San Gabriel River Water Quality Group Coordinated Integrated Monitoring Program
Table A-3 TMDLs Applicable to the RH/SGRWQG EWMP Area and Downstream
Areas
TMDL LARWQCB Resolution
Number
Effective Date and/or USEPA Approval Date
Los Angeles River Nitrogen Compounds and Related Effects
2003-009 March 23, 2004 2012-010 Not Yet Effective
Los Angeles River Trash 2007-012 September 23, 2008
Los Angeles River Metals TMDL 2007-014 October 29, 2008 2010-003 November 3, 2011
Los Angeles River Bacteria TMDL 2010-007 March 23, 2012 Dominguez Channel and Greater Los Angeles and Long Beach Harbor Waters Toxic Pollutants TMDL 2011-008 March 23, 2012
Los Angeles Area Lakes TMDLs for Peck Road Park Lake N/A
(USEPA TMDL)
March 26, 2012
San Gabriel River Metals and Impaired Tributaries Metals and Selenium TMDL March 26, 2007
- 74 -
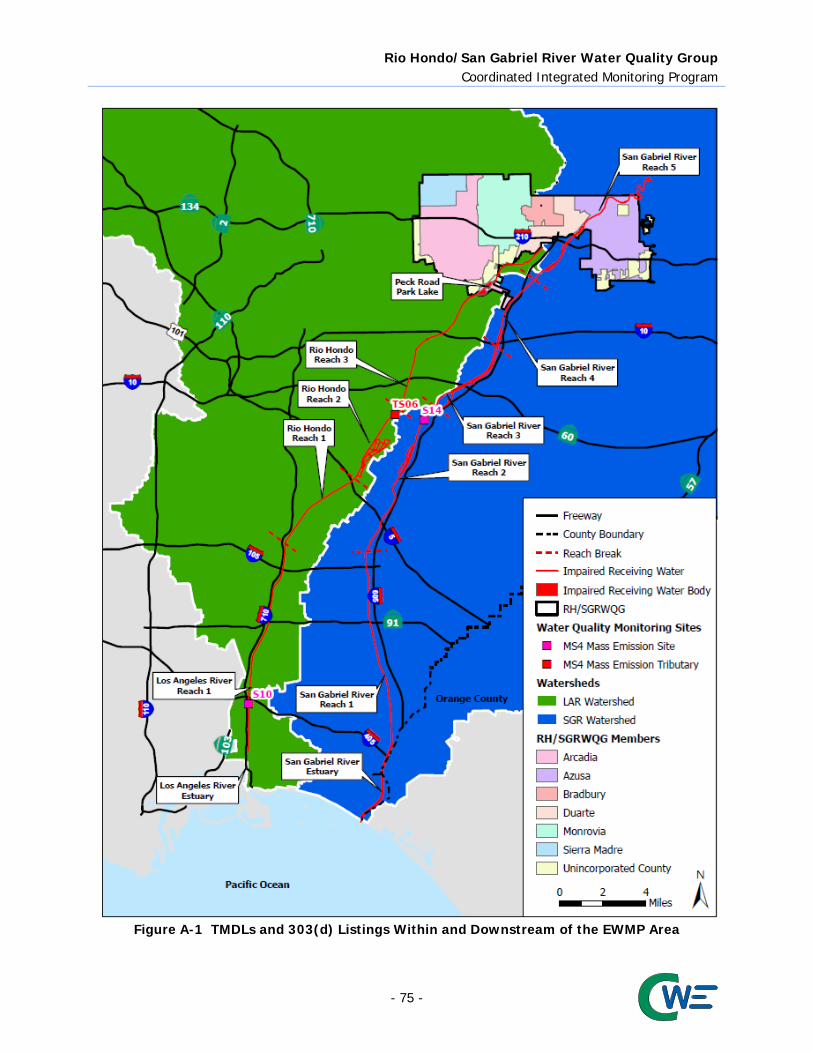
Rio Hondo/San Gabriel River Water Quality Group Coordinated Integrated Monitoring Program
Figure A-1 TMDLs and 303(d) Listings Within and Downstream of the EWMP Area
- 75 -

Rio Hondo/San Gabriel River Water Quality Group Coordinated Integrated Monitoring Program
A.3.1 Harbors Toxics TMDL While the Harbors Toxics TMDL was developed to address impairments in (among other water bodies) San Pedro Bay, it does apply to the jurisdictions in the RH/SGRWQG because the LAR and SGR discharge to San Pedro Bay. The Harbors Toxics TMDL BPA monitoring requirements were incorporated into the MRP (Part XIX.C). A summary of the monitoring requirements identified in the TMDL BPA is presented in Table A-4. Note that rather than submitting a separate CMP or Quality Assurance Project Plan (QAPP) for the TMDL, the CIMP will address this TMDL’s monitoring requirements. Note that as the LAR Estuary is not located within the RH/SGRWQG, this CIMP does not address the related monitoring requirements.
Table A-4 Summary of Harbors Toxics TMDL Monitoring Requirements Location Medium Constituents Condition Frequency
SGR Estuary1
Water, suspended solids
Metals2, DDT, PCBs, PAHs, flow, general chemistry3
Dry-weather Annually Wet-weather Twice per year4
Sediment
General sediment quality constituents and the full
chemical suite as specified in SQO Part 1
Not applicable Every two years
1 The MS4 Permit links the Los Angeles River Watershed and San Gabriel River Watershed responsible parties identified in the respective LAR and SGR Metals TMDLs as, in part, responsible for conducting water and suspended solids monitoring at the mouth of the San Gabriel River to determine the San Gabriel River’s contribution to the impairments in the Greater Harbor waters.
2 Copper, lead, and zinc. 3 Temperature, DO, pH, and electrical conductivity. 4 Including the first large storm event of the season.
As recognized by the footnote in Attachment K-4 of the MS4 Permit, the County of Los Angeles, LACFCD, and the Cities of Arcadia, Azusa, Bradbury, Duarte, Monrovia, and Sierra Madre (CIMP Participants) have entered into an Amended Consent Decree with the United States and State of California, including the Regional Board, pursuant to which the Regional Board has released the CIMP Participants from responsibility for toxic pollutants in the Dominguez Channel and the Greater Los Angeles and Long Beach Harbors. Accordingly, no inference should be drawn from the submission of this CIMP or from any action or implementation taken pursuant to it that the CIMP Participants are obligated to implement the DC Toxics TMDL, including this CIMP or any of the DC Toxics TMDL’s other obligations or plans, or that the CIMP Participants have waived any rights under the Amended Consent Decree. A.3.2 LAR Trash TMDL The LAR Trash TMDL Basin Plan Amendment (BPA) and Staff Report do not require receiving water monitoring and responsible parties are not required to conduct any type of monitoring if complying with WLAs through the installation of full capture systems. Alternatively, responsible parties utilizing partial capture treatment systems and institutional controls must use a mass balance approach to estimate trash discharged. This is done through a calculated trash daily generation rate (DGR). The DGR is the average amount of trash accumulated in a specific land area over a 24-hour period. The DGR is used to estimate the amount of trash discharged after a storm event. The sum of all storm event discharges equals the calculated annual trash discharge for a responsible party. Responsible parties utilizing partial capture treatment systems and institutional controls must directly measure the amount of trash deposited in the drainage area during any 30-day period from June 22nd to September 22nd each year. Annual recalculation acts as a measure of the effectiveness of source reduction measures. The recommended method for measuring trash during this time period is to close the catch basins in a manner that prevents trash from being swept into the catch basins, and then to collect trash on the ground via street sweeping,
- 76 -

Rio Hondo/San Gabriel River Water Quality Group Coordinated Integrated Monitoring Program
manual pickup, or other comparable means. The DGR and storm event discharge are calculated using the following equations:
DGR = Amount of trash collected during a 30-day period / 30 days Storm Event Discharge = [days since last street sweeping * DGR] - Amount of trash from catch basins
A.3.3 LAR Nitrogen TMDL The LAR Nitrogen TMDL BPA required MS4 responsible parties to submit a Work Plan to estimate nitrogen loadings from the storm drain system (Nitrogen Loadings Work Plan) by March 23, 2005. The Nitrogen Loadings Work Plan was to include ammonia, nitrate, and nitrite monitoring through a phased approach with the possibility of the first phase of monitoring occurring at the S10 Mass Emission Station as well as include a protocol and schedule for implementing any additional monitoring, if necessary. The Nitrogen TMDL BPA also required major NPDES Permittees, including stormwater and wastewater reclamation plants, to submit a Work Plan to evaluate the effectiveness of nitrogen reductions on removing impairments from algae, odors, scum, and pH (Algae Work Plan) by March 23, 2005. The monitoring program for the Algae Work Plan was to include instream monitoring of algae, foam, scum, pH, and odors in the Los Angeles River. In addition, groundwater discharges to the Los Angeles River were to also be analyzed for nutrients to determine the magnitude of these loadings and the need for load allocations. Two separate Work Plans were submitted in early 2005; thus, the requirement to submit the Work Plans has been met. Given that the submitted Work Plans do not appear to have been approved by the LARWQCB, MS4 responsible parties have not been required to meet specific monitoring requirements (i.e., monitoring a list of constituents at specified locations and frequencies) to satisfy the LAR Nitrogen TMDL monitoring requirements. However, the Monitoring Work Plan to Assess Nutrients Loading from the Municipal Separate Storm Sewer System in the Los Angeles River Watershed (i.e., the Work Plan submitted to meet the Nitrogen Loadings Work Plan requirements) did propose a phased approach to monitoring, with the first phase consisting of quarterly monitoring at the S10 Mass Emission Station for the following constituents:
Dissolved Oxygen Temperature Conductivity pH Ammonia Nitrate + Nitrite Nitrate-Nitrogen Nitrite-Nitrogen
The LAR Nitrogen TMDL monitoring would be required upon approval of the Nitrogen Loadings Work Plan. The Work Plan for the Evaluation of the Effectiveness of Nitrogen Loading Reductions in Removing Algae-Related Impairments in the Los Angeles River Watershed (i.e., the Work Plan submitted to meet the Algae Work Plan requirements) did not propose any monitoring locations within or downstream of the EWMP area. A.3.4 LAR Metals TMDL The LAR Metals TMDL requires ambient and TMDL effectiveness monitoring to be conducted. The LAR Metals TMDL specifies that total recoverable metals, dissolved metals, including cadmium and zinc, and hardness are to be monitored monthly at each ambient monitoring location until the TMDL is re-considered at year five. Given that the TMDL has been reconsidered and that five years have passed
- 77 -

Rio Hondo/San Gabriel River Water Quality Group Coordinated Integrated Monitoring Program
since the effective date of the TMDL, these specific ambient monitoring requirements do not appear to apply. The LAR Metals TMDL does not specify the requirements for ambient monitoring that takes place after the TMDL re-consideration. In addition, the LAR Metals TMDL required the responsible parties to submit a CMP to address TMDL effectiveness monitoring requirements and allows for additional monitoring and special studies to refine the estimate of loading capacity and waste load and/or load allocations, or optimize implementation efforts. As previously described, the LAR Metals TMDL Technical Committee submitted the LAR Metals TMDL CMP in March 2008 to meet the TMDL effectiveness monitoring requirements of the LAR Metals TMDL. Given that the LAR Metals CMP was approved, the MS4 responsible parties must conduct the monitoring specified in the LAR Metals CMP. The City of Los Angeles WPD, in collaboration with other responsible parties including the RH/SGRWQG, conducts the CMP monitoring to address this TMDL. The LAR Metals TMDL CMP does not include any monitoring locations within the EWMP area, but does include locations downstream of the area.
- 78 -
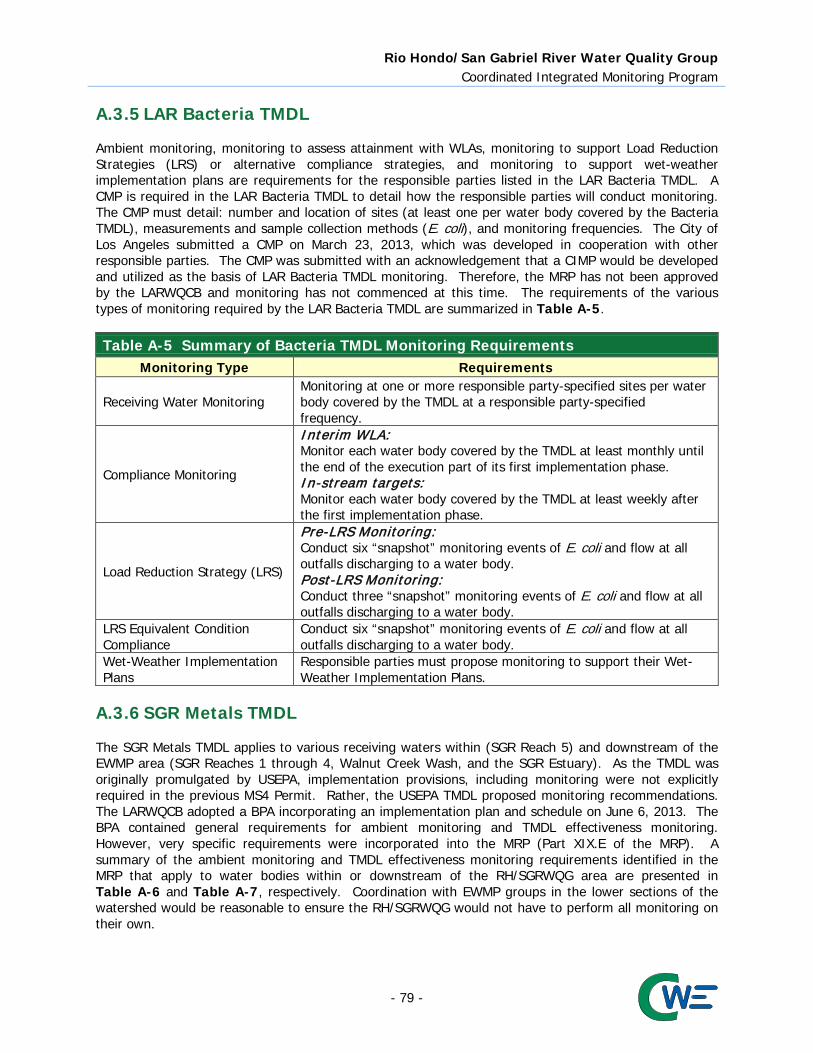
Rio Hondo/San Gabriel River Water Quality Group Coordinated Integrated Monitoring Program
A.3.5 LAR Bacteria TMDL Ambient monitoring, monitoring to assess attainment with WLAs, monitoring to support Load Reduction Strategies (LRS) or alternative compliance strategies, and monitoring to support wet-weather implementation plans are requirements for the responsible parties listed in the LAR Bacteria TMDL. A CMP is required in the LAR Bacteria TMDL to detail how the responsible parties will conduct monitoring. The CMP must detail: number and location of sites (at least one per water body covered by the Bacteria TMDL), measurements and sample collection methods (E. coli), and monitoring frequencies. The City of Los Angeles submitted a CMP on March 23, 2013, which was developed in cooperation with other responsible parties. The CMP was submitted with an acknowledgement that a CIMP would be developed and utilized as the basis of LAR Bacteria TMDL monitoring. Therefore, the MRP has not been approved by the LARWQCB and monitoring has not commenced at this time. The requirements of the various types of monitoring required by the LAR Bacteria TMDL are summarized in Table A-5.
Table A-5 Summary of Bacteria TMDL Monitoring Requirements Monitoring Type Requirements
Receiving Water Monitoring Monitoring at one or more responsible party-specified sites per water body covered by the TMDL at a responsible party-specified frequency.
Compliance Monitoring
Interim WLA: Monitor each water body covered by the TMDL at least monthly until the end of the execution part of its first implementation phase. In-stream targets: Monitor each water body covered by the TMDL at least weekly after the first implementation phase.
Load Reduction Strategy (LRS)
Pre-LRS Monitoring: Conduct six “snapshot” monitoring events of E. coli and flow at all outfalls discharging to a water body. Post-LRS Monitoring: Conduct three “snapshot” monitoring events of E. coli and flow at all outfalls discharging to a water body.
LRS Equivalent Condition Compliance
Conduct six “snapshot” monitoring events of E. coli and flow at all outfalls discharging to a water body.
Wet-Weather Implementation Plans
Responsible parties must propose monitoring to support their Wet-Weather Implementation Plans.
A.3.6 SGR Metals TMDL The SGR Metals TMDL applies to various receiving waters within (SGR Reach 5) and downstream of the EWMP area (SGR Reaches 1 through 4, Walnut Creek Wash, and the SGR Estuary). As the TMDL was originally promulgated by USEPA, implementation provisions, including monitoring were not explicitly required in the previous MS4 Permit. Rather, the USEPA TMDL proposed monitoring recommendations. The LARWQCB adopted a BPA incorporating an implementation plan and schedule on June 6, 2013. The BPA contained general requirements for ambient monitoring and TMDL effectiveness monitoring. However, very specific requirements were incorporated into the MRP (Part XIX.E of the MRP). A summary of the ambient monitoring and TMDL effectiveness monitoring requirements identified in the MRP that apply to water bodies within or downstream of the RH/SGRWQG area are presented in Table A-6 and Table A-7, respectively. Coordination with EWMP groups in the lower sections of the watershed would be reasonable to ensure the RH/SGRWQG would not have to perform all monitoring on their own.
- 79 -
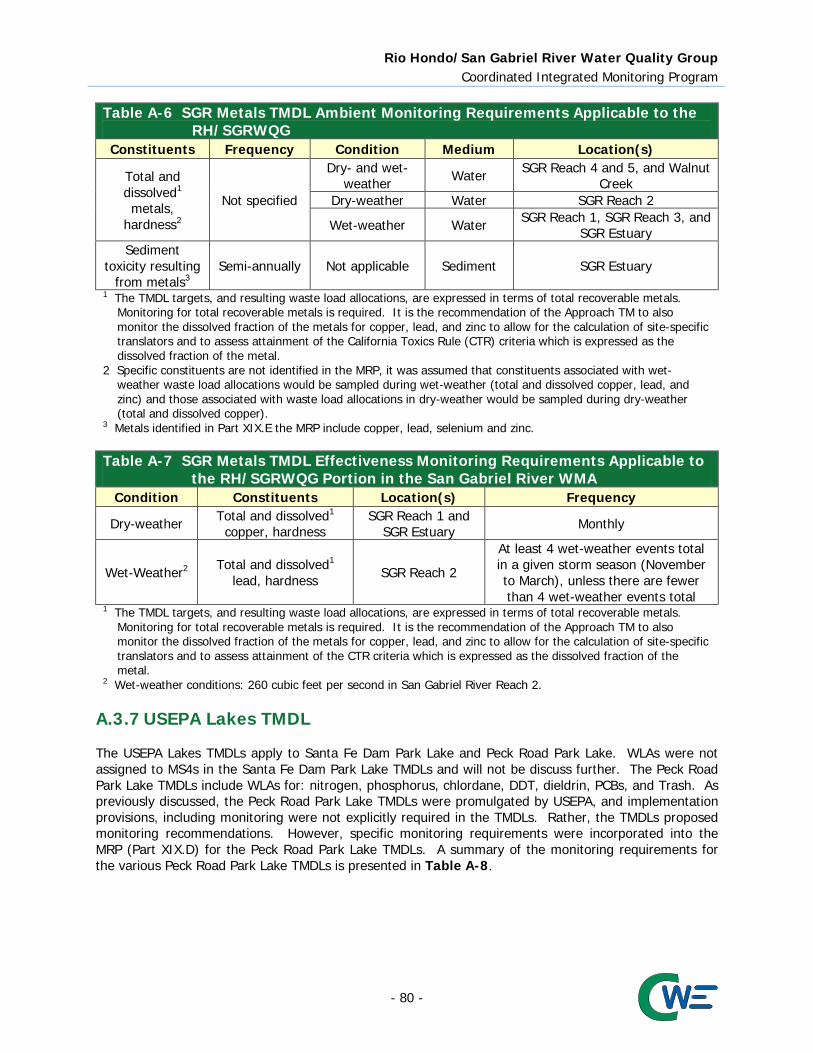
Rio Hondo/San Gabriel River Water Quality Group Coordinated Integrated Monitoring Program
Table A-6 SGR Metals TMDL Ambient Monitoring Requirements Applicable to the
RH/SGRWQG Constituents Frequency Condition Medium Location(s)
Total and dissolved1 metals,
hardness2
Not specified
Dry- and wet-weather Water SGR Reach 4 and 5, and Walnut
Creek Dry-weather Water SGR Reach 2
Wet-weather Water SGR Reach 1, SGR Reach 3, and SGR Estuary
Sediment toxicity resulting
from metals3 Semi-annually Not applicable Sediment SGR Estuary
1 The TMDL targets, and resulting waste load allocations, are expressed in terms of total recoverable metals. Monitoring for total recoverable metals is required. It is the recommendation of the Approach TM to also monitor the dissolved fraction of the metals for copper, lead, and zinc to allow for the calculation of site-specific translators and to assess attainment of the California Toxics Rule (CTR) criteria which is expressed as the dissolved fraction of the metal.
2 Specific constituents are not identified in the MRP, it was assumed that constituents associated with wet-weather waste load allocations would be sampled during wet-weather (total and dissolved copper, lead, and zinc) and those associated with waste load allocations in dry-weather would be sampled during dry-weather (total and dissolved copper).
3 Metals identified in Part XIX.E the MRP include copper, lead, selenium and zinc. Table A-7 SGR Metals TMDL Effectiveness Monitoring Requirements Applicable to
the RH/SGRWQG Portion in the San Gabriel River WMA Condition Constituents Location(s) Frequency
Dry-weather Total and dissolved1 copper, hardness
SGR Reach 1 and SGR Estuary Monthly
Wet-Weather2 Total and dissolved1 lead, hardness SGR Reach 2
At least 4 wet-weather events total in a given storm season (November to March), unless there are fewer than 4 wet-weather events total
1 The TMDL targets, and resulting waste load allocations, are expressed in terms of total recoverable metals. Monitoring for total recoverable metals is required. It is the recommendation of the Approach TM to also monitor the dissolved fraction of the metals for copper, lead, and zinc to allow for the calculation of site-specific translators and to assess attainment of the CTR criteria which is expressed as the dissolved fraction of the metal.
2 Wet-weather conditions: 260 cubic feet per second in San Gabriel River Reach 2. A.3.7 USEPA Lakes TMDL The USEPA Lakes TMDLs apply to Santa Fe Dam Park Lake and Peck Road Park Lake. WLAs were not assigned to MS4s in the Santa Fe Dam Park Lake TMDLs and will not be discuss further. The Peck Road Park Lake TMDLs include WLAs for: nitrogen, phosphorus, chlordane, DDT, dieldrin, PCBs, and Trash. As previously discussed, the Peck Road Park Lake TMDLs were promulgated by USEPA, and implementation provisions, including monitoring were not explicitly required in the TMDLs. Rather, the TMDLs proposed monitoring recommendations. However, specific monitoring requirements were incorporated into the MRP (Part XIX.D) for the Peck Road Park Lake TMDLs. A summary of the monitoring requirements for the various Peck Road Park Lake TMDLs is presented in Table A-8.
- 80 -

Rio Hondo/San Gabriel River Water Quality Group Coordinated Integrated Monitoring Program
Table A-8 Summary of Peck Road Park Lake TMDLs Monitoring Requirements TMDL Constituent(s) Monitoring Frequency
Peck Road Park Lake Nutrient TMDL
In-lake Compliance Monitoring TMDL constituents: Ammonia, TKN or organic nitrogen, nitrate plus nitrite, orthophosphate, total phosphorus, TSS, TDS, and chlorophyll a. General constituents throughout water column: temperature, DO, pH, electrical conductivity, and Secchi depth.
At a minimum, twice during summer months and once during winter.
Stormwater Monitoring Discharge Point: flow, ammonia, TKN or organic nitrogen, nitrate plus nitrite, orthophosphate, total phosphorus, TSS, and TDS.
Twice per year
Peck Road Park Lake PCBs and Organochlorine Pesticides TMDLs
In-lake Compliance Monitoring TMDL constituents: TSS, total PCBs, total chlordane, total DDTs, and dieldrin General constituents throughout water column: temperature, DO, pH, electrical conductivity, Secchi depth
Annually
Fish Tissue Monitoring OC pesticides and PCBs must meet fish tissue targets in a composite sample of skin-off fillets from at least five common carp > 350mm in length
At least every three years
Stormwater Monitoring Discharge Point: Collect sufficient volume of suspended solids to analyze total organic carbon (TOC), TSS, total PCBs, total chlordane, total DDTs, and dieldrin. Measurements of flow, DO, pH, and electrical conductivity
Once per year during a wet-weather event
Peck Road Park Lake Trash TMDL
Monitor trash deposited in the vicinity of Peck Road Park Lake and in the water body to comply with the TMDL target and gage implementation efforts effectiveness.
Quarterly
A.3.8 Summary of TMDL Compliance Points Currently, only the Harbors Toxics TMDL has an implementation plan with effective interim and final compliance milestones. The Regional Board has adopted an implementation plan for the SGR Metals TMDL and is currently being reviewed by the State Water Resources Control Board. The implementation plan is anticipated to be effective within the current MS4 Permit term. The compliance dates and milestones for the TMDLs are listed in Table A-9, Table A-10, and Table A-11. In Table A-9 and Table A-11 the milestone dates for the SGR Metals TMDL correspond to the implementation plan adopted by the Regional Board.
- 81 -

Rio Hondo/San Gabriel River Water Quality Group Coordinated Integrated Monitoring Program
Table A-9 Interim and Final TMDL Compliance Applicable to the Rio Hondo and Tributaries (Except Dry-Weather
Los Angeles River Bacteria)
TMDL Water Bodies Constituents Compliance Goal
Weather Condition
Interim and Final Compliance Dates (Bolded numbers indicate deadlines within the current MS4 Permit term)1
2012 2013 2014 2015 2016 2020 2024 2028 2032 2037
LA River Nitrogen All Water Bodies Ammonia, Nitrate,
Nitrite, Nitrate +Nitrite
Meet WQBELs All
Pre 2012 Final
LA River Trash All Water Bodies Trash % Reduction All 9/30 9/30 9/30 9/30 9/30 70% 80% 90% 96.7% 100%
LA River Metals
All Water Bodies Copper, Lead, Zinc % of MS4 area Meets WQBELs
Dry 1/11 1/11 1/11 50% 75% 100%
All Water Bodies Copper, Lead, Zinc, Cadmium
% of MS4 area Meets WQBELs
Wet 1/11 1/11 1/11 25% 50% 100%
LA River Bacteria All Water Bodies E. coli Meet WQBELs Wet 3/23
Final Dominguez Channel and
LA/LB Harbors Toxics2
Estuary Sediment: DDTs, PCBs, Copper,
Lead, Zinc, PAHs
Meet WQBELs All
12/28 3/23
Interim Final
USEPA Lakes TMDLs
Peck Road Park Lake
Total-P, Total-N, Trash Water and Sediment: PCBs, Chlordane, DDT,
Dieldrin
Meet WLAs All USEPA TMDLs do not contain implementation schedules. The MS4 Permit
(Part VI.E.3.c, page 145) allows MS4 Permittees to propose a schedule in an EWMP.
1 The MS4 Permit term is assumed to be five years from the MS4 Permit effective date or December 27, 2017. 2 Harbors Toxics TMDL applied to both the Los Angeles River and San Gabriel River WMAs.
- 82 -

Rio Hondo/San Gabriel River Water Quality Group Coordinated Integrated Monitoring Program
Table A-10 Interim and Final Dry-Weather Los Angeles River Bacteria TMDL Compliance Dates Applicable to the
Rio Hondo and Tributaries
TMDL Water Bodies Constituents Compliance Goal
Weather Condition
Interim and Final Compliance Dates (Bolded numbers indicated milestone deadlines within the current MS4 Permit
term)1
2016 2020 2023 2030
LA River Bacteria
All Water Bodies E. coli Meet
WQBELs
Dry w/o LRS
3/23 Final
Dry w/ LRS
3/23 9/23 3/23 3/23 Submit LRS2 Complete LRS Interim Final
1 The MS4 Permit term is assumed to be five years from the MS4 Permit effective date or December 27, 2017. 2 Load Reduction Strategy (LRS) requires coordinated effort by all MS4 Permittees within a segment or tributary. A LRS must quantitatively demonstrate that the
actions for specific outfalls are sufficient to result in attainment of the final WLAs. Requires six snapshot outfall sampling events prior to LRS and three post-LRS snapshot sampling events.
Table A-11 Interim and Final TMDL Compliance Dates Applicable to the San Gabriel River and Tributaries
TMDL Water Bodies Constituents Compliance Goal
Weather Condition
Interim and Final Compliance Dates (Bolded numbers indicated milestone deadlines within the current MS4 Permit
term)1 2012 2013 2014 2015 2016 2017 2020 2023 2026 2032
Dominguez Channel and
LA/LB Harbors Toxics2
Estuary Sediment: DDTs, PCBs, Copper,
Lead, Zinc, PAHs
Meet WQBELs All
12/28 3/23
Interim Final
San Gabriel River Metals TMDL3
San Gabriel River Reach 2 Lead Percent
Compliance4 Wet 9/30 9/30 9/30 9/30 10% 35% 65% 100% 1 The MS4 Permit term is assumed to be five years from the MS4 Permit effective date or December 27, 2017.
2 Harbors Toxics TMDL applied to both the Los Angeles River and San Gabriel River WMAs. 3 Assumes adoption and approval of draft implementation plan. 4 Alternatively may be demonstrated as percent of required reduction.
- 83 -

Rio Hondo/San Gabriel River Water Quality Group Coordinated Integrated Monitoring Program
A.4 Water Quality Priorities Water quality priorities for the RH/SGRWQG are based on TMDLs, 303(d) list, and monitoring data. Based on available information and data analysis, WBPCs were classified in one of the three MS4 Permit defined categories. Category 1 if WBPCs are subject to established TMDLs, Category 2 if they are on the 303(d) List, or have sufficient exceedances to be listed, and Category 3 if there are observed exceedances but too infrequently to be listed. A.4.1 Water Body-Pollutant Subject to TMDL Appendix O and P in the MS4 Permit lists the TMDLs directly applicable to the EWMP area. WBPCs identified through TMDLs are included as Category 1. Additional information on the TMDLs is provided in the previous Section. A.4.2 Water Body-Pollutant on 2010 303(d) List WBPCs on the State Water Resources Control Board’s (SWRCB) 2010 Clean Water Act Section 303(d) List that are not already addressed by a TMDL or other action are included as Category 2. The 303(d) listed water bodies are highlighted on Figure A-1 and the location of the listing are presented in Table A-12. All listings within or downstream of the EWMP area were identified and included to acknowledge that discharges from upstream reaches could impact the listed area, particularly during wet-weather. However, a constituent included in the table does not infer MS4 discharges from the EWMP area contribute to the downstream impairment. Additional analysis would need to be conducted to make that determination. The modeling conducted as part of the RAA analysis or special studies implemented through the CIMP would be alternatives allowing the RH/SGRWQG to make the determination.
Table A-12 Category 2 Water Body-Pollutant Combinations
Constituent Sawpit Wash Monrovia Wash
Lead L Indicator Bacteria L Bis(2-ethylhexyl)phthalate L L = Listed on 2010 303(d) list.
A.4.3 Water Body-Pollutant RWL Exceedances Monitoring data for sites within the Los Angeles and San Gabriel River WMAs was received from the following sources:
The Council for Watershed Health provided monitoring data from their monitoring activities throughout the watershed;
Data received from the Council for Watershed Health largely consisted of short term monitoring activities and many sites from these programs were only used for a single sampling event or had a limited number of constituents tested at the sites. One site monitored for one event is the only monitoring in the program reflective of the receiving waters in the EWMP area. All data records were screened to identify potential water quality objective exceedances.
- 84 -

Rio Hondo/San Gabriel River Water Quality Group Coordinated Integrated Monitoring Program
A.4.4 RH/SGRWQG Water Quality Priorities Table A-13 defines subcategories of WBPCs that correspond with the MS4 Permit prioritization categories. The WBPCs are placed in the respective subcategories in Table A-14.
- 85 -

Rio Hondo/San Gabriel River Water Quality Group Coordinated Integrated Monitoring Program
Table A-13 Details for Water Body-Pollutant Combination Subcategories Category Water Body-Pollutant Combinations (WBPCs) Description
1
Category 1A: WBPCs with past due or current MS4 Permit term TMDL deadlines.
WBPCs with TMDLs with past due or current MS4 Permit term interim and/or final limits. These pollutants are the highest priority for the current MS4 Permit term.
Category 1B: WBPCs with TMDL deadlines beyond the MS4 Permit term.
The MS4 Permit does not require the prioritization of TMDL interim and/or final deadlines outside of the MS4 Permit term or USEPA TMDLs, which do not have implementation schedules. To ensure EWMPs consider long term planning requirements and utilize the available compliance mechanisms these WBPCs should be considered during BMP planning and scheduling, and during CIMP development.
Category 1C: WBPCs addressed in USEPA TMDL without a Regional Board Adopted Implementation Plan.
2
Category 2A: 303(d) listed WBPCs or WBPCs that meet 303(d) listing requirements.
WBPCs with confirmed impairment or exceedances of receiving water limitations. WBPCs in a similar class1 as those with TMDLs are identified. WBPCs currently on the 303(d) list are differentiated from those that are not to support utilization of EWMP compliance mechanisms.
Category 2B: 303(d) listed WBPCs or WBPCs that meet 303(d) listing requirements that are not a “pollutant”2 (i.e., toxicity).
WBPCs where specific actions may not be identifiable because the cause of the impairment or exceedances is not resolved. Either routine monitoring or special studies identified in the CIMP should support identification of a “pollutant” linked to the impairment and re-prioritization in the future.
3
Category 3A: All other WBPCs with exceedances identified through CIMP implementation.
Pollutants that are in a similar class1 as those with TMDLs are identified.
Category 3B: All other WBPCs that are not a “pollutant”2 (i.e., toxicity).
WBPCs where specific actions may not be identifiable because the cause of the impairment or exceedances is not resolved. Either routine monitoring or special studies identified in the CIMP should support identification of a “pollutant” linked to the impairment and re-prioritization in the future.
Category 3C: WBPCs identified by the RH/SGRWQG members.
The RH/SGRWQG members may identify other WBPCs for consideration in EWMP planning.
- 86 -

Rio Hondo/San Gabriel River Water Quality Group Coordinated Integrated Monitoring Program
Table A-14 Summary of RH/SGRWQG WBPC Categories
Class1 Constituents Rio Hondo Reach 3
Monrovia Wash
Sawpit Wash
San Gabriel River
Reach 5
San Dimas Wash
Big Dalton Wash
Peck Road Park Lake
Category 1A: WBPCs with past due or current term TMDL deadlines.
Nutrients Ammonia F F F Nitrate F F F Nitrite F F F
Metals
Copper (Dry) I I I Lead (Dry) I I I Zinc (Dry) I I I Copper (Wet) I I I Lead (Wet) I I I I3 I3 I3 Zinc (Wet) I I I Cadmium (Wet) I I I
Trash Trash I/F I/F I/F Category 1B: WBPCs with TMDL deadlines beyond the current MS4 Permit term.
Metals
Copper (Dry) F F F Lead (Dry) F F F Zinc (Dry) F F F Copper (Wet) F F F Lead (Wet) F F F F3 F3 F3 Zinc (Wet) F F F Cadmium (Wet) F F F
Bacteria Fecal Coliform and E. coli I/F I/F I/F Category 1C: WBPCs addressed in USEPA TMDL without an Implementation Plan.
Nutrients Total Nitrogen X Total Phosphorus X
Legacy PCB (Sediment) X PCB (Water) X Chlordane (Sediment) X
- 87 -

Rio Hondo/San Gabriel River Water Quality Group Coordinated Integrated Monitoring Program
Table A-14 Summary of RH/SGRWQG WBPC Categories
Class1 Constituents Rio Hondo Reach 3
Monrovia Wash
Sawpit Wash
San Gabriel River
Reach 5
San Dimas Wash
Big Dalton Wash
Peck Road Park Lake
Chlordane (Water) X Dieldrin (Sediment) X Dieldrin (Water) X
Legacy DDT (Sediment) X DDT (Water) X
Category 2C: 303(d) listed WBPCs. Metals Lead 303(d) Bacteria Indicator Organisms 303(d) 303(d) 303(d)
Other Bis(2-ethylhexyl) phthalate 303(d)
Category 3: All other WBPCs with exceedances identified through CIMP implementation.4 1 Pollutants are considered in a similar class if they have similar fate and transport mechanisms, can be addressed via the same types of control measures,
and within the same timeline already contemplated as part of the EWMP for the TMDL (MS4 Permit, Part VI.C.2.a.i). 2 While pollutants may be contributing to the impairment, it currently is not possible to identify the specific pollutant/stressor. 3 Grouped wet-weather waste load allocation, expressed as total recoverable metals discharged to all upstream reaches and tributaries of the San Gabriel
River Reach 2. 4 Monitoring of MRP Table E-2 constituents in the first year LTA sites are established will identify the Category 3 constituents. Note that unless explicitly stated as sediment, constituents are associated with the water column. I/F = Denotes where the MS4 Permit includes interim (I) and/or final (F) effluent and/or receiving water limitations. X = Identification of a WBPC, but no corresponding MS4 Permit implementation. 303(d) = WBPC on the 2010 303(d) list where the listing was confirmed during data analysis.
- 88 -

Rio Hondo/San Gabriel River Water Quality Group Coordinated Integrated Monitoring Program
Constituents may change subcategories as the monitoring progresses, source investigations occur, and BMP implementation begins. Constituents for which exceedances decrease over time will be removed from the priority list and moved to the monitoring priority categories; or, dropped from the priority list. If the frequency of constituent exceedances increases to a consistent level, for a constituent that is currently not a priority, then the constituent would be reevaluated using the prioritization procedure, likely increasing the priority of the constituent. Due to the natural rate of infiltration, the Rio Hondo and San Gabriel River are generally dry with the exception of storm flows. Future monitoring will be assessed to establish the disconnect between the upper and lower watershed during dry and minor storm events. On establishing the disconnection, the corresponding WBPCs flagged due to downstream water quality issues will be adjusted or removed from the categorization.
- 89 -

Rio Hondo/San Gabriel River Water Quality Group Coordinated Integrated Monitoring Program
Attachment B
Monitoring Location Fact Sheets
- 90 -

Rio Hondo/San Gabriel River Water Quality Group Coordinated Integrated Monitoring Program
B.1 Receiving Water Sites
Rio Hondo Long Term Assessment Site Water Body Name
Water Body Type Site ID Historical
Site ID Site Type Latitude Longitude
Rio Hondo Reach 3 Tributary RHSGR_RH3_ARC N/A LTA, TMDL 34.089836 -118.033828
General Description: LTA and TMDL monitoring site located just downstream of the confluence of Arcadia Wash and Rio Hondo Reach 3.
RHSGR_RH3_ARC Aerial View
RHSGR_RH3_ARC Looking Upstream
- 91 -

Rio Hondo/San Gabriel River Water Quality Group Coordinated Integrated Monitoring Program
Little Dalton Wash Long Term Assessment Site Water Body Name
Water Body Type Site ID Historical
Site ID Site Type Latitude Longitude
Little Dalton Wash Tributary RHSGR_LDW_BDW N/A LTA,
TMDL 34.099445 -117.926766
General Description: LTA and TMDL monitoring site located just upstream of the confluence of Little Dalton Wash and Big Dalton Wash downstream of Vincent Avenue.
RHSGR_LDW_BDW Aerial View
RHSGR_LDW_BDW Looking Upstream
- 92 -

Rio Hondo/San Gabriel River Water Quality Group Coordinated Integrated Monitoring Program
Santa Anita Wash TMDL Site Water Body Name
Water Body Type Site ID Historical
Site ID Site Type Latitude Longitude
Santa Anita Wash Tributary RHSGR_SAN_DD N/A TMDL 34.106200 -118.016150
General Description: TMDL monitoring site located in Santa Anita Wash near Daines Drive.
RHSGR_SAN_DD Aerial View
RHSGR_SAN_DD Looking Downstream
- 93 -
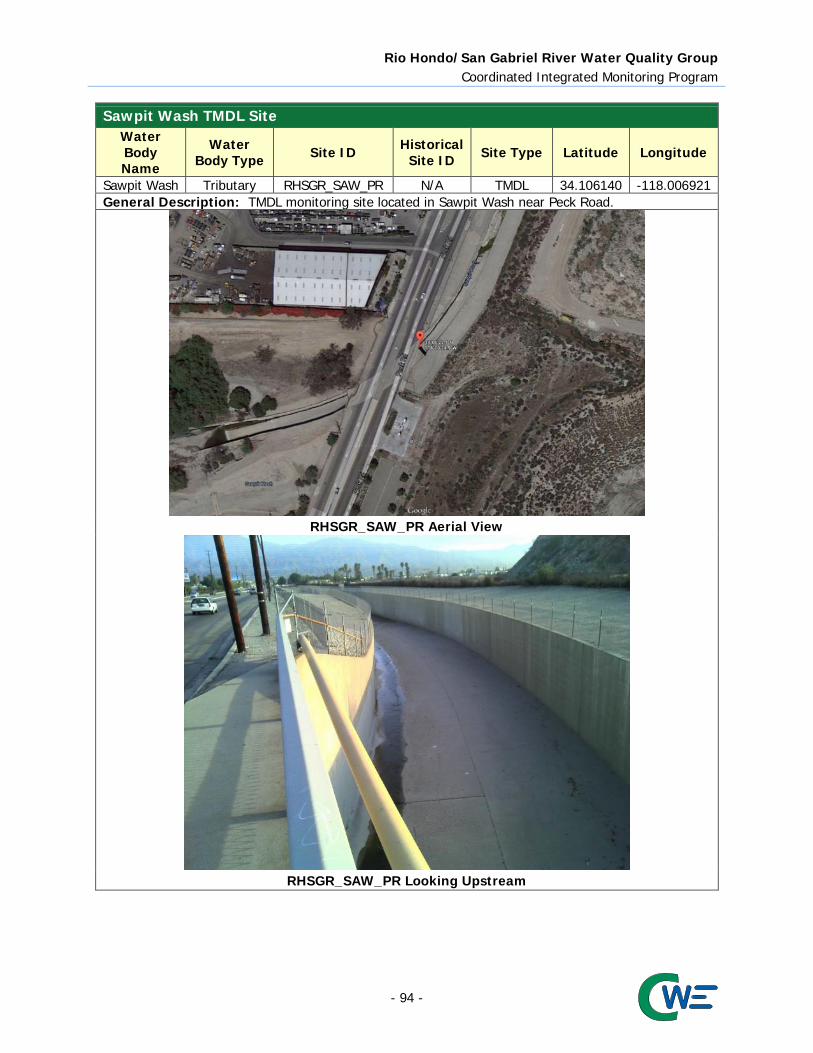
Rio Hondo/San Gabriel River Water Quality Group Coordinated Integrated Monitoring Program
Sawpit Wash TMDL Site Water Body Name
Water Body Type Site ID Historical
Site ID Site Type Latitude Longitude
Sawpit Wash Tributary RHSGR_SAW_PR N/A TMDL 34.106140 -118.006921 General Description: TMDL monitoring site located in Sawpit Wash near Peck Road.
RHSGR_SAW_PR Aerial View
RHSGR_SAW_PR Looking Upstream
- 94 -
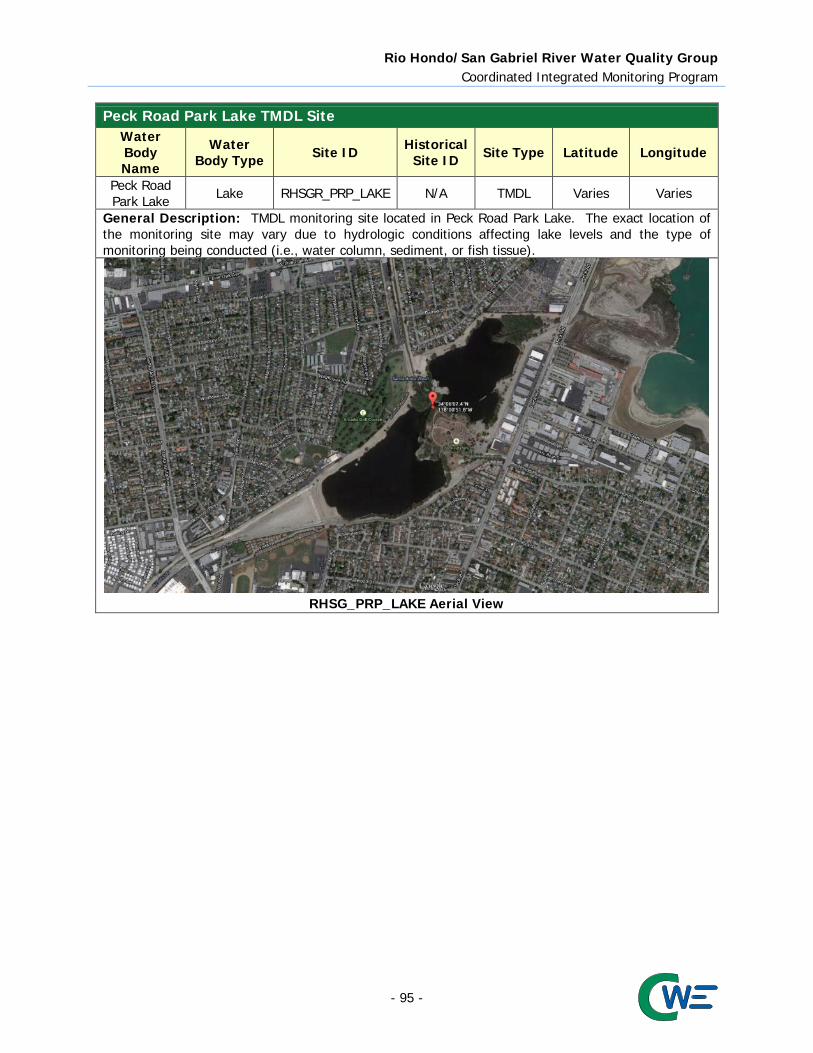
Rio Hondo/San Gabriel River Water Quality Group Coordinated Integrated Monitoring Program
Peck Road Park Lake TMDL Site Water Body Name
Water Body Type Site ID Historical
Site ID Site Type Latitude Longitude
Peck Road Park Lake Lake RHSGR_PRP_LAKE N/A TMDL Varies Varies
General Description: TMDL monitoring site located in Peck Road Park Lake. The exact location of the monitoring site may vary due to hydrologic conditions affecting lake levels and the type of monitoring being conducted (i.e., water column, sediment, or fish tissue).
RHSG_PRP_LAKE Aerial View
- 95 -
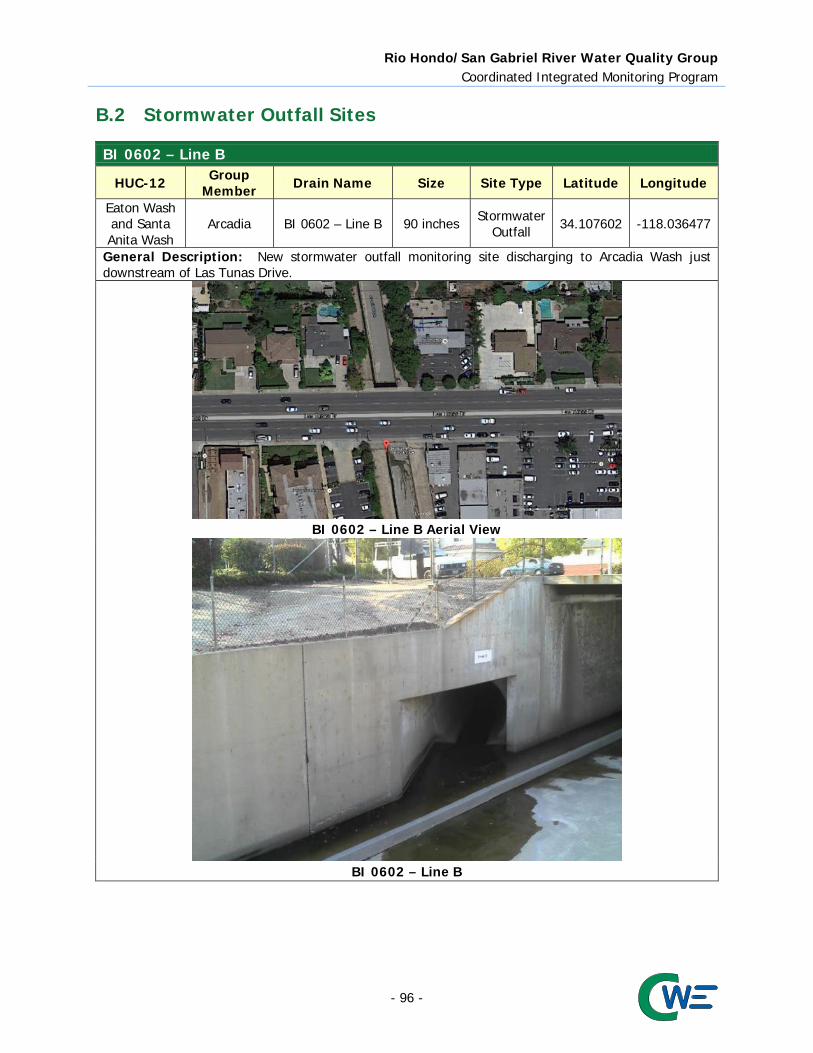
Rio Hondo/San Gabriel River Water Quality Group Coordinated Integrated Monitoring Program
B.2 Stormwater Outfall Sites
BI 0602 – Line B
HUC-12 Group Member Drain Name Size Site Type Latitude Longitude
Eaton Wash and Santa Anita Wash
Arcadia BI 0602 – Line B 90 inches Stormwater Outfall 34.107602 -118.036477
General Description: New stormwater outfall monitoring site discharging to Arcadia Wash just downstream of Las Tunas Drive.
BI 0602 – Line B Aerial View
BI 0602 – Line B
- 96 -

Rio Hondo/San Gabriel River Water Quality Group Coordinated Integrated Monitoring Program
BI 1219 – Line C
HUC-12 Group Member Drain Name Size Site Type Latitude Longitude
Big Dalton Wash County BI 1219 – Line C 63 inches Stormwater
Outfall 34.111369 -117.890254
General Description: New stormwater outfall monitoring site discharging to Big Dalton Wash. Located on S. Citrus Avenue in front of the property located near 588-598 S. Citrus Avenue.
BI 1219 –Line C Aerial View
BI 1219 –Line C
- 97 -

Rio Hondo/San Gabriel River Water Quality Group Coordinated Integrated Monitoring Program
Beatty Canyon
HUC-12 Group Member Drain Name Size Site Type Latitude Longitude
Santa Fe FCB Azusa Beatty Canyon 144 inches Stormwater
Outfall 34.143496 -117.925637
General Description: New stormwater outfall monitoring site discharging to San Gabriel River Reach 5. Located on W. Sierra Madre Avenue in front of the property located at 1351 W. Sierra Madre Avenue.
Beatty Canyon Aerial View
Beatty Canyon
- 98 -
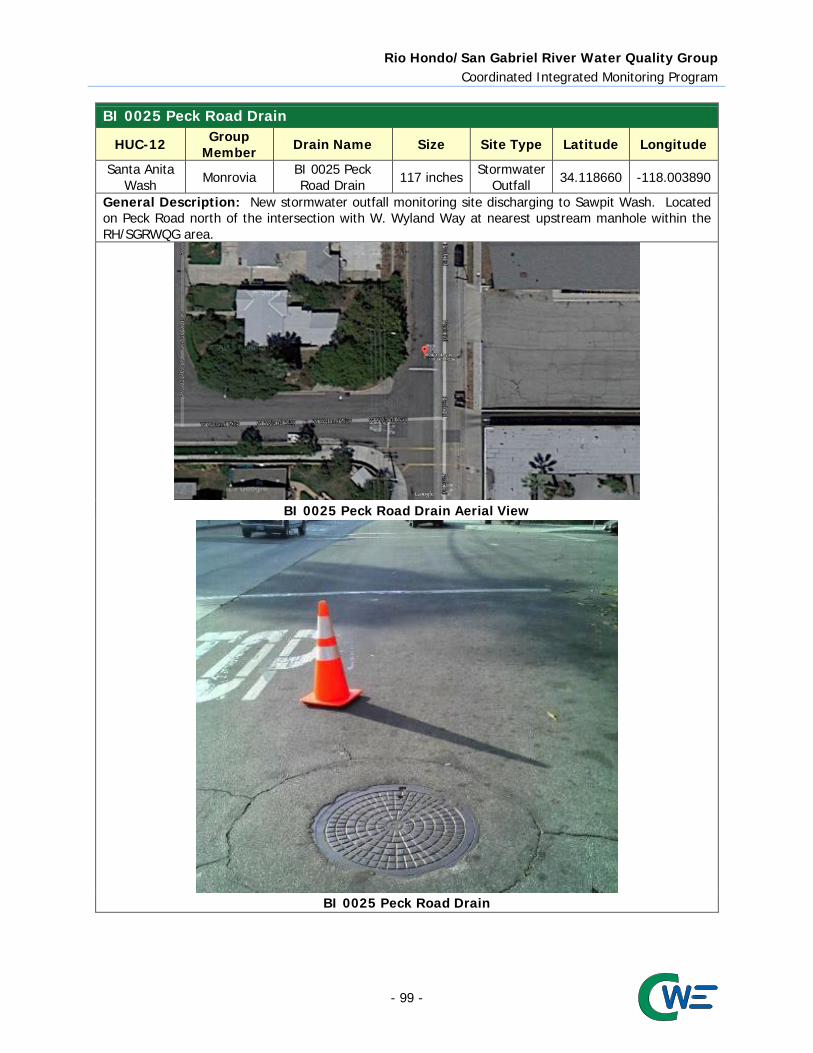
Rio Hondo/San Gabriel River Water Quality Group Coordinated Integrated Monitoring Program
BI 0025 Peck Road Drain
HUC-12 Group Member Drain Name Size Site Type Latitude Longitude
Santa Anita Wash Monrovia BI 0025 Peck
Road Drain 117 inches Stormwater Outfall 34.118660 -118.003890
General Description: New stormwater outfall monitoring site discharging to Sawpit Wash. Located on Peck Road north of the intersection with W. Wyland Way at nearest upstream manhole within the RH/SGRWQG area.
BI 0025 Peck Road Drain Aerial View
BI 0025 Peck Road Drain
- 99 -

Rio Hondo/San Gabriel River Water Quality Group Coordinated Integrated Monitoring Program
Bradbury Drain
HUC-12 Group Member Drain Name Size Site Type Latitude Longitude
Santa Fe FCB Duarte Bradbury Drain 156 inches Stormwater
Outfall 34.137830 -117.955760
General Description: New stormwater outfall monitoring site located where Bradbury Drain daylights near the intersection of Mount Olive Drive and Bloomdale Street.
Bradbury Drain Aerial View
Bradbury Drain
- 100 -

Rio Hondo/San Gabriel River Water Quality Group Coordinated Integrated Monitoring Program
Attachment C
Table E-2 of the Monitoring and Reporting Program
- 101 -

Rio Hondo/San Gabriel River Water Quality Group Coordinated Integrated Monitoring Program
C.1 Table E-2 of the Monitoring and Reporting Program
Constituents Conventional Pollutants Oil and Grease Total Phenols Cyanide pH Temperature Dissolved Oxygen Bacteria Fecal Coliform E. coli General Dissolved Phosphorus Total Phosphorus Turbidity Total Suspended Solids Total Dissolved Solids Volatile Suspended Solids Total Organic Carbon Total Petroleum Hydrocarbon Biochemical Oxygen Demand Chemical Oxygen Demand Total Ammonia-Nitrogen Total Kjeldahl Nitrogen Nitrate-Nitrite Alkalinity Specific Conductance Total Hardness MBAS Chloride Fluoride Methyl tertiary butyl ether (MTBE) Perchlorate Metals Aluminum Antimony Arsenic Beryllium Cadmium Chromium (total)
- 102 -

Rio Hondo/San Gabriel River Water Quality Group Coordinated Integrated Monitoring Program
Constituents Chromium (Hexavalent) Copper Iron Lead Mercury Nickel Selenium Silver Thallium Zinc Semivolatile Organic Compounds Acids 2-Chlorophenol 4-Chloro-3-methylphenol 2,4-Dichlorophenol 2,4-Dimethylphenol 2,4-Dinitrophenol 2-Nitrophenol 4-Nitrophenol Pentachlorophenol Phenol 2,4,6-Trichlorophenol Base/Neutral Acenaphthene Acenaphthylene Anthracene Benzidine 1,2 Benzanthracene Benzo(a)pyrene Benzo(g,h,i)perylene 3,4 Benzofluoranthene Benzo(k)fluoranthene Bis(2-Chloroethoxy) methane Bis(2-Chloroisopropyl) ether Bis(2-Chloroethyl) ether Bis(2-Ethylhexl) phthalate 4-Bromophenyl phenyl ether Butyl benzyl phthalate 2-Chloroethyl vinyl ether 2-Chloronaphthalene 4-Chlorophenyl phenyl ether
- 103 -

Rio Hondo/San Gabriel River Water Quality Group Coordinated Integrated Monitoring Program
Constituents Chrysene Dibenzo(a,h)anthracene 1,3-Dichlorobenzene 1,4-Dichlorobenzene 1,2-Dichlorobenzene 3,3-Dichlorobenzidine Diethyl phthalate Dimethyl phthalate di-n-Butyl phthalate 2,4-Dinitrotoluene 2,6-Dinitrotoluene 4,6 Dinitro-2-methylphenol 1,2-Diphenylhydrazine di-n-Octyl phthalate Fluoranthene Fluorene Hexachlorobenzene Hexachlorobutadiene Hexachloro-cyclopentadiene Hexachloroethane Indeno(1,2,3-cd)pyrene Isophorone Naphthalene Nitrobenzene N-Nitroso-dimethyl amine N-Nitroso-diphenyl amine N-Nitroso-di-n-propyl amine Phenanthrene Pyrene 1,2,4-Trichlorobenzene Chlorinated Pesticides Aldrin alpha-BHC beta-BHC delta-BHC gamma-BHC (lindane) alpha-chlordane gamma-chlordane 4,4'-DDD 4,4'-DDE 4,4'-DDT
- 104 -

Rio Hondo/San Gabriel River Water Quality Group Coordinated Integrated Monitoring Program
Constituents Dieldrin alpha-Endosulfan beta-Endosulfan Endosulfan sulfate Endrin Endrin aldehyde Heptachlor Heptachlor Epoxide Toxaphene Polychlorinated Biphenyels Aroclor-1016 Aroclor-1221 Aroclor-1232 Aroclor-1242 Aroclor-1248 Aroclor-1254 Aroclor-1260 Organophosphate Pesticides Atrazine Chlorpyrifos Cyanazine Diazinon Malathion Prometryn Simazine Herbicides 2,4-D Glyphosate 2,4,5-TP-SILVEX
- 105 -

Rio Hondo/San Gabriel River Water Quality Group Coordinated Integrated Monitoring Program
Attachment D
Stormwater Outfall Selection
- 106 -
Rio Hondo/San Gabriel River Water Quality Group Coordinated Integrated Monitoring Program
D.1 Stormwater Outfall Site Selection The primary criterion cited in the MRP for selection of monitoring sites for the stormwater outfall monitoring program is that the sites are representative of the range of land uses in the area. An additional stated criterion for site selection is the ability to accurately measure flows for pollutant loads characterization. Flow measurement is easily addressed by physical assessment of the site conditions and consideration of access to the site. The primary criterion in the MRP implies an assessment of variation of land uses within the WMA, potential variation in water quality issues for different HUC-12 drainages, and geographic variation in factors influencing runoff quality. In addition to the primary criteria for monitoring site selection, the MS4 Permit defined specific objectives depend on the representativeness of the stormwater outfall monitoring are as follows:
Determine the quality of discharge relative to municipal action levels Determine whether the discharge is in compliance with WQBELs derived from TMDL WLAs Determine whether a discharge causes or contributes to exceedances of RWLs
The default approach in the MRP to achieving adequate representation is to select one major outfall in each HUC–12 within each individual Permittee’s jurisdiction. Consequently, the minimum number of outfalls required for monitoring under the default approach is equal to the total number of unique combinations of HUC-12s and jurisdictions. The default approach is geared toward ensuring adequate accountability and representation if the Permittees monitor as individual entities, but results in monitoring more outfall discharges than needed for efforts coordinated among the RH/SGRWQG. For the San Gabriel River and Los Angeles River WMAs, there would be 12 stormwater outfalls using the default approach. As an alternative to the MRP’s default monitoring approach, the EWMP Group is proposing to monitor one major outfall for each HUC-12 in the WMAs. The resulting data would be considered representative of all group members’ discharge in their respective HUC-12, would provide representative results needed to meet all three specific monitoring objectives, and would also provide the basis for stormwater management decisions for all group members. The rationale supporting the EWMP Group’s alternative approach follows.
D.2 Representativeness of Selected Outfalls The principal criterion for the site selection for stormwater outfall monitoring is that sites are representative of the range of land uses in the WMAs. The drainages within the EWMP Group’s WMA are comprised primarily of residential, commercial, and industrial land uses, with minimal percentages of agriculture and undeveloped open space. The six proposed outfalls were selected specifically to characterize runoff from drainages that are representative of the mix of these primary land uses in the WMAs, and to minimize contributions from other land uses. Land use summaries for the RH/SGRWQG are listed in Table D-1.
- 107 -
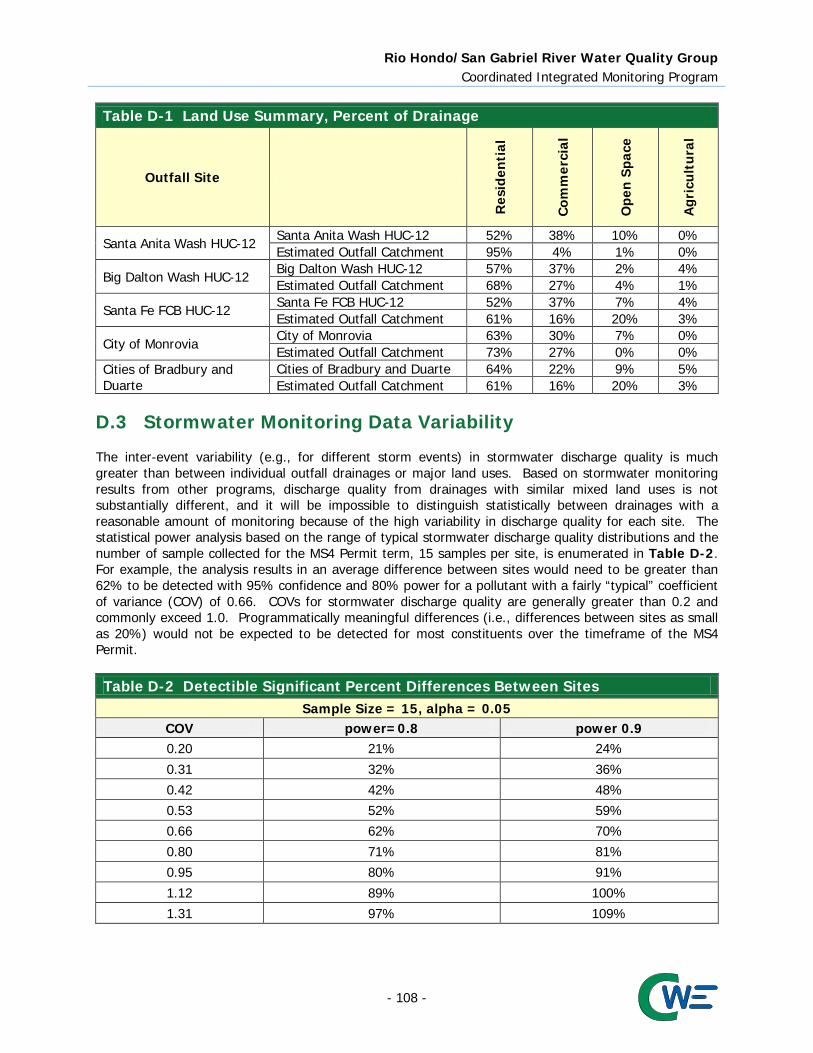
Rio Hondo/San Gabriel River Water Quality Group Coordinated Integrated Monitoring Program
Table D-1 Land Use Summary, Percent of Drainage
Outfall Site
Res
iden
tial
Com
mer
cial
Ope
n S
pace
Agr
icul
tura
l
Santa Anita Wash HUC-12 Santa Anita Wash HUC-12 52% 38% 10% 0% Estimated Outfall Catchment 95% 4% 1% 0%
Big Dalton Wash HUC-12 Big Dalton Wash HUC-12 57% 37% 2% 4% Estimated Outfall Catchment 68% 27% 4% 1%
Santa Fe FCB HUC-12 Santa Fe FCB HUC-12 52% 37% 7% 4% Estimated Outfall Catchment 61% 16% 20% 3%
City of Monrovia City of Monrovia 63% 30% 7% 0% Estimated Outfall Catchment 73% 27% 0% 0%
Cities of Bradbury and Duarte
Cities of Bradbury and Duarte 64% 22% 9% 5% Estimated Outfall Catchment 61% 16% 20% 3%
D.3 Stormwater Monitoring Data Variability The inter-event variability (e.g., for different storm events) in stormwater discharge quality is much greater than between individual outfall drainages or major land uses. Based on stormwater monitoring results from other programs, discharge quality from drainages with similar mixed land uses is not substantially different, and it will be impossible to distinguish statistically between drainages with a reasonable amount of monitoring because of the high variability in discharge quality for each site. The statistical power analysis based on the range of typical stormwater discharge quality distributions and the number of sample collected for the MS4 Permit term, 15 samples per site, is enumerated in Table D-2. For example, the analysis results in an average difference between sites would need to be greater than 62% to be detected with 95% confidence and 80% power for a pollutant with a fairly “typical” coefficient of variance (COV) of 0.66. COVs for stormwater discharge quality are generally greater than 0.2 and commonly exceed 1.0. Programmatically meaningful differences (i.e., differences between sites as small as 20%) would not be expected to be detected for most constituents over the timeframe of the MS4 Permit.
Table D-2 Detectible Significant Percent Differences Between Sites
Sample Size = 15, alpha = 0.05 COV power=0.8 power 0.9 0.20 21% 24%
0.31 32% 36% 0.42 42% 48% 0.53 52% 59% 0.66 62% 70% 0.80 71% 81% 0.95 80% 91%
1.12 89% 100% 1.31 97% 109%
- 108 -
Rio Hondo/San Gabriel River Water Quality Group Coordinated Integrated Monitoring Program
Given the high variability typical of stormwater pollutant levels, and with only a few storm events that can be collected per year, it will not be possible to make meaningful distinctions between drainages, either within land use types, across land use types, or between jurisdictions. Management implementation by the Permittees is also expected to be relatively consistent throughout the WMAs, so additional focus on geographic differences is not necessary. This means that only a handful of sites are needed to adequately characterize residential land use discharge quality within the WMA. Consequently, sampling more than a few representative sites is unlikely to significantly improve characterization of runoff quality, or to better inform the EWMP Groups’ management decisions. Realistically achievable changes in stormwater runoff quality or loads (e.g., 20–50% reductions) are statistically demonstrable only over relatively long periods of time (≥10 years). This is also due to the high variability between events and the relatively low number of events that can be sampled each season, and additional monitoring sites will do little to improve the statistical power of such trend analysis within the MS4 Permit timeframe compared to longer periods of evaluation. This also supports the need to assess management effectiveness and compliance based primarily on successful implementation actions rather than explicit demonstration of improvements in runoff quality.
D.4 Recommendation for Stormwater Outfall Site Selection Based on the evaluations above, the EWMP Group’s proposed CIMP approach to monitor one outfall for each HUC-12 in the WMA will provide the representative data needed to meet the specific MS4 Permit objectives for stormwater outfall monitoring and support management decisions of the EWMP Group. Additional monitoring sites within four HUC-12s will not provide significant improvements in representation or characterization of discharge quality, or additional information for discharge quality management.
- 109 -

Rio Hondo/San Gabriel River Water Quality Group Coordinated Integrated Monitoring Program
Attachment E
Analytical and Monitoring Procedures
- 110 -

Rio Hondo/San Gabriel River Water Quality Group Coordinated Integrated Monitoring Program
Attachment E details the monitoring procedures that will be utilized to collect and analyze samples to meet the goals and objectives of the CIMP and the MS4 Permit. The details contained herein serve as a guide for ensuring that consistent protocols and procedures are in place for successful sample collection and analysis. The attachment is divided into the following sections:
1. Analytical Procedures 2. Sampling Methods and Sample Handling 3. Quality Assurance/Quality Control 4. Instrument/Equipment Calibration and Frequency 5. Data Management, Validation and Usability
E.1 Analytical Procedures E.1.1 Field Parameters Portable field meters will measure within specifications outlined in Table E-1.
Table E-1 Analytical Methods and Project Reporting Limits for Field Measurements Parameter/Constituent Method Range Project RL
Current velocity Electromagnetic -0.5 to +20 ft/s 0.05 ft/s pH Electrometric 0 – 14 pH units NA Temperature High stability thermistor -5 – 50 oC NA Dissolved oxygen Membrane 0 – 50 mg/L 0.5 mg/L Turbidity Nephelometric 0 – 3000 NTU 0.2 NTU Conductivity Graphite electrodes 0 – 10 mmhos/cm 2.5 umhos/cm
E.1.2 Methods and Detection and Reporting Limits Method detection limits (MDL) and reporting limits (RLs) must be distinguished for proper understanding and data use. The MDL is the minimum analyte concentration that can be measured and reported with a 99% confidence that the concentration is greater than zero. The RL represents the concentration of an analyte that can be routinely measured in the sampled matrix within stated limits and with confidence in both identification and quantitation. For this CIMP, RLs must be verifiable by having the lowest non-zero calibration standard or calibration check sample concentration at or less than the RL. RLs have been established in this CIMP based on the verifiable levels and general measurement capabilities demonstrated for each method. These RLs should be considered as maximum allowable RLs to be used for laboratory data reporting. Note that samples diluted for analysis may have sample-specific RLs that exceed these RLs. This will be unavoidable on occasion. However, if samples are consistently diluted to overcome matrix interferences, the analytical laboratory will be required to notify the RH/SGRWQG regarding how the sample preparation or test procedure in question will be modified to reduce matrix interferences so that project RLs can be met consistently. Analytical methods, MDLs, and RLs required for samples analyzed in the laboratory are summarized in Table E-2, Table E-3, and Table E-4 for analysis in water, sediment, and tissue, respectively. For organic constituents, environmentally relevant detection limits will be used to the extent practicable. The RLs listed in Table E-2 are consistent with the requirements of the available minimum levels provided in the MRP, except for total dissolved solids, which was set equal to the minimum level identified in the California State Water Resources Control Board’s Surface Water Ambient Monitoring Program’s (SWAMP)
- 111 -

Rio Hondo/San Gabriel River Water Quality Group Coordinated Integrated Monitoring Program
Quality Assurance Project Plan. Alternative methods with RLs that are at or below those presented in Table E-2, Table E-3, and Table E-4 are considered equivalent and can be used in place of the methods presented in Table E-2, Table E-3, and Table E-4. Prior to the analysis of any environmental samples, the laboratory must have demonstrated the ability to meet the minimum performance requirements for each analytical method presented in Table E-2, Table E-3, and Table E-4. The initial demonstration of capability includes the ability to meet the project-specified Method Detection Limits and Reporting Limits, the ability to generate acceptable precision and accuracy, and other analytical and quality control constituents documented in this CIMP. Data quality objectives for precision and accuracy are summarized in Table E-5. Table E-2 Analytical Methods and Reporting Limits (RLs) for Laboratory Analysis
of Water Samples
Parameter/Constituent Method1 Units Project RL
MRP Table E-2 ML
Toxicity
Pimephales promelas EPA-821-R-02-013 (1000.0) and EPA-821-R-02-012 (2000.0)
NA NA NA
Ceriodaphnia dubia EPA-821-R-02-013 (1002.0) and EPA-821-R-02-012 (2002.0)
NA NA NA
Selenastrum capricornutum EPA-821-R-02-013 (1003.0) NA NA NA
Bacteria Escherichia coli SM 9221 MPN/100mL 10 235 Conventionals Oil and Grease EPA 1664A mg/L 5 5 Cyanide SM 4500-CN E mg/L 0.005 0.005
pH SM 4500 H+B/ EPA 9040/ EPA 9045D NA NA 0-14
Dissolved Oxygen NA mg/L 0.5 Sensitivity to 5 mg/L
Specific Conductance EPA 120.1 µs/cm 1 1 Turbidity EPA 180.1 NTU 0.1 0.1 Total Hardness SM 2340C mg/L 2 2 Dissolved Organic Carbon SM 5310B mg/L 0.6 NA Total Organic Carbon SM 5310B mg/L 1 1 Total Petroleum Hydrocarbon EPA 1664 mg/L 5 5 Biochemical Oxygen Demand SMOL-5210 mg/L 5 2 Chemical Oxygen Demand SM 5220D mg/L 20 20-900 MBAS SM 5540C mg/L 0.5 0.5 Chloride EPA 300.0 mg/L 1 2 Fluoride EPA 300.0 mg/L 0.1 0.1 Sulfate EPA 375.4 mg/L 1 NA Perchlorate EPA 314.0 µg/L 4 4 Chlorophyll a SM 10200 H mg/L 0.01 NA Dissolved Phosphorus SM 4500-P E mg/L 0.05 0.05
- 112 -

Rio Hondo/San Gabriel River Water Quality Group Coordinated Integrated Monitoring Program
Table E-2 Analytical Methods and Reporting Limits (RLs) for Laboratory Analysis
of Water Samples
Parameter/Constituent Method1 Units Project RL
MRP Table E-2 ML
Total Phosphorus SM 4500-P E mg/L 0.05 0.05 Orthophosphate-P EPA 300.0 mg/L 0.2 NA Ammonia (as N) SM 4500-NH3 C mg/L 0.1 0.1 Nitrate + Nitrite (as N) EPA 300.0 mg/L 0.1 0.1 Nitrate (as N) EPA 300.0 mg/L 0.1 0.1 Nitrite (as N) EPA 300.0 mg/L 0.1 0.1 Total Kjehdahl Nitrogen (TKN) SM 4500-NH3 C mg/L 0.1 0.1
Total Alkalinity SM 2320B mg/L 2 2 Solids Suspended Sediment Concentration (SSC) ASTMD 3977-97 mg/L 3 NA
Total Suspended Solids (TSS) SM 2540D mg/L 2 2 Total Dissolved Solids (TDS) SM 2540C mg/L 10 2 Volatile Suspended Solids EPA 1684 mg/L 1 2 Metals in Freshwater (dissolved and total) Aluminum EPA 200.8 µg/L 100 100 Antimony EPA 200.8 µg/L 0.5 0.5 Arsenic EPA 200.8 µg/L 1 1 Beryllium EPA 200.8 µg/L 0.5 0.5 Cadmium EPA 200.8 µg/L 0.25 0.25 Chromium (total) EPA 200.8 µg/L 0.5 0.5 Chromium (Hexavalent) EPA 200.8 µg/L 5 5 Copper EPA 200.8 µg/L 0.5 0.5 Iron EPA 200.8 µg/L 100 100 Lead EPA 200.8 µg/L 0.5 0.5 Mercury EPA 1631 µg/L 0.5 0.5 Nickel EPA 200.8 µg/L 1 1 Selenium EPA 200.8 µg/L 1 1 Silver EPA 200.8 µg/L 0.25 0.25 Thallium EPA 200.8 µg/L 1 1 Zinc EPA 200.8 µg/L 1 1 Organochlorine Pesticides Aldrin EPA 608 ng/L 5 5 alpha-BHC EPA 608 ng/L 10 10 beta-BHC EPA 608 ng/L 5 5 delta-BHC EPA 608 ng/L 5 5 gamma-BHC (Lindane) EPA 608 ng/L 20 20 Chlordane-alpha EPA 608 ng/L 100 100 Chlordane-gamma EPA 608 ng/L 100 100 Oxychlordane EPA 608 ng/L 200 NA
- 113 -

Rio Hondo/San Gabriel River Water Quality Group Coordinated Integrated Monitoring Program
Table E-2 Analytical Methods and Reporting Limits (RLs) for Laboratory Analysis
of Water Samples
Parameter/Constituent Method1 Units Project RL
MRP Table E-2 ML
Cis-nonachlor EPA 608 ng/L 200 NA Trans-nonachlor EPA 608 ng/L 200 NA 2,4'-DDD EPA 625/ 8270C ng/L 2 NA 2,4'-DDE EPA 625/ 8270C ng/L 2 NA 2,4'-DDT EPA 625/ 8270C ng/L 2 NA 4,4’-DDD EPA 625/ 8270C ng/L 50 50 4,4’-DDE EPA 625/ 8270C ng/L 50 50 4,4’-DDT EPA 625/ 8270C ng/L 10 10 Dieldrin EPA 608 ng/L 10 10 Endosulfan I EPA 608 ng/L 20 20 Endosulfan II EPA 608 ng/L 10 10 Endosulfan Sulfate EPA 608 ng/L 50 50 Endrin EPA 608 ng/L 10 10 Endrin Aldehyde EPA 608 ng/L 10 10 Heptachlor EPA 608 ng/L 10 10 Heptachlor Epoxide EPA 608 ng/L 10 10 Toxaphene EPA 608 ng/L 500 500 PCBs Congeners2 EPA 625/ 8270C ng/L 2 NA Aroclors (1016, 1221, 1232, 1242, 1248, 1254, 1260) EPA 608/625/ 8270C ng/L 500 500
Organophosphorus Pesticides Chlorpyrifos EPA 614 ng/L 50 50 Diazinon EPA 614 ng/L 10 10 Malathion EPA 614 ng/L 1000 1000 Triazine Atrazine EPA 530 µg/L 2 2 Cyanazine EPA 530 µg/L 2 2 Prometryn EPA 530 µg/L 2 2 Simazine EPA 530 µg/L 2 2 Diox ins 2,3,7,8-TCDD EPA 1613 ng/L 0.005 NA 1,2,3,7,8-PeCDD EPA 1613 ng/L 0.025 NA 1,2,3,7,8-PeCDF EPA 1613 ng/L 0.025 NA 2,3,4,7,8-PeCDF EPA 1613 ng/L 0.025 NA 1,2,3,4,7,8-HxCDD EPA 1613 ng/L 0.025 NA 1,2,3,6,7,8-HxCDD EPA 1613 ng/L 0.025 NA 1,2,3,7,8,9-HxCDD EPA 1613 ng/L 0.025 NA 1,2,3,4,7,8-HxCDF EPA 1613 ng/L 0.025 NA 1,2,3,6,7,8-HxCDF EPA 1613 ng/L 0.025 NA
- 114 -

Rio Hondo/San Gabriel River Water Quality Group Coordinated Integrated Monitoring Program
Table E-2 Analytical Methods and Reporting Limits (RLs) for Laboratory Analysis
of Water Samples
Parameter/Constituent Method1 Units Project RL
MRP Table E-2 ML
1,2,3,7,8,9-HxCDF EPA 1613 ng/L 0.025 NA 2,3,4,6,7,8-HxCDF EPA 1613 ng/L 0.025 NA 1,2,3,4,6,7,8-HpCDD EPA 1613 ng/L 0.025 NA 1,2,3,4,6,7,8-HpCDF EPA 1613 ng/L 0.025 NA 1,2,3,4,7,8,9-HpCDF EPA 1613 ng/L 0.025 NA OCDD EPA 1613 ng/L 0.025 NA OCDF EPA 1613 ng/L 0.050 NA Herbicides 2,4-D EPA 8151A µg/L 10 10 Glyphosate EPA 547 µg/L 5 5 2,4,5-TP-SILVEX EPA 8151A µg/L 0.5 0.5 Semivolati le Organic Compounds (SVOCs) 1,2-Diphenylhydrazine EPA 625 µg/L 1 1 2,4,6-Trichlorophenol EPA 625 µg/L 10 10 2,4-Dichlorophenol EPA 625 µg/L 1 1 2,4-Dimethylphenol EPA 625 µg/L 2 2 2,4-Dinitrophenol EPA 625 µg/L 5 5 2,4-Dinitrotoluene EPA 625 µg/L 5 5 2,6-Dinitrotoluene EPA 625 µg/L 5 5 2-Chloronaphthalene EPA 625 µg/L 10 10 2-Chlorophenol EPA 625 µg/L 2 2 2-Methyl-4,6-dinitrophenol EPA 625 µg/L 5 5 2-Nitrophenol EPA 625 µg/L 10 10 3,3'-Dichlorobenzidine EPA 625 µg/L 5 5 4-Bromophenyl phenyl ether EPA 625 µg/L 5 5 4-Chloro-3-methylphenol EPA 625 µg/L 1 1 4-Chlorophenyl phenyl ether EPA 625 µg/L 5 5 4-Nitrophenol EPA 625 µg/L 5 5 Acenaphthene EPA 625 µg/L 1 1 Acenaphthylene EPA 625 µg/L 2 2 Anthracene EPA 625 µg/L 2 2 Benzidine EPA 625 µg/L 5 5 Benzo(a)anthracene EPA 625 µg/L 5 5 Benzo(a)pyrene EPA 625 µg/L 2 2 Benzo(b)fluoranthene EPA 625 µg/L 10 10 Benzo(g,h,i)perylene EPA 625 µg/L 5 5 Benzo(k)fluoranthene EPA 625 µg/L 2 2 Benzyl butyl phthalate EPA 625 µg/L 10 10 bis(2-Chloroethoxy) methane EPA 625 µg/L 5 5 bis(2-Chloroisopropyl) ether EPA 625 µg/L 2 2
- 115 -

Rio Hondo/San Gabriel River Water Quality Group Coordinated Integrated Monitoring Program
Table E-2 Analytical Methods and Reporting Limits (RLs) for Laboratory Analysis
of Water Samples
Parameter/Constituent Method1 Units Project RL
MRP Table E-2 ML
bis(2-Chloroethyl) ether EPA 625 µg/L 1 1 bis(2-Ethylhexyl) phthalate EPA 625 µg/L 5 5 Chrysene EPA 625 µg/L 5 5 Dibenzo(a,h)anthracene EPA 625 µg/L 0.1 0.1 Diethyl phthalate EPA 625 µg/L 2 2 Dimethyl phthalate EPA 625 µg/L 2 2 Di-n-butylphthalate EPA 625 µg/L 10 10 Di-n-octylphthalate EPA 625 µg/L 10 10 Fluoranthene EPA 625 µg/L 0.05 0.05 Fluorene EPA 625 µg/L 0.1 0.1 Hexachlorobenzene EPA 625 µg/L 1 1 Hexachlorobutadiene EPA 625 µg/L 1 1 Hexachloro-cyclo pentadiene EPA 625 µg/L 5 5 Hexachloroethane EPA 625 µg/L 1 1 Indeno(1,2,3-cd)pyrene EPA 625 µg/L 0.05 0.05 Isophorone EPA 625 µg/L 1 1 Naphthalene EPA 625 µg/L 0.2 0.2 Nitrobenzene EPA 625 µg/L 1 1 N-Nitroso-dimethyl amine EPA 625 µg/L 5 5 N-Nitrosodiphenylamine EPA 625 µg/L 1 1 N-Nitroso-di-n-propyl amine EPA 625 µg/L 5 5 Pentachlorophenol EPA 625 µg/L 2 2 Phenanthrene EPA 625 µg/L 0.05 0.05 Total Phenols EPA 625 mg/L 0.2 0.1 Phenol EPA 625 µg/L 1 1 Pyrene EPA 625 µg/L 0.05 0.05 Volati le Organic Compounds 1,2,4-Trichlorobenzene EPA 625 µg/L 1 1 1,2-Dichlorobenzene EPA 625 µg/L 1 1 1,3-Dichlorobenzene EPA 625 µg/L 1 1 1,4-Dichlorobenzene EPA 625 µg/L 1 1 2-Chloroethyl vinyl ether EPA 625 µg/L 1 1 Methyl tert-butyl ether (MTBE) EPA 625 µg/L 1 1
RL – Reporting Limit NA – Not applicable 1 Methods may be substituted by an equivalent method that is lower than or meets the project RL. 2 To allow comparison of potential source and effect all congeners across each matrix is analyzed. Analysis for
PCB congeners includes the following constituents: PCB-8, 18, 28, 31, 33, 37, 44, 49, 52, 56, 60, 66, 70, 74, 77, 81, 87, 95, 97, 99, 101, 105, 110, 114, 118, 119, 123, 126, 128, 132, 138, 141, 149, 151, 153, 156, 157, 158, 167, 168, 169, 170, 174, 177, 180, 183, 187, 189, 194, 195, 201, 203, 206, and 209.
- 116 -

Rio Hondo/San Gabriel River Water Quality Group Coordinated Integrated Monitoring Program
Table E-3 Analytical Methods and Reporting Limits (RLs) for Laboratory Analysis
of Sediment Parameter/Constituent Method1 Units Project RL
General Parameters % Solids EPA 1684 % NA Total Organic Carbon (TOC) SM5310B % Dry Weight 0.05 Chlordane Compounds alpha-Chlordane USEPA 8081A/8270C ng/dry g 0.5 gamma-Chlordane USEPA 8081A/8270C ng/dry g 0.5 Oxychlordane USEPA 8081A/8270C ng/dry g 0.5 trans-Nonachlor USEPA 8081A/8270C ng/dry g 0.5 cis-Nonachlor USEPA 8081A/8270C ng/dry g 0.5 Other OC Pesticides 2,4'-DDD USEPA 8081A/8270C ng/dry g 0.5 2,4'-DDE USEPA 8081A/8270C ng/dry g 0.5 2,4'-DDT USEPA 8081A/8270C ng/dry g 0.5 4,4'-DDD USEPA 8081A/8270C ng/dry g 0.5 4,4'-DDE USEPA 8081A/8270C ng/dry g 0.5 4,4'-DDT USEPA 8081A/8270C ng/dry g 0.5 Total DDT USEPA 8081A/8270C ng/dry g NA Dieldrin USEPA 8081A/8270C ng/dry g 0.02 PAHs 1-Methylnaphthalene USEPA 8270C/8270D - SIM ng/dry g 20 1-Methylphenanthrene USEPA 8270C/8270D - SIM ng/dry g 20 2-Methylnaphthalene USEPA 8270C/8270D - SIM ng/dry g 20 2,6-Dimethylnaphthalene USEPA 8270C/8270D - SIM ng/dry g 20 Acenaphthene USEPA 8270C/8270D - SIM ng/dry g 20 Anthracene USEPA 8270C/8270D - SIM ng/dry g 20 Benzo(a)anthracene USEPA 8270C/8270D - SIM ng/dry g 20 Benzo(a)pyrene USEPA 8270C/8270D - SIM ng/dry g 20 Benzo(e)pyrene USEPA 8270C/8270D - SIM ng/dry g 20 Biphenyl USEPA 8270C/8270D - SIM ng/dry g 20 Chrysene USEPA 8270C/8270D - SIM ng/dry g 20 Dibenz(a,h)anthracene USEPA 8270C/8270D - SIM ng/dry g 20 Fluoranthene USEPA 8270C/8270D - SIM ng/dry g 20 Fluorene USEPA 8270C/8270D - SIM ng/dry g 20 Naphthalene USEPA 8270C/8270D - SIM ng/dry g 20 Perylene USEPA 8270C/8270D - SIM ng/dry g 20 Phenanthrene USEPA 8270C/8270D - SIM ng/dry g 20 Pyrene USEPA 8270C/8270D - SIM ng/dry g 20 Total PCBs2 USEPA 8270C/8270D-SIM ng/dry g 0.2 Metals Cadmium EPA 6020 µg/dry g 0.05 Copper EPA 6020 µg/dry g 0.05
- 117 -

Rio Hondo/San Gabriel River Water Quality Group Coordinated Integrated Monitoring Program
Table E-3 Analytical Methods and Reporting Limits (RLs) for Laboratory Analysis
of Sediment Parameter/Constituent Method1 Units Project RL
Lead EPA 6020 µg/dry g 0.05 Silver EPA 6020 µg/dry g 0.05 Zinc EPA 6020 µg/dry g 0.05 RL – Reporting Limit NA – Not applicable 1 Methods may be substituted by an equivalent method that is lower than or meets the project RL. 2 To allow comparison of potential source and effect all congeners across each matrix is analyzed. Analysis for
PCBs includes the following constituents: PCB-8, 18, 28, 31, 33, 37, 44, 49, 52, 56, 60, 66, 70, 74, 77, 81, 87, 95, 97, 99, 101, 105, 110, 114, 118, 119, 123, 126, 128, 132, 138, 141, 149, 151, 153, 156, 157, 158, 167, 168, 169, 170, 174, 177, 180, 183, 187, 189, 194, 195, 201, 203, 206, and 209.
Table E-4 Analytical Methods and Reporting Limits (RLs) for Laboratory Analysis
of Tissue Parameter/Constituent Method1 Units Project RL
Chlordane2 EPA 8270C ng/dry g 5 Dieldrin EPA 8270C ng/dry g 5 PCBs(3) EPA 8270C ng/dry g 5 RL – Reporting Limit NA – Not applicable 1 Methods may be substituted by an equivalent method that is lower than or meets the project RL. 2 Analysis for chlordane includes the following constituents: alpha-chlordane, gamma-chlordane, oxychlordane,
cis-Nonachlor, and trans-Nonachlor. 3 To allow comparison of potential source and effect all congeners across each matrix is analyzed. Analysis for
PCBs includes the following constituents: PCB-8, 18, 28, 31, 33, 37, 44, 49, 52, 56, 60, 66, 70, 74, 77, 81, 87, 95, 97, 99, 101, 105, 110, 114, 118, 119, 123, 126, 128, 132, 138, 141, 149, 151, 153, 156, 157, 158, 167, 168, 169, 170, 174, 177, 180, 183, 187, 189, 194, 195, 201, 203, 206, and 209.
- 118 -
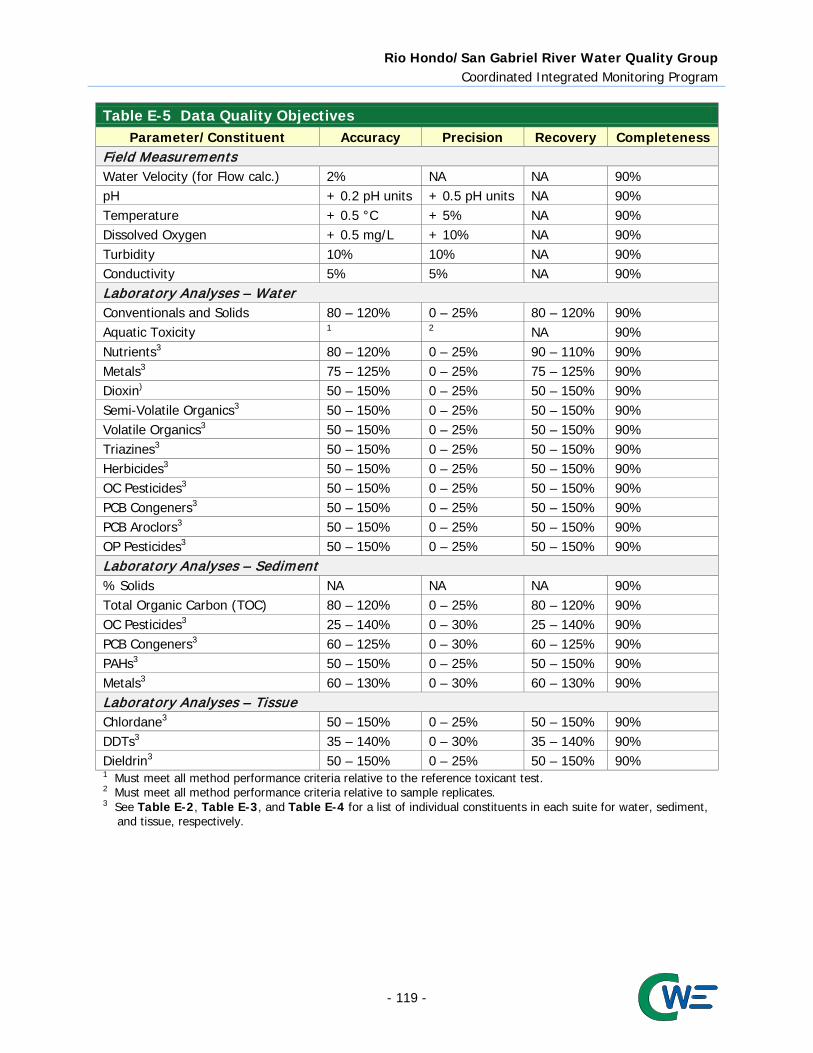
Rio Hondo/San Gabriel River Water Quality Group Coordinated Integrated Monitoring Program
Table E-5 Data Quality Objectives Parameter/Constituent Accuracy Precision Recovery Completeness
Field Measurements Water Velocity (for Flow calc.) 2% NA NA 90% pH + 0.2 pH units + 0.5 pH units NA 90% Temperature + 0.5 °C + 5% NA 90% Dissolved Oxygen + 0.5 mg/L + 10% NA 90% Turbidity 10% 10% NA 90% Conductivity 5% 5% NA 90% Laboratory Analyses – Water Conventionals and Solids 80 – 120% 0 – 25% 80 – 120% 90% Aquatic Toxicity 1 2 NA 90% Nutrients3 80 – 120% 0 – 25% 90 – 110% 90% Metals3 75 – 125% 0 – 25% 75 – 125% 90% Dioxin) 50 – 150% 0 – 25% 50 – 150% 90% Semi-Volatile Organics3 50 – 150% 0 – 25% 50 – 150% 90% Volatile Organics3 50 – 150% 0 – 25% 50 – 150% 90% Triazines3 50 – 150% 0 – 25% 50 – 150% 90% Herbicides3 50 – 150% 0 – 25% 50 – 150% 90% OC Pesticides3 50 – 150% 0 – 25% 50 – 150% 90% PCB Congeners3 50 – 150% 0 – 25% 50 – 150% 90% PCB Aroclors3 50 – 150% 0 – 25% 50 – 150% 90% OP Pesticides3 50 – 150% 0 – 25% 50 – 150% 90% Laboratory Analyses – Sediment % Solids NA NA NA 90% Total Organic Carbon (TOC) 80 – 120% 0 – 25% 80 – 120% 90% OC Pesticides3 25 – 140% 0 – 30% 25 – 140% 90% PCB Congeners3 60 – 125% 0 – 30% 60 – 125% 90% PAHs3 50 – 150% 0 – 25% 50 – 150% 90% Metals3 60 – 130% 0 – 30% 60 – 130% 90% Laboratory Analyses – Tissue Chlordane3 50 – 150% 0 – 25% 50 – 150% 90% DDTs3 35 – 140% 0 – 30% 35 – 140% 90% Dieldrin3 50 – 150% 0 – 25% 50 – 150% 90% 1 Must meet all method performance criteria relative to the reference toxicant test. 2 Must meet all method performance criteria relative to sample replicates. 3 See Table E-2, Table E-3, and Table E-4 for a list of individual constituents in each suite for water, sediment,
and tissue, respectively.
- 119 -
Rio Hondo/San Gabriel River Water Quality Group Coordinated Integrated Monitoring Program
E.1.2.1 Method Detection Limit Studies Any laboratory performing analyses under this program must routinely conduct MDL studies to document that the MDLs are less than or equal to the project-specified RLs. If any analytes have MDLs that do not meet the project RLs, the following steps must be taken:
Perform a new MDL study using concentrations sufficient to prove analyte quantitation at concentrations less than or equal to the project-specified RLs per the procedure for the Determination of the Method Detection Limit presented in Revision 1.1, 40 Code of Federal Regulations (CFR) 136, 1984.
No samples may be analyzed until the issue has been resolved. MDL study results must be available for review during audits, data review, or as requested. Current MDL study results must be reported for review and inclusion in project files.
An MDL is developed from seven aliquots of a standard containing all analytes of interest spiked at five times the expected MDL. These aliquots are processed and analyzed in the same manner as environmental samples. The results are then used to calculate the MDL. If the calculated MDL is less than 0.33 times the spiked concentration, another MDL study should be performed using lower spiked concentrations. E.1.2.2 Project Reporting Limits Laboratories generally establish RLs that are reported with the analytical results—these may be called reporting limits, detection limits, reporting detection limits, or several other terms used by the reporting laboratory. These laboratory limits must be less than or equal to the project RLs listed in Table E-2. Wherever possible, project RLs are lower than the relevant numeric criteria or toxicity thresholds. Laboratories performing analyses for this project must have documentation to support quantitation at the required levels. E.1.2.3 Laboratory Standards and Reagents All stock standards and reagents used for standard solutions and extractions must be tracked through the laboratory. The preparation and use of all working standards must be documented according to procedures outlined in each laboratory’s Quality Assurance (QA) Manual; standards must be traceable according to USEPA, A2LA or National Institute for Standards and Technology (NIST) criteria. Records must have sufficient detail to allow determination of the identity, concentration, and viability of the standards, including any dilutions performed to obtain the working standard. Date of preparation, analyte or mixture, concentration, name of preparer, lot or cylinder number, and expiration date, if applicable, must be recorded on each working standard. E.1.3 Sample Containers, Storage, Preservation, and Holding Times Sample containers must be pre-cleaned and certified free of contamination according to the USEPA specification for the appropriate methods. Sample container, storage and preservation, and holding time requirements are provided in Table E-6. The analytical laboratories will supply sample containers that already contain preservative as listed in Table E-6, including ultra-pure hydrochloric and nitric acid, where applicable. After collection, samples will be stored at 4°C until arrival at the contract laboratory.
- 120 -
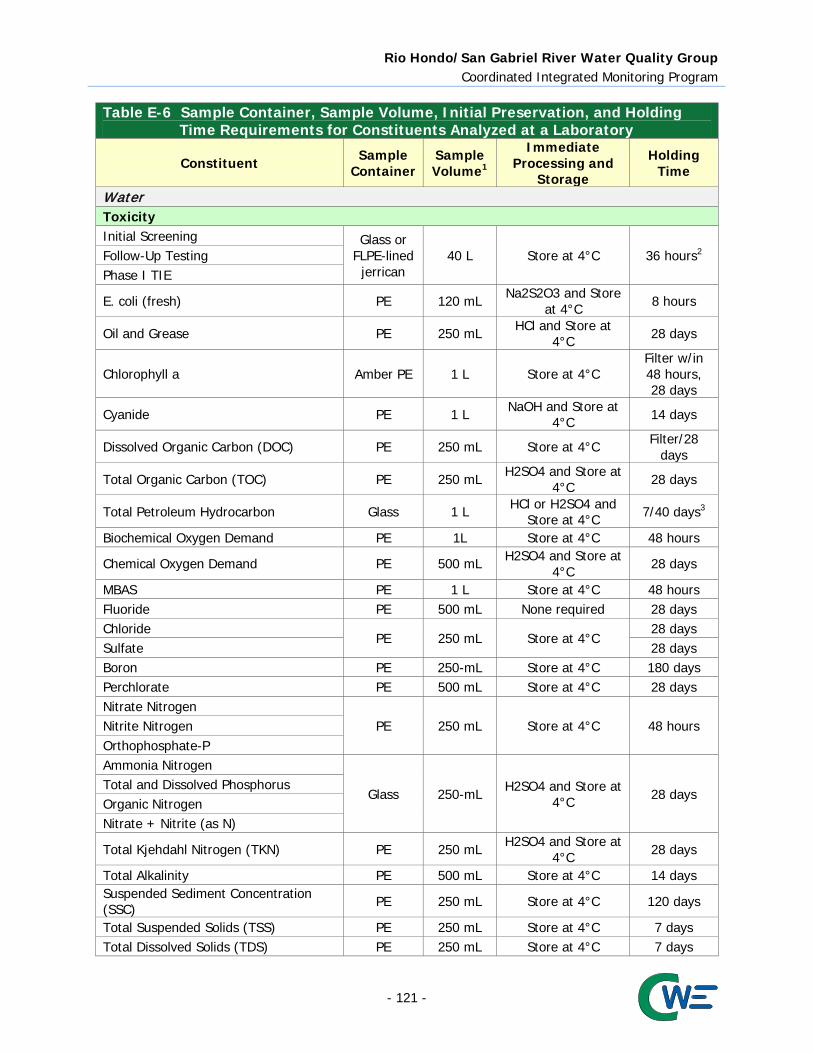
Rio Hondo/San Gabriel River Water Quality Group Coordinated Integrated Monitoring Program
Table E-6 Sample Container, Sample Volume, Initial Preservation, and Holding
Time Requirements for Constituents Analyzed at a Laboratory
Constituent Sample Container
Sample Volume1
Immediate Processing and
Storage
Holding Time
Water Toxicity Initial Screening Glass or
FLPE-lined jerrican
40 L Store at 4°C 36 hours2 Follow-Up Testing Phase I TIE
E. coli (fresh) PE 120 mL Na2S2O3 and Store at 4°C 8 hours
Oil and Grease PE 250 mL HCl and Store at 4°C 28 days
Chlorophyll a Amber PE 1 L Store at 4°C Filter w/in 48 hours, 28 days
Cyanide PE 1 L NaOH and Store at 4°C 14 days
Dissolved Organic Carbon (DOC) PE 250 mL Store at 4°C Filter/28 days
Total Organic Carbon (TOC) PE 250 mL H2SO4 and Store at 4°C 28 days
Total Petroleum Hydrocarbon Glass 1 L HCl or H2SO4 and Store at 4°C 7/40 days3
Biochemical Oxygen Demand PE 1L Store at 4°C 48 hours
Chemical Oxygen Demand PE 500 mL H2SO4 and Store at 4°C 28 days
MBAS PE 1 L Store at 4°C 48 hours Fluoride PE 500 mL None required 28 days Chloride
PE 250 mL Store at 4°C 28 days
Sulfate 28 days Boron PE 250-mL Store at 4°C 180 days Perchlorate PE 500 mL Store at 4°C 28 days Nitrate Nitrogen
PE 250 mL Store at 4°C 48 hours Nitrite Nitrogen Orthophosphate-P Ammonia Nitrogen
Glass 250-mL H2SO4 and Store at 4°C 28 days
Total and Dissolved Phosphorus Organic Nitrogen Nitrate + Nitrite (as N)
Total Kjehdahl Nitrogen (TKN) PE 250 mL H2SO4 and Store at 4°C 28 days
Total Alkalinity PE 500 mL Store at 4°C 14 days Suspended Sediment Concentration (SSC) PE 250 mL Store at 4°C 120 days
Total Suspended Solids (TSS) PE 250 mL Store at 4°C 7 days Total Dissolved Solids (TDS) PE 250 mL Store at 4°C 7 days
- 121 -

Rio Hondo/San Gabriel River Water Quality Group Coordinated Integrated Monitoring Program
Table E-6 Sample Container, Sample Volume, Initial Preservation, and Holding
Time Requirements for Constituents Analyzed at a Laboratory
Constituent Sample Container
Sample Volume1
Immediate Processing and
Storage
Holding Time
Volatile Suspended Solids PE 250 mL Store at 4°C 7 days Hardness
PE 500 mL Store at 4°C 180 days
Metals 6 months4 Mercury Glass 500 mL Store at 4°C 48 Hours
Dioxin Amber glass 2 x 1 L Store at 4°C 1 year
PCBs, OC Pesticides, OP Pesticides, Triazine Pesticides
Amber glass 4 x 1 L Store at 4°C 7/40 days3
Suspended Solids Analysis for Organics and Metals
Amber glass 20 x 1 L Store at 4°C 1 year5
Herbicides Glass 2 x 40 mL Thiosulfate and Store at 4°C 14 days
Semivolatile Organic Compounds Glass 2 x 1 L Store at 4°C 7 days
Volatile Organic Compounds VOA 3 x 40 mL HCl and Store at 4°C 14 days
Sediment % Solids
Glass 2 x 8 oz jar Store at 4°C
7 days Total Organic Carbon (TOC) 1 year6 OC Pesticides, PCBs, PAHs
1 year5 Metals Tissue % Lipids
teflon sheet 200 g Store on dry ice 1 year5
Chlordane DDTs Dieldrin PE – Polyethylene 1 Additional volume may be required for QC analyses. 2 Tests should be initiated within 36 hours of collection. The 36-hour hold time does not apply to subsequent
analyses for TIEs. For interpretation of toxicity results, samples may be split from toxicity samples in the laboratory and analyzed for specific chemical constituents. All other sampling requirements for these samples are as specified in this document for the specific analytical method. Results of these analyses are not for any other use (e.g., characterization of ambient conditions) because of potential holding time exceedances and variance from sampling requirements.
3 7/40 = 7 days to extract and 40 days from extraction to analysis. 4 6 months after preservation. 5 One year if frozen, otherwise 14 days to extract and 40 days from extraction to analysis. 6 One year if frozen, otherwise 28 days.
E.1.4 Aquatic Toxicity Testing and Toxicity Identification Evaluations Aquatic toxicity testing at long term characterization sites supports the identification of BMPs that eliminate urban runoff sources of toxicity or removes them to the maximum extent practicable. The RH/SGRWQG will evaluate aquatic toxicity samples according to the approach described in the following sections. Control measures and management actions to address confirmed toxicity caused by urban runoff are discussed in the Adaptive Management section of the EWMP.
- 122 -
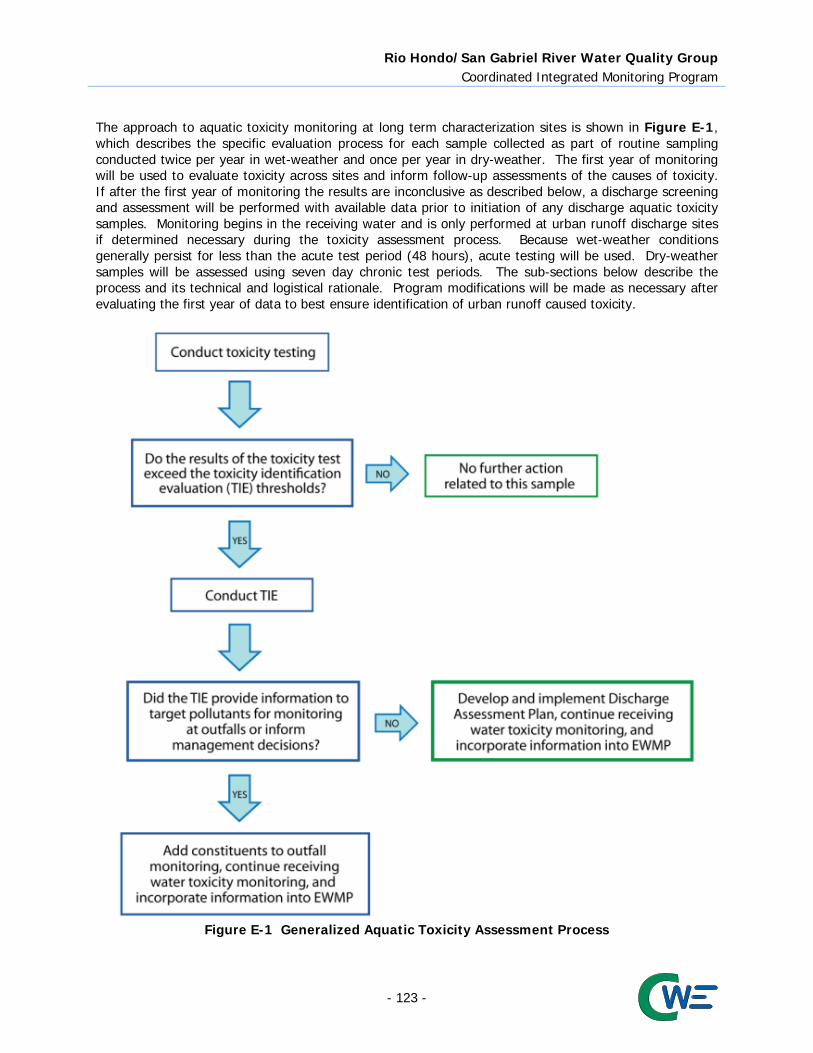
Rio Hondo/San Gabriel River Water Quality Group Coordinated Integrated Monitoring Program
The approach to aquatic toxicity monitoring at long term characterization sites is shown in Figure E-1, which describes the specific evaluation process for each sample collected as part of routine sampling conducted twice per year in wet-weather and once per year in dry-weather. The first year of monitoring will be used to evaluate toxicity across sites and inform follow-up assessments of the causes of toxicity. If after the first year of monitoring the results are inconclusive as described below, a discharge screening and assessment will be performed with available data prior to initiation of any discharge aquatic toxicity samples. Monitoring begins in the receiving water and is only performed at urban runoff discharge sites if determined necessary during the toxicity assessment process. Because wet-weather conditions generally persist for less than the acute test period (48 hours), acute testing will be used. Dry-weather samples will be assessed using seven day chronic test periods. The sub-sections below describe the process and its technical and logistical rationale. Program modifications will be made as necessary after evaluating the first year of data to best ensure identification of urban runoff caused toxicity.
Figure E-1 Generalized Aquatic Toxicity Assessment Process
- 123 -

Rio Hondo/San Gabriel River Water Quality Group Coordinated Integrated Monitoring Program
E.1.4.1 Summary of Previous Relevant Studies A 2005-2006 aquatic toxicity study was performed by the Stormwater Monitoring Council (SMC)2. The study area included the San Gabriel River main stem and tributaries and was performed following significant improvements to publically owned treatment works (POTW) to remove ammonia and metals, and just after diazinon and chlorpyrifos use restrictions and bans. The pesticide bans were effective beginning in 2005, and some tributary toxicity was attributed to remaining use of the pesticides. The researchers generally found much lower rates of significant toxicity to Ceriodaphia dubia than a previous study performed in the 1990’s. The SMC study is used as a model for this aquatic toxicity program to evaluate urban runoff effects, with a focus on replacement pesticides (e.g., pyrethroids) that are now commonly used and have additive synergistic effects that are more difficult to identify. E.1.4.2 Sensitive Species Selection The MRP (page E-32) states that a sensitivity screening to select the most sensitive test species should be conducted unless “a sensitive test species has already been determined, or if there is prior knowledge of potential toxicant(s) and a test species is sensitive to such toxicant(s), then monitoring shall be conducted using only that test species.” Previous relevant studies conducted in the watershed should be considered. Such studies may have been completed via previous MS4 sampling, wastewater NPDES sampling, or special studies conducted within the watershed. The following discuss the species selection process for assessing aquatic toxicity in receiving waters. As described in the MRP (page E-31), if samples are collected in receiving waters with salinity less than 1 part per thousand (ppt), or from outfalls discharging to receiving waters with salinity less than 1 ppt, toxicity tests should be conducted on the most sensitive test species in accordance with species and short-term test methods in Short-term Methods for Estimating the Chronic Toxicity of Effluents and Receiving Waters to Freshwater Organisms (EPA/821/R-02/013, 2002; Table IA, 40 CFR Part 136). The freshwater test species identified in the MRP are:
A static renewal toxicity test with the fathead minnow, Pimephales promelas (Larval Survival and Growth Test Method 1000.04).
A static renewal toxicity test with the daphnid, Ceriodaphnia dubia (Survival and Reproduction Test Method 1002.05).
A static renewal toxicity test with the green alga, Selenastrum capricornutum (also named Raphidocelis subcapitata) (Growth Test Method 1003.0).
The three test species were evaluated to determine if either a sensitive test species had already been determined, or if there is prior knowledge of potential toxicant(s) and a test species is sensitive to such toxicant(s). In reviewing the available data in the watershed, metals, historical organics, and currently used pesticides have been identified as problematic and are generally considered the primary aquatic life toxicants of concern found in urban runoff. Given the knowledge of the presence of these potential toxicants in the watershed, the sensitivities of each of the three species were considered to evaluate which is the most sensitive to the potential toxicants in the watershed. Ceriodaphnia dubia (C. dubia) has been reported as a sensitive test species for historical and current use pesticides and metals, and studies indicate that it is more sensitive to the toxicants of concern than Pimephales promelas (P. promelas) or Selenastrum capricornutum (S. capricornutum). In Aquatic Life Ambient Freshwater Quality Criteria - Copper, the USEPA reports greater sensitivity of C. dubia to copper
2 Schiff, K., Bax, B., Markle, P., Fleming, T. and Newman, J. 2007. Wet and Dry Weather Toxicity in the San Gabriel River. Bulletin of the Southern California Academy of Sciences: Vol. 106: Iss. 3. Available at: http://scholar.oxy.edu/scas/vol106/iss3/2
- 124 -
Rio Hondo/San Gabriel River Water Quality Group Coordinated Integrated Monitoring Program
(species mean acute value of 5.93 µg/l) compared to P. promelas (species mean acute value of 69.93 µg/l; EPA, 2007). C. dubia’s relatively higher sensitivity to metals is common across multiple metals. Additionally, researchers at the University of California (UC), Davis reviewed available reported species sensitivity values in developing pesticide criteria for the Central Valley Regional Water Quality Control Board. The UC Davis researchers reported higher sensitivity of C. dubia to diazinon and bifenthrin (species mean acute value of 0.34 µg/l and 0.105 µg/l) compared to P. promelas (species mean acute value of 7804 µg/l and 0.405 µg/l; Palumbo et al., 2010a,b). Additionally, a study of the City of Stockton urban stormwater runoff found acute and chronic toxicity to C. dubia, with no toxicity to S. capricornutum or P. promelas (Lee and Lee, 2001). The toxicity was attributed to organophosphate pesticides, indicating a higher sensitivity of C. dubia compared to S. capricornutum or P. promelas. C. dubia is also the test organism selected to assess the ambient toxicity of the Los Angeles River by the Los Angeles River Watershed Monitoring Program and has been the most-sensitive species to the Donald C. Tillman and the Los Angeles-Glendale Water Reclamation Plant effluent as well as the Los Angeles River receiving water in the vicinity of the water treatment plants. While P. promelas is generally less sensitive to metals and pesticides, this species can be more sensitive to ammonia than C. dubia. However, as ammonia is not typically a constituent of concern for urban runoff and ammonia is not consistently observed above the toxic thresholds in the watershed, P. promelas is not considered a particularly sensitive species for evaluating the impacts of urban runoff in receiving waters in the watershed. S. capricornutum is a species sensitive to herbicides. However, while sometimes present in urban runoff, herbicides are not identified as a potential toxicant in the watershed. Additionally, S. capricornutum is not considered the most sensitive species as it is not sensitive to pyrethroids or organophosphate pesticides and is not as sensitive to metals as C. dubia. Additionally, the S. capricornutum growth test can be affected by high concentrations of suspended and dissolved solids, color, and pH extremes, which can interfere with the determination of sample toxicity. As a result, it is common to manipulate the sample by centrifugation and filtration to remove solids to conduct the test; however, this process may affect the toxicity of the sample. In a study of urban highway stormwater runoff (Kayhanian et. al, 2008), S. capricornutum response to the stormwater samples was more variable than the C. dubia and the P. promelas and in some cases the algal growth was possibly enhanced due to the presence of stimulatory nutrients. Also, in a study on the City of Stockton urban stormwater runoff (Lee and Lee, 2001) the S. capricornutum tests rarely detected toxicity where the C. dubia and the P. promelas regularly detected toxicity. As C. dubia is identified as the most sensitive to known potential toxicant(s) typically found in receiving waters and urban runoff in the freshwater potions of the watershed, C. dubia is selected as the most sensitive species. The species also has the advantage of being easily maintained in house mass cultures. The simplicity of the test, the ease of interpreting results, and the smaller volume necessary to run the test, make the test a valuable screening tool. The ease of sample collection and higher sensitivity will support assessing the presence of ambient receiving water toxicity or long term effects of toxic stormwater over time. Toxicity testing in the freshwater portions of the watershed will be conducted using C. dubia. However, C. dubia test organisms are typically cultured in moderately hard waters (80-100 mg/L CaCO3) and can have increased sensitivity to elevated water hardness greater than 400 mg/L CaCO3), which is beyond their typical habitat range. Because of this, in instances where hardness in site waters exceeds 400 mg/L (CaCO3), an alternative test species may be used. Daphnia magna is more tolerant to high hardness levels and is a suitable substitution for C. dubia in these instances (Cowgill and Milazzo, 1990). E.1.4.3 Testing Period The following describes the testing periods to assess toxicity in samples collected in the EWMP area during dry- and wet-weather conditions. As wet-weather conditions in the region generally persist for less than the acute and chronic testing periods (typically 48 hours and 7 days, respectively), the shorter of the two testing methods, in the case of C. dubia acute testing measuring survival, will be used for wet-
- 125 -
Rio Hondo/San Gabriel River Water Quality Group Coordinated Integrated Monitoring Program
weather toxicity testing. Utilization of chronic tests on wet-weather samples generates results that are not representative of the conditions found in the receiving water intended to be simulated by toxicity testing. Acute toxicity tests are utilized to be consistent with the relatively shorter exposure periods of species in the EWMP area to potential toxicants introduced by urban runoff during storm events. Acute testing to assess survival endpoints will be conducted in accordance with Methods for Measuring the Acute Toxicity of Effluents and Receiving Waters to Freshwater and Marine Organisms (EPA, 2002b). Chronic toxicity tests will be used to assess both survival and reproductive/growth endpoints for C. dubia in dry-weather samples. Chronic testing will be conducted on undiluted samples in accordance with Short-term Methods for Estimating the Chronic Toxicity of Effluents and Receiving Waters to Freshwater Organisms (USEPA, 2002a). The MS4 Permit specifies that the Permittees shall collect and analyze samples from receiving water monitoring locations to evaluate the extent and cause of toxicity in receiving water. Accordingly, both acute and chronic toxicity samples will be taken from receiving water sites, and not from outfall sites. E.1.4.4 Toxicity Endpoint Assessment and Toxicity Identification
Evaluation (TIE) Triggers Per the MRP, acute and chronic toxicity test endpoints will be analyzed using the Test of Significant Toxicity (TST) t-test approach specified by the USEPA (USEPA, 2010). The MS4 Permit specifies that the chronic in-stream waste concentration (IWC) is set at 100% receiving water for receiving water samples and 100% effluent for outfall samples. Using the TST approach, a t-value is calculated for a test result and compared with a critical t-value from USEPA’s TST Implementation Document (USEPA, 2010). Follow-up triggers are generally based on the MS4 Permit specified statistical assessment as described below. For acute C. dubia toxicity testing, if a statistically significant 50% difference in mortality is observed between the sample and laboratory control, a toxicity identification evaluation (TIE) will be performed. TIE procedures are discussed in detail in the following subsection. Experience conducting TIEs in receiving waters in the region supports using a 50% mortality trigger to provide a reasonable opportunity for a successful TIE. During TMDL monitoring in the Calleguas Creek Watershed (CCW) in 2003 and 2004, TIEs were initiated on samples exceeding the 50% threshold (the majority of which displayed 100% mortality). In that study, toxicity degraded in approximately 40% of the samples on which TIE procedures were conducted making the TIE unsuccessful (and effectively useless in pinpointing specific toxicants). The Regional Board approved monitoring program for the CCW Toxicity, Chlorpyrifos and Diazinon TMDL utilizes a 50% threshold for TIE initiation. Additionally, a 50% mortality threshold is utilized in the Ventura County MS4 Permit. For chronic C. dubia toxicity testing, if a statistically significant 50% difference in mortality is observed between the sample and laboratory control, a TIE will be performed. If a statistically significant 50% difference in a sub-lethal endpoint is observed between the sample and laboratory control, a confirmatory sample will be collected from the receiving water within two weeks of obtaining the results of the initial sample. If a statistically significant 50% difference in mortality or sub-lethal endpoint is observed between the sample and laboratory control on the confirmatory sample, a TIE will be performed. For the chronic marine and estuarine tests, the percent effect will be calculated. The percent effect is defined as the difference between the mean control response and the mean IWC response divided by the control response, multiplied by 100. A TIE will be performed if the percent effect value is equal to or greater than 50 percent.
- 126 -

Rio Hondo/San Gabriel River Water Quality Group Coordinated Integrated Monitoring Program
TIE procedures will be initiated as soon as possible after the toxicity trigger threshold is observed to reduce the potential for loss of toxicity due to extended sample storage. If the cause of toxicity is readily apparent or is caused by pathogen related mortality (PRM) or epibiont interference with the test, the result will be rejected. If necessary, a modified testing procedure will be developed for future testing. In cases where significant endpoint toxicity effects greater than 50% are observed in the original sample, but the follow-up TIE positive control “signal” is not statistically significant, the cause of toxicity will be considered non-persistent. No immediate follow-up testing is required on the sample. However, future test results should be evaluated to determine if parallel TIE treatments are necessary to provide an opportunity to identify the cause of toxicity. E.1.4.5 Toxicity Identification Evaluation Approach The results of toxicity testing will be used to trigger further investigations to determine the cause of observed laboratory toxicity. The primary purpose of conducting TIEs is to support the identification of management actions that will result in the removal of pollutants causing toxicity in receiving waters. Successful TIEs will direct monitoring at outfall sampling sites to inform management actions. The goal of conducting TIEs is to identify pollutant(s) that should be sampled during outfall monitoring so that management actions can be identified to address the pollutant(s). The TIE approach is divided into three phases as described in USEPA’s 1991 Methods for Aquatic Toxicity Identification Evaluations – Phase I Toxicity Characterization Procedures – Second Edition (EPA/600/6-9/003) and briefly summarized as follows:
Phase I utilizes methods to characterize the physical/chemical nature of the constituents which cause toxicity. Such characteristics as solubility, volatility and filterability are determined without specifically identifying the toxicants. Phase I results are intended as a first step in specifically identifying the toxicants but the data generated can also be used to develop treatment methods to remove toxicity without specific identification of the toxicants.
Phase II utilizes methods to specifically identify toxicants. Phase III utilizes methods to confirm the suspected toxicants.
A Phase I TIE will be conducted on samples that exceed a TIE trigger described above. Water quality data will be reviewed to future support evaluation of potential toxicants. TIEs will perform the manipulations described in Table E-7. TIE methods will generally adhere to USEPA procedures documented in conducting TIEs (USEPA, 1991, 1992, 1993a-b).
- 127 -

Rio Hondo/San Gabriel River Water Quality Group Coordinated Integrated Monitoring Program
Table E-7 Aquatic Toxicity Identification Evaluation Sample Manipulations TIE Sample Manipulation Expected Response
pH Adjustment (pH 7 and 8.5) Alters toxicity in pH sensitive compounds (i.e., ammonia and some trace metals)
Filtration or centrifugation Removes particulates and associated toxicants Ethylenedinrilo-Tetraacetic Acid (EDTA) Chelates trace metals, particularly divalent cationic metals
Sodium thiosulfate (STS) addition Reduces toxicants attributable to oxidants (i.e., chlorine) and some trace metals
Piperonyl Butoxide (PBO) Reduces toxicity from organophosphate pesticides such as diazinon, chlorpyrifos and malathion, and enhances pyrethroid toxicity
Carboxylesterase addition1 Hydrolyzes pyrethroids Solid Phase Extraction (SPE) with C18 column
Removes non-polar organics (including pesticides) and some relatively non-polar metal chelates
Sequential Solvent Extraction of C18 column
Further resolution of SPE-extracted compounds for chemical analyses
No Manipulation Baseline test for comparing the relative effectiveness of other manipulations
1 Carboxylesterase addition has been used in recent studies to help identify pyrethroid-associated toxicity (Wheelock et al., 2004; Weston and Amweg, 2007). However, this treatment is experimental in nature and should be used along with other pyrethroid-targeted TIE treatments (e.g., PBO addition).
The RH/SGRWQG will identify the cause(s) of toxicity using the treatments in Table E-7 and, if possible, using the results of water column chemistry analyses. After any initial determinations of the cause of toxicity, the information may be used during future events to modify the targeted treatments to more closely target the expected toxicant or to provide additional treatments to narrow the toxicant cause(s). Moreover, if the toxicant or toxicant class is not initially identified, toxicity monitoring during subsequent events will confirm if the toxicant is persistent or a short-term episodic occurrence. As the primary goals of conducting TIEs is to identify pollutants for incorporation into outfall monitoring, narrowing the list of toxicants following Phase I TIEs via Phase II or III TIEs is not necessary if the toxicant class determined during the Phase I TIE is sufficient for: (1) identifying additional pollutants for outfall monitoring; and/or (2) identifying control measures. Thus, if the specific pollutant(s) or the analytical class of pollutant (e.g., metals that are analyzed via USEPA Method 200.8) are identified then sufficient information is available to inform the addition of pollutants to outfall monitoring. Phase II TIEs may be utilized to identify specific constituents causing toxicity in a given sample if information beyond what is gained via the Phase I TIE and review of chemistry data is needed to identify constituents to monitor or management actions. Phase III TIEs will be conducted following any Phase II TIEs. For the purposes of determining whether a TIE is inconclusive, TIEs will be considered inconclusive if:
The toxicity is persistent (i.e., observed in the positive control), and The cause of toxicity cannot be attributed to a class of constituents (e.g., insecticides, metals,
etc.) that can be targeted for monitoring. If (1) a combination of causes that act in a synergistic or additive manner are identified; (2) the toxicity can be removed with a treatment or via a combination of the TIE treatments; or (3) the analysis of water quality data collected during the same event identify the pollutant or analytical class of pollutants, the result of a TIE is considered conclusive.
- 128 -

Rio Hondo/San Gabriel River Water Quality Group Coordinated Integrated Monitoring Program
Note that the MRP (page E-33) allows a TIE Prioritization Metric (as described in Appendix E of the Southern California Stormwater Monitoring Coalition’s (SMC) Model Monitoring Program) for use in ranking sites for TIEs. However, as the extent to which TIEs will be conducted is unknown, prioritization cannot be conducted at this time. However, prioritization may be utilized in the future based on the results of toxicity monitoring and an approach to prioritization will be developed through the CIMP adaptive management process and will be described in future versions of the CIMP. E.1.4.6 Discharge Assessment The RH/SGRWQG will prepare a Discharge Assessment Plan (DAP) if TIEs conducted on consecutive sampling events are inconclusive. Discharge assessments will be conducted after consecutive inconclusive TIEs, rather than after one, because of the inherit variability associated with the toxicity and TIE testing methods. The DAP will consider the observed potential toxicants in the receiving water and associated urban runoff discharge above known species effect levels and the relevant exposure periods compared to the duration of the observed toxicity. The DAP will identify:
1. If desired, additional receiving water toxicity monitoring to be conducted to further evaluate the spatial extent of receiving water toxicity.
2. The test species to be utilized. If a species is proposed that is different than the species utilized when receiving water toxicity was observed, justification for the substitution will be provided.
3. The number and location of monitoring sites and their spatial relation to the observed receiving water toxicity.
4. The number of monitoring events that will be conducted, a schedule for conducting the monitoring, and a process for evaluating the completion of the assessment monitoring.
The DAP will be submitted to Regional Board staff for comment within 60 days of receipt of notification of the second consecutive inconclusive result. If no comments are received within 30 days, it will be assumed that the approach is appropriate for the given situation and the DAP will be implemented within 90-days of submittal. If comments are received within 30 days, the DAP will be resubmitted to Regional Board staff and the Plan will be implemented within 90-days of submittal of a version of the Plan that does not receive comments from Regional Board staff. E.1.4.7 Follow Up on Toxicity Testing Results The MRP (page E-33) indicates the following actions should be taken when a toxicant or class of toxicants is identified through a TIE:
RH/SGRWQG Members shall analyze for the toxicant(s) during the next scheduled sampling event in the discharge from the outfall(s) upstream of the receiving water location.
If the toxicant is present in the discharge from the outfall at levels above the applicable receiving water limitation, a toxicity reduction evaluation (TRE) will be performed for that toxicant.
The list of constituents monitored at outfalls identified in the CIMP will be modified based on the results of the TIEs.
Monitoring for constituents identified based on the results of a TIE will occur as soon as feasible following the completion of a successful TIE (i.e., the next monitoring event that is at least 45 days following the toxicity laboratory’s report transmitting the results of a successful TIE). The requirements of the TREs will be met as part of the adaptive management process in the EWMP rather than conducted via the CIMP. The identification and implementation of control measures to
- 129 -

Rio Hondo/San Gabriel River Water Quality Group Coordinated Integrated Monitoring Program
address the causes of toxicity are tied to management of the stormwater program, not the CIMP. It is expected that the requirements of TREs will only be conducted for toxicants that are not already addressed by an existing MS4 Permit requirement (i.e., TMDLs) or existing or planned management actions. E.1.4.8 Summary of Aquatic Toxicity Monitoring The approach to conducting aquatic toxicity monitoring as described in the previous sections of this Attachment is summarized in detail in Figure E-2. The intent of the approach is to identify the cause of toxicity observed in receiving water to the extent possible with the toxicity testing tools available, thereby directing outfall monitoring for the pollutants causing toxicity with the ultimate goal of supporting the development and implementation of management actions.
- 130 -
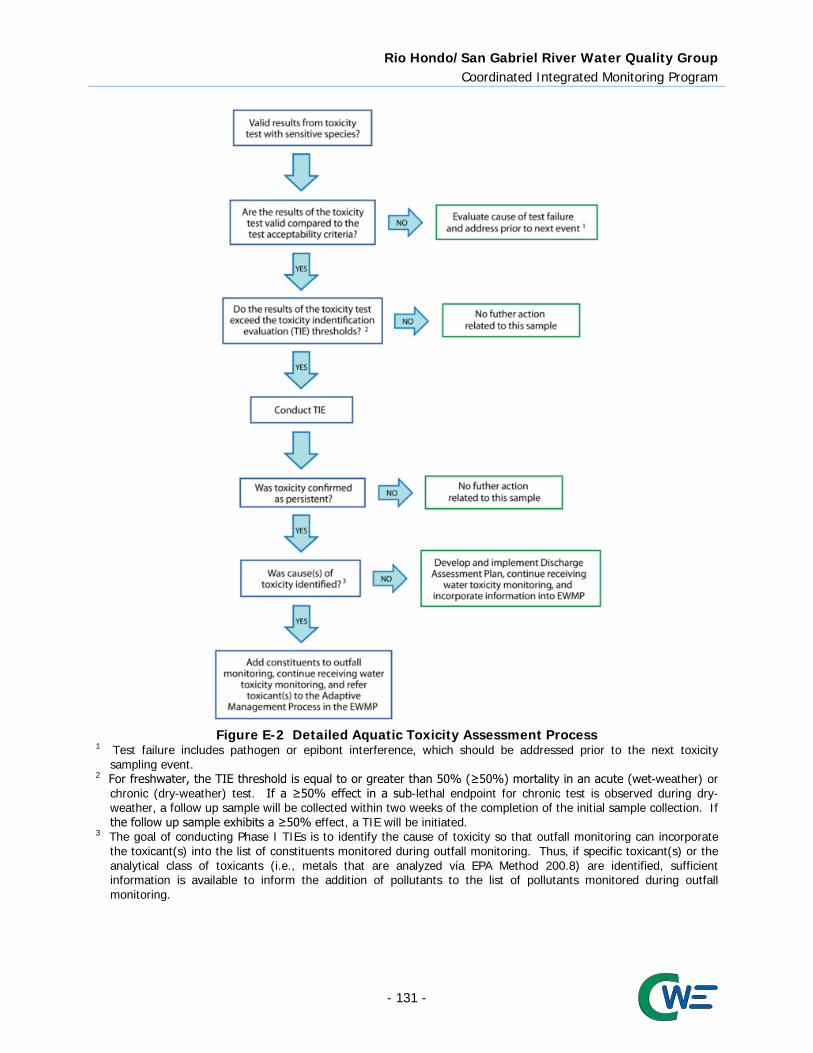
Rio Hondo/San Gabriel River Water Quality Group Coordinated Integrated Monitoring Program
Figure E-2 Detailed Aquatic Toxicity Assessment Process
1 Test failure includes pathogen or epibont interference, which should be addressed prior to the next toxicity sampling event.
2 For freshwater, the TIE threshold is equal to or greater than 50% (≥50%) mortality in an acute (wet-weather) or chronic (dry-weather) test. If a ≥50% effect in a sub-lethal endpoint for chronic test is observed during dry-weather, a follow up sample will be collected within two weeks of the completion of the initial sample collection. If the follow up sample exhibits a ≥50% effect, a TIE will be initiated.
3 The goal of conducting Phase I TIEs is to identify the cause of toxicity so that outfall monitoring can incorporate the toxicant(s) into the list of constituents monitored during outfall monitoring. Thus, if specific toxicant(s) or the analytical class of toxicants (i.e., metals that are analyzed via EPA Method 200.8) are identified, sufficient information is available to inform the addition of pollutants to the list of pollutants monitored during outfall monitoring.
- 131 -

Rio Hondo/San Gabriel River Water Quality Group Coordinated Integrated Monitoring Program
E.1.5 Bioassessment/Macrobenthic Community Assessment The LACFCD has indicated that it will continue its participation in the SMC Regional Bioassessment Monitoring Program on behalf of the RH/SGRWQG. Thus no specific monitoring and analytical procedures are included in the CIMP at this time. If in the future, such monitoring is necessary under this program, the CIMP will be revised to include appropriate procedures. E.1.5.1 List of Laboratories Conducting Analysis The chosen laboratories will be able to meet the measurement quality objectives set forth in Table E-2 through Table E-5. Laboratories will meet California Environmental Laboratory Accreditation Program (ELAP) and/or National Environmental Laboratory Accreditation Program (NELAP) certifications and any data quality requirements specified in this document. Due to contracting procedures and solicitation requirements, qualified laboratories have not yet been selected to carry out the analytical responsibilities described in this CIMP. Selected laboratories will be listed along with laboratory certification information in Table E-8. Following the completion of the first monitoring year, the CIMP will be updated to include the pertinent laboratory specific information. At the end of all future monitoring years the RH/SGRWQG will assess the laboratories performance and at that time a new laboratory may be chosen. Table E-8 Summary of Laboratories Conducting Analysis for the RH/SGRWQG
CIMP Laboratory1 General Category of Analysis Lab Certification No. & Expiration Date2
1 Information for all laboratories will be added to this table following their selection and upon CIMP update. 2 Lab certifications are renewed on an annual basis.
E.1.5.2 Alternate Laboratories In the event that the laboratories selected to perform analyses for the RH/SGRWQG CIMP are unable to fulfill data quality requirements outlined herein (e.g., due to instrument malfunction), alternate laboratories need to meet the same requirements that the primary laboratory have met. The original laboratory selected may recommend a qualified laboratory to act as a substitute. However, the final decision regarding alternate laboratory selection rests with the Project Manager and Project QA Manager.
E.2 Sampling Methods and Sample Handling The following sections describe the steps to be taken to properly prepare for and initiate water quality sampling for the RH/SGRWQG CIMP.
- 132 -
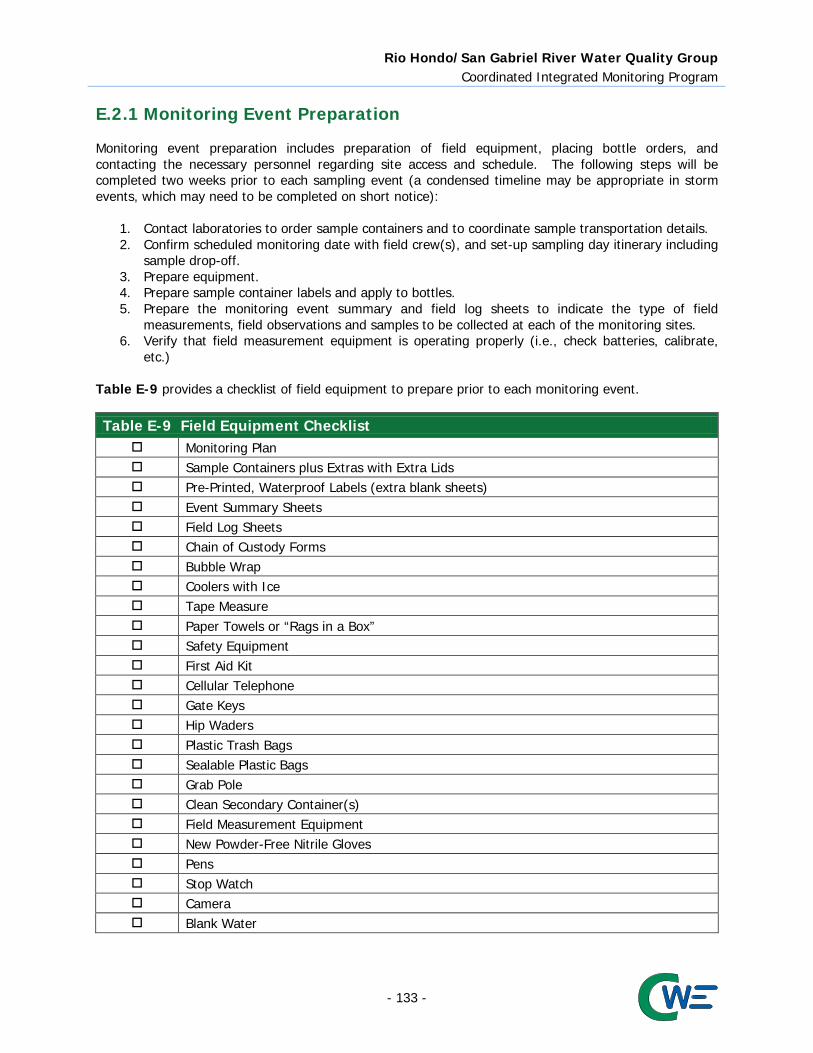
Rio Hondo/San Gabriel River Water Quality Group Coordinated Integrated Monitoring Program
E.2.1 Monitoring Event Preparation Monitoring event preparation includes preparation of field equipment, placing bottle orders, and contacting the necessary personnel regarding site access and schedule. The following steps will be completed two weeks prior to each sampling event (a condensed timeline may be appropriate in storm events, which may need to be completed on short notice):
1. Contact laboratories to order sample containers and to coordinate sample transportation details. 2. Confirm scheduled monitoring date with field crew(s), and set-up sampling day itinerary including
sample drop-off. 3. Prepare equipment. 4. Prepare sample container labels and apply to bottles. 5. Prepare the monitoring event summary and field log sheets to indicate the type of field
measurements, field observations and samples to be collected at each of the monitoring sites. 6. Verify that field measurement equipment is operating properly (i.e., check batteries, calibrate,
etc.) Table E-9 provides a checklist of field equipment to prepare prior to each monitoring event.
Table E-9 Field Equipment Checklist Monitoring Plan Sample Containers plus Extras with Extra Lids Pre-Printed, Waterproof Labels (extra blank sheets) Event Summary Sheets Field Log Sheets Chain of Custody Forms Bubble Wrap Coolers with Ice Tape Measure Paper Towels or “Rags in a Box” Safety Equipment First Aid Kit Cellular Telephone Gate Keys Hip Waders Plastic Trash Bags Sealable Plastic Bags Grab Pole Clean Secondary Container(s) Field Measurement Equipment New Powder-Free Nitrile Gloves Pens Stop Watch Camera Blank Water
- 133 -

Rio Hondo/San Gabriel River Water Quality Group Coordinated Integrated Monitoring Program
E.2.1.1 Bottle Order/Preparation Sample container orders will be placed with the appropriate analytical laboratory at least two weeks prior to each sampling event. Containers will be ordered for all water samples, including quality control samples, as well as extra containers in case the need arises for intermediate containers or a replacement. The containers must be the proper type and size and contain preservative as appropriate for the specified laboratory analytical methods. Table E-6 presents the proper container type, volume, and immediate processing and storage needs. The field crew must inventory sample containers upon receipt from the laboratory to ensure that adequate containers have been provided to meet analytical requirements for each monitoring event. After each event, any bottles used to collect water samples will be cleaned by the laboratory and either picked up by or shipped to the field crew. E.2.1.2 Container Labeling and Sample Identification Scheme All samples will be identified with a unique identification code to ensure that results are properly reported and interpreted. Samples will be identified such that the site, sampling location, matrix, sampling equipment and sample type (i.e., environmental sample or QC sample) can be distinguished by a data reviewer or user. Sample identification codes will consist of a site identification code, a matrix code, and a unique sample ID number. The format for sample ID codes is RHSGR- ###.# - AAAA - XXX, where:
RHSGR indicates that the sample was collected as part of the RH/SGRWQG CIMP. ### identifies the sequentially numbered monitoring event, and .# is an optional indicator for
re-samples collected for the same event. Sample events are numbered from 001 to 999 and will not be repeated.
AAAA indicates the unique site identification code assigned to each site. Site identification codes are provided in Table E-10.
XXX identifies the sample number unique to a sample bottle collected for a single event. Sample bottles are numbered sequentially from 001 to 999 and will not be repeated within a single event.
Table E-10 Summary of RH/SGRWQG Receiving Water Monitoring Sites
Site ID Water Body Represented Coordinates Monitoring Type
Latitude Longitude LTA TMDL RHSGR_RH3_ARC Rio Hondo Reach 3 34.089836 -118.033828 X X RHSGR_LDW_BDW Little Dalton Wash 34.099445 -117.926766 X X RHSGR_SAN_DD Santa Anita Wash 34.106200 -118.016150 X RHSGR_SAW_PR Sawpit Wash 34.106140 -118.006921 X RHSGR_PRP_LAKE Peck Road Park Lake Varies Varies X
- 134 -

Rio Hondo/San Gabriel River Water Quality Group Coordinated Integrated Monitoring Program
Custom bottle labels should be produced using blank waterproof labels and labeling software. Labels will be placed on the appropriate bottles in a dry environment; applying labels to wet sample bottles should be avoided. Labels should be placed on sides of bottles rather than on bottle caps. All sample containers will be pre-labeled before each sampling event to the extent practicable. Pre-labeling sample containers simplifies field activities, leaving only sample collection time and date and field crew initials to be filled out in the field. Custom labels will be produced using blank water-proof labels. This approach will allow the site and analytical constituent information to be entered in advance and printed as needed prior to each monitoring event. Labels should include the following information:
Program Name Station ID Sample ID
Date Collection Time Sampling Personnel
Analytical Requirements Preservative Requirements Analytical Laboratory
E.2.1.3 Field Meter Calibration Calibration of field measurement equipment is performed as described in the owner’s manuals for each individual instrument. Each individual field crew will be responsible for calibrating their field measurement equipment. Field monitoring equipment must meet the requirements outlined in Table E-1 and be calibrated before field events based on manufacturer guidance, but at a minimum prior to each event. Each calibration will be document on each event’s calibration log sheet (presented in Appendix 1). If calibration results do not meet manufacturer specifications, the field crew should first try to recalibrate using fresh aliquots of calibration solution. If recalibration is unsuccessful, new calibration solution should be used and/or maintenance should be performed. Each attempt should be recorded on the equipment calibration log. If the calibration results cannot meet manufacturer’s specifications, the field crew should use a spare field measuring device that can be successfully calibrated. Additionally, the Project Manager should be notified. Calibration should be verified using at least one calibration fluid within the expected range of field measurements, both immediately following calibration and at the end of each monitoring day. Individual constituents should be recalibrated if the field meters do not measure a calibration fluid within the range of accuracy presented in Table E-1. Calibration verification documentation will be retained in the event’s calibration verification log (presented in Appendix 1). Table E-11 outlines the typical field instrument calibration procedures for each piece of equipment requiring calibration. Results of calibration checks will be recorded on the calibration log sheet.
- 135 -
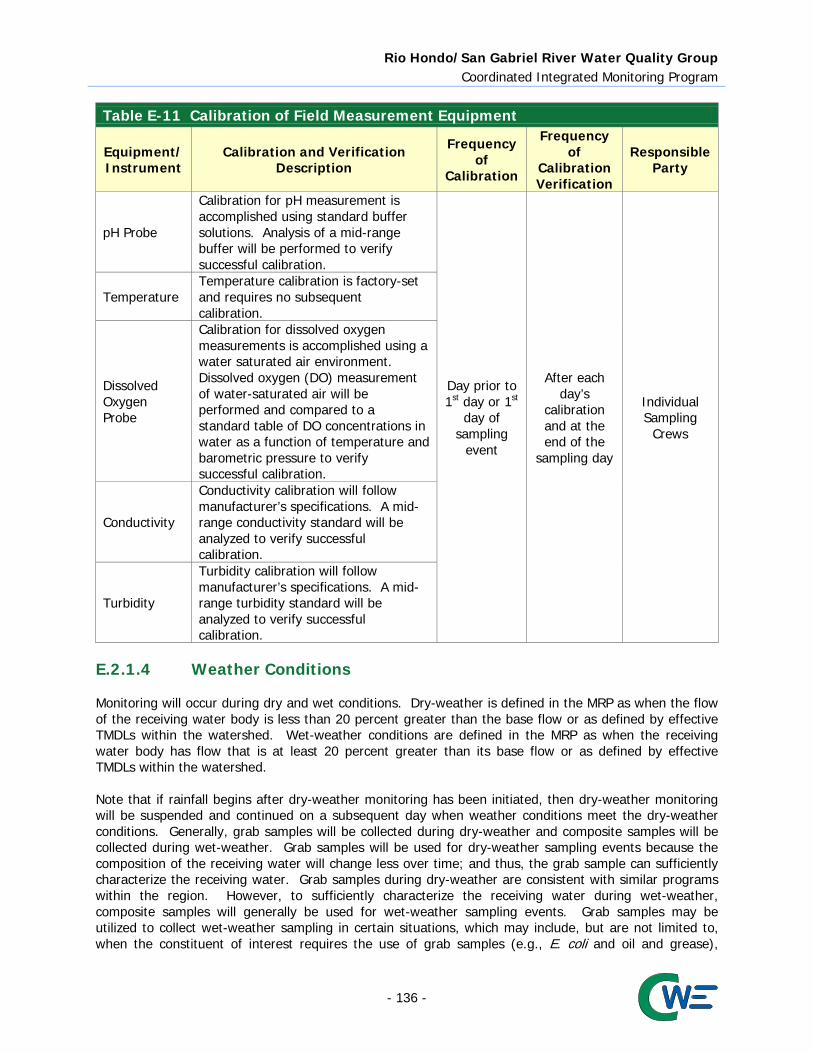
Rio Hondo/San Gabriel River Water Quality Group Coordinated Integrated Monitoring Program
Table E-11 Calibration of Field Measurement Equipment
Equipment/ Instrument
Calibration and Verification Description
Frequency of
Calibration
Frequency of
Calibration Verification
Responsible Party
pH Probe
Calibration for pH measurement is accomplished using standard buffer solutions. Analysis of a mid-range buffer will be performed to verify successful calibration.
Day prior to 1st day or 1st
day of sampling
event
After each day’s
calibration and at the end of the
sampling day
Individual Sampling
Crews
Temperature Temperature calibration is factory-set and requires no subsequent calibration.
Dissolved Oxygen Probe
Calibration for dissolved oxygen measurements is accomplished using a water saturated air environment. Dissolved oxygen (DO) measurement of water-saturated air will be performed and compared to a standard table of DO concentrations in water as a function of temperature and barometric pressure to verify successful calibration.
Conductivity
Conductivity calibration will follow manufacturer’s specifications. A mid-range conductivity standard will be analyzed to verify successful calibration.
Turbidity
Turbidity calibration will follow manufacturer’s specifications. A mid-range turbidity standard will be analyzed to verify successful calibration.
E.2.1.4 Weather Conditions Monitoring will occur during dry and wet conditions. Dry-weather is defined in the MRP as when the flow of the receiving water body is less than 20 percent greater than the base flow or as defined by effective TMDLs within the watershed. Wet-weather conditions are defined in the MRP as when the receiving water body has flow that is at least 20 percent greater than its base flow or as defined by effective TMDLs within the watershed. Note that if rainfall begins after dry-weather monitoring has been initiated, then dry-weather monitoring will be suspended and continued on a subsequent day when weather conditions meet the dry-weather conditions. Generally, grab samples will be collected during dry-weather and composite samples will be collected during wet-weather. Grab samples will be used for dry-weather sampling events because the composition of the receiving water will change less over time; and thus, the grab sample can sufficiently characterize the receiving water. Grab samples during dry-weather are consistent with similar programs within the region. However, to sufficiently characterize the receiving water during wet-weather, composite samples will generally be used for wet-weather sampling events. Grab samples may be utilized to collect wet-weather sampling in certain situations, which may include, but are not limited to, when the constituent of interest requires the use of grab samples (e.g., E. coli and oil and grease),
- 136 -

Rio Hondo/San Gabriel River Water Quality Group Coordinated Integrated Monitoring Program
situations where it is unsafe to collect composite samples, or to perform investigative monitoring where composite sampling or installation of an automatic sample compositor (autosampler) may not be warranted. The MRP includes specific criteria for the time of monitoring events. With the exception of bacteria and metals monitoring, most constituents will be monitored during two dry-weather monitoring events. For dry-weather toxicity monitoring, sampling must take place during the historically driest month. As a result, the dry-weather monitoring event that includes toxicity monitoring will be conducted in July. The second dry-weather monitoring event will take place during January unless sampling during another month is deemed to be preferable. The first significant rain event of the storm year (first flush) will be monitored. The targeted storm events for wet-weather sampling will be selected based on a reasonable probability that the events will result in substantially increased flows in the Rio Hondo and San Gabriel River over at least 12 hours. Sufficient precipitation is needed to produce runoff and increase flow. The decision to sample a storm event will be made in consultation with weather forecasting information services after a quantitative precipitation forecast (QPF) has been determined. All efforts will be made to collect wet-weather samples from all sites during a single targeted storm event. However, safety or other factors may make it infeasible to collect samples from a given storm event. For example, storm events that will require field crews to collect wet-weather samples during holidays and/or weekends may not be sampled due to sample collection or laboratory staffing constraints. For a storm to be tracked, the first flush event will have a predicted rainfall of at least 0.25 inches with at least a 70 percent probability of rainfall 24 hours prior to the forecasted time of initial rainfall. Because a significant storm event is based on predicted rainfall, it is recognized that this monitoring may be triggered without 0.25 inches of rainfall actually occurring. In this case, the monitoring event will still qualify as meeting this requirement provided that sufficient sample volume is collected to do all required laboratory analysis. Documentation will be provided showing the predicted rainfall amount. Subsequent storm events must meet the tracking requirements, flow objectives, as well as be separated by a minimum of three days of dry-weather. Antecedent conditions will be based on the LACDPW rain gauge listed in Table E-12. The rain gauge has been used to define wet- and dry-weather during TMDL monitoring in the watershed since 2009. Data can be obtained over the internet at the following location: http://dpw.lacounty.gov/wrd/Precip/index.cfm Once on the County site, click the ‘See Data’ link in the “Near Real-Time Precipitation Map” section. The web page displays a map showing real-time rainfall totals (in inches) for different rain gauges. Although the default precipitation period is 24 hours, the user can view rainfall totals over different durations. Data from the rain gauges is updated every 10 minutes. Table E-12 Real-Time Rain Gauge Used to Define Weather Conditions for CIMP
Monitoring Jurisdictional Group Rainfall Gauge Gauge Type
RH/SGRWQG Santa Fe Dam (USC) (#3377)
LACDPW ALERT Rainfall Gauge
The targeted storm events for wet-weather sampling will be selected based on a reasonable probability that the events will result in substantially increased flows in the San Gabriel and Rio Hondo River for at least 12 hours. Sufficient precipitation is needed to produce runoff and increase flow. The decision to sample a storm event will be made in consultation with weather forecasting information services after a
- 137 -

Rio Hondo/San Gabriel River Water Quality Group Coordinated Integrated Monitoring Program
QPF has been determined. All efforts will be made to collect wet-weather samples from all sites during a single targeted storm event. However, safety or other factors may make it infeasible to collect samples from the same storm event. For the purpose of triggering wet-weather sampling preparation, field staff can estimate that any rainfall prediction of 0.1-0.5 inches in a 6- to 12-hour period at the Santa Fe Dam gate site would be sufficient to mobilize for wet-weather sampling. The sampling crew should prepare to depart at the forecasted time of initial rainfall. The first of the four manual composite samples should be targeted for collection within 2 hours of local rainfall. Publicly available meteorological forecasting systems are suggested for identifying and anticipating storm event sampling. The sampling decision protocol begins when the sampling crew recognizes an approaching storm, through weekly monitoring of forecasts. The National Weather Service’s weather forecast for downtown Los Angeles can be accessed on-line at: http://www.wrh.noaa.gov/lox/http://www.wrh.noaa.gov/lox/ Then click on “Los Angeles” on the area map. From the forecast page, the link to “Quantitative Precipitation Forecast” provides forecasted precipitation in inches for the next 24 hours, in 3-hour increments for the first 12 hours and in 6-hour increments for the last 12 hours. E.2.1.5 Flow Gauge Measurements USGS flow gauges along the San Gabriel River will be used to determine whether the receiving water flow has exceeded the 20 percent threshold. Flows above the 20 percent threshold will classify the receiving water body as being in “wet” conditions and flows that are less than the 20 percent threshold will be “dry” conditions. In addition to the USGS rain gauges, field crews will monitor flow at each of the sampling sties. Table E-13 presents the location of flow gauges located on the San Gabriel and Rio Hondo River
Table E-13 Rio Hondo and San Gabriel River Flow Gauges Water Body Water Body Type Gauge Location Gauge ID
Rio Hondo River Main Stem Rio Hondo River above Whittier Narrows Dam RHR San Gabriel River Main Stem San Gabriel River above Whittier Narrows Dam SGRW San Gabriel River Main Stem San Gabriel River Below Santa Fe Dam SGRS
E.2.2 Sample Handling Proper sampling handling ensures the samples will comply with the monitoring methods and analytical hold time and provides traceable documentation throughout the history of the sample.
- 138 -
Rio Hondo/San Gabriel River Water Quality Group Coordinated Integrated Monitoring Program
E.2.2.1 Documentation Procedures The Project Manager is responsible for ensuring that each field sampling team adheres to proper custody and documentation procedures. Field log sheets documenting sample collection and other monitoring activities for each site will be bound in a separate master logbook for each event. Field personnel have the following responsibilities:
Keep an accurate written record of sample collection activities on the field log sheets. Ensure that all field log sheet entries are legible and contain accurate and inclusive
documentation of all field activities. Note errors or changes using a single line to cross out the entry and date and initial the change. Ensure that a label is affixed to each sample collected and that the labels uniquely identify
samples with a sample ID, site ID, date and time of sample collection and the sampling crew initials.
Complete the chain of custody forms accurately and legibly. E.2.2.2 Field Documentation/Field Log Field crews will keep a field log book for each sampling event that contains a calibration log sheet, a field log sheet for each site, and appropriate contact information. The following items should be recorded on the field log sheet for each sampling event:
Monitoring station location (Site ID); Date and time(s) of sample collection; Name(s) of sampling personnel; Sample depth; Sample ID numbers and unique IDs for any replicate or blank samples; QC sample type (if appropriate); Requested analyses (specific constituents or method references); Sample type (e.g., grab or composite); The results of any field measurements (e.g., flow, temperature, dissolved oxygen, pH,
conductivity, turbidity) and the time that measurements were made; Qualitative descriptions of relevant water conditions (e.g., water color, flow level, clarity) or
weather (e.g., wind, rain) at the time of sample collection; and, Trash observations; Observations of recreational activities; A description of any unusual occurrences associated with the sampling event, particularly those
that may affect sample or data quality. The field log will be scanned into a PDF and transmitted along with the Post-Event Summary Report to the Project Manager within one week of the conclusion of each sampling event. Appendix 1 contains an example of the field log sheet. E.2.2.3 Sample Handling and Shipment The field crews will have custody of samples during each monitoring event. Chain-of-custody (COC) forms will accompany all samples during shipment to contract laboratories to identify the shipment contents. All water quality samples will be transported to the analytical laboratory by the field crew or by overnight courier. The original COC form will accompany the shipment, and a signed copy of the COC form will be sent, typically via fax, by the laboratory to the field crew to be retained in the project file.
- 139 -

Rio Hondo/San Gabriel River Water Quality Group Coordinated Integrated Monitoring Program
While in the field, samples will be stored on ice in an insulated container, so that they will be kept at less than 6˚C. Samples that must be shipped to the laboratory must be examined to ensure that container lids are tight and placed on ice to maintain the temperature between 4°C. The ice packed with samples must be approximately 2 inches deep at the top and bottom of the cooler, and must contact each sample to maintain temperature. The original COC form(s) will be double-bagged in re-sealable plastic bags and either taped to the outside of the cooler or to the inside lid. Samples must be shipped to the contract laboratory according to Department of Transportation standards. The method(s) of shipment, courier name, and other pertinent information should be entered in the “Received By” or “Remarks” section of the COC form. Coolers must be sealed with packing tape before shipping and must not leak. It is assumed that samples in tape-sealed ice chests are secure whether being transported by field staff vehicle, by common carrier, or by commercial package delivery. The laboratory’s sample receiving department will examine the shipment of samples for correct documentation, proper preservation and compliance with holding times. The following procedures are used to prevent bottle breakage and cross-contamination:
Bubble wrap or foam pouches are used to keep glass bottles from contacting one another to prevent breakage, re-sealable bags will be used if available.
All samples are transported inside hard plastic coolers or other contamination-free shipping containers.
The coolers are taped shut to prevent accidental opening. If arrangements are not made in advance, the laboratory’s sample receiving personnel must be
notified prior to sample shipment. All samples remaining after successful completion of analyses will be disposed of properly. It is the responsibility of the personnel of each analytical laboratory to ensure that all applicable regulations are followed in the disposal of samples or related chemicals. Samples will be stored and transported at less than 6°C. The containers containing the water samples for testing will be shipped to the toxicity testing laboratory for analysis. Samples will be sent to the toxicity testing laboratory priority overnight on the same day that the 24-hour composite sample collection process is completed. The individual sample containers containing the water samples for chemical analysis will be shipped to the analytical chemistry laboratory for analysis. Samples will be stored in coolers with ice and bubble wrap and delivered to the appropriate laboratory as indicated in Table E-14. Appropriate contacts are listed along with lab certification information.
Table E-14 Analytical Laboratories
Laboratory Analysis Shipping Method Contact Phone Address
Lab Certification No. & Expiration
Date1
TBD Toxicity, TIEs
Overnight delivery
TBD Inorganic Chemistry
Same day delivery
TBD Pesticides Overnight delivery
or Courier
- 140 -

Rio Hondo/San Gabriel River Water Quality Group Coordinated Integrated Monitoring Program
E.2.2.4 Chain-of Custody Forms Sample custody procedures provide a mechanism for documenting information related to sample collection and handling. Sample custody must be traceable from the time of sample collection until results are reported. A sample is considered under custody if:
It is in actual possession. It is in view after in physical possession. It is placed in a secure area (accessible by or under the scrutiny of authorized personnel only
after in possession). A COC form must be completed after sample collection and prior to sample shipment or release. The COC form, sample labels, and field documentation will be cross-checked to verify sample identification, type of analyses, number of containers, sample volume, preservatives, and type of containers. A complete chain-of-custody form is to accompany the transfer of samples to the analyzing laboratory. A typical chain-of-custody form is illustrated in Appendix 1. E.2.2.5 Laboratory Custody Procedures Contract laboratories will follow sample custody procedures as outlined in the laboratory’s Quality Assurance (QA) Manual. A copy of each contract laboratory’s QA Manual is available at the laboratory upon request. Laboratories shall maintain custody logs sufficient to track each sample submitted and to analyze or preserve each sample within specified holding times. The following sample control activities must be conducted at the laboratory:
Initial sample login and verification of samples received with the COC form; Document any discrepancies noted during login on the COC; Initiate internal laboratory custody procedures; Verify sample preservation (e.g., temperature); Notify the Project Manager if any problems or discrepancies are identified; and, Perform proper sample storage protocols, including daily refrigerator temperature monitoring and
sample security. Laboratories shall maintain records to document that the above procedures are followed. Once samples have been analyzed, samples will be stored at the laboratory for at least 30 days. After this period, samples may be disposed of properly. E.2.3 Field Protocols Briefly, the key aspects of quality control associated with sample collection for eventual chemical and toxicological analyses are as follows:
Field personnel will be thoroughly trained in the proper use of sample collection gear and will be able to distinguish acceptable versus unacceptable water samples in accordance with pre-established criteria.
Field personnel will be thoroughly trained to recognize and avoid potential sources of sample contamination (e.g., engine exhaust, ice used for cooling).
Sampling gear and utensils which come in direct contact with the sample will be made of non-contaminating materials (e.g., borosilicate glass, high-quality stainless steel and/or Teflon™, according to protocol) and will be thoroughly cleaned between sampling stations according to appropriate cleaning protocol (rinsing thoroughly with laboratory reagent water at minimum).
- 141 -

Rio Hondo/San Gabriel River Water Quality Group Coordinated Integrated Monitoring Program
Sample containers will be of the recommended type and will be free of contaminants (i.e., pre-
cleaned). Conditions for sample collection, preservation and holding times will be followed.
Field crews will be comprised of two persons per crew, minimum. For safety reasons, sampling will occur during daylight hours, when possible. Sampling events should proceed in the following manner:
1. Before leaving the sampling crew base of operations, confirm number and type of sample containers as well as the complete equipment list.
2. Proceed to the first sampling site. 3. Fill-out the general information on the field log sheet. 4. Collect the samples indicated on the event summary sheet in the manner described in the CIMP.
Collect additional volume and blank samples for field-initiated QA/QC samples, if necessary. Place filled sample containers in coolers and carefully pack and ice samples as described in the CIMP. Using the field log sheet, confirm that all appropriate containers were filled.
5. Collect field measurements and observations, and record these on the field log sheet. 6. Repeat the procedures in steps 3, 4, and 5 for each of the remaining sampling sites. 7. Complete the COC forms using the field log sheets. 8. After sample collection is completed, deliver and/or ship samples to appropriate laboratory.
E.2.4 Sample Collection All samples will be collected in a manner appropriate for the specific analytical methods to be used. The proper sampling techniques, outlined in this section, will ensure that the collected samples are representative of the water bodies sampled. Should field crews feel that it is unsafe to collect samples for any reason, the field crews SHOULD NOT COLLECT a sample and note on the field log that the sample was not collected, why the sample was not collected, and provide photo documentation, if feasible. E.2.4.1 Overview of Sampling Techniques As described below, the method used to collect water samples is dependent on the depth, flow and type of outfall. Nonetheless, in all cases:
1. Throughout each sample collection event, the sampler should exercise aseptic techniques to avoid any contamination (i.e., do not touch the inner surfaces or lip edges of the sample bottle or cap).
2. The sampler should collect a single representative grab sample. 3. The sampler should use clean, powder-free, nitrile gloves for each site to prevent contamination. 4. When collecting the sample, he or she should not breathe in the direction of the container. 5. Gloves should be changed if they are soiled or if the potential for cross-contamination exists from
handling sampling materials or samples. 6. While the sample is collected, the bottle lid shall not be placed on the ground. 7. No eating or drinking during sample collection. 8. No smoking. 9. Never sample near a running vehicle. Do not park vehicles in immediate sample collection area,
even non-running vehicles. 10. When the sample is collected leave ample air space (about 1 inch) in the bottle to facilitate
mixing by shaking for lab analysis. 11. After the sample is collected and the cap is tightly screwed back on the bottle, the time of
sampling should be recorded on the field tablet or log sheet.
- 142 -
Rio Hondo/San Gabriel River Water Quality Group Coordinated Integrated Monitoring Program
12. Any QA/QC samples that are collected, as specified in Section E.3, should be also be denoted
on the field log sheet or field tablet and labeled according the convention described in Section E.2.1.2.
13. Immerse samples in ice at least one third the height of the bottle. 14. Fill out COC form as described in Section E.2.2.4 and deliver to the appropriate lab within 6
hours of sample collection. Samples have a holding time of 6-hours from collection and a 2-hour sample processing time after arriving at the laboratory (total time of 8 hours; not to be exceeded).
To prevent contamination of samples, clean metal sampling techniques using USEPA protocols outlined in USEPA Method 16693 will be used throughout all phases of the sampling and laboratory work, including equipment preparation, sample collection, and sample handling, storage, and testing. All containers and test chambers will be acid-rinsed prior to use. Filled sample containers will be kept on ice until receipt at the laboratory. The protocol for clean metal sampling, based on USEPA Method 1669, is summarized below:
Samples are collected in rigorously pre-cleaned sample bottles with any tubing specially processed to clean sampling standards.
At least two persons, wearing clean, powder-free nitrile or latex gloves at all times, are required on a sampling crew.
One person, referred to as “dirty hands”, opens only the outer bag of all double-bagged sample bottles.
The other person, referred to as “clean hands”, reaches into the outer bag, opens the inner bag and removes the clean sample bottle.
Clean hands rinses the bottle at least two times by submerging the bottle, removing the bottle lid, filling the bottle approximately one-third full, replacing the bottle lid, gently shaking and then emptying the bottle. Clean hands then collects the sample by submerging the bottle, removing the lid, filling the bottle and replacing the bottle cap while the bottle is still submerged.
After the sample is collected, the sample bottle is double-bagged in the opposite order from which it was removed from the same double-bagging.
Clean, powder-free gloves are changed whenever something not known to be clean has been touched.
The time of sample collection is recorded on the field log sheet. To reduce potential contamination, sampling personnel will adhere to the following rules:
No smoking. Never sample near a running vehicle. Do not park vehicles in the immediate vicinity of the
sample collection area (even non-running vehicles). Do not eat or drink during sample collection. Do not breathe, sneeze or cough in the direction of an open sample bottle.
Each person on the field crew will wear clean clothing that is free of dirt, grease, or other substances that could contaminate the sampling apparatus or sample bottles.
3 USEPA. April 1995. Method 1669: Sampling Ambient Water for Trace Metals at EPA Water Quality Criteria Levels. EPA 821-R-95-034.
- 143 -

Rio Hondo/San Gabriel River Water Quality Group Coordinated Integrated Monitoring Program
E.2.5 Field Measurements and Observations Field measurements will be collected and observations made at each sampling site after a sample is collected. Field measurements will include the constituents identified in the CIMP for which a laboratory analysis is not being conducted. Field monitoring equipment must meet the requirements outlined in Table E-6. Field measurements for sediment samples shall be collected from within one meter of the sediment. All field measurement results and field observations will be recorded on a field log sheet similar to the one presented in and as described in Section E.2 of this Attachment. Measurements (except for flow) will be collected at approximately mid-stream, mid-depth at the location of greatest flow (if feasible) with a Hydrolab DS4 multi-probe meter, or comparable instrument(s). If at any time the collection of field measurements by wading appears to be unsafe, field crews will not attempt to collect mid-stream, mid-depth measurements. Rather, field measurements will be made either directly from a stable, unobstructed area at the channel edge, or by using a telescoping pole and intermediate container to obtain a sample for field measurements and for filling sample containers. For situations where flows are not sufficiently deep to submerge the probes, an intermediate container will be utilized. The location of field measurements will be documented on the field log sheet. Flow measurements will be collected as outlined in the following subsections at freshwater receiving water and non-stormwater outfall monitoring sites. Regardless of measurement technique used, if a staff gauge is present the gauge height will be noted. Field crews may not be able to measure flow at several sites during wet-weather because of inaccessibility of the site. If this is the case, site inaccessibility will be documented on the field log sheet. The field sampling crew has the primary responsibility for responding to failures in the sampling or measurement systems. Deviations from established monitoring protocols will be documented in the comment section of the field log sheet and noted in the post event summaries. If monitoring equipment fails, monitoring personnel will report the problem in the notes section of the field log sheet and will not record data values for the variables in question. Broken equipment will be replaced or repaired prior to the next field use. Data collected using faulty equipment will not be used. E.2.5.1 Velocity Meter Flow Measurements For sampling sites where water is deep enough (>0.1-foot) a velocity meter will be utilized. For these cases, velocity will be measured at approximately equal increments across the width of the flowing water using a Marsh-McBirney Flo-Mate® velocity meter4, which uses an electromagnetic velocity sensor. A “flow pole” will be used to measure the water depth at each measurement point and to properly align the sensor so that the depth of each velocity measurement is 0.6 * total depth, which is representative of the average velocity. The distance between velocity measurements taken across the stream is dependent on the total width. No more than 10% of the flow will pass through any one cross section. E.2.5.2 Shallow Sheet Flow Measurements If the depth of flow does not allow for the measurement of flow with a velocity meter (<0.1-foot) a “float” will be used to measure the velocity of the flowing water. The width, depth, velocity, cross section, and corresponding flow rate will be estimated as follows: Sheet flow width: The width (W) of the flowing water (not the entire part of the channel that is damp) is measured using a tape measure at the “top,” “middle,” and “bottom” of a marked-off distance –
4 For more information, see http://marsh-mcbirney.com/Products/2000.htm
- 144 -

Rio Hondo/San Gabriel River Water Quality Group Coordinated Integrated Monitoring Program
generally 10 feet (e.g., for a 10-foot marked-off section, WTop is measured at 0-feet, WMid is measured at 5 feet, and WBottom is measured at 10 feet). Sheet flow depth: The depth of the sheet flow is measured at the top, middle, and bottom of the marked-off distance. Specifically, the depth (D) of the sheet flow is measured at 25%, 50%, and 75% of the flowing width (e.g., DMid
50% is the depth of the water at middle of the section in the middle of the sheet flow) at each of the width measurement locations. It is assumed that the depth at the edge of the sheet flow (i.e., at 0% and 100% of the flowing width) is zero. Representative cross-section: Based on the collected depth and width measurements, the representative cross-sectional area across the marked-off sheet flow is approximated as follows:
Sheet flow velocity: Velocity is calculated based on the amount of time it took a float to travel the marked-off distance (typically 10-feet or more). Floats are normally pieces of leaves, litter, or floatables (suds, etc.). The time it takes the float to travel the marked-off distance is measured at least three times. Then average velocity is calculated as follows:
Average Surface Velocity = Distance Marked off for Float Measurement
Average Time for Float to Travel Marked off Distance Flow Rate calculation: For sheet flows, based on the above measurements/estimates, the estimated flow rate, Q, is calculated by:
Q = f x (Representative Cross Section) x (Average Surface Velocity) The coefficient f is used to account for friction effects of the channel bottom. That is, the float travels on the water surface, which is the most rapidly-traveling portion of the water column. The average velocity, not the surface velocity, determines the flow rate, and thus f is used to “convert” surface velocity to average velocity. In general, the value of f typically ranges from 0.60 – 0.90 (USGS 1982). Based on flow rate measurements taken during the LA River Bacteria Source Identification Study (CREST 2008) a value of 0.75 will be used for f. E.2.5.3 Free-Flowing Outfalls Some storm drain outfalls are free-flowing, meaning the runoff falls from an elevated outfall into the channel, which allows for collection of the entire flowing stream of water into a container of known volume (e.g., graduated bucket or graduated Ziploc bag). The time it takes to fill the known volume is measured using a stopwatch, and recorded on the field log. The time it takes to fill the container will be measured three times and averaged to ensure that the calculated discharge is representative. In some cases, a small portion of the runoff may flow around or under the container. For each measurement, “percent capture,” or the proportion of flow estimated to enter the bucket, will be recorded.
( ) ( )
( ) ( )
( ) ( ) }
{
)]2222
(4
[
)],2222
(4
[
)],2222
(4
[
Re
%75%50%75%25%50%25
%75%50%75%25%50%25
%75%50%75%25%50%25
BottomBottomBottomBottomBottomBottomBottom
MidMidMidMidMidMidMid
TopTopTopTopTopTopTop
DDDDDDW
DDDDDDW
DDDDDDWAverage
SectionCrossvepresentati
++
++
+×
++
++
+×
++
++
+×
=
- 145 -
Rio Hondo/San Gabriel River Water Quality Group Coordinated Integrated Monitoring Program
For free-flowing outfalls, the estimated flow rate, Q, is calculated by:
Based on measurements of free-flowing outfalls during the LA River Bacteria Source Identification Study (CREST 2008), estimated capture typically ranges from 0.75 – 1.0. E.2.6 Receiving Water Sample Collection A grab sample is a discrete individual sample. A composite sample is mixture of grab samples collected over a period of time either as time or flow weighted. A time weighted composite is created by mixing multiple aliquots collected at specified time intervals. A flow weighted composite is created by mixing multiple aliquots collected at equal time intervals but then mixed based on flow rate. Composite samples are generally considered to be more representative of a given time period and varying conditions over that time period, whereas grab samples represent an instant in time. Because composite samples are more representative of a given time period they are generally used to develop an understanding of pollutant loadings. In the case of TMDL monitoring, allocations in water are primarily set as concentrations which are considered over varying averaging periods (1 hour, 4-day, and 30-day). A composite sample collected over the averaging period timeframe would allow for a direct comparison to allocations. However, there is varying averaging periods for the same constituents that would require multiple composite samples and there are real logistical and hold time issues faced in collection of composites over a 4 or 30-day period. Composite samples will be used for wet-weather sample collection because they provide a better representation of the changing storm conditions. Grab samples will be used for dry-weather sampling events, because the composition of the receiving water will change less over time and thus the grab sample can sufficiently characterize it. Grab samples will be collected at approximately mid-stream, mid-depth at the location of greatest flow (where feasible) by direct submersion of the sample bottle. This is the preferred method for grab sample collection; however, due to monitoring site configurations and safety concerns, direct filling of sample bottles may not always be feasible, especially during wet events. Monitoring site configuration will dictate grab sample collection technique. Grab samples will be collected directly into the appropriate bottles whenever feasible (containing the required preservatives). Clean, powder-free nitrile gloves will be worn while collecting samples. In the event that a peristaltic pump and priority-cleaned silicone and Teflon™ tubing are used as a last resort to collect samples (i.e., due to unsafe conditions during wet events), the sample collection tubing and the sample bottle and lid shall come into contact only with surfaces known to be clean, or with the water sample. Standard operating procedures (SOPs) for collection of surface water samples are provided in Section E.2.5. The potential exists for monitoring sites to lack discernable flow. The lack of discernable flow may generate unrepresentative data. To address the potential confounding interference that can occur under such conditions, sites sampled should be assessed for the following conditions and sampled or not sampled accordingly:
Pools of water with no flow or visible connection to another surface water body should not be sampled. The field log should be completed for non-water quality data (including date and time of visit) and the site condition should be photo-documented.
])()(
[CaptureEstimatedContainerFilltoTime
VolumecontainerFilledAverageQ×
=
])()(
[CaptureEstimatedContainerFilltoTime
VolumecontainerFilledAverageQ×
=
- 146 -

Rio Hondo/San Gabriel River Water Quality Group Coordinated Integrated Monitoring Program
Flowing water (i.e., based on visual observations, flow meter data, and a photo-documented
assessment of conditions immediately upstream and downstream of the sampling site) site should be sampled.
It is the combined responsibility of all members of the sampling crew to determine if the performance requirements of the specific sampling method have been met, and to collect additional samples if required. If the performance requirements outlined above or documented in sampling protocols are not met, the sample will be re-collected. If contamination of the sample container is suspected, a fresh sample container will be used. The Project Manager will be contacted if at any time the sampling crew has questions about procedures or issues based on site-specific conditions. E.2.6.1 Direct Submersion: Hand Technique Where practical, all grab samples will be collected by direct submersion at mid-stream, mid-depth using the following procedures.
1. Wear clean powder-free nitrile gloves when handling containers and lids. Change gloves if soiled or if the potential for cross-contamination occurs from handling sampling materials or samples.
2. Use pre-labeled sample containers as described in the Sample Container Labeling section. 3. Remove the lid, submerge the container to mid-stream/mid-depth, let the container fill and
secure the lid. 4. Place the sample on ice. 5. Collect the remaining samples including quality control samples, if required, using the same
protocols described above. 6. Fill out the COC form, note sample collection time on the field log sheet, and deliver samples to
the appropriate laboratory. E.2.6.2 Intermediate Container Technique Samples may be collected with the use of a specially cleaned intermediate container, if necessary, following the steps listed below. A secondary container may include a container that is similar in composition to the sample container or a pre-cleaned pitcher made of the same material as the sample container.
1. Wear clean powder-free nitrile gloves when handling bottles and lids. Change gloves if soiled or if the potential for cross-contamination occurs from handling sampling materials or samples.
2. Use pre-labeled sample containers as described in the Sample Container Labeling section. 3. Submerge the intermediate container to mid-stream/mid-depth (if possible), let the container fill,
and quickly transfer the sample into the individual sample container(s) and secure the lid(s). 4. Place the sample(s) on ice. 5. Collect remaining samples including quality control samples, if required, using the same protocols
described above. 6. Fill out the COC form, note sample collection time on the field log sheet, and deliver the samples
to the appropriate laboratory. Some flows may be too shallow to fill a container without using an intermediate container. When collecting samples from shallow sheet flows it is very important to not scoop up algae, sediment, or other particulate matter on the bottom because such debris is not representative of flowing water. To prevent scooping up such debris either: (1) find a spot where the bottom is relatively clean and allow the sterile intermediate container to fill without scooping; or (2) lay a clean sterile Ziploc® bag on the bottom and collect the water sample from on top of the bag. A fresh Ziploc® bag must be used at each site.
- 147 -

Rio Hondo/San Gabriel River Water Quality Group Coordinated Integrated Monitoring Program
E.2.6.3 Pumping The use of a peristaltic pump is not anticipated to be necessary at the CIMP sites; however, information is included here in case pump use becomes necessary due to safety concerns. Samples may be collected with the use of a peristaltic pump and specially cleaned tubing following the steps listed below.
1. Wear clean powder-free nitrile gloves when handling bottles, lids, and pump tubing. Change gloves if soiled or if the potential for cross-contamination occurs from handling sampling materials or samples;
2. Use pre-labeled sample containers as described in the Sample Container Labeling section; 3. Attach pre-cleaned tubing into the pump, exercising caution to avoid allowing tubing ends to
touch any surface known not to be clean. A separate length of clean tubing must be used at each sample location for which the pump is used;
4. Place one end of the tubing below the surface of the water. To the extent possible, avoid placing the tubing near the bottom of the channel so that settled solids are not pumped into the sample container.
5. Hold the other end of the tubing over the opening of the sample container, exercising care not to touch the tubing to the sample container.
6. Pump the necessary sample volume into the sample container and secure the lid; 7. Place the sample on ice; 8. Collect remaining samples including quality control samples, if required, using the same protocols
described above; and 9. Fill out the COC form, note sample collection time on the field log sheet, and deliver the samples
to appropriate laboratory. E.2.6.4 Autosamplers Automatic sample compositors are used to characterize the entire flow of a storm in one analysis. They can be programmed to take aliquots at either time or flow based specified intervals. To setup and install an automatic compositor it is recommended to read the manufacturer’s instructions, before beginning setup in the field. The general steps to setup the sampler are described below.
1. Connect power source to automatic sampling computer. This can be in the form of a battery or a power cable.
2. Install pre-cleaned tubing into the pump. Teflon coated tubing will be used from the sample intake to the peristaltic pump and silicon tubing will be used inside the peristaltic pump. Clean tubing will be used at each site and for each event, in order to minimize contamination.
3. Attach strainer to intake end of the Teflon tubing and install in sampling channel. 4. If running flow based composite samples; install flow sensor in sampling channel and connect it
to the automatic compositor. 5. Install and label composite bottle. If sampler is not refrigerated, then add enough ice to the
composite bottle chamber to keep sample cold for the duration of sampling. Make sure not to contaminate the inside of the composite bottle with any of the ice.
6. Program the sampler as to the manufacturer’s instructions and make sure sampler is powered and running before leaving the site.
After the sample collection is completed the following steps must be taken to ensure proper sample handling.
1. Upon returning to the site, check the status of the sampler and record any errors or missed samples. Note on the field log the time of the last sample, as this will be used for filling out the COCs.
- 148 -
Rio Hondo/San Gabriel River Water Quality Group Coordinated Integrated Monitoring Program
2. Remove composite bottle and store on ice at <6°C. If dissolved metals are required then begin
the sample filtration process outlined in Section E.2.6.5, within 15 minutes of the last composite sample.
3. Power down automatic compositor and leave sampling site. 4. The composite sample will need to be split into the separate analysis bottles before being
shipped to the laboratory. This is best done in a clean and weatherproof environment, using clean sampling technique.
E.2.6.5 Dissolved Metals Field Filtration When feasible, samples for dissolved metals will be filtered in the field. The following describes an appropriate dissolved field filtration method. An alternative an equivalent method may be utilized, if necessary. A 50 mL plastic syringe with a 0.45 µm filter attached will be used to collect and filter the dissolved metals sample in the field. The apparatus will either come certified pre-cleaned from the manufacturer and confirmed by the analytical laboratory or be pre-cleaned by and confirmed by the analytical laboratory at least once per year. The apparatus will be double bagged in Ziploc plastic bags. To collect the sample for dissolved metals, first collect the total metals sample using clean sampling techniques. The dissolved sample will be taken from this container. Immediately prior to collecting the dissolved sample, shake the total metals sample. To collect the dissolved metals sample using clean sampling techniques, remove the syringe from the bag and place the tip of the syringe into the bottle containing the total metals sample and draw up 50 mL of sample into the syringe. Next, remove the filter from the zip-lock bag and screw it tightly into the tip of the syringe. Then put the tip of the syringe with the filter into the clean dissolved metals container and push the sample through the filter taking care not to touch the inside surface of the sample container with the apparatus. The sample volume needs to be a minimum of 20 mL. If the filter becomes clogged prior to generating 20 mL of sample, remove and dispose of the used filter and replace it with a new clean filter (using the clean sampling techniques). Continue to filter the sample. When 20 mL has been collected, cap the sample bottle tightly and store on ice for delivery to the laboratory. E.2.7 Stormwater Outfall Sample Collection Stormwater outfalls will be monitored with similar methods as discussed in the receiving water sampling section. Sampling will not be undertaken if the outfalls are not flowing or if conditions exist where the receiving water is back-flowing into the outfall. It is the combined responsibility of all members of the sampling crew to determine if the performance requirements of the specific sampling method have been met, and to collect additional samples if required. If the performance requirements outlined above or documented in sampling protocols are not met, the sample will be re-collected. If contamination of the sample container is suspected, a fresh sample container will be used. The Project Manager will be contacted if at any time the sampling crew has questions about procedures or issues based on site-specific conditions. E.2.7.1 Free-Flowing Outfalls For outfalls that are free-flowing, the sterile bottle is immersed in the flowing water and allowed to fill. The bottle should not be scraped against the side of the channel or any other structure near the flowing water. If the outfall cannot be reached safely by immersing the bottle by hand, a grab pole can be used instead. When using a grab pole, ensure that the sample container is properly attached.
- 149 -
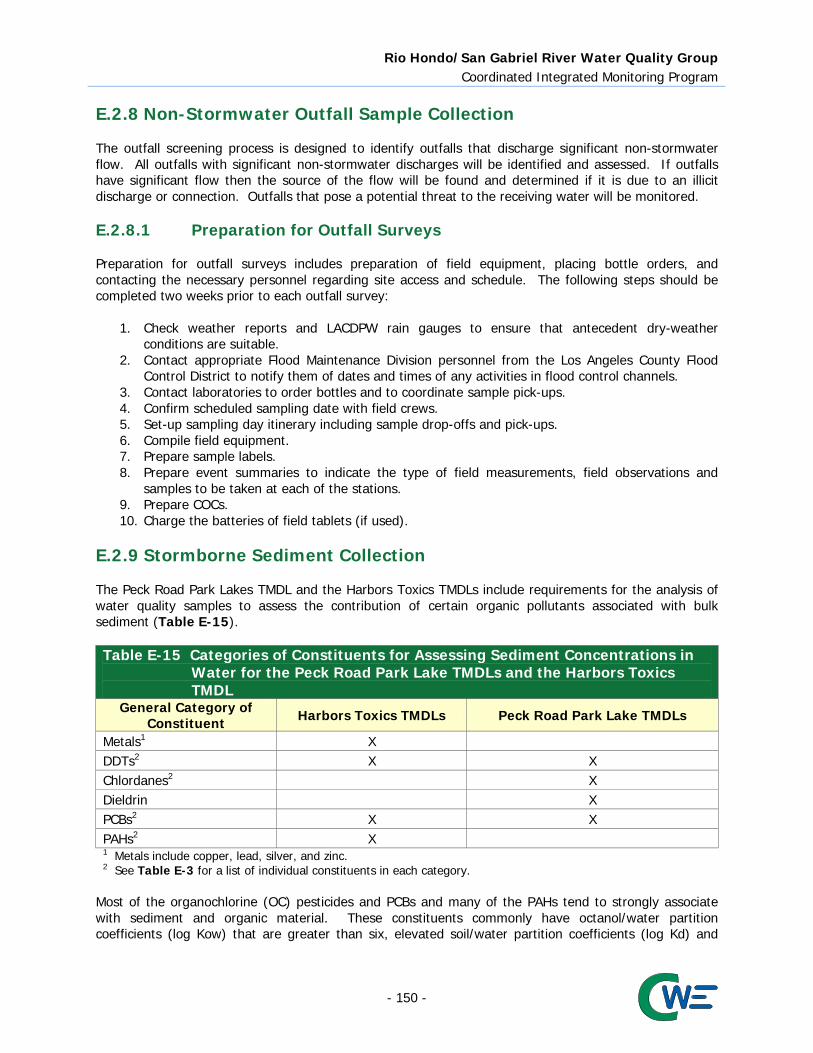
Rio Hondo/San Gabriel River Water Quality Group Coordinated Integrated Monitoring Program
E.2.8 Non-Stormwater Outfall Sample Collection The outfall screening process is designed to identify outfalls that discharge significant non-stormwater flow. All outfalls with significant non-stormwater discharges will be identified and assessed. If outfalls have significant flow then the source of the flow will be found and determined if it is due to an illicit discharge or connection. Outfalls that pose a potential threat to the receiving water will be monitored. E.2.8.1 Preparation for Outfall Surveys Preparation for outfall surveys includes preparation of field equipment, placing bottle orders, and contacting the necessary personnel regarding site access and schedule. The following steps should be completed two weeks prior to each outfall survey:
1. Check weather reports and LACDPW rain gauges to ensure that antecedent dry-weather conditions are suitable.
2. Contact appropriate Flood Maintenance Division personnel from the Los Angeles County Flood Control District to notify them of dates and times of any activities in flood control channels.
3. Contact laboratories to order bottles and to coordinate sample pick-ups. 4. Confirm scheduled sampling date with field crews. 5. Set-up sampling day itinerary including sample drop-offs and pick-ups. 6. Compile field equipment. 7. Prepare sample labels. 8. Prepare event summaries to indicate the type of field measurements, field observations and
samples to be taken at each of the stations. 9. Prepare COCs. 10. Charge the batteries of field tablets (if used).
E.2.9 Stormborne Sediment Collection The Peck Road Park Lakes TMDL and the Harbors Toxics TMDLs include requirements for the analysis of water quality samples to assess the contribution of certain organic pollutants associated with bulk sediment (Table E-15). Table E-15 Categories of Constituents for Assessing Sediment Concentrations in
Water for the Peck Road Park Lake TMDLs and the Harbors Toxics TMDL
General Category of Constituent Harbors Toxics TMDLs Peck Road Park Lake TMDLs
Metals1 X DDTs2 X X Chlordanes2 X Dieldrin X PCBs2 X X PAHs2 X 1 Metals include copper, lead, silver, and zinc. 2 See Table E-3 for a list of individual constituents in each category.
Most of the organochlorine (OC) pesticides and PCBs and many of the PAHs tend to strongly associate with sediment and organic material. These constituents commonly have octanol/water partition coefficients (log Kow) that are greater than six, elevated soil/water partition coefficients (log Kd) and
- 150 -

Rio Hondo/San Gabriel River Water Quality Group Coordinated Integrated Monitoring Program
elevated soil adsorption coefficients (log Koc). The lighter weight PAHs such as naphthalene, acenaphthene and acenaphthylene tend to be more soluble in water and volatile. Concentrations of OC pesticides, PCBs, and PAHs are often below or are very close to the limits of detection for conventional analytical methods used for analyzing water samples. Although collection and filtration of high volumes of stormwater will allow improved quantification of these constituents, it also introduces substantial potential for introduction of errors. Use of filtration methods in combination with conventional analytical methods requires collection of large volumes of stormwater and a filtration processes to obtain the suspended sediment from the water column. Use of conventional analytical methods for analysis of the filtered sediment is then expected to require at least 5 grams of sediment (typically 10 grams is preferred by laboratories) for each of the groups of analytes (metals, OC pesticides, PCBs and PAHs) to achieve detection limits necessary to quantify loads. Efforts by the City of Los Angeles and Los Angeles County in the Ballona Creek and Marina del Rey watersheds, respectively, have demonstrated the challenges associated with collecting and analyzing suspended sediments. Assuming samples contain sediment at an average TSS concentration of 100 mg/L and that all sediment could be recovered, analyses might require as much as 50 liters for each test method (total of 200 liters). An ongoing special study is underway in Marina del Rey to evaluate a passive method for capturing sufficient sediment to conduct analysis. In Ballona Creek, the City of Los Angeles has been successful in collecting sufficient volumes of sediment over the course of a year to conduct the analysis. This allows for the quantification of annual loading; however, it does not allow for an evaluation of concentrations and loads under various storm conditions. Although use of lower sediment volumes may be possible, both detection limits and quality control measures might be impacted. In Ballona Creek, duplicate and quality control analysis have been limited to the available sediment, resulting in situations where either certain target constituents or quality control analysis are not completed. Alternatively, a High Resolution Mass Spectrometry (HRMS) analyses5 may be used to provide lower detection levels. However, the HRMS process is eventually an experimental method and only would be used if determined by the RH/SGRWQG to be acceptable. HRMS analyses are quantified by isotope dilution techniques. Analytical performance is measured by analysis of Ongoing Precision and Recovery (OPR) analyses and labeled compound recovery. Analysis of laboratory blanks address concerns of false positives. In addition, these extremely low detection limits can be achieved with as little as 3-6 liters of stormwater. These test methods provide detection limits that are roughly 100 times more sensitive than conventional analytical methods. The HRMS may be preferable where the conventional methods for analyzing the metals of interest are found to not be sufficiently sensitive to assess concentrations on suspended sediments. Change in methods will be discussed in the commensurate annual report as outlined in CIMP Section 10. For purposes of load calculations, it would be assumed that 100% of OC pesticides, PCBs and PAHs were associated with suspended solids. Separate analyses of TSS would be used to normalize the data. After three years (approximately four to six storm events) the data will be reevaluated to assess whether continued use of the HRMS approach remains to be beneficial. If deemed necessary, a modified approach will be evaluated for analysis of filtered suspended sediments. E.2.9.1 Sampling and Analytical Procedures Stormwater samples for the Peck Road Park Lake TMDLs and the Harbors Toxics TMDLs will be collected using autosamplers as described in Section E.2.6.4. Based on TSS measurements at three mass emission sites in Los Angeles County (Table E-16), use of a TSS concentration of 100 mg/L is expected
5 This approach will match the methods to compounds to analyze for OC pesticides (USEPA 1699), PCBs (USEPA 1668) and PAHs (CARB).
- 151 -
Rio Hondo/San Gabriel River Water Quality Group Coordinated Integrated Monitoring Program
to provide a conservative basis for estimating reporting limits for OC pesticides, PCBs, and PAHs in suspended sediments based upon 1-liter samples. However, two liters of stormwater will be provided for each organic analytical suite for a total of six liters. An accurate measure of suspended sediments is critical to this sampling approach. TSS will be used as the standard for calculating the concentrations of target constituents in suspended sediments and total loads. Since detection limits will depend upon the concentration of suspended sediment in the sample, the laboratory analyzing the suspended sediment concentrations will be asked to provide a rush analysis to provide information that can be used to direct processing of the samples for the organic compounds. If TSS is less than 150 mg/L, two liters will be extracted for subsequent HRMS analysis. If TSS concentrations are between 150 and 200 mg/L, one of the additional liter samples may be used to increase the volume of sample water for just PAHs or the additional liter may be used as a field duplicate for each analysis. If TSS concentrations are greater than 200 mg/L, the additional liter may be used as a field duplicate for each analysis. If the initial TSS sample indicates that sediment content is less than 50 mg/L, additional measures will be taken to improve PAH reporting limits with respect to suspended sediment loads. A field duplicate from one site will be analyzed if adequate sample volumes are obtained. Target reporting limits (Table E-17 and Table E-18) were established based upon bed sediment reporting limits listed in the Coordinated Compliance and Reporting Plan for the Greater Los Angeles and Long Beach Harbor Waters (Anchor QEA, 2013). Table E-17 and Table E-18 provide a summary of the detection limits attainable in water samples using HRMS analytical methods. Estimated detection limits are provided for concentrations of the target constituents in suspended sediments given the assumption that suspended sediment content of the water sample is 100 mg/L and that 100 percent of the target constituents are associated with the suspended sediment. This provides a conservative assumption with respect to evaluating the potential impacts of concentrations of OC pesticides, PCBs, and PAHs in suspended sediment on concentrations in bed sediment. Additionally, Table E-17 and Table E-18 present relevant TMDL targets and reporting limits suggested in the SWAMP QAPP (SWRCB, 2008) and the SQO Technical Support Manual (SCCWRP, 2009). The following summarizes a comparison between the estimated detection limits for OC pesticides, PCBs, and PAHs in the suspended sediments to target reporting limits:
For OC pesticides (Table E-17), estimated detection limits in the suspended sediment are at or below TMDL targets limits for bed sediments, except for dieldrin. The dieldrin estimated detection limit is above the lowest TMDL target, but not the remaining TMDL targets, and is below observed concentrations reported in the TMDL staff reports. Additionally, estimated detection limits in the suspended sediment are below target bed sediment reporting limits for this CIMP and target reporting limits presented in the SWAMP QAPP (SWRCB, 2008) and the SQO Technical Support Manual (SCCWRP, 2009), except for dieldrin. Dieldrin is above the bed sediment reporting limit in this CIMP, but below target reporting limits presented in the SWAMP QAPP (SWRCB, 2008) and the SQO Technical Support Manual (SCCWRP, 2009).
For PCBs (Table E-17), estimated detection limits in the suspended sediment are below TMDL targets limits for bed sediments. Additionally, estimated detection limits in the suspended sediment are at or below target bed sediment reporting limits for this CIMP and below target reporting limits presented in the SWAMP QAPP (SWRCB, 2008) and the SQO Technical Support Manual (SCCWRP, 2009).
For PAHs (Table E-18), estimated detection limits in the suspended sediment are below TMDL targets limits for bed sediments. Most individual PAH compounds would be expected to be detectable in the suspended sediment at concentrations about 2.5 times greater that the target bed sediment reporting limits for this CIMP and the target reporting limits presented in the SWAMP QAPP (SWRCB, 2008). Approximately half of the individual PAH compounds are above the target reporting limits presented in the SQO Technical Support Manual (SCCWRP, 2009), while the other half are below. Two compounds, naphthalene and phenanthrene, would have
- 152 -

Rio Hondo/San Gabriel River Water Quality Group Coordinated Integrated Monitoring Program
detection limits roughly 6 times the target bed sediment reporting limits for this CIMP. Naphthalene is an extremely light weight PAH that is not considered a major analyte of concern in storm water.
As noted previously, metals of interest are quantifiable with standard analytical methods. Detection limits for trace metals (Table E-2) are suitable for calculation of concentrations in suspended solids and the concentration of trace metals associated with the particulate fraction will be calculated as:
CP=CT-CD where CT =Concentration of total recoverable metals CD =Concentration of dissolved fraction CP =Concentration of the particulate fraction
USEPA’s guidance document for development of metals translators (EPA, 1996) uses the same approach for calculation of the trace metals in the particulate fraction. In summary, all but one of the target reporting limits are below relevant TMDL targets and the overwhelming majority are below bed sediment reporting limits identified in this CIMP and the SWAMP QAPP (SWRCB, 2008) and SQO Technical Support Manual (SCCWRP, 2009). The approach to analyzing whole water samples to estimate concentrations of target pollutants on bed sediment provides an opportunity to improve the understanding of loads during multiple storms each year, while simultaneously resolving the concentration levels necessary to determine compliance with WLAs. Table E-16 Summary of Median TSS Measurements (mg/L) at Two Mass Emission
Monitoring Sites in Los Angeles County Water Body Los Angeles County Monitoring Site ID Median
Los Angeles River S10 143 San Gabriel River S14 113
- 153 -
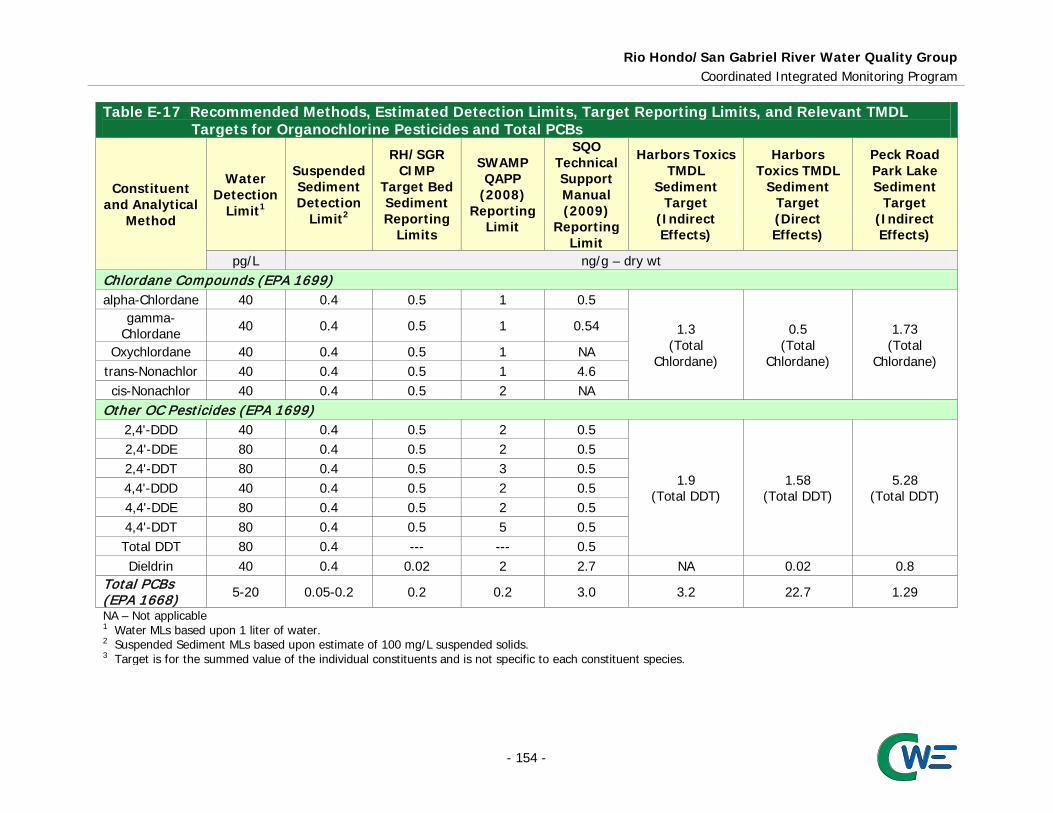
Rio Hondo/San Gabriel River Water Quality Group Coordinated Integrated Monitoring Program
Table E-17 Recommended Methods, Estimated Detection Limits, Target Reporting Limits, and Relevant TMDL
Targets for Organochlorine Pesticides and Total PCBs
Constituent and Analytical
Method
Water Detection
Limit1
Suspended Sediment Detection
Limit2
RH/SGR CIMP
Target Bed Sediment Reporting
Limits
SWAMP QAPP
(2008) Reporting
Limit
SQO Technical Support Manual (2009)
Reporting Limit
Harbors Toxics TMDL
Sediment Target
(Indirect Effects)
Harbors Toxics TMDL
Sediment Target (Direct Effects)
Peck Road Park Lake Sediment
Target (Indirect Effects)
pg/L ng/g – dry wt Chlordane Compounds (EPA 1699) alpha-Chlordane 40 0.4 0.5 1 0.5
1.3 (Total
Chlordane)
0.5 (Total
Chlordane)
1.73 (Total
Chlordane)
gamma-Chlordane 40 0.4 0.5 1 0.54
Oxychlordane 40 0.4 0.5 1 NA trans-Nonachlor 40 0.4 0.5 1 4.6 cis-Nonachlor 40 0.4 0.5 2 NA
Other OC Pesticides (EPA 1699) 2,4'-DDD 40 0.4 0.5 2 0.5
1.9 (Total DDT)
1.58 (Total DDT)
5.28 (Total DDT)
2,4'-DDE 80 0.4 0.5 2 0.5 2,4'-DDT 80 0.4 0.5 3 0.5 4,4'-DDD 40 0.4 0.5 2 0.5 4,4'-DDE 80 0.4 0.5 2 0.5 4,4'-DDT 80 0.4 0.5 5 0.5 Total DDT 80 0.4 --- --- 0.5 Dieldrin 40 0.4 0.02 2 2.7 NA 0.02 0.8
Total PCBs (EPA 1668) 5-20 0.05-0.2 0.2 0.2 3.0 3.2 22.7 1.29
NA – Not applicable 1 Water MLs based upon 1 liter of water. 2 Suspended Sediment MLs based upon estimate of 100 mg/L suspended solids. 3 Target is for the summed value of the individual constituents and is not specific to each constituent species.
- 154 -

Rio Hondo/San Gabriel River Water Quality Group Coordinated Integrated Monitoring Program
Table E-18 Estimated Detection Limits, Target Reporting Limits, and Relevant TMDL Targets for PAHs
Constituent
Water Detection
Limit1
Suspended Sediment Detection
Limit2
RH/SGR CIMP Target Bed Sediment
Reporting Limits
SWAMP QAPP (2009)
Reporting Limit
SQO Technical Support Manual Reporting Limit
Harbors Toxics TMDL Sediment
Target (Direct Effects)
pg/L ng/g – dry wt 1-Methylnaphthalene 5 50 20 20 20
552 (Low Weight)3
1700
(High Weight)3
4700 (Total PAHs)
1-Methylphenanthrene 5 50 20 20 20 2-Methylnaphthalene 5 50 20 20 20
2,6-Dimethylnaphthalene 5 50 20 20 20 Acenaphthene 5 50 20 20 20
Anthracene 5 50 20 20 20 Benzo(a)anthracene 5 50 20 20 80
Benzo(a)pyrene 5 50 20 20 80 Benzo(e)pyrene 5 50 20 20 80
Biphenyl 5 50 20 20 20 Chrysene 5 50 20 20 80
Dibenz(a,h)anthracene 5 50 20 20 80 Fluoranthene 5 50 20 20 80
Fluorene 5 50 20 20 20 Naphthalene 12.5 125 20 20 20
Perylene 5 50 20 20 80 Phenanthrene 12.5 125 20 20 20
Pyrene 5 50 20 20 80 NA – Not applicable 1 Water MLs based upon 1 liter of water and CARB 429m. Detection limits are based upon a final extract of 500 µL. If the SSC is low, either an additional liter
of water can be extracted to halve the detection limit or the final extract volume can be reduced. Depending on sample characteristics, the extract volume can be reduced to as little as 50-100 µL which would drop MLs by a factor of 0.1 to 0.2 times the listed ML.
2 Suspended Sediment MLs based upon estimate of 100 mg/L suspended solids. 3 Low Molecular Weight PAHs Low weight PAHs include Acenaphthene, Anthracene, Phenanthrene, Biphenyl, Naphthalene, 2,6-dimethylnaphthalene, Fluorene,
1-methylnaphthalene, 2-methylnaphthalene, 1-methylphenanthrene, High Molecular Weight PAHs: Benzo(a)anthracene, Benzo(a)pyrene, Benzo(e)pyrene, Chrysene, Dibenz(a,h)anthracene, Fluoranthene, Perylene, Pyrene.
- 155 -

Rio Hondo/San Gabriel River Water Quality Group Coordinated Integrated Monitoring Program
E.2.9.2 Sediment Sample Collection in Lakes The top layer of sediment will be sampled from the bottom of the lake using an Eckman dredge or a similar device. While on a boat, the field crew will drop the Eckman dredge to the bottom of the lake and obtain a sample. Using a pre-cleaned stainless steel trowel, the field crew will scoop the top two to three centimeters of the sample and place it in a clean polyethylene bag. This procedure will be repeated, carefully to as not sample the exact same location, and the final composited sample will be mixed and placed into the appropriate sample jars. E.2.10 Bioaccumulation Sample Collection – Freshwater Reaches Bioaccumulation sampling will be used to monitor trends in the concentration of contaminants in the tissues of aquatic organisms. This will be conducted in order to assess both ecological and human health concerns and to see if the trends or patterns of contaminant concentrations mirror those observed from the sediment analyses. Human health concerns will be assessed by sampling the tissues from fish species that are commonly taken for consumption by sport fisherman. Fish sampling protocols shall be conducted in accordance with the California Office of Environmental Health Hazard Assessment’s (OEHHA) General Protocol for Sport Fish Sampling and Analysis. Fish may be analyzed, as individuals (preferred) or as composites (secondary). During each survey, the goal will be to collect at least nine fish per targeted species that are of legal size and/or edible size6. If fish are analyzed as composite samples, each composite sample shall include a minimum of three fish, with up to five fish per sample preferred, especially if smaller fish are caught (OEHHA, 2005). All fish composite samples must follow OEHHA’s “75 percent rule,” where the length of the smallest fish should be at least 75% of the length of the largest fish of a species in a composite sample. Fish sampling techniques may vary due to season, weather, flow rate, target species, etc. Sport fish may be taken by hook and line or seine. Sampling gear may include electrofishing boats, backpack electrofishers, seine nets, gill nets, trap nets, hook and line, or other equipment as required. Reasonable attempts will be made to collect two to three species of sport fish; but, if sport fish cannot be obtained, whatever species of fish, if any, that can be obtained will be collected and analyzed. However, data collected from species that are not typically consumed will be for informational purposes only and not considered representative of human health exposures. The more likely a species is to be consumed by anglers, the greater the importance of information. E.2.11 Trash Monitoring E.2.11.1 LA River Trash TMDL The following subsections describe the monitoring approaches for the trash TMDLs within the RH/SGRWQG EWMP area: Los Angeles River Trash TMDL and the Peck Road Park Lake Trash TMDL. The following RH/SGRWQG members are implementing the Los Angeles River Trash TMDL through the installation of full capture devices: County of Los Angeles and Cities of Arcadia, Bradbury, Duarte, Monrovia, and Sierra Madre. No specific monitoring is required or will be conducted for the LA River Trash TMDLs for these jurisdictions. The full capture approach is also being implemented within the drainage area of Peck Road Park Lake, thereby addressing the requirements of the Peck Road Park Lake Trash TMDL, including the monitoring requirements.
6 The Department of Fish and Wildlife (DFW) Sport Fishing Regulations define legal size requirements using total length. All size measurements are in terms of total length.
- 156 -
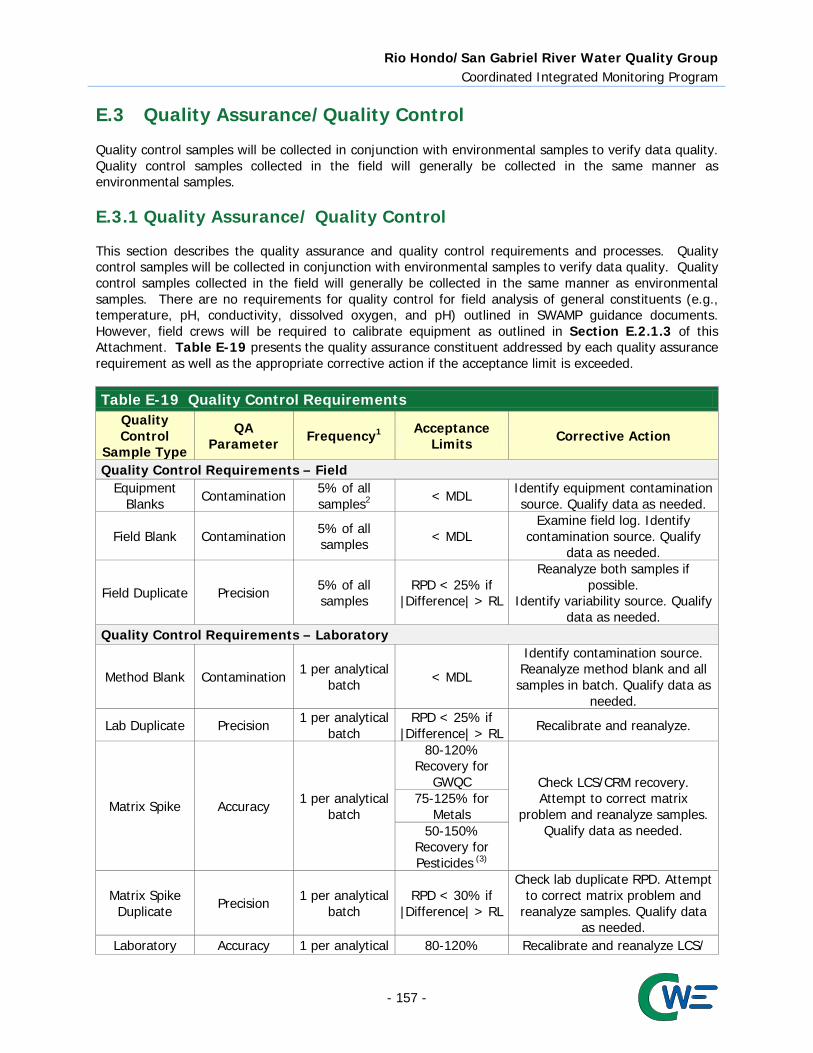
Rio Hondo/San Gabriel River Water Quality Group Coordinated Integrated Monitoring Program
E.3 Quality Assurance/Quality Control Quality control samples will be collected in conjunction with environmental samples to verify data quality. Quality control samples collected in the field will generally be collected in the same manner as environmental samples. E.3.1 Quality Assurance/ Quality Control This section describes the quality assurance and quality control requirements and processes. Quality control samples will be collected in conjunction with environmental samples to verify data quality. Quality control samples collected in the field will generally be collected in the same manner as environmental samples. There are no requirements for quality control for field analysis of general constituents (e.g., temperature, pH, conductivity, dissolved oxygen, and pH) outlined in SWAMP guidance documents. However, field crews will be required to calibrate equipment as outlined in Section E.2.1.3 of this Attachment. Table E-19 presents the quality assurance constituent addressed by each quality assurance requirement as well as the appropriate corrective action if the acceptance limit is exceeded.
Table E-19 Quality Control Requirements Quality Control
Sample Type
QA Parameter Frequency1 Acceptance
Limits Corrective Action
Quality Control Requirements – Field Equipment
Blanks Contamination 5% of all samples2 < MDL Identify equipment contamination
source. Qualify data as needed.
Field Blank Contamination 5% of all samples < MDL
Examine field log. Identify contamination source. Qualify
data as needed.
Field Duplicate Precision 5% of all samples
RPD < 25% if |Difference| > RL
Reanalyze both samples if possible.
Identify variability source. Qualify data as needed.
Quality Control Requirements – Laboratory
Method Blank Contamination 1 per analytical batch < MDL
Identify contamination source. Reanalyze method blank and all samples in batch. Qualify data as
needed.
Lab Duplicate Precision 1 per analytical batch
RPD < 25% if |Difference| > RL Recalibrate and reanalyze.
Matrix Spike Accuracy 1 per analytical batch
80-120% Recovery for
GWQC Check LCS/CRM recovery. Attempt to correct matrix
problem and reanalyze samples. Qualify data as needed.
75-125% for Metals
50-150% Recovery for Pesticides (3)
Matrix Spike Duplicate Precision 1 per analytical
batch RPD < 30% if
|Difference| > RL
Check lab duplicate RPD. Attempt to correct matrix problem and
reanalyze samples. Qualify data as needed.
Laboratory Accuracy 1 per analytical 80-120% Recalibrate and reanalyze LCS/
- 157 -

Rio Hondo/San Gabriel River Water Quality Group Coordinated Integrated Monitoring Program
Table E-19 Quality Control Requirements Quality Control
Sample Type
QA Parameter Frequency1 Acceptance
Limits Corrective Action
Control Sample (or
CRM or Blank Spike)
batch Recovery for GWQC
CRM and samples.
75-125% for Metals
50-150% Recovery for Pesticides (3)
Blank Spike Duplicate Precision 1 per analytical
batch RPD < 25% if
|Difference| > RL
Check lab duplicate RPD. Attempt to correct matrix problem and
reanalyze samples. Qualify data as needed.
Surrogate Spike
(Organics Only)
Accuracy
Each environmental
and lab QC sample
30-150% Recovery3
Check surrogate recovery in LCS. Attempt to correct matrix
problem and reanalyze sample. Qualify data as needed.
MDL = Method Detection Limit RL = Reporting Limit RPD = Relative Percent Difference LCS = Laboratory Control Sample/Standard CRM = Certified/ Standard Reference Material GWQC = General Water Quality Constituents 1 “Analytical batch” refers to a number of samples (not to exceed 20 environmental samples plus the associated
quality control samples) that are similar in matrix type and processed/prepared together under the same conditions and same reagents (equivalent to preparation batch).
2 Equipment blanks will be collected by the field crew before using the equipment to collect sample. 3 Or control limits set at + 3 standard deviations based on actual laboratory data.
E.3.2 QA/QC Requirements and Objectives E.3.2.1 Comparability Comparability of the data can be defined as the similarity of data generated by different monitoring programs. For this monitoring program, this objective will be ensured mainly through use of standardized procedures for field measurements, sample collection, sample preparation, laboratory analysis, and site selection; adherence to quality assurance protocols and holding times; and reporting in standard units. Additionally, comparability of analytical data will be addressed through the use of standard operating procedures and extensive analyst training at the analyzing laboratory. E.3.2.2 Representativeness Representativeness can be defined as the degree to which the environmental data generated by the monitoring program accurately and precisely represent actual environmental conditions. For the CIMP, this objective will be addressed by the overall design of the program. Representativeness is attained through the selection of sampling locations, methods, and frequencies for each constituent of interest, and by maintaining the integrity of each sample after collection. Sampling locations were chosen that are representative of various areas within the watershed and discharges from the MS4, which will allow for the characterization of the watershed and impacts MS4 discharges may have on water quality.
- 158 -

Rio Hondo/San Gabriel River Water Quality Group Coordinated Integrated Monitoring Program
E.3.2.3 Completeness Data completeness is a measure of the amount of successfully collected and validated data relative to the amount of data planned to be collected for the project. It is usually expressed as a percentage value. A project objective for percent completeness is typically based on the percentage of the data needed for the program or study to reach valid conclusions. Because the CIMP is intended to be a long term monitoring program, data that are not successfully collected during a specific sample event will not be recollected at a later date. Rather subsequent events conducted over the course of the monitoring will provide robust data sets to appropriately characterize conditions at individual sampling sites and the watershed in general. For this reason, most of the data planned for collection cannot be considered absolutely critical, and it is difficult to set a meaningful objective for data completeness. However, some reasonable objectives for data are desirable, if only to measure the effectiveness of the program when conditions allow for the collection of samples (i.e., flow is present). The program goals for data completeness, shown in Table E-5, are based on the planned sampling frequency, SWAMP recommendations, and a subjective determination of the relative importance of the monitoring element within the CIMP. If, however, sampling sites do not allow for the collection of enough samples to provide representative data due to conditions (i.e., no flow) alternate sites will be considered. Data completeness will be evaluated on a yearly basis. E.3.3 QA/QC Field Procedures Quality control samples to be prepared in the field will consist of equipment blanks, field blanks, and field duplicates as described below. E.3.3.1 Equipment Blanks The purpose of analyzing equipment blanks is to demonstrate that sampling equipment is free from contamination. Equipment blanks will be collected by the analytical laboratory responsible for cleaning equipment and analyzed for relevant pollutants before sending the equipment to the field crew. Equipment blanks will consist of laboratory-prepared blank water (certified to be contaminant-free by the laboratory) processed through the sampling equipment that will be used to collect environmental samples. The equipment blanks will be analyzed using the same analytical methods specified for environmental samples. If any analytes of interest are detected at levels greater than the MDL, the source(s) of contamination will be identified and eliminated (if possible), the affected batch of equipment will be re-cleaned, and new equipment blanks will be prepared and analyzed before the equipment is returned to the field crew for use. E.3.3.2 Field Blanks The purpose of analyzing field blanks is to demonstrate that sampling procedures do not result in contamination of the environmental samples. Per the Quality Assurance Management Plan for SWAMP (SWRCB, 2008) field blanks are to be collected as follows:
At a frequency of 5% of samples collected for the following constituents: trace metals in water (including mercury), VOC samples in water and sediment, DOC samples in water, and bacteria samples.
- 159 -

Rio Hondo/San Gabriel River Water Quality Group Coordinated Integrated Monitoring Program
Field blanks for other media and analytes should be conducted upon initiation of sampling, and if
field blank performance is acceptable (as described in Table E-19), further collection and analysis of field blanks for these other media and analytes need only be performed on an as-needed basis, or during field performance audits. An as-needed basis for the RG/SGRWQG CIMP will be annually.
Field blanks will consist of laboratory-prepared blank water (certified to be contaminant-free by the laboratory) processed through the sampling equipment using the same procedures used for environmental samples. If any analytes of interest are detected at levels greater than the MDL, the source(s) of contamination should be identified and eliminated, if possible. The sampling crew should be notified so that the source of contamination can be identified (if possible) and corrective measures taken prior to the next sampling event. E.3.3.3 Field Duplicates The purpose of analyzing field duplicates is to demonstrate the precision of sampling and analytical processes. Field duplicates will be prepared at the rate of 5% of all samples, and analyzed along with the associated environmental samples. Field duplicates will consist of two grab samples collected simultaneously, to the extent practicable. If the Relative Percent Difference (RPD) of field duplicate results is greater than the percentage stated in Table E-19 and the absolute difference is greater than the RL, both samples should be reanalyzed, if possible. The sampling crew should be notified so that the source of sampling variability can be identified (if possible) and corrective measures taken prior to the next sampling event. E.3.4 QA/QC Laboratory Analyses Quality control samples prepared in the laboratory will consist of method blanks, laboratory duplicates, matrix spikes/duplicates, laboratory control samples (standard reference materials), and toxicity quality controls. E.3.4.1 Method Blanks The purpose of analyzing method blanks is to demonstrate that sample preparation and analytical procedures do not result in sample contamination. Method blanks will be prepared and analyzed by the contract laboratory at a rate of at least one for each analytical batch. Method blanks will consist of laboratory-prepared blank water processed along with the batch of environmental samples. If the result for a single method blank is greater than the MDL, or if the average blank concentration plus two standard deviations of three or more blanks is greater than the RL, the source(s) of contamination should be corrected, and the associated samples should be reanalyzed. E.3.4.2 Laboratory Duplicates The purpose of analyzing laboratory duplicates is to demonstrate the precision of the sample preparation and analytical methods. Laboratory duplicates will be analyzed at the rate of one pair per sample batch. Laboratory duplicates will consist of duplicate laboratory fortified method blanks. If the RPD for any analyte is greater than the percentage stated in Table E-19 and the absolute difference between duplicates is greater than the RL, the analytical process is not being performed adequately for that analyte. In this case, the sample batch should be prepared again, and laboratory duplicates should be reanalyzed.
- 160 -

Rio Hondo/San Gabriel River Water Quality Group Coordinated Integrated Monitoring Program
E.3.4.3 Matrix Spikes and Matrix Spike Duplicates The purpose of analyzing matrix spikes and matrix spike duplicates is to demonstrate the performance of the sample preparation and analytical methods in a particular sample matrix. Matrix spikes and matrix spike duplicates will be analyzed at the rate of one pair per sample batch. Each matrix spike and matrix spike duplicate will consist of an aliquot of laboratory-fortified environmental sample. Spike concentrations should be added at five to ten times the reporting limit for the analyte of interest. If the matrix spike recovery of any analyte is outside the acceptable range, the results for that analyte have failed to meet acceptance criteria. If recovery of laboratory control samples is acceptable, the analytical process is being performed adequately for that analyte, and the problem is attributable to the sample matrix. An attempt will be made to correct the problem (e.g., by dilution, concentration, etc.), and the samples and matrix spikes will be re-analyzed. If the matrix spike duplicate RPD for any analyte is outside the acceptable range, the results for that analyte have failed to meet acceptance criteria. If the RPD for laboratory duplicates is acceptable, the analytical process is being performed adequately for that analyte, and the problem is attributable to the sample matrix. An attempt will be made to correct the problem (e.g., by dilution, concentration, etc.), and the samples and matrix spikes will be re-analyzed. E.3.4.4 Laboratory Control Samples The purpose of analyzing laboratory control samples (or a standard reference material) is to demonstrate the accuracy of the sample preparation and analytical methods. Laboratory control samples will be analyzed at the rate of one per sample batch. Laboratory control samples will consist of laboratory fortified method blanks or a standard reference material. If recovery of any analyte is outside the acceptable range, the analytical process is not being performed adequately for that analyte. In this case, the sample batch should be prepared again, and the laboratory control sample should be reanalyzed. E.3.4.5 Surrogate Spikes Surrogate recovery results are used to evaluate the accuracy of analytical measurements for organics analyses on a sample-specific basis. A surrogate is a compound (or compounds) added by the laboratory to method blanks, samples, matrix spikes, and matrix spike duplicates prior to sample preparation, as specified in the analytical methodology. Surrogates are generally brominated, fluorinated or isotopically labeled compounds that are not usually present in environmental media. Results are expressed as percent recovery of the surrogate spike. Surrogate spikes are applicable for analysis of PCBs and pesticides. E.3.4.6 Toxicity Quality Control For aquatic toxicity tests, the acceptability of test results is determined primarily by performance-based criteria for test organisms, culture and test conditions, and the results of control bioassays. Control bioassays include monthly reference toxicant testing. Test acceptability requirements are documented in the method documents for each bioassay method.
- 161 -
Rio Hondo/San Gabriel River Water Quality Group Coordinated Integrated Monitoring Program
E.4 Instrument/Equipment Calibration and Frequency Frequencies and procedures for calibration of analytical equipment used by each contract laboratory are documented in the QA Manual for each contract laboratory. Any deficiencies in analytical equipment calibration should be managed in accordance with the QA Manual for each contract laboratory. Any deficiencies that affect analysis of samples submitted through this program must be reported to the RH/SGRWQG, or designee. Laboratory QA Manuals are available for review at the analyzing laboratory.
E.5 Data Management, Validation and Usability The Monitoring Manager will maintain an inventory of data and its forms. After each sampling event, data collected in the RH/SGRWQG CIMP will be verified and validated before it is deemed ready for reporting. This section describes the process that the Monitoring Manager will take to verify and validate the collected data. E.5.1 Data Review, Verification, and Validation Requirements The acceptability of data is determined through data verification and data validation. Both processes are discussed in detail below. In addition to the data quality objectives presented in Table E-5, the standard data validation procedures documented in the contract laboratory’s QA Manual will be used to accept, reject, or qualify the data generated by the laboratory. Each laboratory’s QA Officer will be responsible for validating data generated by the laboratory. Once analytical results are received from the analyzing laboratory, the RH/SGRWQG will perform an independent review and validation of analytical results. Table E-5 provides standards for precision, accuracy, and completeness of the data. Decisions to reject or qualify data will be made by the RH/SGRWQG, based on the evaluation of field and laboratory quality control data, according to procedures outlined in Section 13 of Caltrans document No. CTSW-RT-00-005, Guidance Manual: Stormwater Monitoring Protocols, 2nd Edition (LWA, 2000). E.5.2 Data Verification Data verification involves verifying that required methods and procedures have been followed at all stages of the data collection process, including sample collection, sample receipt, sample preparation, sample analysis, and documentation review for completeness. Verified data have been checked for a variety of factors, including transcription errors, correct application of dilution factors, appropriate reporting of dry weight versus wet weight results, and correct application of conversion factors. Verification of data may also include laboratory qualifiers, if assigned. Data verification should occur in the field and the laboratory at each level (i.e., all personnel should verify their own work) and as information is passed from one level to the next (i.e., supervisors should verify the information produced by their staff). Records commonly examined during the verification process include field and sample collection logs, COC forms, sample preparation logs, instrument logs, raw data, and calculation worksheets. In addition, laboratory personnel will verify that the measurement process was "in control" (i.e., all specified data quality objectives were met or acceptable deviations explained) for each batch of samples before proceeding with the analysis of a subsequent batch. Each laboratory will also establish a system for detecting and reducing transcription and/or calculation errors prior to reporting data.
- 162 -

Rio Hondo/San Gabriel River Water Quality Group Coordinated Integrated Monitoring Program
E.5.3 Data Validation In general, data validation involves identifying project requirements, obtaining the documents and records produced during data verification, evaluating the quality of the data generated, and determining whether project requirements were met. The main focus of data validation is determining data quality in terms of accomplishment of measurement quality objectives (i.e., meeting QC acceptance criteria). Data quality indicators, such as precision, accuracy, sensitivity, representativeness, and completeness, are typically used as expressions of data quality. The Project QA Manager, or designee, will review verified sample results for the data set as a whole, including laboratory qualifiers, summarize data and QC deficiencies and evaluate the impact on overall data quality, assign data validation qualifiers as necessary, and prepare an analytical data validation report. The validation process applies to both field and laboratory data. In addition to the data quality objectives presented in Table E-5, the standard data validation procedures documented in the analyzing laboratory’s QA Manual will be used to accept, reject or qualify the data generated. The laboratory will submit only data that have met data quality objectives, or data that have acceptable deviations explained. When QC requirements have not been met, the samples will be reanalyzed when possible, and only the results of the reanalysis will be submitted, provided that they are acceptable. Each laboratory’s QA Officer is responsible for validating the data it generates. E.5.4 Data Management Event Summary Reports and Analytical Data Reports will be sent to and kept by the Project Manager. Each type of report will be stored separately and ordered chronologically. The field crew shall retain the original field logs. The contract laboratory shall retain original COC forms. The contract laboratory will retain copies of the preliminary and final data reports. Concentrations of all constituents will be calculated as described in the laboratory SOPs or referenced method document for each analyte or constituent. The field log and analytical data generated will be converted to a standard database format maintained on personal computers. After data entry or data transfer procedures are completed for each sample event, data will be validated. After the final quality assurance checks for errors are completed, the data will be added to the final database. The database used to manage data will be upgraded as necessary to meet the requirements of the program. Program data will be submitted electronically with the Annual Monitoring Report in either Microsoft Access® or Microsoft Excel® file format. Tabular data summaries included in the annual report will be generated from this data file (“database”). Additionally, those data collected by the RH/SGRWQG CIMP will be formatted to comply with SWAMP database requirements. All chemical, bacteriological, and toxicity analyses shall be conducted at a laboratory:
1. Certified for such analyses by an appropriate governmental regulatory agency 2. Participated in “Intercalibration Studies” for stormwater pollutant analysis conducted by the SMC 3. Which performs laboratory analyses consistent with the stormwater monitoring guidelines as
specified in the Stormwater Monitoring Coalition Laboratory Guidance Document, 2nd Edition R. Gossettt and K. Schiff (2007), and its revisions
- 163 -

Rio Hondo/San Gabriel River Water Quality Group Coordinated Integrated Monitoring Program
Appendix 1
Example Field and Chain-of-Custody Forms
- 164 -
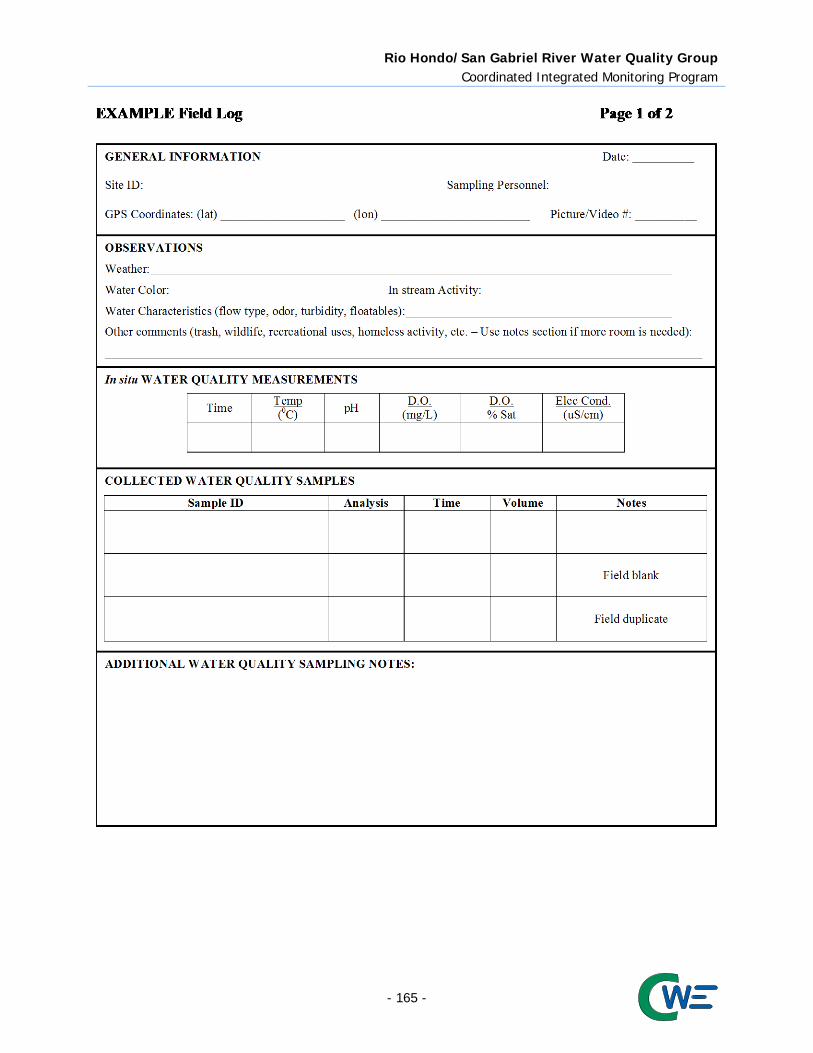
Rio Hondo/San Gabriel River Water Quality Group Coordinated Integrated Monitoring Program
- 165 -

Rio Hondo/San Gabriel River Water Quality Group Coordinated Integrated Monitoring Program
- 166 -
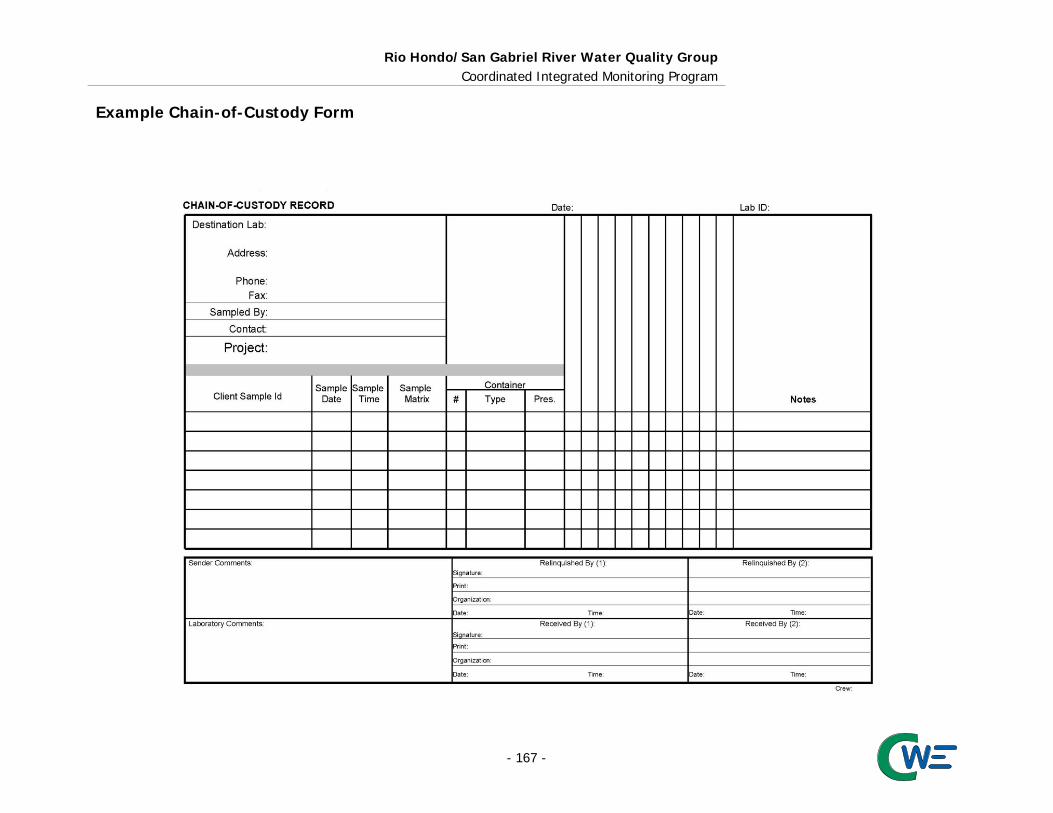
Rio Hondo/San Gabriel River Water Quality Group Coordinated Integrated Monitoring Program
Example Chain-of-Custody Form
- 167 -
Rio Hondo/San Gabriel River Water Quality Group Coordinated Integrated Monitoring Program
Attachment F
Chapter 13 QA/QC Data Evaluation from Caltrans Guidance Manual: Stormwater
Monitoring Protocols, 2nd Edition
- 168 -
Rio Hondo/San Gabriel River Water Quality Group Coordinated Integrated Monitoring Program
- 169 -
Rio Hondo/San Gabriel River Water Quality Group Coordinated Integrated Monitoring Program
- 170 -

Rio Hondo/San Gabriel River Water Quality Group Coordinated Integrated Monitoring Program
- 171 -
Rio Hondo/San Gabriel River Water Quality Group Coordinated Integrated Monitoring Program
- 172 -
Rio Hondo/San Gabriel River Water Quality Group Coordinated Integrated Monitoring Program
- 173 -

Rio Hondo/San Gabriel River Water Quality Group Coordinated Integrated Monitoring Program
- 174 -

Rio Hondo/San Gabriel River Water Quality Group Coordinated Integrated Monitoring Program
- 175 -

Rio Hondo/San Gabriel River Water Quality Group Coordinated Integrated Monitoring Program
- 176 -

Rio Hondo/San Gabriel River Water Quality Group Coordinated Integrated Monitoring Program
- 177 -

Rio Hondo/San Gabriel River Water Quality Group Coordinated Integrated Monitoring Program
- 178 -
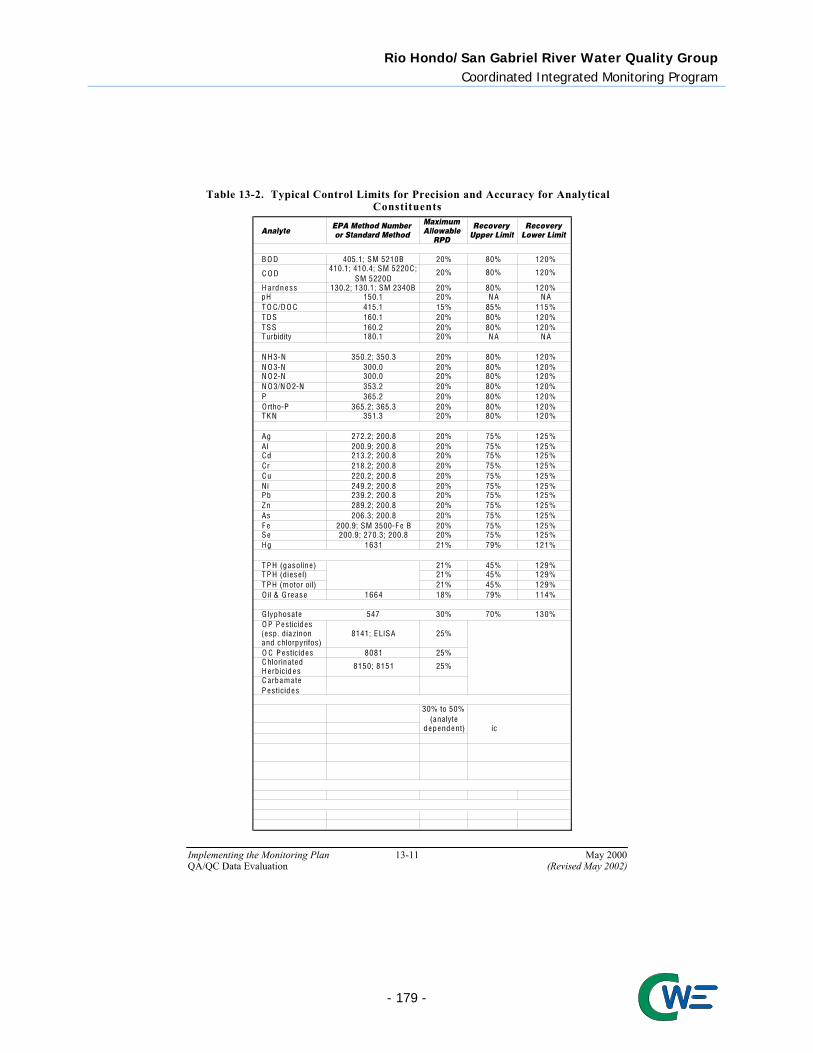
Rio Hondo/San Gabriel River Water Quality Group Coordinated Integrated Monitoring Program
- 179 -
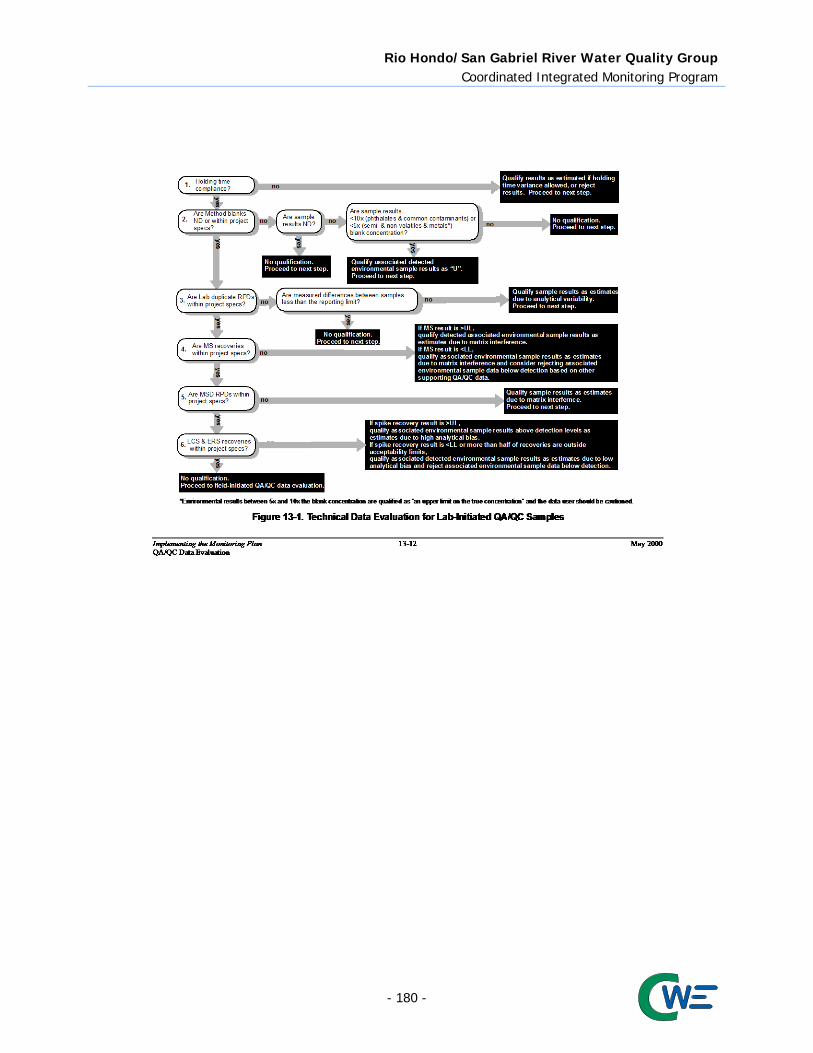
Rio Hondo/San Gabriel River Water Quality Group Coordinated Integrated Monitoring Program
- 180 -

Rio Hondo/San Gabriel River Water Quality Group Coordinated Integrated Monitoring Program
- 181 -

Rio Hondo/San Gabriel River Water Quality Group Coordinated Integrated Monitoring Program
Attachment G
LACFCD Background
- 182 -
Rio Hondo/San Gabriel River Water Quality Group Coordinated Integrated Monitoring Program
G.1 LACFCD Background In 1915, the Los Angeles County Flood Control Act established the LACFCD and empowered it to manage flood risk and conserve stormwater for groundwater recharge. In coordination with the United States Army Corps of Engineers the LACFCD developed and constructed a comprehensive system that provides for the regulation and control of flood waters through the use of reservoirs and flood channels. The system also controls debris, collects surface storm water from streets, and replenishes groundwater with stormwater, imported, and recycled waters. The LACFCD covers the 2,753 square-mile portion of Los Angeles County south of the east-west projection of Avenue S, excluding Catalina Island. It is a special district governed by the County of Los Angeles Board of Supervisors, and its functions are carried out by the Los Angeles County Department of Public Works. The LACFCD service area is shown in Figure G-1. Unlike cities and counties, the LACFCD does not own or operate any municipal sanitary sewer systems, public streets, roads, or highways. The LACFCD operates and maintains storm drains and other appurtenant drainage infrastructure within its service area. The LACFCD does not have planning, zoning, development permitting, or other land use authority within its service area. The Permittees that have such land use authority are responsible under the MS4 Permit for inspecting and controlling pollutants from industrial and commercial facilities, development projects, and development construction sites based on MS4 Permit Part II.E (page 17) The MS4 Permit language clarifies the unique role of the LACFCD in stormwater management programs: “[g]iven the LACFCD’s limited land use authority, it is appropriate for the LACFCD to have a separate and uniquely-tailored storm water management program. Accordingly, the storm water management program minimum control measures imposed on the LACFCD in Part VI.D of this Order differ in some ways from the minimum control measures imposed on other Permittees. Namely, aside from its own properties and facilities, the LACFCD is not subject to the Industrial/Commercial Facilities Program, the Planning and Land Development Program, and the Development Construction Program. However, as a discharger of storm and non-storm water, the LACFCD remains subject to the Public Information and Participation Program and the Illicit Connections and Illicit Discharges Elimination Program. Further, as the owner and operator of certain properties, facilities and infrastructure, the LACFCD remains subject to requirements of a Public Agency Activities Program.” (MS4 Permit, Part II.F, page 18.) Consistent with the role and responsibilities of the LACFCD under the MS4 Permit, the [E]WMPs and CIMPs reflect the opportunities that are available for the LACFCD to collaborate with Permittees having land use authority over the subject watershed area. In some instances, the opportunities are minimal, however the LACFCD remains responsible for compliance with certain aspects of the MS4 permit as discussed above. During the development of the CIMP, LACFCD infrastructure was evaluated for monitoring opportunities. The LACFCD will be collaborating with the groups for all of the monitoring.
- 183 -

Rio Hondo/San Gabriel River Water Quality Group Coordinated Integrated Monitoring Program
Figure G-1: Los Angeles County Flood Control District Service Area
- 184 -