rinsing practices of australian farmers: the characteristics of farmers who do not rinse chemical...
TRANSCRIPT

Journal of Environmental Management (1997) 50, 129–146
Rinsing Practices of Australian Farmers: the Characteristics ofFarmers who do not Rinse Chemical Residues from EmptyContainers
Gavin Turrell∗ and Ingrid McGuffog†
∗School of Public Health, Queensland University of Technology 4059, Australia, and† Department of Anthropology and Sociology, The University of Queensland 4072,Australia
Received 10 January 1996; accepted 6 June 1996
In recent years, the potential environmental and health impact of chemicals leftin empty containers has emerged as an important issue for farmers and thewider community. In 1994, a nationally representative study of Australianfarmers was commissioned to ascertain whether and to what extent farmerswere rinsing empty chemical containers, and to identify the factors which wereassociated with this behaviour. This paper focuses its attention on that groupof farmers who do not rinse their empty chemical containers and argues thatthe containers used by this group pose the greatest threat to the environmentand public health. Specifically, this study examines the relationship betweennon-rinsing and a range of selected variables from the adoption-diffusion andeconomic models of conservation innovation. A multivariate logistic regressionanalysis found that non-rinsing was significantly predicted by the followingvariables: no formal training in the use of agricultural and veterinarychemicals, having a tertiary education, being a livestock farmer, having noadditional adults permanently employed in production activities on the farm,operating a farm greater than 3500 hectares, not perceiving that rinsingcontainers is important, and not believing that chemical residues in emptycontainers were a threat to the environment. Policy implications are discussed. 1997 Academic Press Limited
Keywords: adoption, conservation innovation, rinsing, chemical containers,environment, public health, perceptions, mail survey, logistic regression,Australia.
1. Introduction
Farming operations in most developed industrialised countries rely heavily on the useof agricultural and veterinary chemicals. An important issue facing farmers, and thewider community, is the potential environmental and health impacts of chemical residuesleft in containers after the bulk of their contents have been used. In 1993, an audit ofagricultural and veterinary chemical container usage in Australia found that more than99% of the volume of liquid products was sold in approximately four million primary
0301–4797/97/060129+18 $25.00/0/ev960099 1997 Academic Press Limited
Rinsing practices of Australian farmers130
containers of one litre or greater in size (Avcare, 1994). This number attests to thepotential magnitude of the problem of chemical residues left in empty containers.According to the national association for crop protection and animal health, thesecontainers “may pose a threat to the environment, or to public health, unless they areproperly cleaned to remove any residual product prior to disposal” (Avcare, 1994).
At present, we know very little about the rinsing behaviours of farmers. In 1994, anationally representative study of Australian farmers was commissioned to ascertainwhether and to what extent farmers were rinsing empty chemical containers, and toidentify the factors which were associated with this behaviour. Currently, governmentregulations covering the labelling of agricultural and veterinary chemicals require thatall empty chemical containers are either pressure rinsed or triple rinsed prior to disposal,a practice which is also endorsed by health authorities and industry codes of practice(AVCA, no date). Whilst this recommendation represents a goal to be attained, thereality is likely to be somewhat different. Indeed, there is probably a proportion ofAustralian farmers who do not make any attempt to rinse empty chemical containers.Containers used by this group, it is argued, pose the greatest threat to the environmentand public health. This paper focuses its attention on this group.
The aim of this study is to examine the relationship between non-rinsing and arange of institutional/informational, personal and farm-firm variables, as well as farmerperceptions and attitudes. The variables were selected from the adoption-diffusion andeconomic models of conservation innovation. The specific research questions are: whatproportion of Australian farmers do not rinse empty chemical containers, and whatare the factors which predict non-rinsing?
2. Literature review
A comprehensive search of the published literature failed to locate any study whichaddressed the issue of rinsing behaviour and its determinants1. Given this, the rinsing(or non-rinsing) of empty chemical containers was conceptualised more broadly as aconservation innovation. The conceptual framework used in the conservation innovationliterature, as well as the empirical evidence, provides a useful context and starting pointfor this examination of rinsing behaviour.
2.1.
During the last two decades a lively debate has emerged in the literature on the adoptionof conservation innovations. Proponents of the classic model of adoption-diffusionargue that psycho-social characteristics are the most important factors influencing theuptake of innovations (Rogers and Shoemaker, 1971). Studies using the diffusion modelhave typically included three categories of variables: institutional/informational (e.g.degree of integration in organisational and informational networks, and educationrelevant to the innovation being adopted), personal characteristics (e.g. educationallevel, age and experience in farming), and perceptions and attitudes (e.g. awareness ofthe environmental problem to be addressed and attitude towards the innovation itself).
The use of the diffusion model to explain the uptake of conservation innovations
1 A number of sources were investigated, including specialised computer data bases such as Sociofile,Agricola, Current Affairs Bulletin, Australian Public Affairs Information Service (APAIS) and the AppliedScience and Technology Index.

G. Turrell and I. McGuffog 131
was later questioned, notably by Pampel and van Es (1977), who offered a competing,economic explanation. Proponents of this explanation suggested that the unprofitabilityof conservation innovations limited the applicability of the diffusion model. Studiesusing the economic perspective have typically included two categories of variables:farm-firm characteristics (e.g. farm income and size, industry sector, tenure and thenumber of non-family members employed), and profit orientation (e.g. orientation tofarming and perception of profitability of the conservation innovation). It was arguedthat these factors were likely to be more important in terms of influencing the adoptionof conservation innovations than diffusion-related factors.
More recently, studies have emerged which draw from both perspectives and treatthem as complementary rather than competing models (for example, Nowak, 1987;Camboni and Napier, 1993; Saltiel et al., 1994). These studies have investigated therelative efficacy of both models in explaining the adoption of conservation innovations.The findings suggest that both diffusion and economic factors are important, but theirrelative salience varies according to the innovation being adopted.
2.2.
Thirteen studies were identified as having examined the uptake of a conservationinnovation, and their key methodological features are summarised in Table 1. Thestudies were conducted between 1977 and 1994 in the United States (N=12) andAustralia (N=1). Four were “population” studies (Taylor and Miller, 1978; Korschinget al., 1983; Nowak, 1987; Sinden and King, 1990) and nine used various types ofsamples, although only one was nationally representative (Lee and Stewart, 1983). Ofthe nine studies based on samples, only four reported response rates, thus for aroundhalf of the studies it was not possible to determine the degree of error between thesample and the population from which it was drawn. As a consequence, it was uncertainwhether the results of these studies are a reliable indication of the actual situation whichprevails in the farming population. Data pertaining to the adoption of conservationinnovations were collected using a range of methods which included telephone andpersonal interviews and mail survey questionnaires. Four studies did not report howtheir data were collected. Most studies used multivariate data analysis techniques. Thestability of some of the estimates produced by the application of these techniques wasquestionable as a number of researchers examined complex multivariate models usingsmall samples (Taylor and Miller, 1978; Ervin and Ervin, 1982; Korsching et al., 1983;Norris and Batie, 1987; Lynne et al., 1988; Sinden and King, 1990).
Table 2 presents a summary of the findings of the thirteen studies. The dependentvariables used in these investigations related to the uptake of soil conservation practices.Although soil conservation may seem somewhat removed from the issue of rinsingbehaviour, both can be identified as behaviours which attempt to minimise negativeimpacts on the environment. Of more relevance for this study were the independentvariables used by conservation innovation investigators. It is proposed that many ofthe factors which predict the uptake of recommended soil conservation practices willalso be salient in terms of predicting rinsing behaviour.
Seven of the 13 studies included each of the four categories of variables used tomeasure the adoption-diffusion and economic perspectives (Taylor and Miller, 1978;Ervin and Ervin, 1982; Napier et al., 1984; Norris and Batie, 1987; Sinden and King,1990; Camboni and Napier, 1993; Saltiel et al., 1994). There was little consistency,

Rinsing practices of Australian farmers132
T 1. Key methodological features of studies examining the correlates of adoption ofconservation practices among farmers
Country, Sample type Sample Data Type ofauthor, size collection analysis†date method∗
United StatesPampel and A random probability sample of farmers 340 TI FAvan Es, 1977 in southern IllinoisTaylor and Population study of farmers with farms 89 (initial) PI OLSMiller, 1978 of 10 acres or more in the area of the 71 (final)
Black Creek Watershed, interviewedtwice over two years
Ervin and Random sample of farmers in Monroe 92 NR OLSErvin, 1982 County, MissouriBultena and A random sample of farmers within 23 285 MSQ, TI ANOVAHoiberg, 1983 Iowa countiesKorsching et A population study in three watersheds 117 PI LAal., 1983 in central IowaLee and Merger of the 1977 National Resource 7649 MSQ LAStewart, 1983 Inventories and the 1978 Land Owner-
ship SurveyNapier et al., A systematic sample from nine counties 918 PI OLS1984 chosen at random from extension dis-
tricts in OhioNorris and A random sample of two counties in 74 PI TABatie, 1987 Virginia (Pittsylvania and Lunenburg)Nowak, 1987 Saturation sampling of two watersheds 120 (initial) NR SMR
in east-central Iowa 89 (final)Lynne et al., A survey of farmers in Florida was used. 103 NR TA1988 The sampling method is not reportedCamboni and A systematic sample from five counties 371 NR DNapier, 1993 in OhioSaltiel et al., Random sample of farmers and ranchers 1135 MSQ OLS1994 in Montana
AustraliaSinden and Fifty farms, purchased between De- 50 NR LAKing, 1990 cember 1979 and October 1985, selected
from the Manilla Shire in New SouthWales
∗ (TI) Telephone interview, (PI) Personal interview, (NR) Not reported, (MSQ) Mail survey questionnaire.† (FA) Factor analysis, (OLS) Ordinary least squares regression, (ANOVA) Analysis of variance, (LA)
Logit analysis, (TA) Tobit analysis, (SMR) Stepwise multiple regression, (D) Discriminant analysis.
however, in terms of the number and type of variable measured across the studies andonly those variables which were significant predictors of adoption are reported here.
Table 2 shows that the following institutional/informational factors were significantpredictors of adoption behaviour: organisational involvement (Korsching et al., 1983),exposure to information and agricultural education (Napier et al., 1984), having aconservation plan (Norris and Batie, 1987), contact with extension or governmentrepresentatives (Nowak, 1987), and participation in farm programs (Camboni andNapier, 1993).

G. Turrell and I. McGuffog 133
T 2. Summary of significant findings of previous studies examining the correlates of adoptionof conservation practices among farmers
Variable category Number of Number of Study in whichtimes variable times variable was
examined significant significant∗
Institutional and informational factorsOrganisational involvement 1 1 5Exposure to information 1 1 7Agricultural education 1 1 7Having a conservation plan 1 1 8Contact with extension or government 1 1 9
representativesParticipation in farm program 1 1 11
Personal characteristicsEducation 8 2 4,8Years farming 5 2 1,11Age 6 3 4,5,8
Farm/firm characteristicsFarm income 9 7 1,4,5,8,10,11,12Industry sector 7 7 1,3,7,8,11,12,13Tenure 7 5 1,5,6,8,10Farm size 9 5 4,5,6,8,11Employment of farm workers 4 3 5,7,9Erosion hazard 6 5 3,6,8,9,10Debt 4 1 8
Perceptions and attitudesPerceived need for the innovation 3 3 2,4,12Environmental concern or awareness or 6 6 3,4,7,8,10,11
environmental problemFarming orientation (including profit 5 3 1,4,10
orientation)
∗ (1) Pampel and van Es, 1977; (2) Taylor and Miller, 1978; (3) Ervin and Ervin, 1982; (4) Bultena andHoiberg, 1983; (5) Korsching et al., 1983; (6) Lee and Stewart, 1983; (7) Napier et al., 1984; (8) Norris andBatie, 1987; (9) Nowak, 1987; (10) Lynne et al., 1988; (11) Camboni and Napier, 1993; (12) Saltiel et al.,1994; (13) Sinden and King, 1990.
Adoption behaviour was significantly related with three personal characteristics.Education was significant in two out of the eight studies in which it was examined(Bultena and Hoiberg, 1983; Norris and Batie, 1987). Number of years farming wasincluded in five studies and was significant in two (Pampel and van Es, 1977; Camboniand Napier, 1993). Age was significant in three out of six studies (Bultena and Hoiberg,1983; Korsching et al., 1983; Norris and Batie, 1987).
Seven farm-firm characteristics significantly predicted adoption behaviour. Farmincome (either on-farm or off-farm) was measured in nine studies and was significantin seven (Pampel and van Es, 1977; Bultena and Hoiberg, 1983; Korsching et al., 1983;Norris and Batie, 1987; Lynne et al., 1988; Camboni and Napier, 1993; Saltiel et al.,1994). Industry sector was significant in all of the seven studies in which it was examined(Pampel and van Es, 1977; Ervin and Ervin, 1982; Napier et al., 1984; Norris andBatie, 1987; Sinden and King, 1990; Camboni and Napier, 1993; Saltiel et al., 1994).Tenure was significant in five out of seven studies (Pampel and van Es, 1977; Korsching

Rinsing practices of Australian farmers134
et al., 1983; Lee and Stewart, 1983; Norris and Batie, 1987; Lynne et al., 1988). Farmsize (including acreage operated) was examined in nine studies and was significant infive (Bultena and Hoiberg, 1983; Korsching et al., 1983; Lee and Stewart, 1983; Norrisand Batie, 1987; Lynne et al., 1988; Camboni and Napier, 1993). Employment of farmworkers was significant in three out of four studies (Korsching et al., 1983; Napier etal., 1984; Nowak, 1987). Erosion hazard was significant in five out of six studies (Ervinand Ervin, 1982; Lee and Stewart, 1983; Norris and Batie, 1987; Nowak, 1987; Lynneet al., 1988), and debt was significant in one out of four studies (Norris and Batie,1987).
Adoption behaviour was significantly related to three perceptions/attitudes. Perceivedneed for innovation (including attitude towards innovation) was examined three timesand was found to be significant in all studies (Taylor and Miller, 1978; Bultenaand Hoiberg, 1983; Saltiel et al., 1994). Environmental concern or awareness of anenvironmental problem was significant in all of the six studies in which it was examined(Ervin and Ervin, 1982; Bultena and Hoiberg, 1983; Napier et al., 1984; Norris andBatie, 1987; Lynne et al., 1988; Camboni and Napier, 1993). Farming orientation(including profit orientation) was significant in three out of five studies (Pampel andvan Es, 1977; Bultena and Hoiberg, 1983; Lynne et al., 1988).
These findings provide some support for using variables drawn from both thediffusion and economic perspectives on the adoption of conservation innovations. Thispresent study uses a number of these variables in an attempt to identify the factorswhich predict the non-adoption of recommended rinsing practices among Australianfarmers.
3. Methods
3.1.
The Australian Bureau of Statistics (ABS) randomly selected 4000 farms from the 1993Integrated Register of Agricultural Establishments (Australian Bureau of Statistics,1993). This sampling framework comprised 120 286 farms whose estimated value ofagricultural operation (EVAO) was equal to or greater than $22 500. The sample wasstratified by State and industry sector and the size of each State/sector sub-sample wascalculated to obtain equal sampling errors for cells at the State and industry level. Forconfidentiality purposes, the ABS categorised the 4000 farms into five groups basedon EVAO (i.e. $22 500–40 000, $40 001–80 000, $80 001–120 000, $120 001–200 000,>$200 000). Each EVAO group contained approximately 20% of farms in the selectedsample.
3.2.
Data were collected using a structured self-administered questionnaire. The design andcontent of the questionnaire was developed on the basis of information gathered duringan earlier pilot phase, which involved interviewing 32 farmers from each industry sectorin New South Wales and Queensland. During each interview the farmer was invited tocomplete the questionnaire. The responses were then reviewed with the farmer toevaluate the validity of the questions and identify any problems that they may havehad when completing the instrument.

G. Turrell and I. McGuffog 135
T 3. Comparing the original ABS sample with the finalmail survey sample: by sector as a proportion of the sample
Original ABS Mail surveysample sample
% f % f
Cereals 26 1015 27 814Livestock 29 1145 30 888Sugar 9 345 9 267Cotton 9 301 8 235Horticulture 28 1103 27 803
Total 100 3909 100 3007
v24 2·26, P=0·688.
3.3.
Data were collected using a mail-survey method developed by Dillman (1978, 1991).The questionnaires were initially delivered in January 1994, and were accompanied bya pre-addressed, pre-paid envelope. Two weeks later a reminder/thank-you letter wassent to all those in the sample. Four weeks after the initial mail-out, a reminderletter and replacement questionnaire were sent to all non-respondents. Ninety-onequestionnaires were returned unopened as the intended respondent was no longerresident at the last known address. These “return to senders” were not counted as partof the original ABS sample, which was now reduced to 3909. Implementing Dillman’s“Total Design Method” yielded a final response rate of 77%, which translated into asample of 3007. Among the States, Tasmania recorded the highest response rate (80%),and the lowest was from New South Wales and Queensland (76%). Across industrysectors, the highest response rate was from cereal growers (80%) and lowest fromhorticulturalists (73%). A chi-square test indicated that there was no significant differencebetween the final mail survey sample and the sample selected by the ABS (Table 3).Based on this evidence we can be confident that the sample used in this study isrepresentative of the Australian farming population and any error due to non-responsebias or mis-representation is likely to be minimal.
3.4.
In this study chemicals are defined as insecticides, herbicides, fungicides, nematicides,growth regulators, defoliants, dips, drenches and veterinary preparations. The term“chemicals” does not refer to fertilisers. Containers refer to plastic or metal vesselswhich hold liquid chemicals. Bags or cartons containing powdered or granulatedchemicals are not examined in this study. Rinsing is defined as the removal of chemicalresidue from empty metal or plastic containers using a manual method2. Farmers whoreported using non-manual rinsing methods, such as a special rinsing device or suctionprobe, are not included in this study.
2 That is, partially filling the container with water, replacing the cap, shaking vigorously and draining therinsate into a spray tank.

Rinsing practices of Australian farmers136
3.5.
All variables in this study were operationalised using a dichotomous or polytomouscoding scheme. The dependent variable was coded 1 if the respondent did not rinseempty chemical containers and 0 if they reported rinsing one or more times. In keepingwith the literature reviewed earlier, this study explores the predictive capacity offour groups of independent measures. The first group—institutional/informationalfactors—comprised three variables: organisational networks, perceived importance ofinformation sources, and formal training in the use of agricultural or veterinarychemicals. The organisational networks variable was initially constructed by summingthe responses to an eight-item question which asked farmers to indicate whether theywere involved in a range of organisations or groups (e.g. grower organisation, landcaregroups etc.). The resulting index ranged from zero (no involvement) to eight (mean1·6, SD 1·2). This measure was subsequently divided into two categories, namely, thosewho were not involved in any group or organisation and those involved in oneor more. The “perceived importance of information sources” variable was initiallyconstructed by summing responses to a ten-item question which asked farmers to ratesources of information about farm management (e.g. farmer magazines, field days anddemonstrations, agricultural consultant) on a four point scale (1=not important, 4=very important). The resulting index ranged from 10 to 40 (mean 29·2, SD 4·9). Thisvariable was re-coded as three groups, namely, those who reported that the informationsources were “not very important”, “somewhat important” and “quite/very important”.This variable was conceptualised as measuring the diversity of information sourcesused by respondents. It is proposed that the greater the number of sources of informationa farmer consults, the more likely they are to be exposed to information aboutrecommended rinsing practices. The formal training variable was retained in the formatoperationalised in the questionnaire (no/yes).
The second group of measures—personal characteristics—comprised four variables:education level, whether the respondent grew up on a farm, age, and years farmingsince the age of 15. Education level was originally operationalised using a pre-codedquestion consisting of eight categories. The first five categories (i.e. never went toschool, primary school, part of secondary, all of secondary and trade or certificatecourse) were grouped together and designated “no tertiary”, and the latter threecategories (i.e. diploma or associate diploma, part of a degree course and all of a degreecourse) were designated “tertiary”. The variable pertaining to whether or not arespondent grew up on a farm was retained in the format operationalised in thequestionnaire (no/yes). Age was originally measured using a semi-structured questionwhich asked respondents to report the year in which they were born. The question wasre-scored as a continuous interval measure ranging in yearly increments from 16 to 90(mean 48·7, SD 11·8). For the purposes of this study, the continuous measure wasdivided into four age groups (18–30, 31–44, 45–64, 65+). The “years farming variable”was originally measured using a question which asked “Since the age of 15 how manyyears have you been involved in farming?” The responses ranged from less than 1 yearto 75 years (mean 28·7, SD 13·3). This continuous measure was subsequently dividedinto four groups (0–15 years, 16–30, 31–45 and >45).
The third group of measures—farm/firm characteristics—comprised five variables:EVAO, agricultural sector, tenure, number of adults involved in production activitieson the farm, and total number of hectares operated. The variables measuring EVAOand sector were not included in the questionnaire, but were provided by the ABS on
G. Turrell and I. McGuffog 137
a case-matched basis. The authors sorted the data set on the basis of the respondents’identification number and the ABS provided a matching file containing the respondents’EVAO group and agricultural sector3. The tenure and total number of hectares variableswere constructed from the same question. Respondents were asked to indicate theapproximate land area that they operated under five forms of tenure—freehold, crownleasehold, share farming and other (multiple responses were permitted). A variable wassubsequently created which measured the amount of freehold land as a proportion ofthe total land area. Farmers who operated 100% freehold land were assigned to the“freehold only” category of the tenure variable. Farms comprising less than 100%freehold were assigned to the “leased (including some freehold)” category. The “totalnumber of hectares” variable was constructed by summing the amount of land eachfarm operated irrespective of the type of tenure. This continuous (highly skewed)variable ranged from 0·4 ha to 700 000 ha (median 250·2, mean 2377·3, SD 20 854·3) andwas subsequently categorised into six groups (0–100 ha, 101–500, 501–1000, 1001–2000,2001–3500 and >3500 ha). The fifth variable in this group was originally operationalisedas a single, pre-coded question which asked respondents to indicate how many adults(including family members) were permanently (either full or part-time) involved inproduction activities on the farm. The five response categories ranged from “none” to“more than 10”. This variable was subsequently re-coded into two groups, namely,“none” and “one or more”. This particular coding scheme was adopted as it is arguedthat farming operations which involve no additional adults in production activities arelikely to be qualitatively different from those which do.
The fourth group of measures—perceptions/attitudes—comprised nine variables.The perception questions asked respondents to rate four reasons for rinsing on a fourpoint scale (1=not at all important, 2=not very important, 3=quite important and4=very important). These measures were dichotomised as “not important” (comprisingvalues 1 and 2) and “important” (comprising values 3 and 4). The attitude measuresasked respondents to indicate whether they agreed, disagreed or were non-committalabout a range of issues pertaining to profit motive, farming as a way of life andpotential harm associated with chemical residues left in empty containers. The five-level Likert format that originally accompanied these variables was subsequently re-coded as disagree, agree and neither.
3.6.
Certain groups of farmers were excluded from the study’s analysis: respondents whodid not use chemicals (N=144), very incomplete surveys (N=36) and farmers whoreported using a non-manual rinsing method (N=338). These exclusions reduced theworking sample to 2489. The relationship between each of the independent variablesand rinsing behaviour is initially examined using the chi-square test, with significantdifferences being indicated by PΖ0·05. Those bivariate relationships which are foundto be significant are subsequently included in a logistic regression analysis. The logisticmodel is an appropriate technique for predicting a binary dependent variable such as“do not rinse” (1) and “rinse” (0) (Gilbert, 1993; Kleinbaum, 1994).
The multivariate logistic regression analysis produces logit coefficients, their standarderrors and P-values, as well as adjusted odds ratios. Positive (significant) coefficientsindicate that when other independent variables are controlled for, the log-odds on not
3 At no time did the ABS disclose to the researchers the identity of any respondent.
Rinsing practices of Australian farmers138
rinsing is increased (relative to a reference category). Negative (significant) coefficientsindicate that the log-odds of the event occurring is decreased. Log-odds which aresignificant at PΖ0·05 are presented with accompanying adjusted odds ratios and 95%confidence intervals. Multivariate odds ratios are useful as they provide us with anindication of the direction and magnitude of association between two factors when allother variables in the model are simultaneously adjusted. Moreover, odds ratios havea simple interpretation. For example, values of 1 indicate no association, a value of1·5 suggests that the independent variable (compared to a reference category) increasesthe odds on the dependent variable by a factor of 0·5 (i.e. 50%), whereas a value of0·25 suggests that the odds on the dependent variable are decreased by a factor of 0·75(i.e. 75%). The confidence intervals indicate that there is a 95% probability that thetrue value of the parameter in the farming population lies between the upper and lowerlevels.
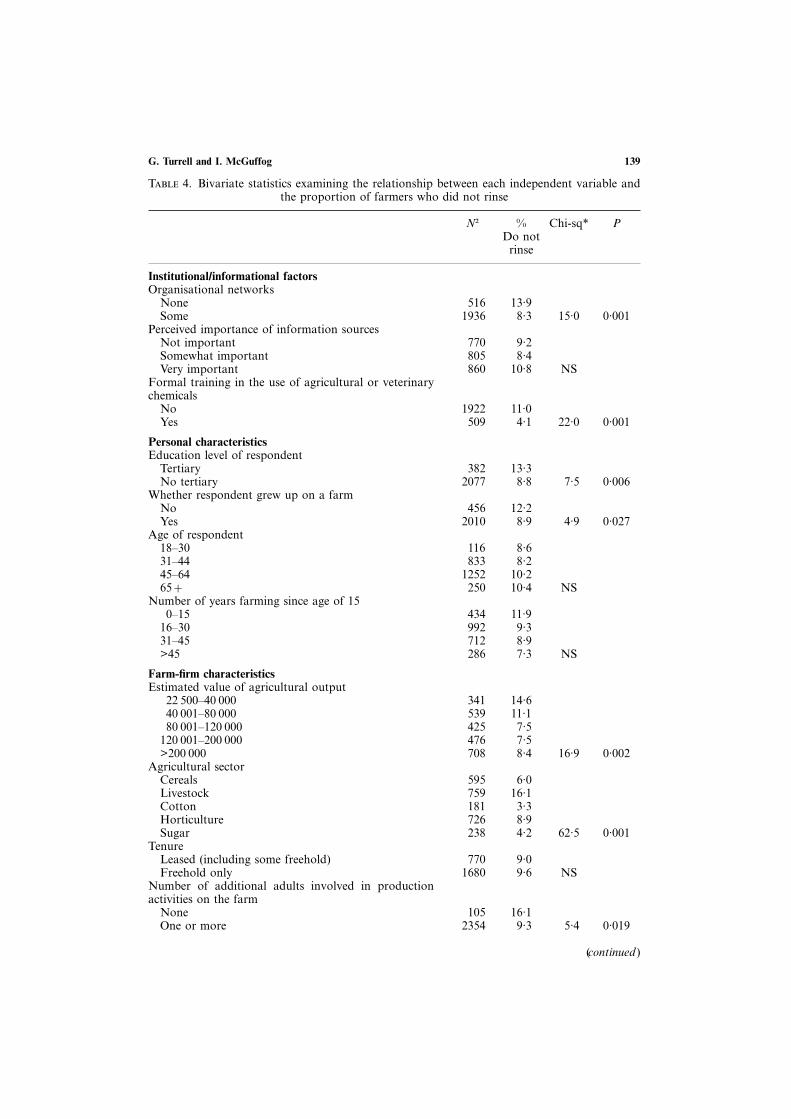
4. Results
Of the 2489 farmers included in this study, 9·6% (N=238) indicated that they never rinsedchemical containers after they had been emptied. Table 4 examines the characteristics ofthis non-compliant group. Farmers who reported that they did not rinse empty chemicalcontainers were more likely to:
• have no organisational networks• not be formally trained in the use of chemicals• be tertiary educated• have not grown up on a farm• have a farm income of less than $80 000 per year• be a livestock producer or (to a lesser extent) a horticulturalist• have no additional adults permanently employed in production activities on the
farm• have a farming operation greater than 3500 hectares• not perceive chemical wastage as an important reason for rinsing• not perceive the safe disposal of the empty container as an important reason for
rinsing• not perceive environmental protection as an important reason for rinsing• not perceive the requirement on the label as an important reason for rinsing• be non-committal about the environmental threat posed by chemical residues left
in empty containers• be non-committal or disagree that on their farm, chemical residues in empty
containers are harmful.
Table 4 also shows that a range of factors were not significantly related with rinsingbehaviour. For example, perceptions about the importance of information sources, theage of the respondent, number of years involved in farming and tenure did notdifferentiate farmers in terms of their rinsing practices. In addition, a farmer’s propensityto rinse or not rinse was unrelated to their attitudes about the farming way of life andissues pertaining to profitability.
Table 5 presents the results of a multivariate analysis examining the relationshipbetween non-rinsing and variables which were found to be significant on the basis ofthe bivariate analysis. After simultaneously adjusting for each of the factors in themodel, it was apparent that the following variables were no longer significant predictors
G. Turrell and I. McGuffog 139
T 4. Bivariate statistics examining the relationship between each independent variable andthe proportion of farmers who did not rinse
N† % Chi-sq∗ PDo not
rinse
Institutional/informational factorsOrganisational networks
None 516 13·9Some 1936 8·3 15·0 0·001
Perceived importance of information sourcesNot important 770 9·2Somewhat important 805 8·4Very important 860 10·8 NS
Formal training in the use of agricultural or veterinarychemicals
No 1922 11·0Yes 509 4·1 22·0 0·001
Personal characteristicsEducation level of respondent
Tertiary 382 13·3No tertiary 2077 8·8 7·5 0·006
Whether respondent grew up on a farmNo 456 12·2Yes 2010 8·9 4·9 0·027
Age of respondent18–30 116 8·631–44 833 8·245–64 1252 10·265+ 250 10·4 NS
Number of years farming since age of 150–15 434 11·9
16–30 992 9·331–45 712 8·9>45 286 7·3 NS
Farm-firm characteristicsEstimated value of agricultural output
22 500–40 000 341 14·640 001–80 000 539 11·180 001–120 000 425 7·5
120 001–200 000 476 7·5>200 000 708 8·4 16·9 0·002
Agricultural sectorCereals 595 6·0Livestock 759 16·1Cotton 181 3·3Horticulture 726 8·9Sugar 238 4·2 62·5 0·001
TenureLeased (including some freehold) 770 9·0Freehold only 1680 9·6 NS
Number of additional adults involved in productionactivities on the farm
None 105 16·1One or more 2354 9·3 5·4 0·019
(continued )

Rinsing practices of Australian farmers140
T 4. (continued )
N† % Chi-sq∗ PDo not
rinse
Total number of hectares>3500 164 17·12001–3500 160 8·11001–2000 249 8·8501–1000 336 7·1101–500 761 9·1
0–100 780 9·7 13·8 0·017
Perceptions/attitudesHere are some reasons people give for rinsing emptycontainers. How important are each of these reasons to you?To ensure that no chemical is wasted
Not important 216 31·4Important 2198 6·5 153·7 0·001
So that the container can be safely disposed ofNot important 132 31·8Important 2277 7·3 94·3 0·001
Because it helps protect the environmentNot important 141 24·8Important 2228 7·5 50·1 0·001
Because it is required on the labelNot important 810 10·6Important 1523 7·6 6·0 0·014
We would like your response to a number of statementsabout rural environmental and economic issues:The primary goal of farmers should be to maximise theprofitability of their farms
Disagree 288 10·7Agree 1780 9·3Neither 359 10·3 NS
It is worth putting up with a small decrease in farmprofit to protect the environment?
Disagree 527 10·8Agree 1235 9·8Neither 650 8·6 NS
The farming way of life is ample compensation for thetimes when it is difficult to make a profit
Disagree 1425 8·7Agree 472 12·2Neither 489 9·0 NS
There is no point in adopting new farm managementpractices unless they are more profitable
Disagree 650 9·6Agree 1294 9·8Neither 485 9·0 NS
The amount of chemical left in a container after it isemptied is a threat to the environment
Disagree 357 8·9Agree 1676 8·1Neither 391 16·3 25·1 0·001
On my farm the amount of chemical left in emptycontainers is not harmful
Disagree 264 12·5Agree 1878 8·2Neither 277 16·6 22·3 0·001
† Marginal frequencies.∗NS (not significant).

G. Turrell and I. McGuffog 141
T 5. Logit coefficients and odds ratios for a multivariate model predicting non-rinsing
Logit SE Sig. Odds 95% CIcoefficients ratio
Institutional/informational factorsOrganisational networks
None 0·297 0·169 0·079 — —Some
Formal training in the use of ag-ricultural or veterinary chemicals
No 0·845 0·254 0·0009 2·33 1·42–3·83Yes
Personal characteristicsEducation level of respondent
Tertiary 0·488 0·197 0·013 1·63 1·11–2·40No tertiary
Whether respondent grew up on afarm
No 0·079 0·189 0·676 — —Yes
Farm-firm characteristicsEstimated value of agriculturaloutput
22 500–40 000 0·452 0·257 0·078 — —40 001–80 000 0·274 0·237 0·246 — —80 001–120 000 −0·263 0·266 0·323 — —
120 001–200 000 −0·172 0·250 0·493 — —>200 000
Agricultural sectorCereals 0·139 0·421 0·741 — —Livestock 1·15 0·387 0·003 3·16 1·48–6·74Cotton −0·353 0·582 0·544 — —Horticulture 0·458 0·374 0·221 — —Sugar
Number of additional adults in-volved in production activities onthe farm
None 0·614 0·304 0·043 1·85 1·02–3·35One or more
Total number of hectares>3500 0·703 0·334 0·036 2·02 1·05–2·822001–3500 0·184 0·400 0·645 — —1001–2000 0·161 0·343 0·638 — —501–1000 −0·189 0·319 0·551 — —101–500 −0·144 0·232 0·534 — —
0–100
Perceptions/attitudesHere are some reasons people givefor rinsing empty containers. Howimportant are each of these reasonsto you?To ensure that no chemical iswasted
Not important 1·43 0·191 0·000 4·18 2·87–6·08Important (continued )

Rinsing practices of Australian farmers142
T 5. (continued )
Logit SE Sig. Odds 95% CIcoefficients ratio
So that the container can be safelydisposed of
Not important 1·25 0·310 0·0001 3·49 1·90–6·40Important
Because it helps protect the en-vironment
Not important −0·229 0·335 0·494 — —Important
Because it is required on the con-tainer label
Not important 0·104 0·160 0·516 — —Important
We would like your response to anumber of statements about ruralenvironmental and economic issues:The amount of chemical left in acontainer after it is emptied is athreat to the environment
Disagree 0·601 0·260 0·021 1·82 1·1–3·04Agree −0·053 0·232 0·820Neither
On my farm the amount of chem-ical left in empty containers is notharmful
Disagree 0·178 0·271 0·511 — —Agree −0·531 0·222 0·017 0·59 0·35–1·0Neither
Constant −3·96−2 log likelihood (for model with constant only) 1558·4−2 log likelihood (for full model) 1301·6 (df 2450, 0·000)Improvement 256·8 (df 26, 0·000)Goodness of fit 2462·3 (df 2450, 0·000)Percentage of cases correctly predicted as “Don’t Rinse” 12·7
of rinsing behaviour: organisational networks, whether the respondent grew up on afarm, EVAO, farmers’ perceptions about the importance of protecting the environment,and requirements on the label of chemical containers.
The factors which significantly increased the odds on not rinsing were as follows:having no formal training in the use of chemicals, being tertiary educated, working inthe livestock sector, having no additional adults permanently employed in productionactivities on the farm, farms greater than 3500 hectares, perceiving that chemicalwastage and safe container disposal are not important reasons for rinsing, disagreeingwith the notion that chemical residues in empty containers are an environmental threat,and being non-committal about the belief that chemical residues in one’s own containersare not harmful.
Farmers who had received no formal training in the use of chemicals were 2·3 timesmore likely not to rinse than were farmers who had received training (independent of
G. Turrell and I. McGuffog 143
all other factors in the model). Education level was inversely related with rinsingbehaviour, as farmers who had attained a tertiary level qualification were approximately60% more likely not to rinse. Farmers in the cereal, cotton, horticulture and sugarsectors engaged in similar rinsing behaviours (i.e. they were equally likely to rinse ornot rinse). Farmers in livestock, however, were approximately three times as likely assugar cane growers to have reported that they never rinsed empty chemical containers.Respondents who worked on farms where no additional adults were permanentlyinvolved in production activities were approximately 80% more likely not to rinse.Further, those who operated farms which were greater than 3500 ha in size wereapproximately twice as likely to not rinse as those on farms of less than 100 ha.
The strongest independent predictors of non-rinsing were the perception items whichpertained to chemical wastage and container disposal. Farmers who perceived thatchemical wastage was not an important reason for rinsing were over four times morelikely not to rinse than farmers who perceived this issue as being important. Similarly,farmers who perceived that safe container disposal was not an important reason forrinsing were over three times more likely not to rinse than farmers who perceived thisissue as being important. Respondents who did not agree that the amount of chemicalleft in an empty container was a threat to the environment were approximately twiceas likely not to rinse as those who were non-committal about this issue. Finally,respondents who do not rinse were less likely to perceive that the residue in their owncontainers was harmful.
The −2 log likelihood statistics for the model with and without the independentvariables, as well as the goodness of fit value, shows that the observed model differssignificantly from the “perfect” model. Thus, overall, the model as proposed in thisstudy does not fit the data very well. This is clearly evident when we examine thepercentage of cases correctly predicted as “don’t rinse”. Only 12·7% of cases werecorrectly predicted on the basis of a model containing 26 independent parametersmeasuring institutional/informational factors, personal and farm-firm characteristics,and farmers’ perceptions and attitudes. However, given that this study is the first of itskind in Australia and possibly internationally, and given the importance of the issuebeing examined, the authors believe that the findings presented here have substantiveimportance for the farming community.
5. Discussion
In 1993, the agricultural census showed that there were 120 286 farming operations inAustralia (Australian Bureau of Statistics, 1993). Based on data reported earlier (seeSection 3.6), we can estimate that approximately 5% of these farms do not use chemicals(N=6014), and 11% use chemicals but rinse using a non-manual method (N=13 231).When these farming operations are deducted from the total number of farms, we canestimate that 101 041 farms throughout Australia use agricultural chemicals and donot use a non-manual rinsing device. As approximately 10% of this present study’ssample did not rinse empty chemical containers we can estimate that 10 000 farmsthroughout Australia are using chemicals in plastic and metal containers and are notremoving the residue once the bulk of the contents have been used. This situation, itis argued, constitutes a potential risk to the environment and the public health of thewider community. Indeed, as is the case with the reporting of many other sociallyundesirable behaviours (e.g. drug and alcohol usage), we could reasonably expect the

Rinsing practices of Australian farmers144
estimate of non-rinsing found in this study to be an under-estimate of the true parameter.Thus the problem of non-rinsing is likely to be more serious than is reported here.
Of the three institutional/informational variables examined in this study, only formaltraining was found to be a significant independent factor differentiating those who didnot rinse from those who did. It is reasonable to expect that farmers who have receivedformal training in the use and handling of farm chemicals would be more likely torinse. This finding highlights the need to make formal training widely available in anyextension campaign aimed at encouraging farmers to adopt recommended rinsingpractices.
Of the four personal characteristics, only education level was found to be in-dependently related with rinsing behaviour. Indeed, there was an inverse relationshipbetween education and rinsing, with tertiary educated farmers being more likely not torinse. This counter-intuitive result contrasts with the findings of those studies whichexamined education and found that it was positively related to the adoption ofconservation innovations (Bultena and Hoiberg, 1983; Norris and Batie, 1987). Thisunexpected result was further explored by unpacking the two-level education variableinto its original eight categories and comparing the proportion of farmers who reportedthat they did not rinse. This analysis further confirmed that the most educated groupin the sample (i.e. those who had completed a degree) were the least likely to rinseempty chemical containers. The possibility that education was confounded by age wasalso tested for, but this did not alter the result. It is admittedly difficult to explain thisfinding, and in a subsequent paper this issue will be examined in more detail. Thisoutcome does suggest, however, that policy makers should not always assume thatthose with higher levels of education will be more likely to comply with industryrecommendations.
Of the farm-firm variables originally included in the study, only number of adultsinvolved in production activities, agricultural sector and farm size were significantindependent predictors of rinsing behaviour. Those who worked alone on their farm,livestock producers, and those on farms larger than 3500 hectares were more likely notto rinse. During the pilot phase of this study, it became evident that livestock farmerswere the least likely to perceive chemical residues in containers as a threat, comparedwith farmers in other sectors. Livestock farmers believed that because veterinarypreparations, dips and drenches were not harmful to livestock they were not likely topose a health threat to humans or a threat to the environment. Livestock producerswould appear to represent a target group for any extension campaign.
Four of the perception/attitude items were found to be independent predictors ofnon-rinsing. The fact that chemical wastage was not a sufficient reason for manyfarmers to rinse their containers suggests that they were unconcerned (or unaware)about the economic savings that would accrue over time if their containers were rinsedin accordance with recommended practices. Reminding farmers, or making them awareof this issue, would probably go some way towards changing the behaviours of thosewho do not currently rinse.
A farmer’s perception or awareness of an environmental problem emerged from theliterature as a possible factor explaining the uptake of a conservation practice. Indeed,Camboni and Napier (1993: 81) suggest that a farmer’s environmental awareness isone of the more important factors affecting adoption behaviour. This suggestion waspartly corroborated in the present study. Farmers who did not perceive that chemicalresidues in containers were a threat to the environment, or that rinsing was necessaryfor the safe disposal of containers, were the most likely not to rinse empty containers.

G. Turrell and I. McGuffog 145
Policy-makers and industry groups who attempt to convince farmers to adopt re-commended rinsing practices will need to promote the fact that chemical residues inempty containers do pose a potential yet real threat to both the environment and publichealth.
6. Conclusion
This is the first known study to examine the rinsing behaviours of farmers. As therewas no previously published literature on this topic, the more general literature pertainingto the adoption of conservation innovations was used as the conceptual framework. Arange of institutional/informational factors, personal characteristics, farmer perceptionsand attitudes, and farm-firm characteristics (drawn from both the adoption-diffusionand economic perspectives of conservation innovation) were found to partially predictnon-compliance with recommended rinsing practices. Specifically, just under 13% offarmers were correctly predicted as “not rinsing”. Whilst the results of this study makean important contribution to our knowledge of the factors which influence rinsingbehaviour (and the adoption of conservation innovations more generally) the limitedexplanatory power of our model indicates that many key variables remain to beidentified.
We propose that any substantial “leap forward” in our understanding of the factorswhich predict the uptake of a conservation innovation is not likely to derive from acontinued re-working of our existing models and variables, using evermore sophisticatedquantitative techniques. Rather, we would encourage researchers to “return to theland” and study the adoption of conservation innovations from a qualitative-exploratoryperspective. We would expect that fresh insights and information gained from theapplication of this more in-depth approach is likely to add considerably to our currenttheories of why farmers do or do not comply with recommended conservation practices.
The authors would like to acknowledge Avcare Ltd, the National Association for Crop Protectionand Animal Health, who commissioned and funded the study upon which this paper is based.Thanks are also due to Mr Doug McGuffog who commented on earlier drafts of the manuscript.
References
Australian Bureau of Statistics. (1993). Characteristics of Australian Farms. Catalogue number 72102.0,Canberra: AGPS.
AVCA Code No. 1 (no date). Disposal of farm chemicals and containers on the farm. The Agricultural andVeterinary Chemicals Association of Australia Ltd. North Sydney, NSW.
Avcare (1994). Avcare insights 1. The Agricultural and Veterinary Chemicals Association of Australia Ltd.North Sydney, NSW.
Bultena, G. L. and Hoiberg, E. O. (1983). Factors affecting farmers’ adoption of conservation tillage. Journalof Soil and Water Conservation 38, 281–284.
Camboni, S. M. and Napier, T. L. (1993). Factors affecting use of conservation farming practices in eastcentral Ohio. Agriculture, Ecosystems and Environment 45, 79–94.
Dillman, D. A. (1978). Mail and telephone survey: the total design method. New York: Wiley.Dillman, D. A. (1991). The design and administration of mail surveys. Annual Review of Sociology 17,
225–249.Ervin, C. A. and Ervin, D. E. (1982). Factors affecting the use of soil conservation practices: hypotheses,
evidence, and policy implications. Land Economics 58, 277–292.Gilbert, N. (1993). Analyzing tabular data: loglinear and logisitic models for social researchers. London: UCL
Press.Guerin, L. T. and Guerin, T. F. (1994). Constraints to the adoption of innovations in agricultural research
and environmental management: a review. Australian Journal of Experimental Agriculture 34, 549–571.Kleinbaum, D. G. (1994). Logistic regression: a self learning tool. New York: Springer-Verlag.Korsching, P. F., Stofferahn, C. W., Nowak, P. J. and Wagener, D. J. (1983). Adopter characteristics and

Rinsing practices of Australian farmers146
adoption patterns of minimum tillage: implications for soil conservation programs. Journal of Soil andWater Conservation 38, 428–431.
Lee, L. K. and Stewart, W. H. (1983). Landownership and the adoption of minimum tillage. AmericanJournal of Agricultural Economics 65, 256–264.
Lynne, G. D., Shonkwiler, J. S. and Rola, L. R. (1988). Attitudes and farmer conservation behavior. AmericanJournal of Agricultural Economics 70, 12–19.
Napier, T. L., Thraen, C. S., Gore, A. and Goe, W. R. (1984). Factors affecting adoption of conventionaland conservation tillage practices in Ohio. Journal of Soil and Water Conservation 39, 205–209.
Norris, P. E. and Batie, S. S. (1987). Virginia farmers’ soil conservation decisions: an application of tobitanalysis. Southern Journal of Agricultural Economics 19, 79–90.
Nowak, P. J. (1987). The adoption of agricultural conservation technologies: economic and diffusionexplanations. Rural Sociology 52, 208–220.
Pampel, F. and van Es, J. C. (1977). Environmental quality and issues of adoption research. Rural Sociology42, 57–71.
Rogers, E. M. and Shoemaker, F. F. (1971). Communication of Innovations: A Cross-cultural Approach, 2ndedn. New York: Free Press.
Saltiel, J., Bauder, J. W. and Palakovich, S. (1994). Adoption of sustainable agricultural practices: diffusion,farm structure, and profitability. Rural Sociology 59, 333–349.
Sinden, J. A. and King, D. A. (1990). Adoption of soil conservation measures in Manilla shire, New SouthWales. Review of Marketing and Agricultural Economics 58, 179–192.
Taylor, D. L. and Miller, W. L. (1978). The adoption process and environmental innovations: a case studyof a government project. Rural Sociology 43, 634–648.